Third Quarter Earnings Presentation October 23, 2026
2 Important Notices and Disclaimers Forward-Looking Statements This presentation contains “forward-looking statements” including statements with respect to the Company’s objectives, expectations and intentions and other statements that are not historical facts. Examples of forward- looking statements include but are not limited to: our future operating or financial performance, including revenues, expenses, expense savings, income or loss and earnings or loss per share, and other financial items; statements regarding expectations, plans or objectives for future operations, products or services, and our expectations on loan recoveries, or reaching positive resolutions on problem loans, or significantly reducing special mention and/or non-performing loans. All statements other than statements of historical fact are statements that could be forward-looking statements. You can identify these forward-looking statements through our use of words such as “may,” “will,” “anticipate,” “assume,” “should,” “indicate,” “would,” “believe,” “contemplate,” “expect,” “estimate,” “continue,” “plan,” “point to,” “project,” “could,” “intend,” “target,” “goals,” “outlook,” “modeled,” “dedicated,” “create,” and other similar words and expressions of the future. Forward-looking statements, including those relating to our beliefs, plans, objectives, goals, expectations, anticipations, estimates and intentions, involve known and unknown risks, uncertainties and other factors, which may be beyond our control, and which may cause the Company’s actual results, performance, achievements, or financial condition to be materially different from future results, performance, achievements, or financial condition expressed or implied by such forward-looking statements. You should not rely on any forward-looking statements as predictions of future events. You should not expect us to update any forward-looking statements, except as required by law. All written or oral forward-looking statements attributable to us are expressly qualified in their entirety by this cautionary notice, together with those risks and uncertainties described in “Risk factors” in our annual report on Form 10-K for the fiscal year ended December 31, 2025 filed on February 27, 2026, in our quarterly report on Form 10-Q for the quarter ended March 31, 2026, filed on May 1, 2026, and in our other filings with the U.S. Securities and Exchange Commission (the “SEC”), which are available at the SEC’s website www.sec.gov. Interim Financial Information Unaudited financial information as of and for interim periods, including the three and nine month periods ended September 30, 2026 and 2025, and the three month periods ended June 30, 2026, March 31, 2026, and December 31, 2025, may not reflect our results of operations for our fiscal year ending, or financial condition as of December 31, 2026, or any other period of time or date. Non-GAAP Financial Measures The Company supplements its financial results that are determined in accordance with accounting principles generally accepted in the United States of America (“GAAP”) with non-GAAP financial measures, such as “pre-tax pre-provision net revenue (PPNR)”, "tangible common equity ratio", and “tangible stockholders’ equity (book value) per common share”. This supplemental information is not required by, or is not presented in accordance with GAAP. The Company refers to these financial measures and ratios as “non-GAAP financial measures”. We use certain non-GAAP financial measures, including those mentioned above, both to explain our results to shareholders and the investment community and in the internal evaluation and management of our business. Management believes that these supplementary non-GAAP financial measures and the information they provide are useful to investors since these measures permit investors to view our performance using the same tools that our management uses to evaluate our past performance and prospects for future performance. While we believe that these non-GAAP financial measures are useful in evaluating our performance, this information should be considered as supplemental and not as a substitute for or superior to the related financial information prepared in accordance with GAAP. Additionally, these non-GAAP financial measures may differ from similar measures presented by other companies. Appendix 1 reconciles these non-GAAP financial measures to GAAP reported results. Beginning in the first quarter of 2026, the Company reviewed and updated its use of non‑GAAP financial measures and now presents a limited set of metrics that management uses to evaluate performance and make operating decisions. As part of this update, the Company discontinued the presentation of “Core PPNR”, “core noninterest income”, “core noninterest expense”, “core net income”, “core earnings per share (basic and diluted)”, “core return on assets (Core ROA)”, “core return on equity (Core ROE)”, and “core efficiency ratio” as management determined these measures are no longer primary metrics used internally. This change does not reflect any change in the Company’s underlying business, operations, or GAAP financial results.
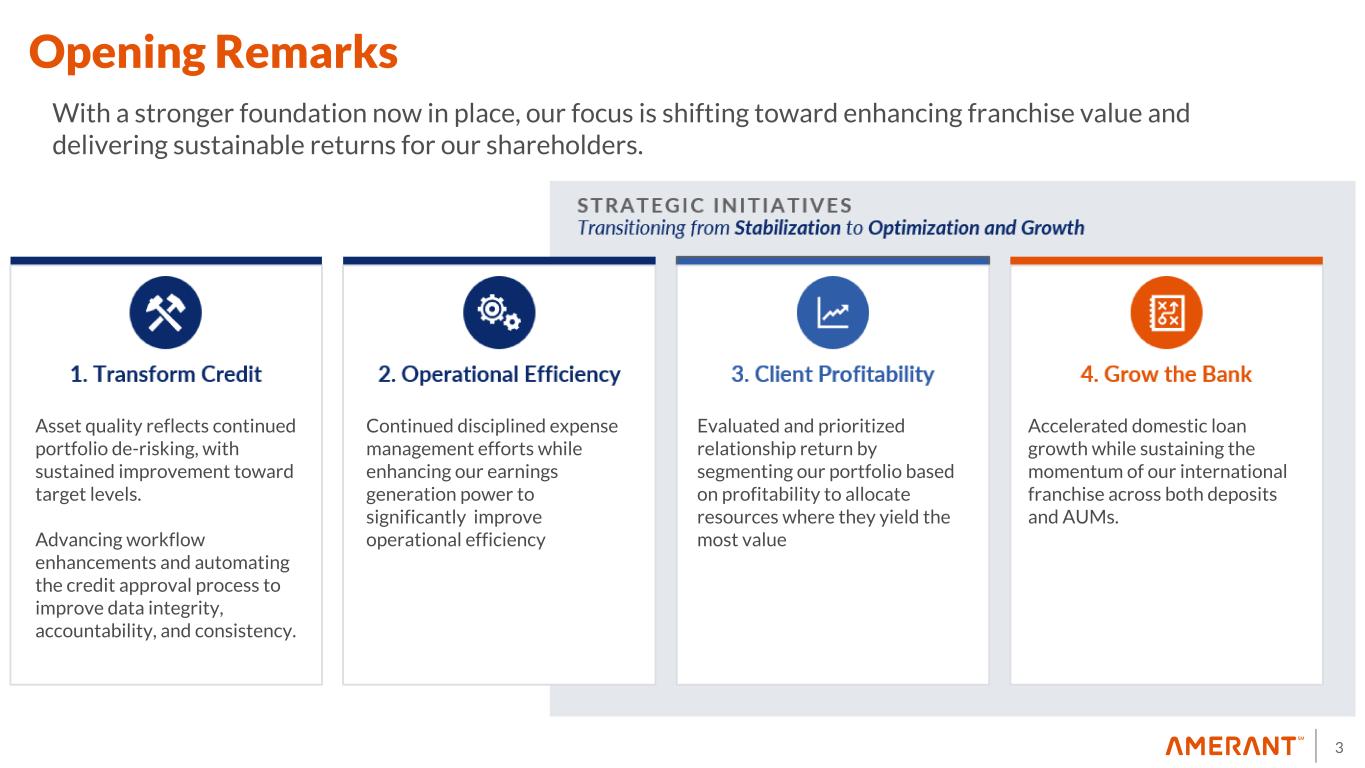
3 With a stronger foundation now in place, our focus is shifting toward enhancing franchise value and delivering sustainable returns for our shareholders. Opening Remarks Asset quality reflects continued portfolio de-risking, with sustained improvement toward target levels. Advancing workflow enhancements and automating the credit approval process to improve data integrity, accountability, and consistency. Continued disciplined expense management efforts while enhancing our earnings generation power to significantly improve operational efficiency Evaluated and prioritized relationship return by segmenting our portfolio based on profitability to allocate resources where they yield the most value Accelerated domestic loan growth while sustaining the momentum of our international franchise across both deposits and AUMs.
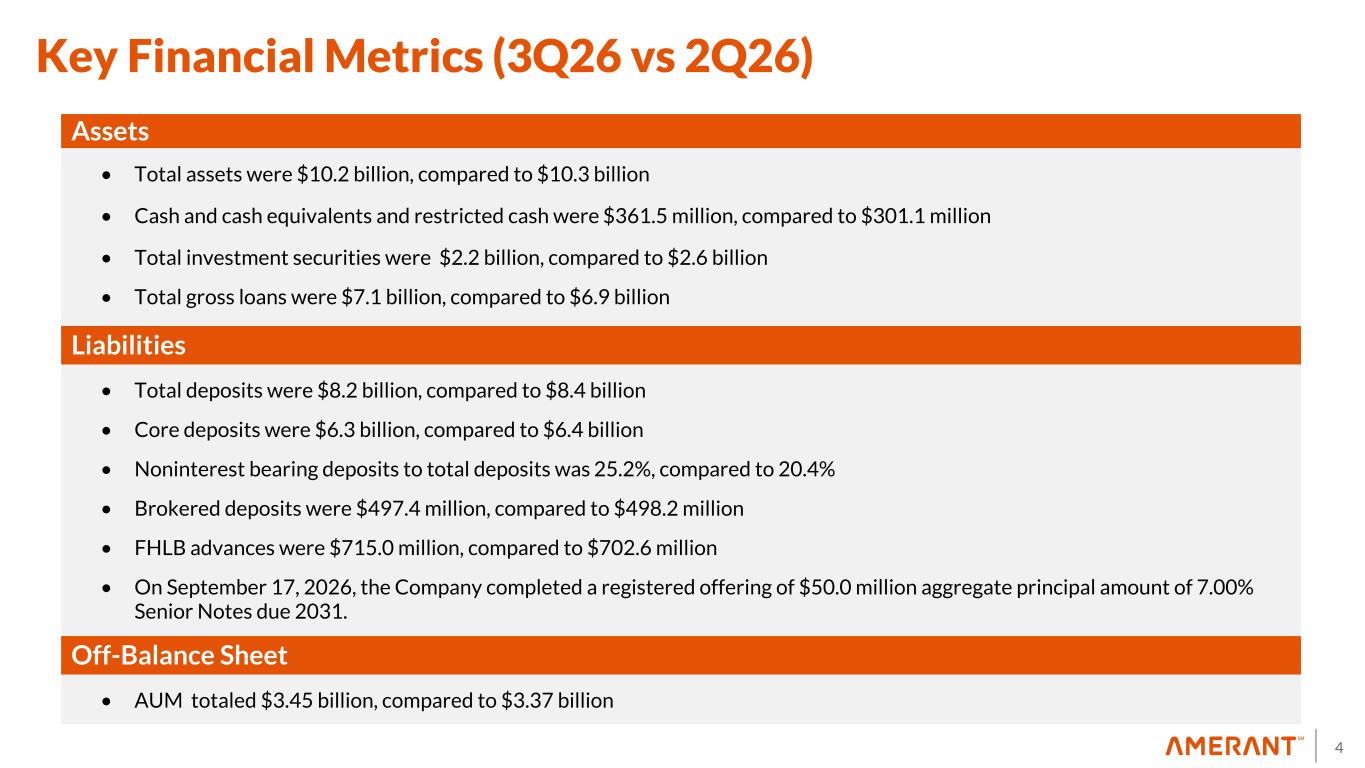
4 Key Financial Metrics (3Q26 vs 2Q26) Assets • Total assets were $10.2 billion, compared to $10.3 billion • Cash and cash equivalents and restricted cash were $361.5 million, compared to $301.1 million • Total investment securities were $2.2 billion, compared to $2.6 billion • Total gross loans were $7.1 billion, compared to $6.9 billion Liabilities • Total deposits were $8.2 billion, compared to $8.4 billion • Core deposits were $6.3 billion, compared to $6.4 billion • Noninterest bearing deposits to total deposits was 25.2%, compared to 20.4% • Brokered deposits were $497.4 million, compared to $498.2 million • FHLB advances were $715.0 million, compared to $702.6 million • On September 17, 2026, the Company completed a registered offering of $50.0 million aggregate principal amount of 7.00% Senior Notes due 2031. Off-Balance Sheet • AUM totaled $3.45 billion, compared to $3.37 billion
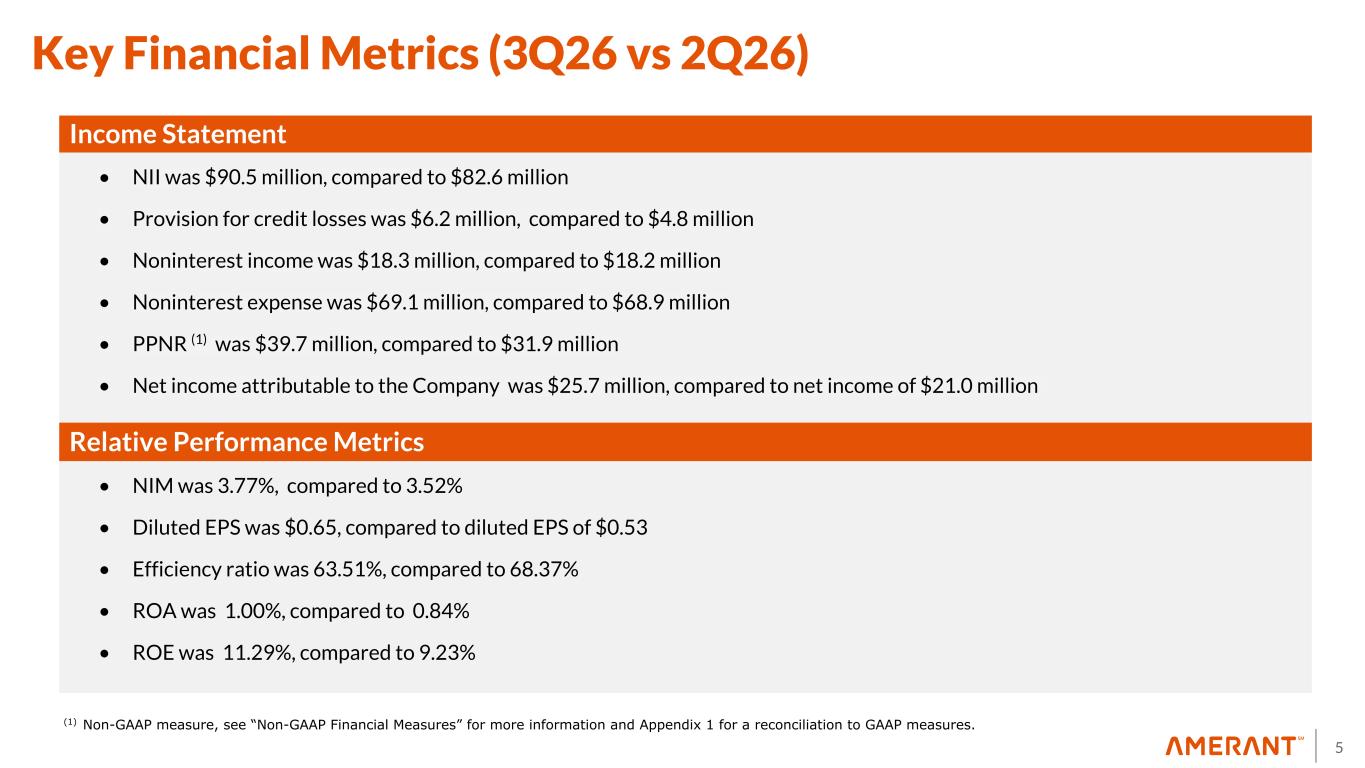
5 Key Financial Metrics (3Q26 vs 2Q26) Income Statement • NII was $90.5 million, compared to $82.6 million • Provision for credit losses was $6.2 million, compared to $4.8 million • Noninterest income was $18.3 million, compared to $18.2 million • Noninterest expense was $69.1 million, compared to $68.9 million • PPNR (1) was $39.7 million, compared to $31.9 million • Net income attributable to the Company was $25.7 million, compared to net income of $21.0 million Relative Performance Metrics • NIM was 3.77%, compared to 3.52% • Diluted EPS was $0.65, compared to diluted EPS of $0.53 • Efficiency ratio was 63.51%, compared to 68.37% • ROA was 1.00%, compared to 0.84% • ROE was 11.29%, compared to 9.23% (1) Non-GAAP measure, see “Non-GAAP Financial Measures” for more information and Appendix 1 for a reconciliation to GAAP measures.
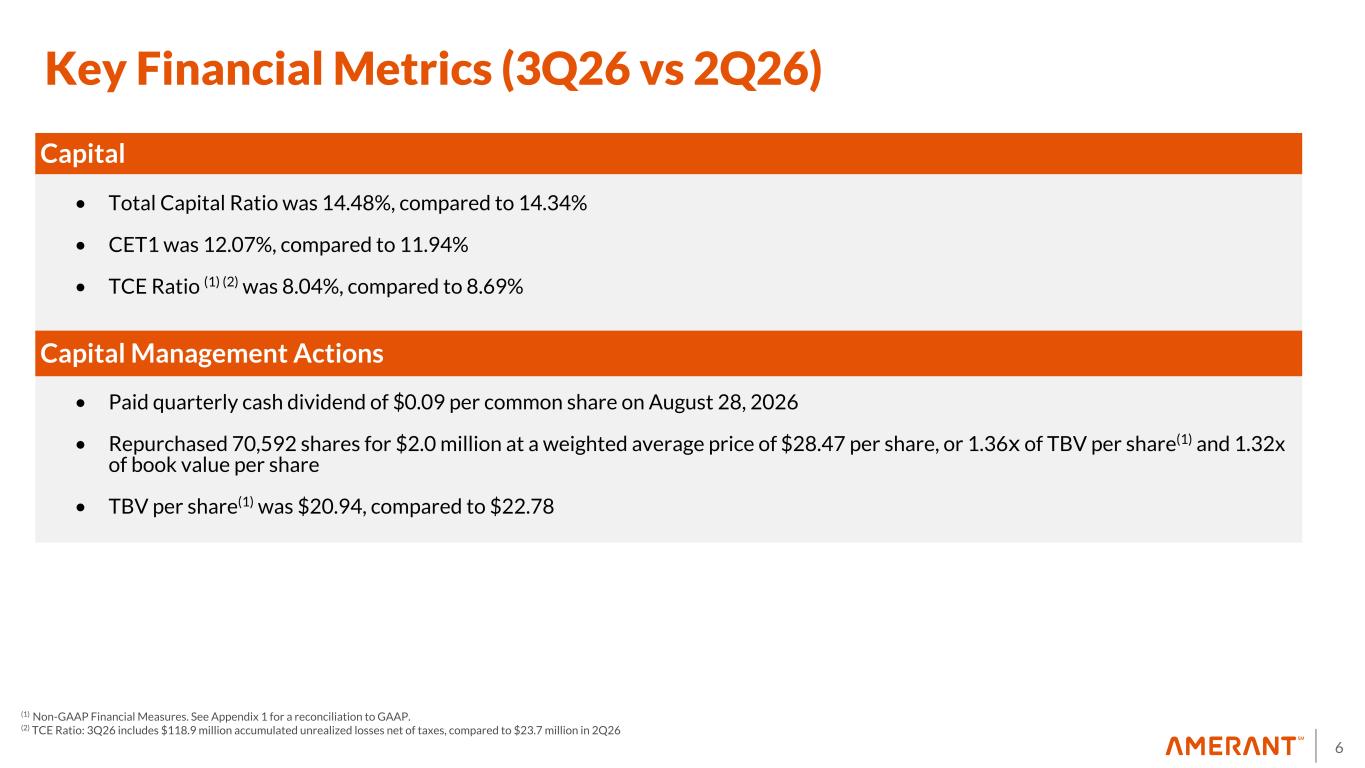
6 Key Financial Metrics (3Q26 vs 2Q26) (1) Non-GAAP Financial Measures. See Appendix 1 for a reconciliation to GAAP. (2) TCE Ratio: 3Q26 includes $118.9 million accumulated unrealized losses net of taxes, compared to $23.7 million in 2Q26 Capital • Total Capital Ratio was 14.48%, compared to 14.34% • CET1 was 12.07%, compared to 11.94% • TCE Ratio (1) (2) was 8.04%, compared to 8.69% Capital Management Actions • Paid quarterly cash dividend of $0.09 per common share on August 28, 2026 • Repurchased 70,592 shares for $2.0 million at a weighted average price of $28.47 per share, or 1.36x of TBV per share(1) and 1.32x of book value per share • TBV per share(1) was $20.94, compared to $22.78
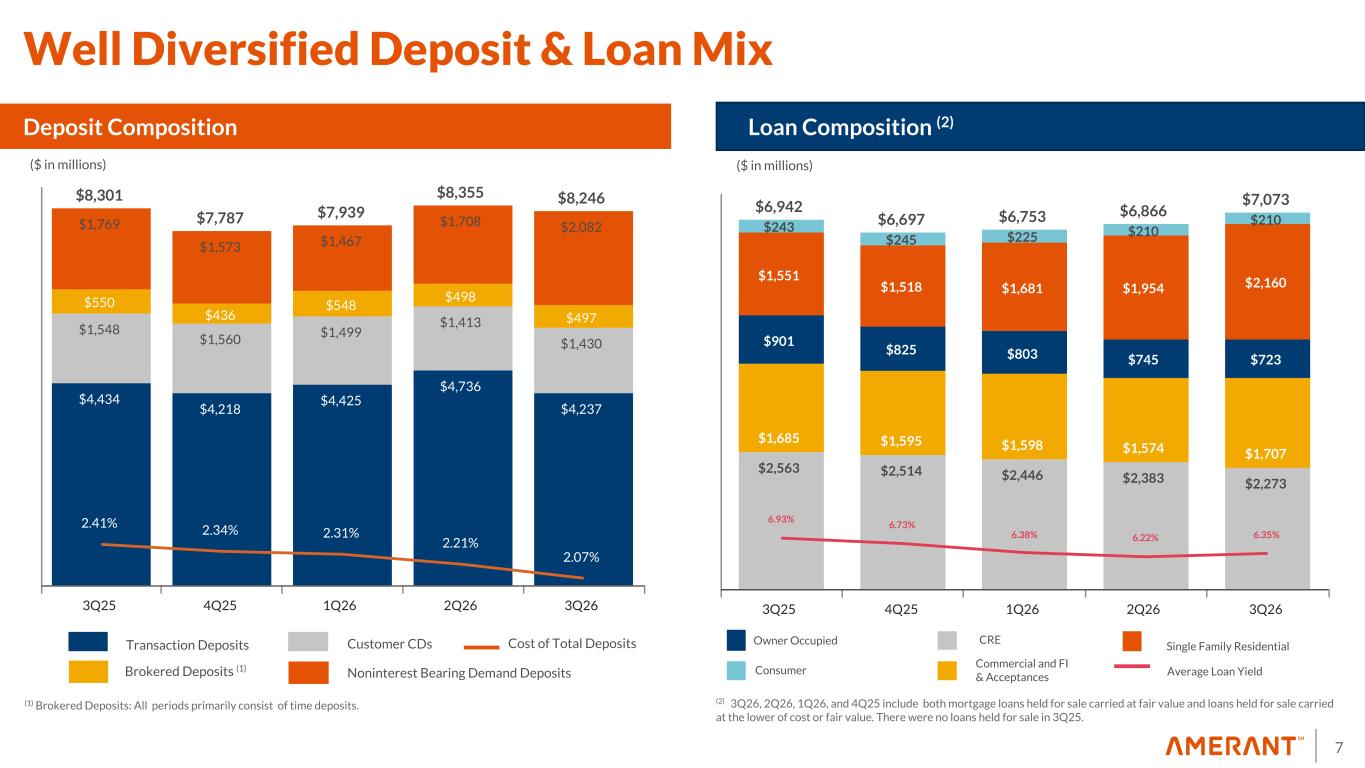
7 $8,301 $7,787 $7,939 $8,355 $8,246 $4,434 $4,218 $4,425 $4,736 $4,237 $1,548 $1,560 $1,499 $1,413 $1,430 $550 $436 $548 $498 $497 $1,769 $1,573 $1,467 $1,708 $2,082 2.41% 2.34% 2.31% 2.21% 2.07% 3Q25 4Q25 1Q26 2Q26 3Q26 Deposit Composition Loan Composition (2) Transaction Deposits Customer CDs Brokered Deposits (1) Cost of Total Deposits ($ in millions) Noninterest Bearing Demand Deposits Well Diversified Deposit & Loan Mix (1) Brokered Deposits: All periods primarily consist of time deposits. $6,942 $6,697 $6,753 $6,866 $7,073 $2,563 $2,514 $2,446 $2,383 $2,273 $1,685 $1,595 $1,598 $1,574 $1,707 $901 $825 $803 $745 $723 $1,551 $1,518 $1,681 $1,954 $2,160 $243 $245 $225 $210 $210 6.93% 6.73% 6.38% 6.22% 6.35% 3Q25 4Q25 1Q26 2Q26 3Q26 Consumer CRE Commercial and FI & Acceptances Owner Occupied Single Family Residential Average Loan Yield ($ in millions) (2) 3Q26, 2Q26, 1Q26, and 4Q25 include both mortgage loans held for sale carried at fair value and loans held for sale carried at the lower of cost or fair value. There were no loans held for sale in 3Q25.
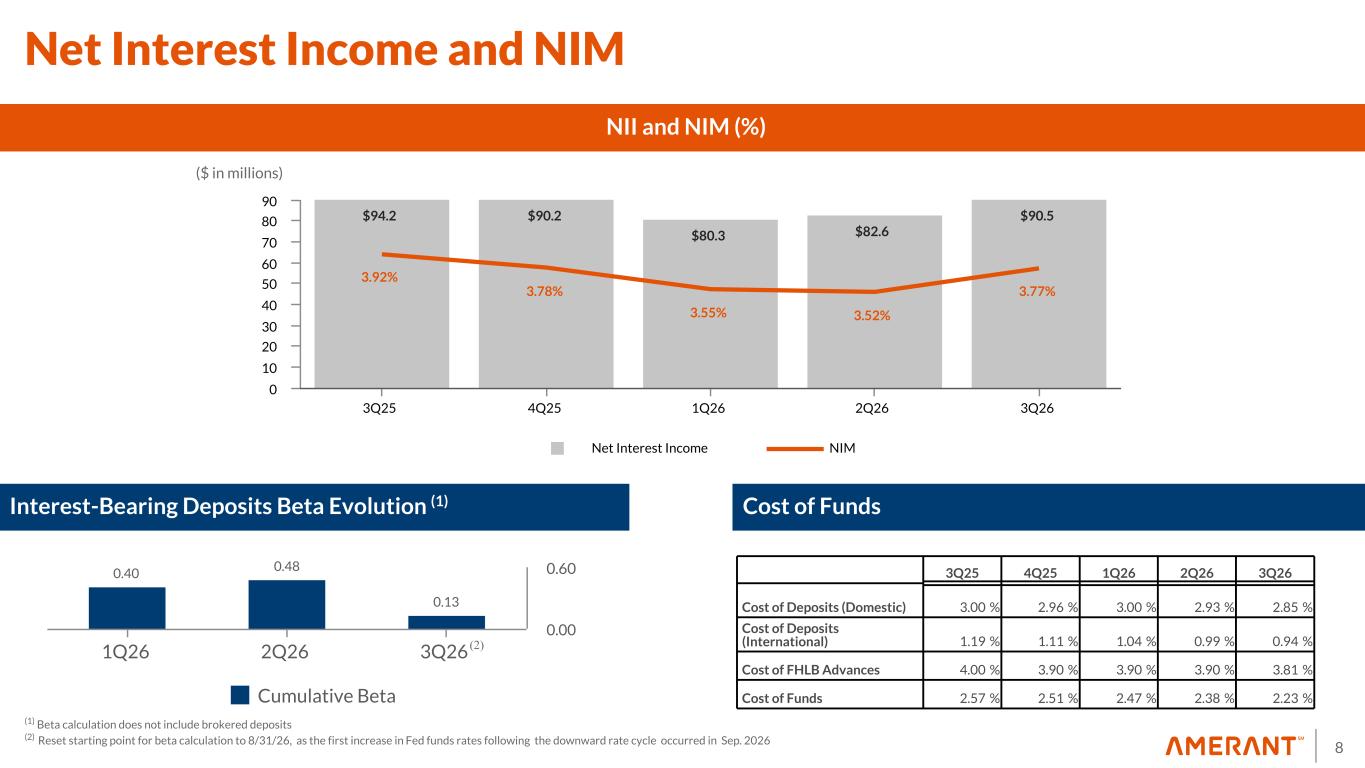
8 $94.2 $90.2 $80.3 $82.6 $90.5 3.92% 3.78% 3.55% 3.52% 3.77% Net Interest Income NIM 3Q25 4Q25 1Q26 2Q26 3Q26 0 10 20 30 40 50 60 70 80 90 NII and NIM (%) 8 ($ in millions) 3Q25 4Q25 1Q26 2Q26 3Q26 Cost of Deposits (Domestic) 3.00 % 2.96 % 3.00 % 2.93 % 2.85 % Cost of Deposits (International) 1.19 % 1.11 % 1.04 % 0.99 % 0.94 % Cost of FHLB Advances 4.00 % 3.90 % 3.90 % 3.90 % 3.81 % Cost of Funds 2.57 % 2.51 % 2.47 % 2.38 % 2.23 % 0.40 0.48 0.13 Cumulative Beta 1Q26 2Q26 3Q26 0.00 0.60 Net Interest Income and NIM Interest-Bearing Deposits Beta Evolution (1) Cost of Funds (1) Beta calculation does not include brokered deposits (2) Reset starting point for beta calculation to 8/31/26, as the first increase in Fed funds rates following the downward rate cycle occurred in Sep. 2026 (2)
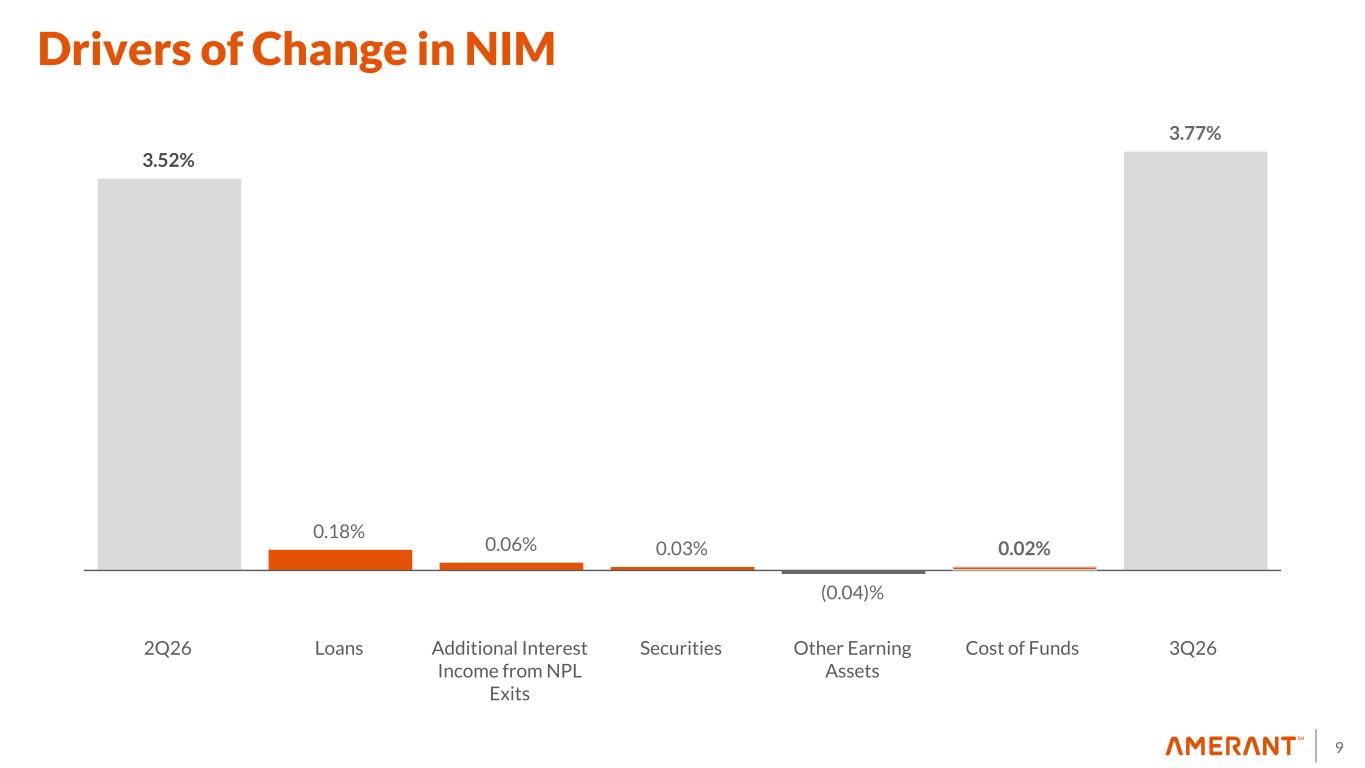
9 Drivers of Change in NIM 3.52% 0.18% 0.06% 0.03% (0.04)% 0.02% 3.77% 2Q26 Loans Additional Interest Income from NPL Exits Securities Other Earning Assets Cost of Funds 3Q26
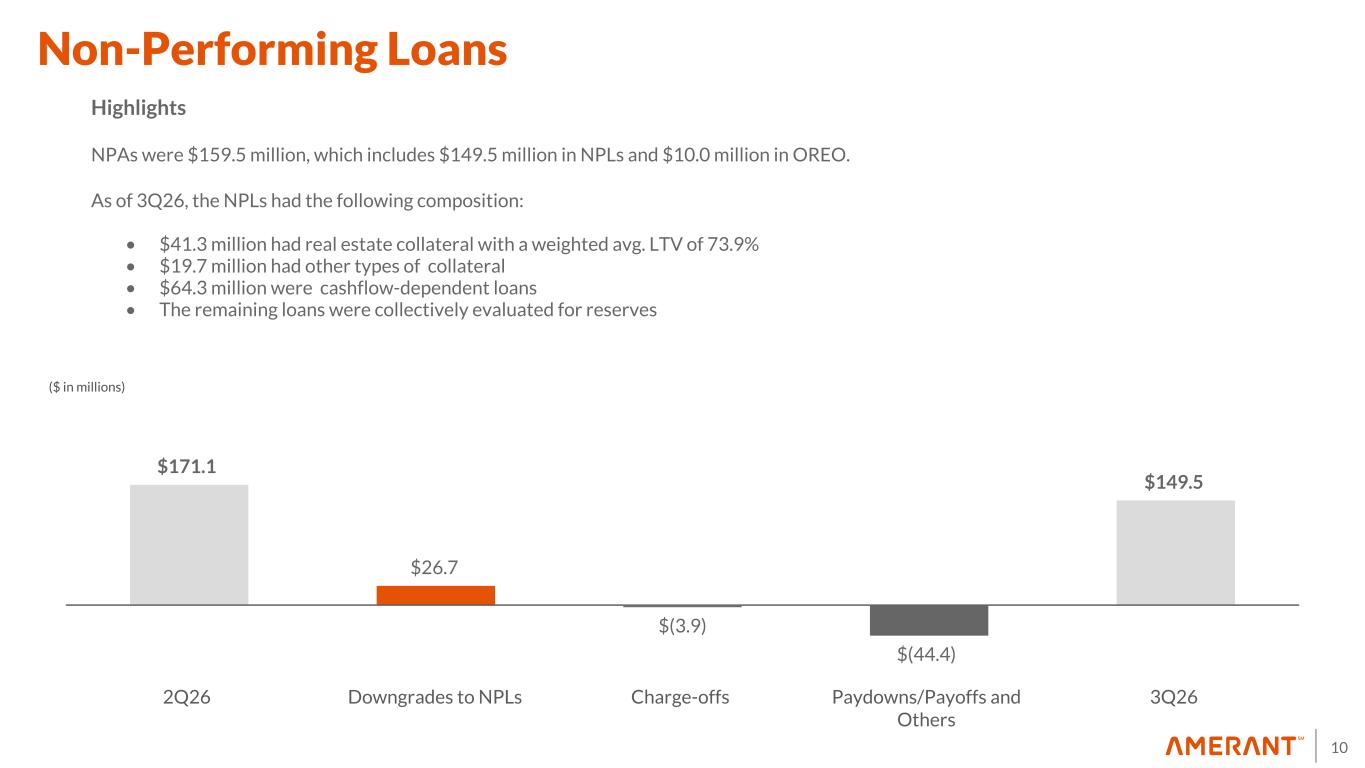
10 Non-Performing Loans ($ in millions) $171.1 $26.7 $(3.9) $(44.4) $149.5 2Q26 Downgrades to NPLs Charge-offs Paydowns/Payoffs and Others 3Q26 Highlights NPAs were $159.5 million, which includes $149.5 million in NPLs and $10.0 million in OREO. As of 3Q26, the NPLs had the following composition: • $41.3 million had real estate collateral with a weighted avg. LTV of 73.9% • $19.7 million had other types of collateral • $64.3 million were cashflow-dependent loans • The remaining loans were collectively evaluated for reserves
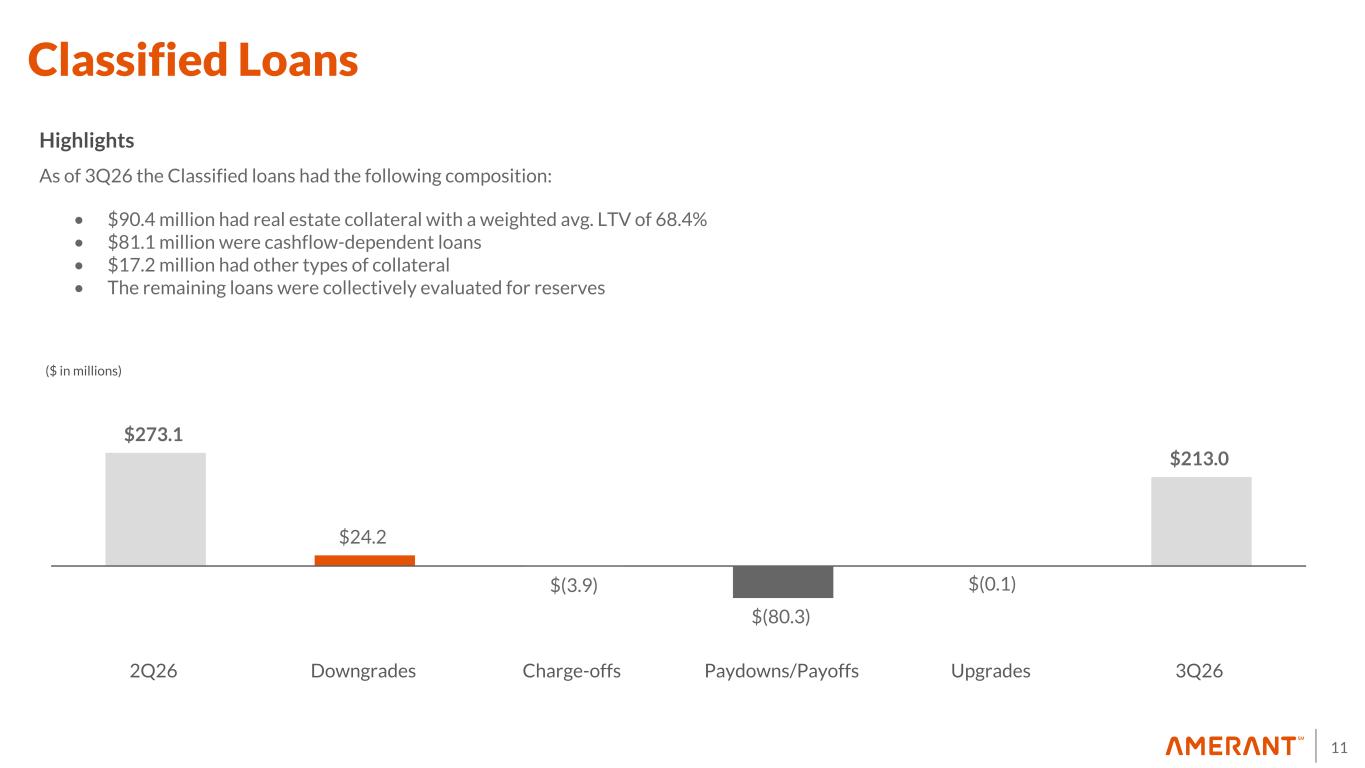
11 Classified Loans $273.1 $24.2 $(3.9) $(80.3) $(0.1) $213.0 2Q26 Downgrades Charge-offs Paydowns/Payoffs Upgrades 3Q26 ($ in millions) Highlights As of 3Q26 the Classified loans had the following composition: • $90.4 million had real estate collateral with a weighted avg. LTV of 68.4% • $81.1 million were cashflow-dependent loans • $17.2 million had other types of collateral • The remaining loans were collectively evaluated for reserves
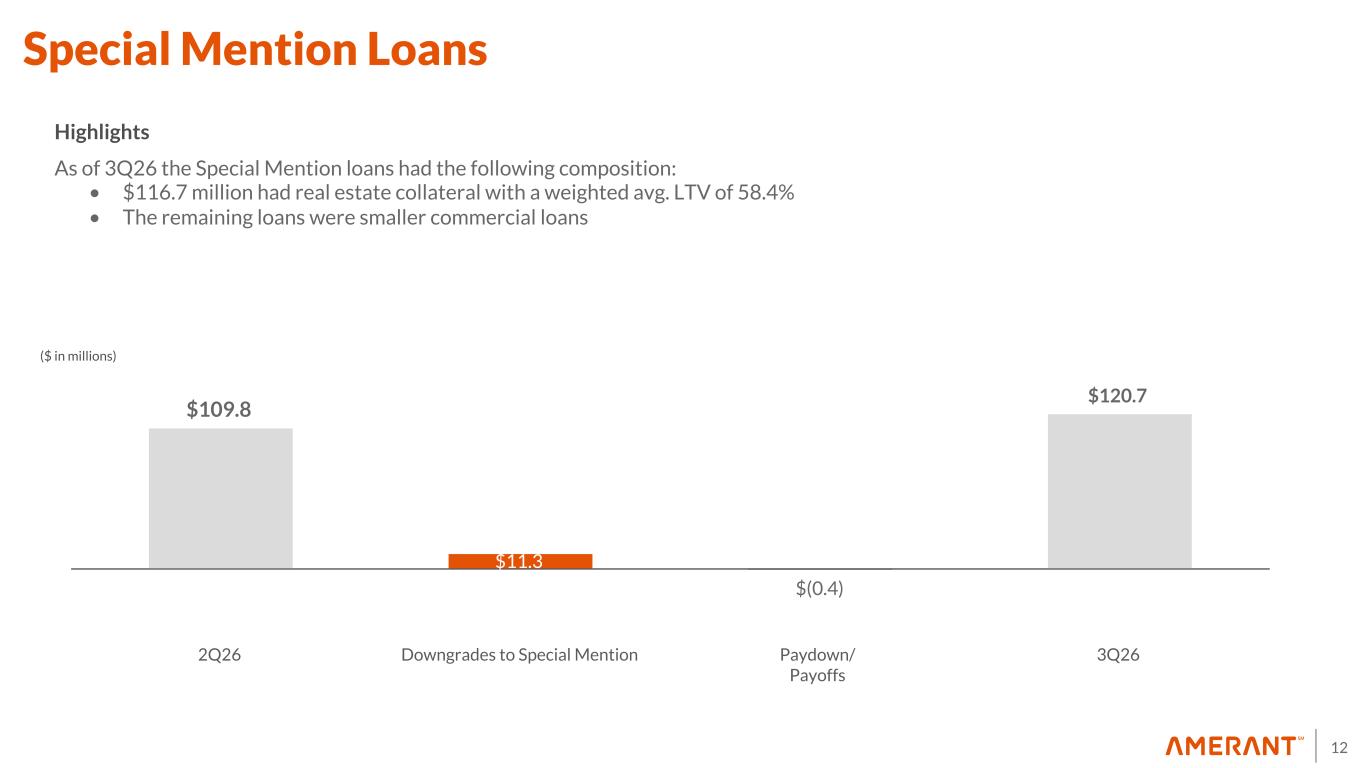
12 Special Mention Loans $109.8 $11.3 $(0.4) $120.7 2Q26 Downgrades to Special Mention Paydown/ Payoffs 3Q26 ($ in millions) Highlights As of 3Q26 the Special Mention loans had the following composition: • $116.7 million had real estate collateral with a weighted avg. LTV of 58.4% • The remaining loans were smaller commercial loans
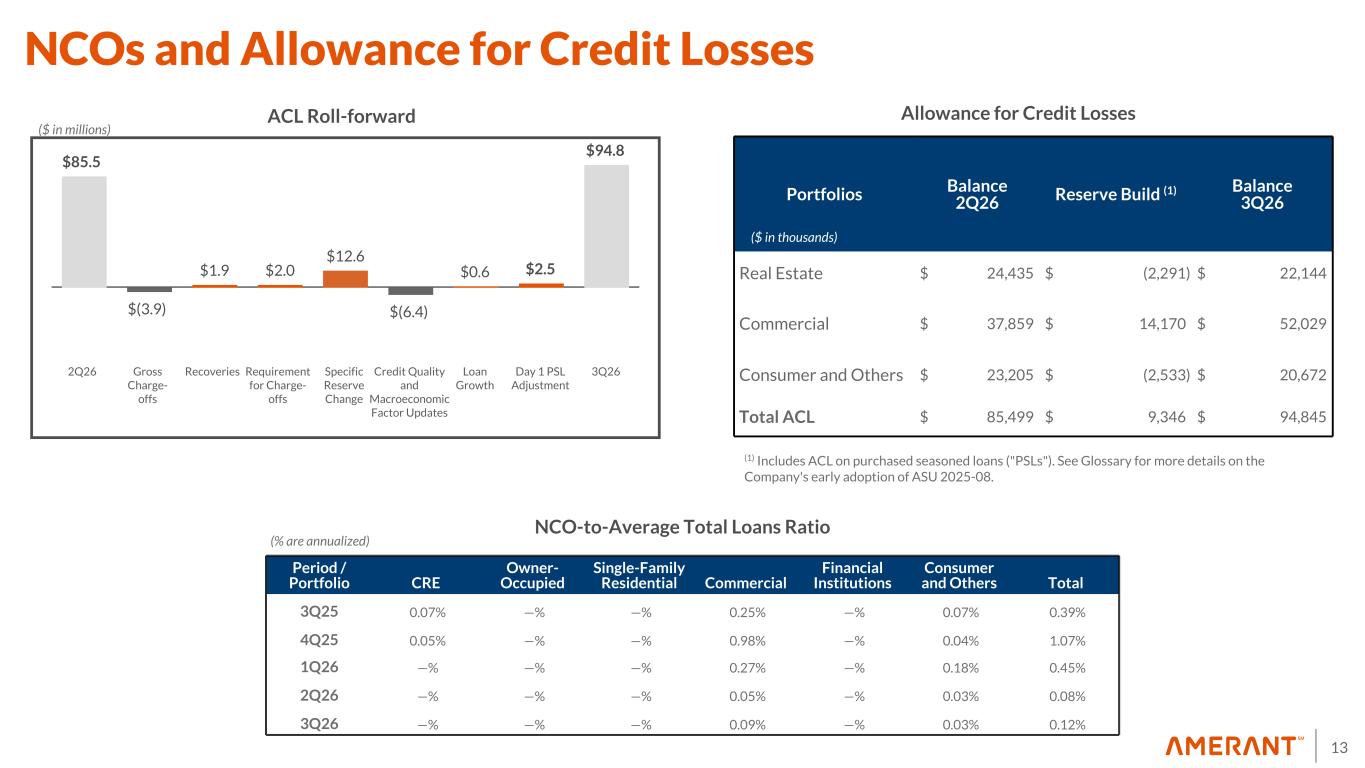
13 NCOs and Allowance for Credit Losses $85.5 $(3.9) $1.9 $2.0 $12.6 $(6.4) $0.6 $2.5 $94.8 2Q26 Gross Charge- offs Recoveries Requirement for Charge- offs Specific Reserve Change Credit Quality and Macroeconomic Factor Updates Loan Growth Day 1 PSL Adjustment 3Q26 Portfolios Balance 2Q26 Reserve Build (1) Balance 3Q26 Real Estate $ 24,435 $ (2,291) $ 22,144 Commercial $ 37,859 $ 14,170 $ 52,029 Consumer and Others $ 23,205 $ (2,533) $ 20,672 Total ACL $ 85,499 $ 9,346 $ 94,845 ACL Roll-forward Allowance for Credit Losses NCO-to-Average Total Loans Ratio ($ in millions) Period / Portfolio CRE Owner- Occupied Single-Family Residential Commercial Financial Institutions Consumer and Others Total 3Q25 0.07% —% —% 0.25% —% 0.07% 0.39% 4Q25 0.05% —% —% 0.98% —% 0.04% 1.07% 1Q26 —% —% —% 0.27% —% 0.18% 0.45% 2Q26 —% —% —% 0.05% —% 0.03% 0.08% 3Q26 —% —% —% 0.09% —% 0.03% 0.12% ($ in thousands) (% are annualized) (1) Includes ACL on purchased seasoned loans ("PSLs"). See Glossary for more details on the Company's early adoption of ASU 2025-08.
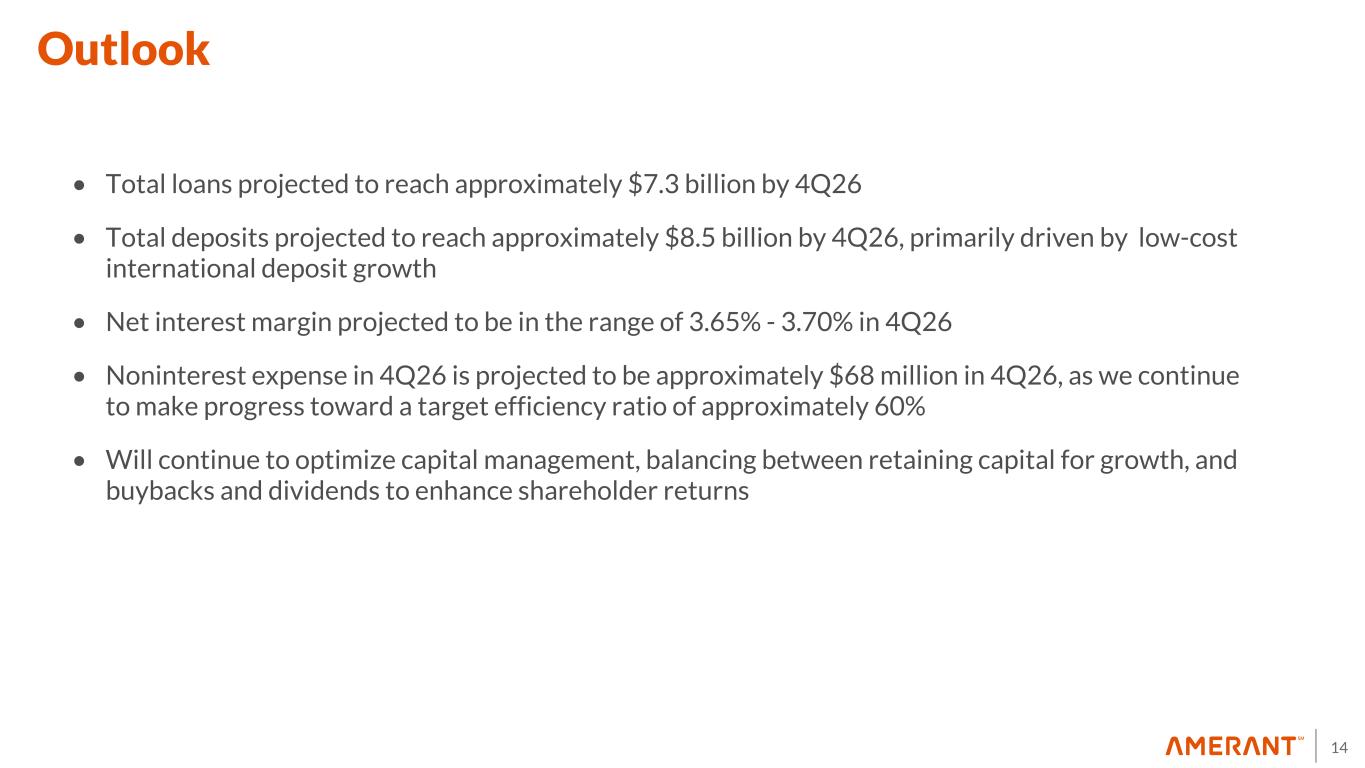
14 Outlook • Total loans projected to reach approximately $7.3 billion by 4Q26 • Total deposits projected to reach approximately $8.5 billion by 4Q26, primarily driven by low-cost international deposit growth • Net interest margin projected to be in the range of 3.65% - 3.70% in 4Q26 • Noninterest expense in 4Q26 is projected to be approximately $68 million in 4Q26, as we continue to make progress toward a target efficiency ratio of approximately 60% • Will continue to optimize capital management, balancing between retaining capital for growth, and buybacks and dividends to enhance shareholder returns
15 As we head into the final quarter of the year, we remain focused on executing against our strategic priorities with discipline and purpose to translate strategic progress into measurable financial results. • Sustaining loan growth momentum with a focus on risk-adjusted returns and balance sheet quality • Continuing to advance credit quality by: ◦ Deepening our credit culture through consistent underwriting standards, relationship-based decision-making, and proactive portfolio oversight ◦ Cultivating a high-quality pipeline with enhanced transparency into risk-adjusted returns and stronger accountability across the credit process • Realizing the benefits of previously announced efficiency initiatives, with recurring cost reductions beginning to strengthen our operating leverage • Advancing our relationship-first approach to deepen client engagement and drive lower-cost deposit growth across domestic and international markets • Preserving strong capital ratios by balancing capital retained to support growth with dividend payments and share repurchases Closing Remarks

Supplemental Information
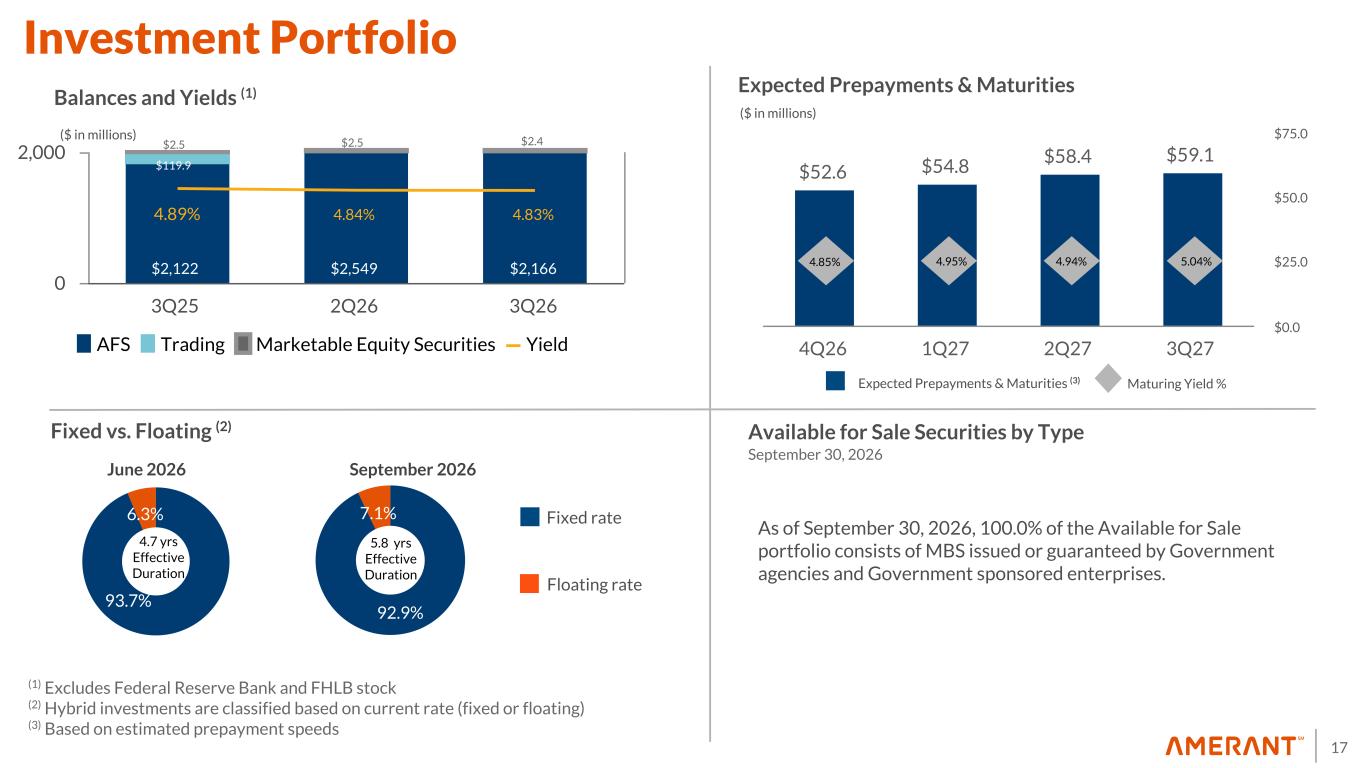
17 92.9% 7.1% $2,122 $2,549 $2,166 4.89% 4.84% 4.83% AFS Trading Marketable Equity Securities Yield 3Q25 2Q26 3Q26 0 2,000 93.7% 6.3% Balances and Yields (1) Fixed vs. Floating (2) September 2026 Floating rate Fixed rate Available for Sale Securities by Type September 30, 2026 4.7 yrs Effective Duration ($ in millions) (1) Excludes Federal Reserve Bank and FHLB stock (2) Hybrid investments are classified based on current rate (fixed or floating) (3) Based on estimated prepayment speeds 5.8 yrs Effective Duration $52.6 $54.8 $58.4 $59.1 4Q26 1Q27 2Q27 3Q27 $0.0 $25.0 $50.0 $75.0 ($ in millions) Expected Prepayments & Maturities Expected Prepayments & Maturities (3) Maturing Yield % Investment Portfolio 4.85% June 2026 As of September 30, 2026, 100.0% of the Available for Sale portfolio consists of MBS issued or guaranteed by Government agencies and Government sponsored enterprises. $2.5$2.5 $2.4 5.04%4.94%4.95% $119.9
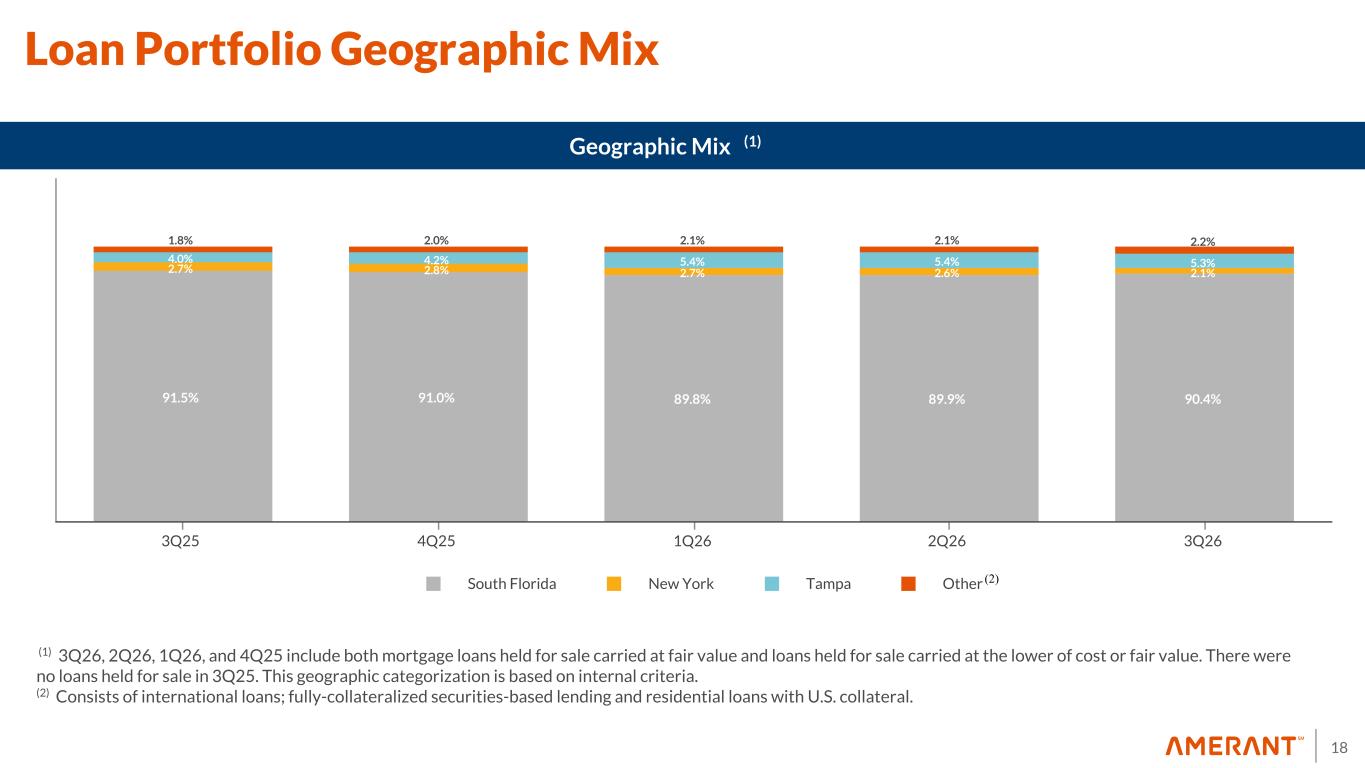
18 91.5% 91.0% 89.8% 89.9% 90.4% 2.7% 2.8% 2.7% 2.6% 2.1% 4.0% 4.2% 5.4% 5.4% 5.3% 1.8% 2.0% 2.1% 2.1% 2.2% South Florida New York Tampa Other 3Q25 4Q25 1Q26 2Q26 3Q26 Geographic Mix (Domestic) Geographic Mix (1) Loan Portfolio Geographic Mix (1) 3Q26, 2Q26, 1Q26, and 4Q25 include both mortgage loans held for sale carried at fair value and loans held for sale carried at the lower of cost or fair value. There were no loans held for sale in 3Q25. This geographic categorization is based on internal criteria. (2) Consists of international loans; fully-collateralized securities-based lending and residential loans with U.S. collateral. (2)
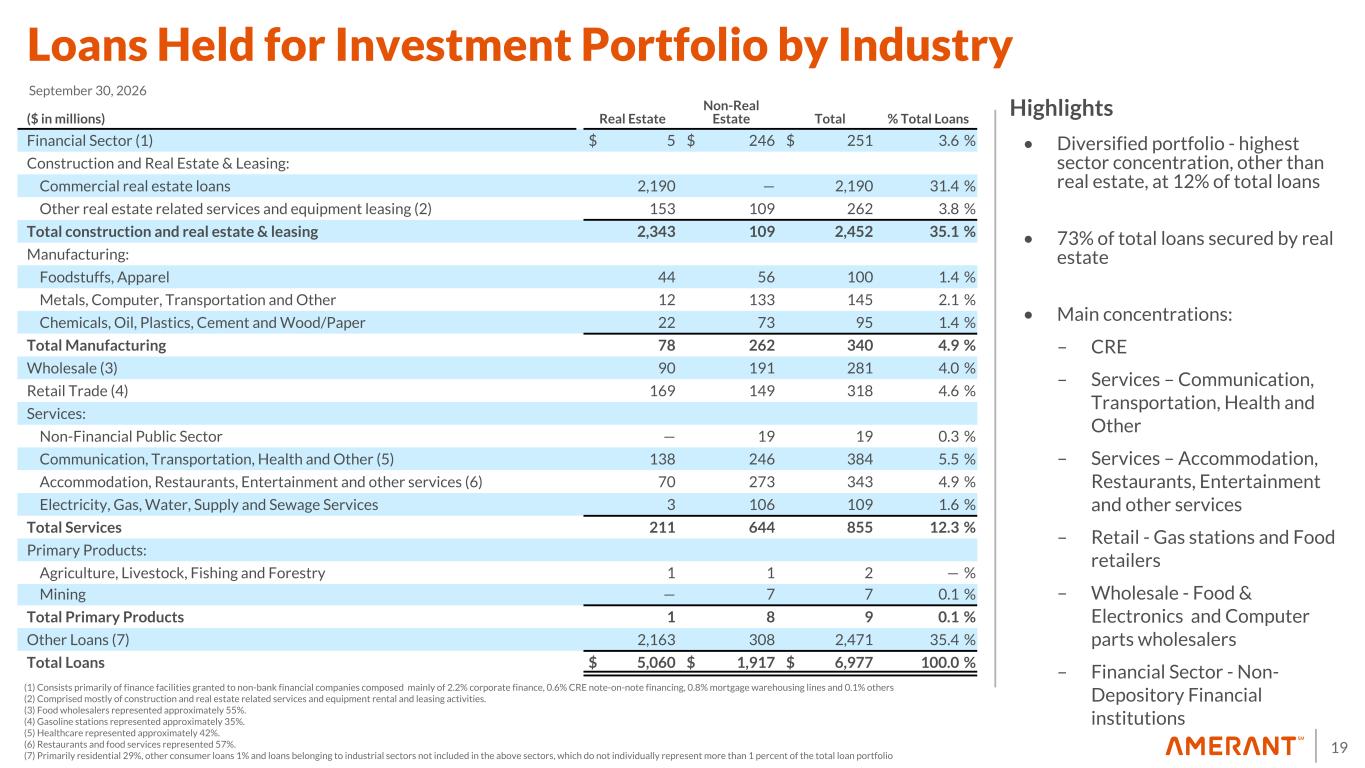
19 Loans Held for Investment Portfolio by Industry • Diversified portfolio - highest sector concentration, other than real estate, at 12% of total loans • 73% of total loans secured by real estate • Main concentrations: – CRE – Services – Communication, Transportation, Health and Other – Services – Accommodation, Restaurants, Entertainment and other services – Retail - Gas stations and Food retailers – Wholesale - Food & Electronics and Computer parts wholesalers – Financial Sector - Non- Depository Financial institutions Highlights (1) Consists primarily of finance facilities granted to non-bank financial companies composed mainly of 2.2% corporate finance, 0.6% CRE note-on-note financing, 0.8% mortgage warehousing lines and 0.1% others (2) Comprised mostly of construction and real estate related services and equipment rental and leasing activities. (3) Food wholesalers represented approximately 55%. (4) Gasoline stations represented approximately 35%. (5) Healthcare represented approximately 42%. (6) Restaurants and food services represented 57%. (7) Primarily residential 29%, other consumer loans 1% and loans belonging to industrial sectors not included in the above sectors, which do not individually represent more than 1 percent of the total loan portfolio ($ in millions) Real Estate Non-Real Estate Total % Total Loans Financial Sector (1) $ 5 $ 246 $ 251 3.6 % Construction and Real Estate & Leasing: Commercial real estate loans 2,190 — 2,190 31.4 % Other real estate related services and equipment leasing (2) 153 109 262 3.8 % Total construction and real estate & leasing 2,343 109 2,452 35.1 % Manufacturing: Foodstuffs, Apparel 44 56 100 1.4 % Metals, Computer, Transportation and Other 12 133 145 2.1 % Chemicals, Oil, Plastics, Cement and Wood/Paper 22 73 95 1.4 % Total Manufacturing 78 262 340 4.9 % Wholesale (3) 90 191 281 4.0 % Retail Trade (4) 169 149 318 4.6 % Services: Non-Financial Public Sector — 19 19 0.3 % Communication, Transportation, Health and Other (5) 138 246 384 5.5 % Accommodation, Restaurants, Entertainment and other services (6) 70 273 343 4.9 % Electricity, Gas, Water, Supply and Sewage Services 3 106 109 1.6 % Total Services 211 644 855 12.3 % Primary Products: Agriculture, Livestock, Fishing and Forestry 1 1 2 — % Mining — 7 7 0.1 % Total Primary Products 1 8 9 0.1 % Other Loans (7) 2,163 308 2,471 35.4 % Total Loans $ 5,060 $ 1,917 $ 6,977 100.0 % September 30, 2026
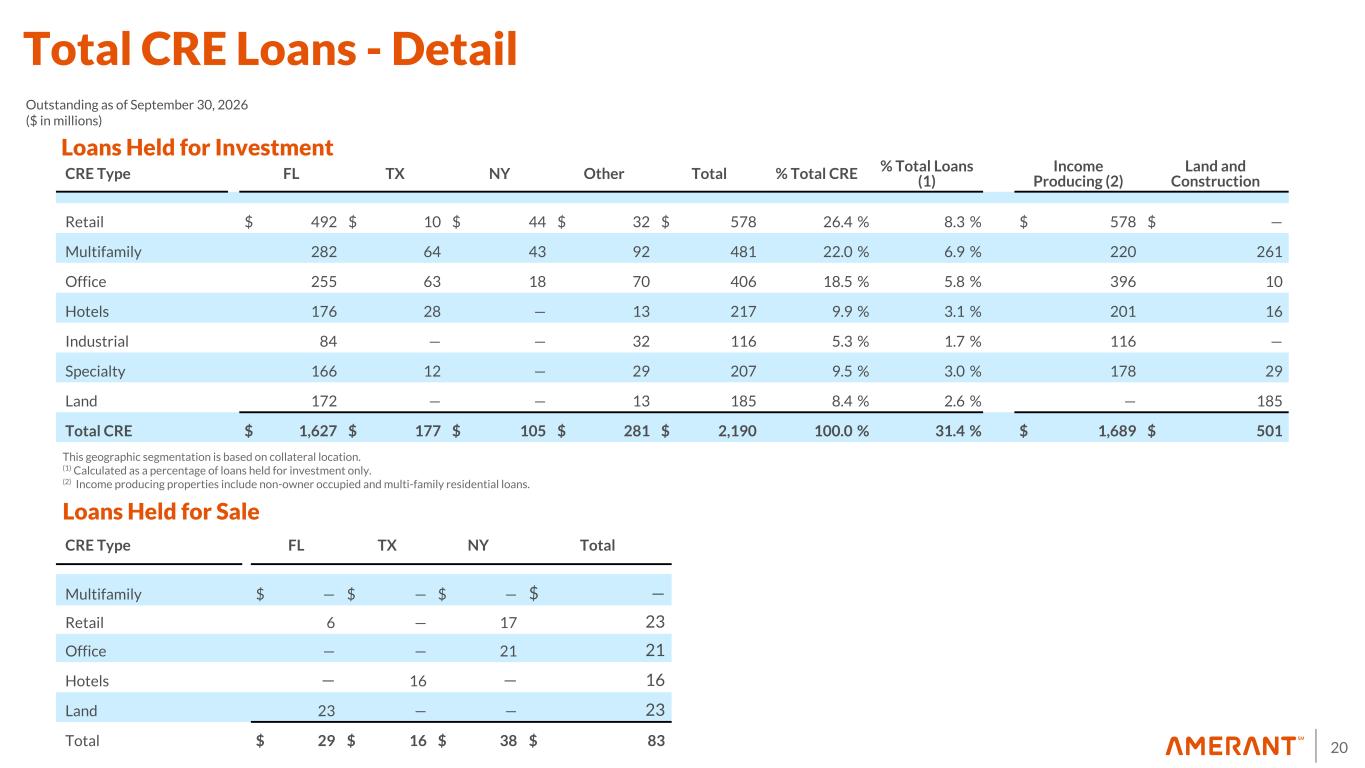
20 CRE Type FL TX NY Other Total % Total CRE % Total Loans (1) Income Producing (2) Land and Construction Retail $ 492 $ 10 $ 44 $ 32 $ 578 26.4 % 8.3 % $ 578 $ — Multifamily 282 64 43 92 481 22.0 % 6.9 % 220 261 Office 255 63 18 70 406 18.5 % 5.8 % 396 10 Hotels 176 28 — 13 217 9.9 % 3.1 % 201 16 Industrial 84 — — 32 116 5.3 % 1.7 % 116 — Specialty 166 12 — 29 207 9.5 % 3.0 % 178 29 Land 172 — — 13 185 8.4 % 2.6 % — 185 Total CRE $ 1,627 $ 177 $ 105 $ 281 $ 2,190 100.0 % 31.4 % $ 1,689 $ 501 Outstanding as of September 30, 2026 ($ in millions) This geographic segmentation is based on collateral location. (1) Calculated as a percentage of loans held for investment only. (2) Income producing properties include non-owner occupied and multi-family residential loans. Total CRE Loans - Detail CRE Type FL TX NY Total Multifamily $ — $ — $ — $ — Retail 6 — 17 23 Office — — 21 21 Hotels — 16 — 16 Land 23 — — 23 Total $ 29 $ 16 $ 38 $ 83 Loans Held for Sale Loans Held for Investment
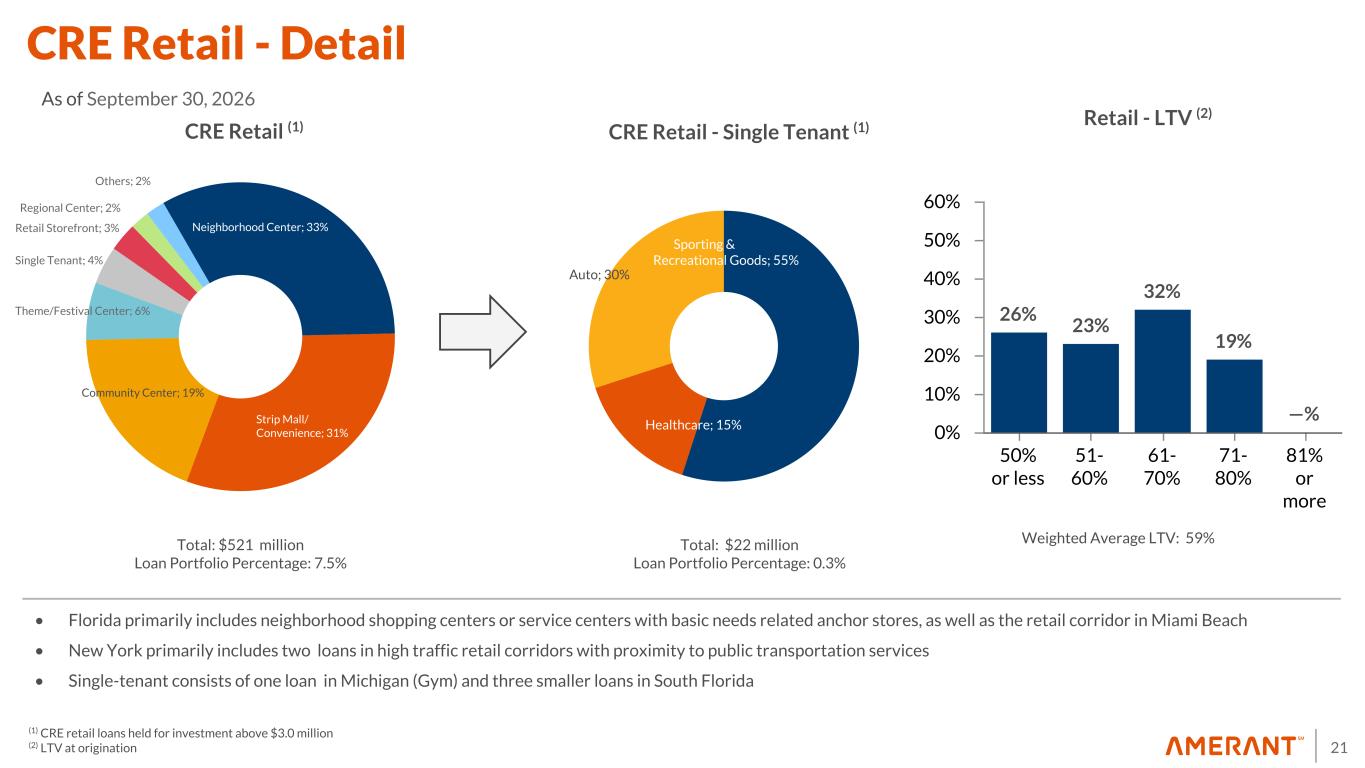
21 26% 23% 32% 19% —% 50% or less 51- 60% 61- 70% 71- 80% 81% or more 0% 10% 20% 30% 40% 50% 60% • Florida primarily includes neighborhood shopping centers or service centers with basic needs related anchor stores, as well as the retail corridor in Miami Beach • New York primarily includes two loans in high traffic retail corridors with proximity to public transportation services • Single-tenant consists of one loan in Michigan (Gym) and three smaller loans in South Florida CRE Retail (1) Retail - LTV (2) Sporting & Recreational Goods; 55% Healthcare; 15% Auto; 30% CRE Retail - Single Tenant (1) (1) CRE retail loans held for investment above $3.0 million (2) LTV at origination Total: $521 million Loan Portfolio Percentage: 7.5% Total: $22 million Loan Portfolio Percentage: 0.3% Neighborhood Center; 33% Strip Mall/ Convenience; 31% Community Center; 19% Theme/Festival Center; 6% Single Tenant; 4% Retail Storefront; 3% Regional Center; 2% Others; 2% CRE Retail - Detail As of September 30, 2026 Weighted Average LTV: 59%
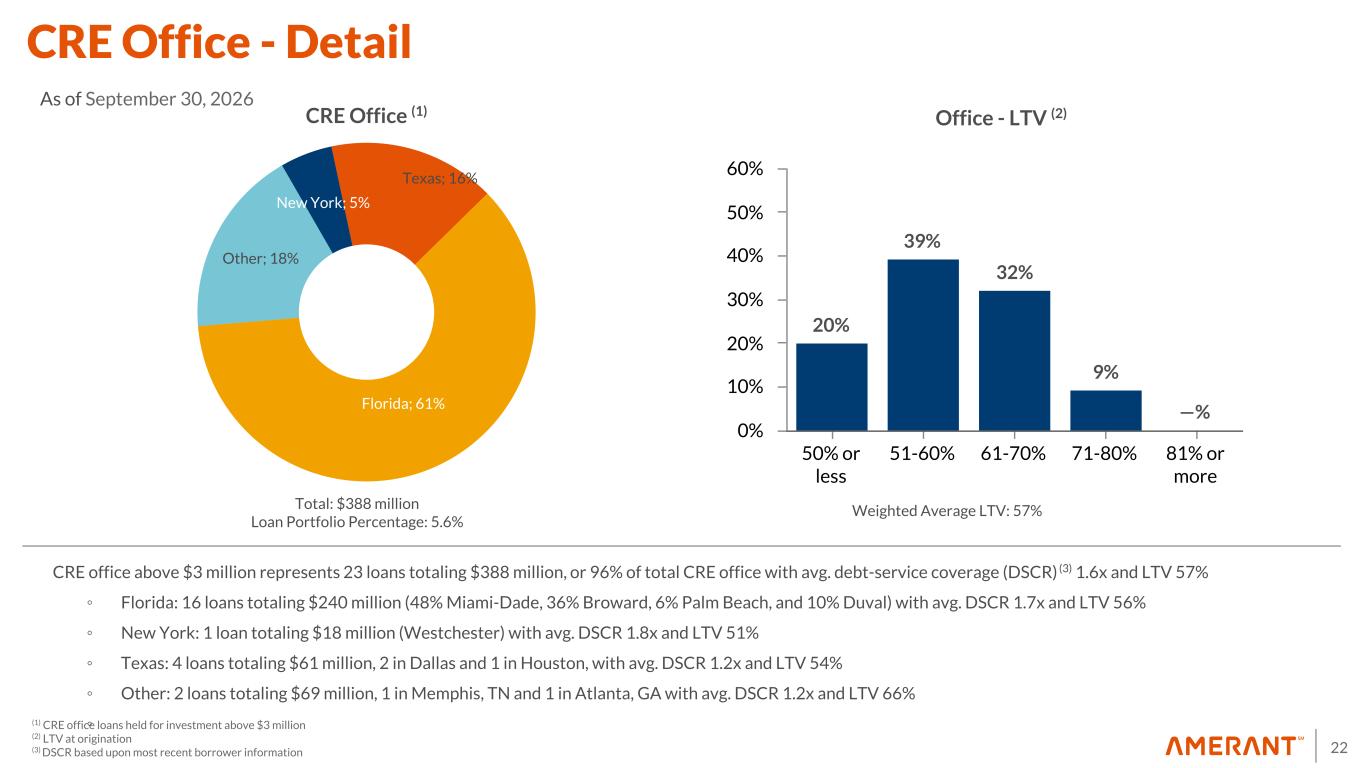
22 New York; 5% Texas; 16% Florida; 61% Other; 18% 20% 39% 32% 9% —% 50% or less 51-60% 61-70% 71-80% 81% or more 0% 10% 20% 30% 40% 50% 60% CRE office above $3 million represents 23 loans totaling $388 million, or 96% of total CRE office with avg. debt-service coverage (DSCR) (3) 1.6x and LTV 57% ◦ Florida: 16 loans totaling $240 million (48% Miami-Dade, 36% Broward, 6% Palm Beach, and 10% Duval) with avg. DSCR 1.7x and LTV 56% ◦ New York: 1 loan totaling $18 million (Westchester) with avg. DSCR 1.8x and LTV 51% ◦ Texas: 4 loans totaling $61 million, 2 in Dallas and 1 in Houston, with avg. DSCR 1.2x and LTV 54% ◦ Other: 2 loans totaling $69 million, 1 in Memphis, TN and 1 in Atlanta, GA with avg. DSCR 1.2x and LTV 66% ◦ CRE Office (1) Office - LTV (2) (1) CRE office loans held for investment above $3 million (2) LTV at origination (3) DSCR based upon most recent borrower information Total: $388 million Loan Portfolio Percentage: 5.6% CRE Office - Detail As of September 30, 2026 Weighted Average LTV: 57%
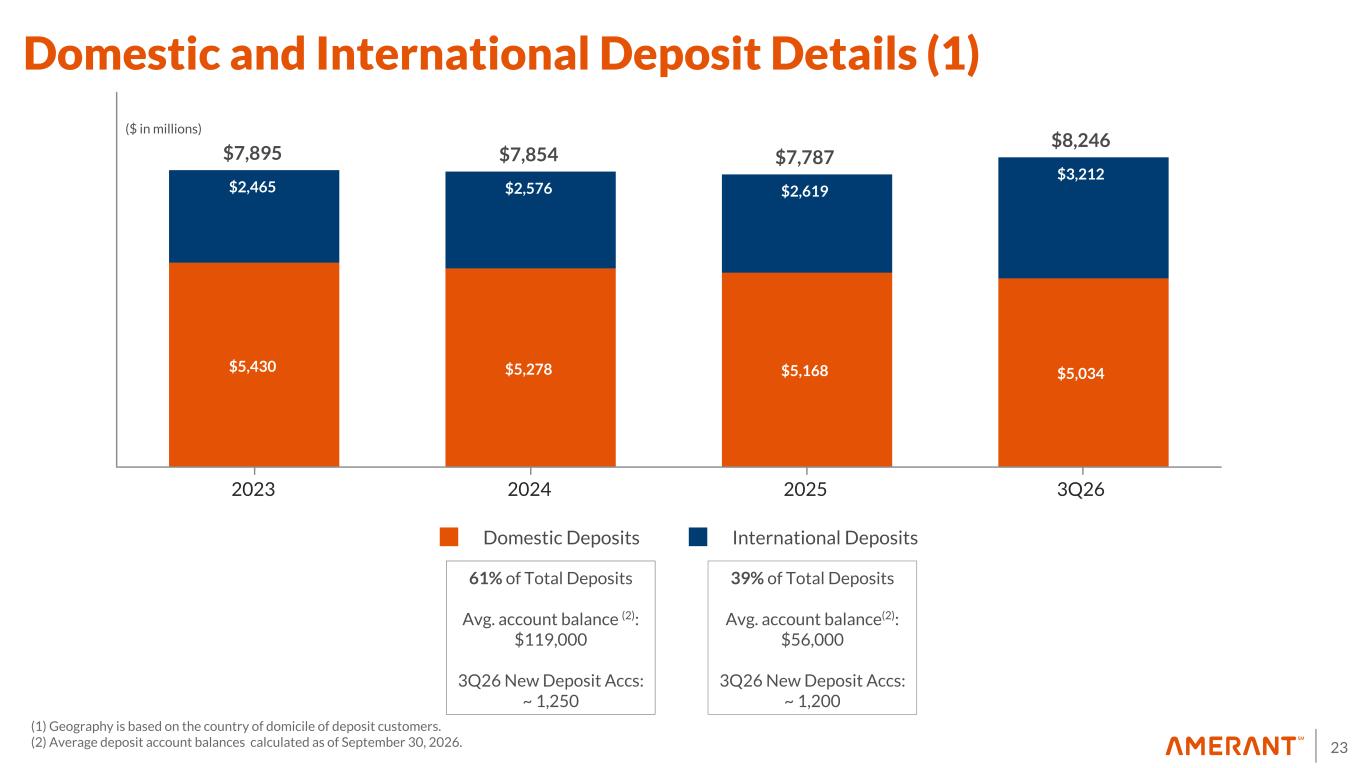
23 $7,895 $7,854 $7,787 $8,246 $5,430 $5,278 $5,168 $5,034 $2,465 $2,576 $2,619 $3,212 Domestic Deposits International Deposits 2023 2024 2025 3Q26 ($ in millions) 39% of Total Deposits Avg. account balance(2): $56,000 3Q26 New Deposit Accs: ~ 1,200 61% of Total Deposits Avg. account balance (2): $119,000 3Q26 New Deposit Accs: ~ 1,250 Domestic and International Deposit Details (1) (1) Geography is based on the country of domicile of deposit customers. (2) Average deposit account balances calculated as of September 30, 2026.
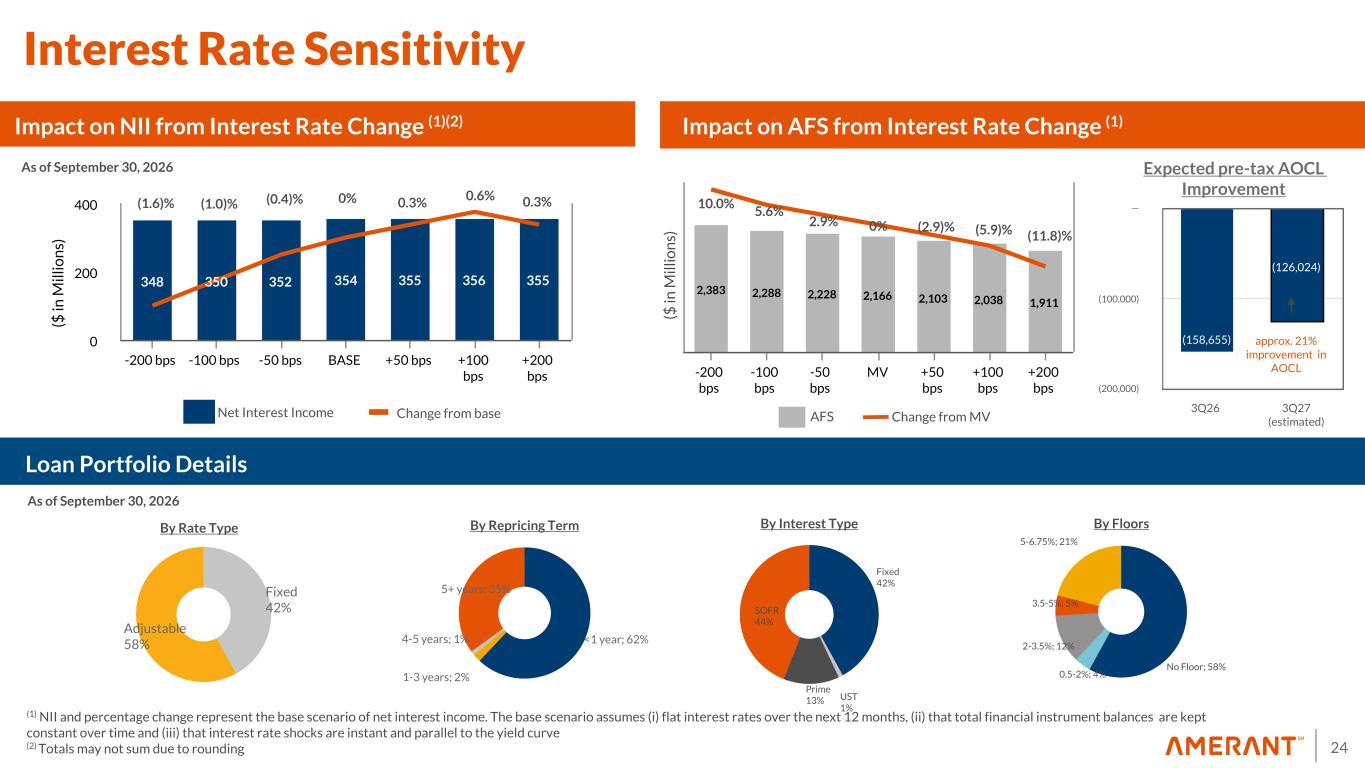
24 <1 year; 62% 1-3 years; 2% 4-5 years; 1% 5+ years; 35% 348 350 352 354 355 356 355 -200 bps -100 bps -50 bps BASE +50 bps +100 bps +200 bps 0 200 400 As of September 30, 2026 Fixed 42% Adjustable 58% 24 By Interest TypeBy Rate Type By Repricing Term (1) NII and percentage change represent the base scenario of net interest income. The base scenario assumes (i) flat interest rates over the next 12 months, (ii) that total financial instrument balances are kept constant over time and (iii) that interest rate shocks are instant and parallel to the yield curve (2) Totals may not sum due to rounding Loan Portfolio Details Impact on NII from Interest Rate Change (1)(2) AFSChange from base ($ in M ill io n s) Fixed 42% UST 1% Prime 13% SOFR 44% As of September 30, 2026 Impact on AFS from Interest Rate Change (1) (1.6)% (1.0)% 0% 0.6%0.3%(0.4)% 0.3% No Floor; 58% 0.5-2%; 4% 2-3.5%; 12% 3.5-5%; 5% 5-6.75%; 21% By Floors 2,383 2,288 2,228 2,166 2,103 2,038 1,911 -200 bps -100 bps -50 bps MV +50 bps +100 bps +200 bps ($ in M ill io n s) 10.0% 5.6% 2.9% 0% (2.9)% (5.9)% (11.8)% Expected pre-tax AOCL Improvement Change from MVNet Interest Income (158,655) (126,024) 3Q26 3Q27 (estimated) (200,000) (100,000) — approx. 21% improvement in AOCL Interest Rate Sensitivity
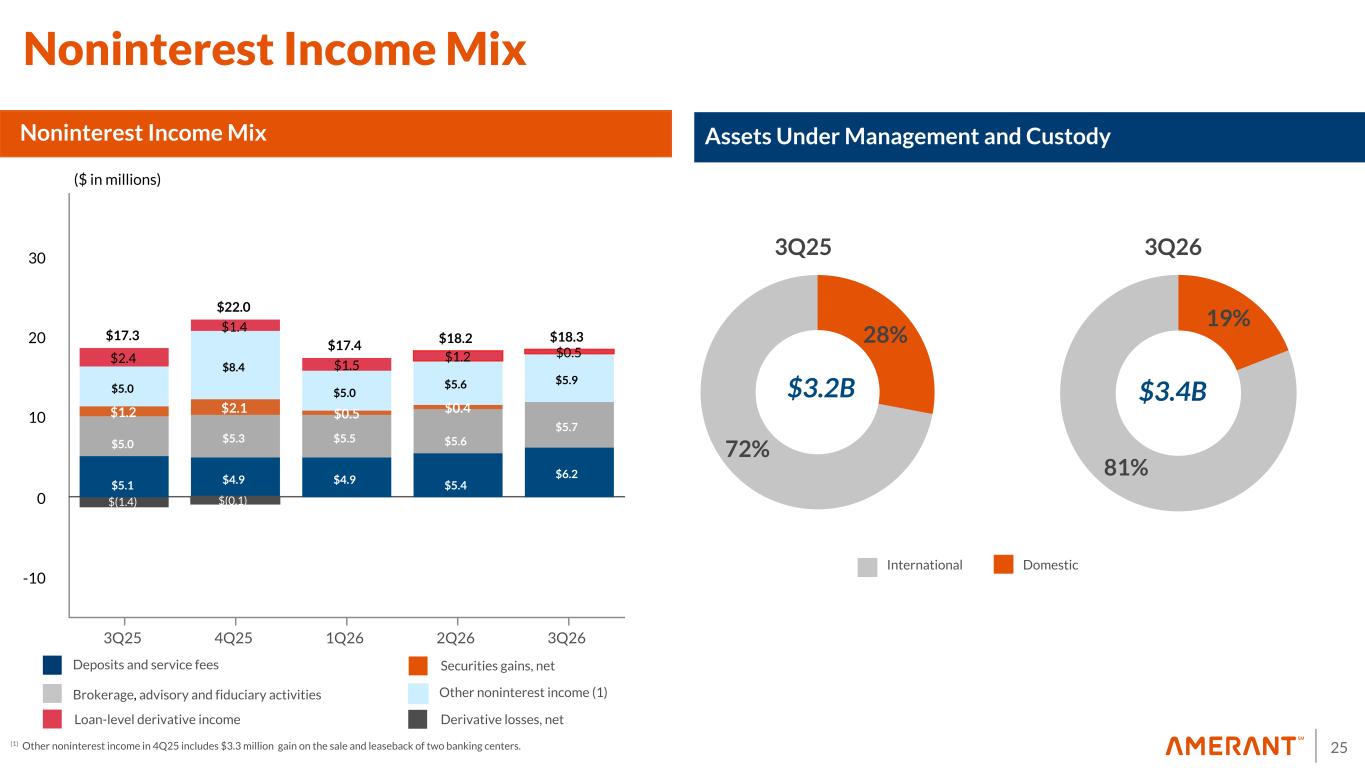
25 $17.3 $22.0 $17.4 $18.2 $18.3 $5.1 $4.9 $4.9 $5.4 $6.2 $5.0 $5.3 $5.5 $5.6 $5.7 $1.2 $2.1 $0.5 $0.4 $5.0 $8.4 $5.0 $5.6 $5.9 $2.4 $1.4 $1.5 $1.2 $0.5 3Q25 4Q25 1Q26 2Q26 3Q26 -10 0 10 20 30 28% 72% 19% 81% Noninterest Income Mix Deposits and service fees Brokerage, advisory and fiduciary activities Other noninterest income (1) DomesticInternational 3Q25 $3.4B ($ in millions) Securities gains, net Loan-level derivative income Derivative losses, net Noninterest Income Mix $3.2B Assets Under Management and Custody 3Q26 $(0.2) (1) Other noninterest income in 4Q25 includes $3.3 million gain on the sale and leaseback of two banking centers. $(1.4) $(0.1)$(0.1)
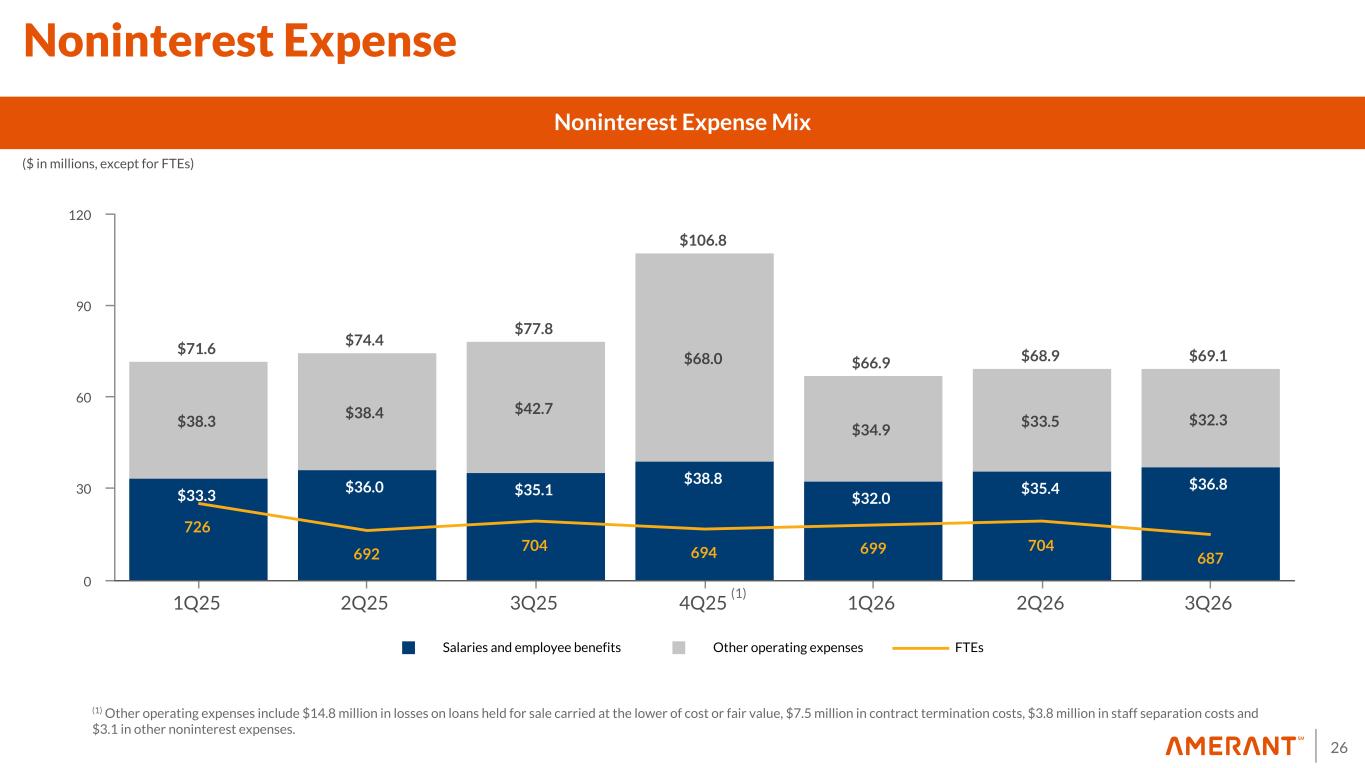
26 $71.6 $74.4 $77.8 $106.8 $66.9 $68.9 $69.1 $33.3 $36.0 $35.1 $38.8 $32.0 $35.4 $36.8 $38.3 $38.4 $42.7 $68.0 $34.9 $33.5 $32.3 726 692 704 694 699 704 687 Salaries and employee benefits Other operating expenses FTEs 1Q25 2Q25 3Q25 4Q25 1Q26 2Q26 3Q26 0 30 60 90 120 ($ in millions, except for FTEs) Noninterest Expense Noninterest Expense Mix (1) Other operating expenses include $14.8 million in losses on loans held for sale carried at the lower of cost or fair value, $7.5 million in contract termination costs, $3.8 million in staff separation costs and $3.1 in other noninterest expenses. (1)
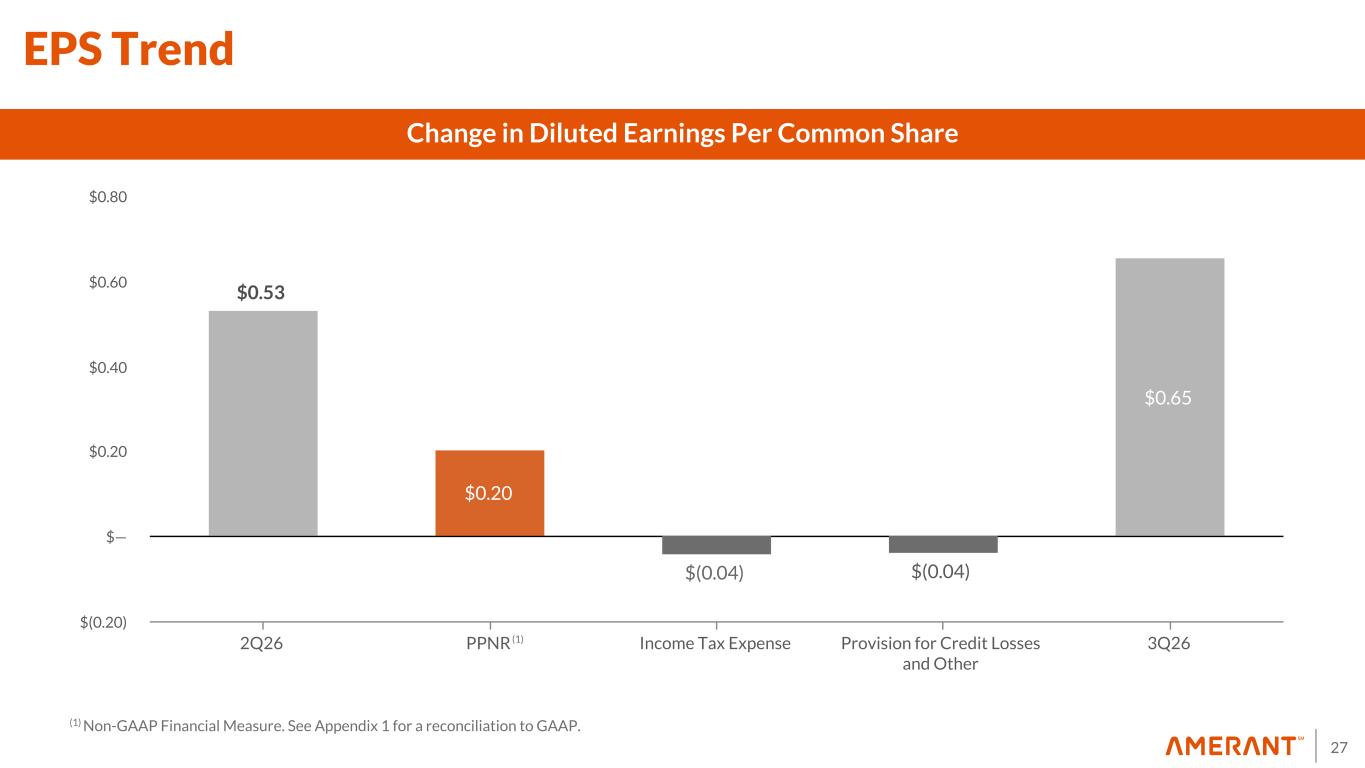
27 Change in Diluted Earnings Per Common Share $0.53 $0.20 $(0.04) $(0.04) $0.65 2Q26 PPNR Income Tax Expense Provision for Credit Losses and Other 3Q26 $(0.20) $— $0.20 $0.40 $0.60 $0.80 EPS Trend (1) Non-GAAP Financial Measure. See Appendix 1 for a reconciliation to GAAP. (1)

Appendices
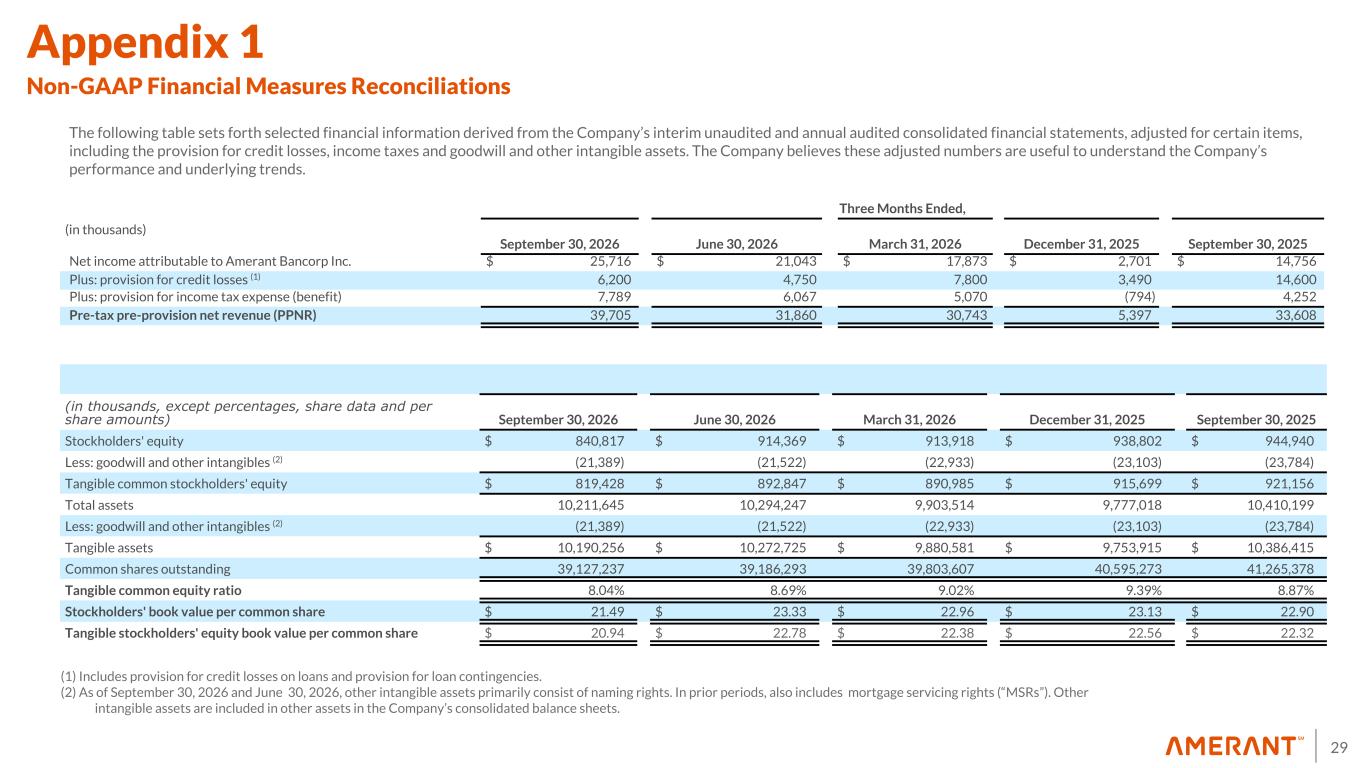
29 Appendix 1 Non-GAAP Financial Measures Reconciliations The following table sets forth selected financial information derived from the Company’s interim unaudited and annual audited consolidated financial statements, adjusted for certain items, including the provision for credit losses, income taxes and goodwill and other intangible assets. The Company believes these adjusted numbers are useful to understand the Company’s performance and underlying trends. Three Months Ended, (in thousands) September 30, 2026 June 30, 2026 March 31, 2026 December 31, 2025 September 30, 2025 Net income attributable to Amerant Bancorp Inc. $ 25,716 $ 21,043 $ 17,873 $ 2,701 $ 14,756 Plus: provision for credit losses (1) 6,200 4,750 7,800 3,490 14,600 Plus: provision for income tax expense (benefit) 7,789 6,067 5,070 (794) 4,252 Pre-tax pre-provision net revenue (PPNR) 39,705 31,860 30,743 5,397 33,608 (in thousands, except percentages, share data and per share amounts) September 30, 2026 June 30, 2026 March 31, 2026 December 31, 2025 September 30, 2025 Stockholders' equity $ 840,817 $ 914,369 $ 913,918 $ 938,802 $ 944,940 Less: goodwill and other intangibles (2) (21,389) (21,522) (22,933) (23,103) (23,784) Tangible common stockholders' equity $ 819,428 $ 892,847 $ 890,985 $ 915,699 $ 921,156 Total assets 10,211,645 10,294,247 9,903,514 9,777,018 10,410,199 Less: goodwill and other intangibles (2) (21,389) (21,522) (22,933) (23,103) (23,784) Tangible assets $ 10,190,256 $ 10,272,725 $ 9,880,581 $ 9,753,915 $ 10,386,415 Common shares outstanding 39,127,237 39,186,293 39,803,607 40,595,273 41,265,378 Tangible common equity ratio 8.04 % 8.69 % 9.02 % 9.39 % 8.87 % Stockholders' book value per common share $ 21.49 $ 23.33 $ 22.96 $ 23.13 $ 22.90 Tangible stockholders' equity book value per common share $ 20.94 $ 22.78 $ 22.38 $ 22.56 $ 22.32 (1) Includes provision for credit losses on loans and provision for loan contingencies. (2) As of September 30, 2026 and June 30, 2026, other intangible assets primarily consist of naming rights. In prior periods, also includes mortgage servicing rights (“MSRs”). Other intangible assets are included in other assets in the Company’s consolidated balance sheets.
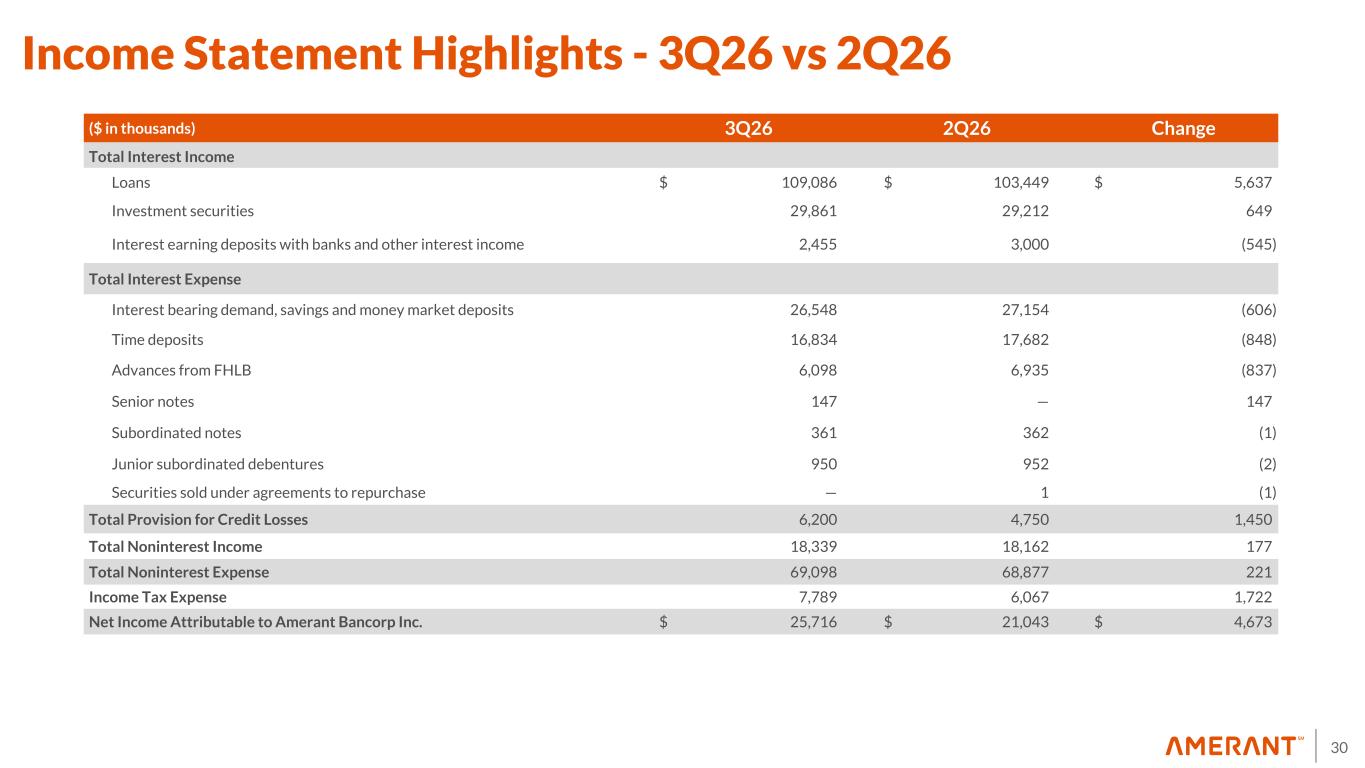
30 Income Statement Highlights - 3Q26 vs 2Q26 ($ in thousands) 3Q26 2Q26 Change Total Interest Income Loans $ 109,086 $ 103,449 $ 5,637 Investment securities 29,861 29,212 649 Interest earning deposits with banks and other interest income 2,455 3,000 (545) Total Interest Expense Interest bearing demand, savings and money market deposits 26,548 27,154 (606) Time deposits 16,834 17,682 (848) Advances from FHLB 6,098 6,935 (837) Senior notes 147 — 147 Subordinated notes 361 362 (1) Junior subordinated debentures 950 952 (2) Securities sold under agreements to repurchase — 1 (1) Total Provision for Credit Losses 6,200 4,750 1,450 Total Noninterest Income 18,339 18,162 177 Total Noninterest Expense 69,098 68,877 221 Income Tax Expense 7,789 6,067 1,722 Net Income Attributable to Amerant Bancorp Inc. $ 25,716 $ 21,043 $ 4,673
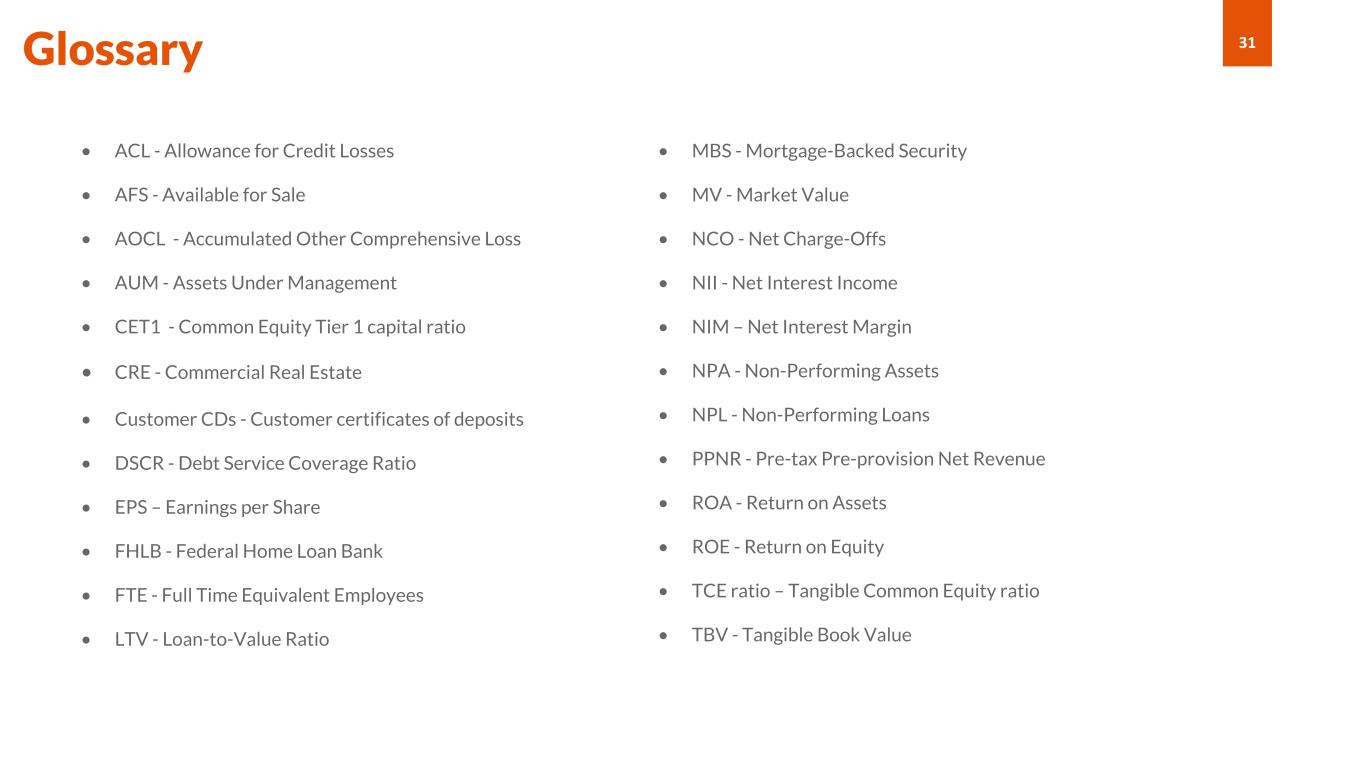
31 • ACL - Allowance for Credit Losses • AFS - Available for Sale • AOCL - Accumulated Other Comprehensive Loss • AUM - Assets Under Management • CET1 - Common Equity Tier 1 capital ratio • CRE - Commercial Real Estate • Customer CDs - Customer certificates of deposits • DSCR - Debt Service Coverage Ratio • EPS – Earnings per Share • FHLB - Federal Home Loan Bank • FTE - Full Time Equivalent Employees • LTV - Loan-to-Value Ratio Glossary • MBS - Mortgage-Backed Security • MV - Market Value • NCO - Net Charge-Offs • NII - Net Interest Income • NIM – Net Interest Margin • NPA - Non-Performing Assets • NPL - Non-Performing Loans • PPNR - Pre-tax Pre-provision Net Revenue • ROA - Return on Assets • ROE - Return on Equity • TCE ratio – Tangible Common Equity ratio • TBV - Tangible Book Value
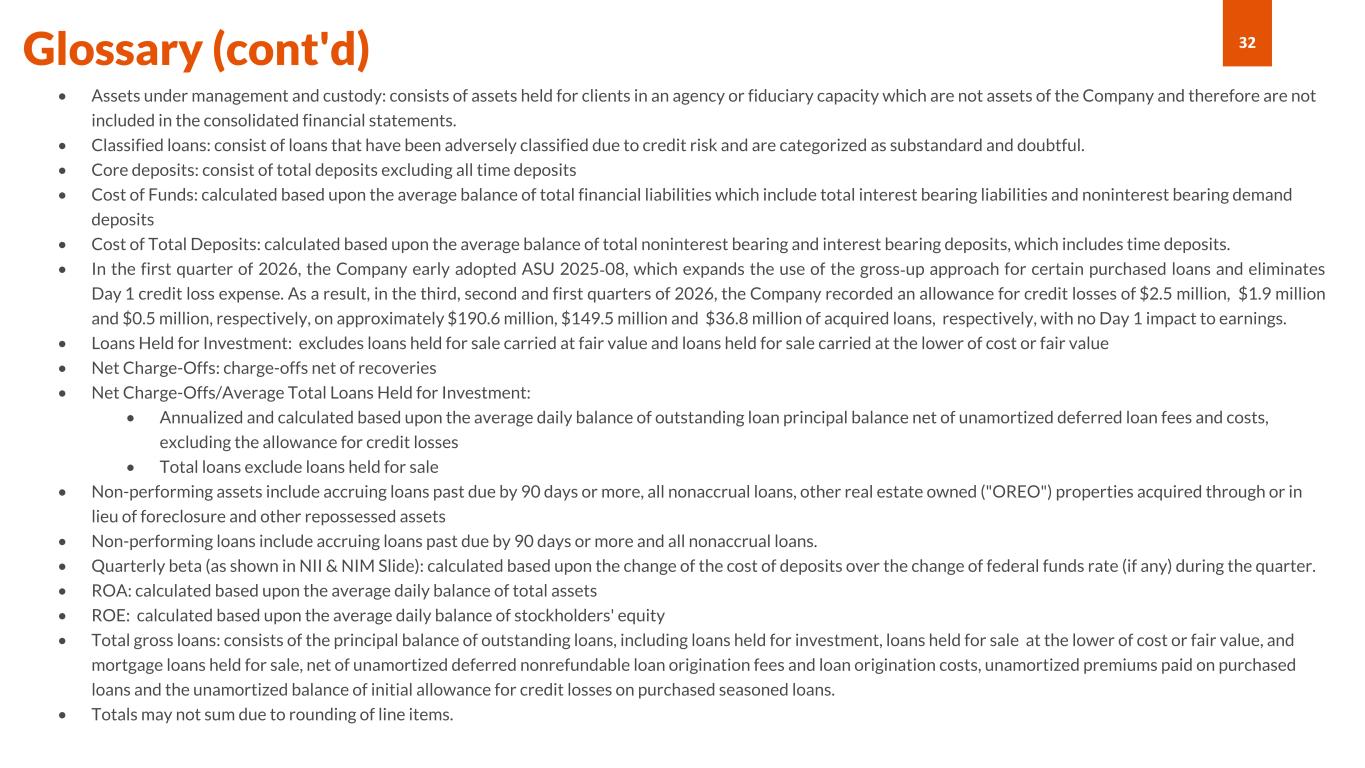
32Glossary (cont'd) • Assets under management and custody: consists of assets held for clients in an agency or fiduciary capacity which are not assets of the Company and therefore are not included in the consolidated financial statements. • Classified loans: consist of loans that have been adversely classified due to credit risk and are categorized as substandard and doubtful. • Core deposits: consist of total deposits excluding all time deposits • Cost of Funds: calculated based upon the average balance of total financial liabilities which include total interest bearing liabilities and noninterest bearing demand deposits • Cost of Total Deposits: calculated based upon the average balance of total noninterest bearing and interest bearing deposits, which includes time deposits. • In the first quarter of 2026, the Company early adopted ASU 2025‑08, which expands the use of the gross‑up approach for certain purchased loans and eliminates Day 1 credit loss expense. As a result, in the third, second and first quarters of 2026, the Company recorded an allowance for credit losses of $2.5 million, $1.9 million and $0.5 million, respectively, on approximately $190.6 million, $149.5 million and $36.8 million of acquired loans, respectively, with no Day 1 impact to earnings. • Loans Held for Investment: excludes loans held for sale carried at fair value and loans held for sale carried at the lower of cost or fair value • Net Charge-Offs: charge-offs net of recoveries • Net Charge-Offs/Average Total Loans Held for Investment: • Annualized and calculated based upon the average daily balance of outstanding loan principal balance net of unamortized deferred loan fees and costs, excluding the allowance for credit losses • Total loans exclude loans held for sale • Non-performing assets include accruing loans past due by 90 days or more, all nonaccrual loans, other real estate owned ("OREO") properties acquired through or in lieu of foreclosure and other repossessed assets • Non-performing loans include accruing loans past due by 90 days or more and all nonaccrual loans. • Quarterly beta (as shown in NII & NIM Slide): calculated based upon the change of the cost of deposits over the change of federal funds rate (if any) during the quarter. • ROA: calculated based upon the average daily balance of total assets • ROE: calculated based upon the average daily balance of stockholders' equity • Total gross loans: consists of the principal balance of outstanding loans, including loans held for investment, loans held for sale at the lower of cost or fair value, and mortgage loans held for sale, net of unamortized deferred nonrefundable loan origination fees and loan origination costs, unamortized premiums paid on purchased loans and the unamortized balance of initial allowance for credit losses on purchased seasoned loans. • Totals may not sum due to rounding of line items.
.