Exhibit 99.1
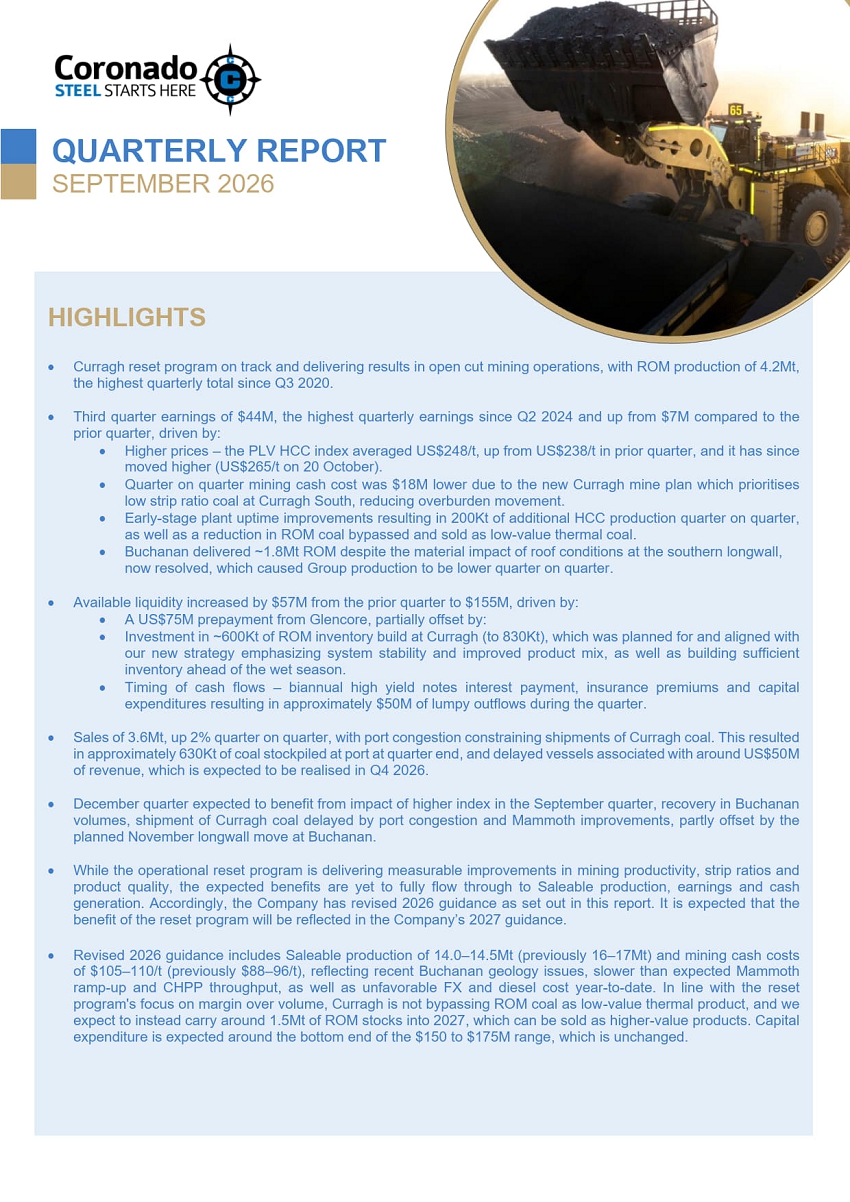
| QUARTERLY REPORT SEPTEMBER 2026 HIGHLIGHTS • Curragh reset program on track and delivering results in open cut mining operations, with ROM production of 4.2Mt, the highest quarterly total since Q3 2020. • Third quarter earnings of $44M, the highest quarterly earnings since Q2 2024 and up from $7M compared to the prior quarter, driven by: • Higher prices – the PLV HCC index averaged US$248/t, up from US$238/t in prior quarter, and it has since moved higher (US$269/t on 12 October). • Quarter on quarter mining cash cost was $19M lower due to the new Curragh mine plan which prioritises low strip ratio coal at Curragh South, reducing overburden movement. • Early-stage plant uptime improvements resulting in 200Kt of additional HCC production quarter on quarter, as well as a reduction in ROM coal bypassed and sold as low-value thermal coal. • Buchanan delivered ~700Kt ROM despite the material impact of roof conditions at the southern longwall, now resolved, which caused Group production to be lower quarter on quarter. • Available liquidity increased by $57M from the prior quarter to $155M, driven by: • A US$75M prepayment from Glencore, partially offset by: • Investment in ~600Kt of ROM inventory build at Curragh (to 830Kt), which was planned for and aligned with our new strategy emphasizing system stability and improved product mix, as well as building sufficient inventory ahead of the wet season. • Timing of cash flows – biannual high yield notes interest payment, insurance premiums and capital expenditures resulting in approximately $50M of lumpy outflows during the quarter. • Sales of 3.6Mt, up 2% quarter on quarter, with port congestion constraining shipments of Curragh coal. This resulted in approximately 630Kt of coal stockpiled at port at quarter end, and delayed vessels associated with around US$50M of revenue, which is expected to be realised in Q4 2026. • December quarter expected to benefit from impact of higher index in the September quarter, recovery in Buchanan volumes, shipment of Curragh coal delayed by port congestion and Mammoth improvements, partly offset by the planned November longwall move at Buchanan. • While the operational reset program is delivering measurable improvements in mining productivity, strip ratios and product quality, the expected benefits are yet to fully flow through to Saleable production, earnings and cash generation. Accordingly, the Company has revised 2026 guidance as set out in this report. It is expected that the benefit of the reset program will be reflected in the Company’s 2027 guidance. • Revised 2026 guidance includes Saleable production of 14.0–14.5Mt (previously 16–17Mt) and mining cash costs of $105–110/t (previously $88–96/t), reflecting recent Buchanan geology issues, slower than expected Mammoth ramp-up and CHPP throughput, as well as unfavorable FX and diesel cost year-to-date. In line with the reset program's focus on margin over volume, Curragh is not bypassing ROM coal as low-value thermal product, and we expect to instead carry around 1.5Mt of ROM stocks into 2027, which can be sold as higher-value products. Capital expenditure is expected around the bottom end of the $150 to $175M range, which is unchanged. |
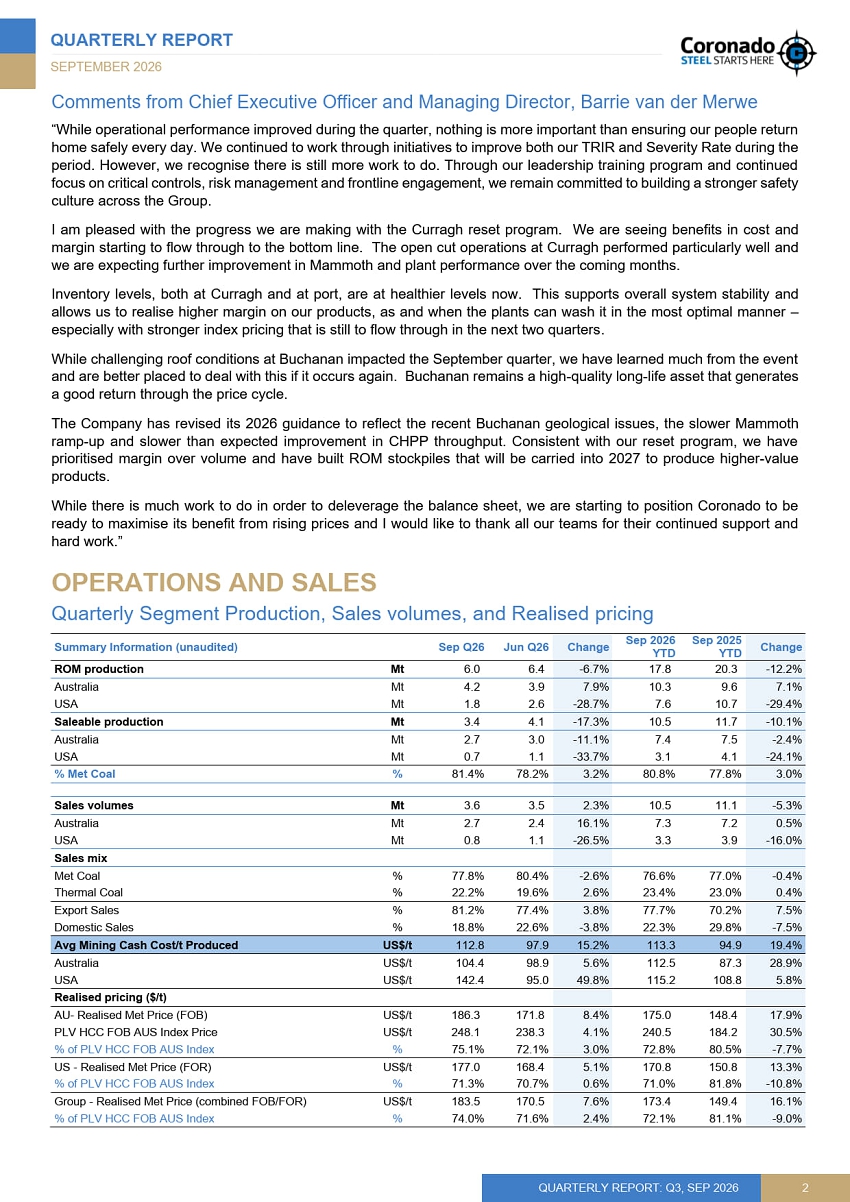
| QUARTERLY REPORT SEPTEMBER 2026 QUARTERLY REPORT: Q3, SEP 2026 2 Comments from Chief Executive Officer and Managing Director, Barrie van der Merwe “While operational performance improved during the quarter, nothing is more important than ensuring our people return home safely every day. We continued to work through initiatives to improve both our TRIR and Severity Rate during the period. However, we recognise there is still more work to do. Through our leadership training program and continued focus on critical controls, risk management and frontline engagement, we remain committed to building a stronger safety culture across the Group. I am pleased with the progress we are making with the Curragh reset program. We are seeing benefits in cost and margin starting to flow through to the bottom line. The open cut operations at Curragh performed particularly well and we are expecting further improvement in Mammoth and plant performance over the coming months. Inventory levels, both at Curragh and at port, are at healthier levels now. This supports overall system stability and allows us to realise higher margin on our products, as and when the plants can wash it in the most optimal manner – especially with stronger index pricing that is still to flow through in the next two quarters. While challenging roof conditions at Buchanan impacted the September quarter, we have learned much from the event and are better placed to deal with this if it occurs again. Buchanan remains a high-quality long-life asset that generates a good return through the price cycle. The Company has revised its 2026 guidance to reflect the recent Buchanan geological issues, the slower Mammoth ramp-up and slower than expected improvement in CHPP throughput. Consistent with our reset program, we have prioritised margin over volume and have built ROM stockpiles that will be carried into 2027 to produce higher-value products. While there is much work to do in order to deleverage the balance sheet, we are starting to position Coronado to be ready to maximise its benefit from rising prices and I would like to thank all our teams for their continued support and hard work.” OPERATIONS AND SALES Quarterly Segment Production, Sales volumes, and Realised pricing Summary Information (unaudited) Sep Q26 Jun Q26 Change Sep 2026 YTD Sep 2025 YTD Change ROM production Mt 6.0 6.4 -6.7% 17.8 20.3 -12.2% Australia Mt 4.2 3.9 7.9% 10.3 9.6 7.1% USA Mt 1.8 2.6 -28.7% 7.6 10.7 -29.4% Saleable production Mt 3.4 4.1 -17.3% 10.5 11.7 -10.1% Australia Mt 2.7 3.0 -11.1% 7.4 7.5 -2.4% USA Mt 0.7 1.1 -33.7% 3.1 4.1 -24.1% % Met Coal % 81.4% 78.2% 3.2% 80.8% 77.8% 3.0% Sales volumes Mt 3.6 3.5 2.3% 10.5 11.1 -5.3% Australia Mt 2.7 2.4 16.1% 7.3 7.2 0.5% USA Mt 0.8 1.1 -26.5% 3.3 3.9 -16.0% Sales mix Met Coal % 77.8% 80.4% -2.6% 76.6% 77.0% -0.4% Thermal Coal % 22.2% 19.6% 2.6% 23.4% 23.0% 0.4% Export Sales % 81.2% 77.4% 3.8% 77.7% 70.2% 7.5% Domestic Sales % 18.8% 22.6% -3.8% 22.3% 29.8% -7.5% Avg Mining Cash Cost/t Produced US$/t 112.8 97.9 15.2% 113.3 94.9 19.4% Australia US$/t 104.4 98.9 5.6% 112.5 87.3 28.9% USA US$/t 142.4 95.0 49.8% 115.2 108.8 5.8% Realised pricing ($/t) AU- Realised Met Price (FOB) US$/t 186.3 171.8 8.4% 175.0 148.4 17.9% PLV HCC FOB AUS Index Price US$/t 248.1 238.3 4.1% 240.5 184.2 30.5% % of PLV HCC FOB AUS Index % 75.1% 72.1% 3.0% 72.8% 80.5% -7.7% US - Realised Met Price (FOR) US$/t 177.0 168.4 5.1% 170.8 150.8 13.3% % of PLV HCC FOB AUS Index % 71.3% 70.7% 0.6% 71.0% 81.8% -10.8% Group - Realised Met Price (combined FOB/FOR) US$/t 183.5 170.5 7.6% 173.4 149.4 16.1% % of PLV HCC FOB AUS Index % 74.0% 71.6% 2.4% 72.1% 81.1% -9.0% |
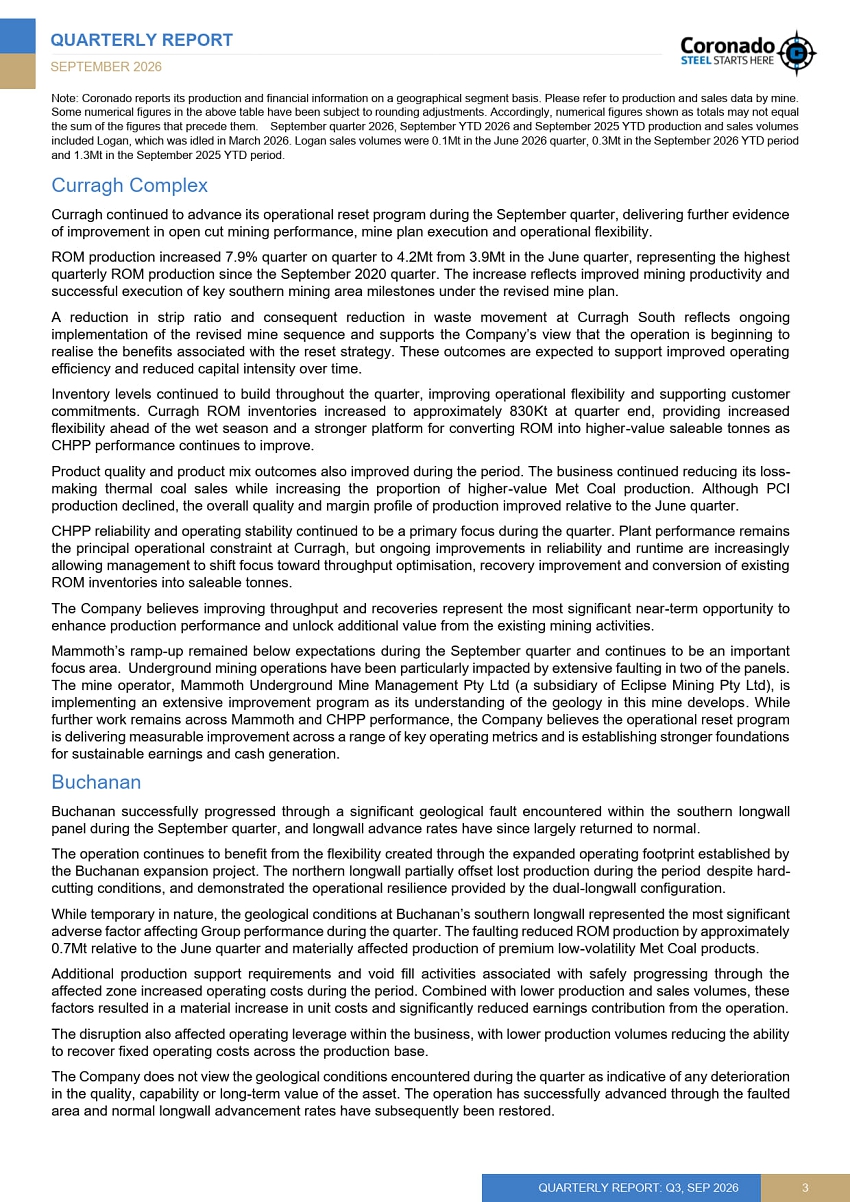
| QUARTERLY REPORT SEPTEMBER 2026 QUARTERLY REPORT: Q3, SEP 2026 3 Note: Coronado reports its production and financial information on a geographical segment basis. Please refer to production and sales data by mine. Some numerical figures in the above table have been subject to rounding adjustments. Accordingly, numerical figures shown as totals may not equal the sum of the figures that precede them. September quarter 2026, September YTD 2026 and September 2025 YTD production and sales volumes included Logan, which was idled in March 2026. Logan sales volumes were 0.1Mt in the June 2026 quarter, 0.3Mt in the September 2026 YTD period and 1.3Mt in the September 2025 YTD period. Curragh Complex Curragh continued to advance its operational reset program during the September quarter, delivering further evidence of improvement in open cut mining performance, mine plan execution and operational flexibility. ROM production increased 7.9% quarter on quarter to 4.2Mt from 3.9Mt in the June quarter, representing the highest quarterly ROM production since the September 2020 quarter. The increase reflects improved mining productivity and successful execution of key southern mining area milestones under the revised mine plan. A reduction in strip ratio and consequent reduction in waste movement at Curragh South reflects ongoing implementation of the revised mine sequence and supports the Company’s view that the operation is beginning to realize the benefits associated with the reset strategy. These outcomes are expected to support improved operating efficiency and reduced capital intensity over time. Inventory levels continued to build throughout the quarter, improving operational flexibility and supporting customer commitments. Curragh ROM inventories increased to approximately 830Kt at quarter end, providing increased flexibility ahead of the wet season and a stronger platform for converting ROM into higher-value saleable tonnes as CHPP performance continues to improve. Product quality and product mix outcomes also improved during the period. The business continued reducing its loss-making thermal coal sales while increasing the proportion of higher-value Met Coal production. Although PCI production declined, the overall quality and margin profile of production improved relative to the June quarter. CHPP reliability and operating stability continued to be a primary focus during the quarter. Plant performance remains the principal operational constraint at Curragh, but ongoing improvements in reliability and runtime are increasingly allowing management to shift focus toward throughput optimisation, recovery improvement and conversion of existing ROM inventories into saleable tonnes. The Company believes improving throughput and recoveries represent the most significant near-term opportunity to enhance production performance and unlock additional value from the existing mining activities. Mammoth’s ramp-up remained below expectations during the September quarter and continues to be an important focus area. Underground mining operations have been particularly impacted by extensive faulting in two of the panels. The mine operator, Mammoth Underground Mine Management Pty Ltd (a subsidiary of Eclipse Mining Pty Ltd), is implementing an extensive improvement program as its understanding of the geology in this mine develops. While further work remains across Mammoth and CHPP performance, the Company believes the operational reset program is delivering measurable improvement across a range of key operating metrics and is establishing stronger foundations for sustainable earnings and cash generation. Buchanan Buchanan successfully progressed through a significant geological fault encountered within the southern longwall panel during the September quarter, and longwall advance rates have since largely returned to normal. The operation continues to benefit from the flexibility created through the expanded operating footprint established by the Buchanan expansion project. The northern longwall partially offset lost production during the period despite hard-cutting conditions, and demonstrated the operational resilience provided by the dual-longwall configuration. While temporary in nature, the geological conditions at Buchanan’s southern longwall represented the most significant adverse factor affecting Group performance during the quarter. The faulting reduced ROM production by approximately 0.7Mt relative to the June quarter and materially affected production of premium low-volatility Met Coal products. Additional production support requirements and void fill activities associated with safely progressing through the affected zone increased operating costs during the period. Combined with lower production and sales volumes, these factors resulted in a material increase in unit costs and significantly reduced earnings contribution from the operation. The disruption also affected operating leverage within the business, with lower production volumes reducing the ability to recover fixed operating costs across the production base. The Company does not view the geological conditions encountered during the quarter as indicative of any deterioration in the quality, capability or long-term value of the asset. The operation has successfully advanced through the faulted area and normal longwall advancement rates have subsequently been restored. |
| QUARTERLY REPORT SEPTEMBER 2026 QUARTERLY REPORT: Q3, SEP 2026 4 With normal mining conditions re-established, the Company believes Buchanan is well positioned to return toward expanding production and higher earnings moving forward, noting that the planned longwall move in November is expected to affect December quarter production. Safety and Health As at 30 September 2026, the Group TRIR was 1.42, up 6% from 1.34 for the June quarter of 2026. The Company will continue to prioritise safety as its most important responsibility and remains committed to delivering long-term improvements that create a safer workplace for all employees and contractors. During the quarter, the Company continued the implementation of its leadership training program across all operations. The program is aimed at strengthening visible safety leadership, enhancing critical risk management practices and reinforcing frontline engagement to ensure safety standards are consistently understood, applied and maintained across the business. The program brings together leaders from all levels of the organisation and is designed to reinforce accountability, improve hazard identification and intervention capabilities and enhance the quality of safety interactions in the field. Through regular site engagements, leadership observations and workforce participation, the Company is seeking to further embed a proactive safety culture that encourages shared ownership of safety outcomes and improvement. The leadership program is supported by a range of ongoing initiatives, including critical control verification activities, targeted training programs, field leadership interactions and focused reviews of key operational risks. Together, these measures are intended to strengthen risk management, improve safety performance and support the Company's objective of preventing serious injuries and fatalities across all operations. Sales Group Sales volumes of 3.6Mt in the September quarter were 2% higher than the June quarter despite lower production, due to the drawdown of inventory built in prior periods. Sales volumes were constrained by port congestion (Curragh experienced 10–14 day loading delays alone), with approximately 630Kt of coal held at port awaiting shipment at quarter end across the Group. The delayed vessels represented approximately US$50M of revenue that is expected to be realised in the December quarter, with most vessels already having sailed in October. The Company has also seen some improvement in port congestion conditions since quarter end. The Group maintained a favourable sales mix during the period, with Met Coal continuing to represent the majority of sales volumes. Stronger realised pricing outcomes, supported by higher benchmark PLV HCC pricing, contributed positively to earnings performance during the quarter. Group realised Met Coal pricing increased to US$183.5/t, up from US$170.5/t in the June quarter, with an average Australian realised Met Coal price of US$186.3/t and an average U.S. realised Met Coal price of US$177.0/t. Australian realised Met Coal pricing improved to 75.1% of the PLV HCC FOB Australia benchmark, up from 72.1% in the June quarter, reflecting continued improvements in product mix, marketing initiatives and commercial execution. Benchmark PLV HCC FOB Australia pricing averaged approximately US$248.1/t during the quarter, an increase of 4.1% from the June quarter, providing strong support for Realised pricing and earnings across the Group. Inventory levels improved throughout the period, providing greater operational flexibility and partially offsetting the impact of lower saleable production. This allowed the Group to continue servicing customers while rebuilding operating momentum across both Curragh and Buchanan. METALLURGICAL COAL MARKETS The Met Coal market remained supportive during the September quarter due to ongoing supply constraints in China, resilient steel demand across key growth markets and continued discipline across global seaborne supply. Chinese domestic coal production remained below normal levels throughout the quarter as safety inspections and operational restrictions continued to limit output from a number of mines. These supply constraints helped support seaborne import demand despite weaker profitability across China's steel sector. Chinese steel production conditions remained mixed during the quarter. While seasonal steel demand improved ahead of national holidays and supported shipments, steel margins remained under pressure and a large proportion of steel |
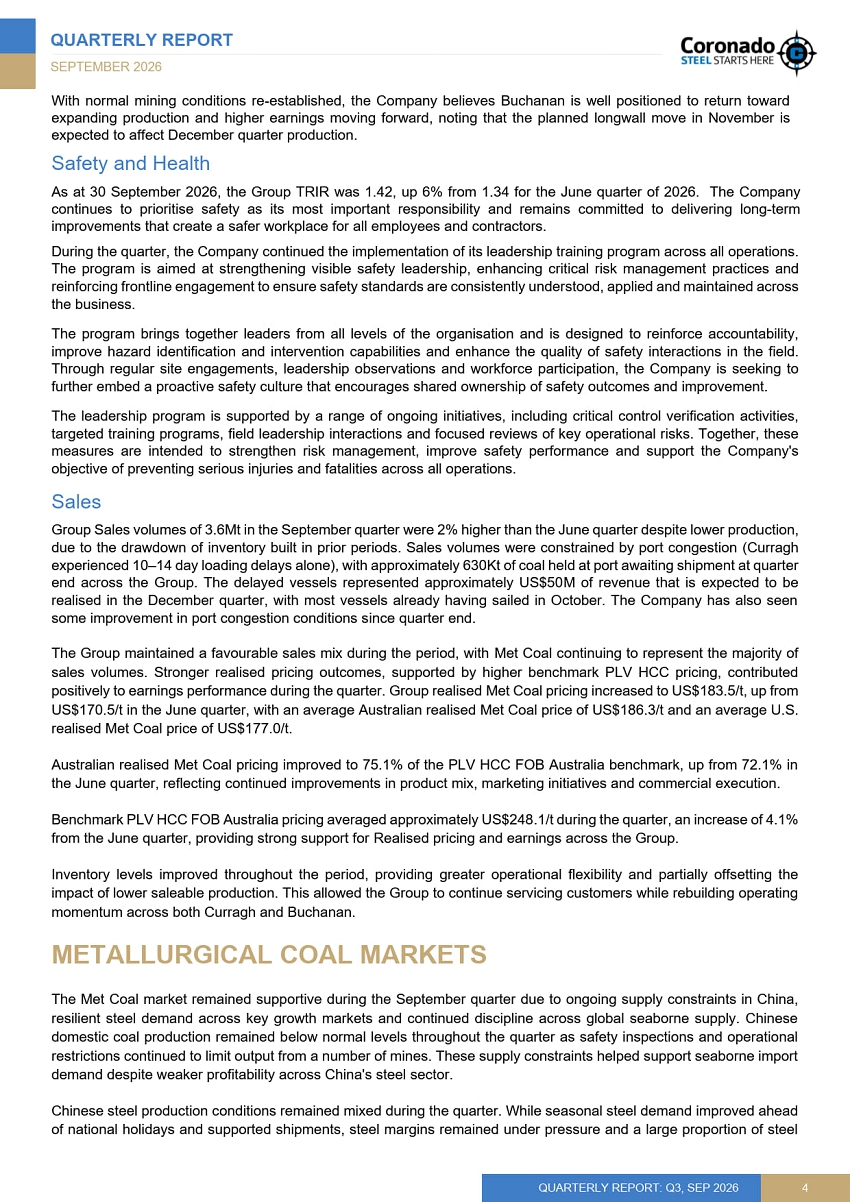
| QUARTERLY REPORT SEPTEMBER 2026 QUARTERLY REPORT: Q3, SEP 2026 5 mills continued to operate at limited profitability. Hot metal production softened modestly during the period as some blast furnaces reduced operating rates or entered maintenance programs. Outside China, demand conditions remained more supportive. India's steel market continued to demonstrate resilience, supported by infrastructure activity, automotive demand and expectations of stronger post-monsoon steel consumption. While buyers remained cautious in response to elevated Met Coal prices, improving steel market conditions are expected to support a gradual recovery in import demand following the monsoon season. On the supply side, global market conditions remained relatively balanced. Australian Met Coal production and exports continued to recover during the quarter, supported by favourable operating conditions and improved performance across several operations. At the same time, disruptions affecting Russian logistics and ongoing challenges in parts of North America continued to limit supply growth from certain exporting regions. Market sentiment softened towards the end of the quarter as expectations of gradual Chinese mine restarts, recovering Mongolian supply and weaker steel margins moderated demand expectations. Nevertheless, seaborne Met Coal markets continued to benefit from constrained supply growth, supportive demand across major steel-producing economies and the strategic importance of high-quality metallurgical coal in blast furnace steel production. FINANCIAL PERFORMANCE Financial performance strengthened during the September quarter, resulting in significantly higher earnings compared to the prior quarter, driven by higher realised pricing, lower total mining costs at Curragh, an improved production mix and the build of unsold coal into inventory. Coal revenues increased to approximately $558M during the quarter (June 2026 quarter: $506M) while Group Realised pricing increased to US$183.5/t, benefiting from stronger benchmark pricing and continued commercial optimisation initiatives. Available liquidity increased by $57M to $155M at 30 September 2026, mainly supported by the Glencore prepayment financing arrangement. Cash flow during the quarter was affected by timing items, principally customer receipts moved into October by port congestion, the build of ROM and port inventories, and the senior secured notes interest and insurance payments, together with the impact of geological conditions on Buchanan production, partly offset by supplier payment deferrals that are expected to reverse in the December quarter. Adjusting for these items, and excluding the prepayment arrangements, the underlying business was broadly cash neutral for the quarter, supported by the significant improvement in earnings, stronger pricing and lower mining cash costs at Curragh. Net debt was $553M at 30 September 2026 (compared to $606M at 30 June 2026). Inventory build represented a significant use of cash during the quarter. The Curragh ROM build was partly deliberate, to prepare for the wet season and to support plant feed continuity and customer commitments, and partly the result of CHPP constraints and port congestion. These inventories are expected to convert to sales and cash progressively as plant performance and port conditions improve. The largest adverse impact on earnings and cash flow was the geological conditions encountered at Buchanan's southern longwall panel. The temporary reduction in production volumes, lost Met Coal tonnes and additional operating activities required to manage the faulted zone materially impacted profitability during the period. Improvements across Curragh open cut performance, product mix optimisation, inventory positioning and operational efficiency initiatives provide support for the Company’s view that the underlying cash-generating capability of the business is improving. Completion of the Logan divestment in July 2026 further simplified the portfolio and removed a loss-making operation from the Group. The Company remains focused on converting improving operational performance, stronger inventory levels, better product mix outcomes and increasing production consistency into sustainable free cash flow generation. |
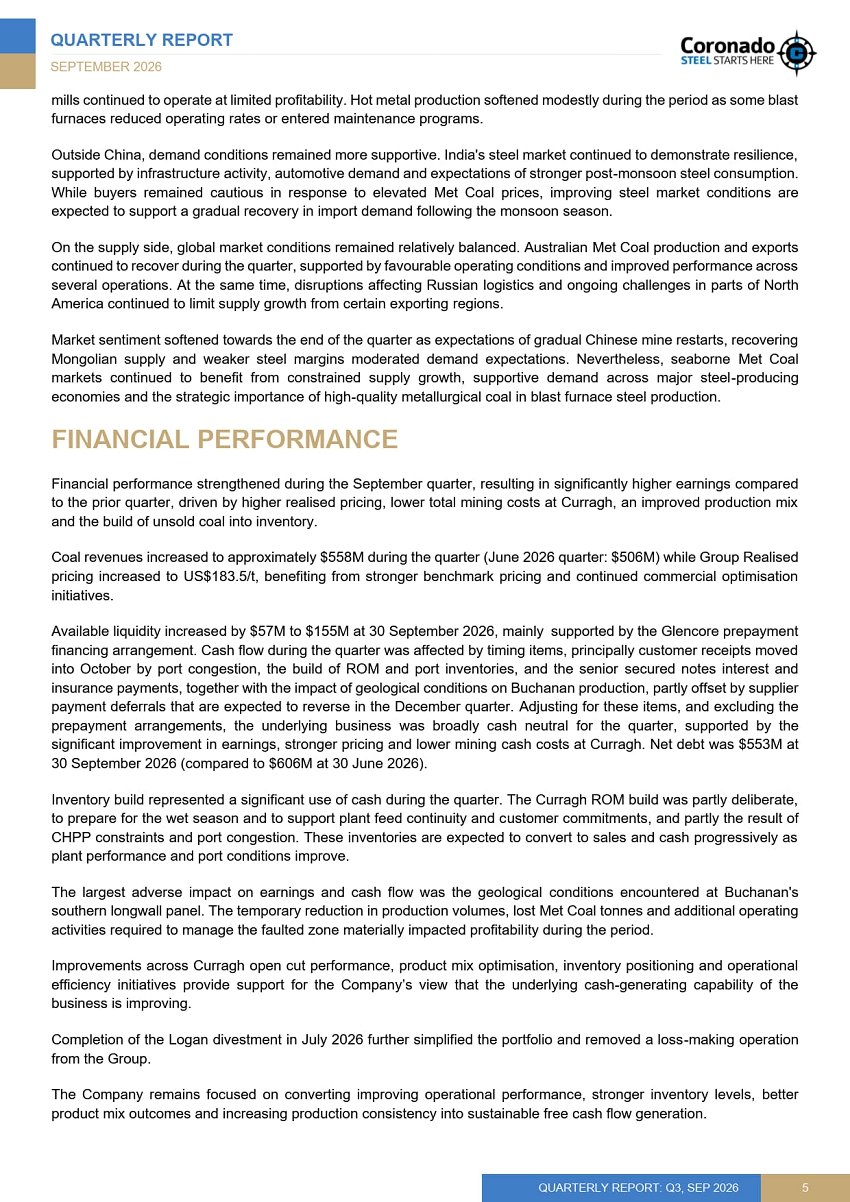
| QUARTERLY REPORT SEPTEMBER 2026 QUARTERLY REPORT: Q3, SEP 2026 6 Outlook and Guidance During the quarter, the Company completed a detailed review of operating performance, production expectations and the timing associated with key operational improvement initiatives across the Group. While meaningful progress has been achieved through the Curragh operational reset program, improved inventory positioning, advancement of the Southern open cut mining operations and a range of productivity and cost improvement initiatives, the timing of expected improvements in CHPP performance has been slower than originally anticipated, and production was affected by geological conditions at Buchanan and the slower Mammoth ramp-up. As a result, the Company now expects full year Saleable production of 14.0Mt to 14.5Mt. The revision reflects lost production at Buchanan arising from the south longwall geological conditions, the slower Mammoth ramp-up and slower than expected improvement in Curragh CHPP throughput. Consistent with the reset program's focus on margin over volume and on building inventory buffers to stabilise the production system, the Company has chosen not to bypass ROM coal as low-value thermal product, which could have increased reported volumes. Curragh expects to end the year with approximately 1.5Mt of ROM coal on stockpiles, equivalent to approximately 1.1Mt of Saleable production at a 75% yield, which we expect will be processed into higher-value products in 2027. Once normalised for the Buchanan performance this quarter and slower than expected Mammoth ramp-up, it is expected that the Company’s 2027 guidance will reflect 16Mt to 17Mt Saleable production, which is equivalent to the Company’s original 2026 guidance. The lower denominator ($5/t) and the impact of a stronger AUD and higher diesel prices, which has added more than $100M to costs ($7/t), is expected to result in annualized Average mining cash costs per tonne produced ($/t) of between $105 to $110/t. Accordingly, the Company’s revised 2026 guidance is as follows: Original 2026 Guidance Revised 2026 Guidance Saleable Production (Mt) 16-17 14.0-14.5 Average mining cash costs per tonne produced 88-96 105-110 Capital Expenditure ($M) 150-175 No Change These revisions do not reflect a deterioration in the underlying quality or capability of the Company's operating assets. ROM production, inventory levels and mine plan execution have continued to improve during the year, while progress achieved through the operational reset program has strengthened the platform for longer-term performance improvement. The Company's focus remains on maximising value and cash generation through improved recoveries, product quality, operational discipline and margin performance rather than solely pursuing production volumes. The benefits of current operational initiatives will become increasingly evident as expected CHPP performance improvements materialise and existing ROM inventories are converted into higher-value Saleable production. Coronado expects to release its unaudited financial statements for the quarter ended 30 September 2026 (SEC Form 10-Q) to the market on 10 November 2026 (AEST). Coronado quotes all numbers in U.S. dollars. This Quarterly Report was authorised for release by the Board of Coronado Global Resources Inc. Contacts Coronado Global Resources Inc. ARBN: 628 199 468 Registered Office: Level 33, Central Plaza One, 345 Queen Street, Brisbane QLD 4000 Australia. T: +61 7 3031 7777 | E: investors@coronadoglobal.com | www.coronadoglobal.com Investors Media Chantelle Essa Helen McCombie Vice President Investor Relations Sodali & Co T: +61 477 949 261 T: +61 411 756 248 E: cessa@coronadoglobal.com E: helen.mccombie@sodali.com |
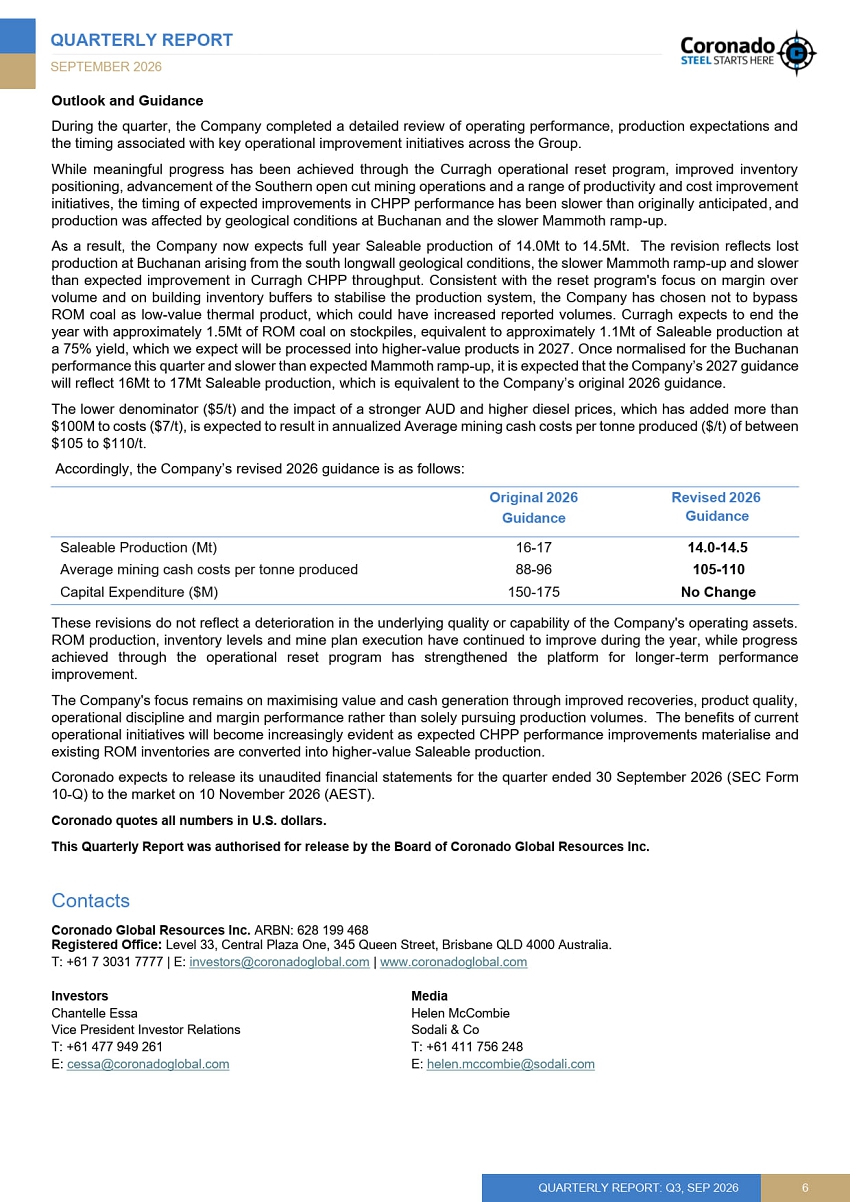
| QUARTERLY REPORT SEPTEMBER 2026 QUARTERLY REPORT: Q3, SEP 2026 7 APPENDIX Quarterly Production and Sales Volumes by Mine Summary Information (unaudited) Sep Q26 Jun Q26 Change Sep 2026 YTD Sep 2025 YTD Change ROM production Mt 6.0 6.4 -6.7% 17.8 20.3 -12.2% Curragh Mt 4.2 3.9 7.9% 10.3 9.6 7.1% Buchanan Mt 1.8 2.5 -26.9% 6.5 5.9 10.5% Logan Mt 0.0 0.0 -% 1.0 4.8 -78.3% Saleable production Mt 3.4 4.1 -17.3% 10.5 11.7 -10.1% Curragh Mt 2.7 3.0 -11.1% 7.4 7.5 -2.4% Buchanan Mt 0.8 1.1 -28.8% 2.9 2.7 5.7% Logan Mt 0.0 0.0 -% 0.3 1.4 -81.7% Sales volumes Mt 3.6 3.5 2.3% 10.5 11.1 -5.3% Curragh Mt 2.7 2.4 16.1% 7.3 7.2 0.5% Buchanan Mt 0.8 1.0 -16.8% 3.0 2.6 16.0% Logan Mt 0.0 0.1 -100.0% 0.3 1.3 -77.1% Some numerical figures in the above table have been subject to rounding adjustments. Accordingly, numerical figures shown as totals may not equal the sum of the figures that follow them. CAUTIONARY NOTICE REGARDING FORWARD-LOOKING STATEMENTS This report contains forward-looking statements concerning our business, operations, financial performance and condition, the coal, steel and other industries, and our plans, objectives and expectations for our business, operations, financial performance and condition. Forward-looking statements may be identified by words such as "may", "could", "believes", "estimates", "expects", "intends", “plans”, "considers", “forecasts”, “anticipates”, “targets” and other similar words that involve risk and uncertainties. Forward-looking statements provide management's current expectations or predictions of future conditions, events or results. All statements that address operating performance, events or developments that we expect or anticipate will occur in the future are forward-looking statements. They may include estimates of revenues, income, earnings per share, cost savings, capital expenditures, dividend payments, share repurchases, liquidity, capital structure, market share, industry volume, or other financial items, descriptions of management’s plans or objectives for future operations, plans with respect to certain assets, risk inherent to mining operations, such as adverse weather conditions, inflationary conditions, geopolitical conflicts or tensions, or descriptions or assumptions underlying any of the above. All forward-looking statements speak only as of the date they are made and reflect the Company's good faith beliefs, assumptions and expectations, but they are not a guarantee of future performance or events. Furthermore, the Company disclaims any obligation to publicly update or revise any forward-looking statement, except as required by law. By their nature, forward-looking statements are subject to risks and uncertainties that could cause actual results to differ materially from those suggested by the forward-looking statements. Factors that might cause such differences include, but are not limited to, a variety of economic, competitive and regulatory factors, many of which are beyond the Company's control, that are described in our Annual Report on Form 10-K for the year ended 31 December 2025 filed with the ASX on 04 March 2026 (filed with the SEC 03 March 2026) as well as additional factors we may describe from time to time in other filings with the ASX and SEC. You may get such filings for free at our website at www.coronadoglobal.com. It is not possible to predict or identify all such factors and, consequently, you should not consider any such list to be a complete set of all potential risks or uncertainties. |
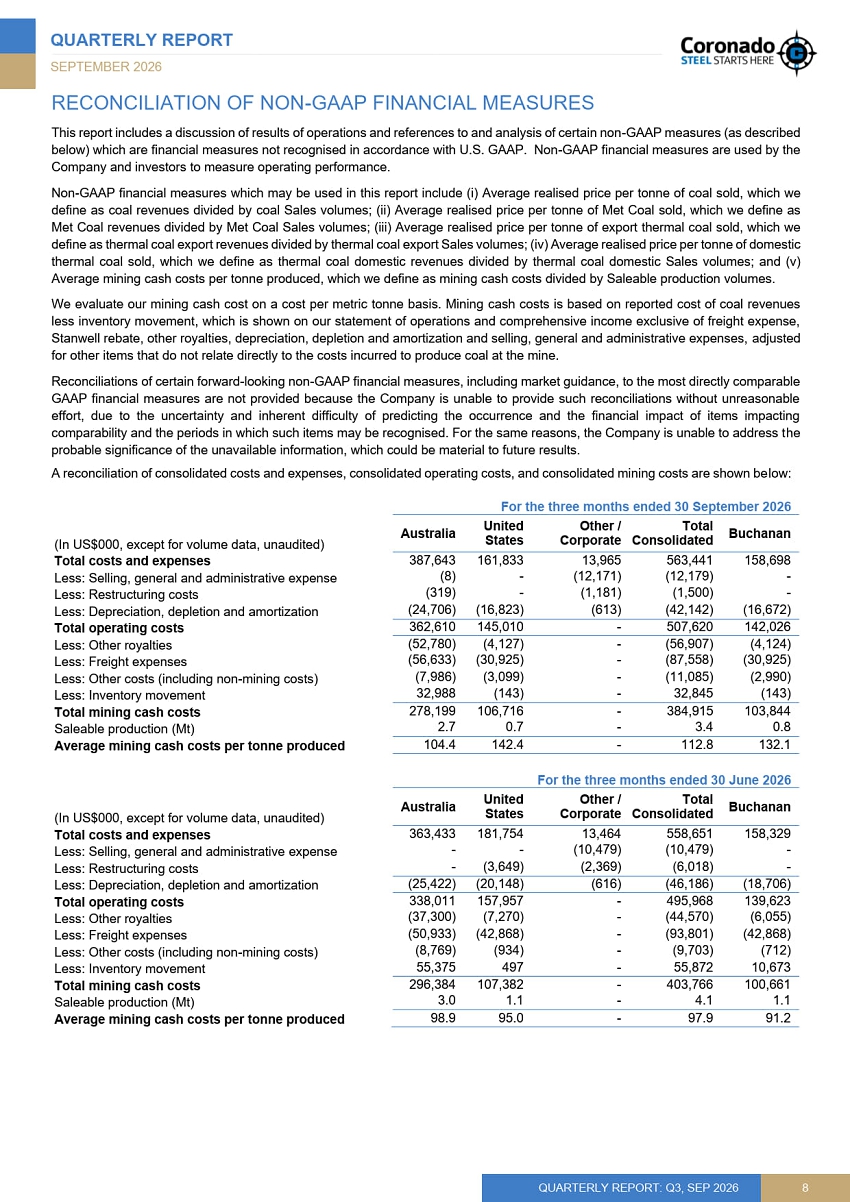
| QUARTERLY REPORT SEPTEMBER 2026 QUARTERLY REPORT: Q3, SEP 2026 8 RECONCILIATION OF NON-GAAP FINANCIAL MEASURES This report includes a discussion of results of operations and references to and analysis of certain non-GAAP measures (as described below) which are financial measures not recognised in accordance with U.S. GAAP. Non-GAAP financial measures are used by the Company and investors to measure operating performance. Non-GAAP financial measures which may be used in this report include (i) Average realised price per tonne of coal sold, which we define as coal revenues divided by coal Sales volumes; (ii) Average realised price per tonne of Met Coal sold, which we define as Met Coal revenues divided by Met Coal Sales volumes; (iii) Average realised price per tonne of export thermal coal sold, which we define as thermal coal export revenues divided by thermal coal export Sales volumes; (iv) Average realised price per tonne of domestic thermal coal sold, which we define as thermal coal domestic revenues divided by thermal coal domestic Sales volumes; and (v) Average mining cash costs per tonne produced, which we define as mining cash costs divided by Saleable production volumes. We evaluate our mining cash cost on a cost per metric tonne basis. Mining cash costs is based on reported cost of coal revenues less inventory movement, which is shown on our statement of operations and comprehensive income exclusive of freight expense, Stanwell rebate, other royalties, depreciation, depletion and amortization and selling, general and administrative expenses, adjusted for other items that do not relate directly to the costs incurred to produce coal at the mine. Reconciliations of certain forward-looking non-GAAP financial measures, including market guidance, to the most directly comparable GAAP financial measures are not provided because the Company is unable to provide such reconciliations without unreasonable effort, due to the uncertainty and inherent difficulty of predicting the occurrence and the financial impact of items impacting comparability and the periods in which such items may be recognised. For the same reasons, the Company is unable to address the probable significance of the unavailable information, which could be material to future results. A reconciliation of consolidated costs and expenses, consolidated operating costs, and consolidated mining costs are shown below: For the three months ended 30 September 2026 (In US$000, except for volume data, unaudited) Australia United States Other / Corporate Total Consolidated Buchanan Total costs and expenses 387,643 161,833 13,965 563,441 158,698 Less: Selling, general and administrative expense (8) - (12,171) (12,179) - Less: Restructuring costs (319) - (1,181) (1,500) - Less: Depreciation, depletion and amortization (24,706) (16,823) (613) (42,142) (16,672) Total operating costs 362,610 145,010 - 507,620 142,026 Less: Other royalties (52,780) (4,127) - (56,907) (4,124) Less: Freight expenses (56,633) (30,925) - (87,558) (30,925) Less: Other costs (including non-mining costs) (7,986) (3,099) - (11,085) (2,990) Less: Inventory movement 32,988 (143) - 32,845 (143) Total mining cash costs 278,199 106,716 - 384,915 103,844 Saleable production (Mt) 2.7 0.7 - 3.4 0.8 Average mining cash costs per tonne produced 104.4 142.4 - 112.8 132.1 For the three months ended 30 June 2026 (In US$000, except for volume data, unaudited) Australia United States Other / Corporate Total Consolidated Buchanan Total costs and expenses 363,433 181,754 13,464 558,651 158,329 Less: Selling, general and administrative expense - - (10,479) (10,479) - Less: Restructuring costs - (3,649) (2,369) (6,018) - Less: Depreciation, depletion and amortization (25,422) (20,148) (616) (46,186) (18,706) Total operating costs 338,011 157,957 - 495,968 139,623 Less: Other royalties (37,300) (7,270) - (44,570) (6,055) Less: Freight expenses (50,933) (42,868) - (93,801) (42,868) Less: Other costs (including non-mining costs) (8,769) (934) - (9,703) (712) Less: Inventory movement 55,375 497 - 55,872 10,673 Total mining cash costs 296,384 107,382 - 403,766 100,661 Saleable production (Mt) 3.0 1.1 - 4.1 1.1 Average mining cash costs per tonne produced 98.9 95.0 - 97.9 91.2 |
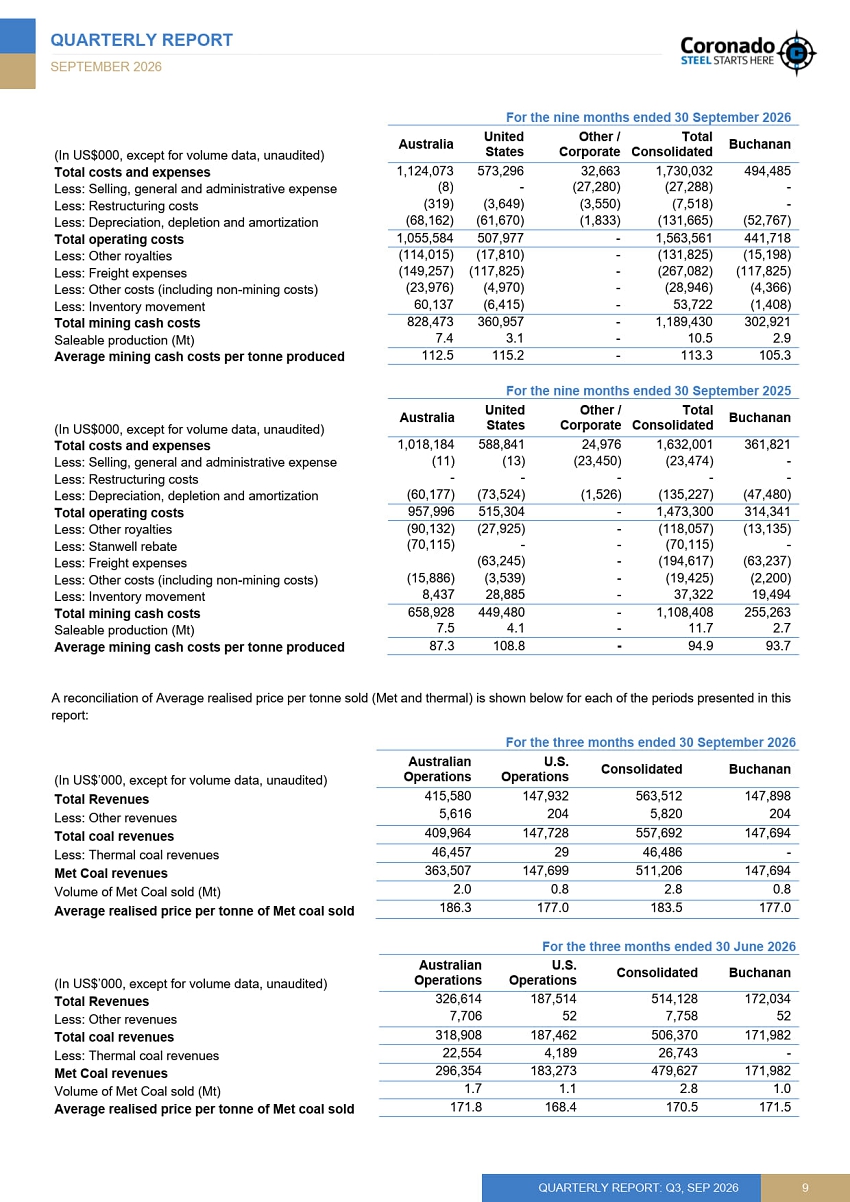
| QUARTERLY REPORT SEPTEMBER 2026 QUARTERLY REPORT: Q3, SEP 2026 9 For the nine months ended 30 September 2026 (In US$000, except for volume data, unaudited) Australia United States Other / Corporate Total Consolidated Buchanan Total costs and expenses 1,124,073 573,296 32,663 1,730,032 494,485 Less: Selling, general and administrative expense (8) - (27,280) (27,288) - Less: Restructuring costs (319) (3,649) (3,550) (7,518) - Less: Depreciation, depletion and amortization (68,162) (61,670) (1,833) (131,665) (52,767) Total operating costs 1,055,584 507,977 - 1,563,561 441,718 Less: Other royalties (114,015) (17,810) - (131,825) (15,198) Less: Freight expenses (149,257) (117,825) - (267,082) (117,825) Less: Other costs (including non-mining costs) (23,976) (4,970) - (28,946) (4,366) Less: Inventory movement 60,137 (6,415) - 53,722 (1,408) Total mining cash costs 828,473 360,957 - 1,189,430 302,921 Saleable production (Mt) 7.4 3.1 - 10.5 2.9 Average mining cash costs per tonne produced 112.5 115.2 - 113.3 105.3 For the nine months ended 30 September 2025 (In US$000, except for volume data, unaudited) Australia United States Other / Corporate Total Consolidated Buchanan Total costs and expenses 1,018,184 588,841 24,976 1,632,001 361,821 Less: Selling, general and administrative expense (11) (13) (23,450) (23,474) - Less: Restructuring costs - - - - - Less: Depreciation, depletion and amortization (60,177) (73,524) (1,526) (135,227) (47,480) Total operating costs 957,996 515,304 - 1,473,300 314,341 Less: Other royalties (90,132) (27,925) - (118,057) (13,135) Less: Stanwell rebate (70,115) - - (70,115) - Less: Freight expenses (131,372) (63,245) - (194,617) (63,237) Less: Other costs (including non-mining costs) (15,886) (3,539) - (19,425) (2,200) Less: Inventory movement 8,437 28,885 - 37,322 19,494 Total mining cash costs 658,928 449,480 - 1,108,408 255,263 Saleable production (Mt) 7.5 4.1 - 11.7 2.7 Average mining cash costs per tonne produced 87.3 108.8 - 94.9 93.7 A reconciliation of Average realised price per tonne sold (Met and thermal) is shown below for each of the periods presented in this report: For the three months ended 30 September 2026 (In US$’000, except for volume data, unaudited) Australian Operations U.S. Operations Consolidated Buchanan Total Revenues 415,580 147,932 563,512 147,898 Less: Other revenues 5,616 204 5,820 204 Total coal revenues 409,964 147,728 557,692 147,694 Less: Thermal coal revenues 46,457 29 46,486 - Met Coal revenues 363,507 147,699 511,206 147,694 Volume of Met Coal sold (Mt) 2.0 0.8 2.8 0.8 Average realised price per tonne of Met coal sold 186.3 177.0 183.5 177.0 For the three months ended 30 June 2026 (In US$’000, except for volume data, unaudited) Australian Operations U.S. Operations Consolidated Buchanan Total Revenues 326,614 187,514 514,128 172,034 Less: Other revenues 7,706 52 7,758 52 Total coal revenues 318,908 187,462 506,370 171,982 Less: Thermal coal revenues 22,554 4,189 26,743 - Met Coal revenues 296,354 183,273 479,627 171,982 Volume of Met Coal sold (Mt) 1.7 1.1 2.8 1.0 Average realised price per tonne of Met coal sold 171.8 168.4 170.5 171.5 |
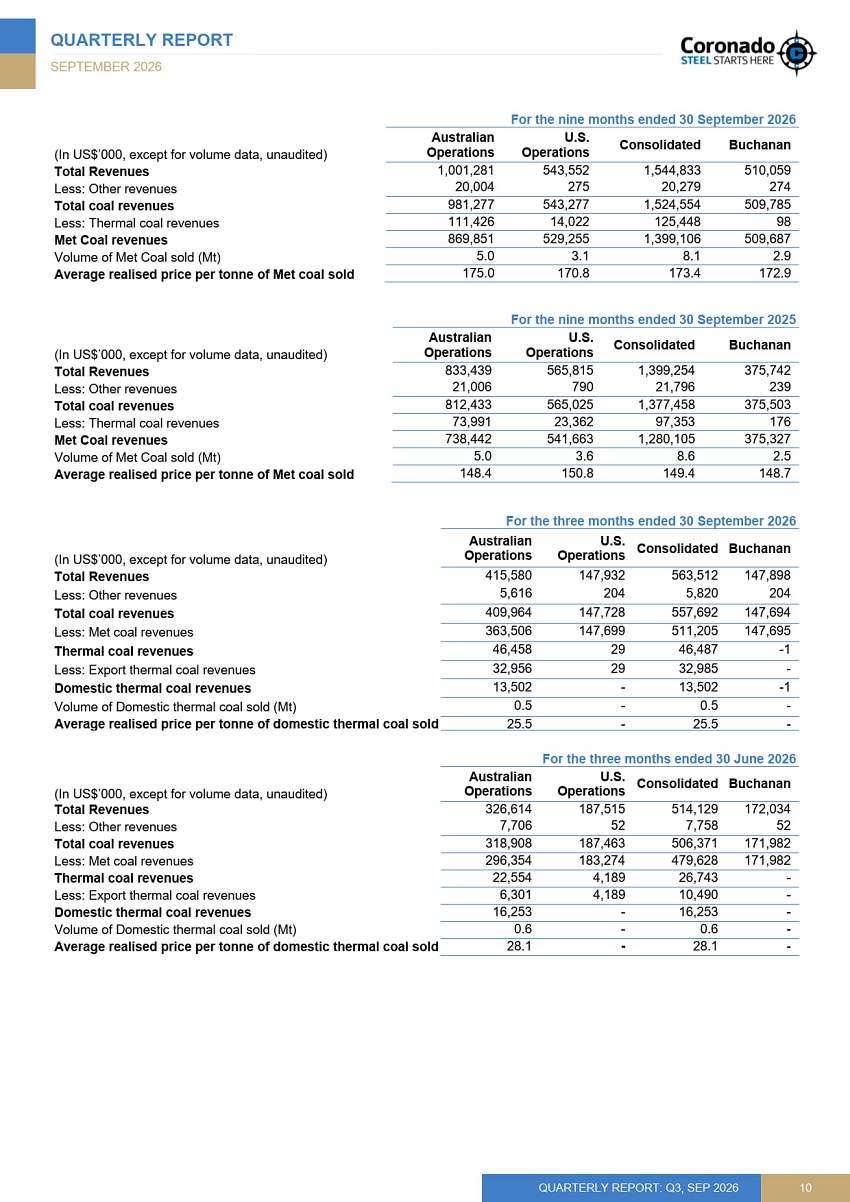
| QUARTERLY REPORT SEPTEMBER 2026 QUARTERLY REPORT: Q3, SEP 2026 10 For the nine months ended 30 September 2026 (In US$’000, except for volume data, unaudited) Australian Operations U.S. Operations Consolidated Buchanan Total Revenues 1,001,281 543,552 1,544,833 510,059 Less: Other revenues 20,004 275 20,279 274 Total coal revenues 981,277 543,277 1,524,554 509,785 Less: Thermal coal revenues 111,426 14,022 125,448 98 Met Coal revenues 869,851 529,255 1,399,106 509,687 Volume of Met Coal sold (Mt) 5.0 3.1 8.1 2.9 Average realised price per tonne of Met coal sold 175.0 170.8 173.4 172.9 For the nine months ended 30 September 2025 (In US$’000, except for volume data, unaudited) Australian Operations U.S. Operations Consolidated Buchanan Total Revenues 833,439 565,815 1,399,254 375,742 Less: Other revenues 21,006 790 21,796 239 Total coal revenues 812,433 565,025 1,377,458 375,503 Less: Thermal coal revenues 73,991 23,362 97,353 176 Met Coal revenues 738,442 541,663 1,280,105 375,327 Volume of Met Coal sold (Mt) 5.0 3.6 8.6 2.5 Average realised price per tonne of Met coal sold 148.4 150.8 149.4 148.7 For the three months ended 30 September 2026 (In US$’000, except for volume data, unaudited) Australian Operations U.S. Operations Consolidated Buchanan Total Revenues 415,580 147,932 563,512 147,898 Less: Other revenues 5,616 204 5,820 204 Total coal revenues 409,964 147,728 557,692 147,694 Less: Met coal revenues 363,506 147,699 511,205 147,695 Thermal coal revenues 46,458 29 46,487 -1 Less: Export thermal coal revenues 32,956 29 32,985 - Domestic thermal coal revenues 13,502 - 13,502 -1 Volume of Domestic thermal coal sold (Mt) 0.5 - 0.5 - Average realised price per tonne of domestic thermal coal sold 25.5 - 25.5 - For the three months ended 30 June 2026 (In US$’000, except for volume data, unaudited) Australian Operations U.S. Operations Consolidated Buchanan Total Revenues 326,614 187,515 514,129 172,034 Less: Other revenues 7,706 52 7,758 52 Total coal revenues 318,908 187,463 506,371 171,982 Less: Met coal revenues 296,354 183,274 479,628 171,982 Thermal coal revenues 22,554 4,189 26,743 - Less: Export thermal coal revenues 6,301 4,189 10,490 - Domestic thermal coal revenues 16,253 - 16,253 - Volume of Domestic thermal coal sold (Mt) 0.6 - 0.6 - Average realised price per tonne of domestic thermal coal sold 28.1 - 28.1 - |
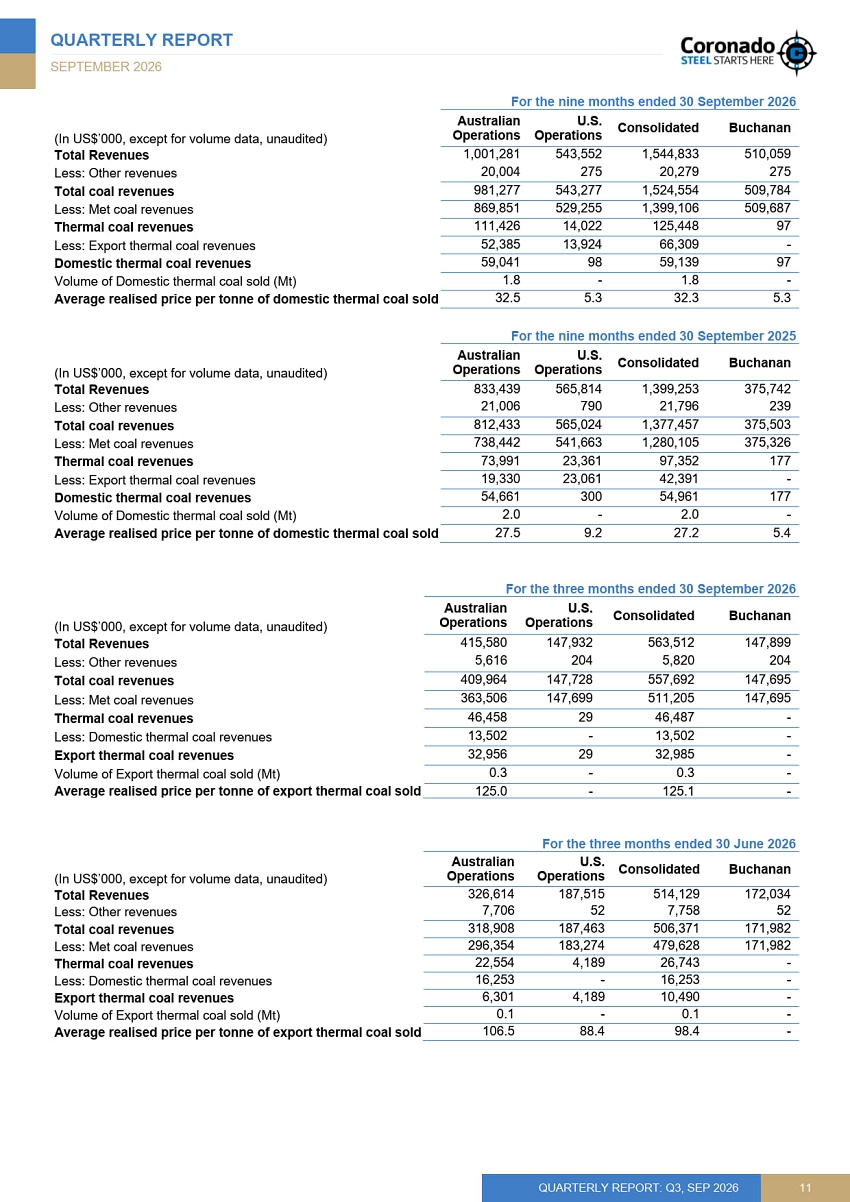
| QUARTERLY REPORT SEPTEMBER 2026 QUARTERLY REPORT: Q3, SEP 2026 11 For the nine months ended 30 September 2026 (In US$’000, except for volume data, unaudited) Australian Operations U.S. Operations Consolidated Buchanan Total Revenues 1,001,281 543,552 1,544,833 510,059 Less: Other revenues 20,004 275 20,279 275 Total coal revenues 981,277 543,277 1,524,554 509,784 Less: Met coal revenues 869,851 529,255 1,399,106 509,687 Thermal coal revenues 111,426 14,022 125,448 97 Less: Export thermal coal revenues 52,385 13,924 66,309 - Domestic thermal coal revenues 59,041 98 59,139 97 Volume of Domestic thermal coal sold (Mt) 1.8 - 1.8 - Average realised price per tonne of domestic thermal coal sold 32.5 5.3 32.3 5.3 For the nine months ended 30 September 2025 (In US$’000, except for volume data, unaudited) Australian Operations U.S. Operations Consolidated Buchanan Total Revenues 833,439 565,814 1,399,253 375,742 Less: Other revenues 21,006 790 21,796 239 Total coal revenues 812,433 565,024 1,377,457 375,503 Less: Met coal revenues 738,442 541,663 1,280,105 375,326 Thermal coal revenues 73,991 23,361 97,352 177 Less: Export thermal coal revenues 19,330 23,061 42,391 - Domestic thermal coal revenues 54,661 300 54,961 177 Volume of Domestic thermal coal sold (Mt) 2.0 - 2.0 - Average realised price per tonne of domestic thermal coal sold 27.5 9.2 27.2 5.4 For the three months ended 30 September 2026 (In US$’000, except for volume data, unaudited) Australian Operations U.S. Operations Consolidated Buchanan Total Revenues 415,580 147,932 563,512 147,899 Less: Other revenues 5,616 204 5,820 204 Total coal revenues 409,964 147,728 557,692 147,695 Less: Met coal revenues 363,506 147,699 511,205 147,695 Thermal coal revenues 46,458 29 46,487 - Less: Domestic thermal coal revenues 13,502 - 13,502 - Export thermal coal revenues 32,956 29 32,985 - Volume of Export thermal coal sold (Mt) 0.3 - 0.3 - Average realised price per tonne of export thermal coal sold 125.0 - 125.1 - For the three months ended 30 June 2026 (In US$’000, except for volume data, unaudited) Australian Operations U.S. Operations Consolidated Buchanan Total Revenues 326,614 187,515 514,129 172,034 Less: Other revenues 7,706 52 7,758 52 Total coal revenues 318,908 187,463 506,371 171,982 Less: Met coal revenues 296,354 183,274 479,628 171,982 Thermal coal revenues 22,554 4,189 26,743 - Less: Domestic thermal coal revenues 16,253 - 16,253 - Export thermal coal revenues 6,301 4,189 10,490 - Volume of Export thermal coal sold (Mt) 0.1 - 0.1 - Average realised price per tonne of export thermal coal sold 106.5 88.4 98.4 - |
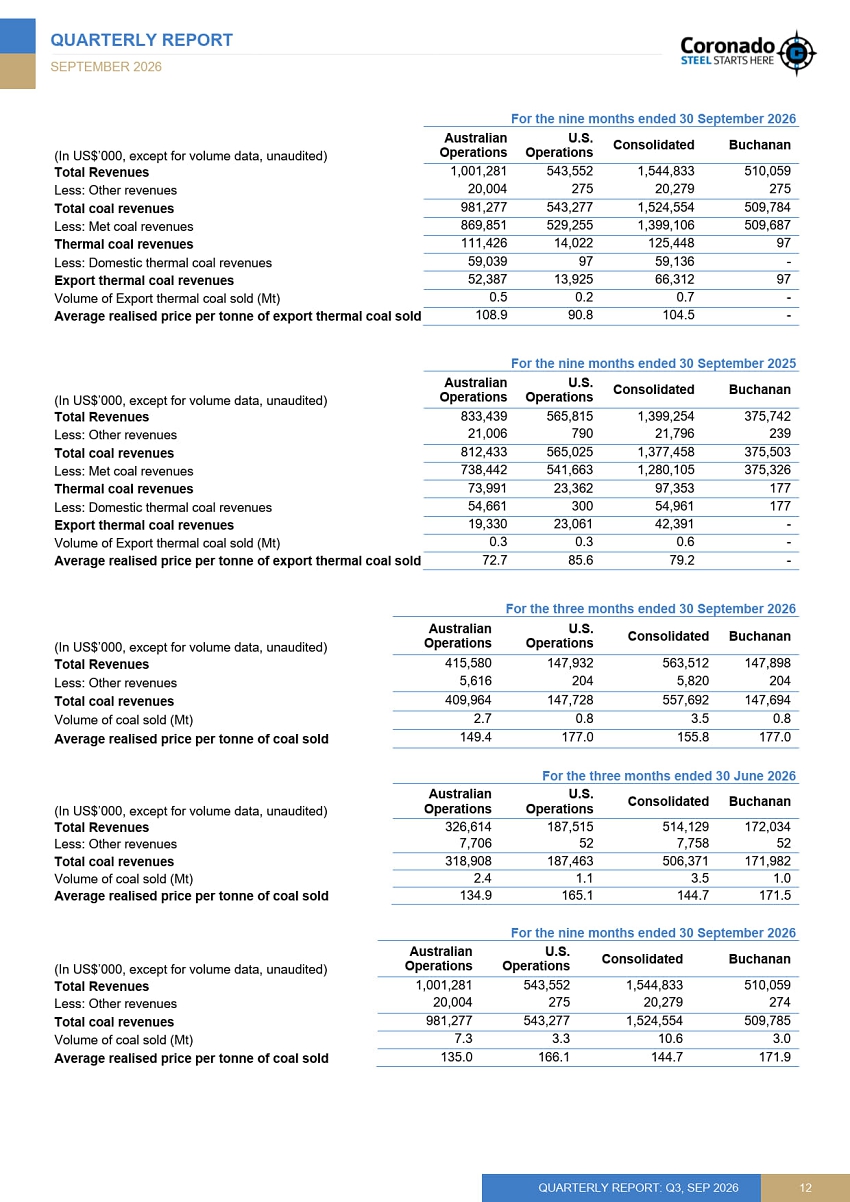
| QUARTERLY REPORT SEPTEMBER 2026 QUARTERLY REPORT: Q3, SEP 2026 12 For the nine months ended 30 September 2026 (In US$’000, except for volume data, unaudited) Australian Operations U.S. Operations Consolidated Buchanan Total Revenues 1,001,281 543,552 1,544,833 510,059 Less: Other revenues 20,004 275 20,279 275 Total coal revenues 981,277 543,277 1,524,554 509,784 Less: Met coal revenues 869,851 529,255 1,399,106 509,687 Thermal coal revenues 111,426 14,022 125,448 97 Less: Domestic thermal coal revenues 59,039 97 59,136 - Export thermal coal revenues 52,387 13,925 66,312 97 Volume of Export thermal coal sold (Mt) 0.5 0.2 0.7 - Average realised price per tonne of export thermal coal sold 108.9 90.8 104.5 - For the nine months ended 30 September 2025 (In US$’000, except for volume data, unaudited) Australian Operations U.S. Operations Consolidated Buchanan Total Revenues 833,439 565,815 1,399,254 375,742 Less: Other revenues 21,006 790 21,796 239 Total coal revenues 812,433 565,025 1,377,458 375,503 Less: Met coal revenues 738,442 541,663 1,280,105 375,326 Thermal coal revenues 73,991 23,362 97,353 177 Less: Domestic thermal coal revenues 54,661 300 54,961 177 Export thermal coal revenues 19,330 23,061 42,391 - Volume of Export thermal coal sold (Mt) 0.3 0.3 0.6 - Average realised price per tonne of export thermal coal sold 72.7 85.6 79.2 - For the three months ended 30 September 2026 (In US$’000, except for volume data, unaudited) Australian Operations U.S. Operations Consolidated Buchanan Total Revenues 415,580 147,932 563,512 147,898 Less: Other revenues 5,616 204 5,820 204 Total coal revenues 409,964 147,728 557,692 147,694 Volume of coal sold (Mt) 2.7 0.8 3.5 0.8 Average realised price per tonne of coal sold 149.4 177.0 155.8 177.0 For the three months ended 30 June 2026 (In US$’000, except for volume data, unaudited) Australian Operations U.S. Operations Consolidated Buchanan Total Revenues 326,614 187,515 514,129 172,034 Less: Other revenues 7,706 52 7,758 52 Total coal revenues 318,908 187,463 506,371 171,982 Volume of coal sold (Mt) 2.4 1.1 3.5 1.0 Average realised price per tonne of coal sold 134.9 165.1 144.7 171.5 For the nine months ended 30 September 2026 (In US$’000, except for volume data, unaudited) Australian Operations U.S. Operations Consolidated Buchanan Total Revenues 1,001,281 543,552 1,544,833 510,059 Less: Other revenues 20,004 275 20,279 274 Total coal revenues 981,277 543,277 1,524,554 509,785 Volume of coal sold (Mt) 7.3 3.3 10.6 3.0 Average realised price per tonne of coal sold 135.0 166.1 144.7 171.9 |
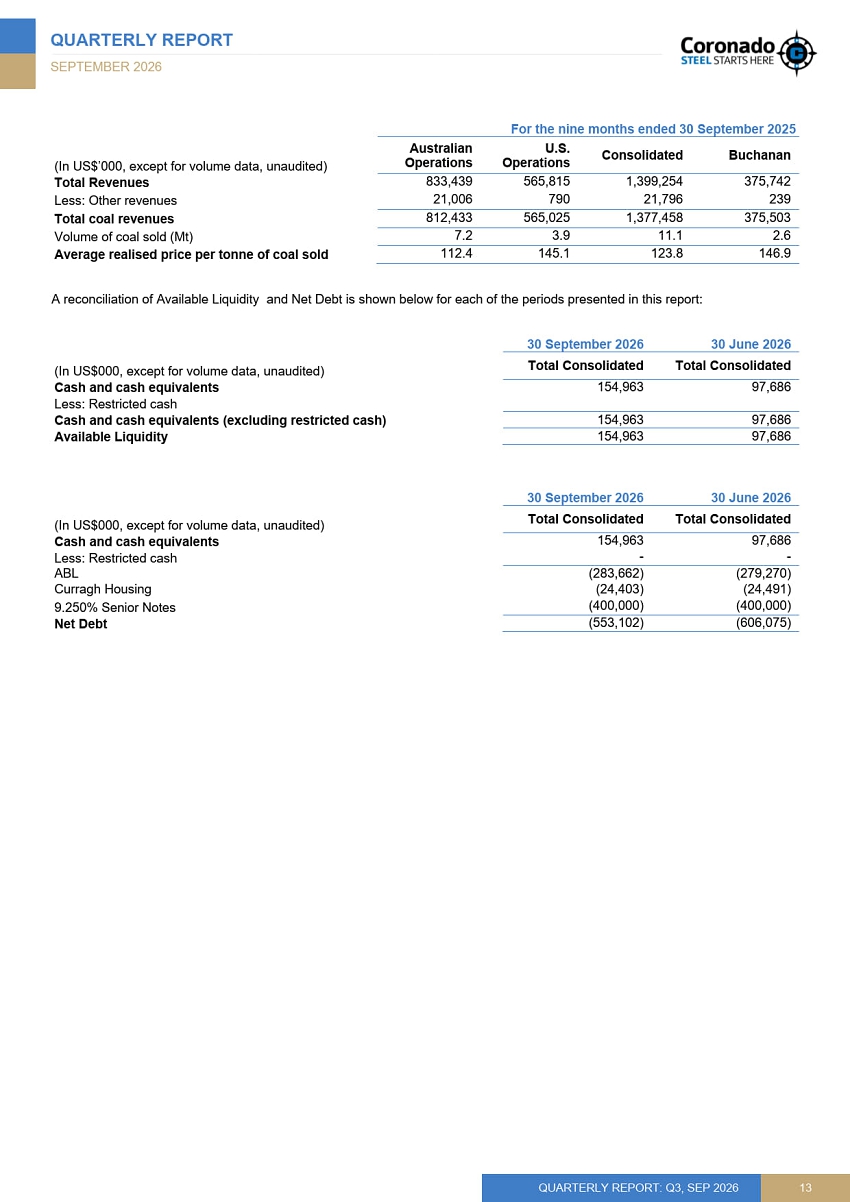
| QUARTERLY REPORT SEPTEMBER 2026 QUARTERLY REPORT: Q3, SEP 2026 13 For the nine months ended 30 September 2025 (In US$’000, except for volume data, unaudited) Australian Operations U.S. Operations Consolidated Buchanan Total Revenues 833,439 565,815 1,399,254 375,742 Less: Other revenues 21,006 790 21,796 239 Total coal revenues 812,433 565,025 1,377,458 375,503 Volume of coal sold (Mt) 7.2 3.9 11.1 2.6 Average realised price per tonne of coal sold 112.4 145.1 123.8 146.9 A reconciliation of Available Liquidity and Net Debt is shown below for each of the periods presented in this report: 30 September 2026 30 June 2026 (In US$000, except for volume data, unaudited) Total Consolidated Total Consolidated Cash and cash equivalents 154,963 97,686 Less: Restricted cash Cash and cash equivalents (excluding restricted cash) 154,963 97,686 Available Liquidity 154,963 97,686 30 September 2026 30 June 2026 (In US$000, except for volume data, unaudited) Total Consolidated Total Consolidated Cash and cash equivalents 154,963 97,686 Less: Restricted cash ABL (283,662) (279,270) Curragh Housing (24,403) (24,491) 9.250% Senior Notes (400,000) (400,000) Net Debt (553,102) (606,075) |
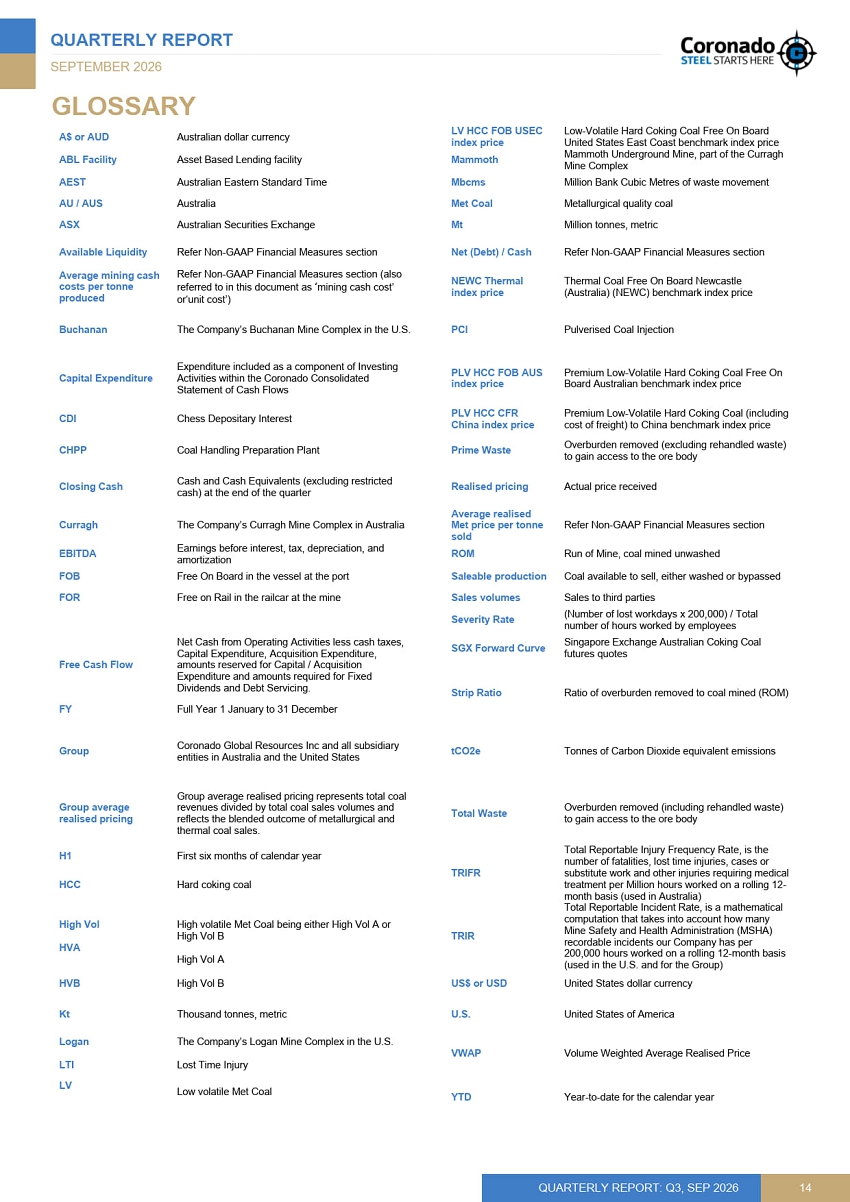
| QUARTERLY REPORT SEPTEMBER 2026 QUARTERLY REPORT: Q3, SEP 2026 14 GLOSSARY A$ or AUD Australian dollar currency LV HCC FOB USEC index price Low-Volatile Hard Coking Coal Free On Board United States East Coast benchmark index price ABL Facility Asset Based Lending facility Mammoth Mammoth Underground Mine, part of the Curragh Mine Complex AEST Australian Eastern Standard Time Mbcms Million Bank Cubic Metres of waste movement AU / AUS Australia Met Coal Metallurgical quality coal ASX Australian Securities Exchange Mt Million tonnes, metric Available Liquidity Refer Non-GAAP Financial Measures section Net (Debt) / Cash Refer Non-GAAP Financial Measures section Average mining cash costs per tonne produced Refer Non-GAAP Financial Measures section (also referred to in this document as ‘mining cash cost’ or‘unit cost’) NEWC Thermal index price Thermal Coal Free On Board Newcastle (Australia) (NEWC) benchmark index price Buchanan The Company’s Buchanan Mine Complex in the U.S. PCI Pulverised Coal Injection Capital Expenditure Expenditure included as a component of Investing Activities within the Coronado Consolidated Statement of Cash Flows PLV HCC FOB AUS index price Premium Low-Volatile Hard Coking Coal Free On Board Australian benchmark index price CDI Chess Depositary Interest PLV HCC CFR China index price Premium Low-Volatile Hard Coking Coal (including cost of freight) to China benchmark index price CHPP Coal Handling Preparation Plant Prime Waste Overburden removed (excluding rehandled waste) to gain access to the ore body Closing Cash Cash and Cash Equivalents (excluding restricted cash) at the end of the quarter Realised pricing Actual price received Curragh The Company’s Curragh Mine Complex in Australia Average realised Met price per tonne sold Refer Non-GAAP Financial Measures section EBITDA Earnings before interest, tax, depreciation, and amortization ROM Run of Mine, coal mined unwashed FOB Free On Board in the vessel at the port Saleable production Coal available to sell, either washed or bypassed FOR Free on Rail in the railcar at the mine Sales volumes Sales to third parties Severity Rate (Number of lost workdays x 200,000) / Total number of hours worked by employees Free Cash Flow Net Cash from Operating Activities less cash taxes, Capital Expenditure, Acquisition Expenditure, amounts reserved for Capital / Acquisition Expenditure and amounts required for Fixed Dividends and Debt Servicing. SGX Forward Curve Singapore Exchange Australian Coking Coal futures quotes Strip Ratio Ratio of overburden removed to coal mined (ROM) FY Full Year 1 January to 31 December Group Coronado Global Resources Inc and all subsidiary entities in Australia and the United States tCO2e Tonnes of Carbon Dioxide equivalent emissions Group average realised pricing Group average realised pricing represents total coal revenues divided by total coal sales volumes and reflects the blended outcome of metallurgical and thermal coal sales. Total Waste Overburden removed (including rehandled waste) to gain access to the ore body H1 First six months of calendar year TRIFR Total Reportable Injury Frequency Rate, is the number of fatalities, lost time injuries, cases or substitute work and other injuries requiring medical treatment per Million hours worked on a rolling 12- month basis (used in Australia) HCC Hard coking coal High Vol HVA High volatile Met Coal being either High Vol A or High Vol B High Vol A TRIR Total Reportable Incident Rate, is a mathematical computation that takes into account how many Mine Safety and Health Administration (MSHA) recordable incidents our Company has per 200,000 hours worked on a rolling 12-month basis (used in the U.S. and for the Group) HVB High Vol B US$ or USD United States dollar currency Kt Thousand tonnes, metric U.S. United States of America Logan LTI The Company’s Logan Mine Complex in the U.S. Lost Time Injury VWAP Volume Weighted Average Realised Price LV Low volatile Met Coal YTD Year-to-date for the calendar year |