
3Q26 Earnings Presentation October 22, 2026 Exhibit 99.2
2 Forward Looking Statements The foregoing contains forward -looking statements within the meaning of the Private Securities Litigation Reform Act of 1995 . Such statements are not historical facts and include expressions about management’s confidence and strategies and management’s expectations about our business, new and existing programs and products, the Transactions (as defined below) and other mergers or acquisitions, relationships, opportunities, taxation, technology, market conditions and economic expectations . These statements may be identified by forward -looking terminology such as “intend,” “should,” “expect,” “believe ,” “target,” “position,” “view,” “opportunity,” “allow,” “continues,” “reflects,” “would,” “could,” “typically,” “usually,” “anticipate,” “may,” “estimate,” “outlook,” “project” or similar statements or variations of such terms . Such forward -looking statements involve certain risks and uncertainties . Actual results may differ materially from such forward -looking statements . Factors that may cause actual results to differ materially from those contemplated in these forward -looking statements include, but are not limited to : risks and uncertainties relating to Valley’s proposed acquisitions of Providence and Bluevine (together, the “Transactions”), including, but not limited to : the possibility that the Transactions may not be completed when expected or at all, including as a result of delays in obtaining, or the failure to obtain, required regulatory or other approvals or the failure to satisfy other closing conditions, including approval by Providence shareholders ; the occurrence of any event that could give rise to the right of any party to terminate the merger or other agreement ; the possibility that the anticipated benefits of the Transactions, including potential cost savings, synergies, and earnings accretion, will not be realized when expected or at all; the possibility that the Transactions may be more expensive to complete than anticipated, including as a result of unexpected factors or events ; diversion of management and attention from ongoing business operations ; costs or difficulties relating to integration matters might be greater than expected ; the inability to retain customers and qualified employees of Providence and Bluevine ; potential business disruption or adverse reactions or changes to business, customer or employee relationships as a result of the Transactions ; and changes in estimates of non -recurring charges related to the Transactions ; the impact of market interest rates and monetary and fiscal policies of the U.S . federal government and its agencies in connection with prolonged inflationary pressures, which could have a material adverse effect on our clients, our business, our employees, and our ability to provide services to our customers ; the impact of unfavorable macroeconomic conditions or downturns, including instability or volatility in financial markets resulting from the impact of tariffs/import fees and other trade policies and practices, any retaliatory actions, changes in energy commodity prices, related market uncertainty, or other factors ; U.S . government debt default or rating downgrade ; unanticipated loan delinquencies ; loss of collateral ; decreased service revenues ; increased business disruptions or failures ; reductions in employment ; and other potential negative effects on our business, employees or clients caused by factors outside of our control, such as new legislation and policy changes under the current U.S . presidential administration, any shutdown of the U.S . federal government, geopolitical instabilities or events, including ongoing conflicts in the Middle East, natural and other disasters, including severe weather events and other climate -related risks, health emergencies, acts of terrorism, or other external events ; the impact of any potential instability within the U.S . financial sector or future bank failures, including the possibility of a run on deposits by a coordinated deposit base, and the impact of any actual or perceived concerns regarding the soundness, or creditworthiness, of other financial institutions, including any resulting disruption within the financial markets, increased expenses, including FDIC insurance assessments, or adverse impact on our stock price, deposits or our ability to borrow or raise capital ; the impact of negative public opinion regarding Valley or banks in general that damages our reputation and adversely impacts business and revenues ; changes in the statutes, regulations, policies, enforcement priorities, or composition of the federal bank regulatory agencies ; the loss of or decrease in lower -cost funding sources within our deposit base ; investigations, damage verdicts, settlements or restrictions related to existing or potential class action litigation or individual litigation arising from claims of violations of laws or regulations, contractual claims, breach of fiduciary responsibility, negligence, fraud, environmental laws, patent, trademark or other intellectual property infringement, misappropriation or other violation, employment -related claims, and other matters ; a prolonged downturn and contraction in the economy, as well as any decline in commercial real estate values collateralizing a significant portion of our loan portfolio ; higher or lower than expected income tax expense or tax rates, including increases or decreases resulting from changes in uncertain tax position liabilities, tax laws, regulations, and case law ; the inability to grow customer deposits to keep pace with the level of loan growth ; a material change in our allowance for credit losses due to forecasted economic conditions and/or unexpected credit deterioration in our loan and investment portfolios ; the need to supplement debt or equity capital to maintain or exceed internal capital thresholds ; changes in our business, strategy, market conditions or other factors that may negatively impact the estimated fair value of our goodwill and other intangible assets and result in future impairment charges ; greater than expected technology -related costs due to, among other factors, prolonged or failed implementations, additional project staffing and obsolescence caused by continuous and rapid market innovations ; increased competitive challenges and competitive pressure on pricing of our products and services ; our ability to stay current with rapid technological changes and evolving legal and regulatory requirements in the financial services industry, including developments relating to the use of artificial intelligence, blockchain, and related regulatory developments, as well as our ability to effectively assess and monitor the effects of, and risks associated with, the implementation and use of such technology ; cyberattacks, ransomware attacks, computer viruses, malware or other cybersecurity incidents that may breach the security of our or our third -party service providers’ websites or other systems or networks to obtain unauthorized access to personal, confidential, proprietary or sensitive information, destroy data, disable or degrade service, or sabotage our systems or networks, and the increasing sophistication of such attacks and use of targeted tactics against the financial services industry ; any disruption of our systems and network, or those of our third -party service providers, resulting from events that are wholly or partially beyond our control, including, for example, electrical, telecommunications, or other major service outages, or actions by employees, which may give rise to financial loss or liability ; results of examinations by the Office of the Comptroller of the Currency (OCC), the Federal Reserve Bank, the Consumer Financial Protection Bureau and other regulatory authorities, including the possibility that any such regulatory authority may, among other things, require us to increase our allowance for credit losses, write -down assets, reimburse customers, change the way we do business, or limit or eliminate certain other banking activities ; application of heightened regulatory standards for certain large insured national banks, and the expenses we will incur to develop policies, programs, and systems that comply with the enhanced standards applicable to us ; our inability or determination not to pay dividends at current levels, or at all, because of inadequate earnings, regulatory restrictions or limitations, changes in our capital requirements, or a decision to increase capital by retaining more earnings ; unanticipated loan delinquencies, loss of collateral, decreased service revenues, and other potential negative effects on our business caused by severe weather and other climate -related risks, pandemics or other public health crises, acts of terrorism or other external events ; our ability to successfully execute our business plan and strategic initiatives ; and unexpected significant declines in the loan portfolio due to the lack of economic expansion, increased competition, large prepayments, risk mitigation strategies, changes in regulatory lending guidance or other factors . A detailed discussion of factors that could affect our results is included in our SEC filings, including Item 1A. “Risk Factors” of our Annual Report on Form 10- K for the year ended December 31, 2025 . We undertake no duty to update any forward -looking statement to conform the statement to actual results or changes in our expectations, except as required by law . Although we believe that the expectations reflected in the forward -looking statements are reasonable, we cannot guarantee future results, levels of activity, performance or achievements .
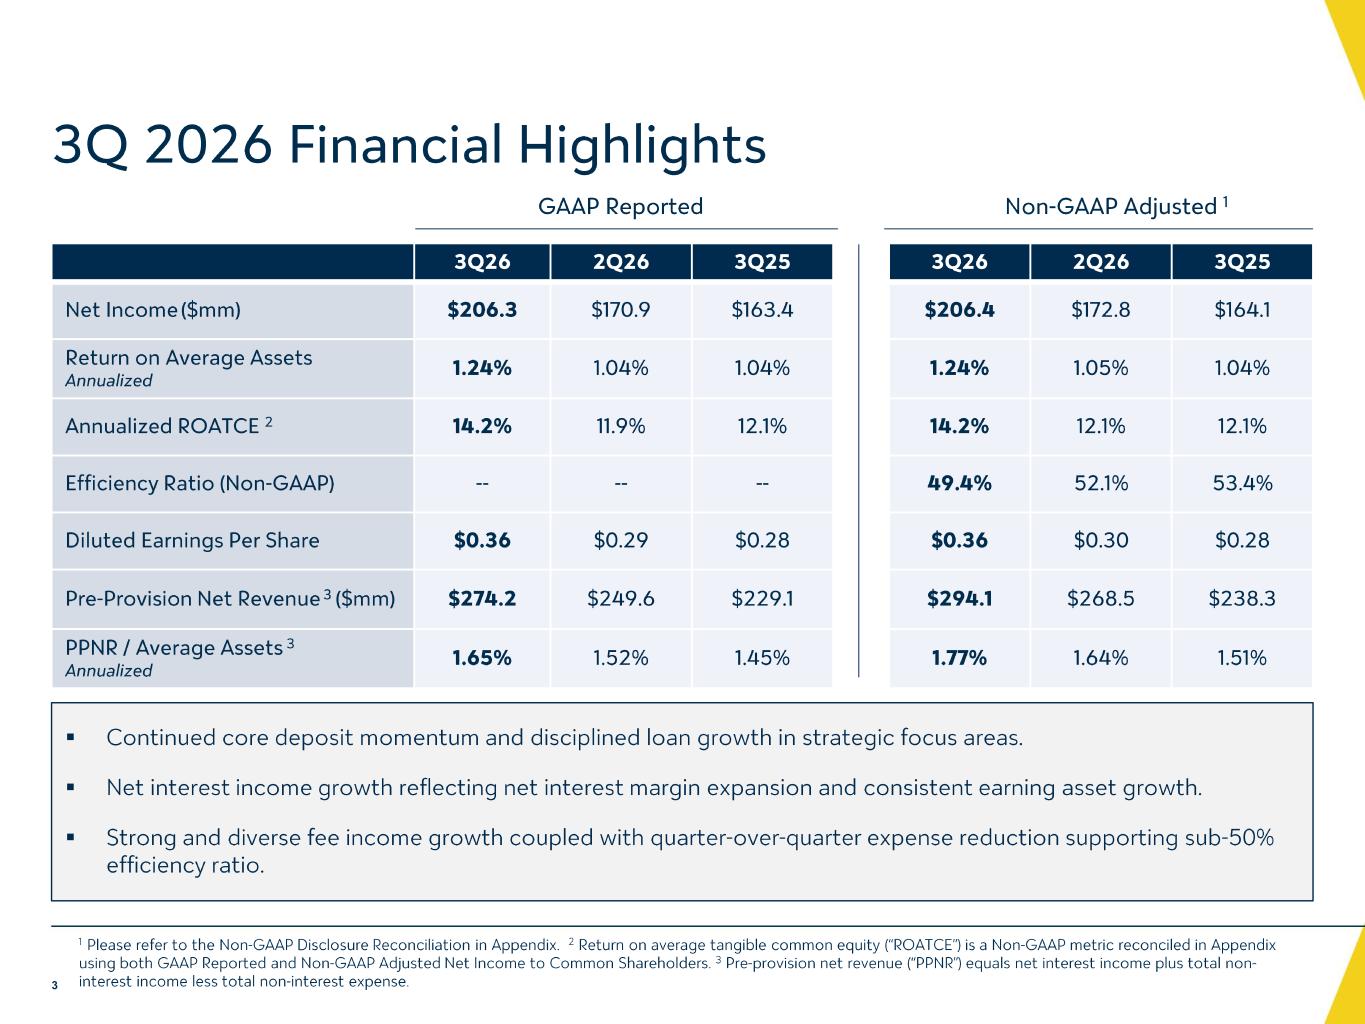
3Q 2026 Financial Highlights 3Q26 2Q26 3Q25 3Q26 2Q26 3Q25 Net Income ($mm) $206.3 $170.9 $163.4 $206.4 $172.8 $164.1 Return on Average Assets Annualized 1.24% 1.04% 1.04% 1.24% 1.05% 1.04% Annualized ROATCE 2 14.2% 11.9% 12.1% 14.2% 12.1% 12.1% Efficiency Ratio (Non -GAAP) -- -- -- 49.4% 52.1% 53.4% Diluted Earnings Per Share $0.36 $0.29 $0.28 $0.36 $0.30 $0.28 Pre -Provision Net Revenue 3 ($mm) $274.2 $249.6 $229.1 $294.1 $268.5 $238.3 PPNR / Average Assets 3 Annualized 1.65% 1.52% 1.45% 1.77% 1.64% 1.51% GAAP Reported Non -GAAP Adjusted 1 1 Please refer to the Non -GAAP Disclosure Reconciliation in Appendix. 2 Return on average tangible common equity (“ROATCE”) is a Non -GAAP metric reconciled in Appendix using both GAAP Reported and Non -GAAP Adjusted Net Income to Common Shareholders. 3 Pre-provision net revenue (“PPNR”) equals net interest income plus total non - interest income less total non -interest expense. ▪ Continued core deposit momentum and disciplined loan growth in strategic focus areas. ▪ Net interest income growth reflecting net interest margin expansion and consistent earning asset growth. ▪ Strong and diverse fee income growth coupled with quarter -over -quarter expense reduction supporting sub -50% efficiency ratio. 3 Source- Earnings Release in Workiva
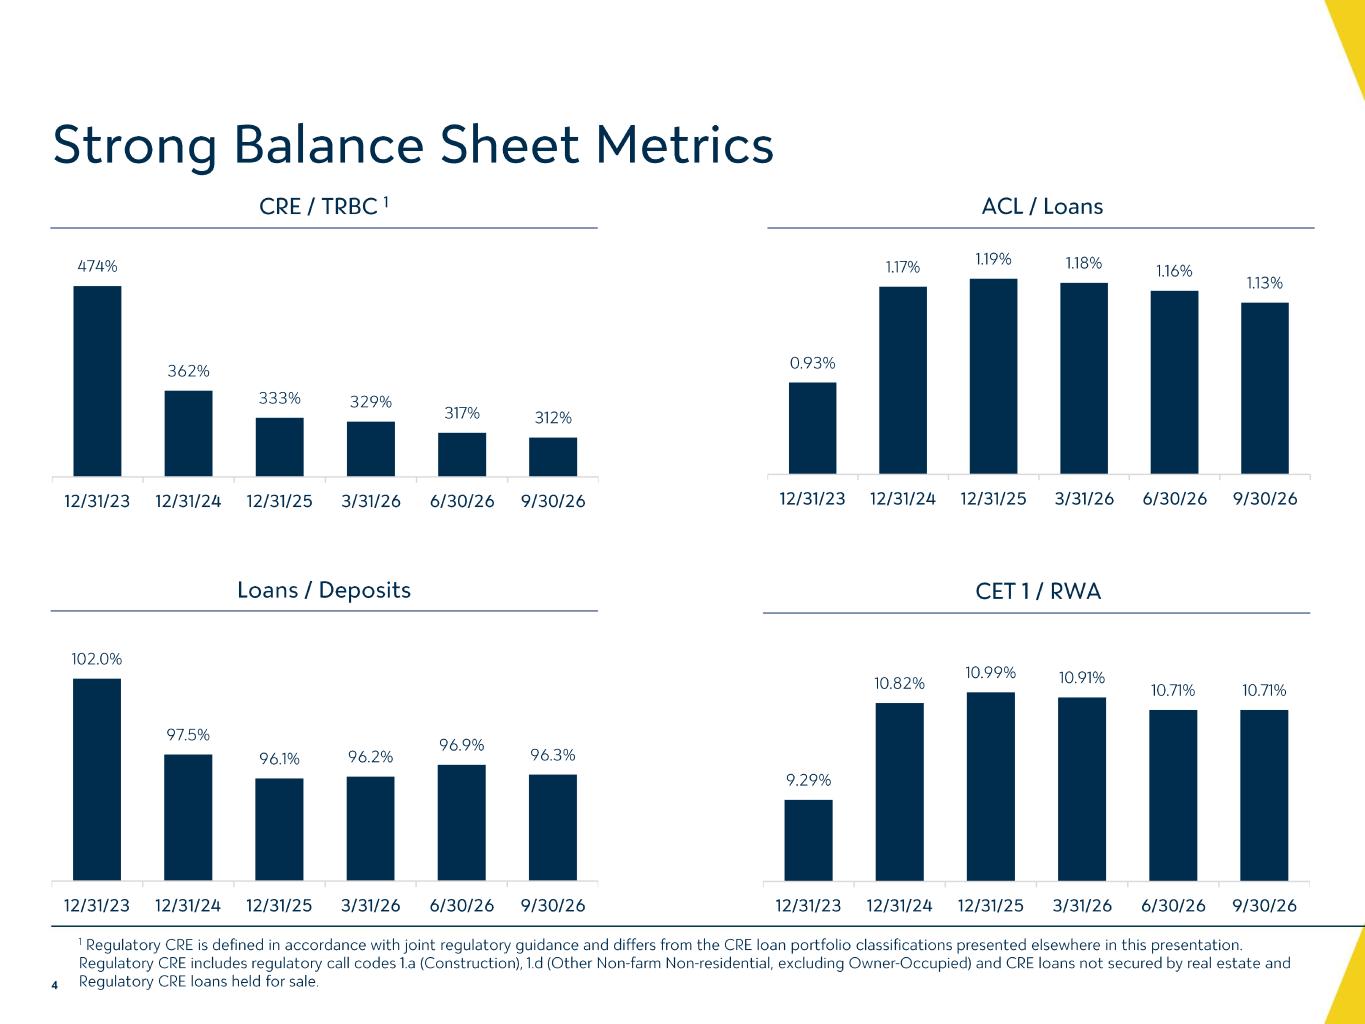
9.29% 10.82% 10.99% 10.91% 10.71% 10.71% 12/31/23 12/31/24 12/31/25 3/31/26 6/30/26 9/30/26 Strong Balance Sheet Metrics 4 ACL / Loans 0.93% 1.17% 1.19% 1.18% 1.16% 1.13% 12/31/23 12/31/24 12/31/25 3/31/26 6/30/26 9/30/26 Loans / Deposits CET 1 / RWA 1 Regulatory CRE is defined in accordance with joint regulatory guidance and differs from the CRE loan portfolio classification s presented elsewhere in this presentation. Regulatory CRE includes regulatory call codes 1.a (Construction), 1.d (Other Non -farm Non -residential, excluding Owner -Occupied) and CRE loans not secured by real estate and Regulatory CRE loans held for sale. CRE / TRBC 1 474% 362% 333% 329% 317% 312% 12/31/23 12/31/24 12/31/25 3/31/26 6/30/26 9/30/26 CRE Concentration - 5 Quarter Trend_2Q26 Source- Earnings Release in Workiva Source- Earnings Release in Workiva Source- Earnings Release in Workiva 102.0% 97.5% 96.1% 96.2% 96.9% 96.3% 12/31/23 12/31/24 12/31/25 3/31/26 6/30/26 9/30/26
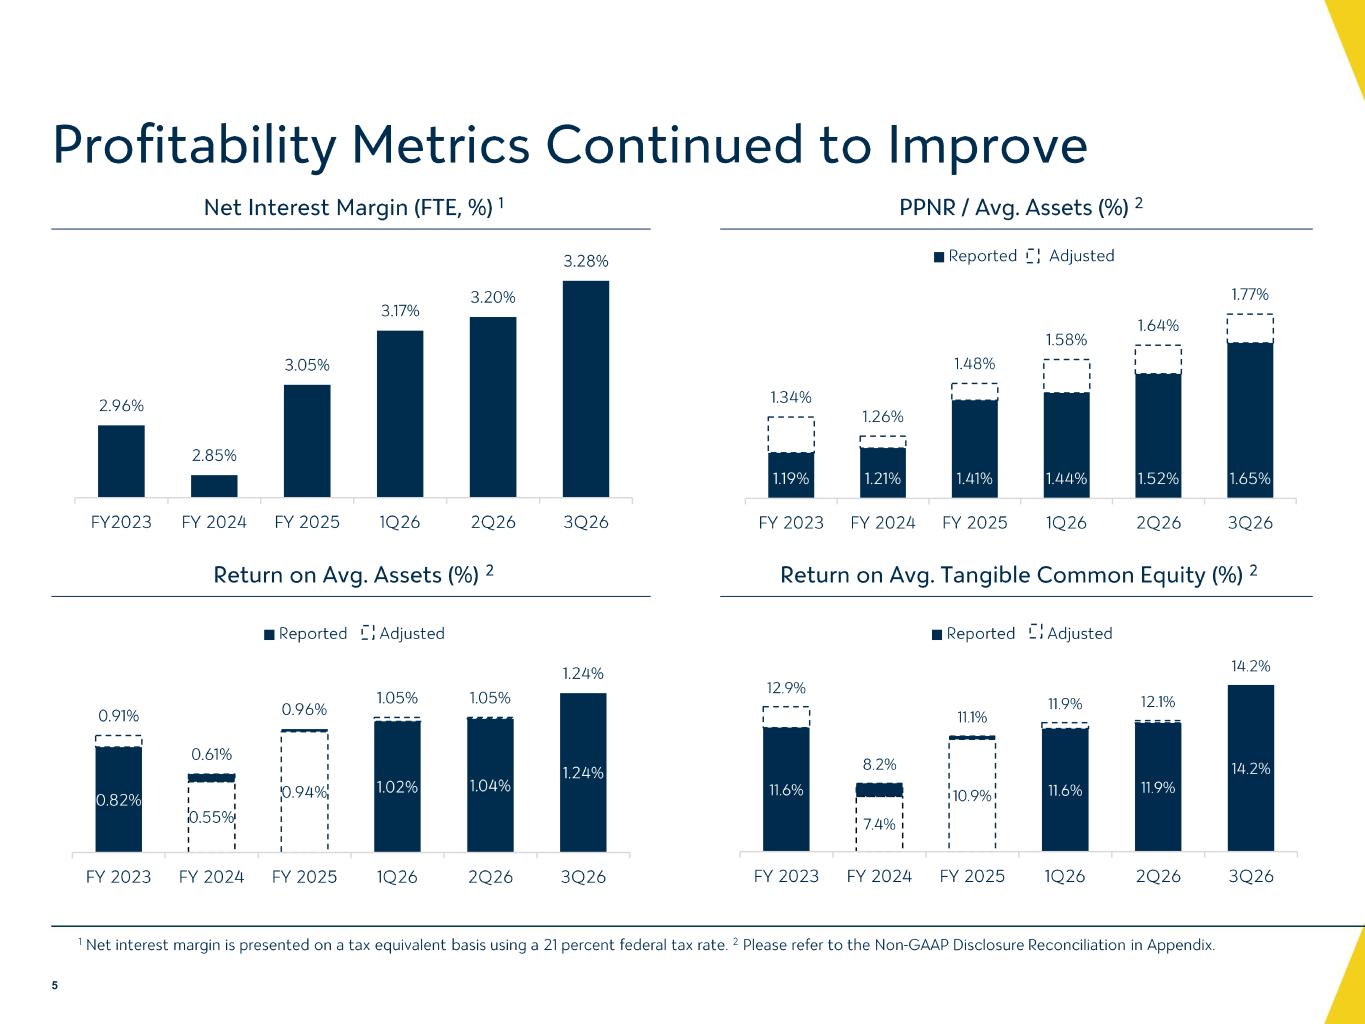
Profitability Metrics Continued to Improve 5 Net Interest Margin (FTE, %) 1 PPNR / Avg. Assets (%) 2 Return on Avg. Assets (%) 2 Return on Avg. Tangible Common Equity (%) 2 2.96% 2.85% 3.05% 3.17% 3.20% 3.28% FY2023 FY 2024 FY 2025 1Q26 2Q26 3Q26 1.19% 1.21% 1.41% 1.44% 1.52% 1.65% 1.34% 1.26% 1.48% 1.58% 1.64% 1.77% FY 2023 FY 2024 FY 2025 1Q26 2Q26 3Q26 Reported Adjusted 0.82% 0.55% 0.94% 1.02% 1.04% 1.24% 0.91% 0.61% 0.96% 1.05% 1.05% 1.24% FY 2023 FY 2024 FY 2025 1Q26 2Q26 3Q26 Reported Adjusted Source- Earnings Release in Workiva Source- Earnings Release in Workiva Source- Earnings Release in Workiva Source- Earnings Release in Workiva 1 Net interest margin is presented on a tax equivalent basis using a 21 percent federal tax rate. 2 Please refer to the Non -GAAP Disclosure Reconciliation in Appendix. 11.6% 7.4% 10.9% 11.6% 11.9% 14.2% 12.9% 8.2% 11.1% 11.9% 12.1% 14.2% FY 2023 FY 2024 FY 2025 1Q26 2Q26 3Q26 Reported Adjusted
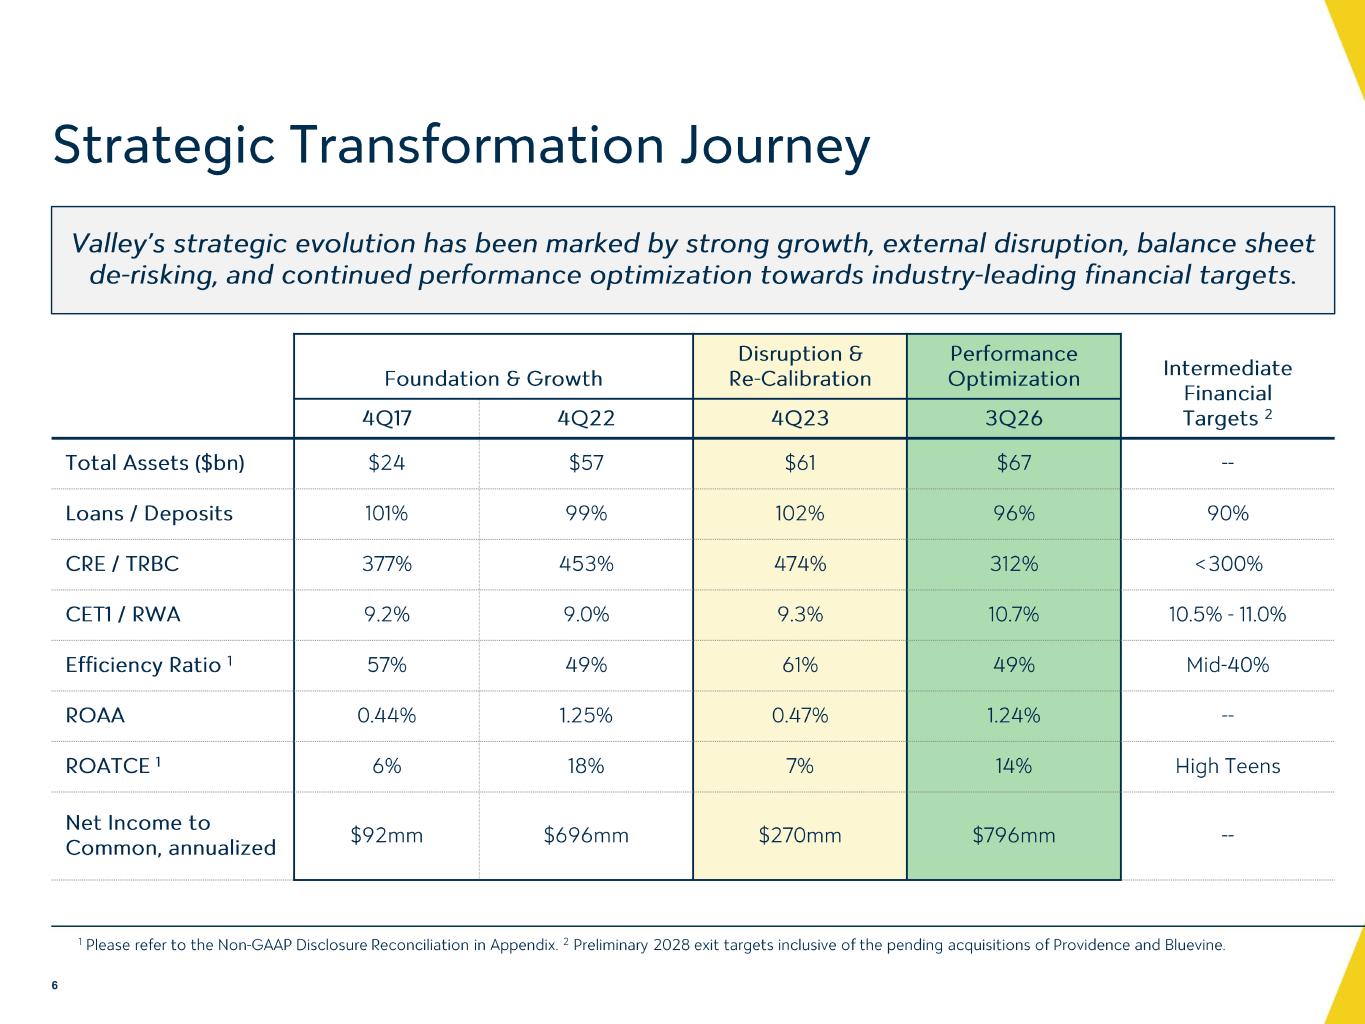
Strategic Transformation Journey 6 1 Please refer to the Non -GAAP Disclosure Reconciliation in Appendix. 2 Preliminary 2028 exit targets inclusive of the pending acquisitions of Providence and Bluevine . CRE Concentration - 5 Quarter Trend_2Q26 Source- Earnings Release in Workiva Source- Earnings Release in Workiva Source- Earnings Release in Workiva Foundation & Growth Disruption & Re -Calibration Performance Optimization Intermediate Financial Targets 24Q17 4Q22 4Q23 3Q26 Total Assets ($bn) $24 $57 $61 $67 -- Loans / Deposits 101% 99% 102% 96% 90% CRE / TRBC 377% 453% 474% 312% <300% CET1 / RWA 9.2% 9.0% 9.3% 10.7% 10.5% - 11.0% Efficiency Ratio 1 57% 49% 61% 49% Mid-40% ROAA 0.44% 1.25% 0.47% 1.24% -- ROATCE 1 6% 18% 7% 14% High Teens Net Income to Common, annualized $92mm $696mm $270mm $796mm -- Valley’s strategic evolution has been marked by strong growth, external disruption, balance sheet de -risking, and continued performance optimization towards industry -leading financial targets.
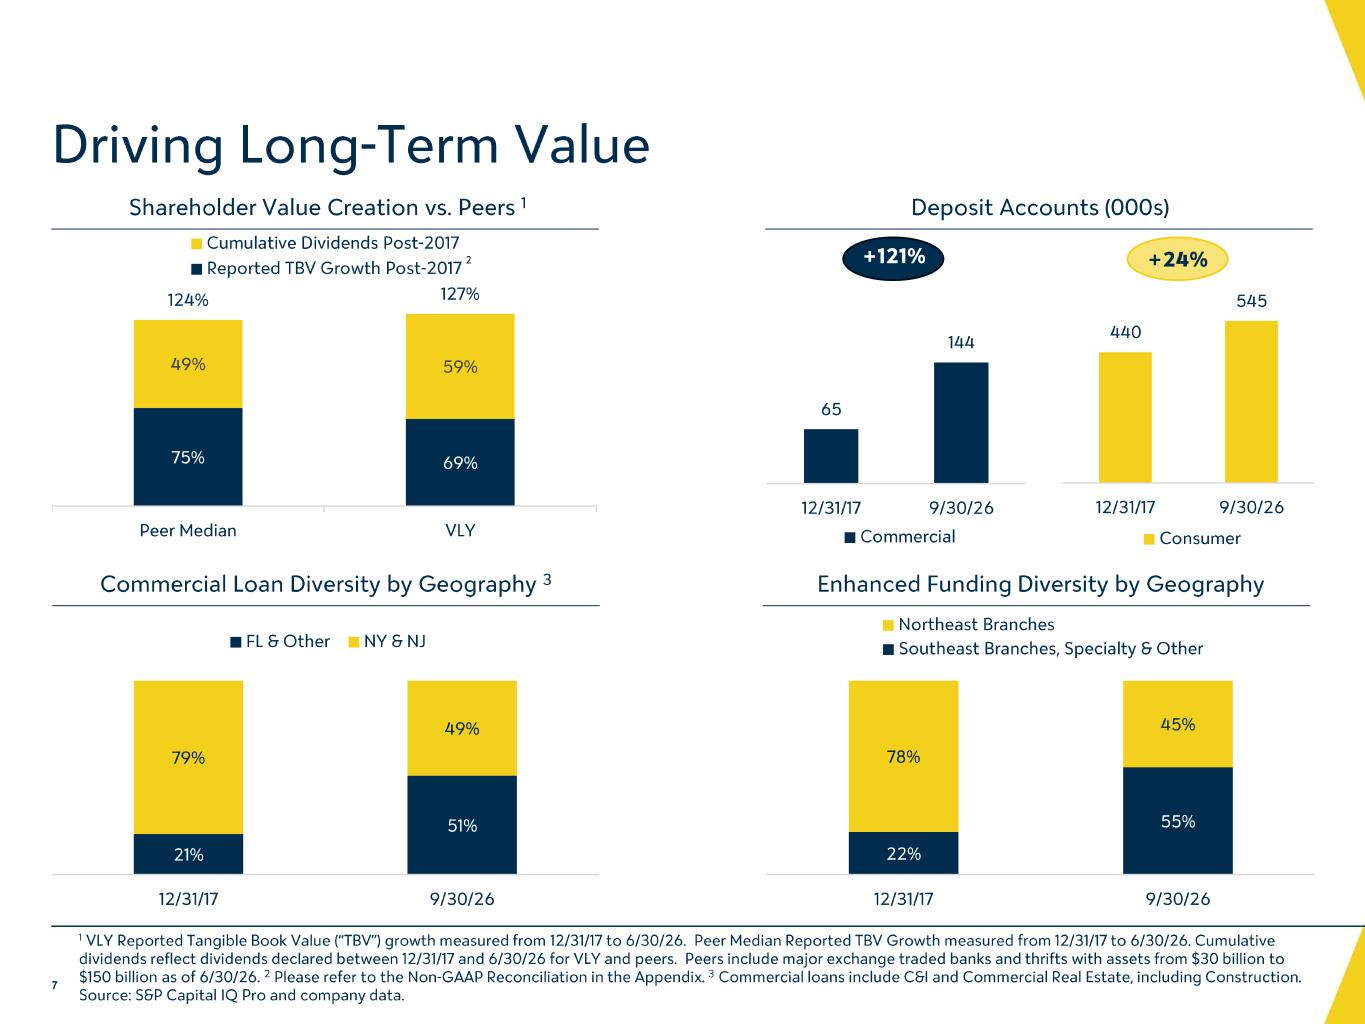
65 144 12/31/17 9/30/26 Commercial 69%75% 59%49% 127%124% VLYPeer Median Cumulative Dividends Post-2017 Reported TBV Growth Post-2017 +121% Shareholder Value Creation vs. Peers 1 Deposit Accounts (000s) Commercial Loan Diversity by Geography 3 Enhanced Funding Diversity by Geography 21% 51% 79% 49% 12/31/17 9/30/26 FL & Other NY & NJ 22% 55% 78% 45% 12/31/17 9/30/26 Northeast Branches Southeast Branches, Specialty & Other 440 545 12/31/17 9/30/26 Consumer +24% Driving Long -Term Value 1 VLY Reported Tangible Book Value (“TBV”) growth measured from 12/31/17 to 6 /30 /26. Peer Median Reported TBV Growth measured from 12/31/17 to 6/30/26. Cumulative dividends reflect dividends declared between 12/31/17 and 6/30/26 for VLY and peers. Peers include major exchange traded ban ks and thrifts with assets from $30 billion to $150 billion as of 6/30/26. 2 Please refer to the Non -GAAP Reconciliation in the Appendix. 3 Commercial loans include C&I and Commercial Real Estate, including Construction. Source: S&P Capital IQ Pro and company data. 7 Source- “TBV Support 2Q26” Source- “Summary_HC” Source- TL Deposit Tie Out Source- “Existing Accounts 06-2026” 2
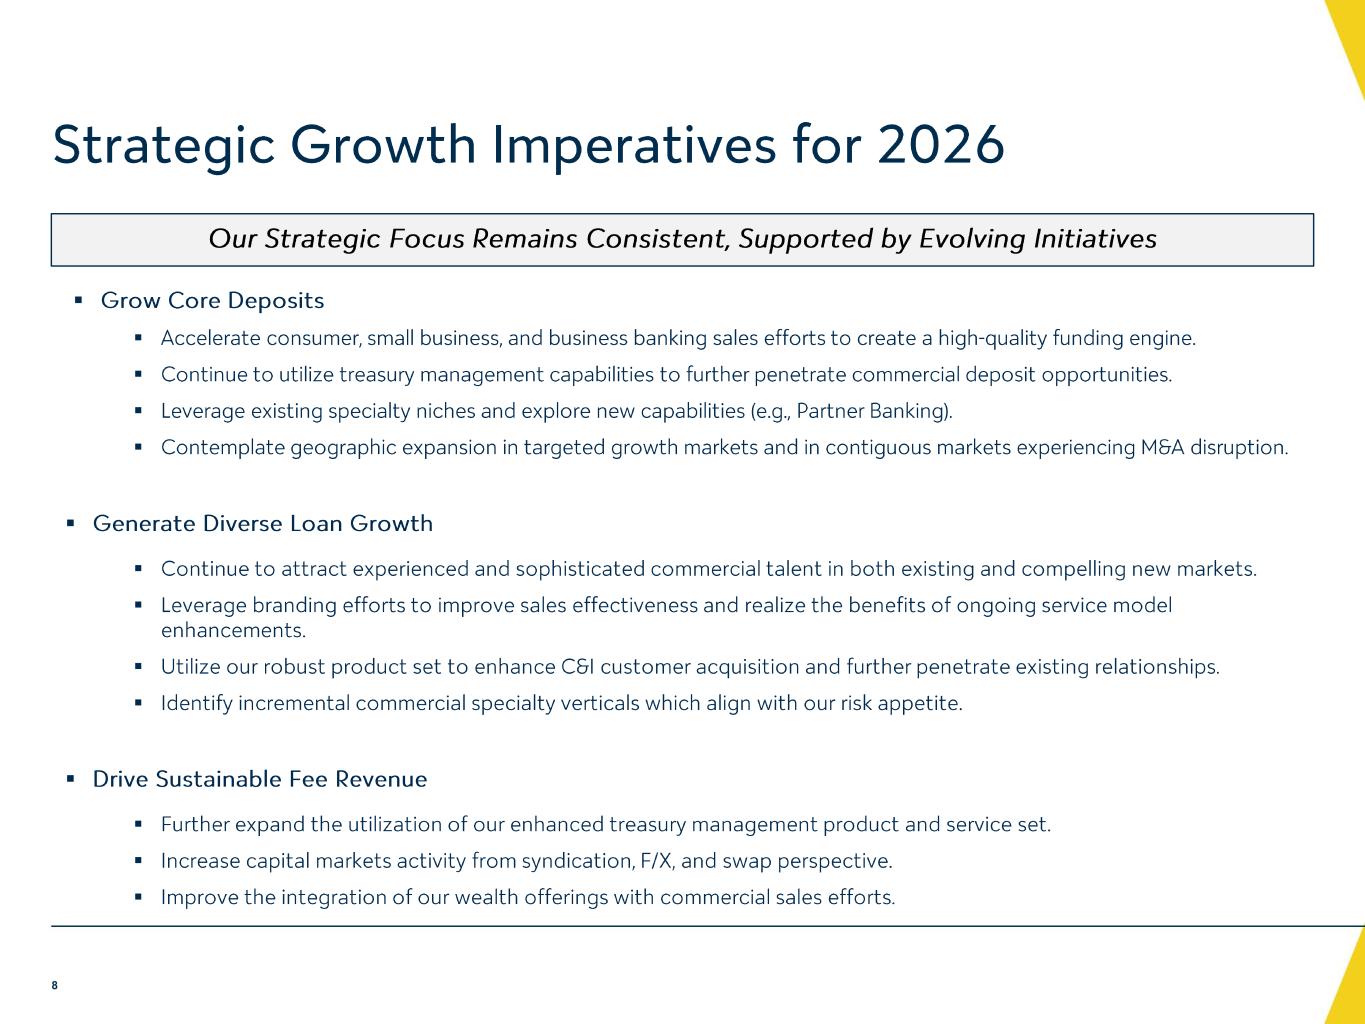
▪ Grow Core Deposits ▪ Accelerate consumer, small business, and business banking sales efforts to create a high -quality funding engine. ▪ Continue to utilize treasury management capabilities to further penetrate commercial deposit opportunities. ▪ Leverage existing specialty niches and explore new capabilities (e.g., Partner Banking). ▪ Contemplate geographic expansion in targeted growth markets and in contiguous markets experiencing M&A disruption. ▪ Generate Diverse Loan Growth ▪ Continue to attract experienced and sophisticated commercial talent in both existing and compelling new markets. ▪ Leverage branding efforts to improve sales effectiveness and realize the benefits of ongoing service model enhancements. ▪ Utilize our robust product set to enhance C&I customer acquisition and further penetrate existing relationships. ▪ Identify incremental commercial specialty verticals which align with our risk appetite. ▪ Drive Sustainable Fee Revenue ▪ Further expand the utilization of our enhanced treasury management product and service set. ▪ Increase capital markets activity from syndication, F/X, and swap perspective. ▪ Improve the integration of our wealth offerings with commercial sales efforts. Our Strategic Focus Remains Consistent, Supported by Evolving Initiatives Strategic Growth Imperatives for 2026 8
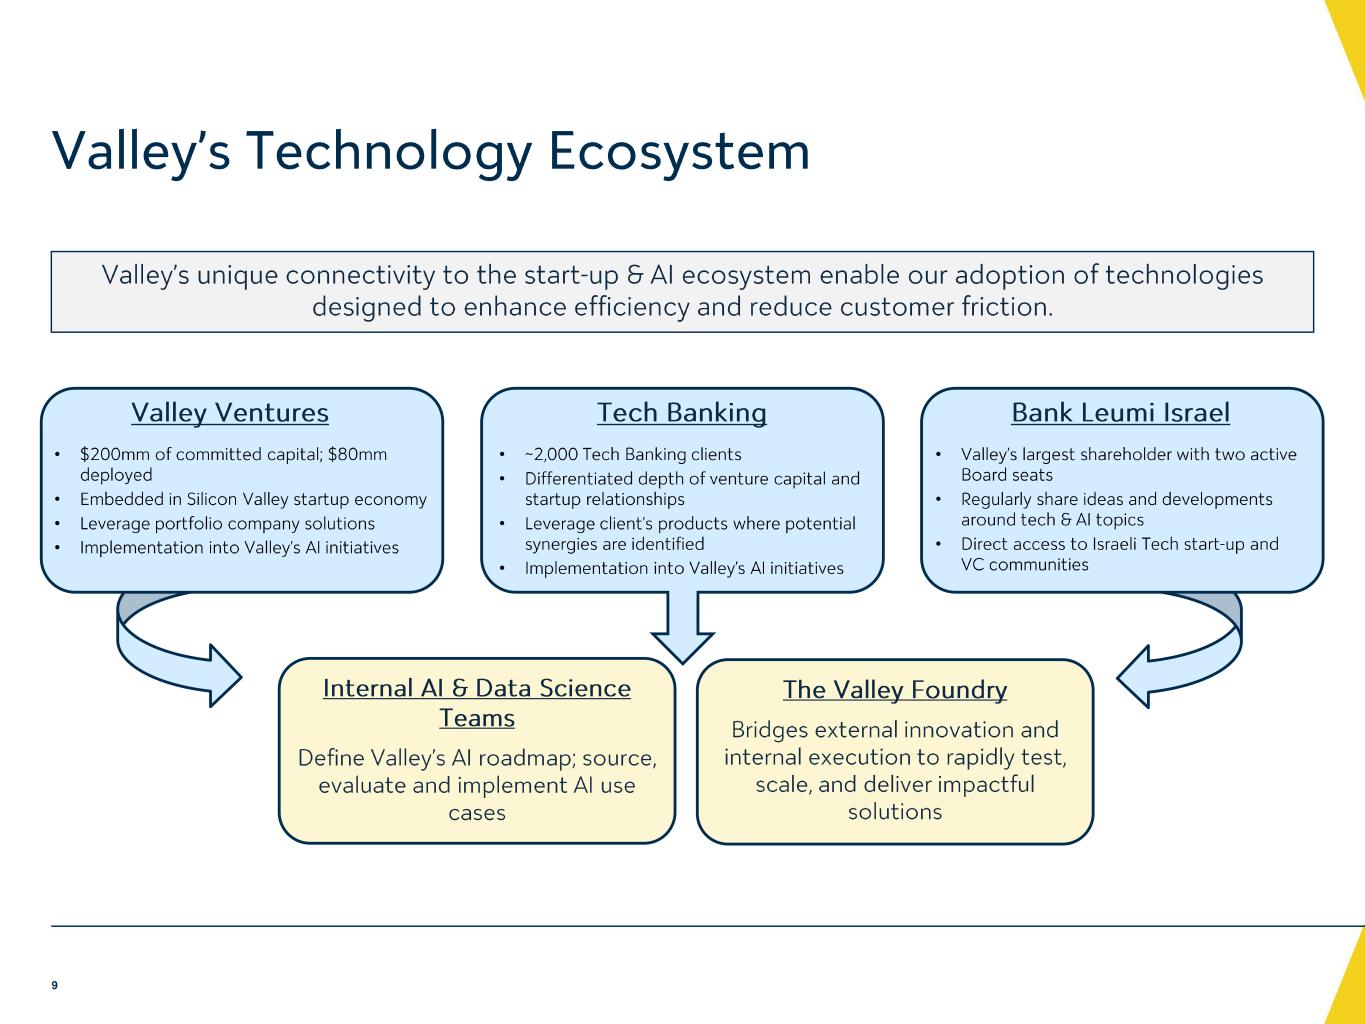
• $200mm of committed capital; $80mm deployed • Embedded in Silicon Valley startup economy • Leverage portfolio company solutions • Implementation into Valley’s AI initiatives • ~2,000 Tech Banking clients • Differentiated depth of venture capital and startup relationships • Leverage client’s products where potential synergies are identified • Implementation into Valley’s AI initiatives • Valley’s largest shareholder with two active Board seats • Regularly share ideas and developments around tech & AI topics • Direct access to Israeli Tech start -up and VC communities Tech Banking Bank Leumi Israel Valley’s unique connectivity to the start -up & AI ecosystem enable our adoption of technologies designed to enhance efficiency and reduce customer friction. 9 Valley’s Technology Ecosystem Internal AI & Data Science Teams Define Valley’s AI roadmap; source, evaluate and implement AI use cases The Valley Foundry Bridges external innovation and internal execution to rapidly test, scale, and deliver impactful solutions Valley Ventures
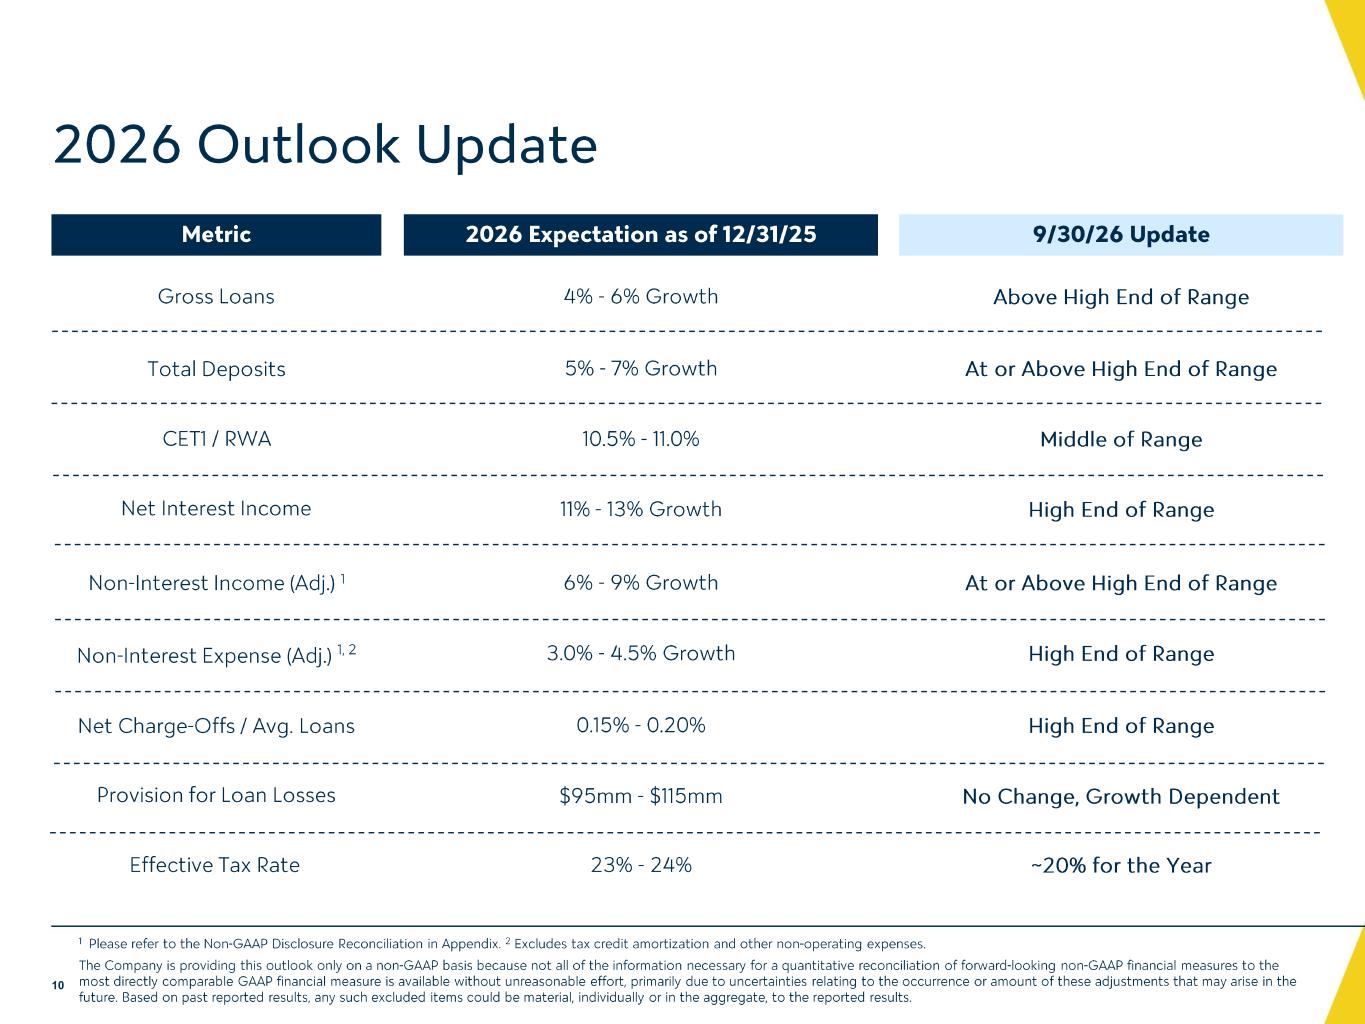
Metric Gross Loans 2026 Outlook Update 1 Please refer to the Non -GAAP Disclosure Reconciliation in Appendix. 2 Excludes tax credit amortization and other non -operating expenses. The Company is providing this outlook only on a non -GAAP basis because not all of the information necessary for a quantitative reconciliation of forward -looking non -GAAP financial measures to the most directly comparable GAAP financial measure is available without unreasonable effort, primarily due to uncertainties rela ting to the occurrence or amount of these adjustments that may arise in the future. Based on past reported results, any such excluded items could be material, individually or in the aggregate, to the r epo rted results. 10 Total Deposits CET1 / RWA Net Interest Income Non -Interest Income (Adj.) 1 Non -Interest Expense (Adj.) 1, 2 Net Charge -Offs / Avg. Loans Provision for Loan Losses Effective Tax Rate 2026 Expectation as of 12/31/25 4% - 6% Growth 5% - 7% Growth 10.5% - 11.0% 11% - 13% Growth 6% - 9% Growth 3.0% - 4.5% Growth 0.15% - 0.20% $95mm - $115mm 23% - 24% 9/30/26 Update Above High End of Range At or Above High End of Range Middle of Range High End of Range At or Above High End of Range High End of Range High End of Range No Change, Growth Dependent ~20% for the Year
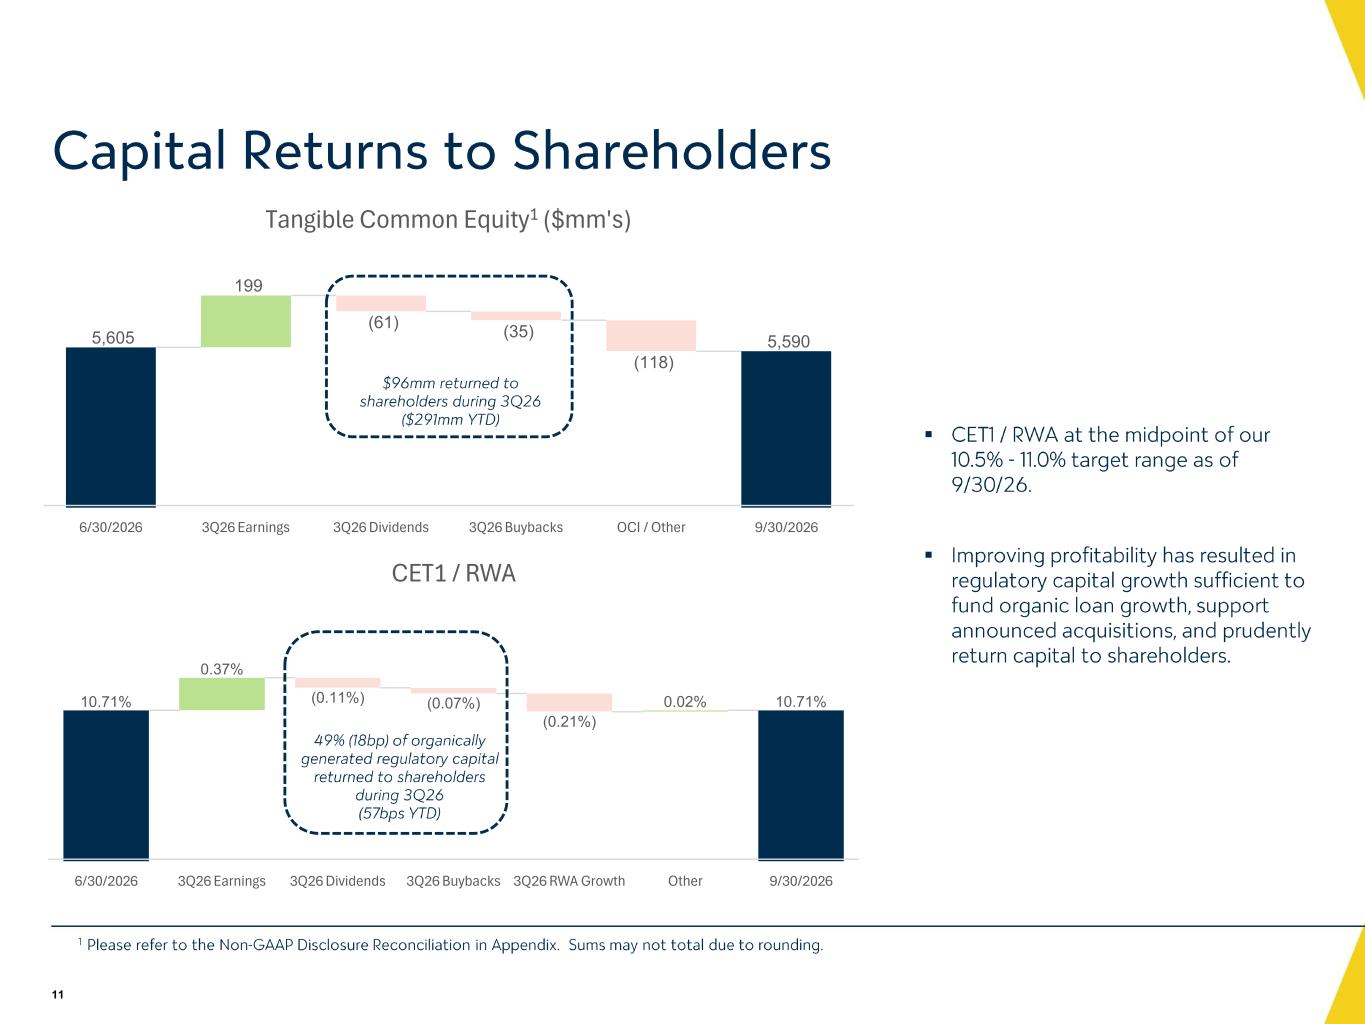
5,605 199 (61) (35) (118) 5,590 6/30/2026 3Q26 Earnings 3Q26 Dividends 3Q26 Buybacks OCI / Other 9/30/2026 Tangible Common Equity1 ($mm's) 10.71% 0.37% (0.11%) (0.07%) (0.21%) 0.02% 10.71% 6/30/2026 3Q26 Earnings 3Q26 Dividends 3Q26 Buybacks 3Q26 RWA Growth Other 9/30/2026 CET1 / RWA 11 Capital Returns to Shareholders $96mm returned to shareholders during 3Q26 ($291mm YTD) 49% (18bp) of organically generated regulatory capital returned to shareholders during 3Q26 (57bps YTD) ▪ CET1 / RWA at the midpoint of our 10.5% - 11.0% target range as of 9/30/26. ▪ Improving profitability has resulted in regulatory capital growth sufficient to fund organic loan growth, support announced acquisitions, and prudently return capital to shareholders. 1 Please refer to the Non -GAAP Disclosure Reconciliation in Appendix. Sums may not total due to rounding. Support- 3Q26 TCE Waterfall Support- 3Q26 CET1 Waterfall Support
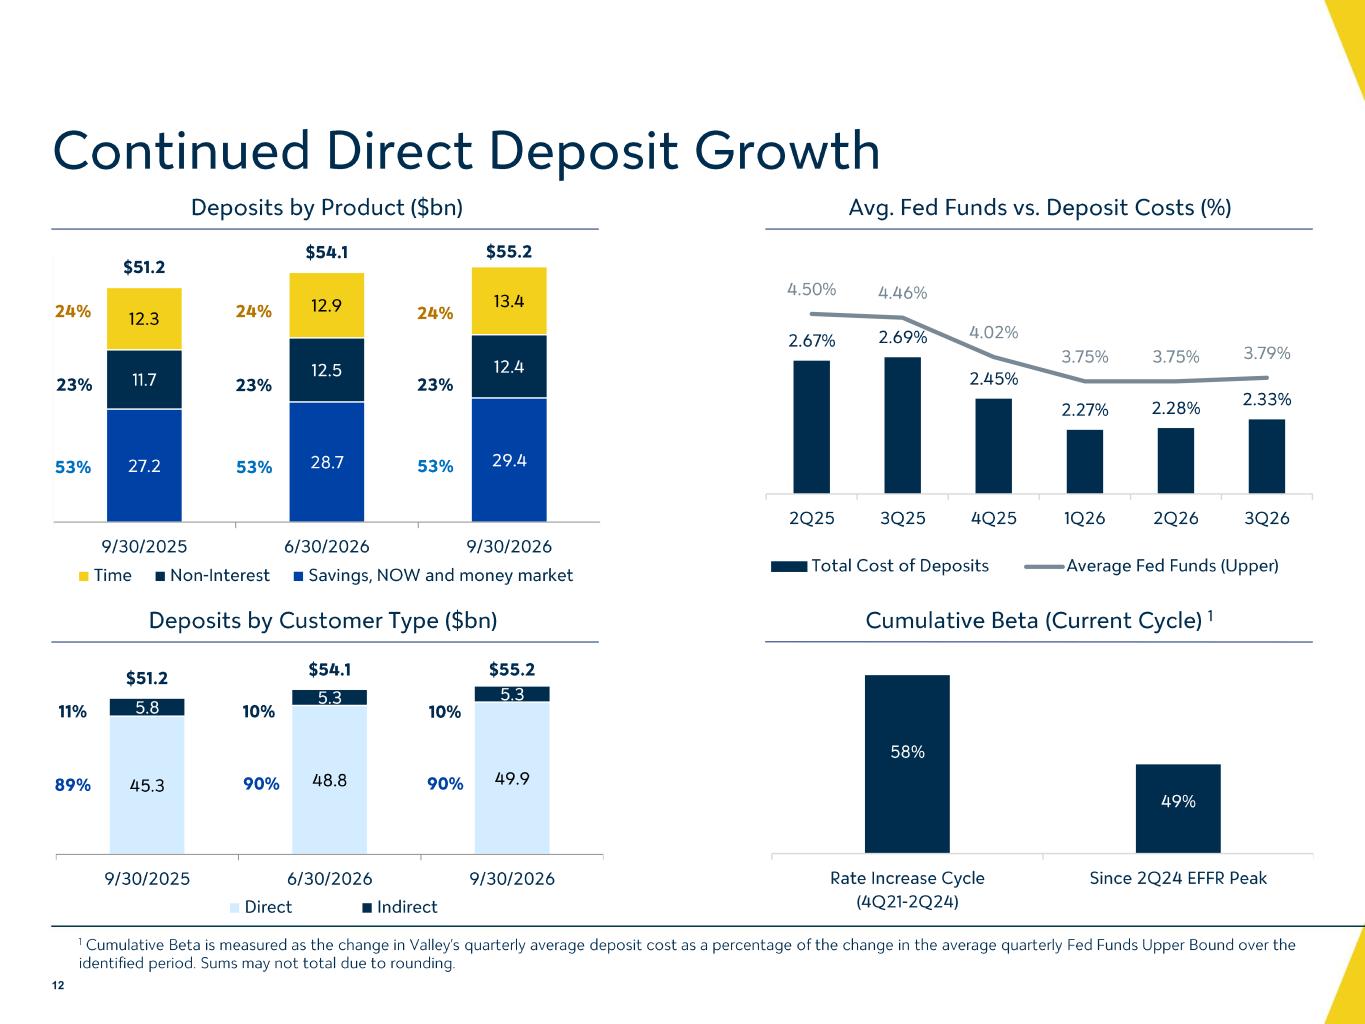
Continued Direct Deposit Growth 27.2 28.7 29.4 11.7 12.5 12.4 12.3 12.9 13.4 $51.2 $54.1 $55.2 9/30/2025 6/30/2026 9/30/2026 Time Non-Interest Savings, NOW and money market 24% 23% 53% 23% 53% 23% 24% 2.67% 2.69% 2.45% 2.27% 2.28% 2.33% 4.50% 4.46% 4.02% 3.75% 3.75% 3.79% 2Q25 3Q25 4Q25 1Q26 2Q26 3Q26 Total Cost of Deposits Average Fed Funds (Upper) Deposits by Product ($bn) 24% 53% Avg. Fed Funds vs. Deposit Costs (%) Cumulative Beta (Current Cycle) 1Deposits by Customer Type ($bn) 1 Cumulative Beta is measured as the change in Valley’s quarterly average deposit cost as a percentage of the change in the ave rage quarterly Fed Funds Upper Bound over the identified period. Sums may not total due to rounding. 12 58% 49% Rate Increase Cycle (4Q21-2Q24) Since 2Q24 EFFR Peak Source- Earnings Release in Workiva Source- Earnings Release in Workiva Brokered Deposits_2Q26 2Q26 Beta Support Calculation made using data from Workiva Calculation also shown in 2Q26 Beta Support 45.3 48.8 49.9 5.8 5.3 5.3 $51.2 $54.1 $55.2 9/30/2025 6/30/2026 9/30/2026 Direct Indirect 89% 90% 10%11% 90% 10%
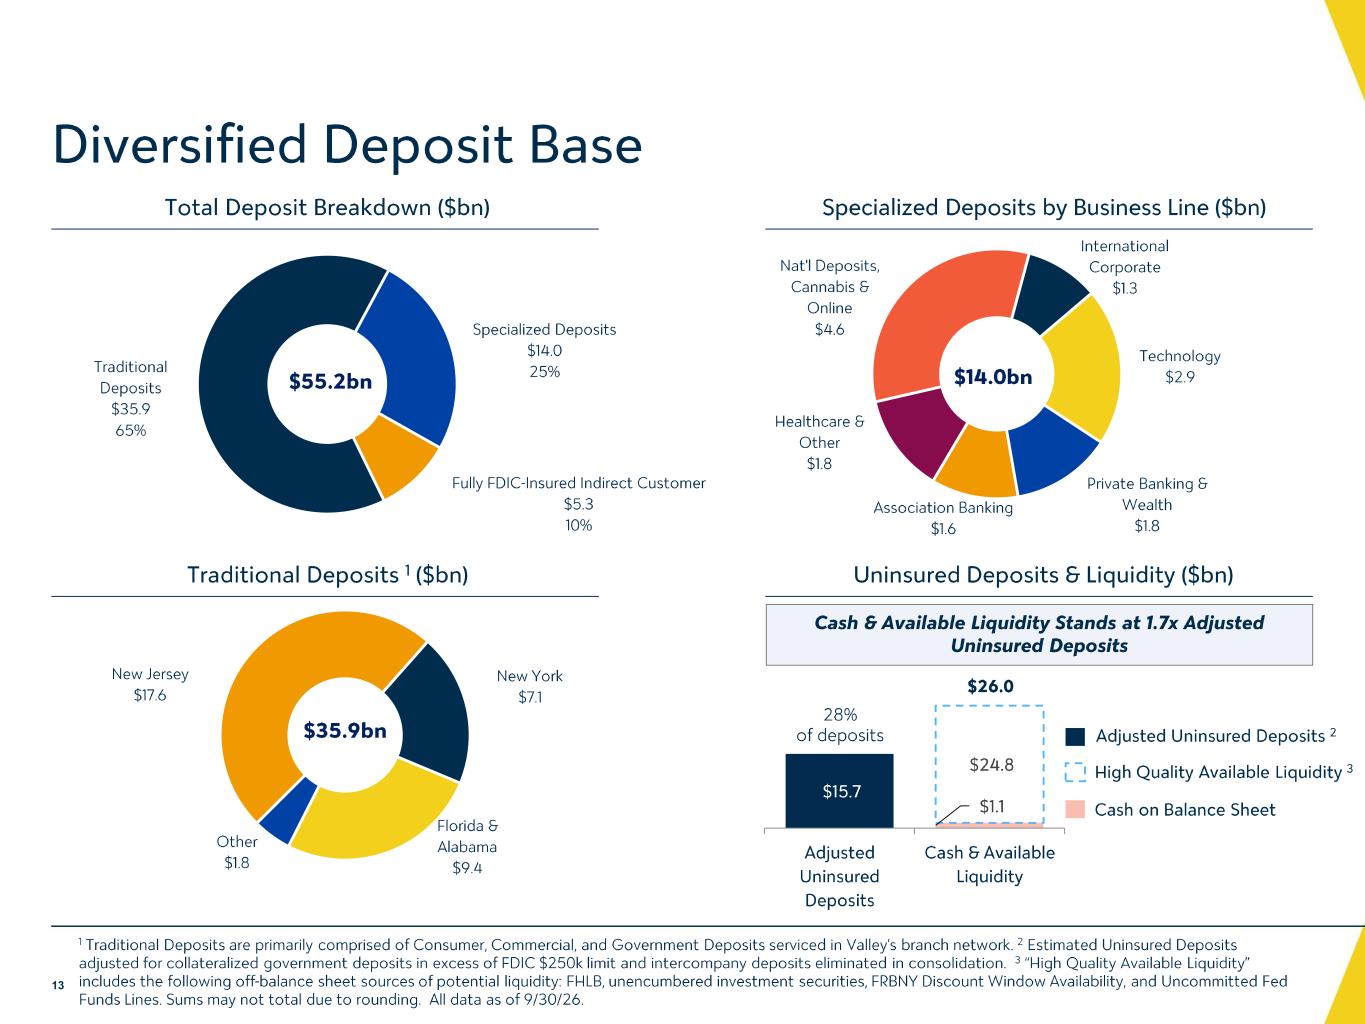
Traditional Deposits $35.9 65% Specialized Deposits $14.0 25% Fully FDIC -Insured Indirect Customer $5.3 10% $55.2bn New Jersey $17.6 New York $7.1 Florida & Alabama $9.4 Other $1.8 $3 5.9 bn Total Deposit Breakdown ($bn) Traditional Deposits 1 ($bn) Uninsured Deposits & Liquidity ($bn) $15.7 $1.1 $24.8 $26.0 Adjusted Uninsured Deposits Cash & Available Liquidity Cash on Balance Sheet High Quality Available Liquidity 3 Cash & Available Liquidity Stands at 1.7x Adjusted Uninsured Deposits Adjusted Uninsured Deposits 2 28 % of deposits Nat'l Deposits, Cannabis & Online $4.6 International Corporate $1.3 Technology $2.9 Private Banking & Wealth $1.8 Association Banking $1.6 Healthcare & Other $1.8 $14.0bn Specialized Deposits by Business Line ($bn) 1 Traditional Deposits are primarily comprised of Consumer, Commercial, and Government Deposits serviced in Valley’s branch net wor k. 2 Estimate d Uninsured Deposits adjusted for collateralized government deposits in excess of FDIC $250k limit and intercompany deposits eliminated in consoli dat ion . 3 “High Quality Available Liquidity” includes the following off -balance sheet sources of potential liquidity: FHLB, unencumbered investment securities, FRBNY Discoun t Window Availability, and Uncommitted Fed Funds Lines. Sums may not total due to rounding. All data as of 9/30/26. 13 Diversified Deposit Base Uninsured data comes from managed funding report, and cash on balance sheet comes from Workiva ER Deposit Charts Source- TL Deposit Tie Out
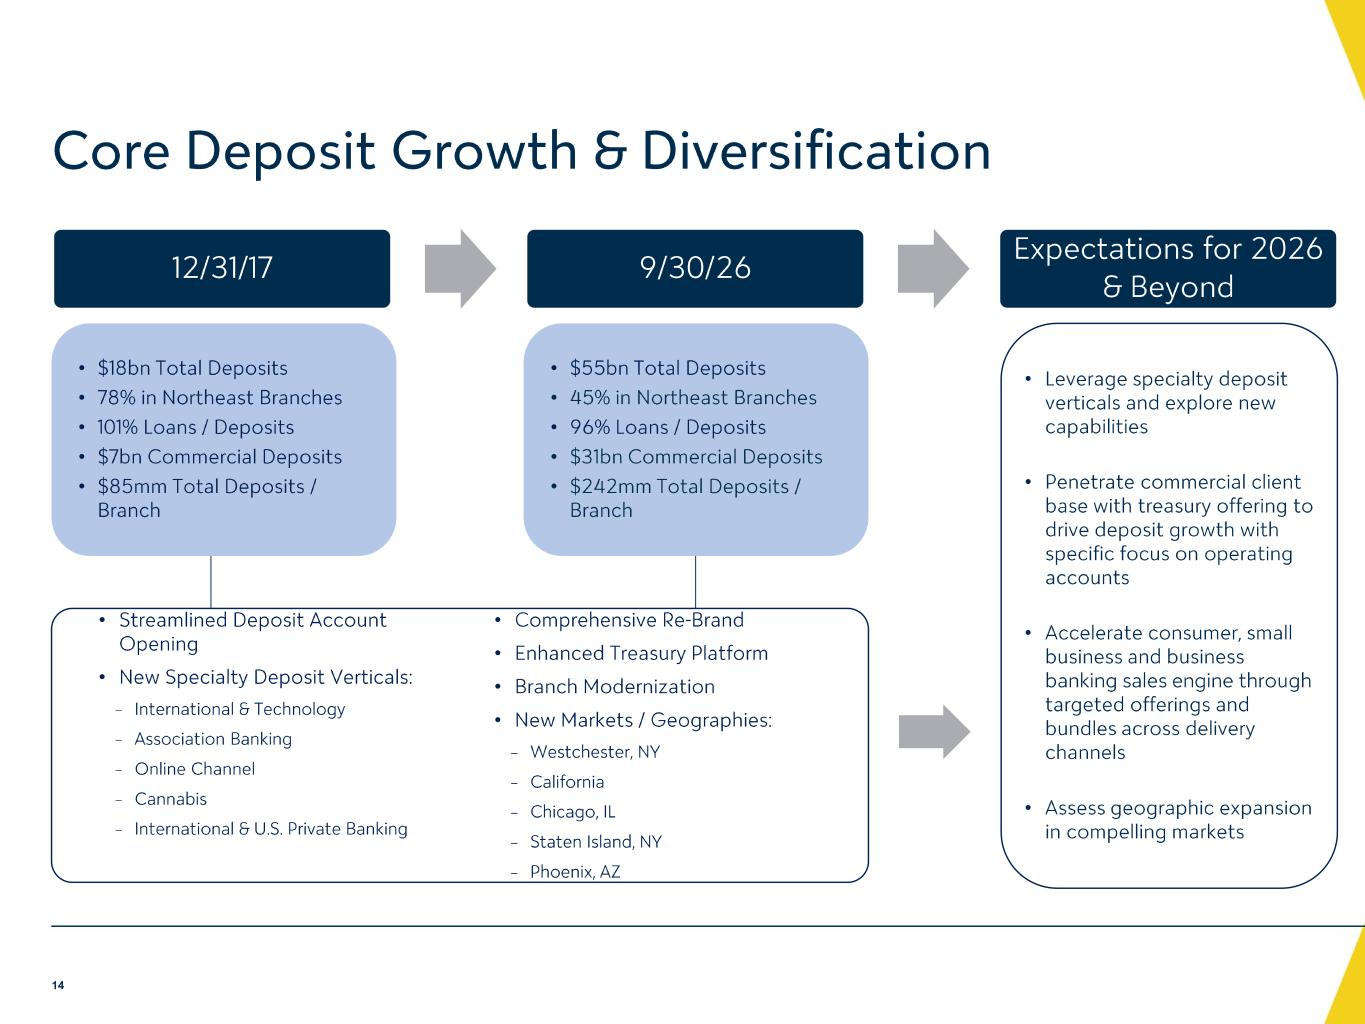
Core Deposit Growth & Diversification 12/31/17 9/30/26 Expectations for 2026 & Beyond • $18bn Total Deposits • 78% in Northeast Branches • 101% Loans / Deposits • $7bn Commercial Deposits • $85mm Total Deposits / Branch • $55bn Total Deposits • 45% in Northeast Branches • 96% Loans / Deposits • $31bn Commercial Deposits • $242mm Total Deposits / Branch • Streamlined Deposit Account Opening • New Specialty Deposit Verticals: − International & Technology − Association Banking − Online Channel − Cannabis − International & U.S. Private Banking • Comprehensive Re -Brand • Enhanced Treasury Platform • Branch Modernization • New Markets / Geographies: − Westchester, NY − California − Chicago, IL − Staten Island, NY − Phoenix, AZ • Leverage specialty deposit verticals and explore new capabilities • Penetrate commercial client base with treasury offering to drive deposit growth with specific focus on operating accounts • Accelerate consumer, small business and business banking sales engine through targeted offerings and bundles across delivery channels • Assess geographic expansion in compelling markets 14
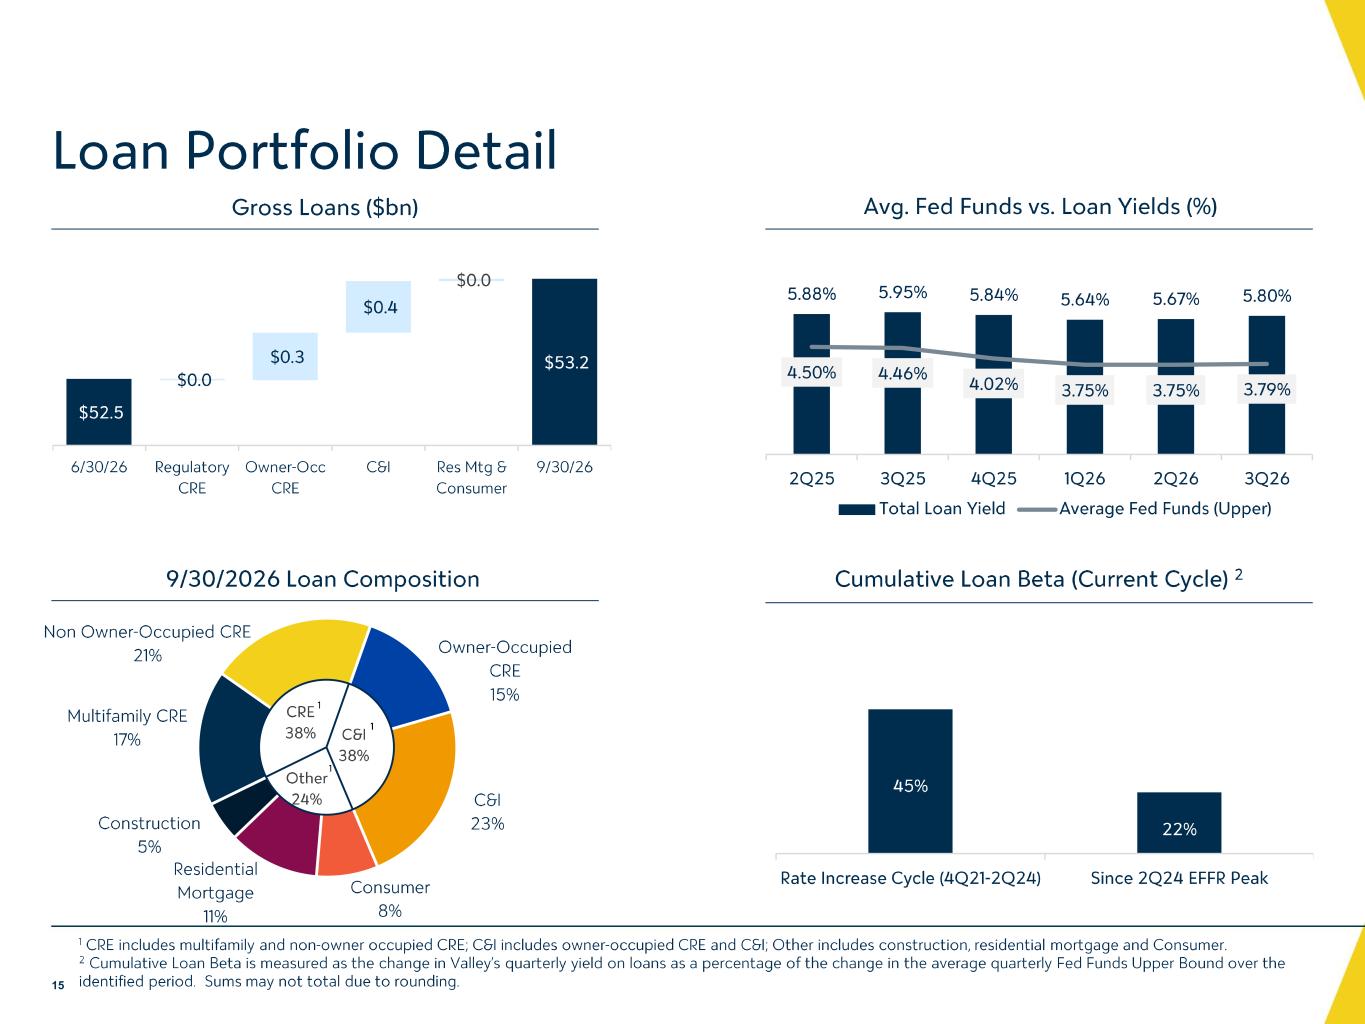
Multifamily CRE 17% Non Owner -Occupied CRE 21% Owner -Occupied CRE 15% C&I 23% Consumer 8% Residential Mortgage 11% Construction 5% CRE 38% C&I 38% Other 24% 9/30/2026 Loan Composition Loan Portfolio Detail Gross Loans ($bn) Avg. Fed Funds vs. Loan Yields (%) Cumulative Loan Beta (Current Cycle) 2 Avg. Fed Funds (Upper) Avg. Loan Yield Cumulative Beta 4Q21 0.25% 3.83% -- 4Q22 3.82% 5.20% 38% 4Q23 5.50% 6.10% 43% 1Q24 5.50% 6.14% 44% 2Q24 5.50% 6.17% 45% 3Q24 5.43% 6.28% 47% 4Q24 1 CRE includes multifamily and non -owner occupied CRE; C&I includes owner -occupied CRE and C&I; Other includes construction, resi dential mortgage and Consumer. 2 Cumulative Loan Beta is measured as the change in Valley’s quarterly yield on loans as a percentage of the change in the aver age quarterly Fed Funds Upper Bound over the identified period . Sums may not total due to rounding.15 $52.5 $53.2 $0.0 $0.3 $0.4 $0.0 6/30/26 Regulatory CRE Owner-Occ CRE C&I Res Mtg & Consumer 9/30/26 Source- “Loan Balances- 5 Quarter Trend_2Q26_FINAL” 45% 22% Rate Increase Cycle (4Q21-2Q24) Since 2Q24 EFFR Peak Source- “Loan Balances – 5 Quarter Trend_2Q26_FINAL” Regulatory CRE comes from the CRE concentration support file 5.88% 5.95% 5.84% 5.64% 5.67% 5.80% 4.50% 4.46% 4.02% 3.75% 3.75% 3.79% 2Q25 3Q25 4Q25 1Q26 2Q26 3Q26 Total Loan Yield Average Fed Funds (Upper) Workiva- loan yield Calculation for avg fed funds upper 2Q26 Beta Support1 1 1
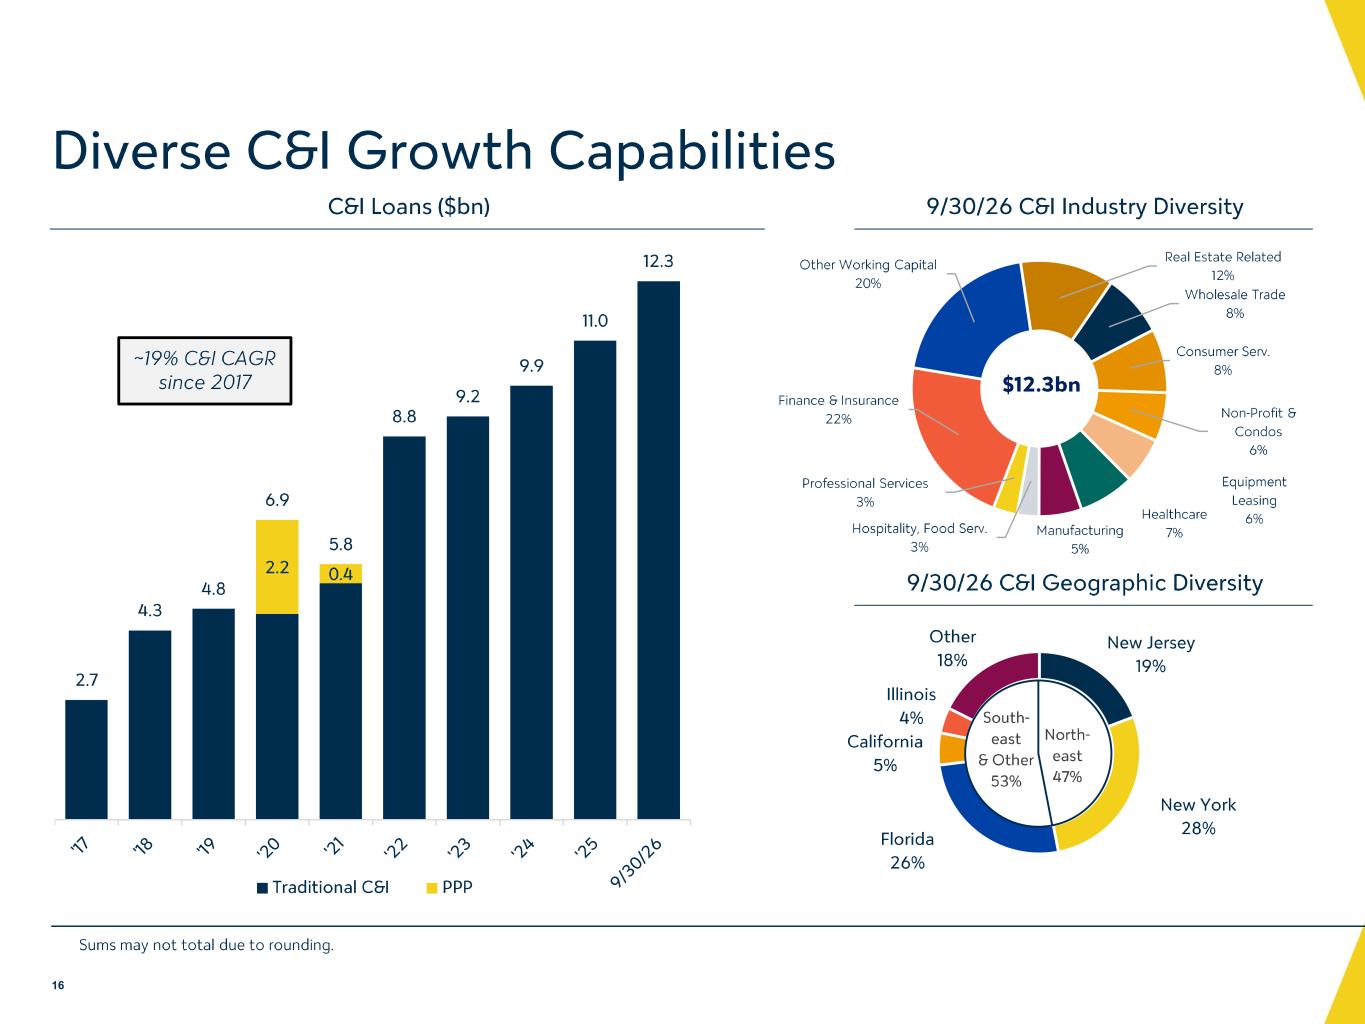
New Jersey 19% New York 28% Florida 26% California 5% Illinois 4% Other 18% North - east 47% South - east & Other 53% Diverse C&I Growth Capabilities 2.2 0.4 2.7 4.3 4.8 6.9 5.8 8.8 9.2 9.9 11.0 12.3 Traditional C&I PPP ~19% C&I CAGR since 2017 Source- “Loan Balances- 5 Quarter Trend_2Q26_FINAL” Source- “Summary_HC” 16 9/30/26 C&I Industry Diversity 9/30/26 C&I Geographic Diversity C&I Loans ($bn) Finance & Insurance 22% Other Working Capital 20% Real Estate Related 12% Wholesale Trade 8% Consumer Serv. 8% Non -Profit & Condos 6% Equipment Leasing 6%Healthcare 7%Manufacturing 5% Hospitality, Food Serv. 3% Professional Services 3% $12.3bn Source- “Commercial Portfolio by Industry- 3.31.26” Sums may not total due to rounding.
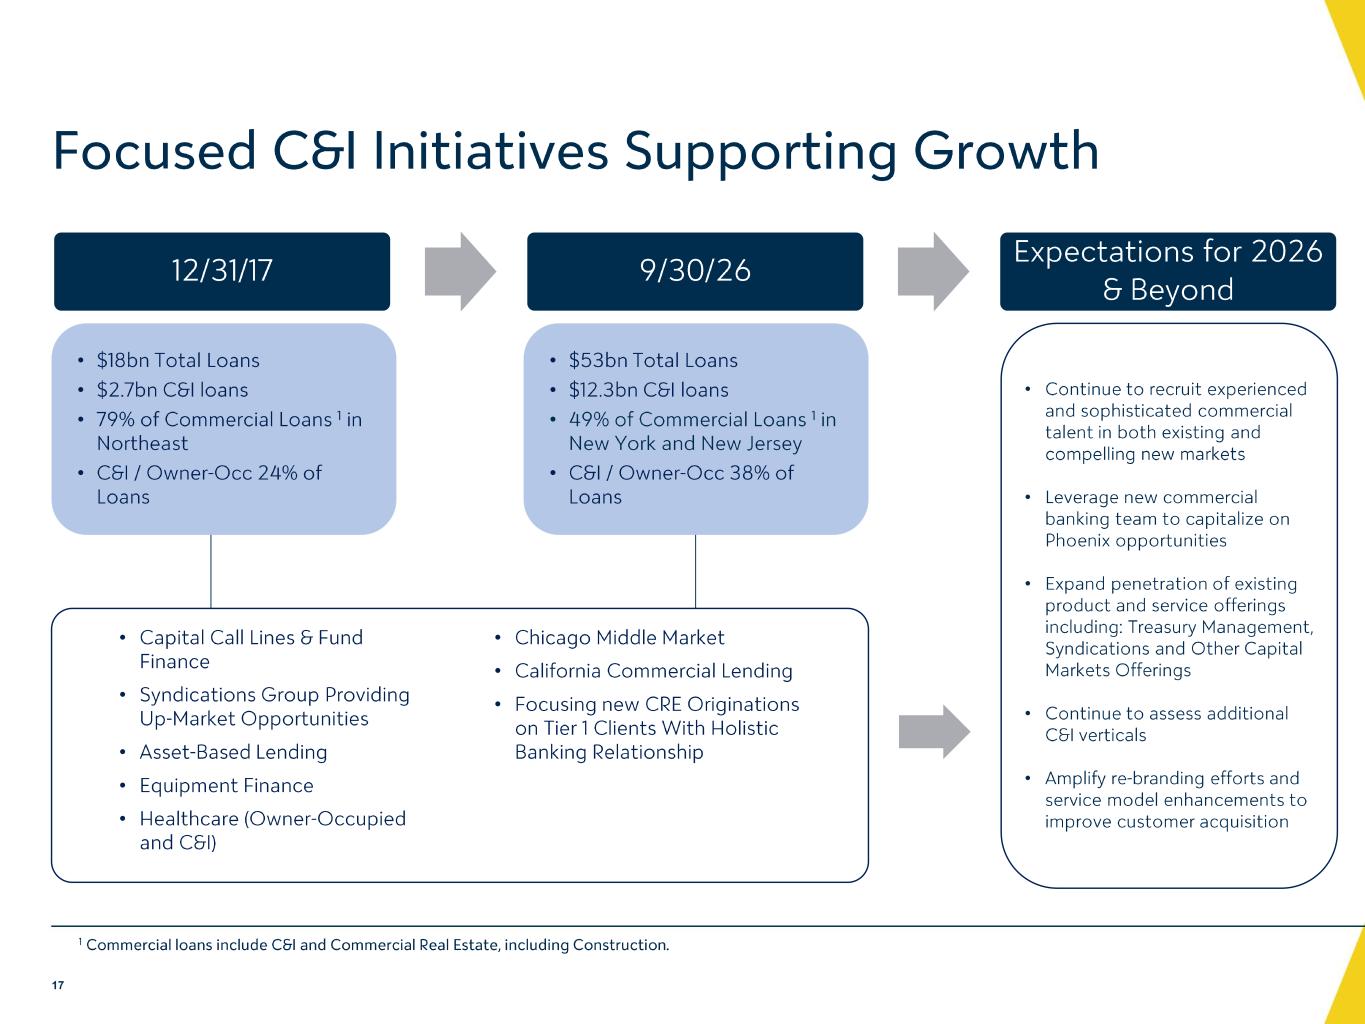
• $18bn Total Loans • $2.7bn C&I loans • 79% of Commercial Loans 1 in Northeast • C&I / Owner -Occ 24% of Loans • $53bn Total Loans • $12.3bn C&I loans • 49% of Commercial Loans 1 in New York and New Jersey • C&I / Owner -Occ 38% of Loans Focused C&I Initiatives Supporting Growth • Capital Call Lines & Fund Finance • Syndications Group Providing Up -Market Opportunities • Asset -Based Lending • Equipment Finance • Healthcare (Owner -Occupied and C&I) • Chicago Middle Market • California Commercial Lending • Focusing new CRE Originations on Tier 1 Clients With Holistic Banking Relationship 12/31/17 9/30/26 Expectations for 2026 & Beyond • Continue to recruit experienced and sophisticated commercial talent in both existing and compelling new markets • Leverage new commercial banking team to capitalize on Phoenix opportunities • Expand penetration of existing product and service offerings including: Treasury Management, Syndications and Other Capital Markets Offerings • Continue to assess additional C&I verticals • Amplify re -branding efforts and service model enhancements to improve customer acquisition 17 1 Commercial loans include C&I and Commercial Real Estate, including Construction.
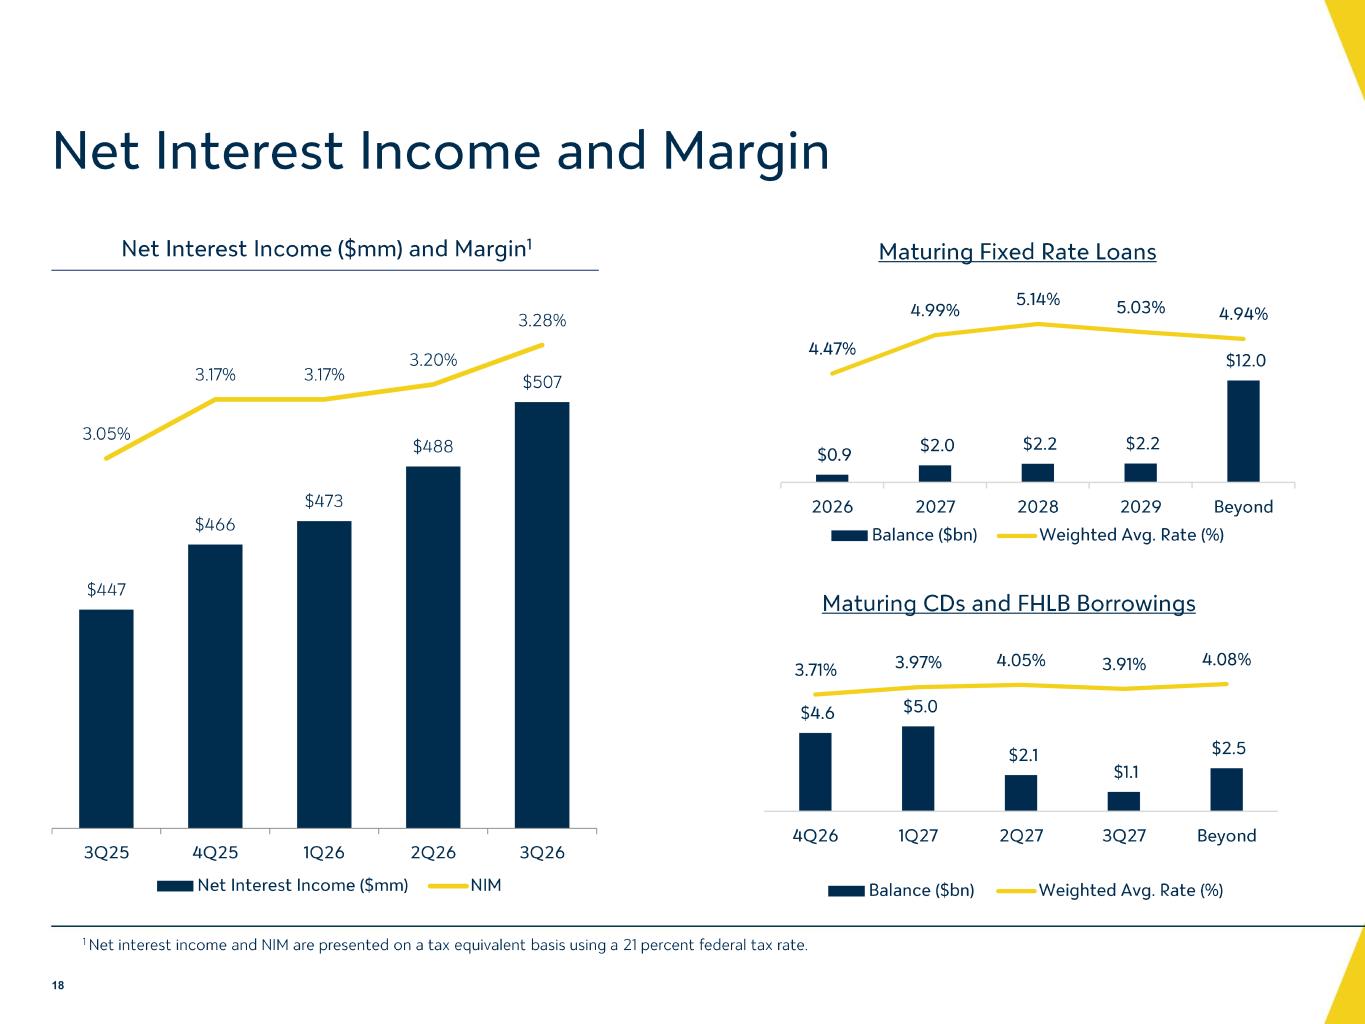
Net Interest Income ($mm) and Margin 1 $447 $466 $473 $488 $507 3.05% 3.17% 3.17% 3.20% 3.28% 3Q25 4Q25 1Q26 2Q26 3Q26 Net Interest Income ($mm) NIM $4.6 $5.0 $2.1 $1.1 $2.5 3.71% 3.97% 4.05% 3.91% 4.08% 4Q26 1Q27 2Q27 3Q27 Beyond Maturing CDs and FHLB Borrowings Balance ($bn) Weighted Avg. Rate (%) Net Interest Income and Margin 1 Net interest income and NIM are presented on a tax equivalent basis using a 21 percent federal tax rate. 18 Workiva “CD Runoff_0630 $0.9 $2.0 $2.2 $2.2 $12.0 4.47% 4.99% 5.14% 5.03% 4.94% 2026 2027 2028 2029 Beyond Maturing Fixed Rate Loans Balance ($bn) Weighted Avg. Rate (%) “Loan Reset 0630_CAL&Highlighted Updated
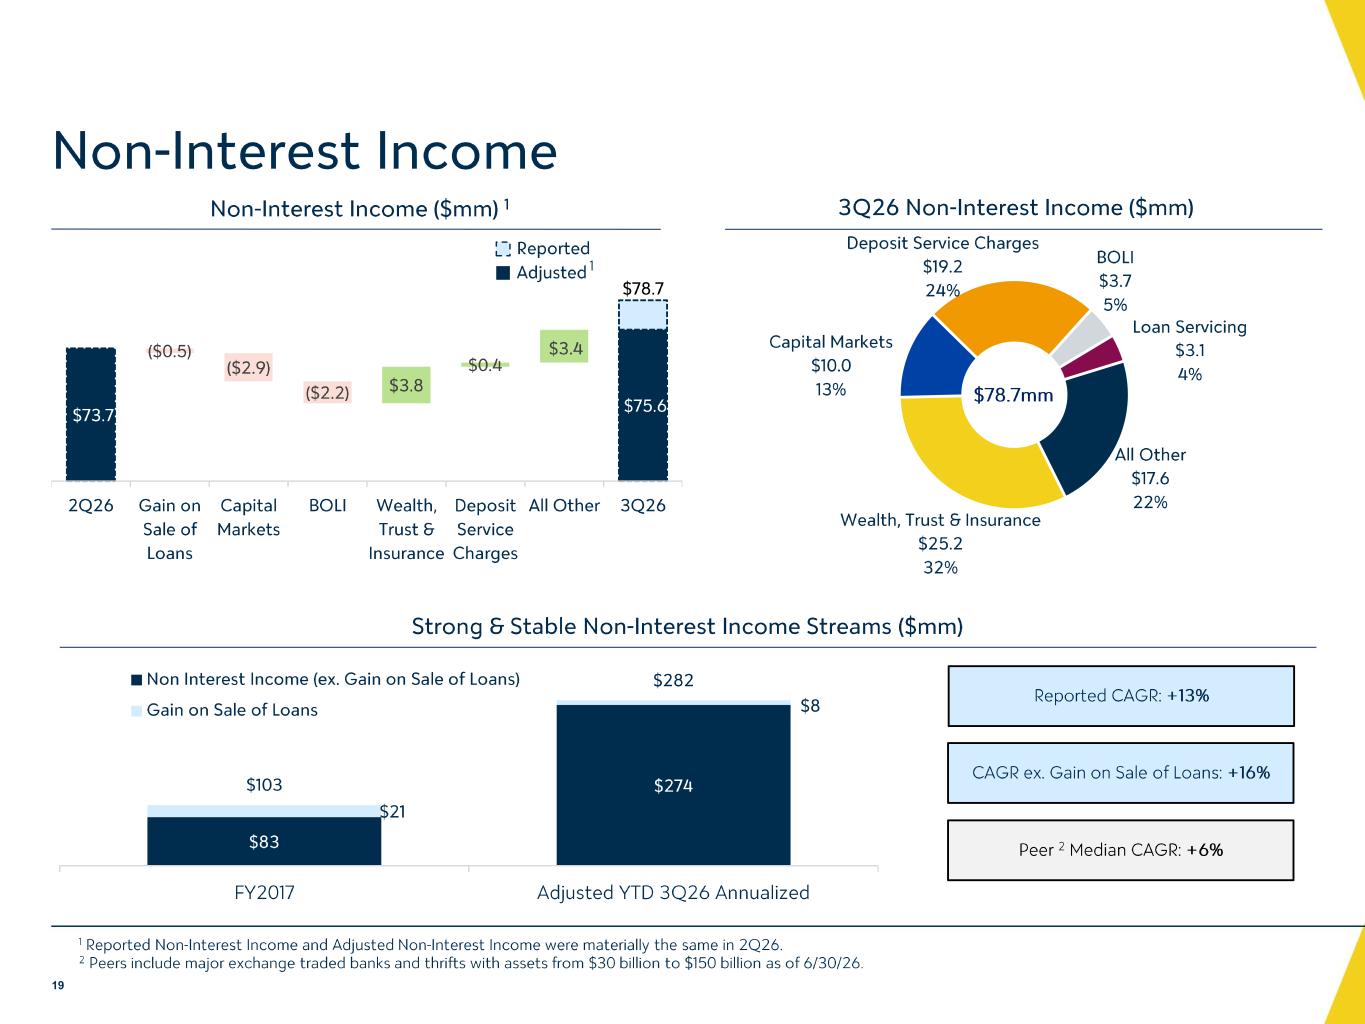
All Other $17.6 22% Wealth, Trust & Insurance $25.2 32% Capital Markets $10.0 13% Deposit Service Charges $19.2 24% BOLI $3.7 5% Loan Servicing $3.1 4% $78.7mm Non -Interest Income 19 Strong & Stable Non -Interest Income Streams ($mm) $73.7 $75.6 ($0.5 ) ($2.9 ) ($2.2 ) $3.8 $0.4 $3.4 2Q26 Gain on Sale of Loans Capital Markets BOLI Wealth, Trust & Insurance Deposit Service Charges All Other 3Q26 Workiva Workiva 3Q26 Non -Interest Income ($mm) $83 $274 $21 $8 $103 $282 FY2017 Adjusted YTD 3Q26 Annualized Non Interest Income (ex. Gain on Sale of Loans) Gain on Sale of Loans CAGR ex. Gain on Sale of Loans: +16% 1 Reported Non -Interest Income and Adjusted Non -Interest Income were materially the same in 2Q26 . 2 Peers include major exchange traded banks and thrifts with assets from $30 billion to $150 billion as of 6/30/26. “Fee Income CAGR Support” Reported CAGR: +13% Peer 2 Median CAGR: +6% Non -Interest Income ($mm) 1 Non -Interest Income ($ mm) 1 $78.7 Adjusted Reported 1
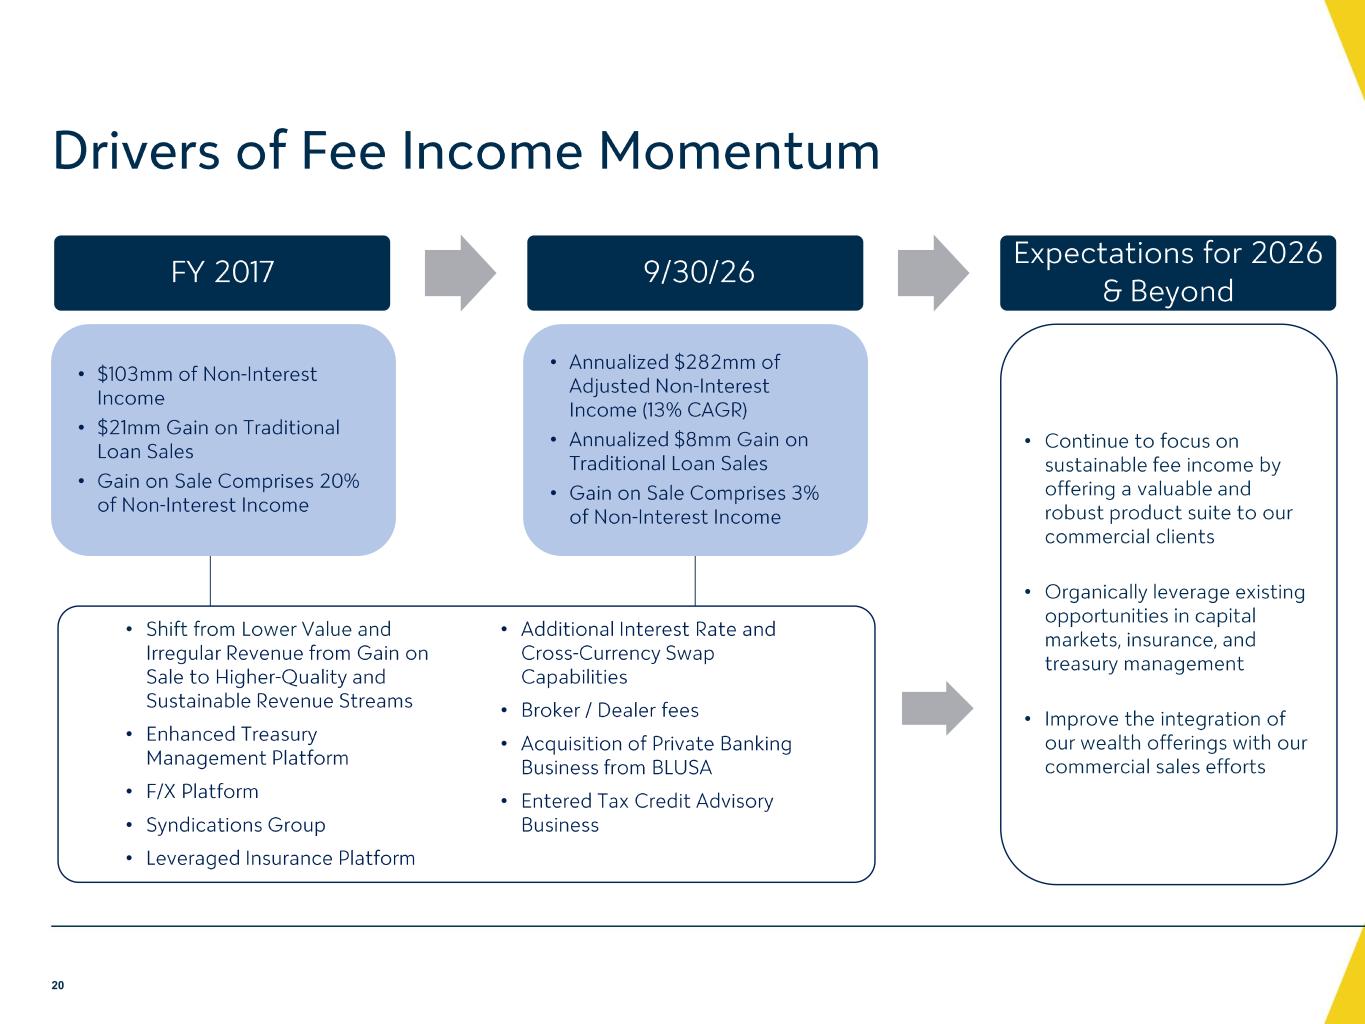
Drivers of Fee Income Momentum 20 Workiva Workiva • Continue to focus on sustainable fee income by offering a valuable and robust product suite to our commercial clients • Organically leverage existing opportunities in capital markets, insurance, and treasury management • Improve the integration of our wealth offerings with our commercial sales efforts FY 2017 9/30/26 Expectations for 2026 & Beyond • Shift from Lower Value and Irregular Revenue from Gain on Sale to Higher -Quality and Sustainable Revenue Streams • Enhanced Treasury Management Platform • F/X Platform • Syndications Group • Leveraged Insurance Platform • Additional Interest Rate and Cross -Currency Swap Capabilities • Broker / Dealer fees • Acquisition of Private Banking Business from BLUSA • Entered Tax Credit Advisory Business • Annualized $282mm of Adjusted Non -Interest Income (13% CAGR) • Annualized $8mm Gain on Traditional Loan Sales • Gain on Sale Comprises 3% of Non -Interest Income • $103mm of Non -Interest Income • $21mm Gain on Traditional Loan Sales • Gain on Sale Comprises 20% of Non -Interest Income
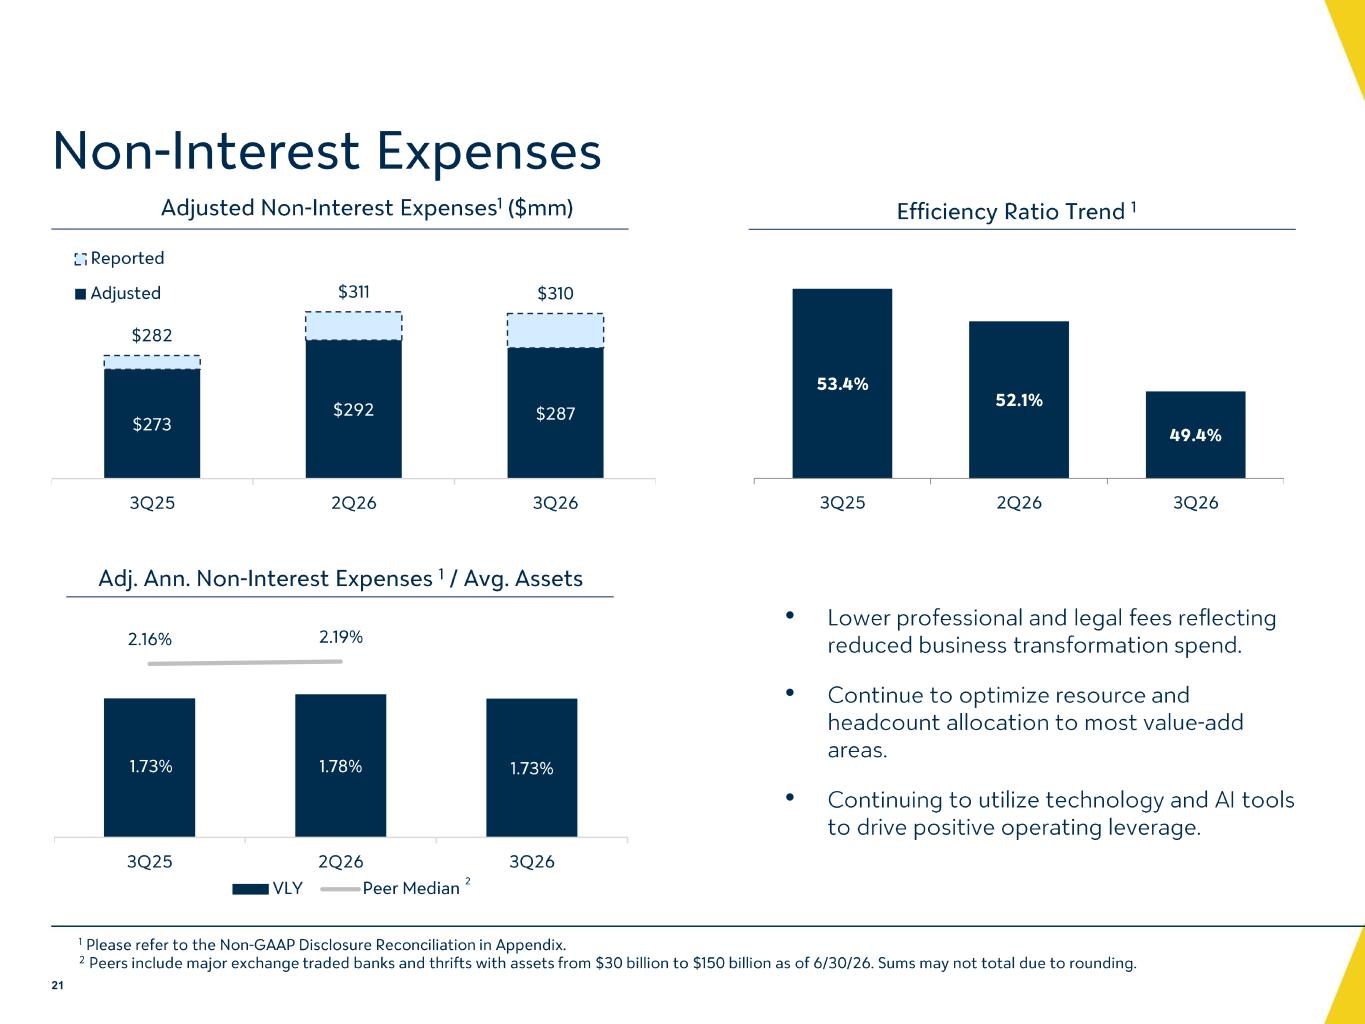
Adjusted Non -Interest Expenses 1 ($mm) • Lower professional and legal fees reflecting reduced business transformation spend. • Continue to optimize resource and headcount allocation to most value -add areas. • Continuing to utilize technology and AI tools to drive positive operating leverage. Non -Interest Expenses 1 Please refer to the Non -GAAP Disclosure Reconciliation in Appendix. 2 Peers include major exchange traded banks and thrifts with assets from $30 billion to $150 billion as of 6/30/26. Sums may no t total due to rounding. 21 Workiva Workiva 1.73% 1.78% 1.73% 2.16% 2.19% 3Q25 2Q26 3Q26 VLY Peer Median Adj. Ann. Non -Interest Expenses 1 / Avg. Assets Efficiency Ratio Trend 1 53.4% 52.1% 49.4% 3Q25 2Q26 3Q26 2 Workiva $273 $292 $287 $282 $311 $310 3Q25 2Q26 3Q26 Reported Adjusted
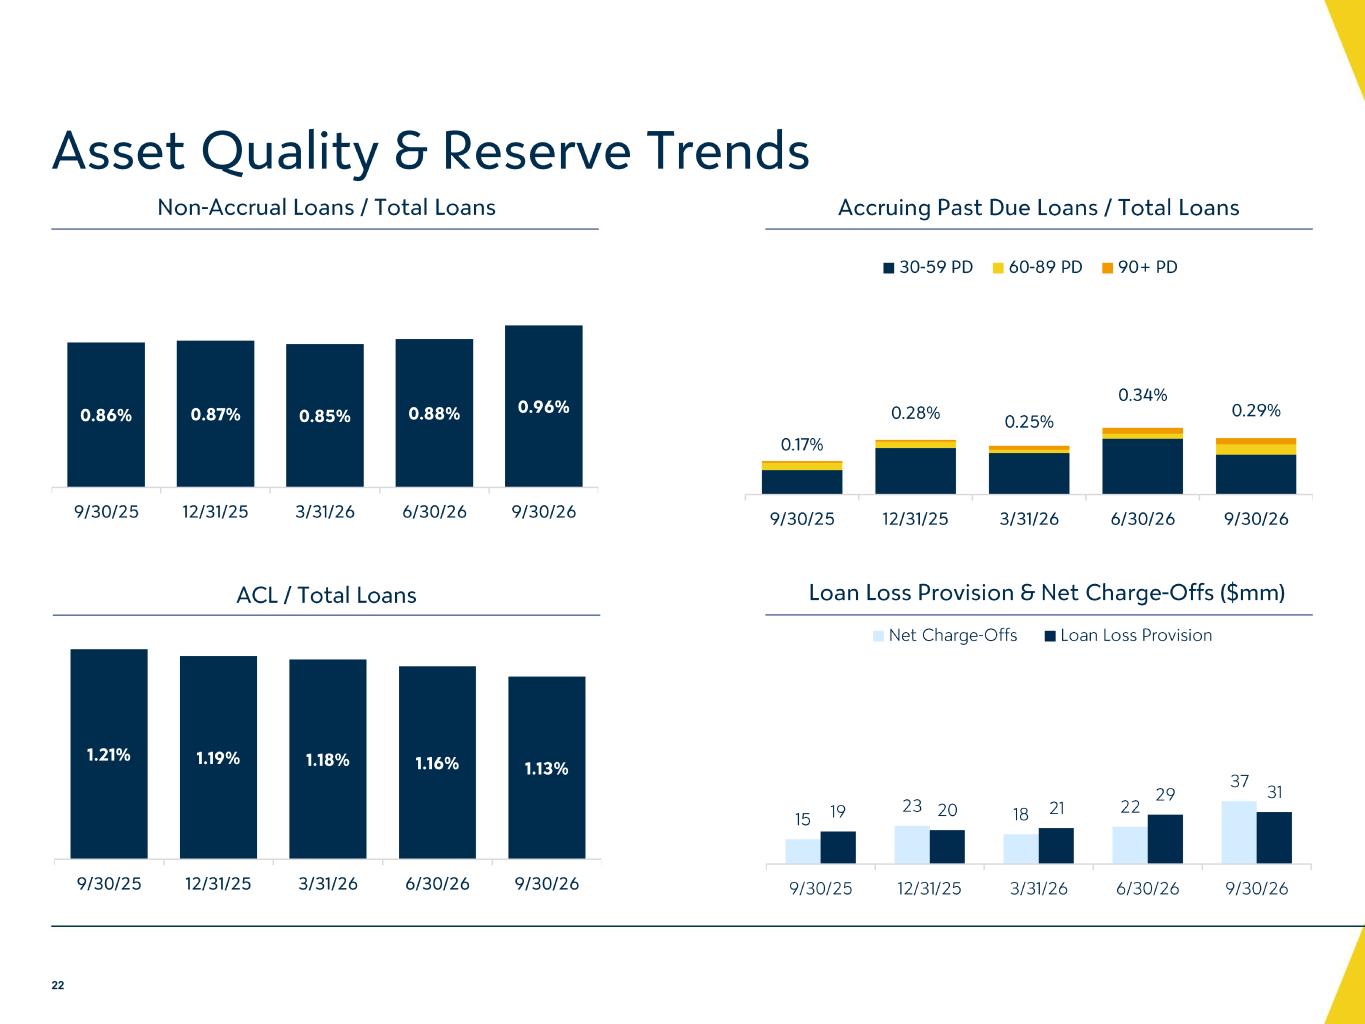
Non -Accrual Loans / Total Loans 0.99 % 1.03 % Accruing Past Due Loans / Total Loans Asset Quality & Reserve Trends 22 ACL / Total Loans 0.86% 0.87% 0.85% 0.88% 0.96% 9/30/25 12/31/25 3/31/26 6/30/26 9/30/26 0.17% 0.28% 0.25% 0.34% 0.29% 9/30/25 12/31/25 3/31/26 6/30/26 9/30/26 30-59 PD 60-89 PD 90+ PD 1.21% 1.19% 1.18% 1.16% 1.13% 9/30/25 12/31/25 3/31/26 6/30/26 9/30/26 15 23 18 22 37 19 20 21 29 31 9/30/25 12/31/25 3/31/26 6/30/26 9/30/26 Net Charge-Offs Loan Loss Provision Loan Loss Provision & Net Charge -Offs ($mm) Workiva Workiva Workiva / KEITH Chargeoff's and Recoveries - 5 Quarter Trend_Draft_2Q26_Final Workiva / KEITH 5-Quarter Trend (2Q26)_Final
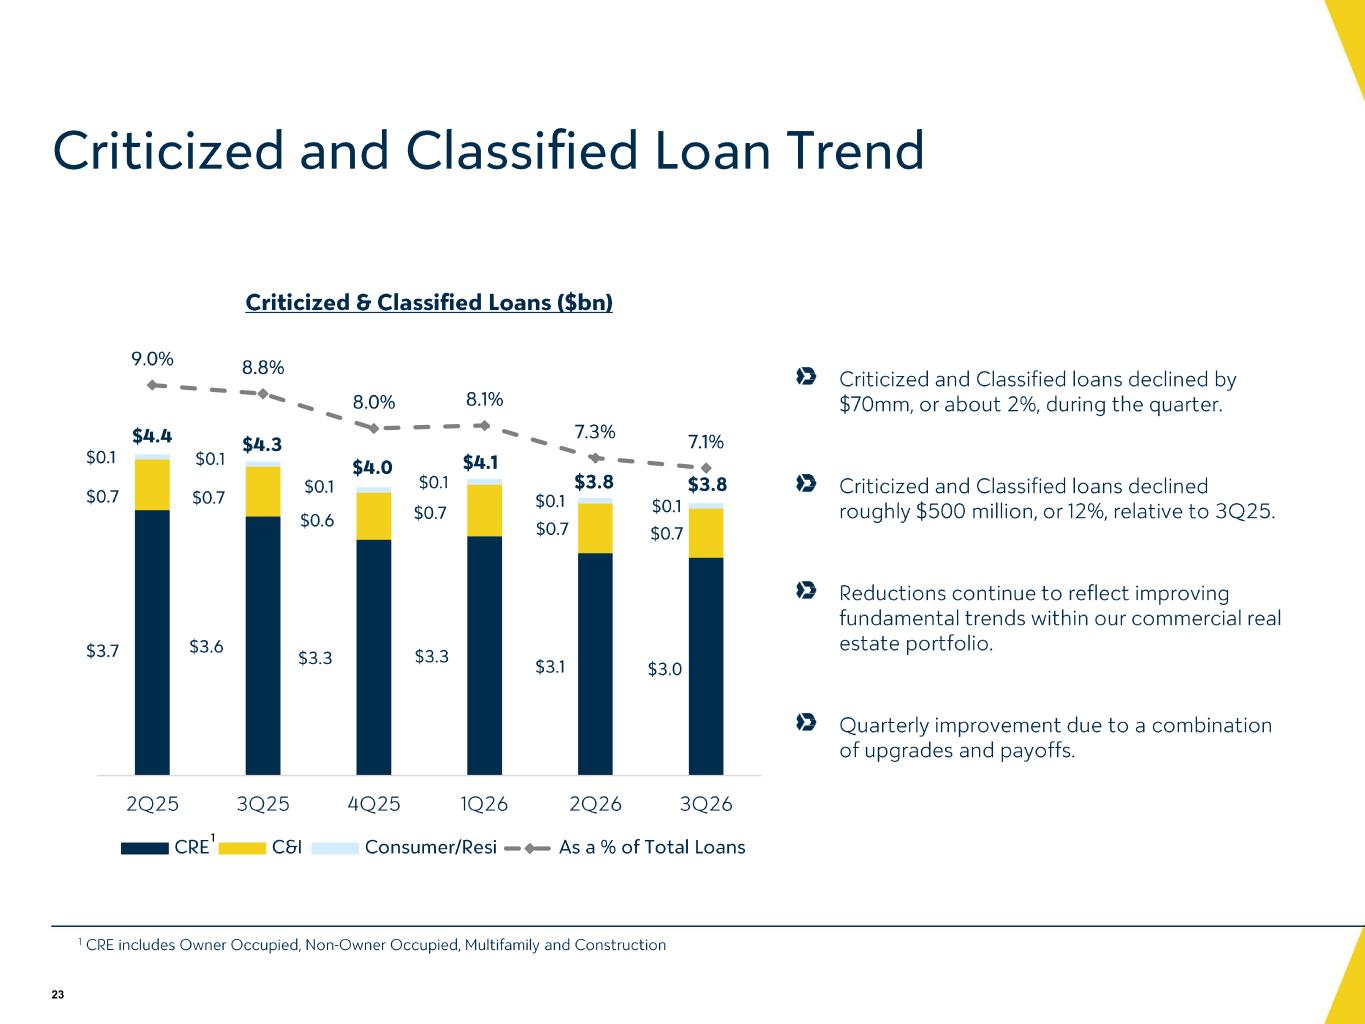
23 Criticized and Classified Loan Trend Criticized and Classified loans declined by $70mm, or about 2%, during the quarter. Criticized and Classified loans declined roughly $500 million, or 12%, relative to 3Q25. Reductions continue to reflect improving fundamental trends within our commercial real estate portfolio. Quarterly improvement due to a combination of upgrades and payoffs. $3.7 $3.6 $3.3 $3.3 $3.1 $3.0 $0.7 $0.7 $0.6 $0.7 $0.7 $0.7 $0.1 $0.1 $0.1 $0.1 $0.1 $0.1 9.0% 8.8% 8.0% 8.1% 7.3% 7.1% 2Q25 3Q25 4Q25 1Q26 2Q26 3Q26 Criticized & Classified Loans ($bn) CRE C&I Consumer/Resi As a % of Total Loans $4.1$4.0 $4.3 $3.8 $4.4 “Cited Asset Analysis summary- 06.30.2026” $3.8 1 CRE includes Owner Occupied, Non -Owner Occupied, Multifamily and Construction 1
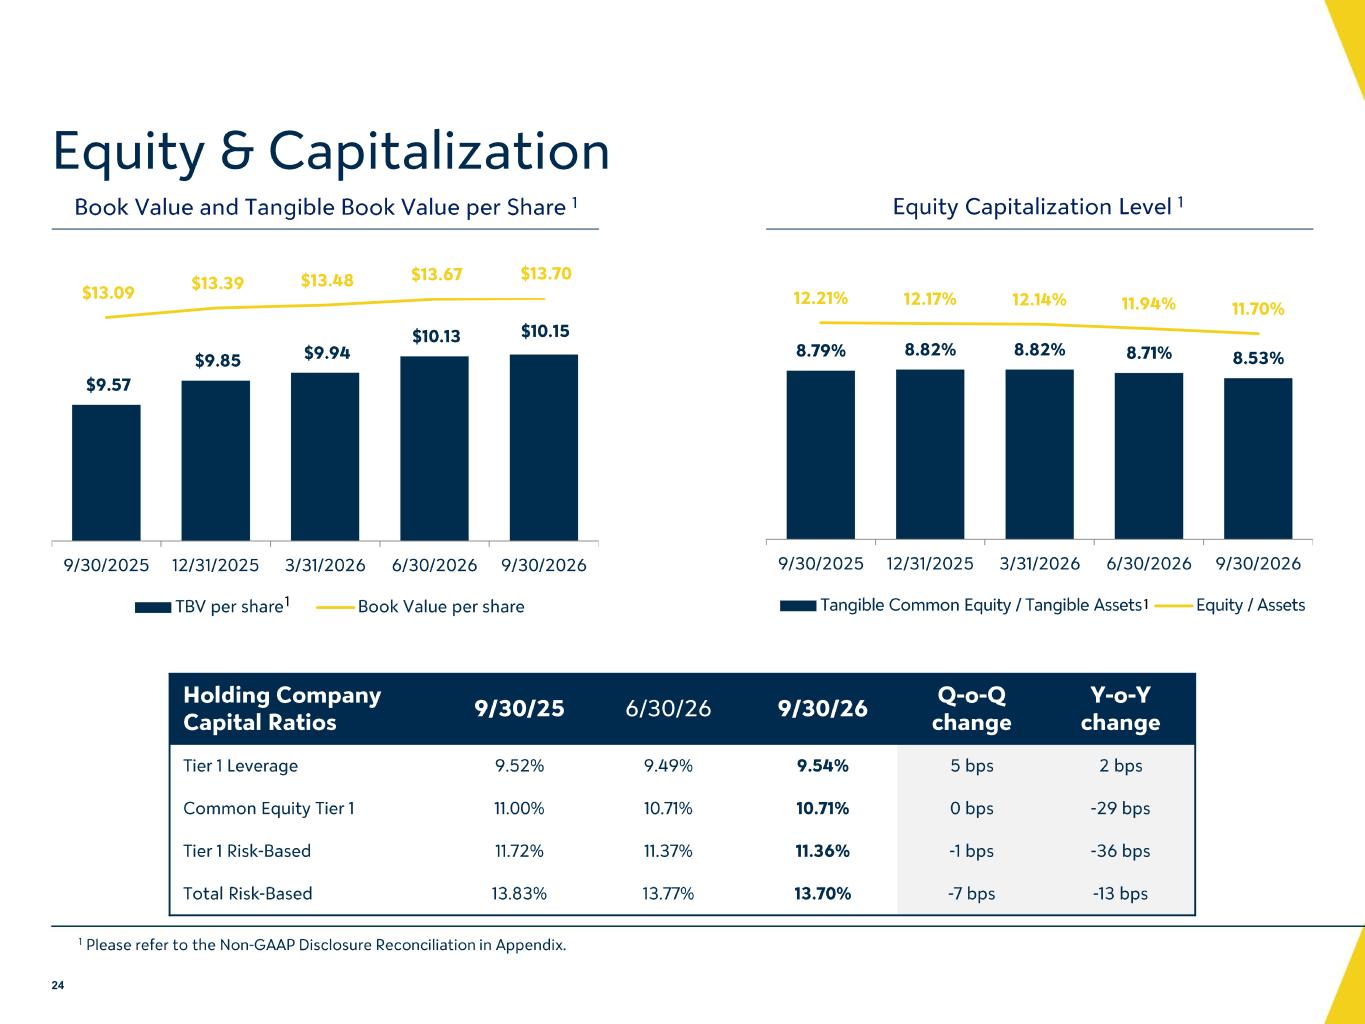
$9.57 $9.85 $9.94 $10.13 $10.15 $13.09 $13.39 $13.48 $13.67 $13.70 9/30/2025 12/31/2025 3/31/2026 6/30/2026 9/30/2026 TBV per share Book Value per share Book Value and Tangible Book Value per Share 1 Equity Capitalization Level 1 8.79% 8.82% 8.82% 8.71% 8.53% 12.21% 12.17% 12.14% 11.94% 11.70% 9/30/2025 12/31/2025 3/31/2026 6/30/2026 9/30/2026 Tangible Common Equity / Tangible Assets Equity / Assets Holding Company Capital Ratios 9/30/25 6/30/26 9/30/26 Q -o-Q change Y -o-Y change Tier 1 Leverage 9.52% 9.49% 9.54% 5 bps 2 bps Common Equity Tier 1 11.00% 10.71% 10.71% 0 bps -29 bps Tier 1 Risk -Based 11.72% 11.37% 11.36% -1 bps -36 bps Total Risk -Based 13.83% 13.77% 13.70% -7 bps -13 bps 1 Equity & Capitalization 1 Please refer to the Non -GAAP Disclosure Reconciliation in Appendix. 24 Workiva Workiva Workiva 1

APPENDIX
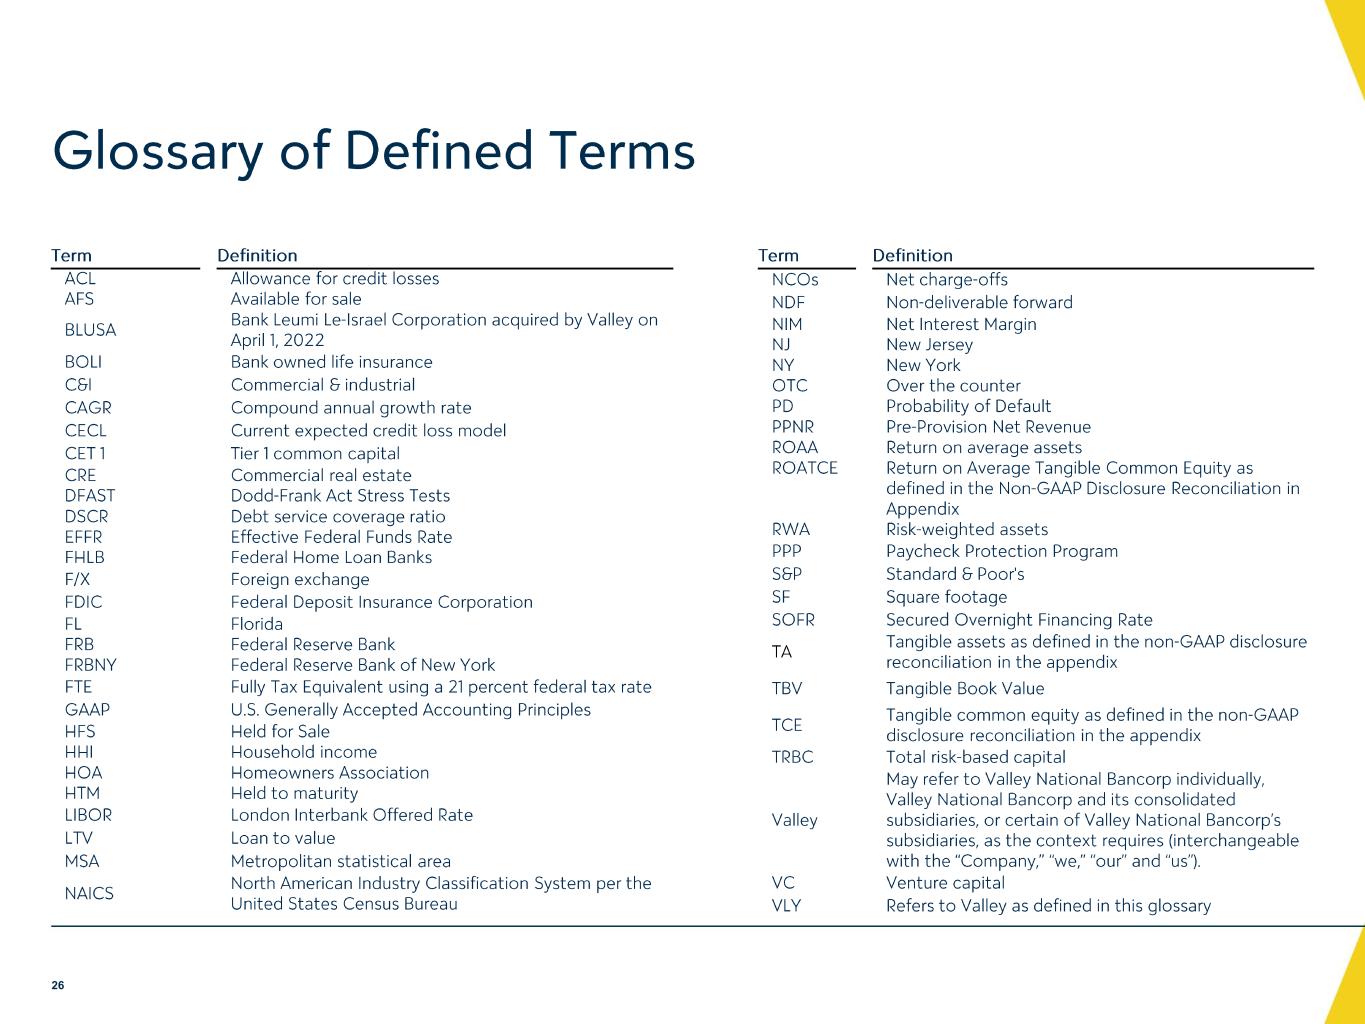
Term Definition ACL AFS Allowance for credit losses Available for sale BLUSA Bank Leumi Le -Israel Corporation acquired by Valley on April 1, 2022 BOLI Bank owned life insurance C&I Commercial & industrial CAGR Compound annual growth rate CECL Current expected credit loss model CET 1 Tier 1 common capital CRE DFAST Commercial real estate Dodd -Frank Act Stress Tests DSCR EFFR FHLB Debt service coverage ratio Effective Federal Funds Rate Federal Home Loan Banks F/X Foreign exchange FDIC Federal Deposit Insurance Corporation FL FRB FRBNY Florida Federal Reserve Bank Federal Reserve Bank of New York FTE Fully Tax Equivalent using a 21 percent federal tax rate GAAP U.S. Generally Accepted Accounting Principles HFS HHI Held for Sale Household income HOA HTM Homeowners Association Held to maturity LIBOR London Interbank Offered Rate LTV Loan to value MSA Metropolitan statistical area NAICS North American Industry Classification System per the United States Census Bureau Term Definition NCOs Net charge -offs NDF Non -deliverable forward NIM NJ NY OTC PD Net Interest Margin New Jersey New York Over the counter Probability of Default PPNR ROAA ROATCE RWA Pre -Provision Net Revenue Return on average assets Return on Average Tangible Common Equity as defined in the Non -GAAP Disclosure Reconciliation in Appendix Risk -weighted assets PPP Paycheck Protection Program S&P Standard & Poor's SF Square footage SOFR Secured Overnight Financing Rate TA Tangible assets as defined in the non -GAAP disclosure reconciliation in the appendix TBV Tangible Book Value TCE Tangible common equity as defined in the non -GAAP disclosure reconciliation in the appendix TRBC Total risk -based capital Valley May refer to Valley National Bancorp individually, Valley National Bancorp and its consolidated subsidiaries, or certain of Valley National Bancorp’s subsidiaries, as the context requires (interchangeable with the “Company,” “we,” “our” and “us”). VC Venture capital VLY Refers to Valley as defined in this glossary Glossary of Defined Terms 26
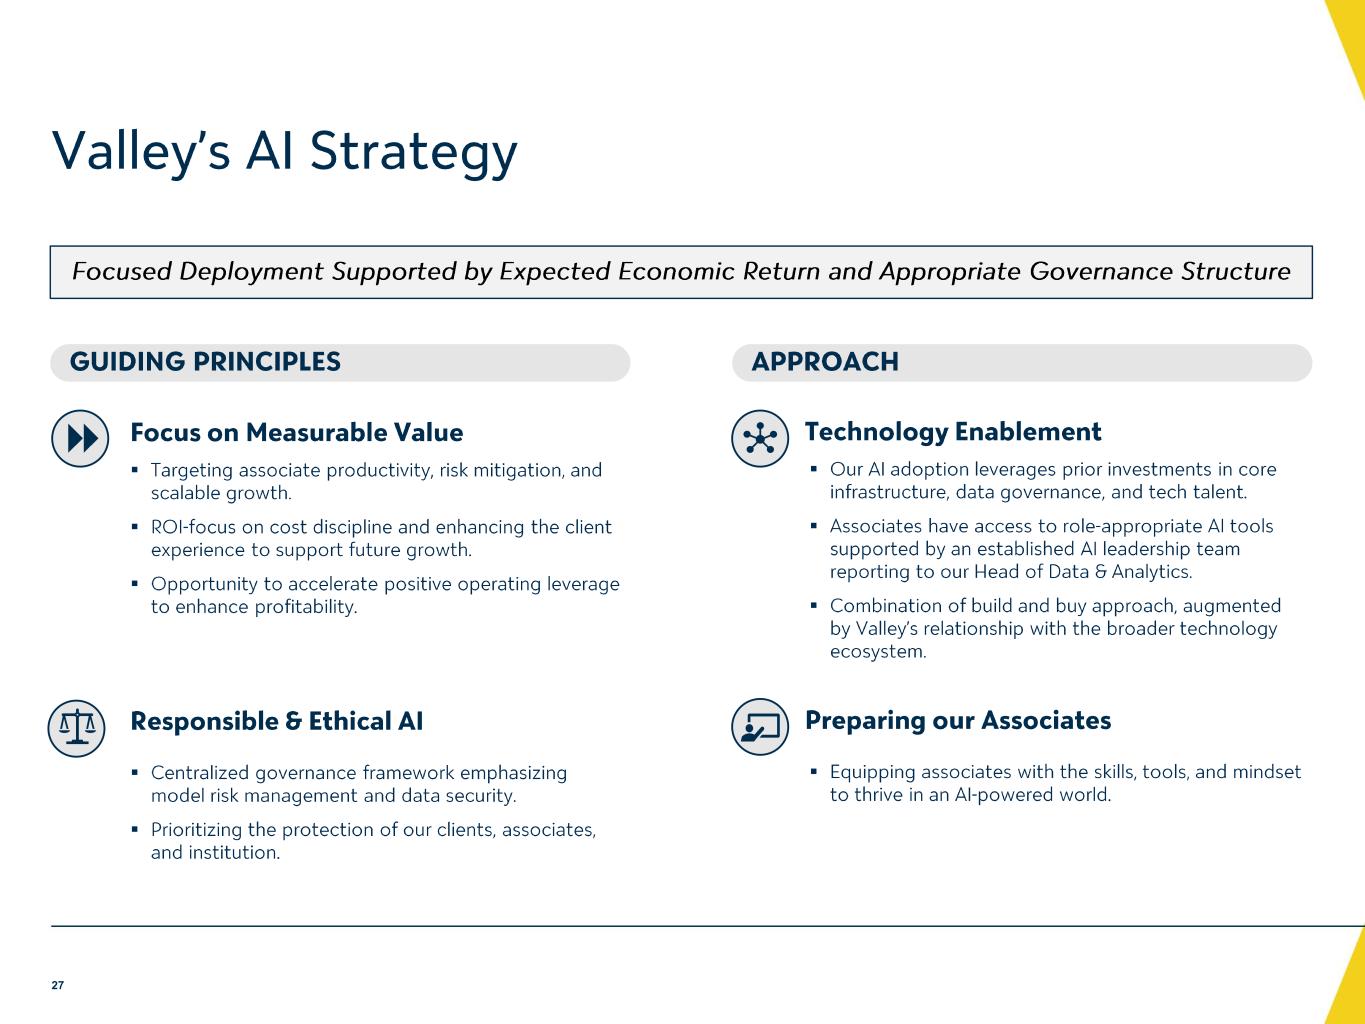
Valley’s AI Strategy Focused Deployment Supported by Expected Economic Return and Appropriate Governance Structure GUIDING PRINCIPLES Focus on Measurable Value Responsible & Ethical AI ▪ Targeting associate productivity, risk mitigation, and scalable growth. ▪ ROI -focus on cost discipline and enhancing the client experience to support future growth. ▪ Opportunity to accelerate positive operating leverage to enhance profitability. ▪ Centralized governance framework emphasizing model risk management and data security. ▪ Prioritizing the protection of our clients, associates, and institution. APPROACH Technology Enablement Preparing our Associates ▪ Our AI adoption leverages prior investments in core infrastructure, data governance, and tech talent. ▪ Associates have access to role -appropriate AI tools supported by an established AI leadership team reporting to our Head of Data & Analytics. ▪ Combination of build and buy approach, augmented by Valley’s relationship with the broader technology ecosystem. ▪ Equipping associates with the skills, tools, and mindset to thrive in an AI -powered world. 27
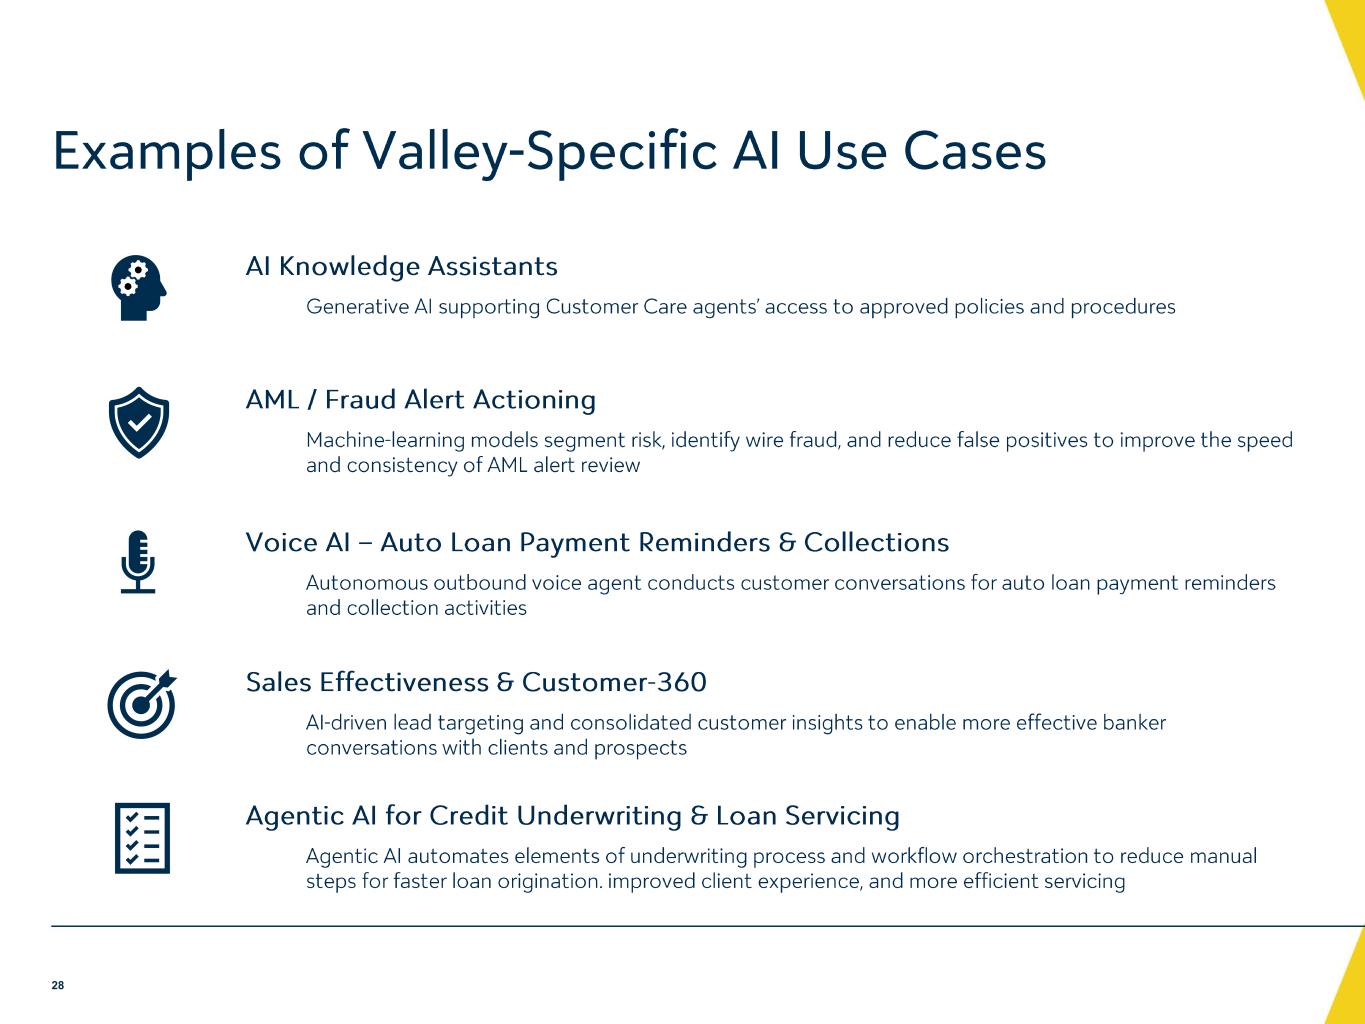
Examples of Valley -Specific AI Use Cases 28 AI Knowledge Assistants Generative AI supporting Customer Care agents’ access to approved policies and procedures AML / Fraud Alert Actioning Machine -learning models segment risk, identify wire fraud, and reduce false positives to improve the speed and consistency of AML alert review Voice AI – Auto Loan Payment Reminders & Collections Autonomous outbound voice agent conducts customer conversations for auto loan payment reminders and collection activities Sales Effectiveness & Customer -360 AI-driven lead targeting and consolidated customer insights to enable more effective banker conversations with clients and prospects Agentic AI for Credit Underwriting & Loan Servicing Agentic AI automates elements of underwriting process and workflow orchestration to reduce manual steps for faster loan origination. improved client experience, and more efficient servicing
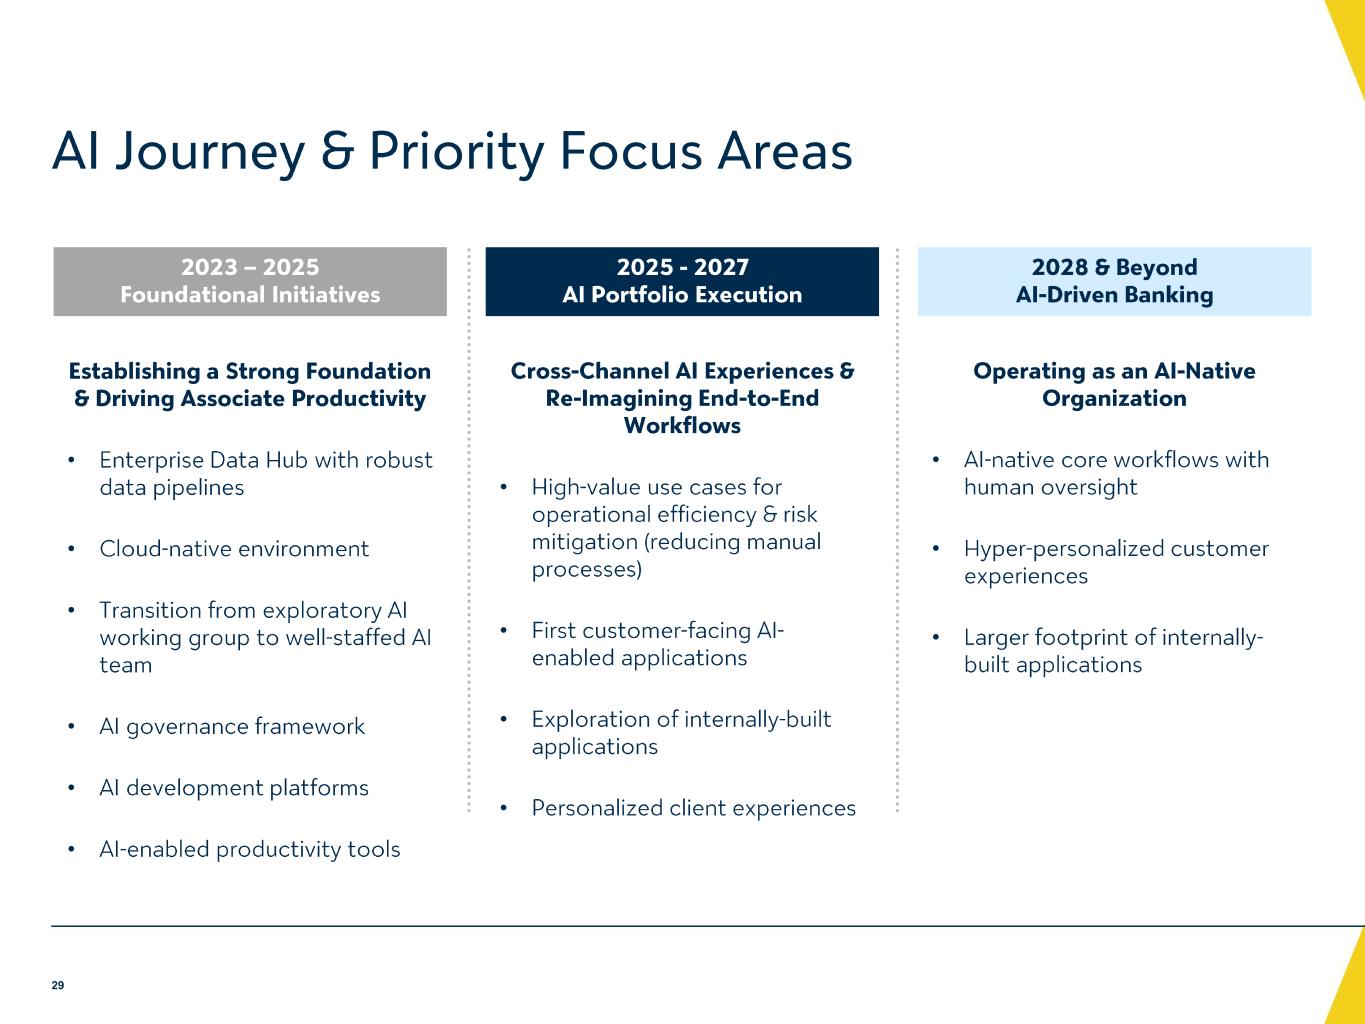
AI Journey & Priority Focus Areas 2023 – 2025 Foundational Initiatives 2025 - 2027 AI Portfolio Execution 2028 & Beyond AI -Driven Banking Establishing a Strong Foundation & Driving Associate Productivity • Enterprise Data Hub with robust data pipelines • Cloud -native environment • Transition from exploratory AI working group to well -staffed AI team • AI governance framework • AI development platforms • AI-enabled productivity tools Cross -Channel AI Experiences & Re -Imagining End -to -End Workflows • High -value use cases for operational efficiency & risk mitigation (reducing manual processes) • First customer -facing AI - enabled applications • Exploration of internally -built applications • Personalized client experiences Operating as an AI -Native Organization • AI-native core workflows with human oversight • Hyper -personalized customer experiences • Larger footprint of internally - built applications 29
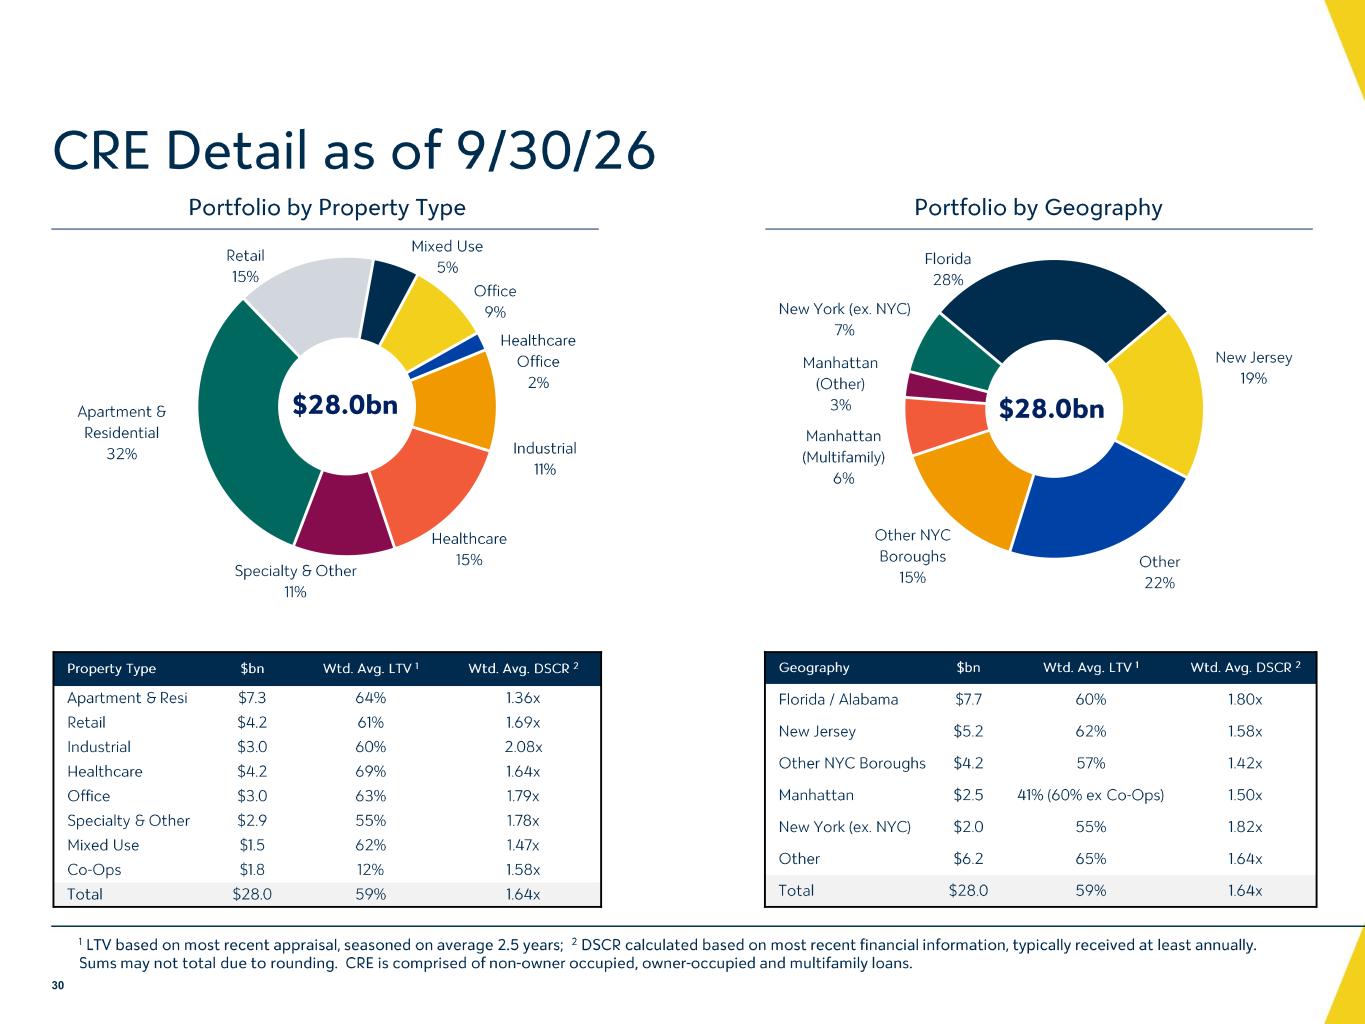
Apartment & Residential 32% Retail 15% Mixed Use 5% Office 9% Healthcare Office 2% Industrial 11% Healthcare 15% Specialty & Other 11% CRE Detail as of 9/30/26 Portfolio by Property Type Portfolio by Geography Florida 28% New Jersey 19% Other 22% Other NYC Boroughs 15% Manhattan (Multifamily) 6% Manhattan (Other) 3% New York (ex. NYC) 7% $28.0bn $28.0bn 1 LTV based on most recent appraisal, seasoned on average 2.5 years; 2 DSCR calculated based on most recent financial information, typically received at least annually. Sums may not total due to rounding. CRE is comprised of non -owner occupied, owner -occupied and multifamily loans. 30 Source- “CRE Portfolio Review 9.30.2026” Co-op info comes directly from Joe Tam via email Geography $bn Wtd . Avg. LTV 1 Wtd . Avg. DSCR 2 Florida / Alabama $7.7 60% 1.80x New Jersey $5.2 62% 1.58x Other NYC Boroughs $4.2 57% 1.42x Manhattan $2.5 41% (60% ex Co -Ops) 1.50x New York (ex. NYC) $2.0 55% 1.82x Other $6.2 65% 1.64x Total $28.0 59% 1.64x Property Type $bn Wtd . Avg. LTV 1 Wtd . Avg. DSCR 2 Apartment & Resi $7.3 64% 1.36x Retail $4.2 61% 1.69x Industrial $3.0 60% 2.08x Healthcare $4.2 69% 1.64x Office $3.0 63% 1.79x Specialty & Other $2.9 55% 1.78x Mixed Use $1.5 62% 1.47x Co -Ops $1.8 12% 1.58x Total $28.0 59% 1.64x
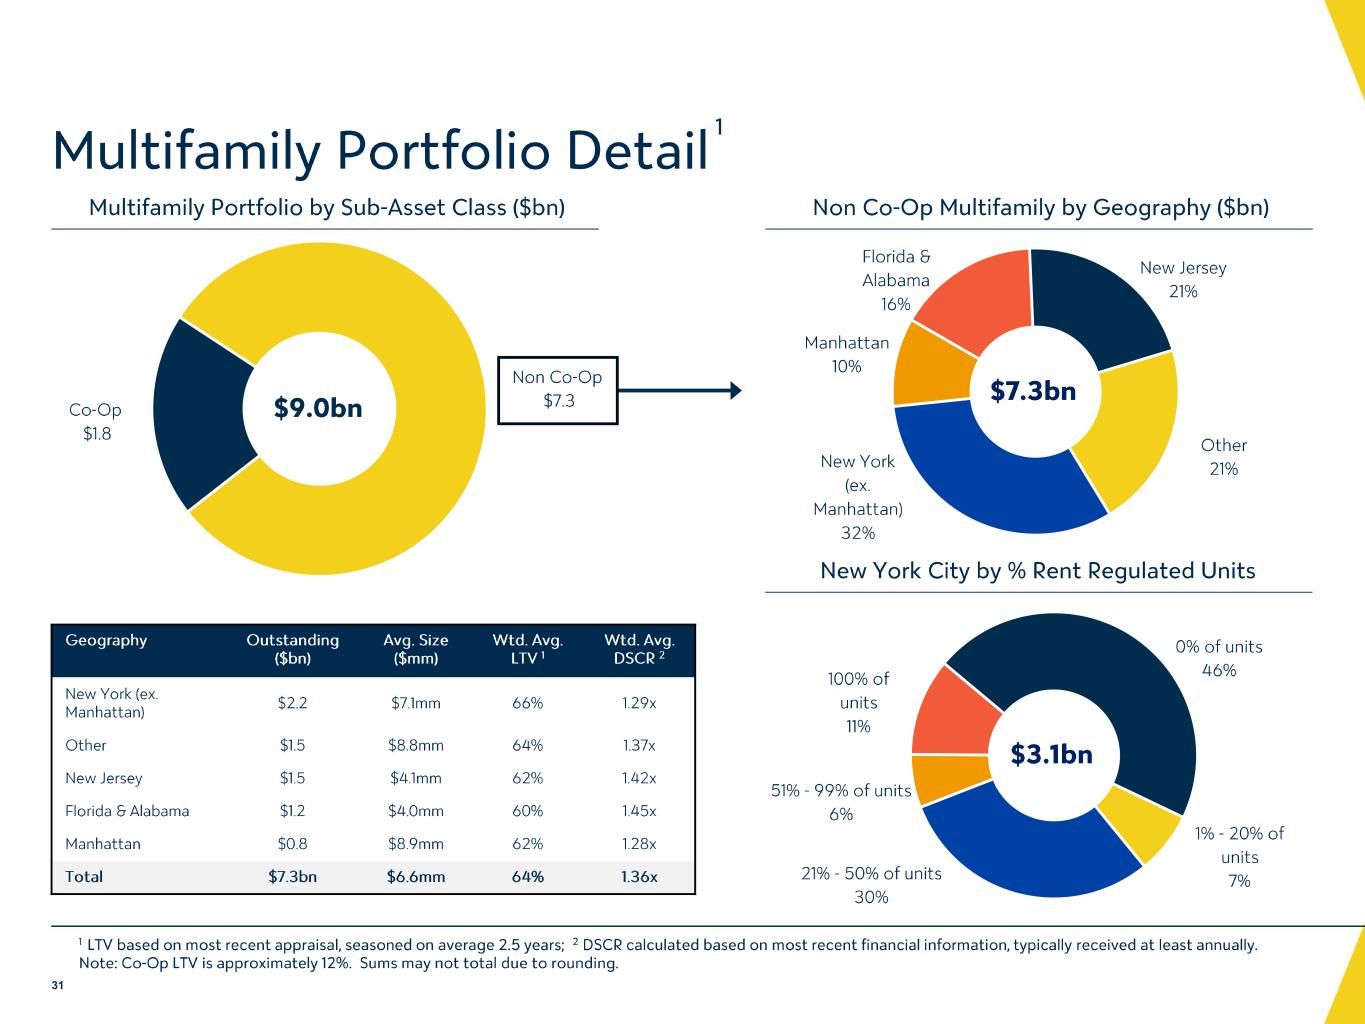
0% of units 46% 1% - 20% of units 7%21% - 50% of units 30% 51% - 99% of units 6% 100% of units 11% Co -Op $1.8 Non Co -Op $7.3 Multifamily Portfolio by Sub -Asset Class ($bn) Non Co -Op Multifamily by Geography ($bn) $9.0bn Geography Outstanding ($bn) Avg. Size ($mm) Wtd . Avg. LTV 1 Wtd . Avg. DSCR 2 New York (ex. Manhattan) $2.2 $7.1mm 66% 1.29x Other $1.5 $8.8mm 64% 1.37x New Jersey $1.5 $4.1mm 62% 1.42x Florida & Alabama $1.2 $4.0mm 60% 1.45x Manhattan $0.8 $8.9mm 62% 1.28x Total $7.3bn $6.6mm 64% 1.36x Florida & Alabama 16% New Jersey 21% Other 21%New York (ex. Manhattan) 32% Manhattan 10% $7.3bn New York City by % Rent Regulated Units $3.1bn Multifamily Portfolio Detail 1 LTV based on most recent appraisal, seasoned on average 2.5 years; 2 DSCR calculated based on most recent financial information, typically received at least annually. Note: Co -Op LTV is approximately 12%. Sums may not total due to rounding. 31 Source- “CRE Portfolio Review 9.30.2026” 1
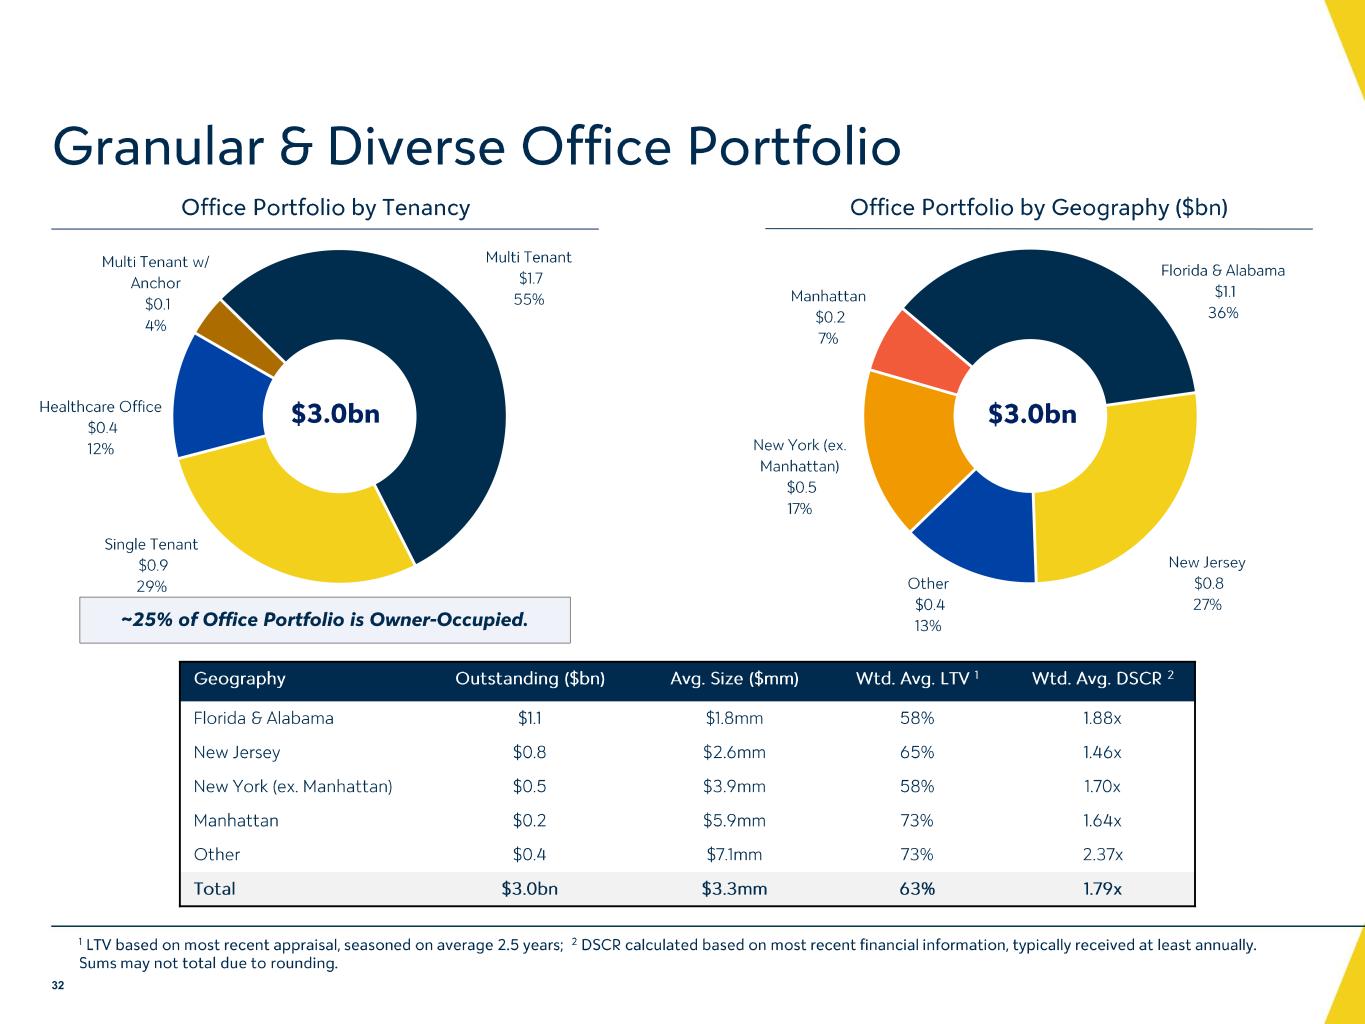
Granular & Diverse Office Portfolio Multi Tenant w/ Anchor $0.1 4% Multi Tenant $1.7 55% Single Tenant $0.9 29% Healthcare Office $0.4 12% Office Portfolio by Tenancy $3.0bn Office Portfolio by Geography ($bn) ~25% of Office Portfolio is Owner -Occupied. Florida & Alabama $1.1 36% New Jersey $0.8 27% Other $0.4 13% New York (ex. Manhattan) $0.5 17% Manhattan $0.2 7% 1 LTV based on most recent appraisal, seasoned on average 2.5 years; 2 DSCR calculated based on most recent financial information, typically received at least annually. Sums may not total due to rounding. 32 $3.0bn Source- “CRE Portfolio Review 9.30.2026” Geography Outstanding ($bn) Avg. Size ($mm) Wtd . Avg. LTV 1 Wtd . Avg. DSCR 2 Florida & Alabama $1.1 $1.8mm 58% 1.88x New Jersey $0.8 $2.6mm 65% 1.46x New York (ex. Manhattan) $0.5 $3.9mm 58% 1.70x Manhattan $0.2 $5.9mm 73% 1.64x Other $0.4 $7.1mm 73% 2.37x Total $3.0bn $3.3mm 63% 1.79x
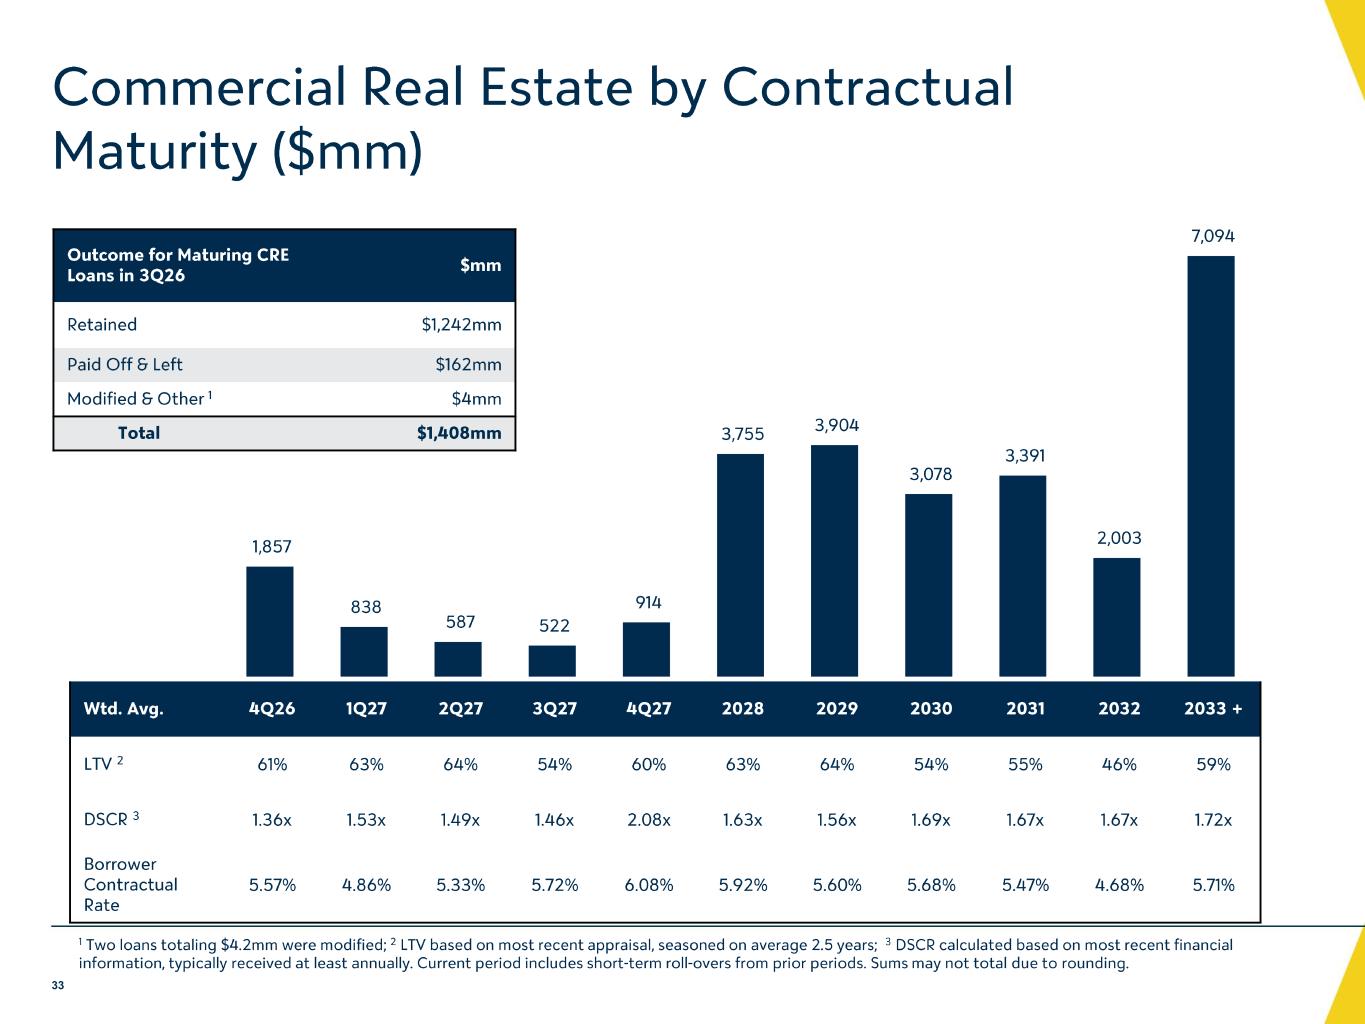
Commercial Real Estate by Contractual Maturity ($mm) 1,857 838 587 522 914 3,755 3,904 3,078 3,391 2,003 7,094 4Q26 1Q27 2Q27 3Q27 4Q27 2028 2029 2030 2031 2032 2033 + Wtd . Avg. 4Q26 1Q27 2Q27 3Q27 4Q27 2028 2029 2030 2031 2032 2033 + LTV 2 61% 63% 64% 54% 60% 63% 64% 54% 55% 46% 59% DSCR 3 1.36x 1.53x 1.49x 1.46x 2.08x 1.63x 1.56x 1.69x 1.67x 1.67x 1.72x Borrower Contractual Rate 5.57% 4.86% 5.33% 5.72% 6.08% 5.92% 5.60% 5.68% 5.47% 4.68% 5.71% 1 Two loans totaling $4.2mm were modified; 2 LTV based on most recent appraisal, seasoned on average 2.5 years; 3 DSCR calculated based on most recent financial information, typically received at least annually. Current period includes short -term roll -overs from prior periods. Sums may no t total due to rounding. 33 Outcome for Maturing CRE Loans in 3Q26 $mm Retained $1,242mm Paid Off & Left $162mm Modified & Other 1 $4mm Total $1,408mm CRE Maturity Details 9.30.26 & CRE Maturity Outcomes 9.30.26
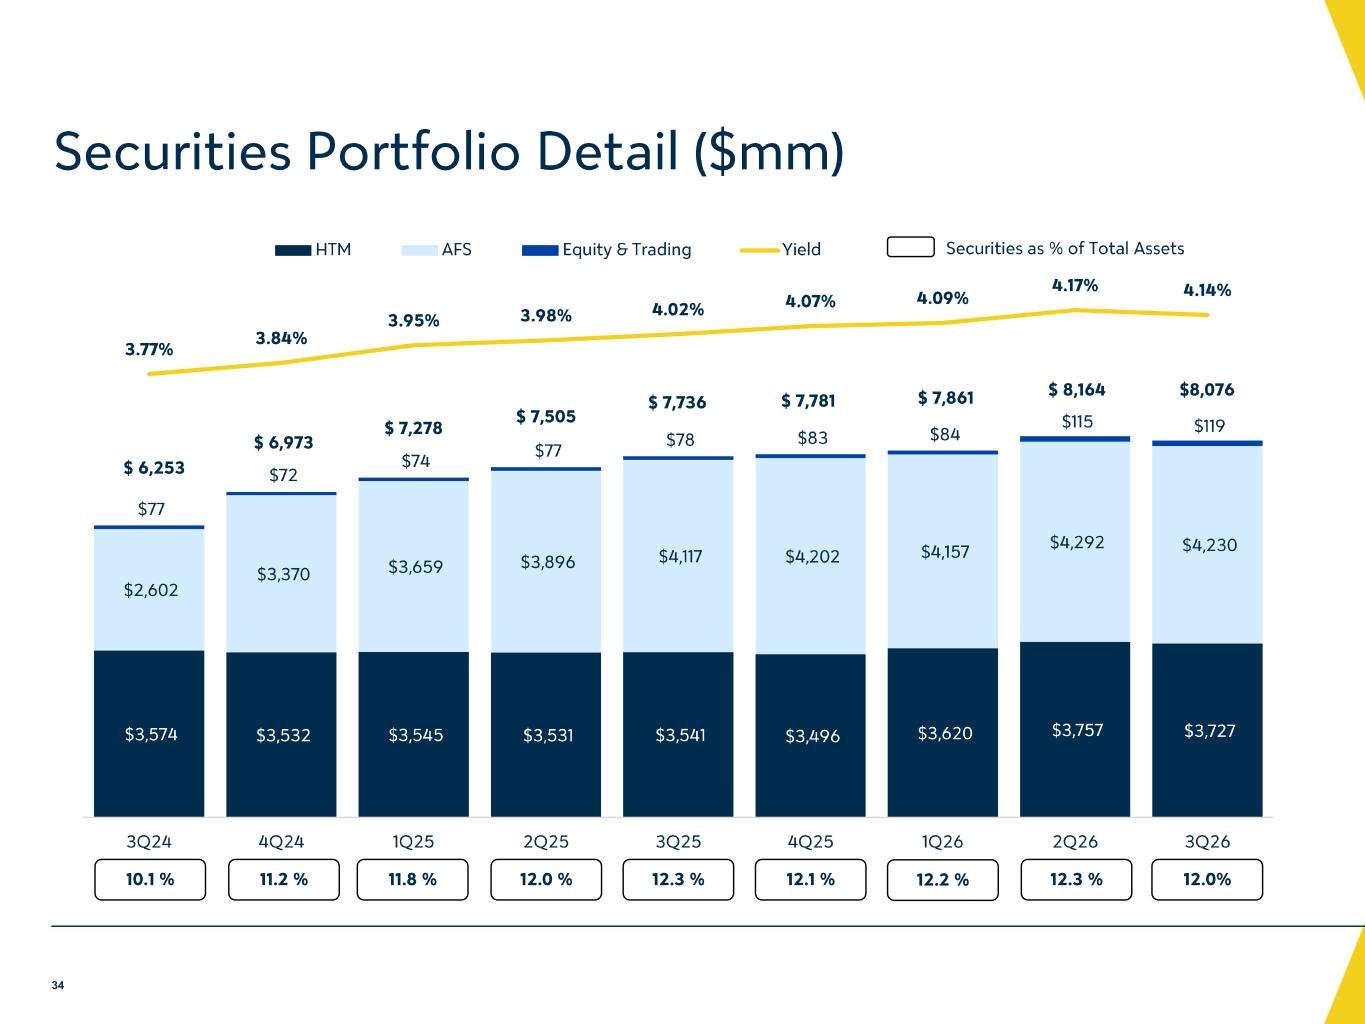
$3,574 $3,532 $3,545 $3,531 $3,541 $3,496 $3,620 $3,757 $3,727 $2,602 $3,370 $3,659 $3,896 $4,117 $4,202 $4,157 $4,292 $4,230 $77 $72 $74 $77 $78 $83 $84 $115 $119 3.77% 3.84% 3.95% 3.98% 4.02% 4.07% 4.09% 4.17% 4.14% 3Q24 4Q24 1Q25 2Q25 3Q25 4Q25 1Q26 2Q26 3Q26 HTM AFS Equity & Trading Yield 12.3 % $ 7,861 $ 8,164 12.0% Securities Portfolio Detail ($mm) Securities as % of Total Assets Historical data from S&P Capital IQ, Current data from Workiva $ 6,253 $ 6,973 $ 7,278 $ 7,505 $ 7,736 $ 7,781 10.1 % 11.2 % 11.8 % 12.0 % 12.3 % 12.1 % 12.2 % 34 $8,076
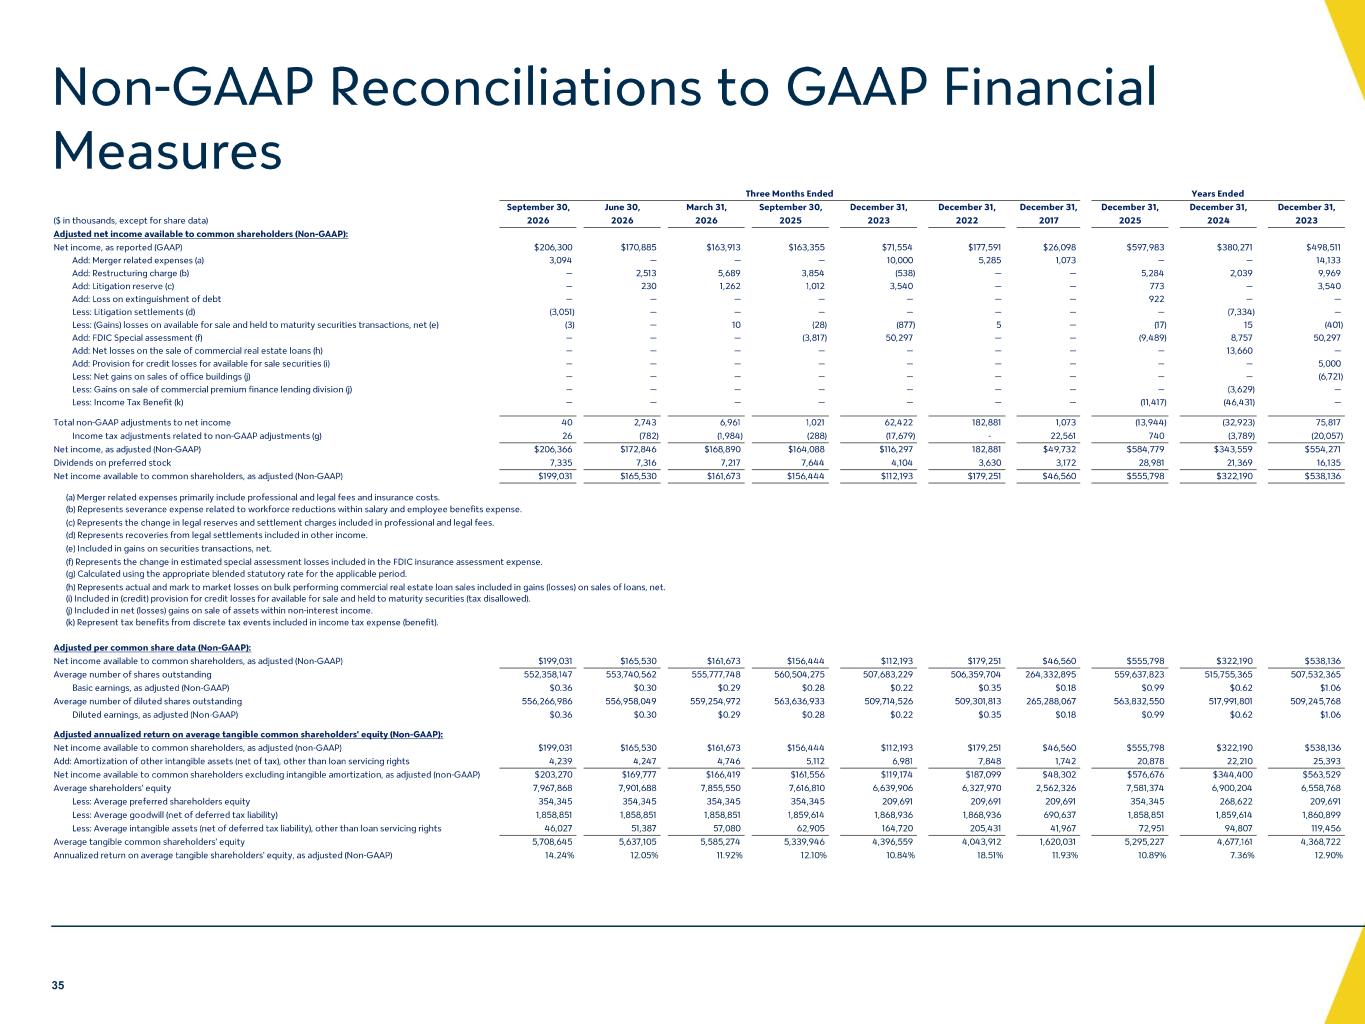
September 30, June 30, March 31, September 30, December 31, December 31, December 31, December 31, December 31, December 31, ($ in thousands, except for share data) 2026 2026 2026 2025 2023 2022 2017 2025 2024 2023 Adjusted net income available to common shareholders (Non-GAAP): Net income, as reported (GAAP) $206,300 $170,885 $163,913 $163,355 $71,554 $177,591 $26,098 $597,983 $380,271 $498,511 Add: Merger related expenses (a) 3,094 — — — 10,000 5,285 1,073 — — 14,133 Add: Restructuring charge (b) — 2,513 5,689 3,854 (538) — — 5,284 2,039 9,969 Add: Litigation reserve (c) — 230 1,262 1,012 3,540 — — 773 — 3,540 Add: Loss on extinguishment of debt — — — — — — — 922 — — Less: Litigation settlements (d) (3,051) — — — — — — — (7,334) — Less: (Gains) losses on available for sale and held to maturity securities transactions, net (e) (3) — 10 (28) (877) 5 — (17) 15 (401) Add: FDIC Special assessment (f) — — — (3,817) 50,297 — — (9,489) 8,757 50,297 Add: Net losses on the sale of commercial real estate loans (h) — — — — — — — — 13,660 — Add: Provision for credit losses for available for sale securities (i) — — — — — — — — — 5,000 Less: Net gains on sales of office buildings (j) — — — — — — — — — (6,721) Less: Gains on sale of commercial premium finance lending division (j) — — — — — — — — (3,629) — Less: Income Tax Benefit (k) — — — — — — — (11,417) (46,431) — Total non-GAAP adjustments to net income 40 2,743 6,961 1,021 62,422 182,881 1,073 (13,944) (32,923) 75,817 Income tax adjustments related to non-GAAP adjustments (g) 26 (782) (1,984) (288) (17,679) - 22,561 740 (3,789) (20,057) Net income, as adjusted (Non-GAAP) $206,366 $172,846 $168,890 $164,088 $116,297 182,881 $49,732 $584,779 $343,559 $554,271 Dividends on preferred stock 7,335 7,316 7,217 7,644 4,104 3,630 3,172 28,981 21,369 16,135 Net income available to common shareholders, as adjusted (Non-GAAP) $199,031 $165,530 $161,673 $156,444 $112,193 $179,251 $46,560 $555,798 $322,190 $538,136 (a) Merger related expenses primarily include professional and legal fees and insurance costs. (b) Represents severance expense related to workforce reductions within salary and employee benefits expense. (c) Represents the change in legal reserves and settlement charges included in professional and legal fees. (d) Represents recoveries from legal settlements included in other income. (e) Included in gains on securities transactions, net. (f) Represents the change in estimated special assessment losses included in the FDIC insurance assessment expense. (g) Calculated using the appropriate blended statutory rate for the applicable period. (h) Represents actual and mark to market losses on bulk performing commercial real estate loan sales included in gains (losses) on sales of loans, net. (i) Included in (credit) provision for credit losses for available for sale and held to maturity securities (tax disallowed). (j) Included in net (losses) gains on sale of assets within non-interest income. (k) Represent tax benefits from discrete tax events included in income tax expense (benefit). Adjusted per common share data (Non-GAAP): Net income available to common shareholders, as adjusted (Non-GAAP) $199,031 $165,530 $161,673 $156,444 $112,193 $179,251 $46,560 $555,798 $322,190 $538,136 Average number of shares outstanding 552,358,147 553,740,562 555,777,748 560,504,275 507,683,229 506,359,704 264,332,895 559,637,823 515,755,365 507,532,365 Basic earnings, as adjusted (Non-GAAP) $0.36 $0.30 $0.29 $0.28 $0.22 $0.35 $0.18 $0.99 $0.62 $1.06 Average number of diluted shares outstanding 556,266,986 556,958,049 559,254,972 563,636,933 509,714,526 509,301,813 265,288,067 563,832,550 517,991,801 509,245,768 Diluted earnings, as adjusted (Non-GAAP) $0.36 $0.30 $0.29 $0.28 $0.22 $0.35 $0.18 $0.99 $0.62 $1.06 Adjusted annualized return on average tangible common shareholders' equity (Non-GAAP): Net income available to common shareholders, as adjusted (non-GAAP) $199,031 $165,530 $161,673 $156,444 $112,193 $179,251 $46,560 $555,798 $322,190 $538,136 Add: Amortization of other intangible assets (net of tax), other than loan servicing rights 4,239 4,247 4,746 5,112 6,981 7,848 1,742 20,878 22,210 25,393 Net income available to common shareholders excluding intangible amortization, as adjusted (non-GAAP) $203,270 $169,777 $166,419 $161,556 $119,174 $187,099 $48,302 $576,676 $344,400 $563,529 Average shareholders' equity 7,967,868 7,901,688 7,855,550 7,616,810 6,639,906 6,327,970 2,562,326 7,581,374 6,900,204 6,558,768 Less: Average preferred shareholders equity 354,345 354,345 354,345 354,345 209,691 209,691 209,691 354,345 268,622 209,691 Less: Average goodwill (net of deferred tax liability) 1,858,851 1,858,851 1,858,851 1,859,614 1,868,936 1,868,936 690,637 1,858,851 1,859,614 1,860,899 Less: Average intangible assets (net of deferred tax liability), other than loan servicing rights 46,027 51,387 57,080 62,905 164,720 205,431 41,967 72,951 94,807 119,456 Average tangible common shareholders' equity 5,708,645 5,637,105 5,585,274 5,339,946 4,396,559 4,043,912 1,620,031 5,295,227 4,677,161 4,368,722 Annualized return on average tangible shareholders' equity, as adjusted (Non-GAAP) 14.24% 12.05% 11.92% 12.10% 10.84% 18.51% 11.93% 10.89% 7.36% 12.90% Years EndedThree Months Ended Non -GAAP Reconciliations to GAAP Financial Measures 35
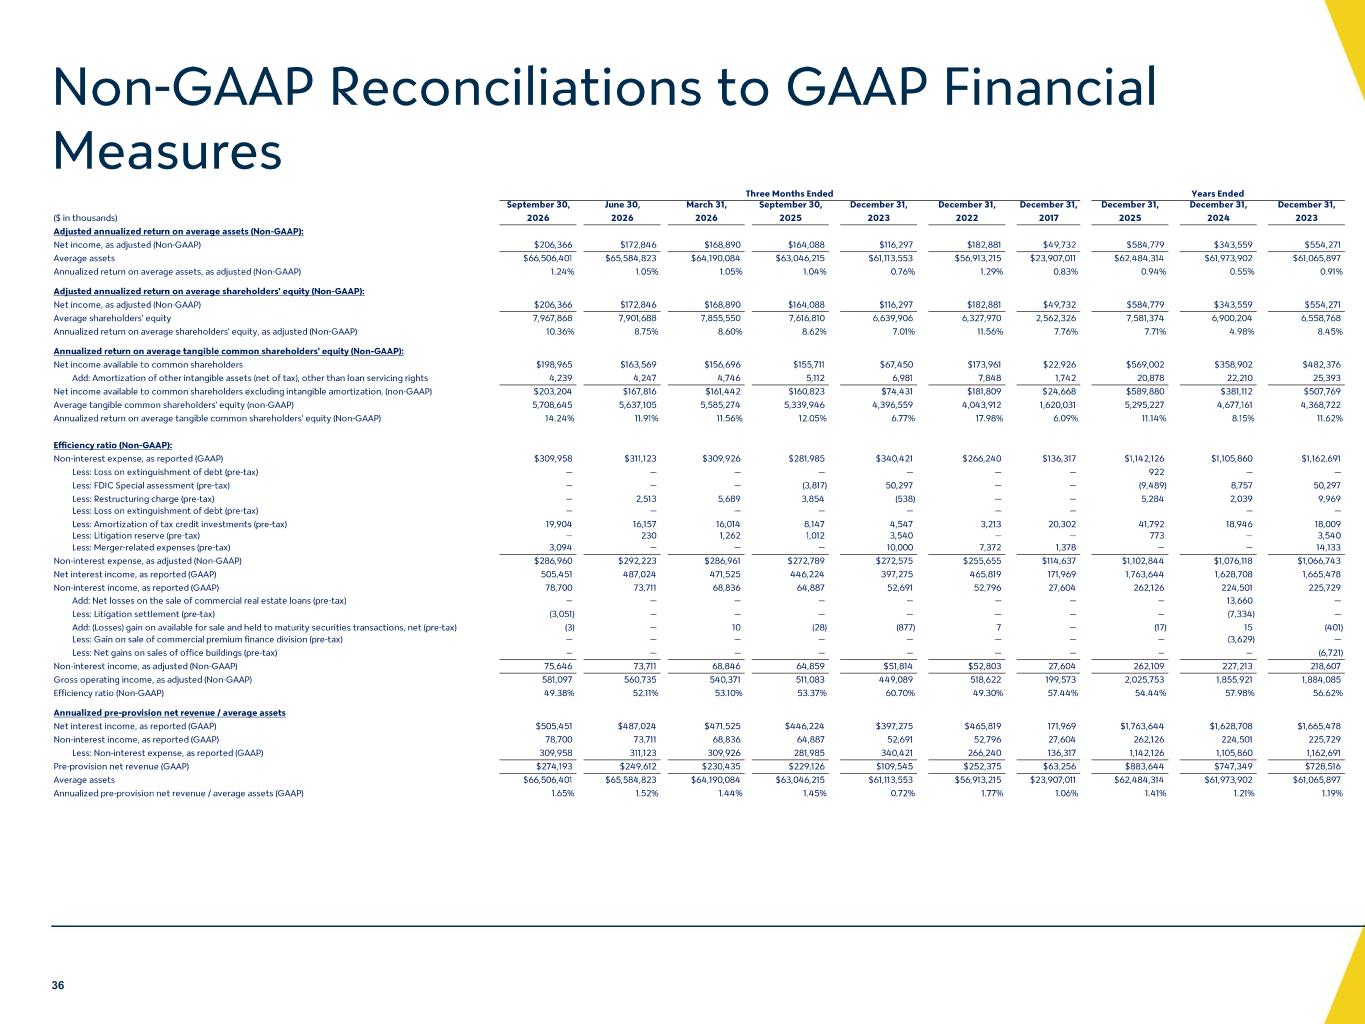
Non -GAAP Reconciliations to GAAP Financial Measures 36 September 30, June 30, March 31, September 30, December 31, December 31, December 31, December 31, December 31, December 31, ($ in thousands) 2026 2026 2026 2025 2023 2022 2017 2025 2024 2023 Adjusted annualized return on average assets (Non-GAAP): Net income, as adjusted (Non-GAAP) $206,366 $172,846 $168,890 $164,088 $116,297 $182,881 $49,732 $584,779 $343,559 $554,271 Average assets $66,506,401 $65,584,823 $64,190,084 $63,046,215 $61,113,553 $56,913,215 $23,907,011 $62,484,314 $61,973,902 $61,065,897 Annualized return on average assets, as adjusted (Non-GAAP) 1.24% 1.05% 1.05% 1.04% 0.76% 1.29% 0.83% 0.94% 0.55% 0.91% Adjusted annualized return on average shareholders' equity (Non-GAAP): Net income, as adjusted (Non-GAAP) $206,366 $172,846 $168,890 $164,088 $116,297 $182,881 $49,732 $584,779 $343,559 $554,271 Average shareholders' equity 7,967,868 7,901,688 7,855,550 7,616,810 6,639,906 6,327,970 2,562,326 7,581,374 6,900,204 6,558,768 Annualized return on average shareholders' equity, as adjusted (Non-GAAP) 10.36% 8.75% 8.60% 8.62% 7.01% 11.56% 7.76% 7.71% 4.98% 8.45% Annualized return on average tangible common shareholders' equity (Non-GAAP): Net income available to common shareholders $198,965 $163,569 $156,696 $155,711 $67,450 $173,961 $22,926 $569,002 $358,902 $482,376 Add: Amortization of other intangible assets (net of tax), other than loan servicing rights 4,239 4,247 4,746 5,112 6,981 7,848 1,742 20,878 22,210 25,393 Net income available to common shareholders excluding intangible amortization, (non-GAAP) $203,204 $167,816 $161,442 $160,823 $74,431 $181,809 $24,668 $589,880 $381,112 $507,769 Average tangible common shareholders' equity (non-GAAP) 5,708,645 5,637,105 5,585,274 5,339,946 4,396,559 4,043,912 1,620,031 5,295,227 4,677,161 4,368,722 Annualized return on average tangible common shareholders' equity (Non-GAAP) 14.24% 11.91% 11.56% 12.05% 6.77% 17.98% 6.09% 11.14% 8.15% 11.62% Efficiency ratio (Non-GAAP): Non-interest expense, as reported (GAAP) $309,958 $311,123 $309,926 $281,985 $340,421 $266,240 $136,317 $1,142,126 $1,105,860 $1,162,691 Less: Loss on extinguishment of debt (pre-tax) — — — — — — — 922 — — Less: FDIC Special assessment (pre-tax) — — — (3,817) 50,297 — — (9,489) 8,757 50,297 Less: Restructuring charge (pre-tax) — 2,513 5,689 3,854 (538) — — 5,284 2,039 9,969 Less: Loss on extinguishment of debt (pre-tax) — — — — — — — — — Less: Amortization of tax credit investments (pre-tax) 19,904 16,157 16,014 8,147 4,547 3,213 20,302 41,792 18,946 18,009 Less: Litigation reserve (pre-tax) — 230 1,262 1,012 3,540 — — 773 — 3,540 Less: Merger-related expenses (pre-tax) 3,094 — — — 10,000 7,372 1,378 — — 14,133 Non-interest expense, as adjusted (Non-GAAP) $286,960 $292,223 $286,961 $272,789 $272,575 $255,655 $114,637 $1,102,844 $1,076,118 $1,066,743 Net interest income, as reported (GAAP) 505,451 487,024 471,525 446,224 397,275 465,819 171,969 1,763,644 1,628,708 1,665,478 Non-interest income, as reported (GAAP) 78,700 73,711 68,836 64,887 52,691 52,796 27,604 262,126 224,501 225,729 Add: Net losses on the sale of commercial real estate loans (pre-tax) — — — — — — — — 13,660 — Less: Litigation settlement (pre-tax) (3,051) — — — — — — — (7,334) — Add: (Losses) gain on available for sale and held to maturity securities transactions, net (pre-tax) (3) — 10 (28) (877) 7 — (17) 15 (401) Less: Gain on sale of commercial premium finance division (pre-tax) — — — — — — — — (3,629) — Less: Net gains on sales of office buildings (pre-tax) — — — — — — — — — (6,721) Non-interest income, as adjusted (Non-GAAP) 75,646 73,711 68,846 64,859 $51,814 $52,803 27,604 262,109 227,213 218,607 Gross operating income, as adjusted (Non-GAAP) 581,097 560,735 540,371 511,083 449,089 518,622 199,573 2,025,753 1,855,921 1,884,085 Efficiency ratio (Non-GAAP) 49.38% 52.11% 53.10% 53.37% 60.70% 49.30% 57.44% 54.44% 57.98% 56.62% Annualized pre-provision net revenue / average assets Net interest income, as reported (GAAP) $505,451 $487,024 $471,525 $446,224 $397,275 $465,819 171,969 $1,763,644 $1,628,708 $1,665,478 Non-interest income, as reported (GAAP) 78,700 73,711 68,836 64,887 52,691 52,796 27,604 262,126 224,501 225,729 Less: Non-interest expense, as reported (GAAP) 309,958 311,123 309,926 281,985 340,421 266,240 136,317 1,142,126 1,105,860 1,162,691 Pre-provision net revenue (GAAP) $274,193 $249,612 $230,435 $229,126 $109,545 $252,375 $63,256 $883,644 $747,349 $728,516 Average assets $66,506,401 $65,584,823 $64,190,084 $63,046,215 $61,113,553 $56,913,215 $23,907,011 $62,484,314 $61,973,902 $61,065,897 Annualized pre-provision net revenue / average assets (GAAP) 1.65% 1.52% 1.44% 1.45% 0.72% 1.77% 1.06% 1.41% 1.21% 1.19% Years EndedThree Months Ended
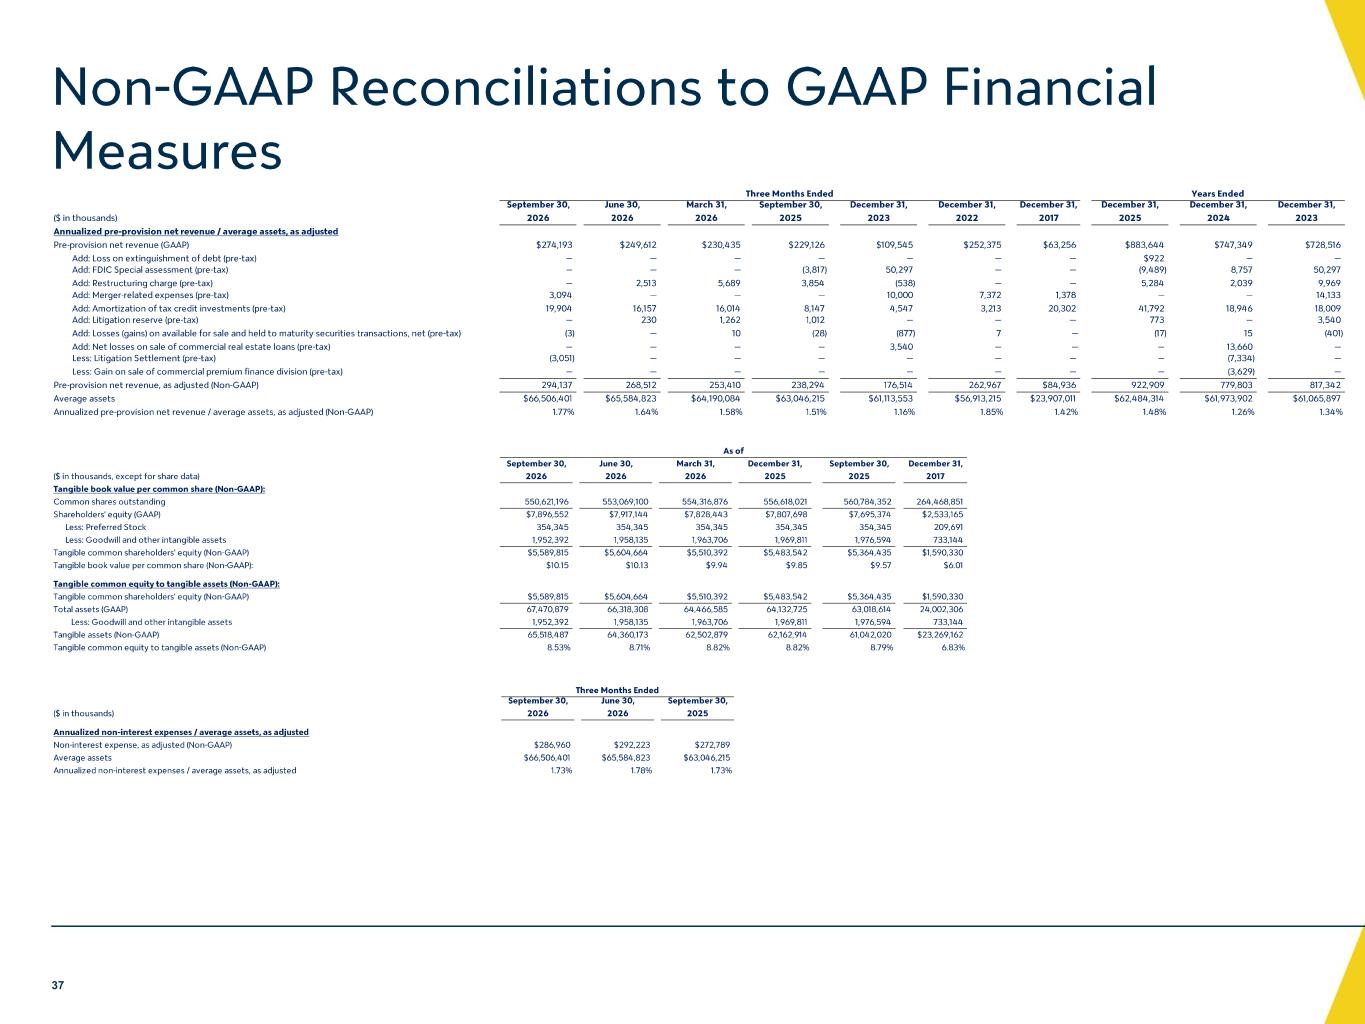
Non -GAAP Reconciliations to GAAP Financial Measures 37 September 30, June 30, March 31, December 31, September 30, December 31, ($ in thousands, except for share data) 2026 2026 2026 2025 2025 2017 Tangible book value per common share (Non-GAAP): Common shares outstanding 550,621,196 553,069,100 554,316,876 556,618,021 560,784,352 264,468,851 Shareholders' equity (GAAP) $7,896,552 $7,917,144 $7,828,443 $7,807,698 $7,695,374 $2,533,165 Less: Preferred Stock 354,345 354,345 354,345 354,345 354,345 209,691 Less: Goodwill and other intangible assets 1,952,392 1,958,135 1,963,706 1,969,811 1,976,594 733,144 Tangible common shareholders' equity (Non-GAAP) $5,589,815 $5,604,664 $5,510,392 $5,483,542 $5,364,435 $1,590,330 Tangible book value per common share (Non-GAAP): $10.15 $10.13 $9.94 $9.85 $9.57 $6.01 Tangible common equity to tangible assets (Non-GAAP): Tangible common shareholders' equity (Non-GAAP) $5,589,815 $5,604,664 $5,510,392 $5,483,542 $5,364,435 $1,590,330 Total assets (GAAP) 67,470,879 66,318,308 64,466,585 64,132,725 63,018,614 24,002,306 Less: Goodwill and other intangible assets 1,952,392 1,958,135 1,963,706 1,969,811 1,976,594 733,144 Tangible assets (Non-GAAP) 65,518,487 64,360,173 62,502,879 62,162,914 61,042,020 $23,269,162 Tangible common equity to tangible assets (Non-GAAP) 8.53% 8.71% 8.82% 8.82% 8.79% 6.83% As of September 30, June 30, September 30, ($ in thousands) 2026 2026 2025 Annualized non-interest expenses / average assets, as adjusted Non-interest expense, as adjusted (Non-GAAP) $286,960 $292,223 $272,789 Average assets $66,506,401 $65,584,823 $63,046,215 Annualized non-interest expenses / average assets, as adjusted 1.73% 1.78% 1.73% Three Months Ended September 30, June 30, March 31, September 30, December 31, December 31, December 31, December 31, December 31, December 31, ($ in thousands) 2026 2026 2026 2025 2023 2022 2017 2025 2024 2023 Annualized pre-provision net revenue / average assets, as adjusted Pre-provision net revenue (GAAP) $274,193 $249,612 $230,435 $229,126 $109,545 $252,375 $63,256 $883,644 $747,349 $728,516 Add: Loss on extinguishment of debt (pre-tax) — — — — — — — $922 — — Add: FDIC Special assessment (pre-tax) — — — (3,817) 50,297 — — (9,489) 8,757 50,297 Add: Restructuring charge (pre-tax) — 2,513 5,689 3,854 (538) — — 5,284 2,039 9,969 Add: Merger-related expenses (pre-tax) 3,094 — — — 10,000 7,372 1,378 — — 14,133 Add: Amortization of tax credit investments (pre-tax) 19,904 16,157 16,014 8,147 4,547 3,213 20,302 41,792 18,946 18,009 Add: Litigation reserve (pre-tax) — 230 1,262 1,012 — — — 773 — 3,540 Add: Losses (gains) on available for sale and held to maturity securities transactions, net (pre-tax) (3) — 10 (28) (877) 7 — (17) 15 (401) Add: Net losses on sale of commercial real estate loans (pre-tax) — — — — 3,540 — — — 13,660 — Less: Litigation Settlement (pre-tax) (3,051) — — — — — — — (7,334) — Less: Gain on sale of commercial premium finance division (pre-tax) — — — — — — — — (3,629) — Pre-provision net revenue, as adjusted (Non-GAAP) 294,137 268,512 253,410 238,294 176,514 262,967 $84,936 922,909 779,803 817,342 Average assets $66,506,401 $65,584,823 $64,190,084 $63,046,215 $61,113,553 $56,913,215 $23,907,011 $62,484,314 $61,973,902 $61,065,897 Annualized pre-provision net revenue / average assets, as adjusted (Non-GAAP) 1.77% 1.64% 1.58% 1.51% 1.16% 1.85% 1.42% 1.48% 1.26% 1.34% Years EndedThree Months Ended

© 2026 Valley Bank. All rights reserved. Please see www.valley.com for further details. For More Information ▪ Go to our website: www.valley.com ▪ Email requests to: ajianette@valley.com ▪ Call Andrew Jianette in Investor Relations at: (551) 288 -3182 ▪ Go to our website above or www.sec.gov to obtain free copies of documents filed by Valley with the SEC