Pay vs Performance Disclosure - USD ($)
|
12 Months Ended |
Jun. 30, 2026 |
Jun. 30, 2025 |
Jun. 30, 2024 |
Jun. 30, 2023 |
Jun. 30, 2022 |
| Pay vs Performance Disclosure |
|
|
|
|
|
| Pay vs Performance Disclosure, Table |
The following table provides information regarding the relationship between executive compensation for our principal executive officers ("PEOs") and our other named executive officers ("non-PEO NEOs") and Company performance as required by Section 953(a) of the Dodd-Frank Act and Item 402(v) of Regulation S-K for the fiscal years ended June 30, 2026, 2025, 2024, 2023 and 2022. | | | | | | | | | | | | | | | | | | | | | | | | | | | | | | | | | | | | | | | | | | | | | | | | | | | | | | | | | | | | | | | | | | | | | | | | | | | | | Value of initial fixed $100 investment based on: | | | | | Fiscal
Year | Summary Compensation Table Total for PEO Williams (1) | Summary Compensation Table Total for PEO Beauchamp (1) | Compensation Actually Paid to PEO Williams(2) | Compensation Actually Paid to PEO Beauchamp(2) | Average Summary Compensation Table Total for Non-PEO NEOs(3) | Average Compensation Actually Paid to Non-PEO NEOs(2)(3) | Total Shareholder Return(4) | Peer Group Total Shareholder Return(5) | Net Income ($ millions) | Recurring and Other Revenue ($ millions) | | 2026 | | $ | 23,473,564 | | | $ | — | | | $ | 145,214 | | | $ | — | | | $ | 5,941,687 | | | $ | 1,698,461 | | | $ | 54.79 | | | $ | 100.18 | | | $ | 269.7 | | | $ | 1,651.4 | | | 2025 | | $ | 18,044,482 | | | $ | 3,044,516 | | | $ | 28,295,857 | | | $ | 8,767,719 | | | $ | 4,708,119 | | | $ | 6,285,878 | | | $ | 94.96 | | | $ | 110.74 | | | $ | 227.1 | | | $ | 1,471.8 | | | 2024 | | $ | 14,737,065 | | | $ | 11,137,431 | | | $ | 1,664,676 | | | $ | (1,454,508) | | | $ | 3,756,613 | | | $ | 1,189,384 | | | $ | 69.10 | | | $ | 88.16 | | | $ | 206.8 | | | $ | 1,281.7 | | | 2023 | | $ | 21,672,572 | | | $ | 21,583,365 | | | $ | 16,000,336 | | | $ | 20,565,161 | | | $ | 5,495,940 | | | $ | 4,271,028 | | | $ | 96.71 | | | $ | 77.83 | | | $ | 140.8 | | | $ | 1,098.0 | | | 2022 | | $ | 8,422,470 | | | $ | 15,292,725 | | | $ | 7,958,073 | | | $ | 11,093,807 | | | $ | 7,666,070 | | | $ | 3,705,009 | | | $ | 91.42 | | | $ | 64.82 | | | $ | 90.8 | | | $ | 847.7 | |
|
|
|
|
|
| Named Executive Officers, Footnote |
Mr. Williams was a PEO for fiscal 2026, 2025, 2024, 2023 and 2022, and Mr. Beauchamp was a PEO for fiscal 2024, 2023 and 2022, as well as from July 1, 2024 until August 5, 2024 when he became Executive Chairman.
|
|
|
|
|
| Adjustment To PEO Compensation, Footnote |
The reconciliation of the amount of PEO and Average Non-PEO Summary Compensation Table totals to Compensation Actually Paid ("CAP") is summarized in the following table: | | | | | | | | | | | | | | | | 2026 | | PEO Williams | Average Non - PEO NEOs | | Summary Compensation Table Total | | $ | 23,473,564 | | | $ | 5,941,687 | | | Adjustments | | | | | | Equity Awards | | $ | (21,557,447) | | | $ | (4,693,981) | | | Fair Value of Equity Awards | | | | | | Year End Fair Value of Outstanding and Unvested Equity Awards Granted in the Covered Year | | $ | 10,894,797 | | | $ | 2,433,898 | | | Change in Fair Value of Outstanding and Unvested Equity Awards Granted in the Prior Year | | $ | (12,772,279) | | | $ | (1,963,475) | | | Change in Fair Value of Prior Year Equity Awards Vested in the Covered Year | | $ | (2,168,594) | | | $ | (466,227) | | | Fair Value on Vesting Date of Equity Awards Granted and Vested in the Covered Year | | $ | 2,275,173 | | | $ | 446,559 | | | Total Adjustments for Fair Value of Equity Awards | | $ | (23,328,350) | | | $ | (4,243,226) | | | Compensation Actually Paid | | $ | 145,214 | | | $ | 1,698,461 | |
|
|
|
|
|
| Non-PEO NEO Average Total Compensation Amount |
$ 5,941,687
|
$ 4,708,119
|
$ 3,756,613
|
$ 5,495,940
|
$ 7,666,070
|
| Non-PEO NEO Average Compensation Actually Paid Amount |
$ 1,698,461
|
6,285,878
|
1,189,384
|
4,271,028
|
3,705,009
|
| Adjustment to Non-PEO NEO Compensation Footnote |
The reconciliation of the amount of PEO and Average Non-PEO Summary Compensation Table totals to Compensation Actually Paid ("CAP") is summarized in the following table: | | | | | | | | | | | | | | | | 2026 | | PEO Williams | Average Non - PEO NEOs | | Summary Compensation Table Total | | $ | 23,473,564 | | | $ | 5,941,687 | | | Adjustments | | | | | | Equity Awards | | $ | (21,557,447) | | | $ | (4,693,981) | | | Fair Value of Equity Awards | | | | | | Year End Fair Value of Outstanding and Unvested Equity Awards Granted in the Covered Year | | $ | 10,894,797 | | | $ | 2,433,898 | | | Change in Fair Value of Outstanding and Unvested Equity Awards Granted in the Prior Year | | $ | (12,772,279) | | | $ | (1,963,475) | | | Change in Fair Value of Prior Year Equity Awards Vested in the Covered Year | | $ | (2,168,594) | | | $ | (466,227) | | | Fair Value on Vesting Date of Equity Awards Granted and Vested in the Covered Year | | $ | 2,275,173 | | | $ | 446,559 | | | Total Adjustments for Fair Value of Equity Awards | | $ | (23,328,350) | | | $ | (4,243,226) | | | Compensation Actually Paid | | $ | 145,214 | | | $ | 1,698,461 | |
|
|
|
|
|
| Compensation Actually Paid vs. Total Shareholder Return |
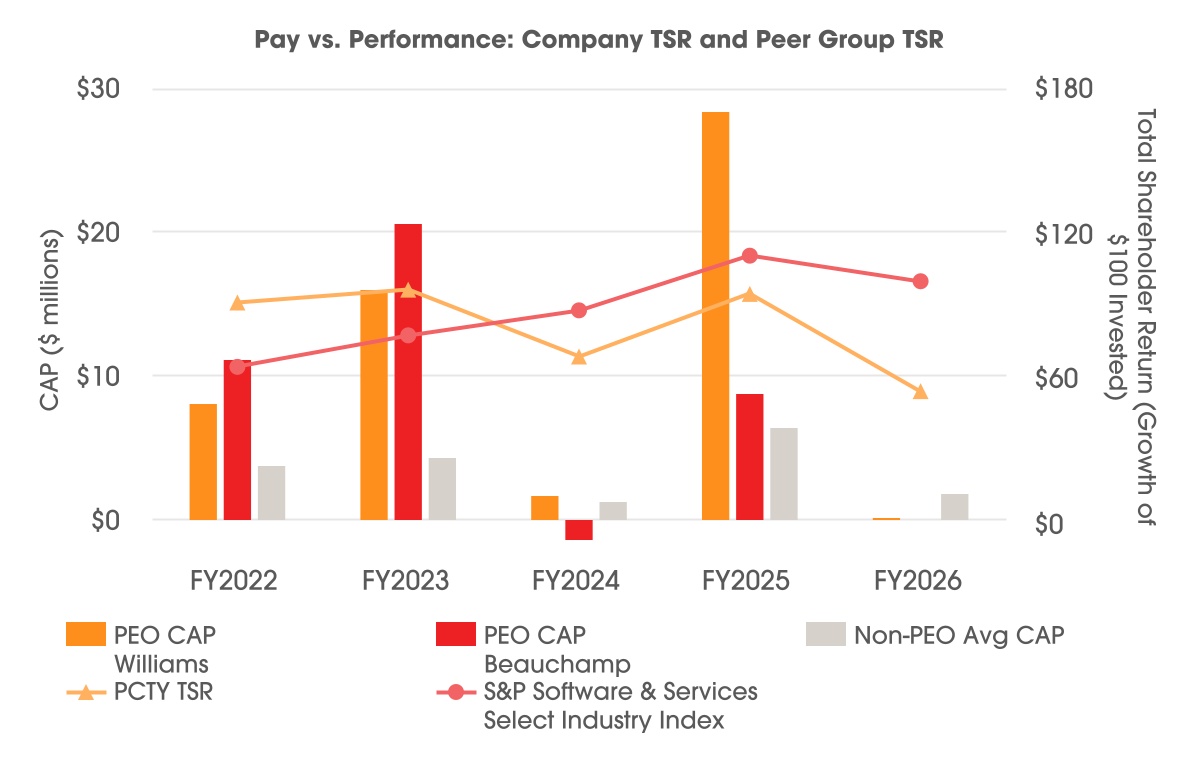
The following graph shows the relationship between compensation actually paid to our PEOs and the average compensation actually paid to our non-PEO named executive officers to total shareholder return for both Paylocity and the S&P Software & Services Select Industry Index for the years ended June 30, 2022, 2023, 2024, 2025 and 2026:
|
|
|
|
|
| Compensation Actually Paid vs. Net Income |
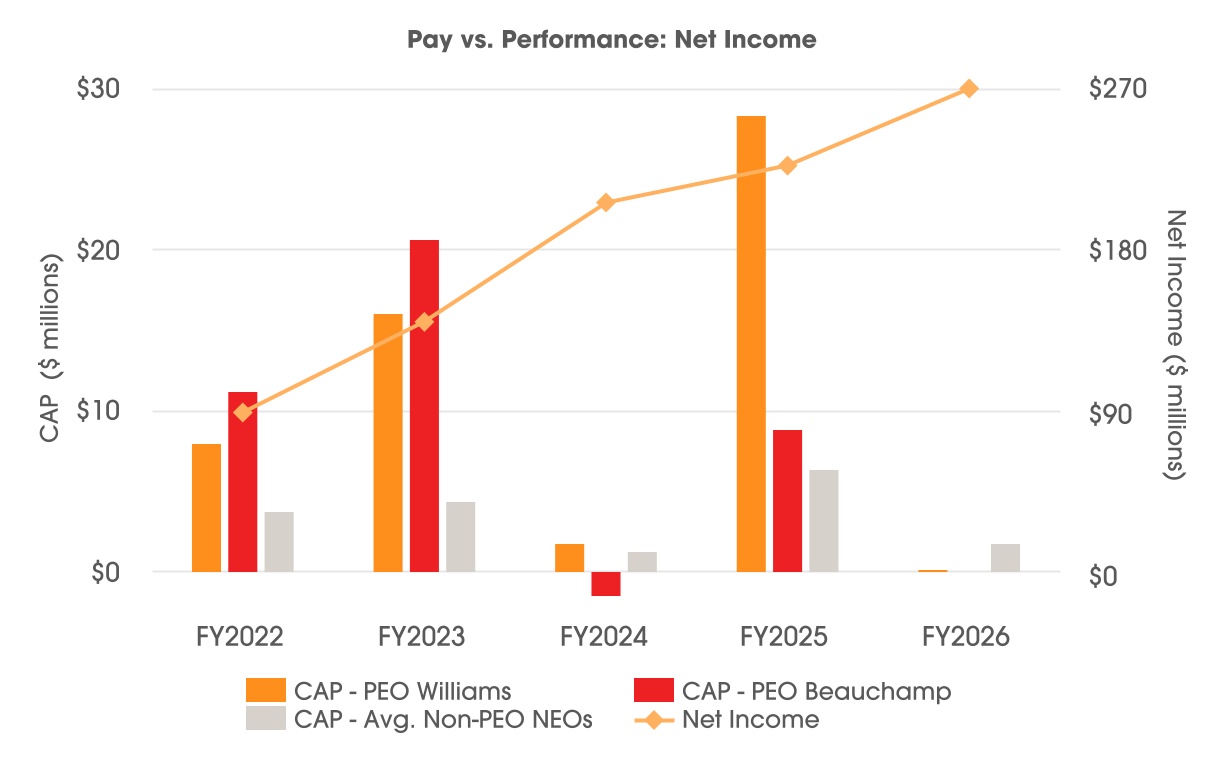
The following graph shows the relationship between compensation actually paid to our PEOs and the average compensation actually paid to our non-PEO named executive officers to net income for the years ended June 30, 2022, 2023, 2024, 2025 and 2026:
|
|
|
|
|
| Compensation Actually Paid vs. Company Selected Measure |
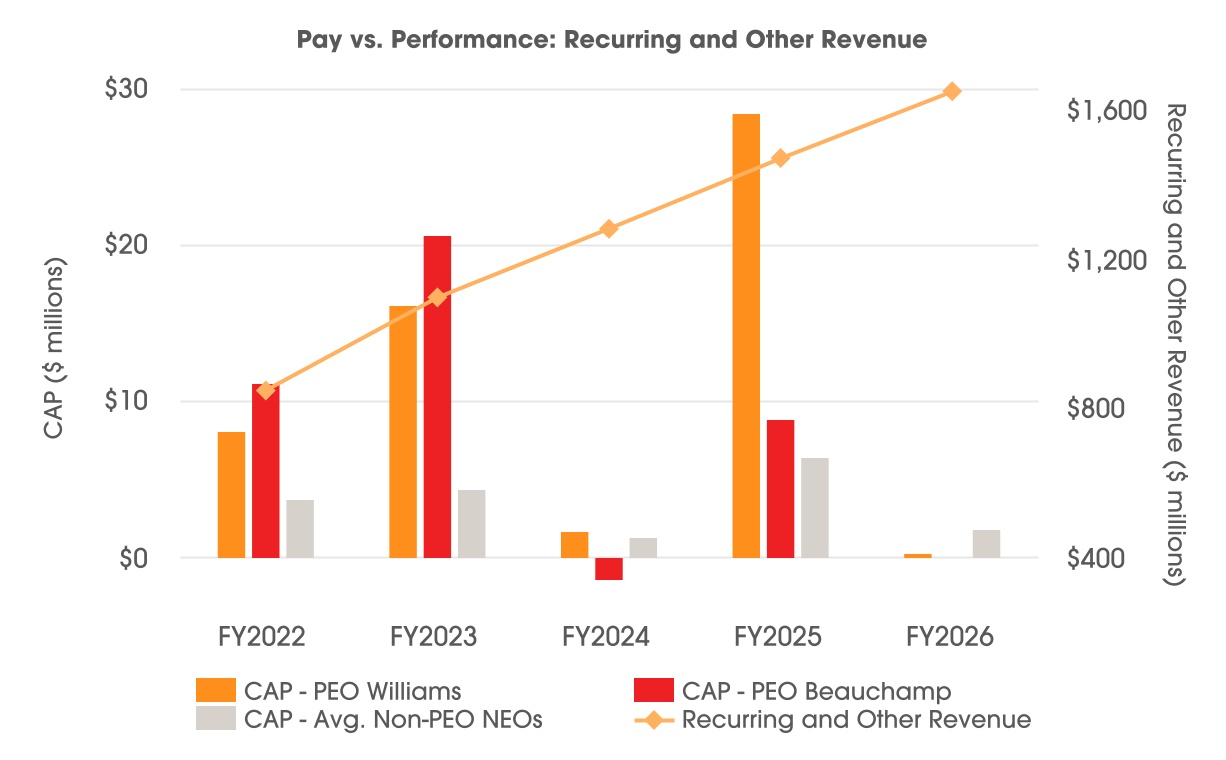
The following graph shows the relationship between compensation actually paid to our PEOs and the average compensation actually paid to our non-PEO named executive officers to recurring and other revenue for the years ended June 30, 2022, 2023, 2024, 2025 and 2026:
|
|
|
|
|
| Total Shareholder Return Vs Peer Group |
The peer group used for calculating Peer Group Total Shareholder Return is the S&P Software & Services Select Industry Index as of June 30 of each year presented, assuming an initial fixed $100 investment on June 30, 2021.
|
|
|
|
|
| Tabular List, Table |
The table below lists the financial performance measures we believe represent the most important financial performance measures used to link compensation actually paid to our named executive officers for the year ended June 30, 2026 to company performance. | | | | Most Important Financial Performance Measures | | Recurring and Other Revenue | | Adjusted EBITDA* | | Total Shareholder Return ("Company TSR") | | Relative TSR Against the Russell 3000 Index |
* Adjusted EBITDA is a non-GAAP financial measure. For information on Adjusted EBITDA, as defined by the Company, please see "Appendix A: Non-GAAP Financial Measures".
|
|
|
|
|
| Total Shareholder Return Amount |
$ 54.79
|
94.96
|
69.10
|
96.71
|
91.42
|
| Peer Group Total Shareholder Return Amount |
100.18
|
110.74
|
88.16
|
77.83
|
64.82
|
| Net Income (Loss) |
$ 269,700,000
|
$ 227,100,000
|
$ 206,800,000
|
$ 140,800,000
|
$ 90,800,000
|
| Company Selected Measure Amount |
1,651,400,000
|
1,471,800,000
|
1,281,700,000
|
1,098,000,000
|
847,700,000
|
| Measure:: 1 |
|
|
|
|
|
| Pay vs Performance Disclosure |
|
|
|
|
|
| Name |
Recurring and Other Revenue
|
|
|
|
|
| Measure:: 2 |
|
|
|
|
|
| Pay vs Performance Disclosure |
|
|
|
|
|
| Name |
Adjusted EBITDA*
|
|
|
|
|
| Non-GAAP Measure Description |
* Adjusted EBITDA is a non-GAAP financial measure. For information on Adjusted EBITDA, as defined by the Company, please see "Appendix A: Non-GAAP Financial Measures".
|
|
|
|
|
| Measure:: 3 |
|
|
|
|
|
| Pay vs Performance Disclosure |
|
|
|
|
|
| Name |
Total Shareholder Return ("Company TSR")
|
|
|
|
|
| Non-GAAP Measure Description |
The amounts reported in this column reflect the Company’s cumulative total shareholder return ("TSR") as of June 30 of each year presented, assuming an initial fixed $100 investment on June 30, 2021.
|
|
|
|
|
| Measure:: 4 |
|
|
|
|
|
| Pay vs Performance Disclosure |
|
|
|
|
|
| Name |
Relative TSR Against the Russell 3000 Index
|
|
|
|
|
| Williams [Member] |
|
|
|
|
|
| Pay vs Performance Disclosure |
|
|
|
|
|
| PEO Total Compensation Amount |
$ 23,473,564
|
$ 18,044,482
|
$ 14,737,065
|
$ 21,672,572
|
$ 8,422,470
|
| PEO Actually Paid Compensation Amount |
$ 145,214
|
$ 28,295,857
|
$ 1,664,676
|
$ 16,000,336
|
$ 7,958,073
|
| PEO Name |
Mr. Williams
|
Mr. Williams
|
Mr. Williams
|
Mr. Williams
|
Mr. Williams
|
| Williams [Member] | Equity Awards Adjustments |
|
|
|
|
|
| Pay vs Performance Disclosure |
|
|
|
|
|
| Adjustment to Compensation, Amount |
$ (23,328,350)
|
|
|
|
|
| Williams [Member] | Aggregate Grant Date Fair Value of Equity Award Amounts Reported in Summary Compensation Table |
|
|
|
|
|
| Pay vs Performance Disclosure |
|
|
|
|
|
| Adjustment to Compensation, Amount |
(21,557,447)
|
|
|
|
|
| Williams [Member] | Year-end Fair Value of Equity Awards Granted in Covered Year that are Outstanding and Unvested |
|
|
|
|
|
| Pay vs Performance Disclosure |
|
|
|
|
|
| Adjustment to Compensation, Amount |
10,894,797
|
|
|
|
|
| Williams [Member] | Year-over-Year Change in Fair Value of Equity Awards Granted in Prior Years That are Outstanding and Unvested |
|
|
|
|
|
| Pay vs Performance Disclosure |
|
|
|
|
|
| Adjustment to Compensation, Amount |
(12,772,279)
|
|
|
|
|
| Williams [Member] | Vesting Date Fair Value of Equity Awards Granted and Vested in Covered Year |
|
|
|
|
|
| Pay vs Performance Disclosure |
|
|
|
|
|
| Adjustment to Compensation, Amount |
2,275,173
|
|
|
|
|
| Williams [Member] | Change in Fair Value as of Vesting Date of Prior Year Equity Awards Vested in Covered Year |
|
|
|
|
|
| Pay vs Performance Disclosure |
|
|
|
|
|
| Adjustment to Compensation, Amount |
(2,168,594)
|
|
|
|
|
| Beauchamp [Member] |
|
|
|
|
|
| Pay vs Performance Disclosure |
|
|
|
|
|
| PEO Total Compensation Amount |
0
|
$ 3,044,516
|
$ 11,137,431
|
$ 21,583,365
|
$ 15,292,725
|
| PEO Actually Paid Compensation Amount |
$ 0
|
$ 8,767,719
|
$ (1,454,508)
|
$ 20,565,161
|
$ 11,093,807
|
| PEO Name |
Mr. Beauchamp
|
Mr. Beauchamp
|
Mr. Beauchamp
|
Mr. Beauchamp
|
Mr. Beauchamp
|
| Non-PEO NEO | Equity Awards Adjustments |
|
|
|
|
|
| Pay vs Performance Disclosure |
|
|
|
|
|
| Adjustment to Compensation, Amount |
$ (4,243,226)
|
|
|
|
|
| Non-PEO NEO | Aggregate Grant Date Fair Value of Equity Award Amounts Reported in Summary Compensation Table |
|
|
|
|
|
| Pay vs Performance Disclosure |
|
|
|
|
|
| Adjustment to Compensation, Amount |
(4,693,981)
|
|
|
|
|
| Non-PEO NEO | Year-end Fair Value of Equity Awards Granted in Covered Year that are Outstanding and Unvested |
|
|
|
|
|
| Pay vs Performance Disclosure |
|
|
|
|
|
| Adjustment to Compensation, Amount |
2,433,898
|
|
|
|
|
| Non-PEO NEO | Year-over-Year Change in Fair Value of Equity Awards Granted in Prior Years That are Outstanding and Unvested |
|
|
|
|
|
| Pay vs Performance Disclosure |
|
|
|
|
|
| Adjustment to Compensation, Amount |
(1,963,475)
|
|
|
|
|
| Non-PEO NEO | Vesting Date Fair Value of Equity Awards Granted and Vested in Covered Year |
|
|
|
|
|
| Pay vs Performance Disclosure |
|
|
|
|
|
| Adjustment to Compensation, Amount |
446,559
|
|
|
|
|
| Non-PEO NEO | Change in Fair Value as of Vesting Date of Prior Year Equity Awards Vested in Covered Year |
|
|
|
|
|
| Pay vs Performance Disclosure |
|
|
|
|
|
| Adjustment to Compensation, Amount |
$ (466,227)
|
|
|
|
|