Wabtec Reports Strong Third Quarter 2026 Results
Raised and Tightened Adjusted EPS Guidance
| | | | | | | | | | | | | | | | | | | | | | | | |
| SALES | | GAAP DILUTED
EARNINGS PER SHARE | | ADJUSTED DILUTED
EARNINGS PER SHARE | |
| 3Q’26 | 3Q YTD ’26 | | 3Q’26 | 3Q YTD ’26 | | 3Q’26 | 3Q YTD ’26 | |
| | | | | | | | | | | | | | | | | | | | | | | | | | |
| $3.12B | $9.25B | | $2.42 | $6.86 | | $2.83 | | $8.29 |
| +8.1% YOY | +12.8%YOY | | +33.7% YOY | +21.6% YOY | | +22.0% YOY | | +20.5% YOY |
Q3 2026 HIGHLIGHTS
| | |
| “Wabtec delivered another strong quarter, evidenced by sales growth, margin expansion and a 22% increase in adjusted EPS,” said Rafael Santana, Wabtec’s Chairman and CEO. |
| “The strength of our performance reflects our momentum across the portfolio, disciplined execution by our teams, and the continued success of our strategic actions. These actions enhance our growth profile, expand margins, and increase the earnings power of the company. |
| “Our teams continue to translate healthy customer demand into profitable growth while investing in technologies that will advance the future of transportation. These investments are strengthening our competitive position and reinforcing Wabtec as a leading Industrial Technology Company” |
| Rafael Santana Chairman and CEO |
•Sales Growth of 8.1% to $3.12 Billion Driven by Both the Freight and Transit Segments
•GAAP Operating Margin at 20.0%; Adjusted Operating Margin Up 1.9 pts to 22.9%
•GAAP Earnings Per Share of $2.42, Up 33.7%; Adjusted Earnings Per Share of $2.83, Up 22.0%
•Raised and Tightened 2026 Adjusted Earnings Per Share Guidance; up 22% at the midpoint
PITTSBURGH, October 21, 2026 – Wabtec Corporation (NYSE: WAB) today reported third quarter 2026 GAAP earnings per diluted share of $2.42, up 33.7% versus the third quarter of 2025. Adjusted earnings per diluted share were $2.83, up 22.0% versus the same quarter a year ago. Third quarter sales were $3.12 billion and cash from operations was $455 million.
2026 Third Quarter Consolidated Results | | | | | | | | | | | | | | |
| Wabtec Corporation Consolidated Financial Results | |
| $ in millions except earnings per share and percentages; margin change in percentage points (pts) | Third Quarter | |
| 2026 | 2025 | Change | |
| Net Sales | $3,120 | $2,886 | 8.1 | % | |
| | | | |
| GAAP Gross Margin | 37.3 | % | 34.7 | % | 2.6 pts | |
| Adjusted Gross Margin | 37.4 | % | 35.6 | % | 1.8 pts | |
| GAAP Operating Margin | 20.0 | % | 17.0 | % | 3.0 pts | |
| Adjusted Operating Margin | 22.9 | % | 21.0 | % | 1.9 pts | |
| | | | |
| GAAP Diluted EPS | $2.42 | $1.81 | 33.7 | % | |
| Adjusted Diluted EPS | $2.83 | $2.32 | 22.0 | % | |
| | | | |
| Cash Flow from Operations | $455 | $367 | $88 | |
| Operating Cash Flow Conversion | 82 | % | 83 | % | | |
•Sales increased 8.1% compared to the year-ago quarter driven by higher sales in the Freight and Transit segments, which includes the acquisitions of Frauscher Sensor Technologies and Dellner Couplers.
•GAAP operating margin was higher than the prior year at 20.0%, and adjusted operating margin was higher than the prior year at 22.9%. Both GAAP and adjusted operating margins benefited from sales growth and improved gross margins in the quarter.
•GAAP EPS and adjusted EPS increased from the year-ago quarter primarily due to higher sales, operating margin expansion, and non-operational benefits primarily related to currency fluctuations.
2026 Third Quarter Freight Segment Results
| | | | | | | | | | | |
| Wabtec Corporation Freight Segment Financial Results |
| Net sales $ in millions; margin change in percentage points (pts) | Third Quarter |
| 2026 | 2025 | Change |
| Net Sales | $2,237 | $2,093 | 6.9 | % |
| GAAP Gross Margin | 38.5 | % | 35.8 | % | 2.7 pts |
| Adjusted Gross Margin | 38.5 | % | 37.0 | % | 1.5 pts |
| GAAP Operating Margin | 23.0 | % | 19.8 | % | 3.2 pts |
| Adjusted Operating Margin | 26.4 | % | 24.5 | % | 1.9 pts |
•Freight segment sales for the third quarter were up 6.9%. Services sales were up 6.7% driven by core services demand and higher modernization deliveries, while Equipment sales were up 0.3% due to increased mining sales, which were partially offset by lower locomotive deliveries. Digital sales were up 24.2% driven by the acquisition of Frauscher Sensor Technologies and strong core digital demand. Components sales were up 5.3% driven by industrial, maintenance of way, and international demand which offset lower North America rail build and portfolio optimization efforts.
•GAAP and adjusted operating margin benefited from gross margin improvements and lower operating expenses as a percentage of revenue.
2026 Third Quarter Transit Segment Results
| | | | | | | | | | | |
| Wabtec Corporation Transit Segment Financial Results |
| Net sales $ in millions; margin change in percentage points (pts) | Third Quarter |
| 2026 | 2025 | Change |
| Net Sales | $883 | $793 | 11.3 | % |
| GAAP Gross Margin | 34.5 | % | 31.7 | % | 2.8 pts |
| Adjusted Gross Margin | 34.6 | % | 31.8 | % | 2.8 pts |
| GAAP Operating Margin | 16.4 | % | 14.5 | % | 1.9 pts |
| Adjusted Operating Margin | 18.1 | % | 15.5 | % | 2.6 pts |
•Transit segment sales for the third quarter were up 11.3% driven by the acquisition of Dellner Couplers, and higher OE and aftermarket sales which was partially offset by unfavorable foreign currency exchange. Sales were up 12.5% on a constant currency basis.
•GAAP and adjusted operating margins were up as a result of improved gross margins which were partially offset by higher operating expenses as a percentage of revenue.
Backlog
| | | | | | | | | | | |
| Wabtec Corporation Consolidated Backlog Comparison |
| Backlog $ in millions | September 30, |
| 2026 | 2025 | Change |
| 12-Month Backlog | $8,992 | $8,267 | 8.8 | % |
| Total Backlog | $31,435 | $25,577 | 22.9 | % |
•The Company’s multi-year backlog continues to provide strong visibility. At September 30, 2026, the 12-month backlog was $0.73 billion higher than the prior year period. At September 30, 2026, the multi-year backlog was $5.86 billion higher than the prior year period, and excluding foreign currency exchange, the multi-year backlog was $5.46 billion higher, up 21.4%.
Cash Flow and Liquidity Summary
•During the third quarter, the Company generated cash from operations of $455 million versus $367 million in the year ago period. The increase in cash was driven by higher net income.
•At the end of the quarter, the Company had cash, cash equivalents and restricted cash of $0.49 billion and total debt of $6.38 billion. At September 30, 2026, the Company’s total available liquidity was $2.09 billion, which includes $0.48 billion in cash and cash equivalents plus $1.61 billion available under current credit facilities.
•During the quarter, the Company repurchased $305 million of Wabtec shares and paid $52 million in dividends.
2026 Financial Guidance
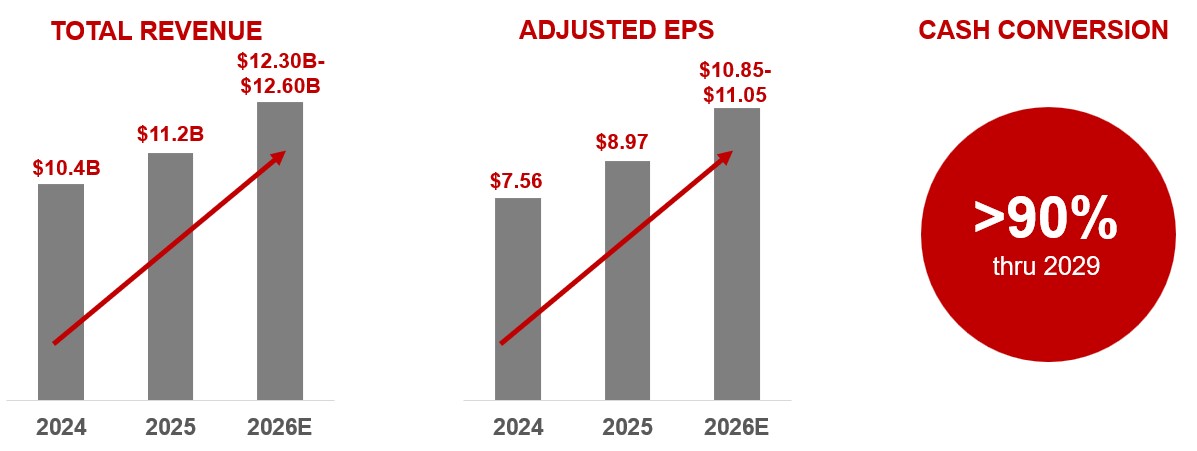
•Wabtec raised and tightened its 2026 adjusted EPS guidance range to $10.85 - $11.05, raising it $0.20 at the midpoint, or up 22.0% versus prior year.
•For the full year 2026, Wabtec continues to expect revenues to be between $12.30 billion to $12.60 billion, up 11.5% at the midpoint versus prior year.
About Wabtec
Wabtec Corporation (NYSE: WAB) is revolutionizing the way the world moves for future generations. The company is a leading global provider of equipment, systems, digital solutions and value-added services for the freight and transit rail industries, as well as the mining, marine and industrial markets. Wabtec has been a leader in the rail industry for over 155 years and has a vision to achieve a sustainable rail system in the U.S. and worldwide. Visit Wabtec’s website at www.wabteccorp.com.
Forecasted GAAP Earnings Reconciliation
Wabtec is not presenting a quantitative reconciliation of our forecasted GAAP earnings per diluted share to forecasted adjusted earnings per diluted share because it is unable to predict with reasonable certainty and without unreasonable effort the impact and timing of restructuring-related and other charges, including acquisition-related expenses and the outcome of certain regulatory, legal and tax matters. The financial impact of these items is uncertain and is dependent on various factors, including timing, and could be material to our Consolidated Statements of Earnings.
Conference Call Information
Wabtec will host a call with analysts and investors at 8:30 a.m. ET, today. To listen via webcast, go to Wabtec’s website at www.WabtecCorp.com and click on “Events & Presentations” in the “Investor Relations” section. Also, an audio replay of the call will be available by calling 1-855-669-9658 or 1-412-317-0088 (access code: 9897430).
Information about non-GAAP Financial Information and Forward-Looking Statements
Wabtec’s earnings release and 2026 financial guidance mentions certain non-GAAP financial performance measures, including adjusted gross profit, adjusted operating expenses, adjusted operating margin, adjusted gross margin, EBITDA, adjusted EBITDA, adjusted income tax expense, adjusted income from operations, adjusted interest and other expense, adjusted net income, adjusted earnings per diluted share and operating cash flow conversion. Wabtec defines EBITDA as earnings before interest, taxes, depreciation and amortization. Adjusted EBITDA is further adjusted by restructuring costs. Wabtec defines operating cash flow conversion as net cash provided by operating activities divided by net income plus depreciation and amortization including deferred debt cost amortization. While Wabtec believes these are useful supplemental measures for investors, they are not presented in accordance with GAAP. Investors should not consider non-GAAP measures in isolation or as a substitute for net income, cash flows from operations, or any other items calculated in accordance with GAAP. In addition, the non-GAAP financial measures included in this release have inherent material limitations as performance measures because they add back certain expenses incurred by the Company to GAAP financial measures, resulting in those expenses not being taken into account in the applicable non-GAAP financial measure. Because not all companies use identical calculations, Wabtec’s presentation of non-GAAP financial measures may not be comparable to other similarly titled measures of other companies. Included in this release are reconciliation tables that provide details about how adjusted results relate to GAAP results.
This communication contains “forward-looking” statements as that term is defined in Section 27A of the Securities Act of 1933, and Section 21E of the Securities Exchange Act of 1934, as amended by the Private Securities Litigation Reform Act of 1995. All statements, other than historical facts, including statements regarding Wabtec’s plans, objectives, expectations and intentions; Wabtec’s expectations about future sales, earnings and cash conversion; and any assumptions underlying any of the foregoing, are forward-looking statements. Forward-looking statements concern future circumstances and results and other statements that are not historical facts and are sometimes identified by the words “may,” “will,” “should,” “potential,” “intend,” “expect,” “endeavor,” “seek,” “anticipate,” “estimate,” “overestimate,” “underestimate,” “believe,” “could,” “project,” “predict,” “continue,” “target” or other similar words or expressions. Forward-looking statements are based upon current plans, estimates and expectations that are subject to risks, uncertainties and assumptions. Should one or more of these risks or uncertainties materialize, or should underlying assumptions prove incorrect, actual results may vary materially from those indicated or anticipated by such forward-looking statements. The inclusion of such statements should not be regarded as a representation that such plans, estimates or expectations will be achieved. Important factors that could cause actual results to differ materially from such plans, estimates or expectations include, among others, (1) changes in general economic and/or industry specific conditions, including the impacts of significant recent shifts in trade policies (including the actual or threatened imposition of tariffs and retaliatory tariff measures) as well as tax programs, inflation, supply chain disruptions, foreign currency exchange and industry consolidation and market reactions to these factors; (2) changes in the financial condition or operating strategies of Wabtec’s customers; (3) unexpected costs, charges or expenses resulting from acquisitions and potential failure to realize synergies and other anticipated benefits of acquisitions, including as a result of integrating acquired targets into Wabtec; (4) inability to retain and hire key personnel; (5) evolving legal, regulatory and tax regimes; (6) changes in the expected timing of projects; (7) a decrease in freight or passenger rail traffic; (8) an increase in manufacturing costs; (9) actions by third parties, including government agencies; (10) the impacts of epidemics, pandemics or similar public health crises on the global economy and, in particular, our customers, suppliers and end-markets, (11) potential disruptions, instability and volatility in global markets as a result of global military action, acts of terrorism or armed conflict, including Russia’s invasion of Ukraine and ongoing military conflicts in the Middle East; (12) cybersecurity and data protection risks and (13) other risk factors as detailed from time to time in Wabtec’s reports filed with the SEC, including Wabtec’s annual report on Form 10-K, periodic quarterly reports on Form 10-Q, current reports on Form 8-K and other documents filed with the SEC. The foregoing list of important factors is not exclusive. Any forward-looking statements speak only as of the date of this communication. Wabtec does not undertake any obligation to update any forward-looking statements, whether as a result of new information or development, future events or otherwise, except as required by law. Readers are cautioned not to place undue reliance on any of these forward-looking statements.
Wabtec Investor Contact
Kyra Yates / Kyra.Yates@wabtec.com / 817-349-2735
Wabtec Media Contact
Tim Bader / Tim.Bader@wabtec.com / 682-319-7925
WESTINGHOUSE AIR BRAKE TECHNOLOGIES CORPORATION
CONDENSED CONSOLIDATED STATEMENTS OF INCOME
FOR THE THREE AND NINE MONTHS ENDED SEPTEMBER 30, 2026 AND 2025
(AMOUNTS IN MILLIONS EXCEPT PER SHARE DATA)
(UNAUDITED)
| | | | | | | | | | | | | | | | | | | | | | | |
| Three Months Ended
September 30, | | Nine Months Ended
September 30, |
| |
| 2026 | | 2025 | | 2026 | | 2025 |
| | | | | | | |
| Net sales | $ | 3,120 | | | $ | 2,886 | | | $ | 9,249 | | | $ | 8,202 | |
| Cost of sales | (1,956) | | | (1,884) | | | (5,863) | | | (5,362) | |
| Gross profit | 1,164 | | | 1,002 | | | 3,386 | | | 2,840 | |
| Gross profit as a % of Net sales | 37.3 | % | | 34.7 | % | | 36.6 | % | | 34.6 | % |
| | | | | | | |
| Selling, general and administrative expenses | (383) | | | (375) | | | (1,184) | | | (1,029) | |
| Engineering expenses | (67) | | | (59) | | | (193) | | | (155) | |
| Amortization expense | (89) | | | (77) | | | (267) | | | (219) | |
| Total operating expenses | (539) | | | (511) | | | (1,644) | | | (1,403) | |
| Operating expenses as a % of Net sales | 17.3 | % | | 17.7 | % | | 17.8 | % | | 17.1 | % |
| | | | | | | |
| Income from operations | 625 | | | 491 | | | 1,742 | | | 1,437 | |
| Income from operations as a % of Net sales | 20.0 | % | | 17.0 | % | | 18.8 | % | | 17.5 | % |
| | | | | | | |
| Interest expense, net | (80) | | | (65) | | | (231) | | | (157) | |
| Other income (expense), net | 12 | | | (1) | | | 33 | | | 21 | |
| Income before income taxes | 557 | | | 425 | | | 1,544 | | | 1,301 | |
| | | | | | | |
| Income tax expense | (146) | | | (112) | | | (374) | | | (322) | |
| Effective tax rate | 26.3 | % | | 26.4 | % | | 24.2 | % | | 24.8 | % |
| | | | | | | |
| Net income | 411 | | | 313 | | | 1,170 | | | 979 | |
| | | | | | | |
| Less: Net income attributable to noncontrolling interest | (2) | | | (3) | | | (4) | | | (11) | |
| | | | | | | |
| Net income attributable to Wabtec shareholders | $ | 409 | | | $ | 310 | | | $ | 1,166 | | | $ | 968 | |
| | | | | | | |
| Earnings Per Common Share | | | | | | | |
| Basic | | | | | | | |
| Net income attributable to Wabtec shareholders | $ | 2.43 | | | $ | 1.81 | | | $ | 6.88 | | | $ | 5.66 | |
| Diluted | | | | | | | |
| Net income attributable to Wabtec shareholders | $ | 2.42 | | | $ | 1.81 | | | $ | 6.86 | | | $ | 5.64 | |
| | | | | | | |
| Weighted average shares outstanding | | | | | | | |
| Basic | 168.2 | | | 170.5 | | | 169.1 | | | 170.5 | |
| Diluted | 168.8 | | | 171.1 | | | 169.7 | | | 171.2 | |
| | | | | | | |
WESTINGHOUSE AIR BRAKE TECHNOLOGIES CORPORATION
CONDENSED CONSOLIDATED STATEMENTS OF INCOME (CONTINUED)
FOR THE THREE AND NINE MONTHS ENDED SEPTEMBER 30, 2026 AND 2025
(AMOUNTS IN MILLIONS EXCEPT PER SHARE DATA)
(UNAUDITED)
| | | | | | | | | | | | | | | | | | | | | | | | | | |
| Three Months Ended
September 30, | | Nine Months Ended
September 30, | | |
| | | |
| 2026 | | 2025 | | 2026 | | 2025 | | | |
| Segment Information | | | | | | | | | | |
| Freight Net sales | $ | 2,237 | | | $ | 2,093 | | | $ | 6,595 | | | $ | 5,913 | | | | |
| Freight Income from operations | $ | 515 | | | $ | 414 | | | $ | 1,469 | | | $ | 1,249 | | | | |
| Freight Operating margin | 23.0 | % | | 19.8 | % | | 22.3 | % | | 21.1 | % | | | |
| | | | | | | | | | |
| Transit Net sales | $ | 883 | | | $ | 793 | | | $ | 2,654 | | | $ | 2,289 | | | | |
| Transit Income from operations | $ | 145 | | | $ | 115 | | | $ | 412 | | | $ | 314 | | | | |
| Transit Operating margin | 16.4 | % | | 14.5 | % | | 15.5 | % | | 13.7 | % | | | |
| | | | | | | | | | |
| Backlog Information (Note: 12-month is a sub-set of total) | September 30, 2026 | | June 30, 2026 | | September 30, 2025 | | | | | |
| Freight Total | $ | 25,765 | | | $ | 25,332 | | | $ | 20,907 | | | | | | |
| Transit Total | 5,670 | | | 5,600 | | | 4,670 | | | | | | |
| Wabtec Total | $ | 31,435 | | | $ | 30,932 | | | $ | 25,577 | | | | | | |
| | | | | | | | | | |
| Freight 12-month | $ | 6,544 | | | $ | 6,638 | | | $ | 6,085 | | | | | | |
| Transit 12-month | 2,448 | | | 2,502 | | | 2,182 | | | | | | |
| Wabtec 12-month | $ | 8,992 | | | $ | 9,140 | | | $ | 8,267 | | | | | | |
WESTINGHOUSE AIR BRAKE TECHNOLOGIES CORPORATION
CONDENSED CONSOLIDATED BALANCE SHEETS
(UNAUDITED)
| | | | | | | | | | | |
| September 30, 2026 | | December 31, 2025 |
| In millions | | | |
| Cash, cash equivalents and restricted cash | $ | 489 | | | $ | 789 | |
| Receivables, net | 2,264 | | | 1,897 | |
| Inventories, net | 2,946 | | | 2,745 | |
| Other current assets | 352 | | | 263 | |
| Total current assets | 6,051 | | | 5,694 | |
| Property, plant and equipment, net | 1,672 | | | 1,616 | |
| Goodwill | 10,621 | | | 10,216 | |
| Other intangible assets, net | 4,032 | | | 3,838 | |
| Other noncurrent assets | 765 | | | 705 | |
| Total Assets | $ | 23,141 | | | $ | 22,069 | |
| Current liabilities | $ | 5,500 | | | $ | 5,150 | |
| Long-term debt | 4,665 | | | 4,291 | |
| Other long-term liabilities | 1,612 | | | 1,438 | |
| Total Liabilities | 11,777 | | | 10,879 | |
| Shareholders' equity | 11,333 | | | 11,142 | |
| Noncontrolling interest | 31 | | | 48 | |
| Total Equity | 11,364 | | | 11,190 | |
| Total Liabilities and Equity | $ | 23,141 | | | $ | 22,069 | |
WESTINGHOUSE AIR BRAKE TECHNOLOGIES CORPORATION
CONDENSED CONSOLIDATED STATEMENTS OF CASH FLOWS
(UNAUDITED)
| | | | | | | | | | | |
| Nine Months Ended
September 30, |
| 2026 | | 2025 |
| In millions | | | |
| Operating activities | | | |
| Net income | $ | 1,170 | | | $ | 979 | |
| Non-cash expense | 466 | | | 357 | |
| Receivables | (342) | | | (368) | |
| Inventories | (100) | | | (228) | |
| Accounts payable | 67 | | | 76 | |
| Other operating activities | (166) | | | (49) | |
| Net cash provided by operating activities | 1,095 | | | 767 | |
| | | |
| Net cash used for investing activities | (1,243) | | | (1,887) | |
| | | |
| Net cash (used for) provided by financing activities | (147) | | | 907 | |
| | | |
| Effect of changes in currency exchange rates | (5) | | | 26 | |
| | | |
| Decrease in cash | (300) | | | (187) | |
| | | |
| Cash, cash equivalents and restricted cash, beginning of period | 789 | | | 715 | |
| Cash, cash equivalents and restricted cash, end of period | $ | 489 | | | $ | 528 | |
| | | |
Set forth below is the calculation of the non-GAAP performance measures included in this press release. We believe that these measures provide useful supplemental information to assess our operating performance and to evaluate period-to-period comparisons. Non-GAAP financial measures should be viewed in addition to, and not as an alternative for, Wabtec’s reported results prepared in accordance with GAAP.
| | | | | | | | | | | | | | | | | | | | | | | | | | | | | | | | | | | | | | | | | | | | | | | | | | | | | | | | | | | | | | | | | |
| Wabtec Corporation | | | | | | | | | | | | | | | | | | | | |
| Reconciliation of Reported Results to Adjusted Results | | | | | | | | | | | | | | | | | |
| (in millions) | | Third Quarter 2026 Actual Results | |
| | Net | | Gross | | Operating | | Income from | | Interest & | | | | Net | | Noncontrolling | | Wabtec | | | |
| | Sales | | Profit | | Expenses | | Operations | | Other Exp | | Tax | | Income | | Interest | | Net Income | | EPS | |
| | | | | | | | | | | | | | | | | | | | | |
| Reported Results | $ | 3,120 | | | $ | 1,164 | | | $ | (539) | | | $ | 625 | | | $ | (68) | | | $ | (146) | | | $ | 411 | | | $ | (2) | | | $ | 409 | | | $ | 2.42 | | |
| | | | | | | | | | | | | | | | | | | | | |
| Restructuring and Portfolio Optimization costs | — | | | 2 | | | (1) | | | 1 | | | 4 | | | (1) | | | 4 | | | — | | | 4 | | | $ | 0.02 | | |
| | | | | | | | | | | | | | | | | | | | | |
| | | | | | | | | | | | | | | | | | | | |
| | | | | | | | | | | | | | | | | | | | | |
| | | | | | | | | | | | | | | | | | | | | |
| | | | | | | | | | | | | | | | | | | | | |
| Non-cash Amortization expense | — | | | — | | | 89 | | | 89 | | | — | | | (24) | | | 65 | | | — | | | 65 | | | $ | 0.39 | | |
| | | | | | | | | | | | | | | | | | | | | |
| Adjusted Results | $ | 3,120 | | | $ | 1,166 | | | $ | (451) | | | $ | 715 | | | $ | (64) | | | $ | (171) | | | $ | 480 | | | $ | (2) | | | $ | 478 | | | $ | 2.83 | | |
| | | | | | | | | | | | | | | | | | | | |
| Fully Diluted Shares Outstanding | | | | | | | | | | | | | | | | | | | 168.8 | | |
| | | | | | | | | | | | | | | | | | | | | |
| | | | | | | | | | | | | | | | | | | | | |
| | | | | | | | | | | | | | | | | | | | | |
| Wabtec Corporation | | | | | | | | | | | | | | | | | | | | |
| Reconciliation of Reported Results to Adjusted Results | | | | | | | | | | | | | | | | | |
| (in millions) | | Third Quarter Year-to-Date 2026 Actual Results | |
| | Net | | Gross | | Operating | | Income from | | Interest & | | | | Net | | Noncontrolling | | Wabtec | | | |
| | Sales | | Profit | | Expenses | | Operations | | Other Exp | | Tax | | Income | | Interest | | Net Income | | EPS | |
| | | | | | | | | | | | | | | | | | | | | |
| Reported Results | $ | 9,249 | | | $ | 3,386 | | | $ | (1,644) | | | $ | 1,742 | | | $ | (198) | | | $ | (374) | | | $ | 1,170 | | | $ | (4) | | | $ | 1,166 | | | $ | 6.86 | | |
| | | | | | | | | | | | | | | | | | | | | |
| Restructuring and Portfolio Optimization costs | — | | | 5 | | | 1 | | | 6 | | | 4 | | | (2) | | | 8 | | | — | | | 8 | | | $ | 0.04 | | |
| | | | | | | | | | | | | | | | | | | | | |
| Inventory Purchase Accounting charge | — | | | 28 | | | — | | | 28 | | | — | | | (7) | | | 21 | | | — | | | 21 | | | $ | 0.13 | | |
| | | | | | | | | | | | | | | | | | | | | |
| Transaction costs | — | | | — | | | 14 | | | 14 | | | (2) | | | — | | | 12 | | | — | | | 12 | | | $ | 0.07 | | |
| | | | | | | | | | | | | | | | | | | | | |
| Non-cash Amortization expense | — | | | — | | | 267 | | | 267 | | | — | | | (65) | | | 202 | | | — | | | 202 | | | $ | 1.19 | | |
| | | | | | | | | | | | | | | | | | | | | |
| Adjusted Results | $ | 9,249 | | | $ | 3,419 | | | $ | (1,362) | | | $ | 2,057 | | | $ | (196) | | | $ | (448) | | | $ | 1,413 | | | $ | (4) | | | $ | 1,409 | | | $ | 8.29 | | |
| | | | | | | | | | | | | | | | | | | | |
| Fully Diluted Shares Outstanding | | | | | | | | | | | | | | | | | | | 169.7 | | |
| | | | | | | | | | | | | | | | | | | | | |
Set forth below is the calculation of the non-GAAP performance measures included in this press release. We believe that these measures provide useful supplemental information to assess our operating performance and to evaluate period-to-period comparisons. Non-GAAP financial measures should be viewed in addition to, and not as an alternative for, Wabtec’s reported results prepared in accordance with GAAP.
| | | | | | | | | | | | | | | | | | | | | | | | | | | | | | | | | | | | | | | | | | | | | | | | | | | | | | | | | | | | | | | | | |
| Wabtec Corporation | | | | | | | | | | | | | | | | | | | | |
| Reconciliation of Reported Results to Adjusted Results | | | | | | | | | | | | | | | | | |
| (in millions) | | Third Quarter 2025 Actual Results | |
| | Net | | Gross | | Operating | | Income from | | Interest & | | | | Net | | Noncontrolling | | Wabtec | | | |
| | Sales | | Profit | | Expenses | | Operations | | Other Exp | | Tax | | Income | | Interest | | Net Income | | EPS | |
| | | | | | | | | | | | | | | | | | | | | |
| Reported Results | $ | 2,886 | | | $ | 1,002 | | | $ | (511) | | | $ | 491 | | | $ | (66) | | | $ | (112) | | | $ | 313 | | | $ | (3) | | | $ | 310 | | | $ | 1.81 | | |
| | | | | | | | | | | | | | | | | | | | | |
| Restructuring and Portfolio Optimization costs | — | | | 2 | | | 4 | | | 6 | | | — | | | (1) | | | 5 | | | — | | | 5 | | | $ | 0.02 | | |
| | | | | | | | | | | | | | | | | | | | | |
| Inventory Purchase Accounting charge | — | | | 24 | | | — | | | 24 | | | — | | | (6) | | | 18 | | | — | | | 18 | | | $ | 0.11 | | |
| | | | | | | | | | | | | | | | | | | | | |
| Transaction costs | — | | | — | | | 9 | | | 9 | | | 2 | | | (3) | | | 8 | | | — | | | 8 | | | $ | 0.05 | | |
| | | | | | | | | | | | | | | | | | | | | |
| Non-cash Amortization expense | — | | | — | | | 77 | | | 77 | | | — | | | (20) | | | 57 | | | — | | | 57 | | | $ | 0.33 | | |
| | | | | | | | | | | | | | | | | | | | | |
| Adjusted Results | $ | 2,886 | | | $ | 1,028 | | | $ | (421) | | | $ | 607 | | | $ | (64) | | | $ | (142) | | | $ | 401 | | | $ | (3) | | | $ | 398 | | | $ | 2.32 | | |
| | | | | | | | | | | | | | | | | | | | |
| Fully Diluted Shares Outstanding | | | | | | | | | | | | | | | | | | | 171.1 | | |
| | | | | | | | | | | | | | | | | | | | | |
| | | | | | | | | | | | | | | | | | | | | |
| | | | | | | | | | | | | | | | | | | | | |
| Wabtec Corporation | | | | | | | | | | | | | | | | | | | | |
| Reconciliation of Reported Results to Adjusted Results | | | | | | | | | | | | | | | | | |
| (in millions) | | Third Quarter Year-to-Date 2025 Actual Results | |
| | Net | | Gross | | Operating | | Income from | | Interest & | | | | Net | | Noncontrolling | | Wabtec | | | |
| | Sales | | Profit | | Expenses | | Operations | | Other Exp | | Tax | | Income | | Interest | | Net Income | | EPS | |
| | | | | | | | | | | | | | | | | | | | | |
| Reported Results | $ | 8,202 | | | $ | 2,840 | | | $ | (1,403) | | | $ | 1,437 | | | $ | (136) | | | $ | (322) | | | $ | 979 | | | $ | (11) | | | $ | 968 | | | $ | 5.64 | | |
| | | | | | | | | | | | | | | | | | | | | |
| Restructuring and Portfolio Optimization costs | — | | | 8 | | | 13 | | | 21 | | | — | | | (5) | | | 16 | | | — | | | 16 | | | $ | 0.09 | | |
| | | | | | | | | | | | | | | | | | | | | |
| Inventory Purchase Accounting charge | — | | | 24 | | | — | | | 24 | | | — | | | (6) | | | 18 | | | — | | | 18 | | | $ | 0.11 | | |
| | | | | | | | | | | | | | | | | | | | | |
| Transaction costs | — | | | — | | | 44 | | | 44 | | | (30) | | | (1) | | | 13 | | | — | | | 13 | | | $ | 0.08 | | |
| | | | | | | | | | | | | | | | | | | | | |
| Non-cash Amortization expense | — | | | — | | | 218 | | | 218 | | | — | | | (54) | | | 164 | | | — | | | 164 | | | $ | 0.96 | | |
| | | | | | | | | | | | | | | | | | | | | |
| Adjusted Results | $ | 8,202 | | | $ | 2,872 | | | $ | (1,128) | | | $ | 1,744 | | | $ | (166) | | | $ | (388) | | | $ | 1,190 | | | $ | (11) | | | $ | 1,179 | | | $ | 6.88 | | |
| | | | | | | | | | | | | | | | | | | | |
| Fully Diluted Shares Outstanding | | | | | | | | | | | | | | | | | | | 171.2 | | |
| | | | | | | | | | | | | | | | | | | | | |
Set forth below is the calculation of the non-GAAP performance measures included in this press release. We believe that these measures provide useful supplemental information to assess our operating performance and to evaluate period-to-period comparisons. Non-GAAP financial measures should be viewed in addition to, and not as an alternative for, Wabtec’s reported results prepared in accordance with GAAP.
| | | | | | | | | | | | | | | | | | | | | | | | | | | | | | | | | | | | | | | | | | | | | | | | | | | | | | | | | | | | | | | | | |
| Wabtec Corporation | | | | | | | | | | | | | | | | | | | | |
| Reconciliation of Reported Results to Adjusted Results | | | | | | | | | | | | | | | | | |
| (in millions) | | Fourth Quarter Year-to-Date 2025 Actual Results | |
| | Net | | Gross | | Operating | | Income from | | Interest & | | | | Net | | Noncontrolling | | Wabtec | | | |
| | Sales | | Profit | | Expenses | | Operations | | Other Exp | | Tax | | Income | | Interest | | Net Income | | EPS | |
| | | | | | | | | | | | | | | | | | | | | |
| Reported Results | $ | 11,167 | | | $ | 3,806 | | | $ | (2,013) | | | $ | 1,793 | | | $ | (201) | | | $ | (409) | | | $ | 1,183 | | | $ | (13) | | | $ | 1,170 | | | $ | 6.83 | | |
| | | | | | | | | | | | | | | | | | | | | |
| Restructuring and Portfolio Optimization costs | — | | | 12 | | | 64 | | | 76 | | | — | | | 1 | | | 77 | | | — | | | 77 | | | $ | 0.45 | | |
| | | | | | | | | | | | | | | | | | | | | |
| Inventory Purchase Accounting charge | — | | | 53 | | | — | | | 53 | | | — | | | (13) | | | 40 | | | — | | | 40 | | | $ | 0.23 | | |
| | | | | | | | | | | | | | | | | | | | | |
| Transaction costs | | — | | | — | | | 49 | | | 49 | | | (19) | | | (4) | | | 26 | | | — | | | 26 | | | $ | 0.15 | | |
| | | | | | | | | | | | | | | | | | | | | |
| Non-cash Amortization expense | — | | | — | | | 296 | | | 296 | | | — | | | (72) | | | 224 | | | — | | | 224 | | | $ | 1.31 | | |
| | | | | | | | | | | | | | | | | | | | | |
| Adjusted Results | $ | 11,167 | | | $ | 3,871 | | | $ | (1,604) | | | $ | 2,267 | | | $ | (220) | | | $ | (497) | | | $ | 1,550 | | | $ | (13) | | | $ | 1,537 | | | $ | 8.97 | | |
| | | | | | | | | | | | | | | | | | | | |
| Fully Diluted Shares Outstanding | | | | | | | | | | | | | | | | | | | 171.1 | | |
| | | | | | | | | | | | | | | | | | | | | |
| | | | | | | | | | | | | | | | | | | | | |
| | | | | | | | | | | | | | | | | | | | | |
| | | | | | | | | | | | | | | | | | | | |
| | | | | | | | | | | | | | | | | |
| | | |
| | | | | | | | | | | | | | | | | | | | | |
| | | | | | | | | | | | | | | | | | | | | |
| | | | | | | | | | | | | | | | | | | | | |
| | | | | | | | | | | | | | | | | | | | |
| | | | | | | | | | | | | | | | | | | | | |
| | | | | | | | | | | | | | | | | | | | |
| | | | | | | | | | | | | | | | | | | | |
| | | | | | | | | | | | | | | | | | | | |
| | | | | | | | | | | | | | | | | | | | | |
| | | | | | | | | | | | | | | | | | | | |
| | | | | | | | | | | | | | | | | | | | | |
| | | | | | | | | | | | | | | | | | | | |
| | | | | | | | | | | | | | | | | | | | | |
| | | | | | | | | | | | | | | | | | | | |
| | | | | | | | | | | | | | | | | | | | |
| | | | | | | | | | | | | | | | | | | | |
| | | | | | | | | | | | | | | | | | | | | |
| | | | | | | | | | | | | | | | | | | | | | | | | | | | | | | | | | | | | | | | | | | | | | | | | | | | | | | | | | | | | | | | | |
| Wabtec Corporation | | | | | | | | | | | | | | | | | | | | |
| Reconciliation of Reported Results to Adjusted Results | | | | | | | | | | | | | | | | | |
| (in millions) | | Fourth Quarter Year-to-Date 2024 Actual Results | |
| | Net | | Gross | | Operating | | Income from | | Interest & | | | | Net | | Noncontrolling | | Wabtec | | | |
| | Sales | | Profit | | Expenses | | Operations | | Other Exp | | Tax | | Income | | Interest | | Net Income | | EPS | |
| | | | | | | | | | | | | | | | | | | | | |
| Reported Results | $ | 10,387 | | | $ | 3,366 | | | $ | (1,757) | | | $ | 1,609 | | | $ | (199) | | | $ | (343) | | | $ | 1,067 | | | $ | (11) | | | $ | 1,056 | | | $ | 6.04 | | |
| | | | | | | | | | | | | | | | | | | | | |
| Restructuring and Portfolio Optimization costs | — | | | 37 | | | 33 | | | 70 | | | (4) | | | (16) | | | 50 | | | — | | | 50 | | | $ | 0.28 | | |
| | | | | | | | | | | | | | | | | | | | |
| Non-cash Amortization expense | — | | | — | | | 288 | | | 288 | | | — | | | (70) | | | 218 | | | — | | | 218 | | | $ | 1.24 | | |
| | | | | | | | | | | | | | | | | | | | | |
| Adjusted Results | $ | 10,387 | | | $ | 3,403 | | | $ | (1,436) | | | $ | 1,967 | | | $ | (203) | | | $ | (429) | | | $ | 1,335 | | | $ | (11) | | | $ | 1,324 | | | $ | 7.56 | | |
| | | | | | | | | | | | | | | | | | | | |
| Fully Diluted Shares Outstanding | | | | | | | | | | | | | | | | | | | 174.8 | | |
| | | | | | | | | | | | | | | | | | | | | |
| | | | | | | | | | | | | | | | | | | | | |
| | | | | | | | | | | | | | | | | | | | | |
| | | | | | | | | | | | | | | | | | | | |
| | | | | | | | | | | | | | | | | |
| | | |
| | | | | | | | | | | | | | | | | | | | | |
| | | | | | | | | | | | | | | | | | | | | |
| | | | | | | | | | | | | | | | | | | | | |
| | | | | | | | | | | | | | | | | | | | |
| | | | | | | | | | | | | | | | | | | | | |
| | | | | | | | | | | | | | | | | | | | |
| | | | | | | | | | | | | | | | | | | | | |
| | | | | | | | | | | | | | | | | | | | |
| | | | | | | | | | | | | | | | | | | | | |
| | | | | | | | | | | | | | | | | | | | |
| | | | | | | | | | | | | | | | | | | | | |
| | | | | | | | | | | | | | | | | | | | |
| | | | | | | | | | | | | | | | | | | | | |
| | | | | | | | | | | | | | | | | | | | |
| | | | | | | | | | | | | | | | | | | | | |
| | | | | | | | | | | | | | | | | | | | | |
Appendix E
Set forth below is the calculation of the non-GAAP performance measures included in this press release. We believe that these measures provide useful supplemental information to assess our operating performance and to evaluate period-to-period comparisons. Non-GAAP financial measures should be viewed in addition to, and not as an alternative for, Wabtec’s reported results prepared in accordance with GAAP.
| | | | | | | | | | | | | | | | | | | | | | | | | | | | | | | | | | | | | | | | | |
| Wabtec Corporation | | | | | | | | | | | | | |
Third Quarter 2026 EBITDA Reconciliation | | | | | | | | | |
| (in millions) | | | | | | | | | | | | | |
| | Reported Income | + | Other Income | + | Depreciation & | = | EBITDA | + | Restructuring | = | Adjusted | |
| | from Operations | (Expense) | Amortization | Costs | EBITDA | |
| | | | | | | | | | | | | |
| Consolidated Results | | $ | 625 | | | $ | 12 | | | $ | 140 | | | $ | 777 | | | $ | 5 | | | $ | 782 | | |
| | | | | | | | | | | | | |
| | | | | | | | | | | | | |
| Wabtec Corporation | | | | | | | | | | | | | |
Third Quarter 2026 YTD EBITDA Reconciliation | | | | | | | | | |
| (in millions) | | | | | | | | | | | | | |
| | Reported Income | + | Other Income | + | Depreciation & | = | EBITDA | + | Restructuring & | = | Adjusted | |
| | from Operations | (Expense) | Amortization | Transaction Costs | EBITDA | |
| | | | | | | | | | | | | |
| Consolidated Results | | $ | 1,742 | | | $ | 33 | | | $ | 419 | | | $ | 2,194 | | | $ | 50 | | | $ | 2,244 | | |
| | | | | | | | | | | | | |
| | | | | | | | | | | | | |
| | | | | | | | | | | | | |
| Wabtec Corporation | | | | | | | | | | | | | |
Third Quarter 2025 EBITDA Reconciliation | | | | | | | | | |
| (in millions) | | | | | | | | | | | | | |
| | Reported Income | + | Other Income | + | Depreciation & | = | EBITDA | + | Restructuring & | = | Adjusted | |
| | from Operations | (Expense) | Amortization | Transaction Costs | EBITDA | |
| | | | | | | | | | | | | |
| Consolidated Results | | $ | 491 | | | $ | (1) | | | $ | 127 | | | $ | 617 | | | $ | 41 | | | $ | 658 | | |
| | | | | | | | | | | | | |
| | | | | | | | | | | | | |
| Wabtec Corporation | | | | | | | | | | | | | |
Third Quarter 2025 YTD EBITDA Reconciliation | | | | | | | | | |
| (in millions) | | | | | | | | | | | | | |
| | Reported Income | + | Other Income | + | Depreciation & | = | EBITDA | + | Restructuring & | = | Adjusted | |
| | from Operations | (Expense) | Amortization | Transaction Costs | EBITDA | |
| | | | | | | | | | | | | |
| Consolidated Results | | $ | 1,437 | | | $ | 21 | | | $ | 361 | | | $ | 1,819 | | | $ | 55 | | | $ | 1,874 | | |
| | | | | | | | | | | | | |
Appendix F
WESTINGHOUSE AIR BRAKE TECHNOLOGIES CORPORATION
SALES BY PRODUCT LINE
(UNAUDITED)
| | | | | | | | | | | |
| Three Months Ended September 30, |
| In millions | 2026 | | 2025 |
| Freight Segment | | | |
| Services | $ | 794 | | | $ | 744 | |
| Equipment | 679 | | | 677 | |
| Components | 395 | | | 375 | |
| Digital Intelligence | 369 | | | 297 | |
| Total Freight Segment | $ | 2,237 | | | $ | 2,093 | |
| | | |
| Transit Segment | | | |
| Original Equipment Manufacturer | $ | 408 | | | $ | 367 | |
| Aftermarket | 475 | | | 426 | |
| Total Transit Segment | $ | 883 | | | $ | 793 | |
| Nine Months Ended September 30, |
| In millions | 2026 | | 2025 |
| Freight Segment | | | |
| Services | $ | 2,256 | | | $ | 2,388 | |
| Equipment | 2,142 | | | 1,699 | |
| Components | 1,150 | | | 1,157 | |
| Digital Intelligence | 1,047 | | | 669 | |
| Total Freight Segment | $ | 6,595 | | | $ | 5,913 | |
| | | |
| Transit Segment | | | |
| Original Equipment Manufacturer | $ | 1,200 | | | $ | 1,042 | |
| Aftermarket | 1,454 | | | 1,247 | |
| Total Transit Segment | $ | 2,654 | | | $ | 2,289 | |
| | | |
Appendix G
WESTINGHOUSE AIR BRAKE TECHNOLOGIES CORPORATION
RECONCILIATION OF REPORTED RESULTS TO ADJUSTED RESULTS - BY SEGMENT
(UNAUDITED)
| | | | | | | | | | | | | | | | | | | | | | | | | | | | | | | | | | | | | | | | | | | | | | | |
| Three Months Ended September 30, | | Nine Months Ended September 30, |
| 2026 | | 2025 | | 2026 | | 2025 |
| In millions | Gross Profit | | Income from Operations | | Gross Profit | | Income from Operations | | Gross Profit | | Income from Operations | | Gross Profit | | Income from Operations |
| | | | | | | | | | | | | | | |
| Freight Segment Reported Results | $ | 861 | | | $ | 515 | | | $ | 750 | | | $ | 414 | | | $ | 2,503 | | | $ | 1,469 | | | $ | 2,132 | | | $ | 1,249 | |
| Freight Segment Reported Margin | 38.5 | % | | 23.0 | % | | 35.8 | % | | 19.8 | % | | 37.9 | % | | 22.3 | % | | 36.1 | % | | 21.1 | % |
| | | | | | | | | | | | | | | |
| Restructuring and Portfolio Optimization costs | — | | | 1 | | | 1 | | | 2 | | | 2 | | | 2 | | | 5 | | | 6 | |
| Inventory Purchase Accounting charge | — | | | — | | | 24 | | | 24 | | | 20 | | | 20 | | | 24 | | | 24 | |
| Transaction costs | — | | | — | | | — | | | 1 | | | — | | | 2 | | | — | | | 2 | |
| Non-cash Amortization expense | — | | | 75 | | | — | | | 72 | | | — | | | 227 | | | — | | | 200 | |
| | | | | | | | | | | | | | | |
| Freight Segment Adjusted Results | $ | 861 | | | $ | 591 | | | $ | 775 | | | $ | 513 | | | $ | 2,525 | | | $ | 1,720 | | | $ | 2,161 | | | $ | 1,481 | |
| Freight Segment Adjusted Margin | 38.5 | % | | 26.4 | % | | 37.0 | % | | 24.5 | % | | 38.3 | % | | 26.1 | % | | 36.5 | % | | 25.0 | % |
| | | | | | | | | | | | | | | |
| | | | | | | | | | | | | | | |
| Transit Segment Reported Results | $ | 303 | | | $ | 145 | | | $ | 252 | | | $ | 115 | | | $ | 883 | | | $ | 412 | | | $ | 708 | | | $ | 314 | |
| Transit Segment Reported Margin | 34.5 | % | | 16.4 | % | | 31.7 | % | | 14.5 | % | | 33.3 | % | | 15.5 | % | | 30.9 | % | | 13.7 | % |
| | | | | | | | | | | | | | | |
| Restructuring and Portfolio Optimization costs | 2 | | | 1 | | | 1 | | | 3 | | | 3 | | | 4 | | | 3 | | | 14 | |
| Inventory Purchase Accounting charge | — | | | — | | | — | | | — | | | 8 | | | 8 | | | — | | | — | |
| Non-cash Amortization expense | — | | | 14 | | | — | | | 5 | | | — | | | 40 | | | — | | | 18 | |
| | | | | | | | | | | | | | | |
| Transit Segment Adjusted Results | $ | 305 | | | $ | 160 | | | $ | 253 | | | $ | 123 | | | $ | 894 | | | $ | 464 | | | $ | 711 | | | $ | 346 | |
| Transit Segment Adjusted Margin | 34.6 | % | | 18.1 | % | | 31.8 | % | | 15.5 | % | | 33.7 | % | | 17.5 | % | | 31.0 | % | | 15.1 | % |
| | | | | | | | | | | | | | | |
Appendix H
WESTINGHOUSE AIR BRAKE TECHNOLOGIES CORPORATION
RECONCILIATION OF CHANGES IN NET SALES - BY SEGMENT
(UNAUDITED)
| | | | | | | | | | | | | | | | | | | | |
| Three Months Ended September 30, | |
| In millions | Freight | | Transit | | Consolidated | |
| | | | | | |
2025 Net sales | $ | 2,093 | | | $ | 793 | | | $ | 2,886 | | |
| | | | | | |
| Acquisitions | 49 | | | 65 | | | 114 | | |
| Portfolio Optimization (Divestitures/Exits) | (11) | | | (1) | | | (12) | | |
| Foreign Exchange | 4 | | | (9) | | | (5) | | |
| Organic | 102 | | | 35 | | | 137 | | |
| | | | | | |
2026 Net sales | $ | 2,237 | | | $ | 883 | | | $ | 3,120 | | |
| | | | | | |
| Change ($) | 144 | | | 90 | | | 234 | | |
| Change (%) | 6.9 | % | | 11.3 | % | | 8.1 | % | |
| | | | | | |
| | | | | | |
| Nine Months Ended September 30, | |
2025 Net sales | $ | 5,913 | | | $ | 2,289 | | | $ | 8,202 | | |
| | | | | | |
| Acquisitions | 396 | | | 175 | | | 571 | | |
| Portfolio Optimization (Divestitures/Exits) | (32) | | | (5) | | | (37) | | |
| Foreign Exchange | 38 | | | 49 | | | 87 | | |
| Organic | 280 | | | 146 | | | 426 | | |
| | | | | | |
2026 Net sales | $ | 6,595 | | | $ | 2,654 | | | $ | 9,249 | | |
| | | | | | |
| Change ($) | 682 | | | 365 | | | 1,047 | | |
| Change (%) | 11.5 | % | | 15.9 | % | | 12.8 | % | |
| | | | | | |
Appendix I
Set forth below is the calculation of the non-GAAP performance measures included in this press release. We believe that these measures provide useful supplemental information to assess our operating performance and to evaluate period-to-period comparisons. Non-GAAP financial measures should be viewed in addition to, and not as an alternative for, Wabtec's reported results prepared in accordance with GAAP.
| | | | | | | | | | | | | | | | | | | | | | | | | | | | | |
| Wabtec Corporation | | | | | | | | | |
2026 Third Quarter Cash Conversion Calculation | | | | | | |
| (in millions) | | | | | | | | | |
| | Reported Cash from Operations | ÷ | (Net Income | + | Depreciation & Amortization) | = | Cash Conversion | |
| | | | | | | | | |
| Consolidated Results | | $455 | | $411 | | $142 | | 82% | |
| | | | | | | | | |
| | | | | | | | | |
| Wabtec Corporation | | | | | | | | | |
2026 Third Quarter YTD Cash Conversion Calculation | | | | | | |
| (in millions) | | | | | | | | | |
| | Reported Cash from Operations | ÷ | (Net Income | + | Depreciation & Amortization) | = | Cash Conversion | |
| | | | | | | | | |
| Consolidated Results | | $1,095 | | $1,170 | | $424 | | 69% | |
| | | | | | | | | |
| | | | | | | | | |
| | | | | | | | | |
| Wabtec Corporation | | | | | | | | | |
2025 Third Quarter Cash Conversion Calculation | | | | | | |
| (in millions) | | | | | | | | | |
| | Reported Cash from Operations | ÷ | (Net Income | + | Depreciation & Amortization) | = | Cash Conversion | |
| | | | | | | | | |
| Consolidated Results | | $367 | | $313 | | $128 | | 83% | |
| | | | | | | | | |
| | | | | | | | | |
| Wabtec Corporation | | | | | | | | | |
2025 Third Quarter YTD Cash Conversion Calculation | | | | | | |
| (in millions) | | | | | | | | | |
| | Reported Cash from Operations | ÷ | (Net Income | + | Depreciation & Amortization) | = | Cash Conversion | |
| | | | | | | | | |
| Consolidated Results | | $767 | | $979 | | $365 | | 57% | |
| | | | | | | | | |