
Third Quarter 2026 Earnings October 21, 2026 Exhibit 99.2
2 This presentation, including documents incorporated herein by reference, will contain forward-looking statements within the meaning of Section 27A of the Securities Act of 1933, as amended and Section 21E of the Securities Exchange Act of 1934, as amended. Such forward-looking statements are made pursuant to the safe harbor provisions of the Private Securities Litigation Reform Act of 1995. Forward-looking statements are subject to risks and uncertainties that could cause actual results to differ materially from those contemplated by the forward-looking statements. Please review our disclosures in filings with the United States Securities and Exchange Commission. Non-GAAP Financial Data This presentation includes the use of adjusted operating income, operating ratio, adjusted operating ratio, adjusted earnings per share, adjusted income before taxes and adjusted operating expenses, which are financial measures that are not in accordance with United States generally accepted accounting principles (“GAAP”). Each such measure is a supplemental non-GAAP financial measure that is used by management and external users of our financial statements, such as industry analysts, investors and lenders. While management believes such measures are useful for investors, they should not be used as a replacement for financial measures that are in accordance with GAAP. In addition, our use of these non-GAAP measures should not be interpreted as indicating that these or similar items could not occur in future periods. In addition, adjusted operating ratio excludes truckload and LTL segment fuel surcharges from revenue and nets these surcharges against fuel expense. Disclosure
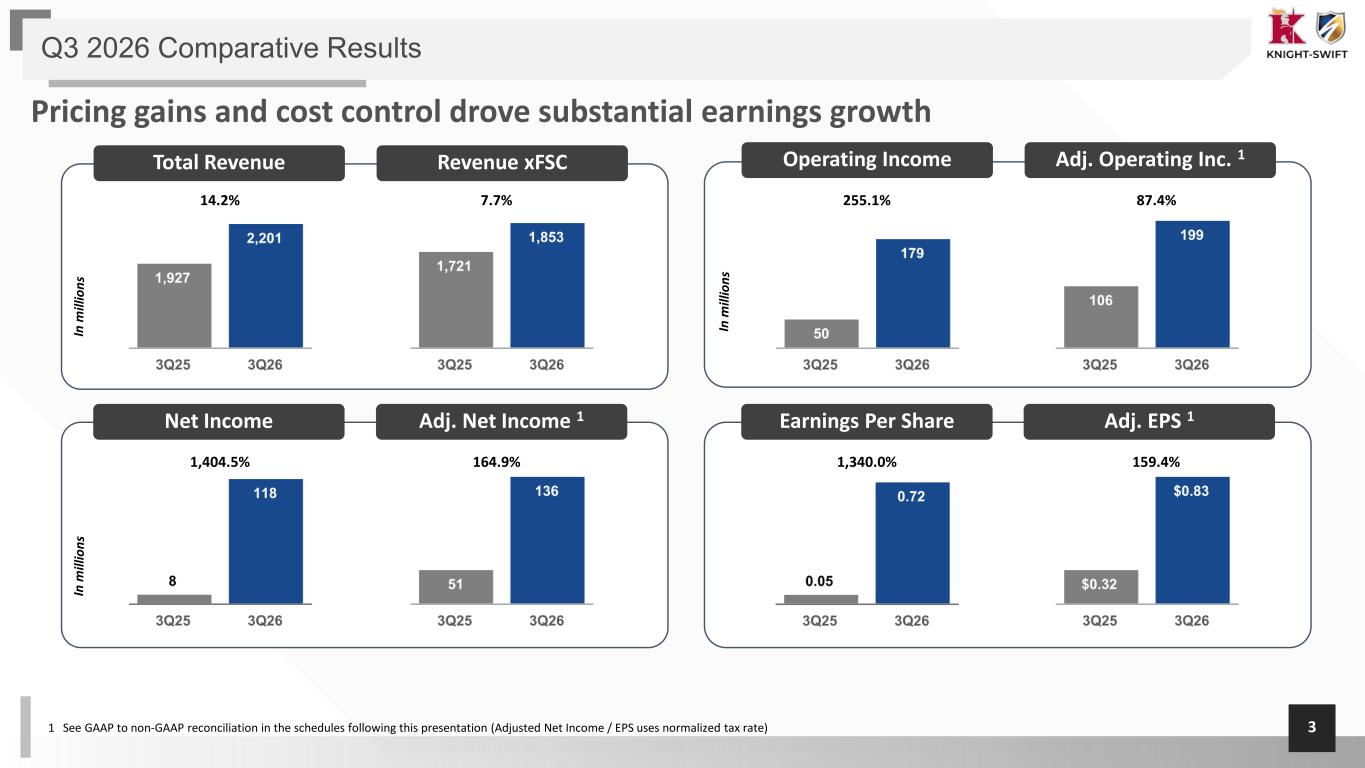
3 Q3 2026 Comparative Results Total Revenue 14.2% Revenue xFSC 7.7% Operating Income 255.1% Adj. Operating Inc. 1 87.4% Net Income Adj. Net Income 1 164.9% Earnings Per Share Adj. EPS 1 159.4% Pricing gains and cost control drove substantial earnings growth 1 See GAAP to non-GAAP reconciliation in the schedules following this presentation (Adjusted Net Income / EPS uses normalized tax rate) 1,404.5% 1,340.0%
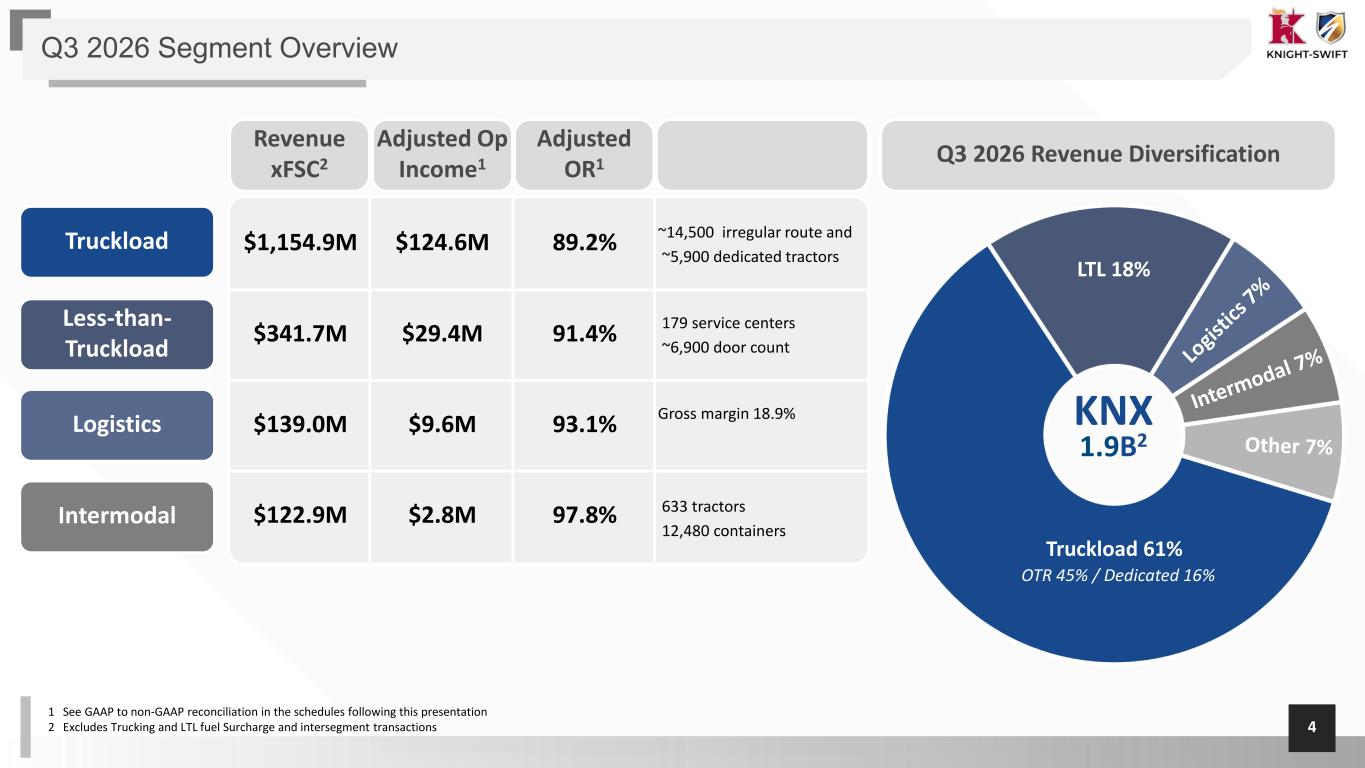
4 $1,154.9M $124.6M 89.2% ~14,500 irregular route and ~5,900 dedicated tractors $341.7M $29.4M 91.4% 179 service centers ~6,900 door count $139.0M $9.6M 93.1% Gross margin 18.9% $122.9M $2.8M 97.8% 633 tractors 12,480 containers 1 See GAAP to non-GAAP reconciliation in the schedules following this presentation 2 Excludes Trucking and LTL fuel Surcharge and intersegment transactions Q3 2026 Revenue Diversification Q3 2026 Segment Overview OTR 45% / Dedicated 16% LTL 18% Truckload 61% Revenue xFSC2 Adjusted Op Income1 Adjusted OR1 Truckload Less-than- Truckload Logistics Intermodal KNX 1.9B2
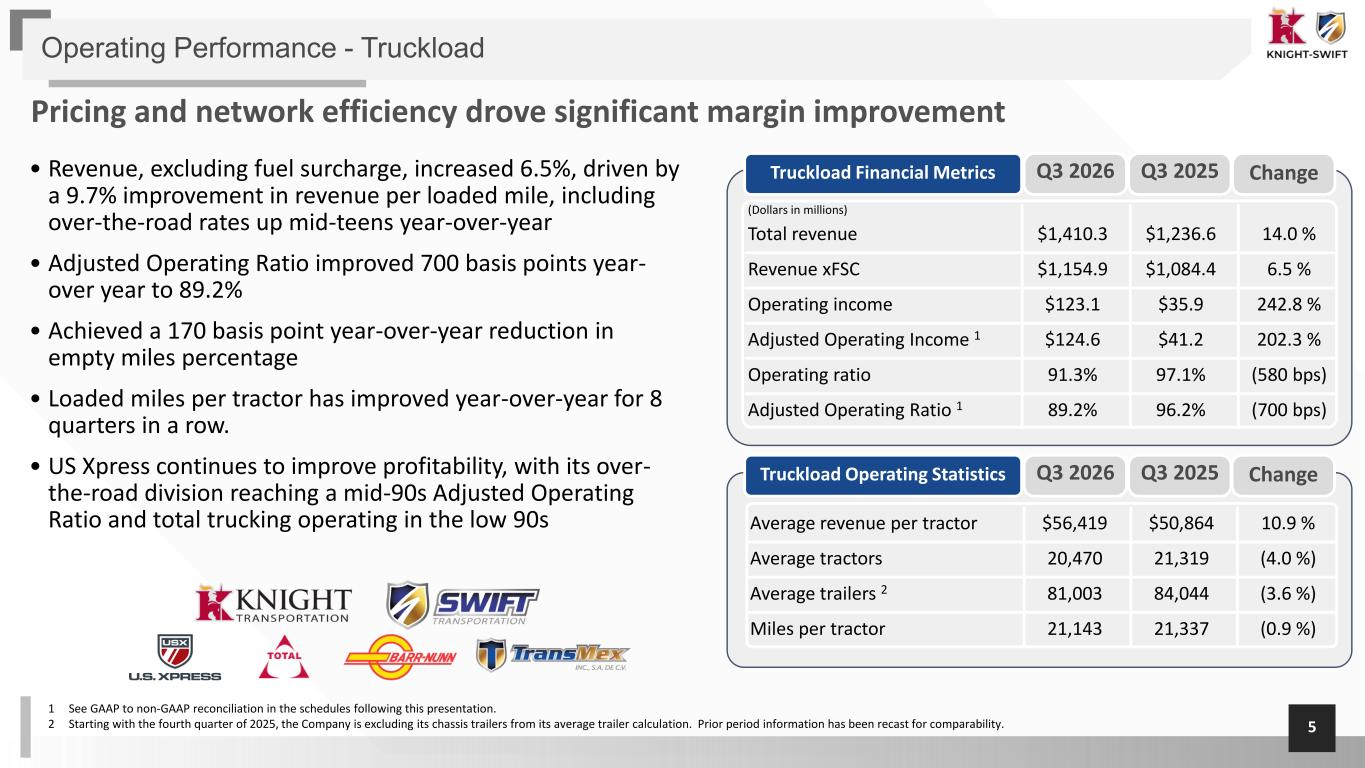
5 (Dollars in millions) Total revenue $1,410.3 $1,236.6 14.0 % Revenue xFSC $1,154.9 $1,084.4 6.5 % Operating income $123.1 $35.9 242.8 % Adjusted Operating Income 1 $124.6 $41.2 202.3 % Operating ratio 91.3% 97.1% (580 bps) Adjusted Operating Ratio 1 89.2% 96.2% (700 bps) Truckload Financial Metrics Average revenue per tractor $56,419 $50,864 10.9 % Average tractors 20,470 21,319 (4.0 %) Average trailers 2 81,003 84,044 (3.6 %) Miles per tractor 21,143 21,337 (0.9 %) Operating Performance - Truckload Pricing and network efficiency drove significant margin improvement Q3 2026 Q3 2025 Change Truckload Operating Statistics Q3 2026 Q3 2025 Change 1 See GAAP to non-GAAP reconciliation in the schedules following this presentation. 2 Starting with the fourth quarter of 2025, the Company is excluding its chassis trailers from its average trailer calculation. Prior period information has been recast for comparability. • Revenue, excluding fuel surcharge, increased 6.5%, driven by a 9.7% improvement in revenue per loaded mile, including over-the-road rates up mid-teens year-over-year • Adjusted Operating Ratio improved 700 basis points year- over year to 89.2% • Achieved a 170 basis point year-over-year reduction in empty miles percentage • Loaded miles per tractor has improved year-over-year for 8 quarters in a row. • US Xpress continues to improve profitability, with its over- the-road division reaching a mid-90s Adjusted Operating Ratio and total trucking operating in the low 90s
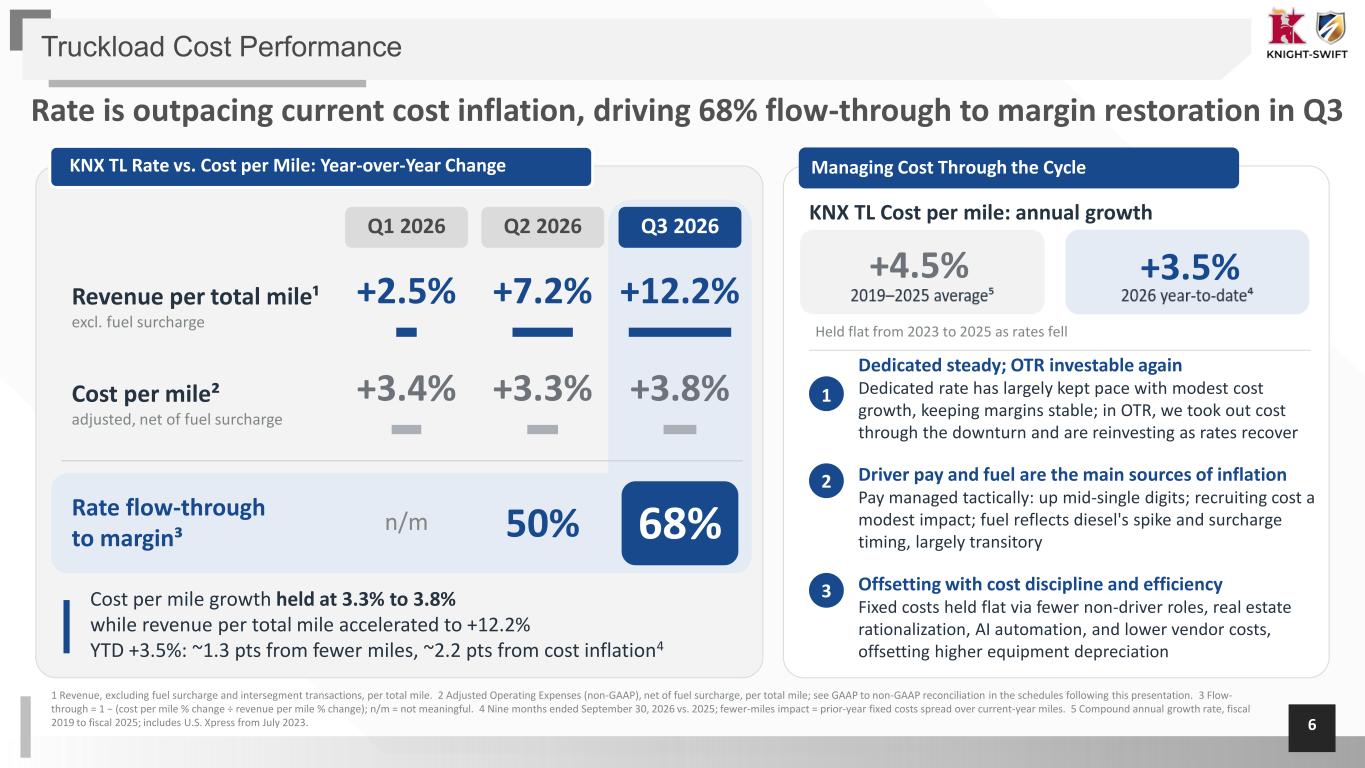
6 Truckload Cost Performance Rate is outpacing current cost inflation, driving 68% flow-through to margin restoration in Q3 Q1 2026 Q2 2026 Q3 2026 Revenue per total mile¹ excl. fuel surcharge Cost per mile² adjusted, net of fuel surcharge n/m 50% 68% Cost per mile growth held at 3.3% to 3.8% while revenue per total mile accelerated to +12.2% YTD +3.5%: ~1.3 pts from fewer miles, ~2.2 pts from cost inflation4 Managing Cost Through the Cycle KNX TL Cost per mile: annual growth Held flat from 2023 to 2025 as rates fell Dedicated steady; OTR investable again Dedicated rate has largely kept pace with modest cost growth, keeping margins stable; in OTR, we took out cost through the downturn and are reinvesting as rates recover Driver pay and fuel are the main sources of inflation Pay managed tactically: up mid-single digits; recruiting cost a modest impact; fuel reflects diesel's spike and surcharge timing, largely transitory Offsetting with cost discipline and efficiency Fixed costs held flat via fewer non-driver roles, real estate rationalization, AI automation, and lower vendor costs, offsetting higher equipment depreciation 1 Revenue, excluding fuel surcharge and intersegment transactions, per total mile. 2 Adjusted Operating Expenses (non-GAAP), net of fuel surcharge, per total mile; see GAAP to non-GAAP reconciliation in the schedules following this presentation. 3 Flow- through = 1 − (cost per mile % change ÷ revenue per mile % change); n/m = not meaningful. 4 Nine months ended September 30, 2026 vs. 2025; fewer-miles impact = prior-year fixed costs spread over current-year miles. 5 Compound annual growth rate, fiscal 2019 to fiscal 2025; includes U.S. Xpress from July 2023. 1 2 3 Rate flow-through to margin³ +2.5% +7.2% +12.2% +3.4% +3.3% +3.8% KNX TL Rate vs. Cost per Mile: Year-over-Year Change +4.5% +3.5%
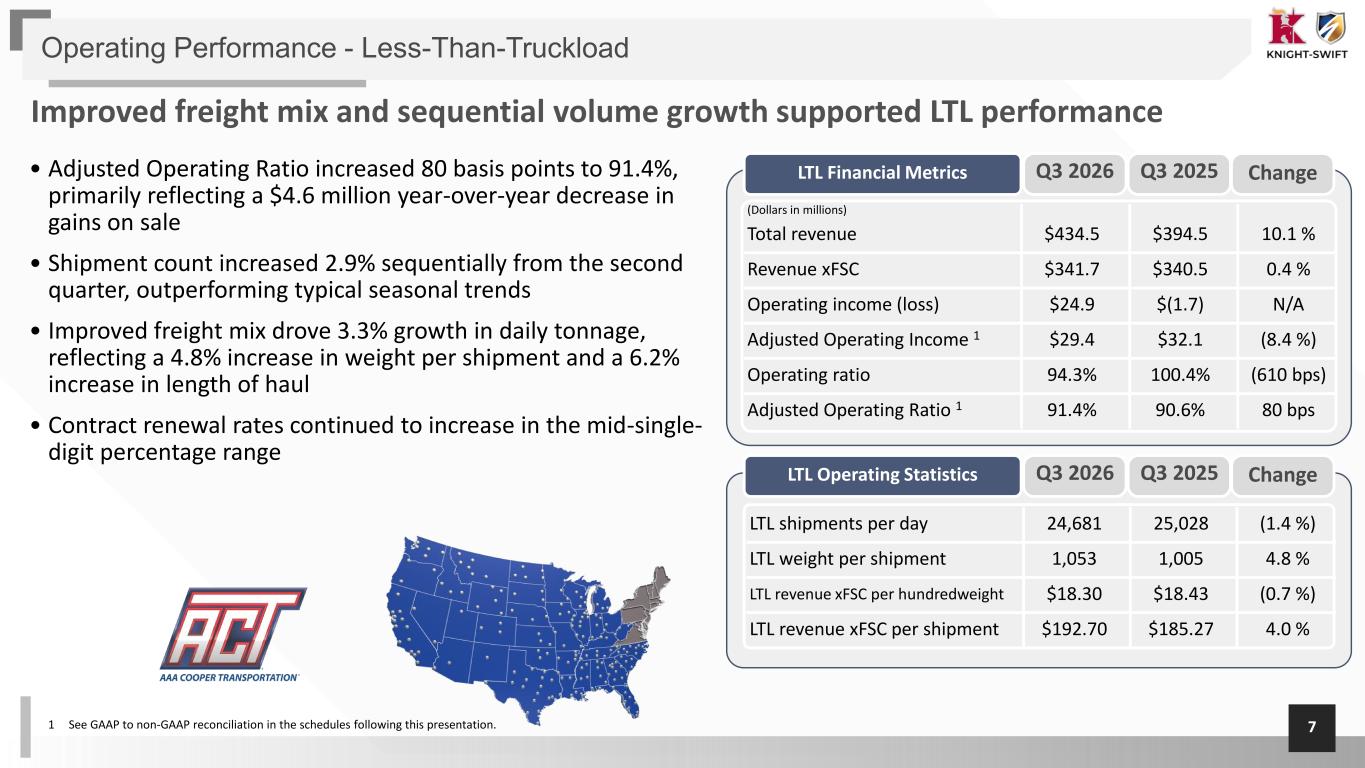
7 LTL shipments per day 24,681 25,028 (1.4 %) LTL weight per shipment 1,053 1,005 4.8 % LTL revenue xFSC per hundredweight $18.30 $18.43 (0.7 %) LTL revenue xFSC per shipment $192.70 $185.27 4.0 % Operating Performance - Less-Than-Truckload Improved freight mix and sequential volume growth supported LTL performance (Dollars in millions) Total revenue $434.5 $394.5 10.1 % Revenue xFSC $341.7 $340.5 0.4 % Operating income (loss) $24.9 $(1.7) N/A Adjusted Operating Income 1 $29.4 $32.1 (8.4 %) Operating ratio 94.3% 100.4% (610 bps) Adjusted Operating Ratio 1 91.4% 90.6% 80 bps LTL Financial Metrics LTL Operating Statistics 1 See GAAP to non-GAAP reconciliation in the schedules following this presentation. • Adjusted Operating Ratio increased 80 basis points to 91.4%, primarily reflecting a $4.6 million year-over-year decrease in gains on sale • Shipment count increased 2.9% sequentially from the second quarter, outperforming typical seasonal trends • Improved freight mix drove 3.3% growth in daily tonnage, reflecting a 4.8% increase in weight per shipment and a 6.2% increase in length of haul • Contract renewal rates continued to increase in the mid-single- digit percentage range Q3 2026 Q3 2025 Change Q3 2026 Q3 2025 Change
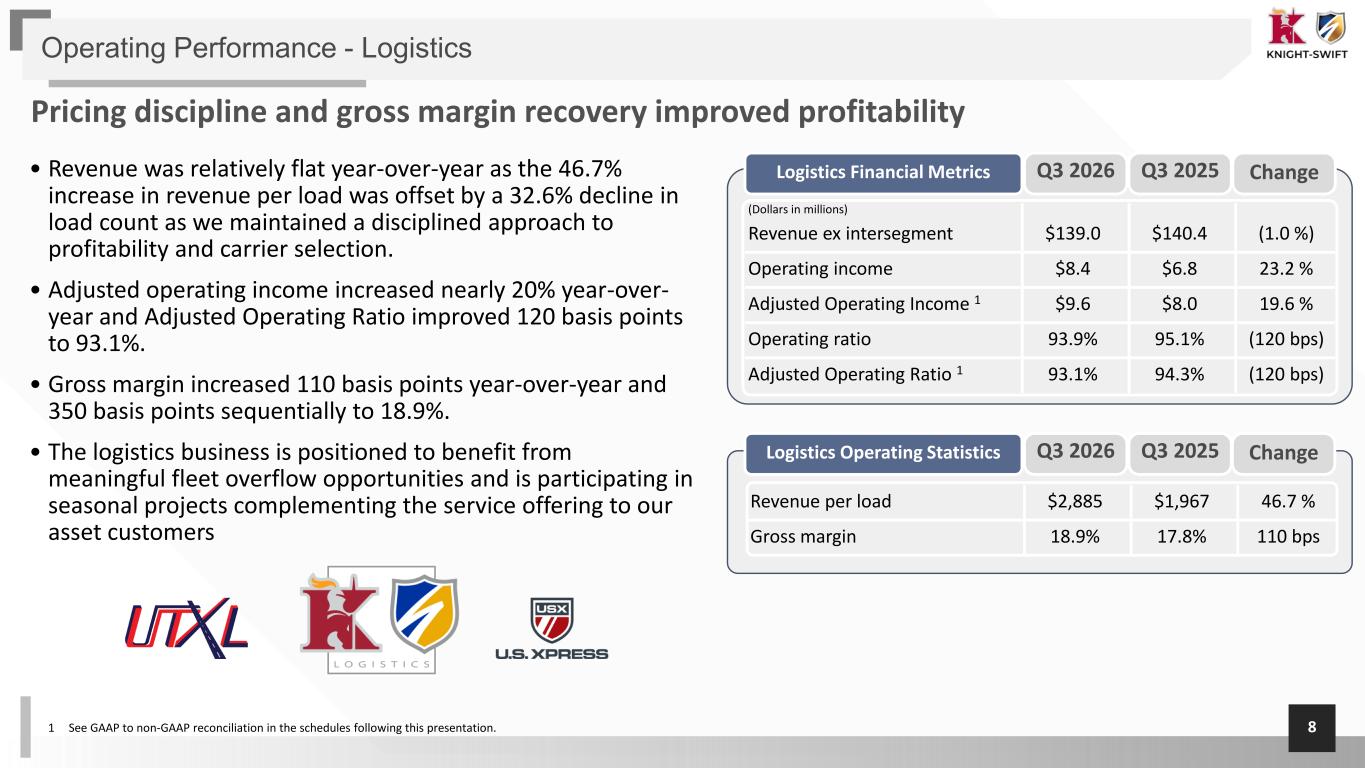
8 • Revenue was relatively flat year-over-year as the 46.7% increase in revenue per load was offset by a 32.6% decline in load count as we maintained a disciplined approach to profitability and carrier selection. • Adjusted operating income increased nearly 20% year-over- year and Adjusted Operating Ratio improved 120 basis points to 93.1%. • Gross margin increased 110 basis points year-over-year and 350 basis points sequentially to 18.9%. • The logistics business is positioned to benefit from meaningful fleet overflow opportunities and is participating in seasonal projects complementing the service offering to our asset customers Operating Performance - Logistics Pricing discipline and gross margin recovery improved profitability (Dollars in millions) Revenue ex intersegment $139.0 $140.4 (1.0 %) Operating income $8.4 $6.8 23.2 % Adjusted Operating Income 1 $9.6 $8.0 19.6 % Operating ratio 93.9% 95.1% (120 bps) Adjusted Operating Ratio 1 93.1% 94.3% (120 bps) Logistics Financial Metrics Revenue per load $2,885 $1,967 46.7 % Gross margin 18.9% 17.8% 110 bps Logistics Operating Statistics 1 See GAAP to non-GAAP reconciliation in the schedules following this presentation. Q3 2026 Q3 2025 Change Q3 2026 Q3 2025 Change
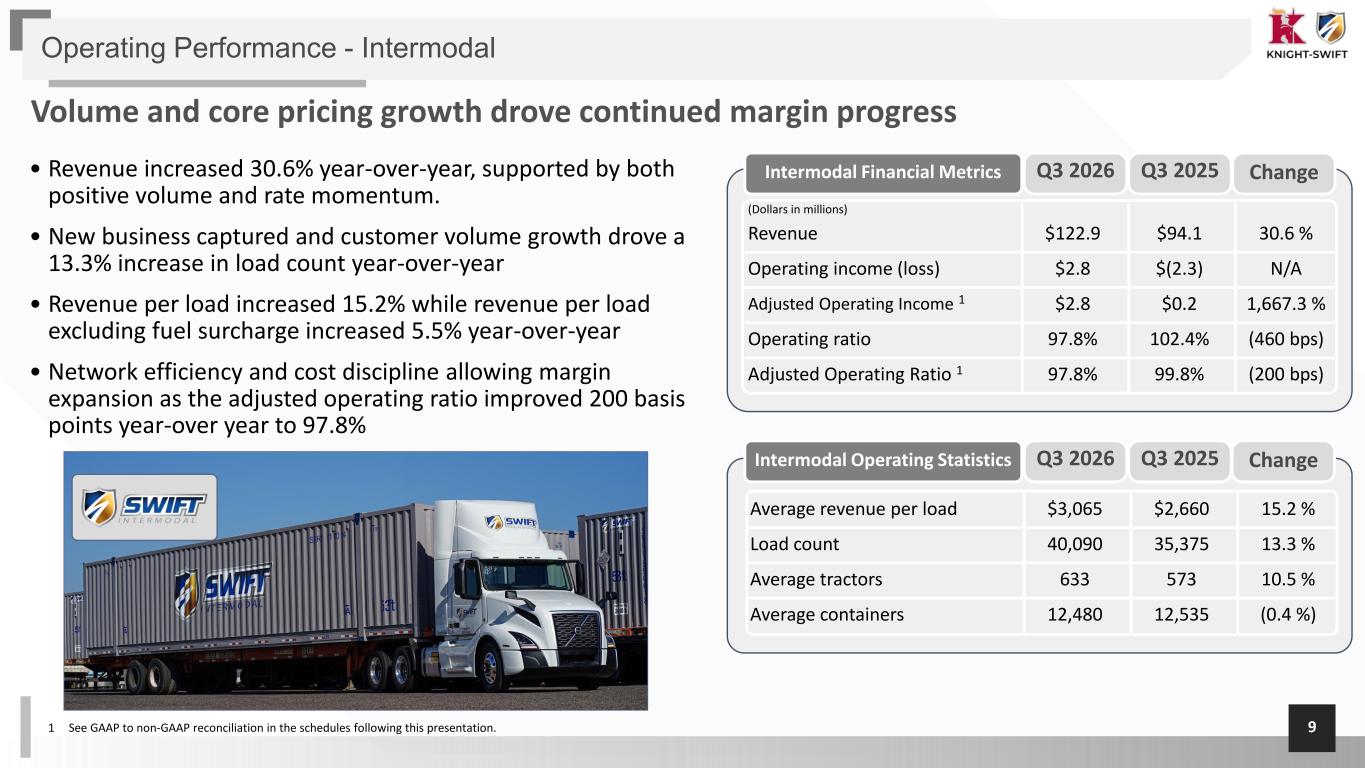
9 • Revenue increased 30.6% year-over-year, supported by both positive volume and rate momentum. • New business captured and customer volume growth drove a 13.3% increase in load count year-over-year • Revenue per load increased 15.2% while revenue per load excluding fuel surcharge increased 5.5% year-over-year • Network efficiency and cost discipline allowing margin expansion as the adjusted operating ratio improved 200 basis points year-over year to 97.8% Operating Performance - Intermodal Volume and core pricing growth drove continued margin progress (Dollars in millions) Revenue $122.9 $94.1 30.6 % Operating income (loss) $2.8 $(2.3) N/A Adjusted Operating Income 1 $2.8 $0.2 1,667.3 % Operating ratio 97.8% 102.4% (460 bps) Adjusted Operating Ratio 1 97.8% 99.8% (200 bps) Intermodal Financial Metrics Average revenue per load $3,065 $2,660 15.2 % Load count 40,090 35,375 13.3 % Average tractors 633 573 10.5 % Average containers 12,480 12,535 (0.4 %) Intermodal Operating Statistics Q3 2026 Q3 2025 Change Q3 2026 Q3 2025 Change 1 See GAAP to non-GAAP reconciliation in the schedules following this presentation.
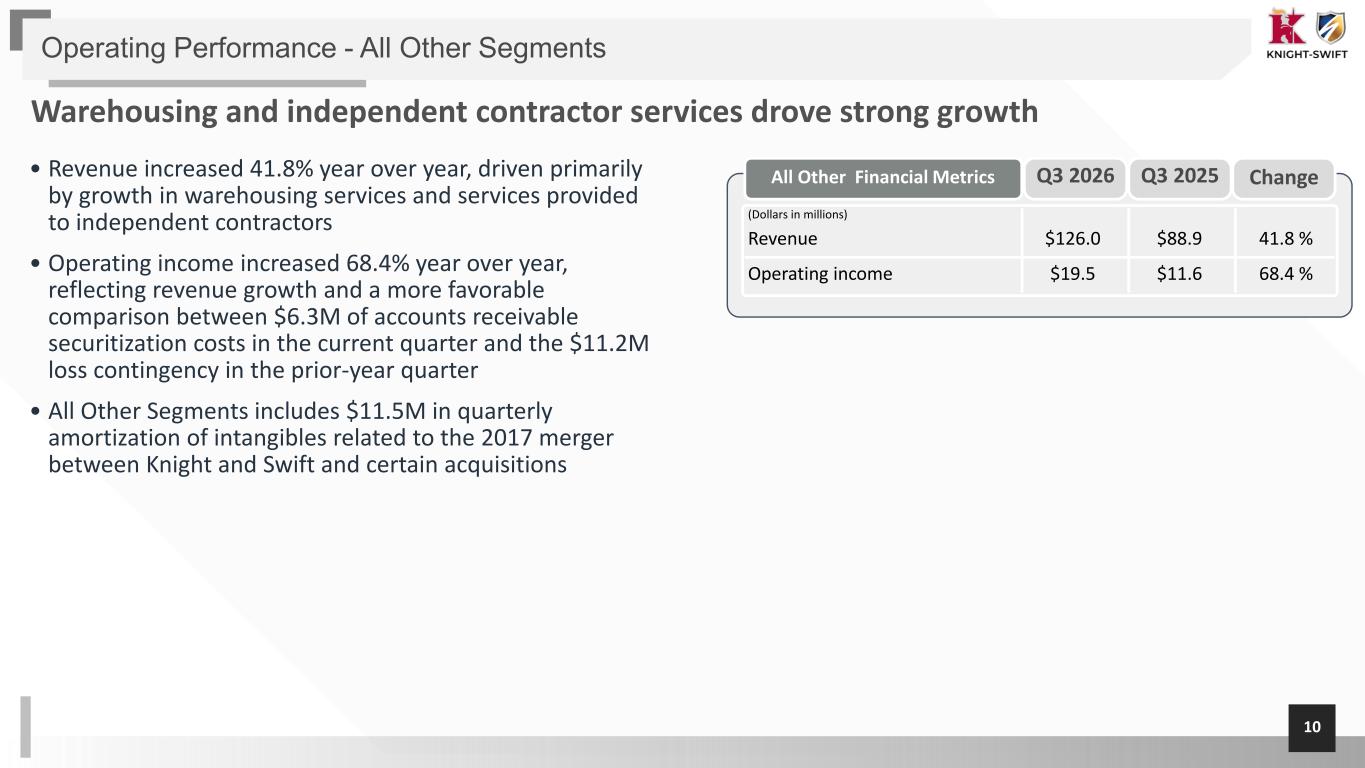
10 • Revenue increased 41.8% year over year, driven primarily by growth in warehousing services and services provided to independent contractors • Operating income increased 68.4% year over year, reflecting revenue growth and a more favorable comparison between $6.3M of accounts receivable securitization costs in the current quarter and the $11.2M loss contingency in the prior-year quarter • All Other Segments includes $11.5M in quarterly amortization of intangibles related to the 2017 merger between Knight and Swift and certain acquisitions Operating Performance - All Other Segments Warehousing and independent contractor services drove strong growth (Dollars in millions) Revenue $126.0 $88.9 41.8 % Operating income $19.5 $11.6 68.4 % All Other Financial Metrics Q3 2026 Q3 2025 Change
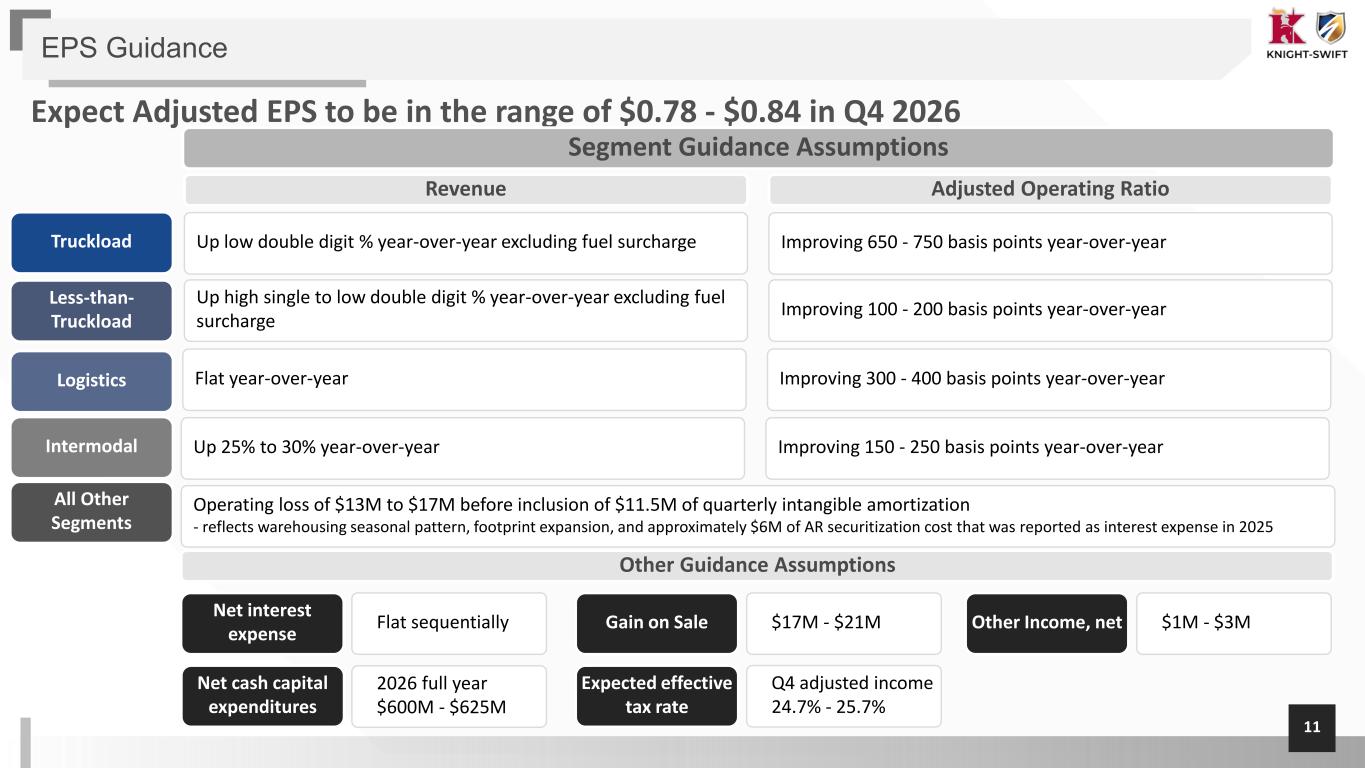
11 EPS Guidance Expect Adjusted EPS to be in the range of $0.78 - $0.84 in Q4 2026 Truckload Up low double digit % year-over-year excluding fuel surcharge Segment Guidance Assumptions Less-than- Truckload Logistics Intermodal Up high single to low double digit % year-over-year excluding fuel surcharge Revenue Adjusted Operating Ratio Improving 650 - 750 basis points year-over-year Improving 100 - 200 basis points year-over-year Flat year-over-year Improving 300 - 400 basis points year-over-year Up 25% to 30% year-over-year Improving 150 - 250 basis points year-over-year All Other Segments Other Guidance Assumptions Operating loss of $13M to $17M before inclusion of $11.5M of quarterly intangible amortization - reflects warehousing seasonal pattern, footprint expansion, and approximately $6M of AR securitization cost that was reported as interest expense in 2025 Gain on Sale Net interest expense Flat sequentially Net cash capital expenditures 2026 full year $600M - $625M $17M - $21M Other Income, net $1M - $3M Expected effective tax rate Q4 adjusted income 24.7% - 25.7%

Appendix
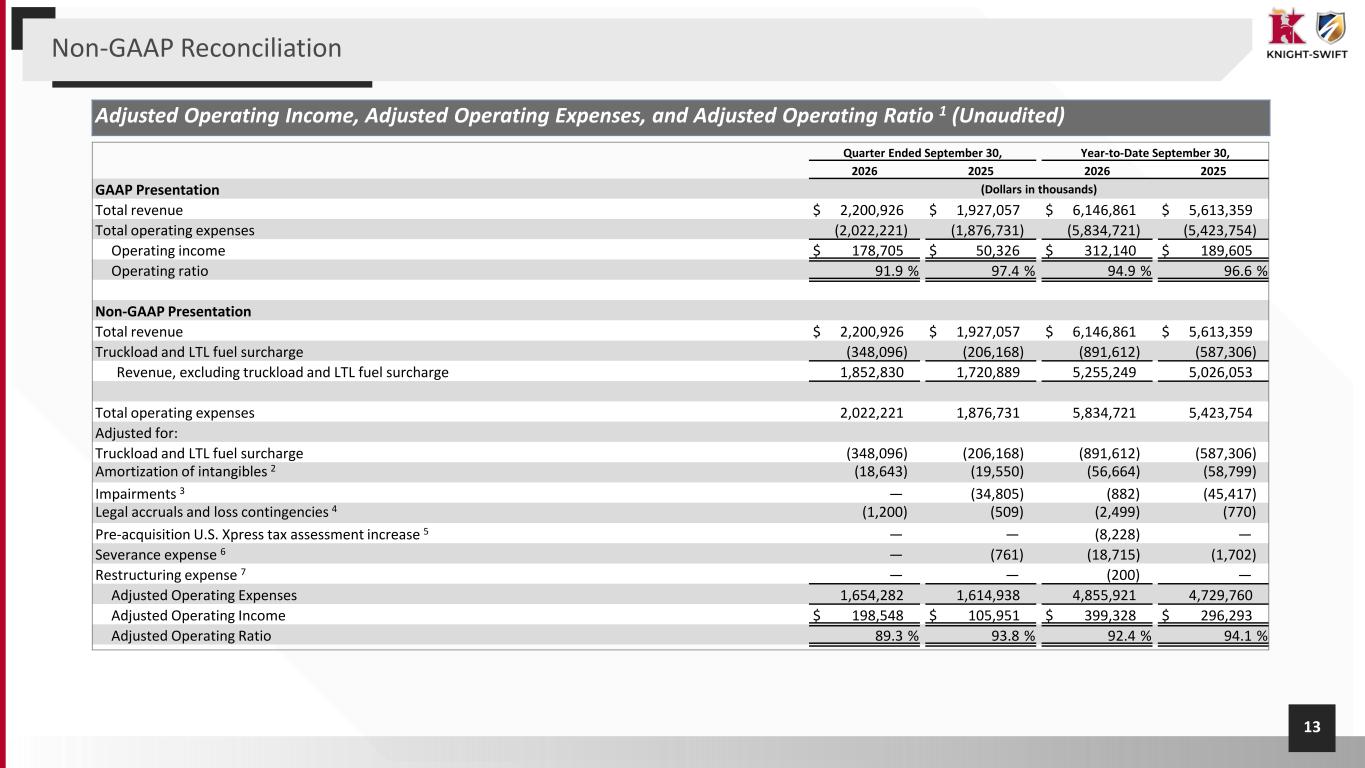
13 Adjusted Operating Income, Adjusted Operating Expenses, and Adjusted Operating Ratio 1 (Unaudited) Quarter Ended September 30, Year-to-Date September 30, 2026 2025 2026 2025 GAAP Presentation (Dollars in thousands) Total revenue $ 2,200,926 $ 1,927,057 $ 6,146,861 $ 5,613,359 Total operating expenses (2,022,221) (1,876,731) (5,834,721) (5,423,754) Operating income $ 178,705 $ 50,326 $ 312,140 $ 189,605 Operating ratio 91.9 % 97.4 % 94.9 % 96.6 % Non-GAAP Presentation Total revenue $ 2,200,926 $ 1,927,057 $ 6,146,861 $ 5,613,359 Truckload and LTL fuel surcharge (348,096) (206,168) (891,612) (587,306) Revenue, excluding truckload and LTL fuel surcharge 1,852,830 1,720,889 5,255,249 5,026,053 Total operating expenses 2,022,221 1,876,731 5,834,721 5,423,754 Adjusted for: Truckload and LTL fuel surcharge (348,096) (206,168) (891,612) (587,306) Amortization of intangibles 2 (18,643) (19,550) (56,664) (58,799) Impairments 3 — (34,805) (882) (45,417) Legal accruals and loss contingencies 4 (1,200) (509) (2,499) (770) Pre-acquisition U.S. Xpress tax assessment increase 5 — — (8,228) — Severance expense 6 — (761) (18,715) (1,702) Restructuring expense 7 — — (200) — Adjusted Operating Expenses 1,654,282 1,614,938 4,855,921 4,729,760 Adjusted Operating Income $ 198,548 $ 105,951 $ 399,328 $ 296,293 Adjusted Operating Ratio 89.3 % 93.8 % 92.4 % 94.1 % Non-GAAP Reconciliation
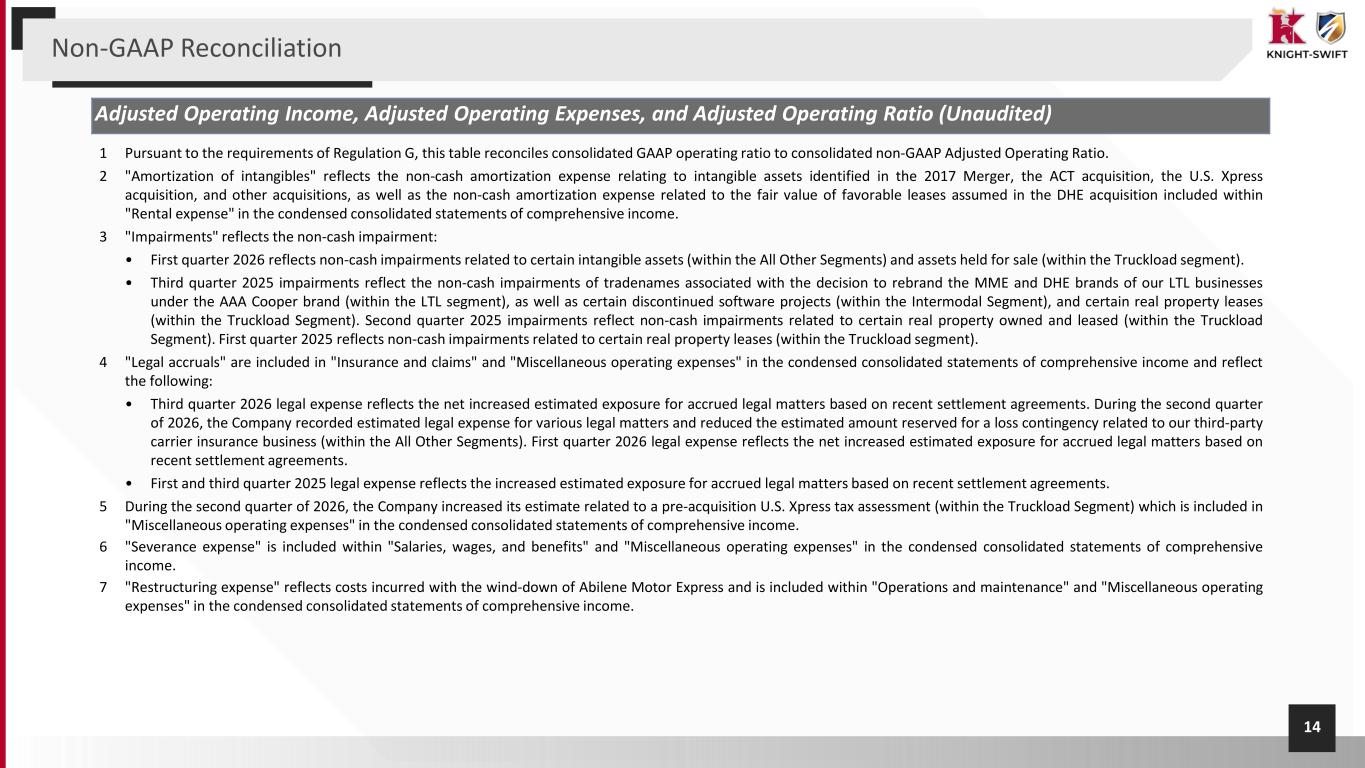
14 Adjusted Operating Income, Adjusted Operating Expenses, and Adjusted Operating Ratio (Unaudited) 1 Pursuant to the requirements of Regulation G, this table reconciles consolidated GAAP operating ratio to consolidated non-GAAP Adjusted Operating Ratio. 2 "Amortization of intangibles" reflects the non-cash amortization expense relating to intangible assets identified in the 2017 Merger, the ACT acquisition, the U.S. Xpress acquisition, and other acquisitions, as well as the non-cash amortization expense related to the fair value of favorable leases assumed in the DHE acquisition included within "Rental expense" in the condensed consolidated statements of comprehensive income. 3 "Impairments" reflects the non-cash impairment: • First quarter 2026 reflects non-cash impairments related to certain intangible assets (within the All Other Segments) and assets held for sale (within the Truckload segment). • Third quarter 2025 impairments reflect the non-cash impairments of tradenames associated with the decision to rebrand the MME and DHE brands of our LTL businesses under the AAA Cooper brand (within the LTL segment), as well as certain discontinued software projects (within the Intermodal Segment), and certain real property leases (within the Truckload Segment). Second quarter 2025 impairments reflect non-cash impairments related to certain real property owned and leased (within the Truckload Segment). First quarter 2025 reflects non-cash impairments related to certain real property leases (within the Truckload segment). 4 "Legal accruals" are included in "Insurance and claims" and "Miscellaneous operating expenses" in the condensed consolidated statements of comprehensive income and reflect the following: • Third quarter 2026 legal expense reflects the net increased estimated exposure for accrued legal matters based on recent settlement agreements. During the second quarter of 2026, the Company recorded estimated legal expense for various legal matters and reduced the estimated amount reserved for a loss contingency related to our third-party carrier insurance business (within the All Other Segments). First quarter 2026 legal expense reflects the net increased estimated exposure for accrued legal matters based on recent settlement agreements. • First and third quarter 2025 legal expense reflects the increased estimated exposure for accrued legal matters based on recent settlement agreements. 5 During the second quarter of 2026, the Company increased its estimate related to a pre-acquisition U.S. Xpress tax assessment (within the Truckload Segment) which is included in "Miscellaneous operating expenses" in the condensed consolidated statements of comprehensive income. 6 "Severance expense" is included within "Salaries, wages, and benefits" and "Miscellaneous operating expenses" in the condensed consolidated statements of comprehensive income. 7 "Restructuring expense" reflects costs incurred with the wind-down of Abilene Motor Express and is included within "Operations and maintenance" and "Miscellaneous operating expenses" in the condensed consolidated statements of comprehensive income. Non-GAAP Reconciliation
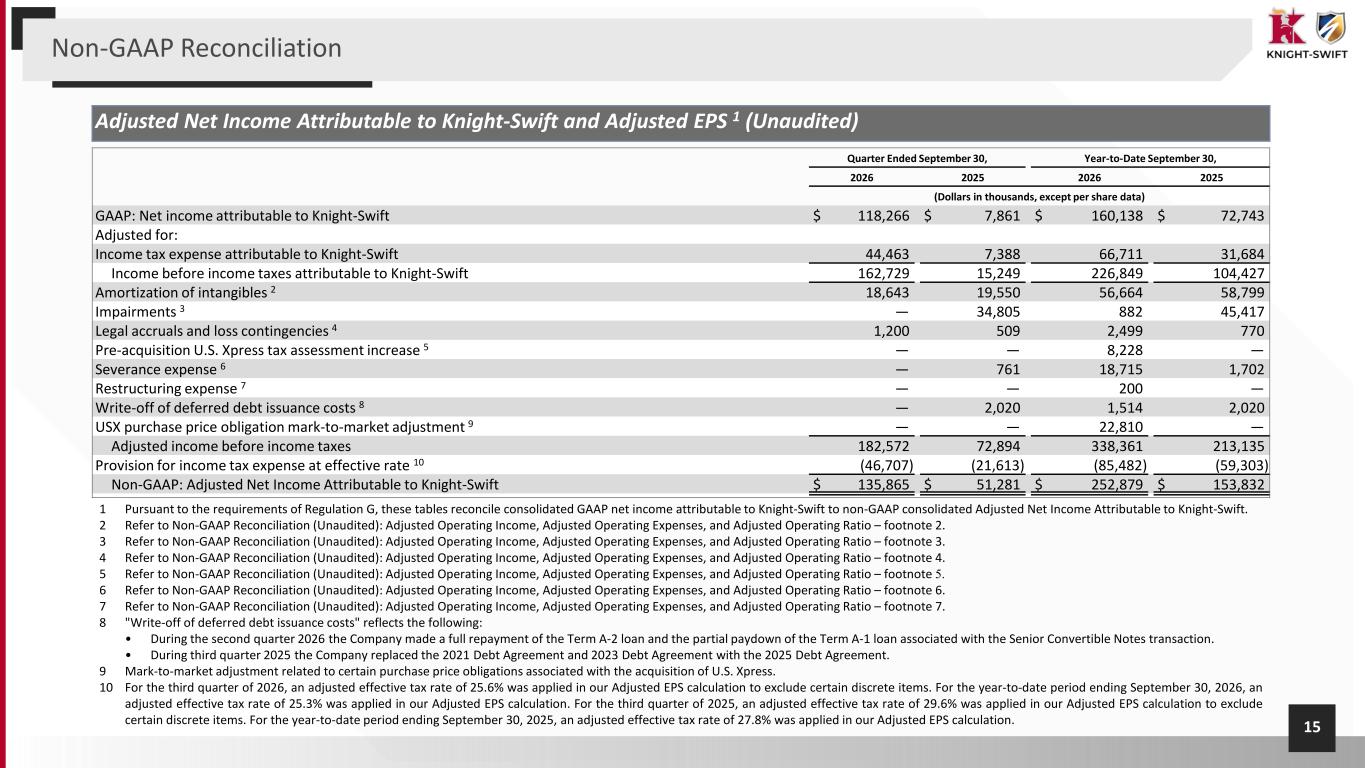
15 1 Pursuant to the requirements of Regulation G, these tables reconcile consolidated GAAP net income attributable to Knight-Swift to non-GAAP consolidated Adjusted Net Income Attributable to Knight-Swift. 2 Refer to Non-GAAP Reconciliation (Unaudited): Adjusted Operating Income, Adjusted Operating Expenses, and Adjusted Operating Ratio – footnote 2. 3 Refer to Non-GAAP Reconciliation (Unaudited): Adjusted Operating Income, Adjusted Operating Expenses, and Adjusted Operating Ratio – footnote 3. 4 Refer to Non-GAAP Reconciliation (Unaudited): Adjusted Operating Income, Adjusted Operating Expenses, and Adjusted Operating Ratio – footnote 4. 5 Refer to Non-GAAP Reconciliation (Unaudited): Adjusted Operating Income, Adjusted Operating Expenses, and Adjusted Operating Ratio – footnote 5. 6 Refer to Non-GAAP Reconciliation (Unaudited): Adjusted Operating Income, Adjusted Operating Expenses, and Adjusted Operating Ratio – footnote 6. 7 Refer to Non-GAAP Reconciliation (Unaudited): Adjusted Operating Income, Adjusted Operating Expenses, and Adjusted Operating Ratio – footnote 7. 8 "Write-off of deferred debt issuance costs" reflects the following: • During the second quarter 2026 the Company made a full repayment of the Term A-2 loan and the partial paydown of the Term A-1 loan associated with the Senior Convertible Notes transaction. • During third quarter 2025 the Company replaced the 2021 Debt Agreement and 2023 Debt Agreement with the 2025 Debt Agreement. 9 Mark-to-market adjustment related to certain purchase price obligations associated with the acquisition of U.S. Xpress. 10 For the third quarter of 2026, an adjusted effective tax rate of 25.6% was applied in our Adjusted EPS calculation to exclude certain discrete items. For the year-to-date period ending September 30, 2026, an adjusted effective tax rate of 25.3% was applied in our Adjusted EPS calculation. For the third quarter of 2025, an adjusted effective tax rate of 29.6% was applied in our Adjusted EPS calculation to exclude certain discrete items. For the year-to-date period ending September 30, 2025, an adjusted effective tax rate of 27.8% was applied in our Adjusted EPS calculation. Adjusted Net Income Attributable to Knight-Swift and Adjusted EPS 1 (Unaudited) Quarter Ended September 30, Year-to-Date September 30, 2026 2025 2026 2025 (Dollars in thousands, except per share data) GAAP: Net income attributable to Knight-Swift $ 118,266 $ 7,861 $ 160,138 $ 72,743 Adjusted for: Income tax expense attributable to Knight-Swift 44,463 7,388 66,711 31,684 Income before income taxes attributable to Knight-Swift 162,729 15,249 226,849 104,427 Amortization of intangibles 2 18,643 19,550 56,664 58,799 Impairments 3 — 34,805 882 45,417 Legal accruals and loss contingencies 4 1,200 509 2,499 770 Pre-acquisition U.S. Xpress tax assessment increase 5 — — 8,228 — Severance expense 6 — 761 18,715 1,702 Restructuring expense 7 — — 200 — Write-off of deferred debt issuance costs 8 — 2,020 1,514 2,020 USX purchase price obligation mark-to-market adjustment 9 — — 22,810 — Adjusted income before income taxes 182,572 72,894 338,361 213,135 Provision for income tax expense at effective rate 10 (46,707) (21,613) (85,482) (59,303) Non-GAAP: Adjusted Net Income Attributable to Knight-Swift $ 135,865 $ 51,281 $ 252,879 $ 153,832 Non-GAAP Reconciliation
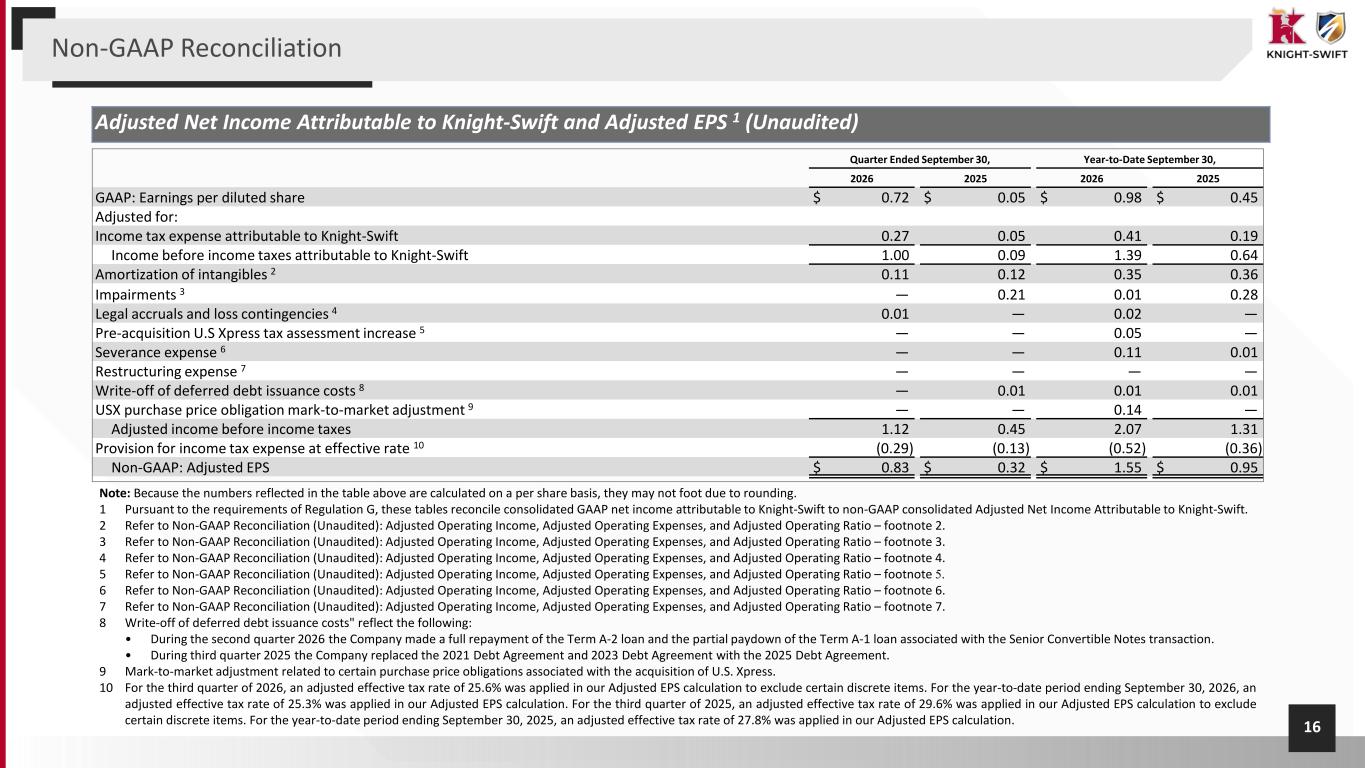
16 Adjusted Net Income Attributable to Knight-Swift and Adjusted EPS 1 2 (Unaudited) Quarter Ended September 30, Year-to-Date September 30, 2026 2025 2026 2025 GAAP: Earnings per diluted share $ 0.72 $ 0.05 $ 0.98 $ 0.45 Adjusted for: Income tax expense attributable to Knight-Swift 0.27 0.05 0.41 0.19 Income before income taxes attributable to Knight-Swift 1.00 0.09 1.39 0.64 Amortization of intangibles 2 0.11 0.12 0.35 0.36 Impairments 3 — 0.21 0.01 0.28 Legal accruals and loss contingencies 4 0.01 — 0.02 — Pre-acquisition U.S Xpress tax assessment increase 5 — — 0.05 — Severance expense 6 — — 0.11 0.01 Restructuring expense 7 — — — — Write-off of deferred debt issuance costs 8 — 0.01 0.01 0.01 USX purchase price obligation mark-to-market adjustment 9 — — 0.14 — Adjusted income before income taxes 1.12 0.45 2.07 1.31 Provision for income tax expense at effective rate 10 (0.29) (0.13) (0.52) (0.36) Non-GAAP: Adjusted EPS $ 0.83 $ 0.32 $ 1.55 $ 0.95 Note: Because the numbers reflected in the table above are calculated on a per share basis, they may not foot due to rounding. 1 Pursuant to the requirements of Regulation G, these tables reconcile consolidated GAAP net income attributable to Knight-Swift to non-GAAP consolidated Adjusted Net Income Attributable to Knight-Swift. 2 Refer to Non-GAAP Reconciliation (Unaudited): Adjusted Operating Income, Adjusted Operating Expenses, and Adjusted Operating Ratio – footnote 2. 3 Refer to Non-GAAP Reconciliation (Unaudited): Adjusted Operating Income, Adjusted Operating Expenses, and Adjusted Operating Ratio – footnote 3. 4 Refer to Non-GAAP Reconciliation (Unaudited): Adjusted Operating Income, Adjusted Operating Expenses, and Adjusted Operating Ratio – footnote 4. 5 Refer to Non-GAAP Reconciliation (Unaudited): Adjusted Operating Income, Adjusted Operating Expenses, and Adjusted Operating Ratio – footnote 5. 6 Refer to Non-GAAP Reconciliation (Unaudited): Adjusted Operating Income, Adjusted Operating Expenses, and Adjusted Operating Ratio – footnote 6. 7 Refer to Non-GAAP Reconciliation (Unaudited): Adjusted Operating Income, Adjusted Operating Expenses, and Adjusted Operating Ratio – footnote 7. 8 Write-off of deferred debt issuance costs" reflect the following: • During the second quarter 2026 the Company made a full repayment of the Term A-2 loan and the partial paydown of the Term A-1 loan associated with the Senior Convertible Notes transaction. • During third quarter 2025 the Company replaced the 2021 Debt Agreement and 2023 Debt Agreement with the 2025 Debt Agreement. 9 Mark-to-market adjustment related to certain purchase price obligations associated with the acquisition of U.S. Xpress. 10 For the third quarter of 2026, an adjusted effective tax rate of 25.6% was applied in our Adjusted EPS calculation to exclude certain discrete items. For the year-to-date period ending September 30, 2026, an adjusted effective tax rate of 25.3% was applied in our Adjusted EPS calculation. For the third quarter of 2025, an adjusted effective tax rate of 29.6% was applied in our Adjusted EPS calculation to exclude certain discrete items. For the year-to-date period ending September 30, 2025, an adjusted effective tax rate of 27.8% was applied in our Adjusted EPS calculation. djusted Net Income Attributable to Knight-Swift and Adjusted EPS 1 (Una di ) Non-GAAP Reconciliation
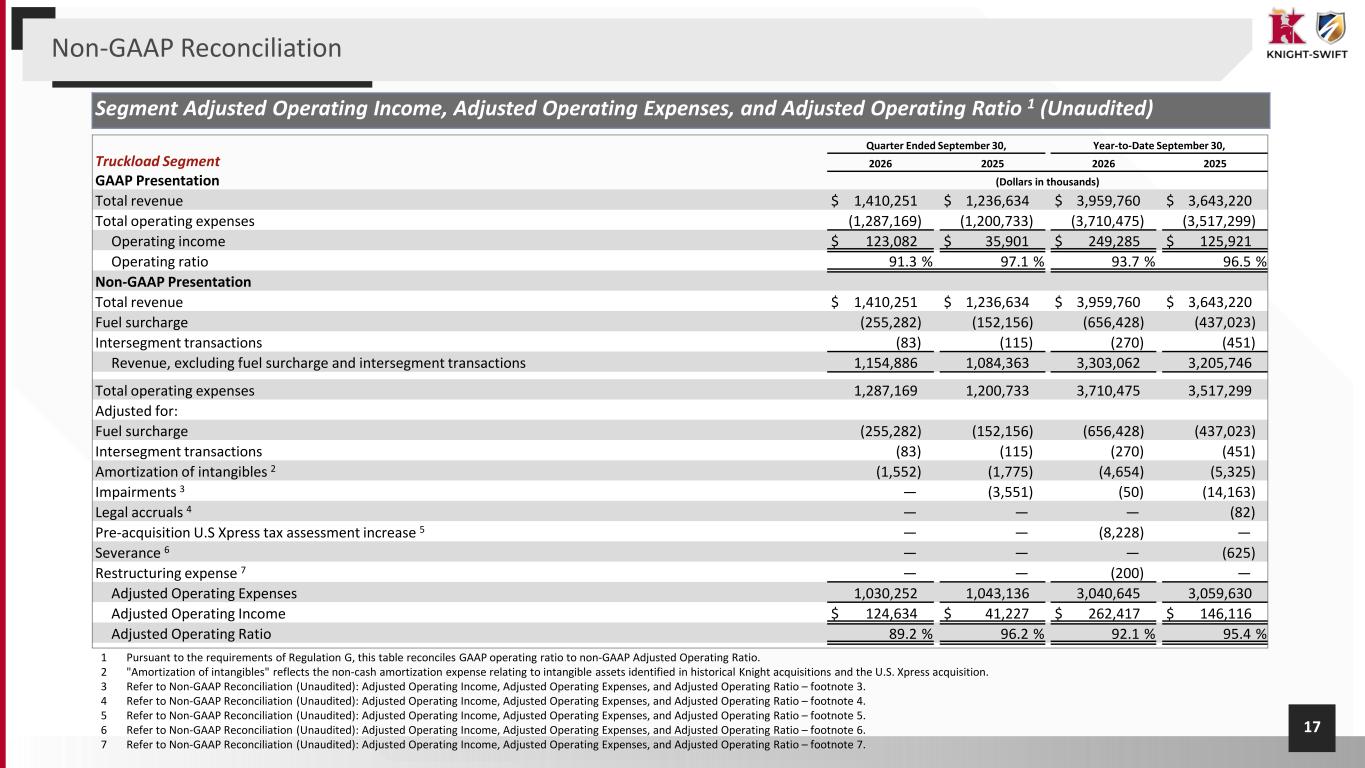
17 Segment Adjusted Operating Income, Adjusted Operating Expenses, and Adjusted Operating Ratio 1 (Unaudited) Quarter Ended September 30, Year-to-Date September 30, Truckload Segment 2026 2025 2026 2025 GAAP Presentation (Dollars in thousands) Total revenue $ 1,410,251 $ 1,236,634 $ 3,959,760 $ 3,643,220 Total operating expenses (1,287,169) (1,200,733) (3,710,475) (3,517,299) Operating income $ 123,082 $ 35,901 $ 249,285 $ 125,921 Operating ratio 91.3 % 97.1 % 93.7 % 96.5 % Non-GAAP Presentation Total revenue $ 1,410,251 $ 1,236,634 $ 3,959,760 $ 3,643,220 Fuel surcharge (255,282) (152,156) (656,428) (437,023) Intersegment transactions (83) (115) (270) (451) Revenue, excluding fuel surcharge and intersegment transactions 1,154,886 1,084,363 3,303,062 3,205,746 Total operating expenses 1,287,169 1,200,733 3,710,475 3,517,299 Adjusted for: Fuel surcharge (255,282) (152,156) (656,428) (437,023) Intersegment transactions (83) (115) (270) (451) Amortization of intangibles 2 (1,552) (1,775) (4,654) (5,325) Impairments 3 — (3,551) (50) (14,163) Legal accruals 4 — — — (82) Pre-acquisition U.S Xpress tax assessment increase 5 — — (8,228) — Severance 6 — — — (625) Restructuring expense 7 — — (200) — Adjusted Operating Expenses 1,030,252 1,043,136 3,040,645 3,059,630 Adjusted Operating Income $ 124,634 $ 41,227 $ 262,417 $ 146,116 Adjusted Operating Ratio 89.2 % 96.2 % 92.1 % 95.4 % 1 Pursuant to the requirements of Regulation G, this table reconciles GAAP operating ratio to non-GAAP Adjusted Operating Ratio. 2 "Amortization of intangibles" reflects the non-cash amortization expense relating to intangible assets identified in historical Knight acquisitions and the U.S. Xpress acquisition. 3 Refer to Non-GAAP Reconciliation (Unaudited): Adjusted Operating Income, Adjusted Operating Expenses, and Adjusted Operating Ratio – footnote 3. 4 Refer to Non-GAAP Reconciliation (Unaudited): Adjusted Operating Income, Adjusted Operating Expenses, and Adjusted Operating Ratio – footnote 4. 5 Refer to Non-GAAP Reconciliation (Unaudited): Adjusted Operating Income, Adjusted Operating Expenses, and Adjusted Operating Ratio – footnote 5. 6 Refer to Non-GAAP Reconciliation (Unaudited): Adjusted Operating Income, Adjusted Operating Expenses, and Adjusted Operating Ratio – footnote 6. 7 Refer to Non-GAAP Reconciliation (Unaudited): Adjusted Operating Income, Adjusted Operating Expenses, and Adjusted Operating Ratio – footnote 7. Non-GAAP Reconciliation
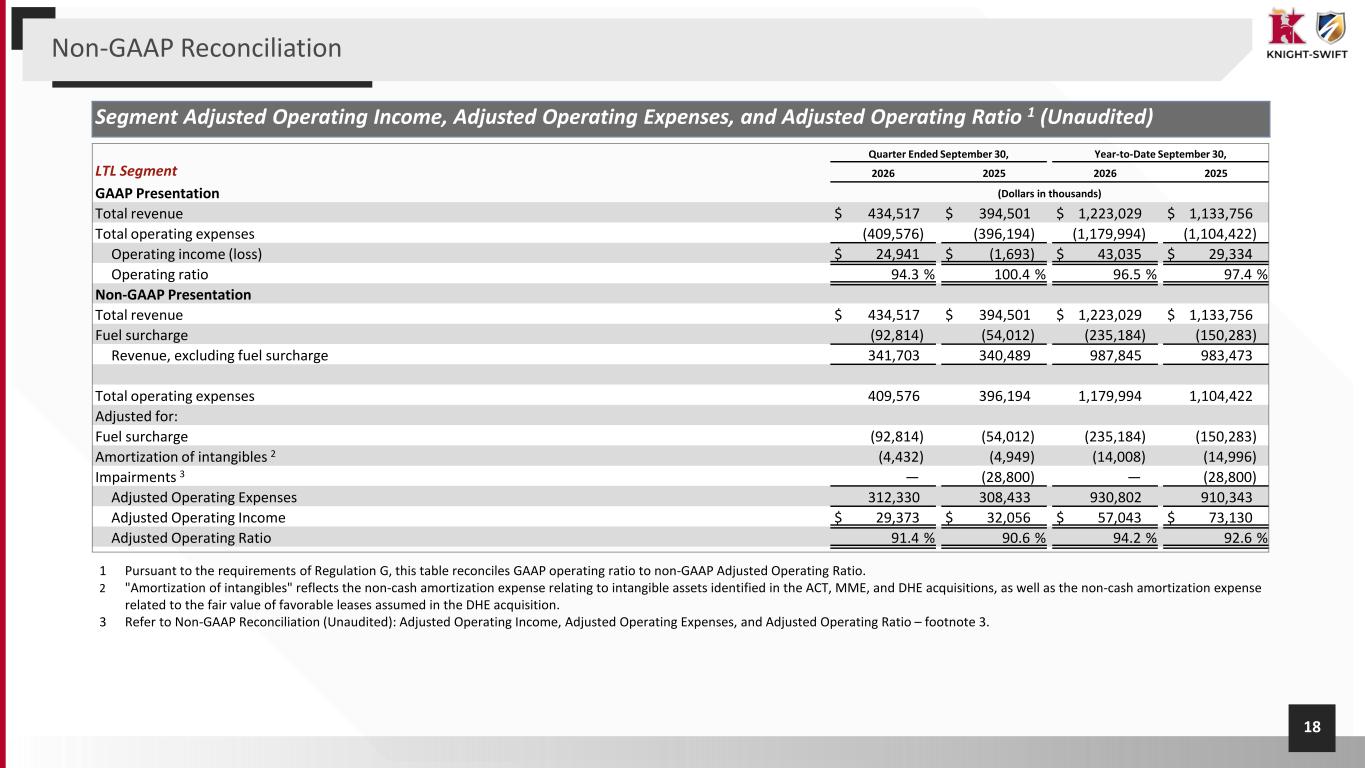
18 Segment Adjusted Operating Income, Adjusted Operating Expenses, and Adjusted Operating Ratio 1 (Unaudited) Quarter Ended September 30, Year-to-Date September 30, LTL Segment 2026 2025 2026 2025 GAAP Presentation (Dollars in thousands) Total revenue $ 434,517 $ 394,501 $ 1,223,029 $ 1,133,756 Total operating expenses (409,576) (396,194) (1,179,994) (1,104,422) Operating income (loss) $ 24,941 $ (1,693) $ 43,035 $ 29,334 Operating ratio 94.3 % 100.4 % 96.5 % 97.4 % Non-GAAP Presentation Total revenue $ 434,517 $ 394,501 $ 1,223,029 $ 1,133,756 Fuel surcharge (92,814) (54,012) (235,184) (150,283) Revenue, excluding fuel surcharge 341,703 340,489 987,845 983,473 Total operating expenses 409,576 396,194 1,179,994 1,104,422 Adjusted for: Fuel surcharge (92,814) (54,012) (235,184) (150,283) Amortization of intangibles 2 (4,432) (4,949) (14,008) (14,996) Impairments 3 — (28,800) — (28,800) Adjusted Operating Expenses 312,330 308,433 930,802 910,343 Adjusted Operating Income $ 29,373 $ 32,056 $ 57,043 $ 73,130 Adjusted Operating Ratio 91.4 % 90.6 % 94.2 % 92.6 % 1 Pursuant to the requirements of Regulation G, this table reconciles GAAP operating ratio to non-GAAP Adjusted Operating Ratio. 2 "Amortization of intangibles" reflects the non-cash amortization expense relating to intangible assets identified in the ACT, MME, and DHE acquisitions, as well as the non-cash amortization expense related to the fair value of favorable leases assumed in the DHE acquisition. 3 Refer to Non-GAAP Reconciliation (Unaudited): Adjusted Operating Income, Adjusted Operating Expenses, and Adjusted Operating Ratio – footnote 3. Non-GAAP Reconciliation
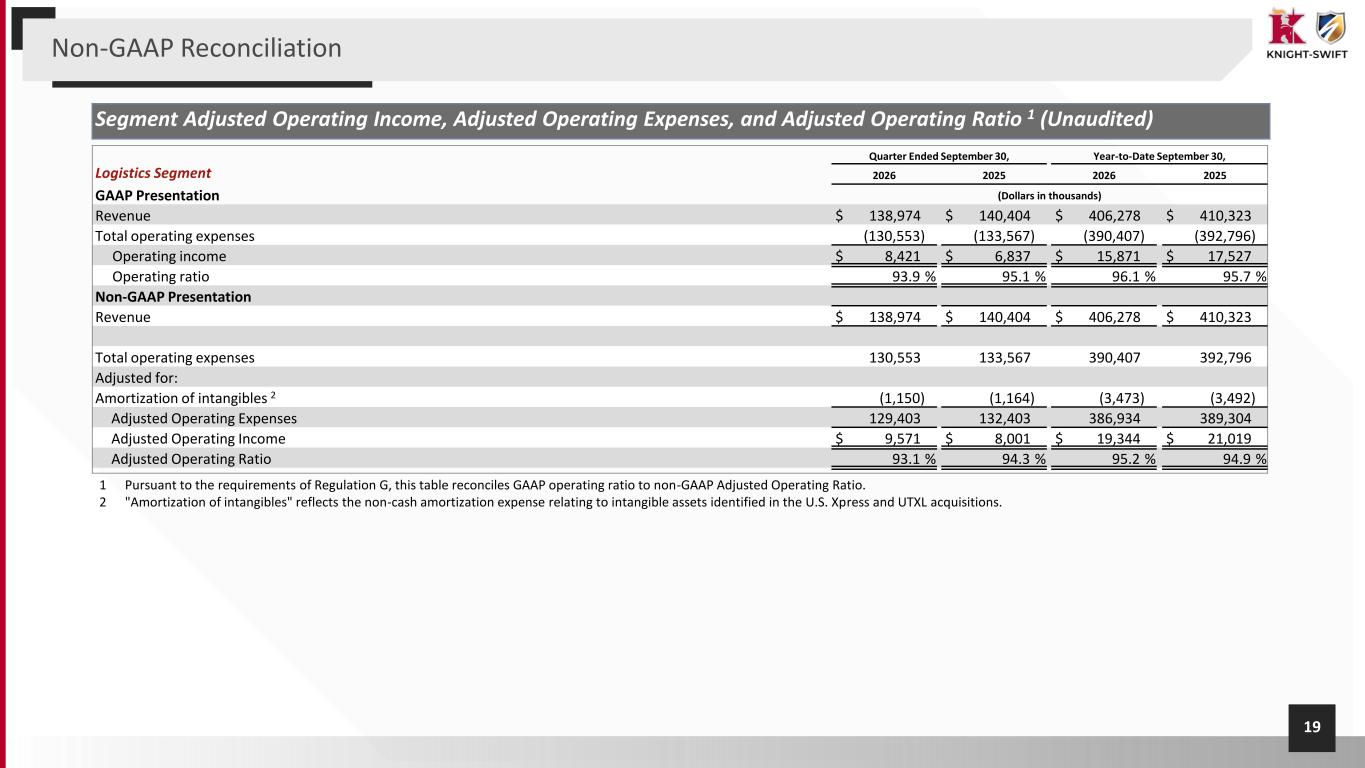
19 Quarter Ended September 30, Year-to-Date September 30, Logistics Segment 2026 2025 2026 2025 GAAP Presentation (Dollars in thousands) Revenue $ 138,974 $ 140,404 $ 406,278 $ 410,323 Total operating expenses (130,553) (133,567) (390,407) (392,796) Operating income $ 8,421 $ 6,837 $ 15,871 $ 17,527 Operating ratio 93.9 % 95.1 % 96.1 % 95.7 % Non-GAAP Presentation Revenue $ 138,974 $ 140,404 $ 406,278 $ 410,323 Total operating expenses 130,553 133,567 390,407 392,796 Adjusted for: Amortization of intangibles 2 (1,150) (1,164) (3,473) (3,492) Adjusted Operating Expenses 129,403 132,403 386,934 389,304 Adjusted Operating Income $ 9,571 $ 8,001 $ 19,344 $ 21,019 Adjusted Operating Ratio 93.1 % 94.3 % 95.2 % 94.9 % Segment Adjusted Operating Income, Adjusted Operating Expenses, and Adjusted Operating Ratio 1 (Unaudited) 1 Pursuant to the requirements of Regulation G, this table reconciles GAAP operating ratio to non-GAAP Adjusted Operating Ratio. 2 "Amortization of intangibles" reflects the non-cash amortization expense relating to intangible assets identified in the U.S. Xpress and UTXL acquisitions. Non-GAAP Reconciliation
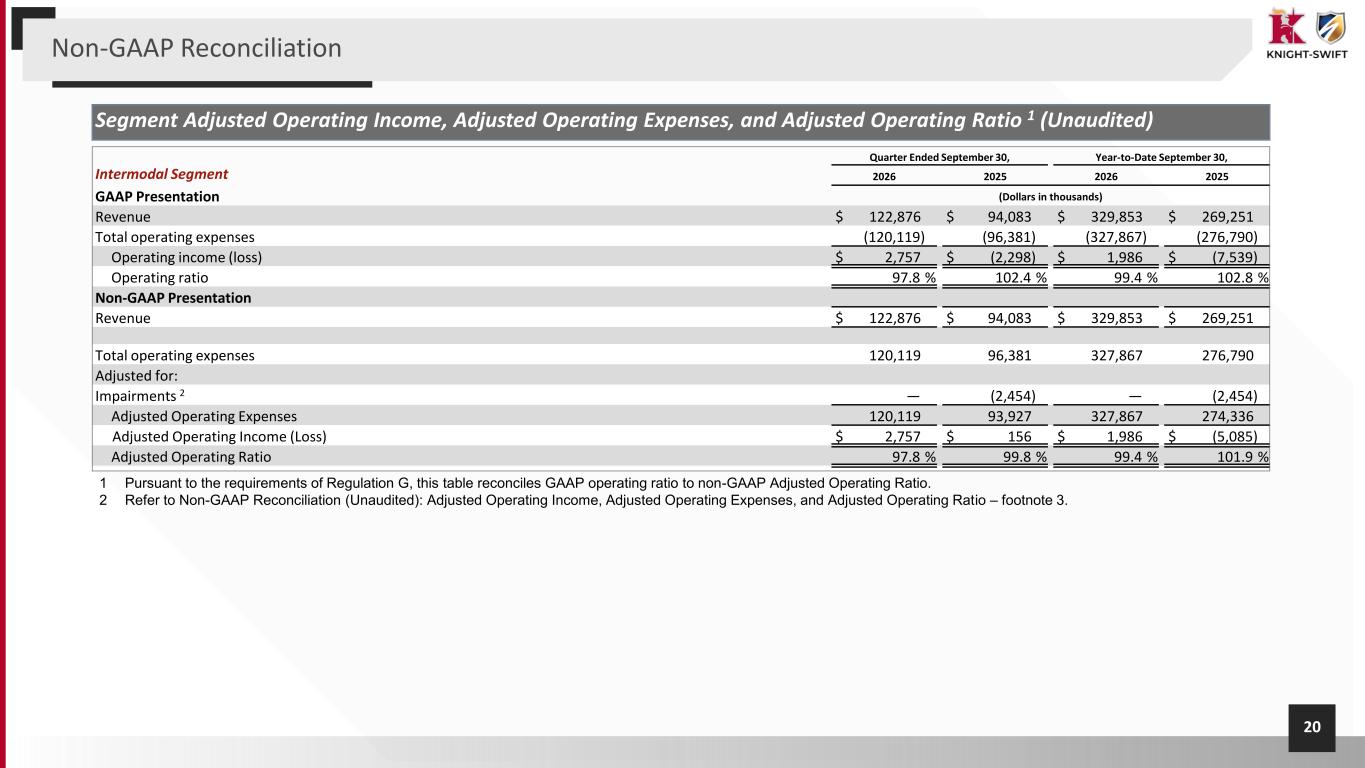
20 Segment Adjusted Operating Income, Adjusted Operating Expenses, and Adjusted Operating Ratio 1 (Unaudited) Quarter Ended September 30, Year-to-Date September 30, Intermodal Segment 2026 2025 2026 2025 GAAP Presentation (Dollars in thousands) Revenue $ 122,876 $ 94,083 $ 329,853 $ 269,251 Total operating expenses (120,119) (96,381) (327,867) (276,790) Operating income (loss) $ 2,757 $ (2,298) $ 1,986 $ (7,539) Operating ratio 97.8 % 102.4 % 99.4 % 102.8 % Non-GAAP Presentation Revenue $ 122,876 $ 94,083 $ 329,853 $ 269,251 Total operating expenses 120,119 96,381 327,867 276,790 Adjusted for: Impairments 2 — (2,454) — (2,454) Adjusted Operating Expenses 120,119 93,927 327,867 274,336 Adjusted Operating Income (Loss) $ 2,757 $ 156 $ 1,986 $ (5,085) Adjusted Operating Ratio 97.8 % 99.8 % 99.4 % 101.9 % 1 Pursuant to the requirements of Regulation G, this table reconciles GAAP operating ratio to non-GAAP Adjusted Operating Ratio. 2 Refer to Non-GAAP Reconciliation (Unaudited): Adjusted Operating Income, Adjusted Operating Expenses, and Adjusted Operating Ratio – footnote 3. Non-GAAP Reconciliation