Exhibit 99.3 Third Quarter 2026 Financial Results Presentation October 21, 2026 Quarterly Earnings Report
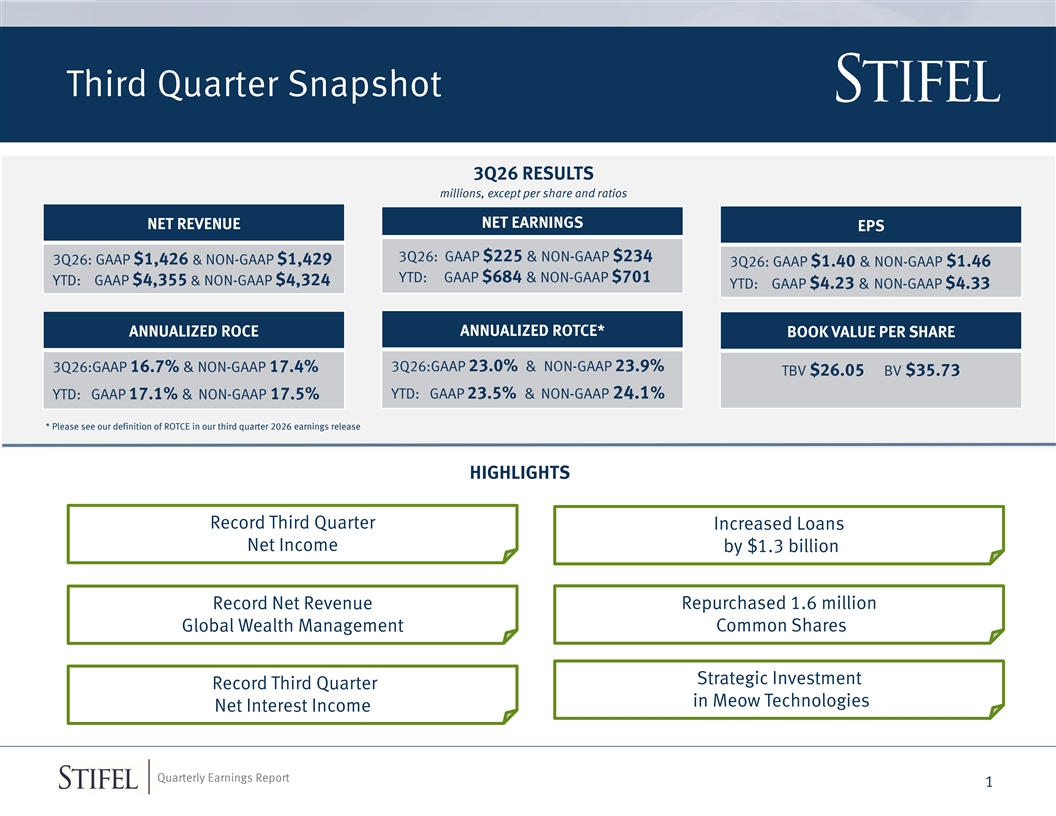
Third Quarter Snapshot 3Q26 RESULTS millions, except per share and ratios NET EARNINGS NET REVENUE EPS 3Q26: GAAP $225 & NON-GAAP $234 3Q26: GAAP $1,426 & NON-GAAP $1,429 3Q26: GAAP $1.40 & NON-GAAP $1.46 YTD: GAAP $684 & NON-GAAP $701 YTD: GAAP $4,355 & NON-GAAP $4,324 YTD: GAAP $4.23 & NON-GAAP $4.33 ANNUALIZED ROTCE* ANNUALIZED ROCE BOOK VALUE PER SHARE 3Q26:GAAP 16.7% & NON-GAAP 17.4% 3Q26:GAAP 23.0% & NON-GAAP 23.9% TBV $26.05 BV $35.73 YTD: GAAP 23.5% & NON-GAAP 24.1% YTD: GAAP 17.1% & NON-GAAP 17.5% * Please see our definition of ROTCE in our third quarter 2026 earnings release HIGHLIGHTS Record Third Quarter Increased Loans Net Income by $1.3 billion Record Net Revenue Repurchased 1.6 million Global Wealth Management Common Shares Strategic Investment Record Third Quarter in Meow Technologies Net Interest Income Quarterly Earnings Report 1
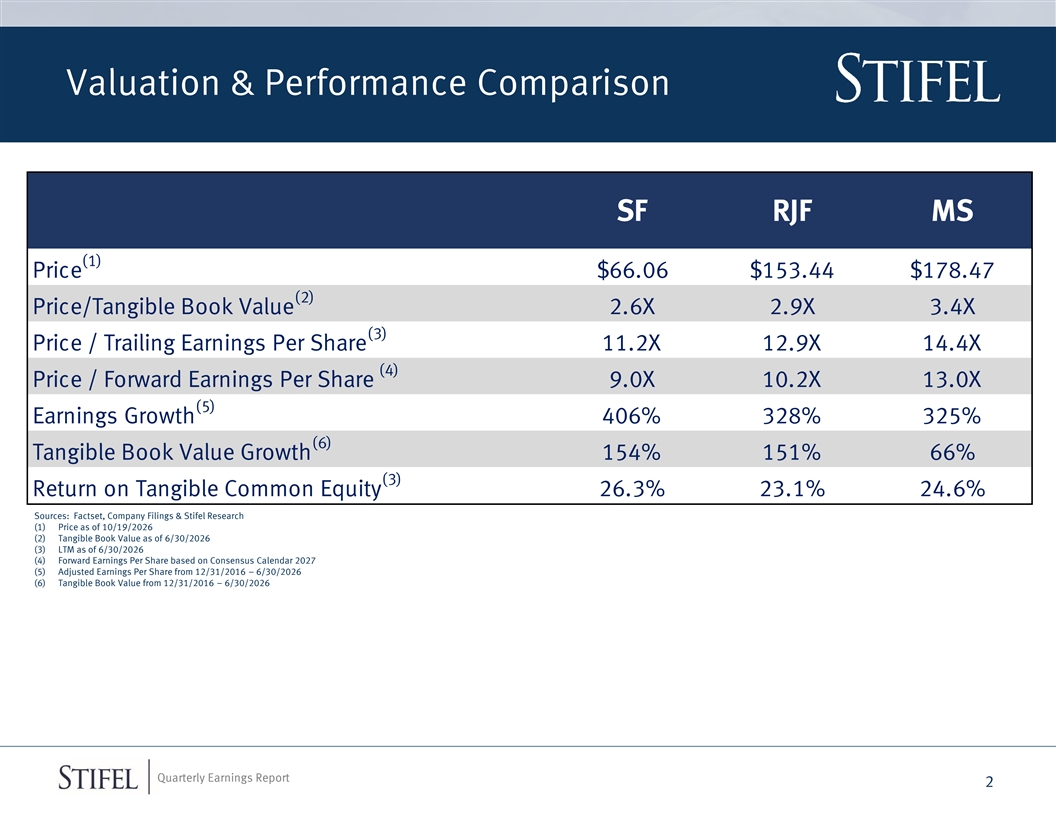
Valuation & Performance Comparison SF RJF MS (1) Price $66.06 $153.44 $178.47 (2) Price/Tangible Book Value 2.6X 2.9X 3.4X (3) Price / Trailing Earnings Per Share 11.2X 12.9X 14.4X (4) Price / Forward Earnings Per Share 9.0X 10.2X 13.0X (5) Earnings Growth 406% 328% 325% (6) Tangible Book Value Growth 154% 151% 66% (3) Return on Tangible Common Equity 26.3% 23.1% 24.6% Sources: Factset, Company Filings & Stifel Research (1) Price as of 10/19/2026 (2) Tangible Book Value as of 6/30/2026 (3) LTM as of 6/30/2026 (4) Forward Earnings Per Share based on Consensus Calendar 2027 (5) Adjusted Earnings Per Share from 12/31/2016 – 6/30/2026 (6) Tangible Book Value from 12/31/2016 – 6/30/2026 Quarterly Earnings Report 2
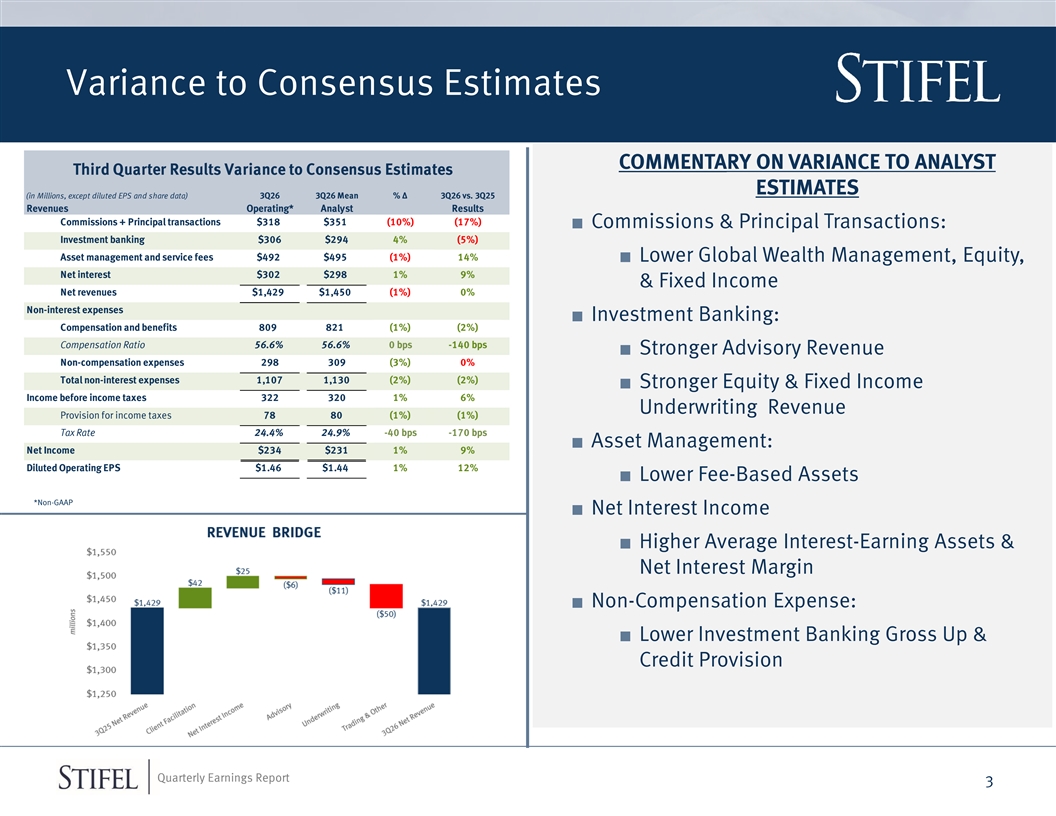
Variance to Consensus Estimates COMMENTARY ON VARIANCE TO ANALYST Third Quarter Results Variance to Consensus Estimates ESTIMATES (in Millions, except diluted EPS and share data) 3Q26 3Q26 Mean % ∆ 3Q26 vs. 3Q25 Revenues Operating* Analyst Results Commissions + Principal transactions $318 $351 (10%) (17%) ■ Commissions & Principal Transactions: Investment banking $306 $294 4% (5%) Asset management and service fees $492 $495 (1%) 14%■ Lower Global Wealth Management, Equity, Net interest $302 $298 1% 9% & Fixed Income Net revenues $1,429 $1,450 (1%) 0% Non-interest expenses ■ Investment Banking: Compensation and benefits 809 821 (1%) (2%) Compensation Ratio 56.6% 56.6% 0 bps -140 bps ■ Stronger Advisory Revenue Non-compensation expenses 298 309 (3%) 0% Total non-interest expenses 1,107 1,130 (2%) (2%) ■ Stronger Equity & Fixed Income Income before income taxes 322 320 1% 6% Underwriting Revenue Provision for income taxes 78 80 (1%) (1%) Tax Rate 24.4% 24.9% -40 bps -170 bps ■ Asset Management: Net Income $234 $231 1% 9% Diluted Operating EPS $1.46 $1.44 1% 12% ■ Lower Fee-Based Assets *Non-GAAP ■ Net Interest Income * Impact of Legal Reserves calculated as legal reserves of $67 million, an adjusted tax rate of 25%, divided by the diluted ■ Higher Average Interest-Earning Assets & average share count. Net Interest Margin ■ Non-Compensation Expense: ■ Lower Investment Banking Gross Up & Credit Provision Quarterly Earnings Report 3
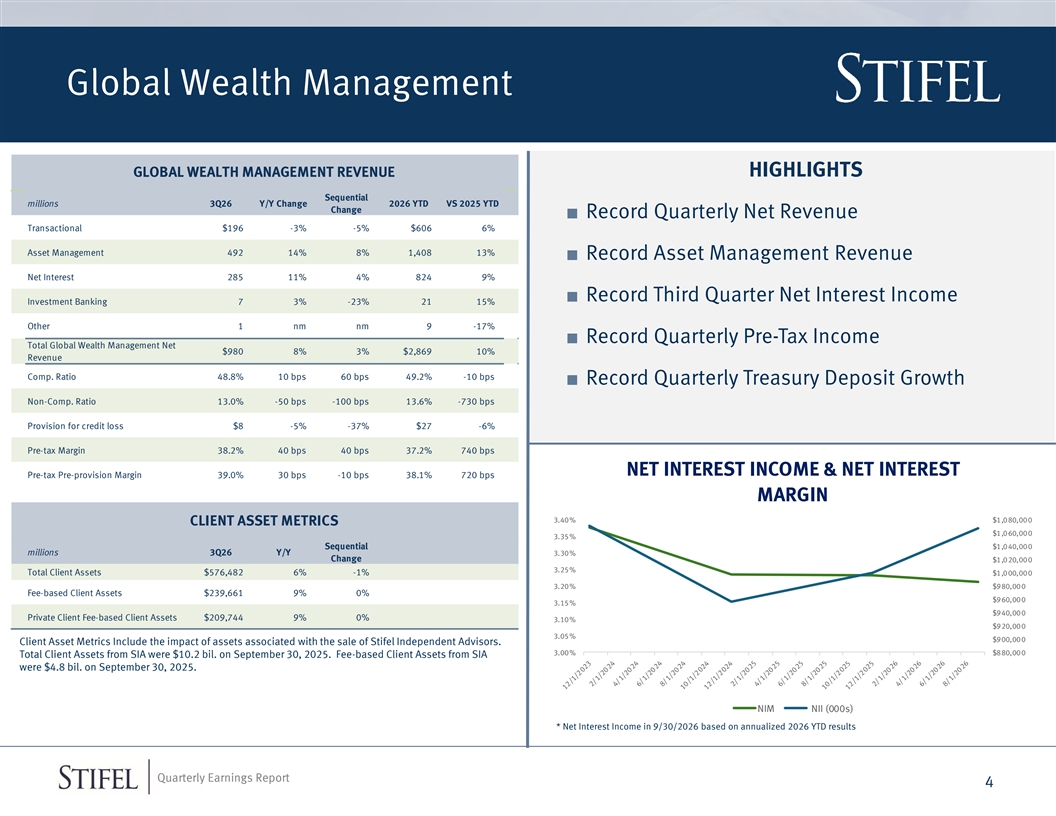
Global Wealth Management GLOBAL WEALTH MANAGEMENT REVENUE HIGHLIGHTS Sequential millions 3Q26 Y/Y Change 2026 YTD VS 2025 YTD Change ■ Record Quarterly Net Revenue Transactional $196 -3% -5% $606 6% Asset Management 492 14% 8% 1,408 13% ■ Record Asset Management Revenue Net Interest 285 11% 4% 824 9% ■ Record Third Quarter Net Interest Income Investment Banking 7 3% -23% 21 15% Other 1 nm nm 9 -17% ■ Record Quarterly Pre-Tax Income Total Global Wealth Management Net $980 8% 3% $2,869 10% Revenue Comp. Ratio 48.8% 10 bps 60 bps 49.2% -10 bps ■ Record Quarterly Treasury Deposit Growth Non-Comp. Ratio 13.0% -50 bps -100 bps 13.6% -730 bps Provision for credit loss $8 -5% -37% $27 -6% Pre-tax Margin 38.2% 40 bps 40 bps 37.2% 740 bps NET INTEREST INCOME & NET INTEREST Pre-tax Pre-provision Margin 39.0% 30 bps -10 bps 38.1% 720 bps MARGIN 3.40% $1,080,000 CLIENT ASSET METRICS $1,060,000 3.35% Sequential $1,040,000 millions 3Q26 Y/Y 3.30% Change $1,020,000 3.25% Total Client Assets $576,482 6% -1% $1,000,000 3.20% $980,000 Fee-based Client Assets $239,661 9% 0% $960,000 3.15% $940,000 Private Client Fee-based Client Assets $209,744 9% 0% 3.10% $920,000 3.05% $900,000 Client Asset Metrics Include the impact of assets associated with the sale of Stifel Independent Advisors. 3.00% $880,000 Total Client Assets from SIA were $10.2 bil. on September 30, 2025. Fee-based Client Assets from SIA were $4.8 bil. on September 30, 2025. NIM NII (000s) * Net Interest Income in 9/30/2026 based on annualized 2026 YTD results Quarterly Earnings Report 4
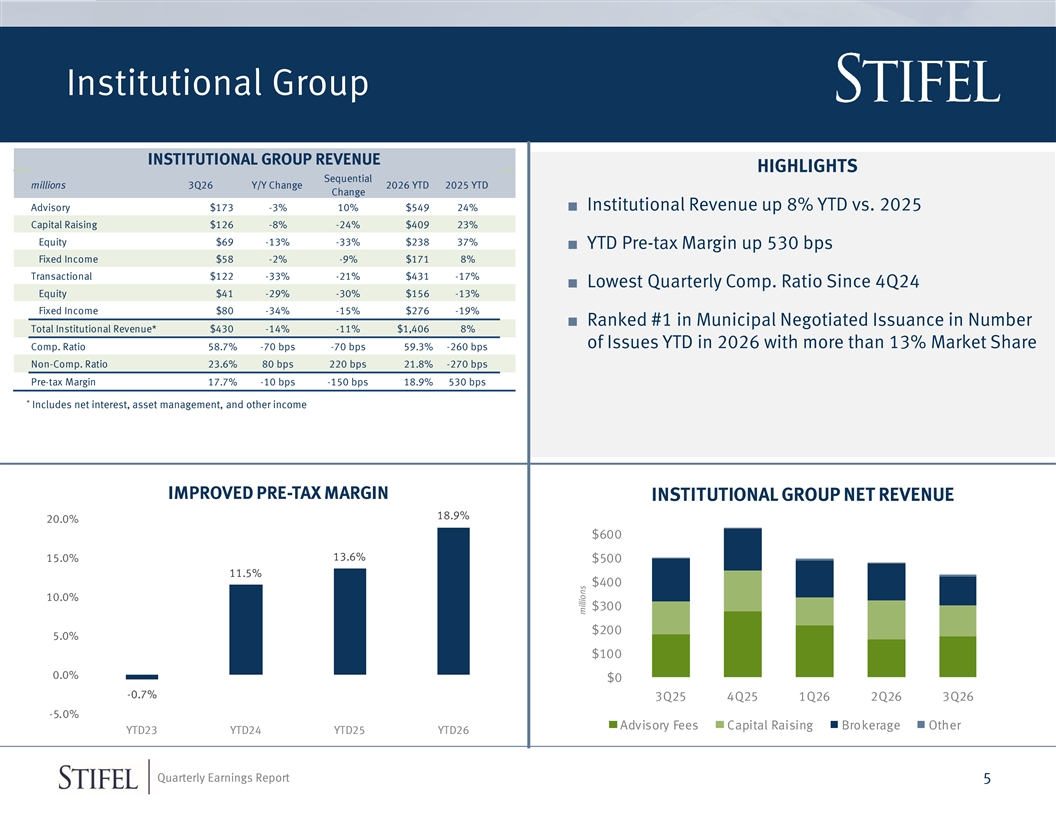
Institutional Group INSTITUTIONAL GROUP REVENUE HIGHLIGHTS Sequential millions 3Q26 Y/Y Change 2026 YTD 2025 YTD Change Advisory $173 -3% 10% $549 24%■ Institutional Revenue up 8% YTD vs. 2025 Capital Raising $126 -8% -24% $409 23% Equity $69 -13% -33% $238 37% ■ YTD Pre-tax Margin up 530 bps Fixed Income $58 -2% -9% $171 8% Transactional $122 -33% -21% $431 -17% ■ Lowest Quarterly Comp. Ratio Since 4Q24 Equity $41 -29% -30% $156 -13% Fixed Income $80 -34% -15% $276 -19% ■ Ranked #1 in Municipal Negotiated Issuance in Number Total Institutional Revenue* $430 -14% -11% $1,406 8% of Issues YTD in 2026 with more than 13% Market Share Comp. Ratio 58.7% -70 bps -70 bps 59.3% -260 bps Non-Comp. Ratio 23.6% 80 bps 220 bps 21.8% -270 bps Pre-tax Margin 17.7% -10 bps -150 bps 18.9% 530 bps * Includes net interest, asset management, and other income IMPROVED PRE-TAX MARGIN INSTITUTIONAL GROUP NET REVENUE 18.9% 20.0% $600 13.6% 15.0% $500 11.5% $400 10.0% $300 $200 5.0% $100 0.0% $0 -0.7% 3Q25 4Q25 1Q26 2Q26 3Q26 -5.0% Advisory Fees Capital Raising Brokerage Other YTD23 YTD24 YTD25 YTD26 * 2021 revenue based on annualized results through 9/30/2021 Quarterly Earnings Report 5 millions
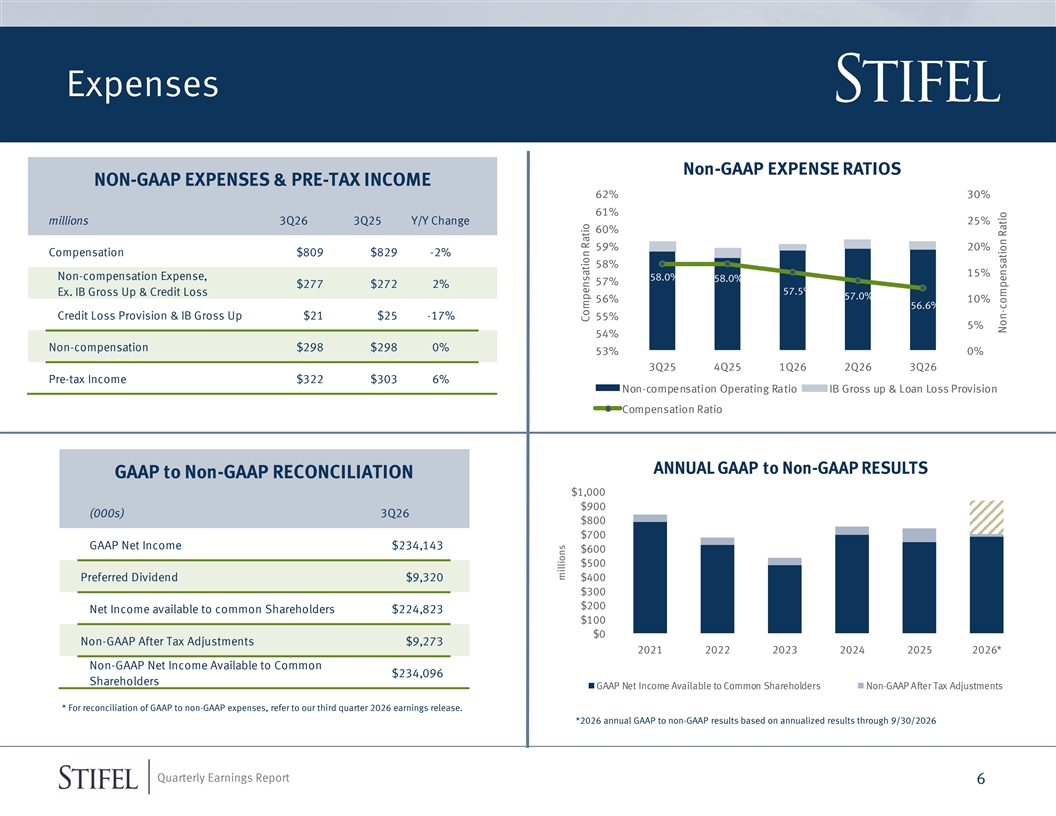
Expenses Non-GAAP EXPENSE RATIOS NON-GAAP EXPENSES & PRE-TAX INCOME 62% 30% 61% 25% millions 3Q26 3Q25 Y/Y Change 60% 59% 20% Compensation $809 $829 -2% 58% 15% Non-compensation Expense, 58.0% 58.0% 57% $277 $272 2% 57.5% Ex. IB Gross Up & Credit Loss 57.0% 56% 10% 56.6% Credit Loss Provision & IB Gross Up $21 $25 -17% 55% 5% 54% Non-compensation $298 $298 0% 53% 0% 3Q25 4Q25 1Q26 2Q26 3Q26 Pre-tax Income $322 $303 6% Non-compensation Operating Ratio IB Gross up & Loan Loss Provision Compensation Ratio ANNUAL GAAP to Non-GAAP RESULTS GAAP to Non-GAAP RECONCILIATION $1,000 $900 (000s) 3Q26 $800 Bar chart header numbers $700 GAAP Net Income $234,143 $600 are a graphic $500 Preferred Dividend $9,320 $400 $300 $200 Net Income available to common Shareholders $224,823 $100 $0 Non-GAAP After Tax Adjustments $9,273 2021 2022 2023 2024 2025 2026* Non-GAAP Net Income Available to Common $234,096 Shareholders GAAP Net Income Available to Common Shareholders Non-GAAP After Tax Adjustments * For reconciliation of GAAP to non-GAAP expenses, refer to our third quarter 2026 earnings release. *2026 annual GAAP to non-GAAP results based on annualized results through 9/30/2026 Quarterly Earnings Report 6 millions Compensation Ratio Non-compensation Ratio
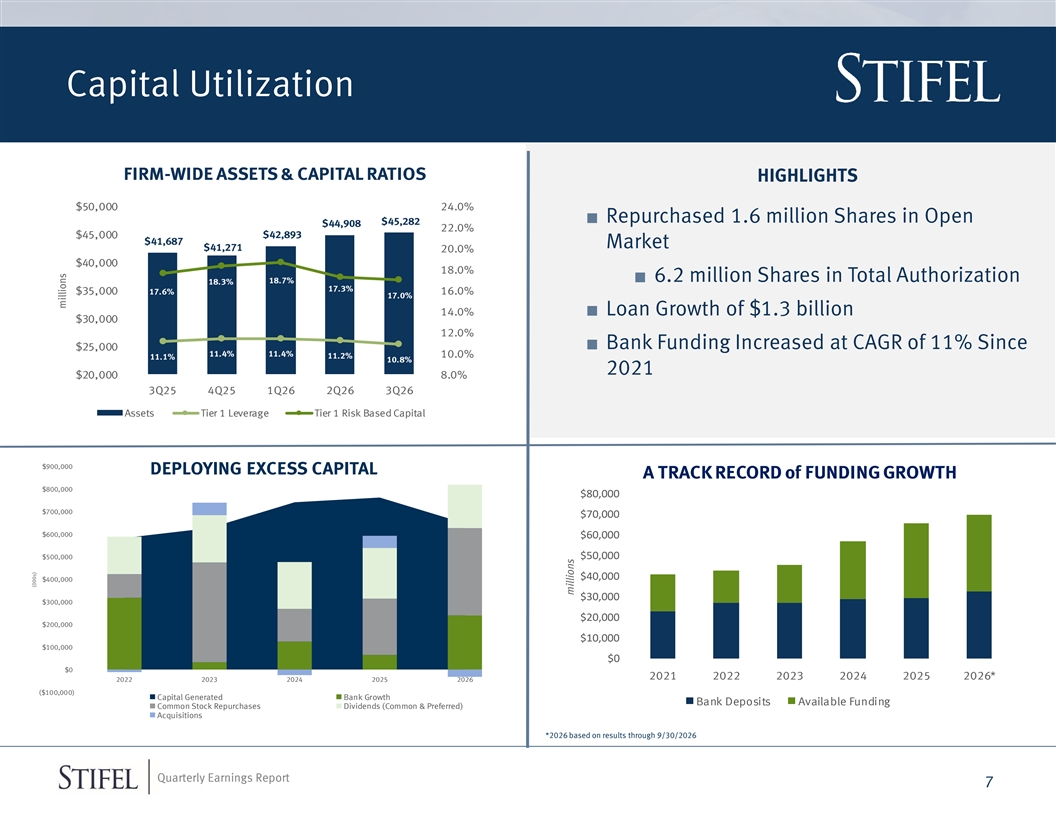
Capital Utilization FIRM-WIDE ASSETS & CAPITAL RATIOS HIGHLIGHTS $50,000 24.0% ■ Repurchased 1.6 million Shares in Open $45,282 $44,908 22.0% $45,000 $42,893 $41,687 Market $41,271 20.0% $40,000 18.0% ■ 6.2 million Shares in Total Authorization 18.7% 18.3% 17.3% $35,000 17.6% 16.0% 17.0% 14.0%■ Loan Growth of $1.3 billion $30,000 12.0% ■ Bank Funding Increased at CAGR of 11% Since $25,000 11.4% 11.4% 10.0% 11.2% 11.1% 10.8% 2021 $20,000 8.0% 3Q25 4Q25 1Q26 2Q26 3Q26 Assets Tier 1 Leverage Tier 1 Risk Based Capital $900,000 DEPLOYING EXCESS CAPITAL A TRACK RECORD of FUNDING GROWTH $800,000 $80,000 $700,000 $70,000 $600,000 $60,000 $50,000 $500,000 $40,000 $400,000 $30,000 $300,000 $20,000 $200,000 $10,000 $100,000 $0 $0 2021 2022 2023 2024 2025 2026* 2022 2023 2024 2025 2026 ($100,000) Capital Generated Bank Growth Bank Deposits Available Funding Common Stock Repurchases Dividends (Common & Preferred) Acquisitions *2026 based on results through 9/30/2026 Quarterly Earnings Report 7 (000s) millions millions

Concluding Remarks Quarterly Earnings Report

Third Quarter 2026 Financial Results Presentation October 21, 2026 Quarterly Earnings Report
Disclaimer Forward-Looking Statements This presentation may contain “forward-looking statements” within the meaning of the Private Securities Litigation Reform Act of 1995 that involve significant risks, assumptions, and uncertainties, including statements relating to the market opportunity and future business prospects of Stifel Financial Corp., as well as Stifel, Nicolaus & Company, Incorporated and its subsidiaries (collectively, “SF” or the “Company”). These statements can be identified by the use of the words “may,” “will,” “should,” “could,” “would,” “plan,” “potential,” “estimate,” “project,” “believe,” “intend,” “anticipate,” “expect,” and similar expressions. All statements not dealing with historical results are forward-looking and are based on various assumptions. The forward-looking statements are subject to risks and uncertainties that could cause actual results to differ materially from those expressed in or implied by the statements. For information about the risks and important factors that could affect the Company’s future results, financial condition and liquidity, see “Risk Factors” in Part I of the Company’s Annual Report on Form 10-K for the year ended December 31, 2025. Forward-looking statements speak only as to the date they are made. The Company disclaims any intent or obligation to update forward-looking statements to reflect circumstances or events that occur after the date the forward-looking statements are made. Use of Non-GAAP Financial Measures The Company prepares its Consolidated Financial Statements using accounting principles generally accepted in the United States (U.S. GAAP). The Company may disclose certain “non-GAAP financial measures” in the course of its earnings releases, earnings conference calls, financial presentations and otherwise. The Securities and Exchange Commission defines a “non-GAAP financial measure” as a numerical measure of historical or future financial performance, financial position, or cash flows that is subject to adjustments that effectively exclude, or include, amounts from the most directly comparable measure calculated and presented in accordance with U.S. GAAP. Non-GAAP financial measures disclosed by the Company are provided as additional information to analysts, investors and other stakeholders in order to provide them with greater transparency about, or an alternative method for assessing the Company’s financial condition or operating results. These measures are not in accordance with, or a substitute for U.S. GAAP, and may be different from or inconsistent with non-GAAP financial measures used by other companies. Whenever the Company refers to a non-GAAP financial measure, it will also define it or present the most directly comparable financial measure calculated and presented in accordance with U.S. GAAP, along with a reconciliation of the differences between the non-GAAP financial measure it references and such comparable U.S. GAAP financial measure. Quarterly Earnings Report 10