Exhibit (c)(1)
E3QUBO Valuation Report for Cementos Pacasmayo S.A.A. Determination of the
minimum price to be taken into account in the subsequent public tender offer for the common shares issued by Cementos Pacasmayo S.A.A., as a result of the indirect control acquisition by Holcim Ltd. Prepared by MSRA S.A.C. October 14, 2026
01 Valuation Report Cover Page
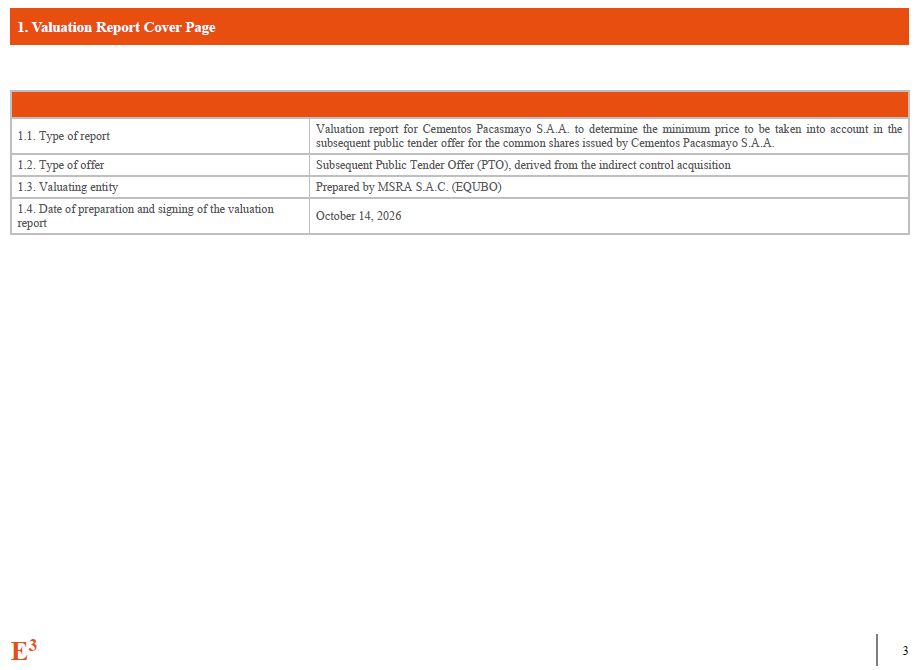
E3 3 1. Valuation Report Cover Page 1.1. Type of report Valuation report for
Cementos Pacasmayo S.A.A. to determine the minimum price to be taken into account in the subsequent public tender offer for the common shares issued by Cementos Pacasmayo S.A.A. 1.2. Type of offer Subsequent Public Tender Offer (PTO),
derived from the indirect control acquisition 1.3. Valuating entity Prepared by MSRA S.A.C. (EQUBO) 1.4. Date of preparation and signing of the valuation report October 14, 2026
02 Statement of Responsibility
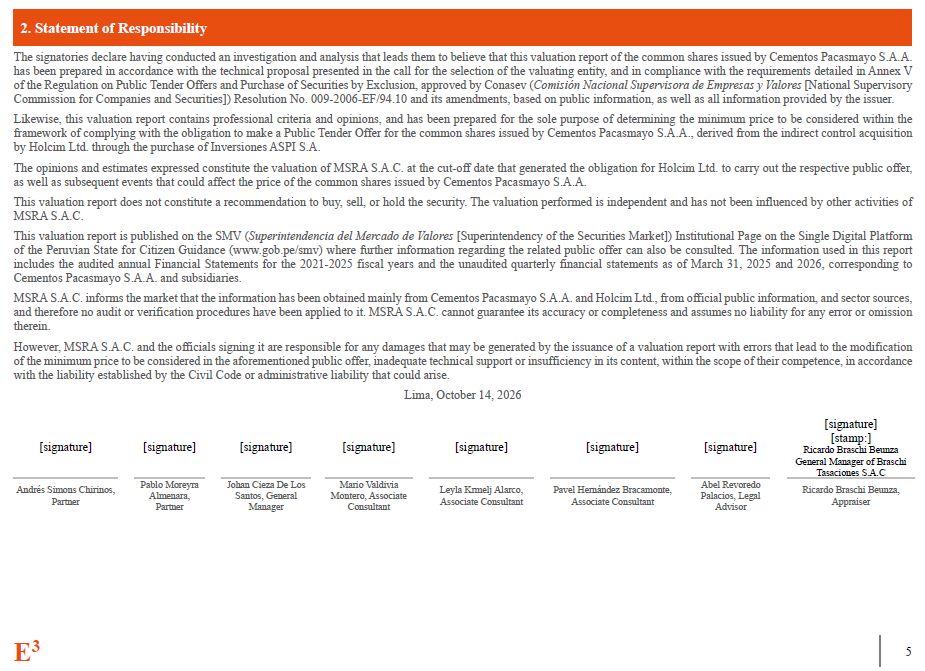
2. Statement of Responsibility The signatories declare having conducted an
investigation and analysis that leads them to believe that this valuation report of the common shares issued by Cementos Pacasmayo S.A.A. has been prepared in accordance with the technical proposal presented in the call for the selection of
the valuating entity, and in compliance with the requirements detailed in Annex V of the Regulation on Public Tender Offers and Purchase of Securities by Exclusion, approved by Conasev (Comisión Nacional Supervisora de Empresas y Valores
[National Supervisory Commission for Companies and Securities]) Resolution No. 009-2006-EF/94.10 and its amendments, based on public information, as well as all information provided by the issuer. Likewise, this valuation report contains
professional criteria and opinions, and has been prepared for the sole purpose of determining the minimum price to be considered within the framework of complying with the obligation to make a Public Tender Offer for the common shares issued
by Cementos Pacasmayo S.A.A., derived from the indirect control acquisition by Holcim Ltd. through the purchase of Inversiones ASPI S.A. The opinions and estimates expressed constitute the valuation of MSRA S.A.C. at the cut-off date that
generated the obligation for Holcim Ltd. to carry out the respective public offer, as well as subsequent events that could affect the price of the common shares issued by Cementos Pacasmayo S.A.A. This valuation report does not constitute a
recommendation to buy, sell, or hold the security. The valuation performed is independent and has not been influenced by other activities of MSRA S.A.C. This valuation report is published on the SMV (Superintendencia del Mercado de Valores
[Superintendency of the Securities Market]) Institutional Page on the Single Digital Platform of the Peruvian State for Citizen Guidance (www.gob.pe/smv) where further information regarding the related public offer can also be consulted. The
information used in this report includes the audited annual Financial Statements for the 2021-2025 fiscal years and the unaudited quarterly financial statements as of March 31, 2025 and 2026, corresponding to Cementos Pacasmayo S.A.A. and
subsidiaries. MSRA S.A.C. informs the market that the information has been obtained mainly from Cementos Pacasmayo S.A.A. and Holcim Ltd., from official public information, and sector sources, and therefore no audit or verification
procedures have been applied to it. MSRA S.A.C. cannot guarantee its accuracy or completeness and assumes no liability for any error or omission therein. However, MSRA S.A.C. and the officials signing it are responsible for any damages that
may be generated by the issuance of a valuation report with errors that lead to the modification of the minimum price to be considered in the aforementioned public offer, inadequate technical support or insufficiency in its content, within
the scope of their competence, in accordance with the liability established by the Civil Code or administrative liability that could arise. Lima, October 14,
2026 [signature] [signature] [signature] [signature] [signature] [signature] [signature] [signature] [stamp:] Ricardo Braschi Beunza General Manager of Braschi Tasaciones S.A.C Ricardo Braschi Beunza, Appraiser Andrés Simons
Chirinos, Partner Pablo Moreyra Almenara, Partner Johan Cieza De Los Santos, General Manager Mario Valdivia Montero, Associate Consultant Leyla Krmelj Alarco, Associate Consultant Pavel Hernández Bracamonte, Associate Consultant Abel
Revoredo Palacios, Legal Advisor E3 5
03 Executive Summary
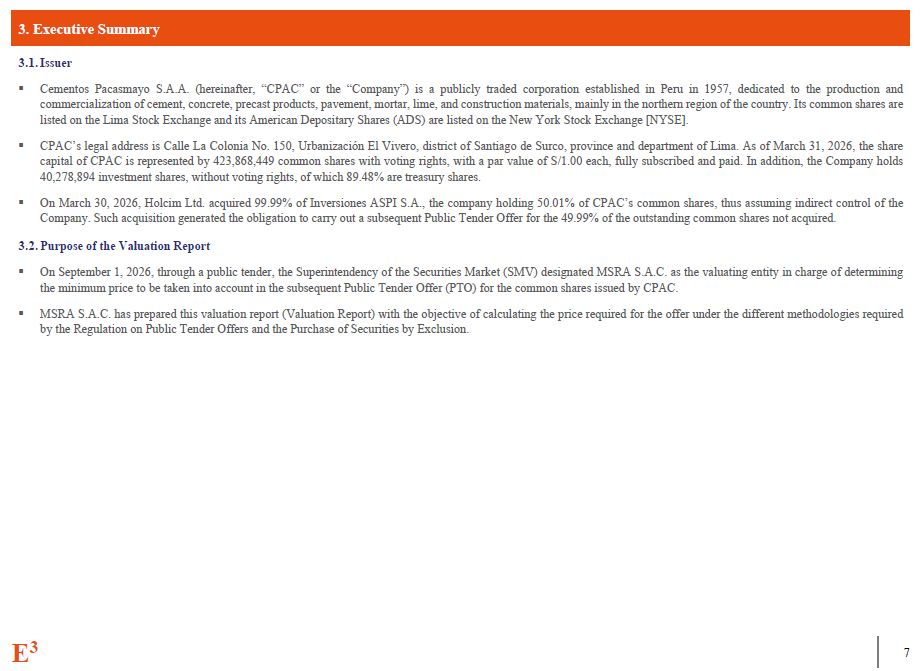
3. Executive Summary E3 7 Issuer Cementos Pacasmayo S.A.A. (hereinafter,
“CPAC” or the “Company”) is a publicly traded corporation established in Peru in 1957, dedicated to the production and commercialization of cement, concrete, precast products, pavement, mortar, lime, and construction materials, mainly in the
northern region of the country. Its common shares are listed on the Lima Stock Exchange and its American Depositary Shares (ADS) are listed on the New York Stock Exchange [NYSE]. CPAC’s legal address is Calle La Colonia No. 150, Urbanización
El Vivero, district of Santiago de Surco, province and department of Lima. As of March 31, 2026, the share capital of CPAC is represented by 423,868,449 common shares with voting rights, with a par value of S/1.00 each, fully subscribed and
paid. In addition, the Company holds 40,278,894 investment shares, without voting rights, of which 89.48% are treasury shares. On March 30, 2026, Holcim Ltd. acquired 99.99% of Inversiones ASPI S.A., the company holding 50.01% of CPAC’s
common shares, thus assuming indirect control of the Company. Such acquisition generated the obligation to carry out a subsequent Public Tender Offer for the 49.99% of the outstanding common shares not acquired. 3.2. Purpose of the Valuation
Report On September 1, 2026, through a public tender, the Superintendency of the Securities Market (SMV) designated MSRA S.A.C. as the valuating entity in charge of determining the minimum price to be taken into account in the subsequent
Public Tender Offer (PTO) for the common shares issued by CPAC. MSRA S.A.C. has prepared this valuation report (Valuation Report) with the objective of calculating the price required for the offer under the different methodologies required
by the Regulation on Public Tender Offers and the Purchase of Securities by Exclusion.
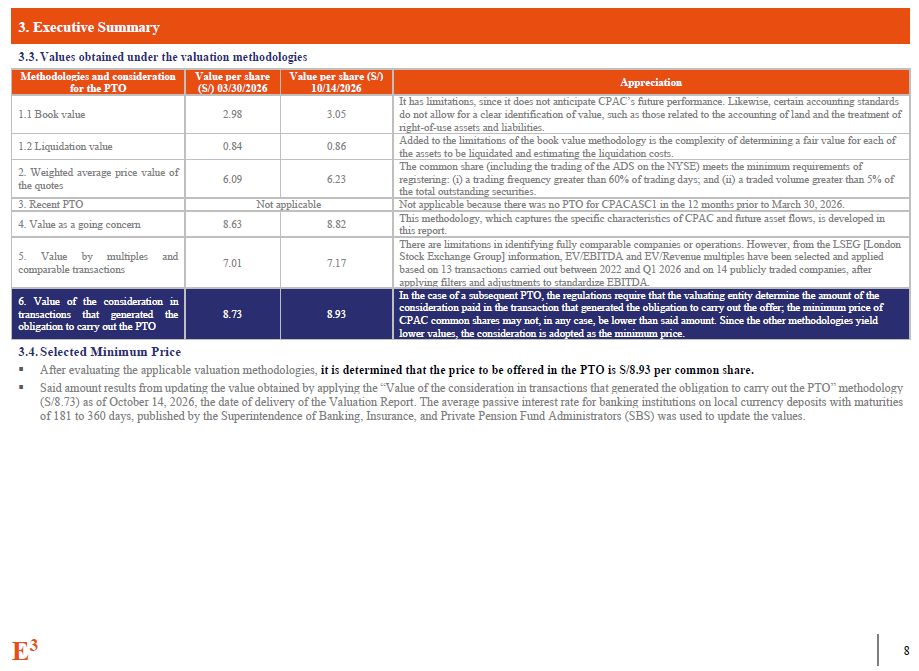
3. Executive Summary E3 7 3.3. Values obtained under the valuation
methodologies Methodologies and consideration for the PTO Value per share (S/) 03/30/2026 Value per share (S/) 10/14/2026 Appreciation 1.1 Book value 2.98 3.05 It has limitations, since it does not anticipate CPAC’s future
performance. Likewise, certain accounting standards do not allow for a clear identification of value, such as those related to the accounting of land and the treatment of right-of-use assets and liabilities. 1.2 Liquidation
value 0.84 0.86 Added to the limitations of the book value methodology is the complexity of determining a fair value for each of the assets to be liquidated and estimating the liquidation costs. 2. Weighted average price value of the
quotes 6.09 6.23 The common share (including the trading of the ADS on the NYSE) meets the minimum requirements of registering: (i) a trading frequency greater than 60% of trading days; and (ii) a traded volume greater than 5% of the total
outstanding securities. 3. Recent PTO Not applicable Not applicable because there was no PTO for CPACASC1 in the 12 months prior to March 30, 2026. 4. Value as a going concern 8.63 8.82 This methodology, which captures the specific
characteristics of CPAC and future asset flows, is developed in this report. 5. Value by multiples and comparable transactions 7.01 7.17 There are limitations in identifying fully comparable companies or operations. However, from the LSEG
[London Stock Exchange Group] information, EV/EBITDA and EV/Revenue multiples have been selected and applied based on 13 transactions carried out between 2022 and Q1 2026 and on 14 publicly traded companies, after applying filters and
adjustments to standardize EBITDA. 6. Value of the consideration in transactions that generated the obligation to carry out the PTO 8.73 8.93 In the case of a subsequent PTO, the regulations require that the valuating entity determine the
amount of the consideration paid in the transaction that generated the obligation to carry out the offer; the minimum price of CPAC common shares may not, in any case, be lower than said amount. Since the other methodologies yield lower
values, the consideration is adopted as the minimum price. 3.4. Selected Minimum Price After evaluating the applicable valuation methodologies, it is determined that the price to be offered in the PTO is S/8.93 per common share. Said
amount results from updating the value obtained by applying the “Value of the consideration in transactions that generated the obligation to carry out the PTO” methodology (S/8.73) as of October 14, 2026, the date of delivery of the Valuation
Report. The average passive interest rate for banking institutions on local currency deposits with maturities of 181 to 360 days, published by the Superintendence of Banking, Insurance, and Private Pension Fund Administrators (SBS) was used
to update the values.
04 Background of the Transaction
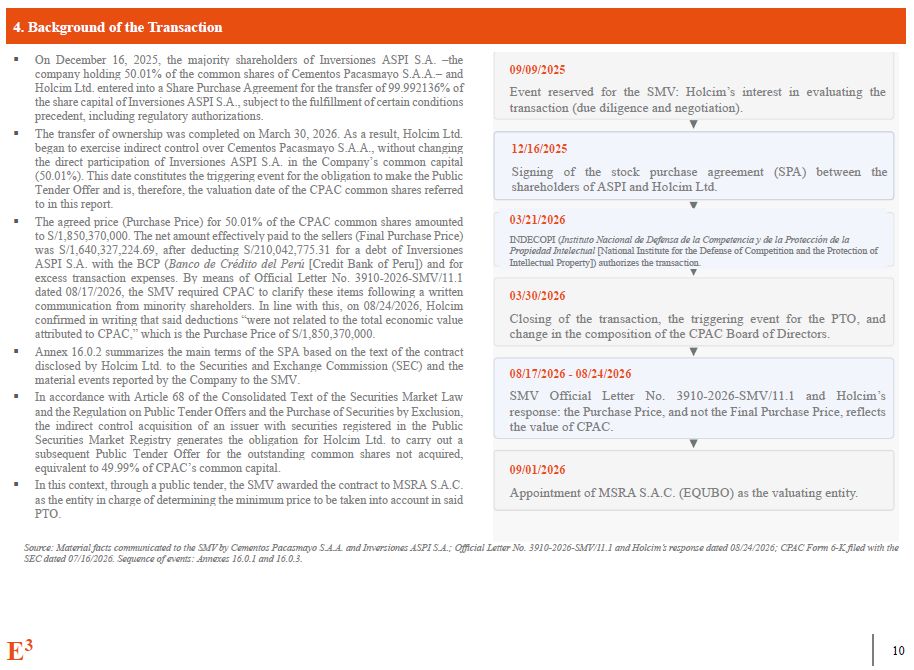
4. Background of the Transaction On December 16, 2025, the majority
shareholders of Inversiones ASPI S.A. –the company holding 50.01% of the common shares of Cementos Pacasmayo S.A.A.– and Holcim Ltd. entered into a Share Purchase Agreement for the transfer of 99.992136% of the share capital of Inversiones
ASPI S.A., subject to the fulfillment of certain conditions precedent, including regulatory authorizations. The transfer of ownership was completed on March 30, 2026. As a result, Holcim Ltd. began to exercise indirect control over Cementos
Pacasmayo S.A.A., without changing the direct participation of Inversiones ASPI S.A. in the Company’s common capital (50.01%). This date constitutes the triggering event for the obligation to make the Public Tender Offer and is, therefore,
the valuation date of the CPAC common shares referred to in this report. The agreed price (Purchase Price) for 50.01% of the CPAC common shares amounted to S/1,850,370,000. The net amount effectively paid to the sellers (Final Purchase
Price) was S/1,640,327,224.69, after deducting S/210,042,775.31 for a debt of Inversiones ASPI S.A. with the BCP (Banco de Crédito del Perú [Credit Bank of Peru]) and for excess transaction expenses. By means of Official Letter No.
3910-2026-SMV/11.1 dated 08/17/2026, the SMV required CPAC to clarify these items following a written communication from minority shareholders. In line with this, on 08/24/2026, Holcim confirmed in writing that said deductions “were not
related to the total economic value attributed to CPAC,” which is the Purchase Price of S/1,850,370,000. Annex 16.0.2 summarizes the main terms of the SPA based on the text of the contract disclosed by Holcim Ltd. to the Securities and
Exchange Commission (SEC) and the material events reported by the Company to the SMV. In accordance with Article 68 of the Consolidated Text of the Securities Market Law and the Regulation on Public Tender Offers and the Purchase of
Securities by Exclusion, the indirect control acquisition of an issuer with securities registered in the Public Securities Market Registry generates the obligation for Holcim Ltd. to carry out a subsequent Public Tender Offer for the
outstanding common shares not acquired, equivalent to 49.99% of CPAC’s common capital. In this context, through a public tender, the SMV awarded the contract to MSRA S.A.C. as the entity in charge of determining the minimum price to be taken
into account in said PTO. Source: Material facts communicated to the SMV by Cementos Pacasmayo S.A.A. and Inversiones ASPI S.A.; Official Letter No. 3910-2026-SMV/11.1 and Holcim’s response dated 08/24/2026; CPAC Form 6-K filed with the SEC
dated 07/16/2026. Sequence of events: Annexes 16.0.1 and 16.0.3. 09/09/2025 Event reserved for the SMV: Holcim’s interest in evaluating the transaction (due diligence and negotiation). 03/30/2026 Closing of the transaction, the triggering
event for the PTO, and change in the composition of the CPAC Board of Directors. 09/01/2026 Appointment of MSRA S.A.C. (EQUBO) as the valuating entity. 12/16/2025 Signing of the stock purchase agreement (SPA) between the shareholders of
ASPI and Holcim Ltd. 03/21/2026 INDECOPI (Instituto Nacional de Defensa de la Competencia y de la Protección de la Propiedad Intelectual [National Institute for the Defense of Competition and the Protection of Intellectual Property])
authorizes the transaction. 08/17/2026 - 08/24/2026 SMV Official Letter No. 3910-2026-SMV/11.1 and Holcim’s response: the Purchase Price, and not the Final Purchase Price, reflects the value of CPAC. E3 10
05 Information about Cementos Pacasmayo
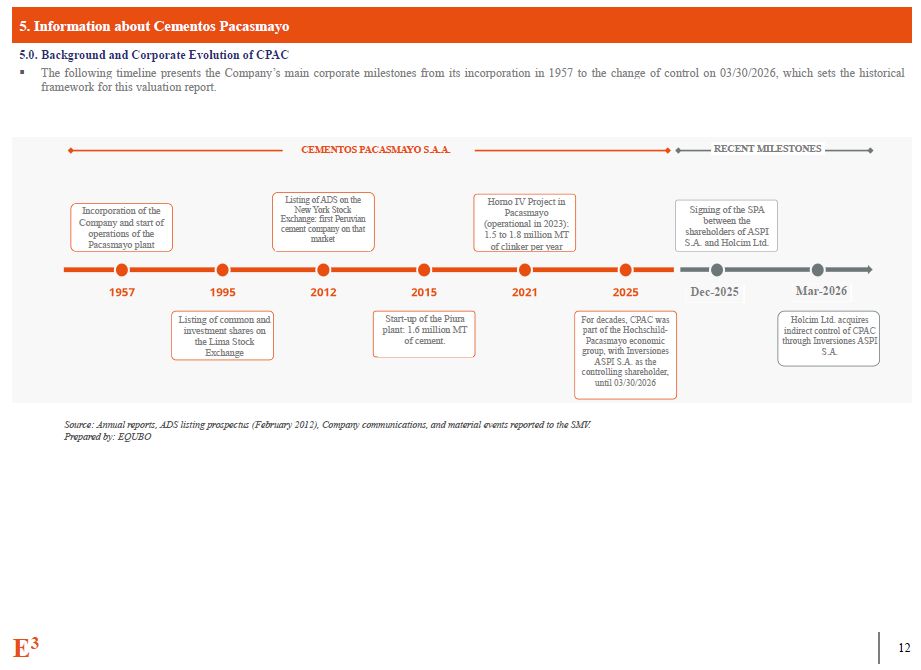
5. Information about Cementos Pacasmayo 5.0. Background and Corporate Evolution
of CPAC The following timeline presents the Company’s main corporate milestones from its incorporation in 1957 to the change of control on 03/30/2026, which sets the historical framework for this valuation report. Source: Annual reports,
ADS listing prospectus (February 2012), Company communications, and material events reported to the SMV. Prepared by: EQUBO Incorporation of the Company and start of operations of the Pacasmayo plant Listing of ADS on the New York Stock
Exchange: first Peruvian cement company on that market Horno IV Project in Pacasmayo (operational in 2023): 1.5 to 1.8 million MT of clinker per year Signing of the SPA between the shareholders of ASPI S.A. and Holcim
Ltd. Dec-2025 Mar-2026 Listing of common and investment shares on the Lima Stock Exchange Start-up of the Piura plant: 1.6 million MT of cement. For decades, CPAC was part of the Hochschild-Pacasmayo economic group, with Inversiones ASPI
S.A. as the controlling shareholder, until 03/30/2026 Holcim Ltd. acquires indirect control of CPAC through Inversiones ASPI S.A. RECENT MILESTONES CEMENTOS PACASMAYO S.A.A. E3 12
5. Information about Cementos Pacasmayo CPAC Business Lines CPAC’s offering
includes the production and commercialization of cement and lime, complemented by ready-mix concrete, pavements, mortars, bagged solutions, aggregates, and precast elements, which allows it to capture value throughout the entire construction
chain in the northern macro-region. The main lines of business for CPAC, which are described in greater detail on the following page, are the following: Cement Concrete, pavement, and mortar Precast products Construction materials and
others The operation of these lines is supported by three cement plants –Pacasmayo, Piura, and Rioja– with a combined installed capacity of 4.9 million MT of cement and 3.0 million MT of clinker per year (2025), vertically integrated with
its own limestone and shell quarries. In addition, CPAC benefits from its integration with DINO and Dinoselva, subsidiaries that operate the distribution network, ready-mix concrete, and precast products. This vertical integration allows it
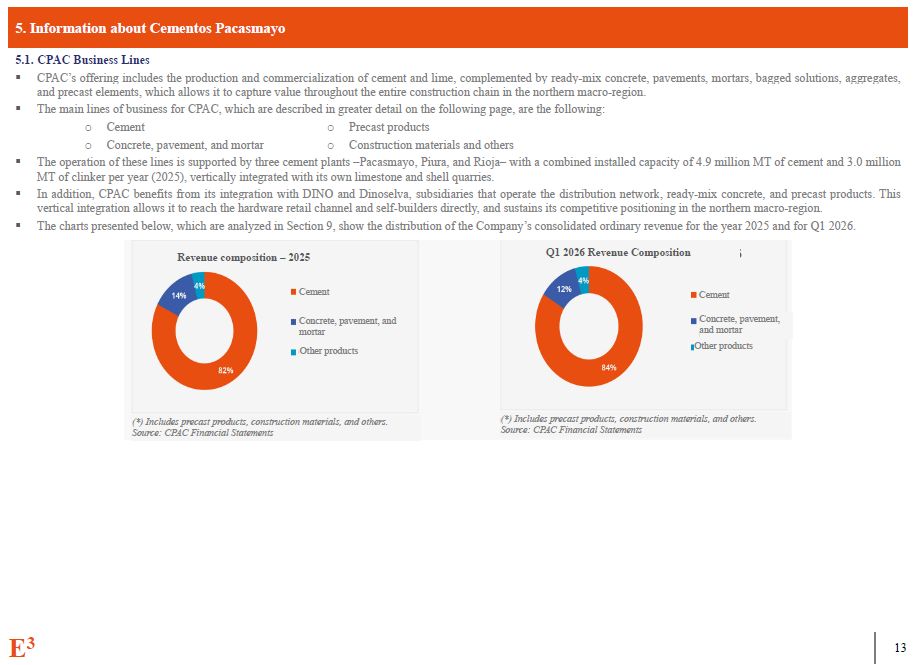
to reach the hardware retail channel and self-builders directly, and sustains its competitive positioning in the northern macro-region. The charts presented below, which are analyzed in Section 9, show the distribution of the Company’s
consolidated ordinary revenue for the year 2025 and for Q1 2026. (*) Includes precast products, construction materials, and others. Source: CPAC Financial Statements (*) Includes precast products, construction materials, and others. Source:
CPAC Financial Statements Concrete, pavement, and mortar Other products Cement Concrete, pavement, and mortar Other products Cement Revenue composition – 2025 Q1 2026 Revenue Composition E3 12
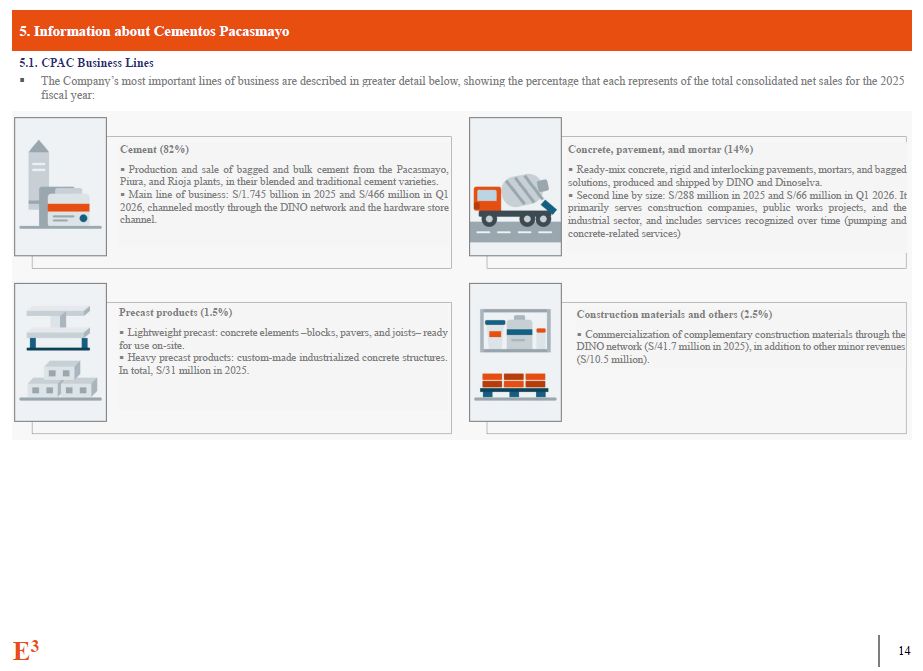
5. Information about Cementos Pacasmayo CPAC Business Lines The Company’s most
important lines of business are described in greater detail below, showing the percentage that each represents of the total consolidated net sales for the 2025 fiscal year: Cement (82%) Production and sale of bagged and bulk cement from the
Pacasmayo, Piura, and Rioja plants, in their blended and traditional cement varieties. Main line of business: S/1.745 billion in 2025 and S/466 million in Q1 2026, channeled mostly through the DINO network and the hardware store
channel. Concrete, pavement, and mortar (14%) Ready-mix concrete, rigid and interlocking pavements, mortars, and bagged solutions, produced and shipped by DINO and Dinoselva. Second line by size: S/288 million in 2025 and S/66 million in
Q1 2026. It primarily serves construction companies, public works projects, and the industrial sector, and includes services recognized over time (pumping and concrete-related services) Precast products (1.5%) Lightweight precast: concrete
elements –blocks, pavers, and joists– ready for use on-site. Heavy precast products: custom-made industrialized concrete structures. In total, S/31 million in 2025. Construction materials and others (2.5%) Commercialization of
complementary construction materials through the DINO network (S/41.7 million in 2025), in addition to other minor revenues (S/10.5 million). E3 12
5. Information about Cementos Pacasmayo CPAC Business Lines CPAC Value
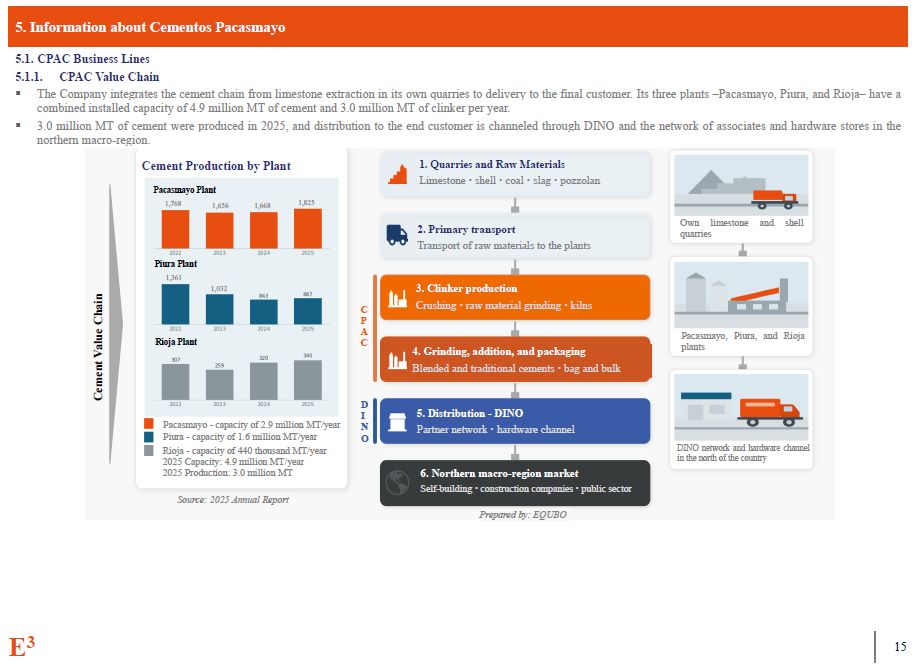
Chain The Company integrates the cement chain from limestone extraction in its own quarries to delivery to the final customer. Its three plants –Pacasmayo, Piura, and Rioja– have a combined installed capacity of 4.9 million MT of cement and
3.0 million MT of clinker per year. 3.0 million MT of cement were produced in 2025, and distribution to the end customer is channeled through DINO and the network of associates and hardware stores in the northern macro-region. Cement Value
Chain Cement Production by Plant 1. Quarries and Raw Materials Limestone shell coal slag pozzolan Pacasmayo - capacity of 2.9 million MT/year Piura - capacity of 1.6 million MT/year Rioja - capacity of 440 thousand MT/year 2025
Capacity: 4.9 million MT/year 2025 Production: 3.0 million MT Rioja Plant Pacasmayo Plant 1,768 1,656 1,668 1,825 Piura Plant 1,361 1,032 Source: 2025 Annual Report Prepared by: EQUBO 2. Primary transport Transport of raw
materials to the plants 3. Clinker production Crushing raw material grinding kilns 4. Grinding, addition, and packaging Blended and traditional cements bag and bulk C P A C D I N O 5. Distribution - DINO Partner network
hardware channel 6. Northern macro-region market Self-building construction companies public sector DINO network and hardware channel in the north of the country Pacasmayo, Piura, and Rioja plants Own limestone and shell
quarries E3 12
5. Information about Cementos Pacasmayo CPAC Business Lines CPAC Area of
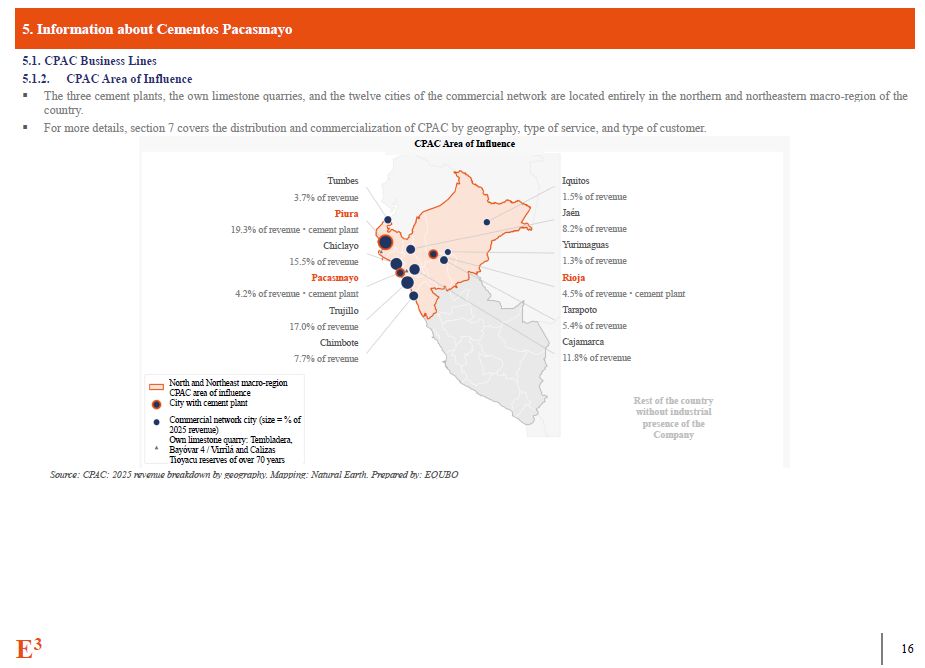
Influence The three cement plants, the own limestone quarries, and the twelve cities of the commercial network are located entirely in the northern and northeastern macro-region of the country. For more details, section 7 covers the
distribution and commercialization of CPAC by geography, type of service, and type of customer. CPAC Area of Influence Tumbes 3.7% of revenue Piura 19.3% of revenue cement plant Chiclayo 15.5% of revenue Pacasmayo 4.2% of revenue
cement plant Trujillo 17.0% of revenue Chimbote 7.7% of revenue Iquitos 1.5% of revenue Jaén 8.2% of revenue Yurimaguas 1.3% of revenue Rioja 4.5% of revenue cement plant Tarapoto 5.4% of revenue Cajamarca 11.8% of revenue Rest of
the country without industrial presence of the Company North and Northeast macro-region CPAC area of influence City with cement plant Commercial network city (size = % of 2025 revenue) Own limestone quarry: Tembladera, Bayóvar 4 / Virrilá
and Calizas Tioyacu reserves of over 70 years Source: CPAC: 2025 revenue breakdown by geography. Mapping: Natural Earth. Prepared by: EQUBO E3 12
5. Information about Cementos Pacasmayo CPAC Business Lines CPAC Product
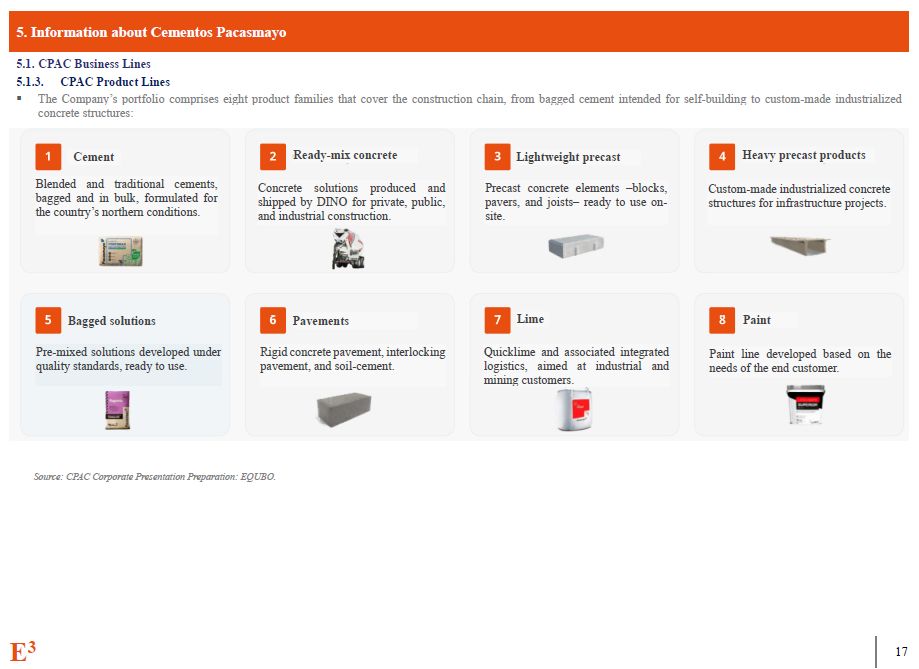
Lines The Company’s portfolio comprises eight product families that cover the construction chain, from bagged cement intended for self-building to custom-made industrialized concrete structures: Source: CPAC Corporate Presentation
Preparation: EQUBO. Cement Ready-mix concrete Lightweight precast Heavy precast products Paint Lime Pavements Bagged solutions Concrete solutions produced and shipped by DINO for private, public, and industrial construction. Blended
and traditional cements, bagged and in bulk, formulated for the country’s northern conditions. Precast concrete elements –blocks, pavers, and joists– ready to use on-site. Custom-made industrialized concrete structures for infrastructure
projects. Paint line developed based on the needs of the end customer. Quicklime and associated integrated logistics, aimed at industrial and mining customers. Rigid concrete pavement, interlocking pavement, and soil-cement. Pre-mixed
solutions developed under quality standards, ready to use. E3 12
5. Information about Cementos Pacasmayo E3 12 CPAC Business Lines CPAC
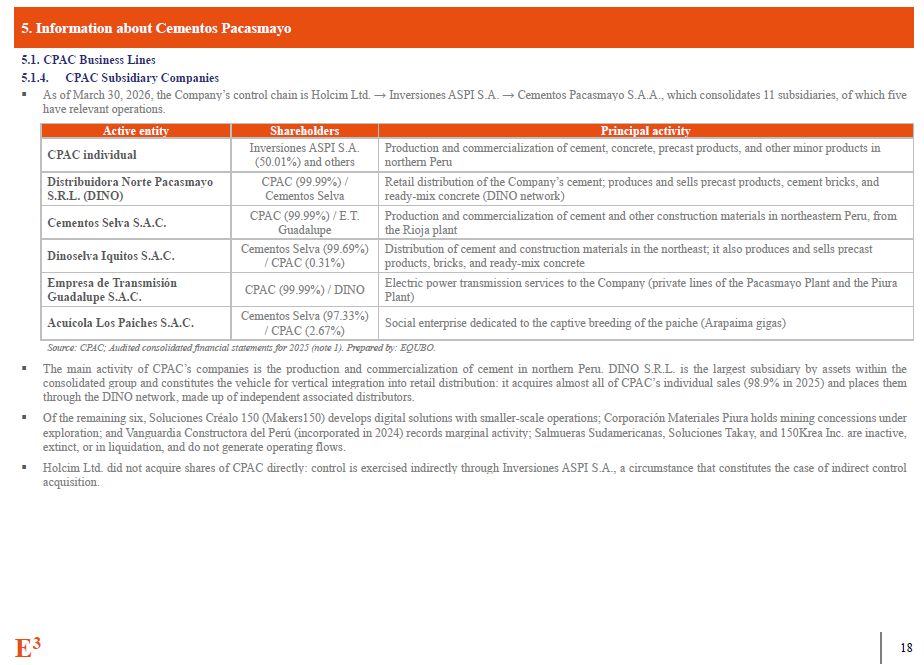
Subsidiary Companies As of March 30, 2026, the Company’s control chain is Holcim Ltd. → Inversiones ASPI S.A. → Cementos Pacasmayo S.A.A., which consolidates 11 subsidiaries, of which five have relevant operations. Active
entity Shareholders Principal activity CPAC individual Inversiones ASPI S.A. (50.01%) and others Production and commercialization of cement, concrete, precast products, and other minor products in northern Peru Distribuidora Norte
Pacasmayo S.R.L. (DINO) CPAC (99.99%) / Cementos Selva Retail distribution of the Company’s cement; produces and sells precast products, cement bricks, and ready-mix concrete (DINO network) Cementos Selva S.A.C. CPAC (99.99%) /
E.T. Guadalupe Production and commercialization of cement and other construction materials in northeastern Peru, from the Rioja plant Dinoselva Iquitos S.A.C. Cementos Selva (99.69%) / CPAC (0.31%) Distribution of cement and
construction materials in the northeast; it also produces and sells precast products, bricks, and ready-mix concrete Empresa de Transmisión Guadalupe S.A.C. CPAC (99.99%) / DINO Electric power transmission services to the Company (private
lines of the Pacasmayo Plant and the Piura Plant) Acuícola Los Paiches S.A.C. Cementos Selva (97.33%) / CPAC (2.67%) Social enterprise dedicated to the captive breeding of the paiche (Arapaima gigas) Source: CPAC; Audited consolidated
financial statements for 2025 (note 1). Prepared by: EQUBO. The main activity of CPAC’s companies is the production and commercialization of cement in northern Peru. DINO S.R.L. is the largest subsidiary by assets within the consolidated
group and constitutes the vehicle for vertical integration into retail distribution: it acquires almost all of CPAC’s individual sales (98.9% in 2025) and places them through the DINO network, made up of independent associated
distributors. Of the remaining six, Soluciones Créalo 150 (Makers150) develops digital solutions with smaller-scale operations; Corporación Materiales Piura holds mining concessions under exploration; and Vanguardia Constructora del Perú
(incorporated in 2024) records marginal activity; Salmueras Sudamericanas, Soluciones Takay, and 150Krea Inc. are inactive, extinct, or in liquidation, and do not generate operating flows. Holcim Ltd. did not acquire shares of CPAC directly:
control is exercised indirectly through Inversiones ASPI S.A., a circumstance that constitutes the case of indirect control acquisition.
5. Information about Cementos Pacasmayo E3 12 5.2. Shareholding and Board of
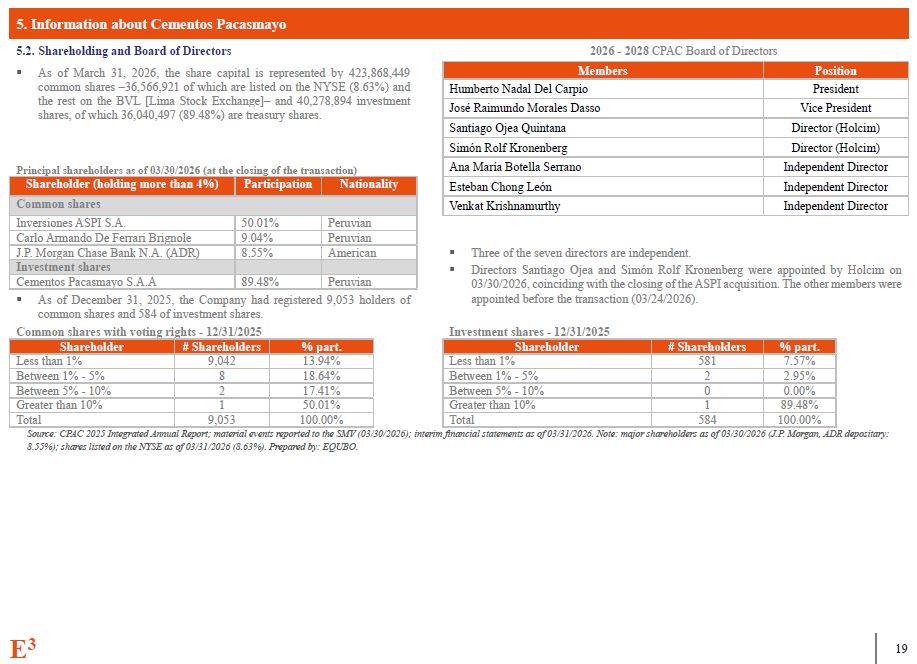
Directors 2026 - 2028 CPAC Board of Directors As of March 31, 2026, the share capital is represented by 423,868,449 common shares –36,566,921 of which are listed on the NYSE (8.63%) and the rest on the BVL [Lima Stock Exchange]– and
40,278,894 investment shares, of which 36,040,497 (89.48%) are treasury shares. Members Position Humberto Nadal Del Carpio President José Raimundo Morales Dasso Vice President Santiago Ojea Quintana Director (Holcim) Simón Rolf
Kronenberg Director (Holcim) Ana María Botella Serrano Independent Director Esteban Chong León Independent Director Venkat Krishnamurthy Independent Director Principal shareholders as of 03/30/2026 (at the closing of the
transaction) Shareholder (holding more than 4%) Participation Nationality Common shares Inversiones ASPI S.A. 50.01% Peruvian Carlo Armando De Ferrari Brignole 9.04% Peruvian J.P. Morgan Chase Bank N.A.
(ADR) 8.55% American Investment shares Cementos Pacasmayo S.A.A 89.48% Peruvian Three of the seven directors are independent. Directors Santiago Ojea and Simón Rolf Kronenberg were appointed by Holcim on 03/30/2026, coinciding with
the closing of the ASPI acquisition. The other members were appointed before the transaction (03/24/2026). As of December 31, 2025, the Company had registered 9,053 holders of common shares and 584 of investment shares. Common shares with
voting rights - 12/31/2025 Investment shares - 12/31/2025 Shareholder # Shareholders % part. Less than 1% 9,042 13.94% Between 1% - 5% 8 18.64% Between 5% - 10% 2 17.41% Greater than
10% 1 50.01% Total 9,053 100.00% Shareholder # Shareholders % part. Less than 1% 581 7.57% Between 1% - 5% 2 2.95% Between 5% - 10% 0 0.00% Greater than 10% 1 89.48% Total 584 100.00% Source: CPAC 2025 Integrated
Annual Report; material events reported to the SMV (03/30/2026); interim financial statements as of 03/31/2026. Note: major shareholders as of 03/30/2026 (J.P. Morgan, ADR depositary: 8.55%); shares listed on the NYSE as of 03/31/2026
(8.63%). Prepared by: EQUBO.
5. Information about Cementos Pacasmayo 5.3. CPAC Organizational Chart Source:
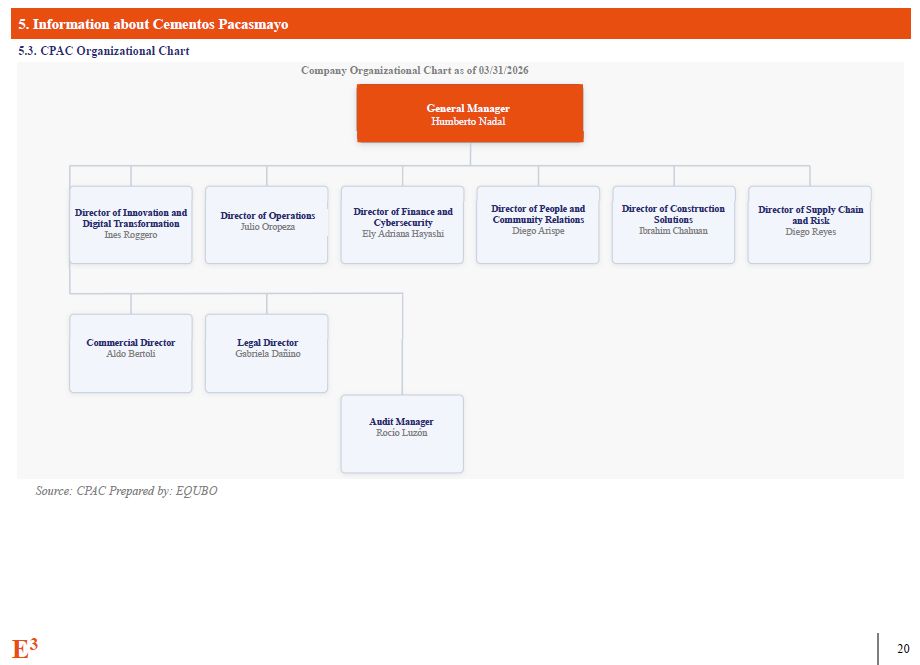
CPAC Prepared by: EQUBO Company Organizational Chart as of 03/31/2026 General Manager Humberto Nadal Director of Innovation and Digital Transformation Ines Roggero Director of Operations Julio Oropeza Director of Finance and
Cybersecurity Ely Adriana Hayashi Director of People and Community Relations Diego Arispe Director of Construction Solutions Ibrahim Chahuan Director of Supply Chain and Risk Diego Reyes Commercial Director Aldo Bertoli Legal
Director Gabriela Dañino Audit Manager Rocío Luzón E3 12
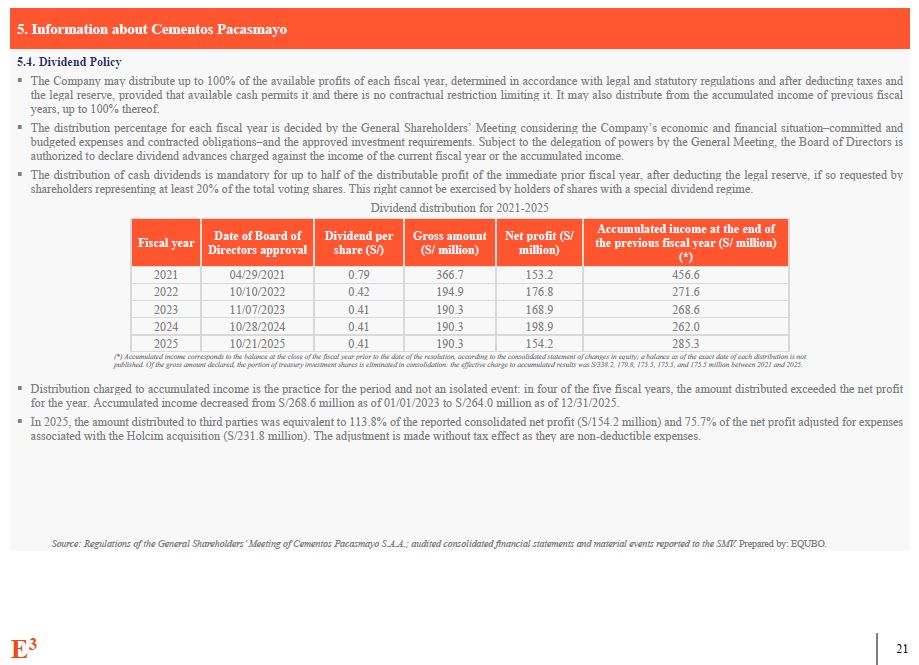
Information about Cementos Pacasmayo Dividend Policy The Company may
distribute up to 100% of the available profits of each fiscal year, determined in accordance with legal and statutory regulations and after deducting taxes and the legal reserve, provided that available cash permits it and there is no
contractual restriction limiting it. It may also distribute from the accumulated income of previous fiscal years, up to 100% thereof. The distribution percentage for each fiscal year is decided by the General Shareholders’ Meeting
considering the Company’s economic and financial situation–committed and budgeted expenses and contracted obligations–and the approved investment requirements. Subject to the delegation of powers by the General Meeting, the Board of Directors
is authorized to declare dividend advances charged against the income of the current fiscal year or the accumulated income. The distribution of cash dividends is mandatory for up to half of the distributable profit of the immediate prior
fiscal year, after deducting the legal reserve, if so requested by shareholders representing at least 20% of the total voting shares. This right cannot be exercised by holders of shares with a special dividend regime. Dividend distribution
for 2021-2025 E3 12 Fiscal year Date of Board of Directors approval Dividend per share (S/) Gross amount (S/ million) Net profit (S/ million) Accumulated income at the end of the previous fiscal year (S/ million)
(*) 2021 04/29/2021 0.79 366.7 153.2 456.6 2022 10/10/2022 0.42 194.9 176.8 271.6 2023 11/07/2023 0.41 190.3 168.9 268.6 2024 10/28/2024 0.41 190.3 198.9 262.0 2025 10/21/2025 0.41 190.3 154.2 285.3 (*)
Accumulated income corresponds to the balance at the close of the fiscal year prior to the date of the resolution, according to the consolidated statement of changes in equity; a balance as of the exact date of each distribution is not
published. Of the gross amount declared, the portion of treasury investment shares is eliminated in consolidation: the effective charge to accumulated results was S/338.2, 179.8, 175.5, 175.5, and 175.5 million between 2021 and
2025. Distribution charged to accumulated income is the practice for the period and not an isolated event: in four of the five fiscal years, the amount distributed exceeded the net profit for the year. Accumulated income decreased from
S/268.6 million as of 01/01/2023 to S/264.0 million as of 12/31/2025. In 2025, the amount distributed to third parties was equivalent to 113.8% of the reported consolidated net profit (S/154.2 million) and 75.7% of the net profit adjusted
for expenses associated with the Holcim acquisition (S/231.8 million). The adjustment is made without tax effect as they are non-deductible expenses. Source: Regulations of the General Shareholders’ Meeting of Cementos Pacasmayo S.A.A.;
audited consolidated financial statements and material events reported to the SMV. Prepared by: EQUBO.
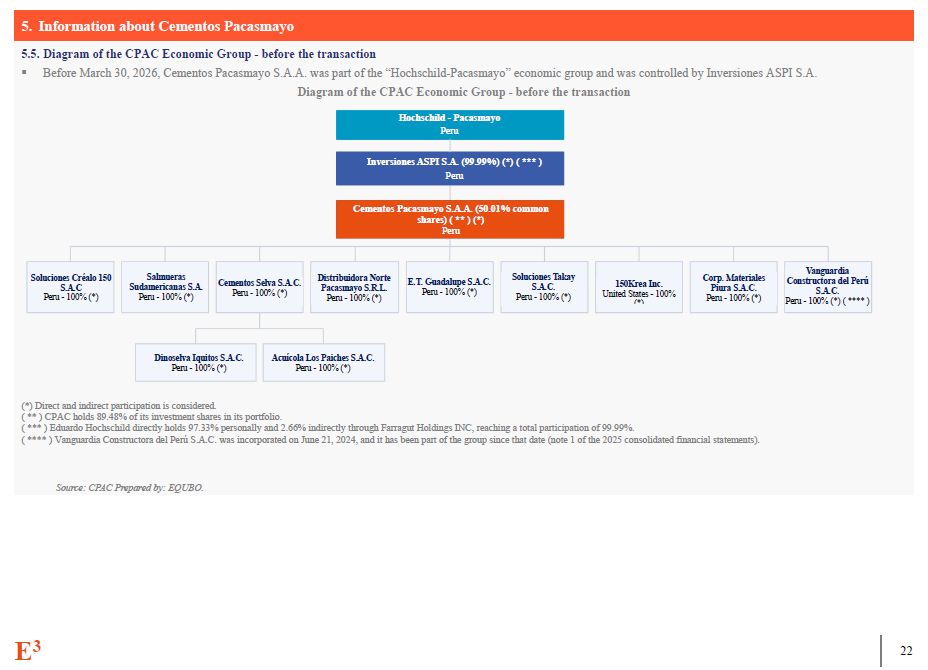
(*) Direct and indirect participation is considered. ( ** ) CPAC holds 89.48%
of its investment shares in its portfolio. ( *** ) Eduardo Hochschild directly holds 97.33% personally and 2.66% indirectly through Farragut Holdings INC, reaching a total participation of 99.99%. ( **** ) Vanguardia Constructora del Perú
S.A.C. was incorporated on June 21, 2024, and it has been part of the group since that date (note 1 of the 2025 consolidated financial statements). Source: CPAC Prepared by: EQUBO. Information about Cementos Pacasmayo Diagram of the CPAC
Economic Group - before the transaction Before March 30, 2026, Cementos Pacasmayo S.A.A. was part of the “Hochschild-Pacasmayo” economic group and was controlled by Inversiones ASPI S.A. Diagram of the CPAC Economic Group - before the
transaction Hochschild - Pacasmayo Peru Inversiones ASPI S.A. (99.99%) (*) ( *** ) Peru Cementos Pacasmayo S.A.A. (50.01% common shares) ( ** ) (*) Peru Soluciones Créalo 150 S.A.C Peru - 100% (*) Salmueras Sudamericanas S.A. Peru -
100% (*) Cementos Selva S.A.C. Peru - 100% (*) Distribuidora Norte Pacasmayo S.R.L. Peru - 100% (*) E.T. Guadalupe S.A.C. Peru - 100% (*) Soluciones Takay S.A.C. Peru - 100% (*) 150Krea Inc. United States - 100% (*) Corp. Materiales
Piura S.A.C. Peru - 100% (*) Vanguardia Constructora del Perú S.A.C. Peru - 100% (*) ( **** ) Dinoselva Iquitos S.A.C. Peru - 100% (*) Acuícola Los Paiches S.A.C. Peru - 100% (*) E3 12
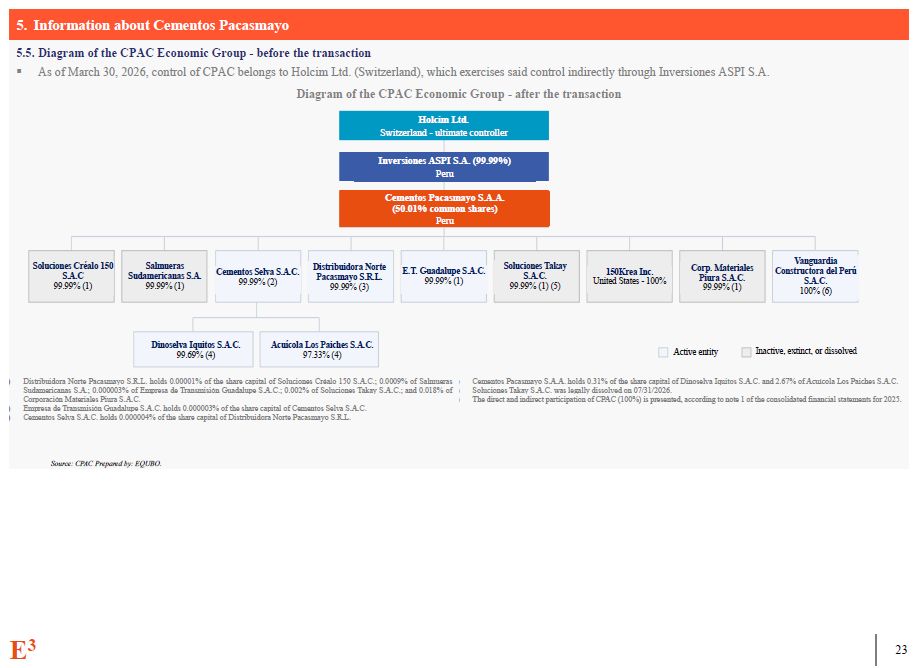
Distribuidora Norte Pacasmayo S.R.L. holds 0.00001% of the share capital of
Soluciones Créalo 150 S.A.C.; 0.0009% of Salmueras Sudamericanas S.A.; 0.000003% of Empresa de Transmisión Guadalupe S.A.C.; 0.002% of Soluciones Takay S.A.C.; and 0.018% of Corporación Materiales Piura S.A.C. Empresa de Transmisión
Guadalupe S.A.C. holds 0.000003% of the share capital of Cementos Selva S.A.C. Cementos Selva S.A.C. holds 0.000004% of the share capital of Distribuidora Norte Pacasmayo S.R.L. Cementos Pacasmayo S.A.A. holds 0.31% of the share capital of
Dinoselva Iquitos S.A.C. and 2.67% of Acuícola Los Paiches S.A.C. Soluciones Takay S.A.C. was legally dissolved on 07/31/2026. The direct and indirect participation of CPAC (100%) is presented, according to note 1 of the consolidated
financial statements for 2025. Source: CPAC Prepared by: EQUBO. Information about Cementos Pacasmayo Diagram of the CPAC Economic Group - before the transaction As of March 30, 2026, control of CPAC belongs to Holcim Ltd. (Switzerland),
which exercises said control indirectly through Inversiones ASPI S.A. Diagram of the CPAC Economic Group - after the transaction Holcim Ltd. Switzerland - ultimate controller Inversiones ASPI S.A. (99.99%) Peru Cementos Pacasmayo S.A.A.
(50.01% common shares) Peru Soluciones Créalo 150 S.A.C 99.99% (1) Salmueras Sudamericanas S.A. 99.99% (1) Cementos Selva S.A.C. 99.99% (2) Distribuidora Norte Pacasmayo S.R.L. 99.99% (3) E.T. Guadalupe S.A.C. 99.99% (1) Soluciones
Takay S.A.C. 99.99% (1) (5) 150Krea Inc. United States - 100% Corp. Materiales Piura S.A.C. 99.99% (1) Vanguardia Constructora del Perú S.A.C. 100% (6) Dinoselva Iquitos S.A.C. 99.69% (4) Acuícola Los Paiches S.A.C. 97.33%
(4) Active entity Inactive, extinct, or dissolved E3 12
06 Macro-Environmental Analysis
Macro-Environmental Analysis Analysis of the economic sector for CPAC products
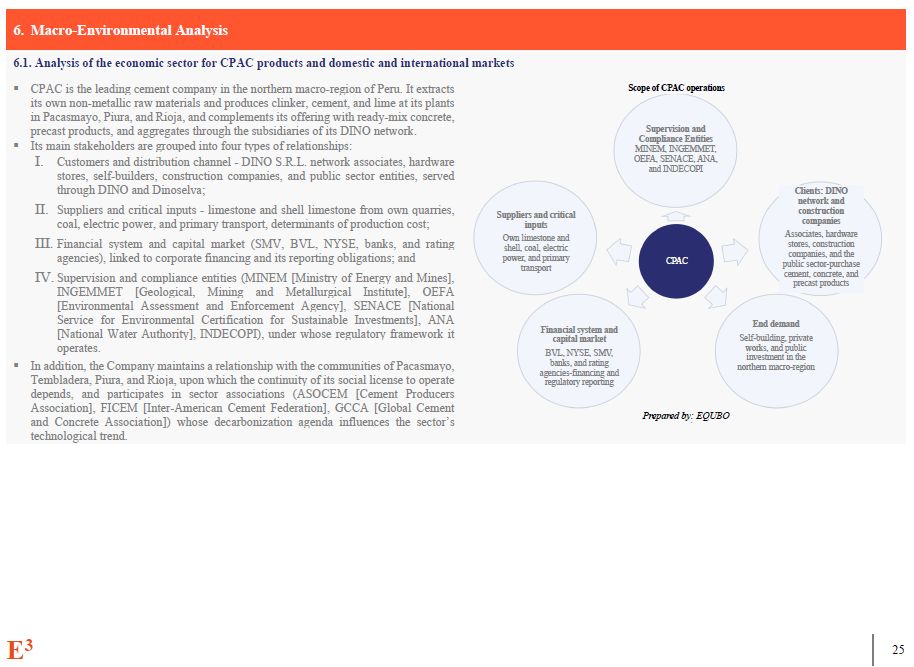
and domestic and international markets CPAC is the leading cement company in the northern macro-region of Peru. It extracts its own non-metallic raw materials and produces clinker, cement, and lime at its plants in Pacasmayo, Piura, and
Rioja, and complements its offering with ready-mix concrete, precast products, and aggregates through the subsidiaries of its DINO network. Its main stakeholders are grouped into four types of relationships: Customers and distribution
channel - DINO S.R.L. network associates, hardware stores, self-builders, construction companies, and public sector entities, served through DINO and Dinoselva; Suppliers and critical inputs - limestone and shell limestone from own quarries,
coal, electric power, and primary transport, determinants of production cost; Financial system and capital market (SMV, BVL, NYSE, banks, and rating agencies), linked to corporate financing and its reporting obligations; and Supervision and
compliance entities (MINEM [Ministry of Energy and Mines], INGEMMET [Geological, Mining and Metallurgical Institute], OEFA [Environmental Assessment and Enforcement Agency], SENACE [National Service for Environmental Certification for
Sustainable Investments], ANA [National Water Authority], INDECOPI), under whose regulatory framework it operates. In addition, the Company maintains a relationship with the communities of Pacasmayo, Tembladera, Piura, and Rioja, upon which
the continuity of its social license to operate depends, and participates in sector associations (ASOCEM [Cement Producers Association], FICEM [Inter-American Cement Federation], GCCA [Global Cement and Concrete Association]) whose
decarbonization agenda influences the sector’s technological trend. Supervision and Compliance Entities MINEM, INGEMMET, OEFA, SENACE, ANA, and INDECOPI CPAC Clients: DINO network and construction companies Associates, hardware stores,
construction companies, and the public sector-purchase cement, concrete, and precast products End demand Self-building, private works, and public investment in the northern macro-region Financial system and capital market BVL, NYSE,
SMV, banks, and rating agencies-financing and regulatory reporting Suppliers and critical inputs Own limestone and shell, coal, electric power, and primary transport Scope of CPAC operations Prepared by: EQUBO E3 25
Macro-Environmental Analysis Analysis of the economic sector for CPAC products
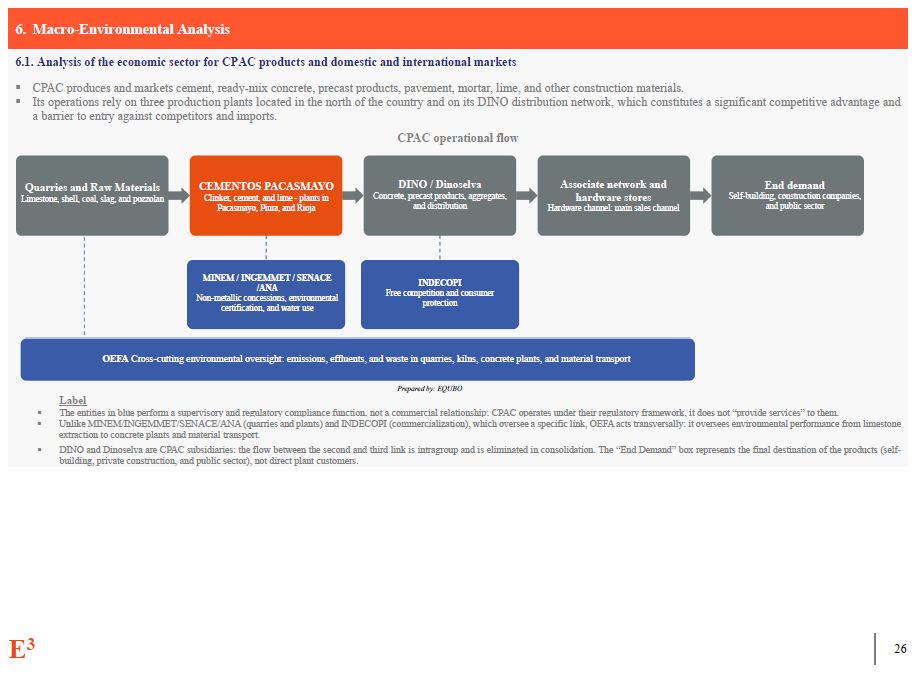
and domestic and international markets CPAC produces and markets cement, ready-mix concrete, precast products, pavement, mortar, lime, and other construction materials. Its operations rely on three production plants located in the north of
the country and on its DINO distribution network, which constitutes a significant competitive advantage and a barrier to entry against competitors and imports. CPAC operational flow MINEM / INGEMMET / SENACE /ANA Non-metallic concessions,
environmental certification, and water use INDECOPI Free competition and consumer protection OEFA Cross-cutting environmental oversight: emissions, effluents, and waste in quarries, kilns, concrete plants, and material transport Prepared
by: EQUBO Label The entities in blue perform a supervisory and regulatory compliance function, not a commercial relationship: CPAC operates under their regulatory framework, it does not “provide services” to them. Unlike
MINEM/INGEMMET/SENACE/ANA (quarries and plants) and INDECOPI (commercialization), which oversee a specific link, OEFA acts transversally: it oversees environmental performance from limestone extraction to concrete plants and material
transport. DINO and Dinoselva are CPAC subsidiaries: the flow between the second and third link is intragroup and is eliminated in consolidation. The “End Demand” box represents the final destination of the products (self-building, private
construction, and public sector), not direct plant customers. Quarries and Raw Materials Limestone, shell, coal, slag, and pozzolan DINO / Dinoselva Concrete, precast products, aggregates, and distribution Associate network and hardware
stores Hardware channel: main sales channel End demand Self-building, construction companies, and public sector CEMENTOS PACASMAYO Clinker, cement, and lime - plants in Pacasmayo, Piura, and Rioja E3 25
Macro-Environmental Analysis Analysis of the economic sector for CPAC products
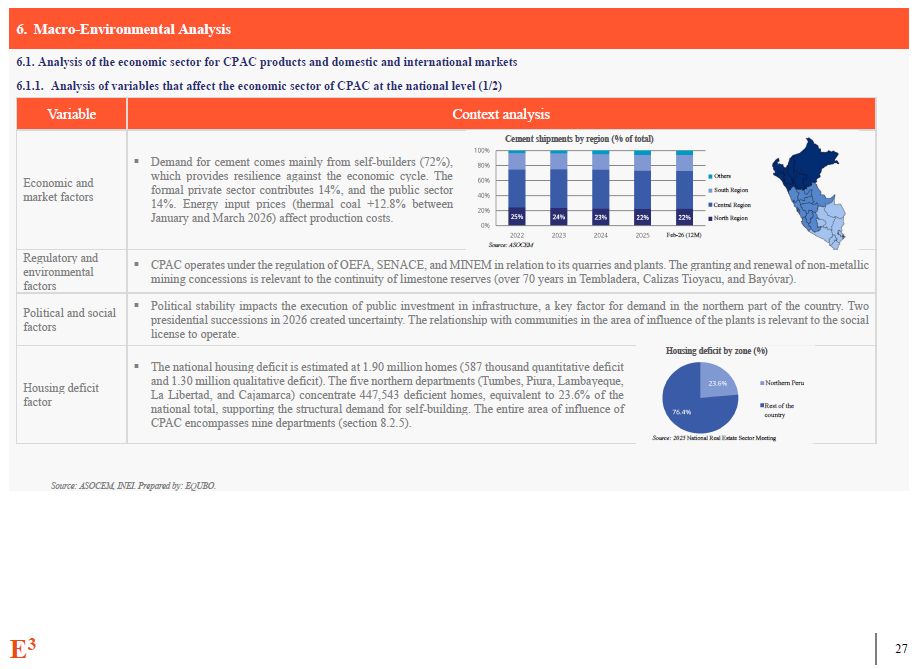
and domestic and international markets Analysis of variables that affect the economic sector of CPAC at the national level (1/2) Source: ASOCEM, INEI. Prepared by: EQUBO. Variable Context analysis Economic and market factors Cement
shipments by region (% of total) Demand for cement comes mainly from self-builders (72%), which provides resilience against the economic cycle. The Others formal private sector contributes 14%, and the public sector South Region 14%.
Energy input prices (thermal coal +12.8% between Central Region January and March 2026) affect production costs. North Region Feb-26 (12M) Source: ASOCEM Regulatory and environmental factors CPAC operates under the regulation of OEFA,
SENACE, and MINEM in relation to its quarries and plants. The granting and renewal of non-metallic mining concessions is relevant to the continuity of limestone reserves (over 70 years in Tembladera, Calizas Tioyacu, and Bayóvar). Political
and social factors Political stability impacts the execution of public investment in infrastructure, a key factor for demand in the northern part of the country. Two presidential successions in 2026 created uncertainty. The relationship with
communities in the area of influence of the plants is relevant to the social license to operate. Housing deficit factor Housing deficit by zone (%) The national housing deficit is estimated at 1.90 million homes (587 thousand quantitative
deficit and 1.30 million qualitative deficit). The five northern departments (Tumbes, Piura, Lambayeque, Northern Peru La Libertad, and Cajamarca) concentrate 447,543 deficient homes, equivalent to 23.6% of the national total, supporting
the structural demand for self-building. The entire area of influence of Rest of the country CPAC encompasses nine departments (section 8.2.5). Source: 2025 National Real Estate Sector Meeting E3 25
Macro-Environmental Analysis Analysis of the economic sector for CPAC products
and domestic and international markets Analysis of variables that affect the economic sector of CPAC at the national level (2/2) Source: CPAC, 2023-2025 Annual Reports; INEI; ASOCEM; ENFEN [Multisectoral Commission in Charge of the National
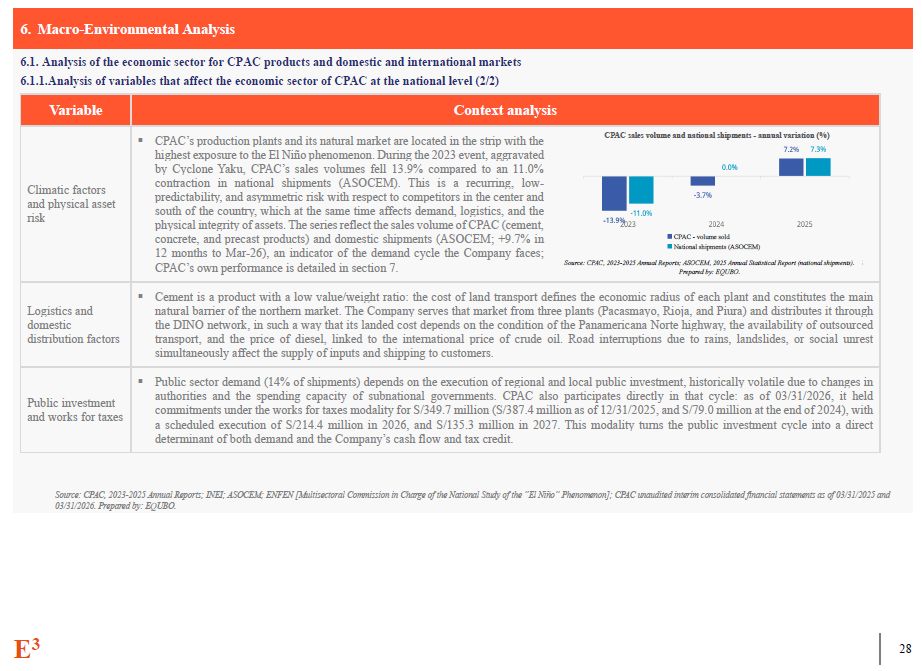
Study of the “El Niño” Phenomenon]; CPAC unaudited interim consolidated financial statements as of 03/31/2025 and 03/31/2026. Prepared by: EQUBO. Variable Context analysis Climatic factors and physical asset risk CPAC’s production plants
and its natural market are located in the strip with the CPAC sales volume and national shipments - annual variation (%) highest exposure to the El Niño phenomenon. During the 2023 event, aggravated by Cyclone Yaku, CPAC’s sales volumes fell
13.9% compared to an 11.0% contraction in national shipments (ASOCEM). This is a recurring, low-predictability, and asymmetric risk with respect to competitors in the center and south of the country, which at the same time affects demand,
logistics, and the physical integrity of assets. The series reflect the sales volume of CPAC (cement, concrete, and precast products) and domestic shipments (ASOCEM; +9.7% in CPAC - volume sold National shipments (ASOCEM) 12 months to
Mar-26), an indicator of the demand cycle the Company faces; CPAC’s own performance is detailed in section 7. Source: CPAC, 2023-2025 Annual Reports; ASOCEM, 2025 Annual Statistical Report (national shipments). Prepared by:
EQUBO. Logistics and domestic distribution factors Cement is a product with a low value/weight ratio: the cost of land transport defines the economic radius of each plant and constitutes the main natural barrier of the northern market. The
Company serves that market from three plants (Pacasmayo, Rioja, and Piura) and distributes it through the DINO network, in such a way that its landed cost depends on the condition of the Panamericana Norte highway, the availability of
outsourced transport, and the price of diesel, linked to the international price of crude oil. Road interruptions due to rains, landslides, or social unrest simultaneously affect the supply of inputs and shipping to customers. Public
investment and works for taxes Public sector demand (14% of shipments) depends on the execution of regional and local public investment, historically volatile due to changes in authorities and the spending capacity of subnational
governments. CPAC also participates directly in that cycle: as of 03/31/2026, it held commitments under the works for taxes modality for S/349.7 million (S/387.4 million as of 12/31/2025, and S/79.0 million at the end of 2024), with a
scheduled execution of S/214.4 million in 2026, and S/135.3 million in 2027. This modality turns the public investment cycle into a direct determinant of both demand and the Company’s cash flow and tax credit. E3 25
Macro-Environmental Analysis Analysis of the economic sector for CPAC products
and domestic and international markets 6.1.2.Analysis of variables that affect the economic sector of CPAC at the national level (1/2) Source: World Bank Commodities Price Data; ASOCEM, 2025 Annual Statistical Report and July 2026 Monthly
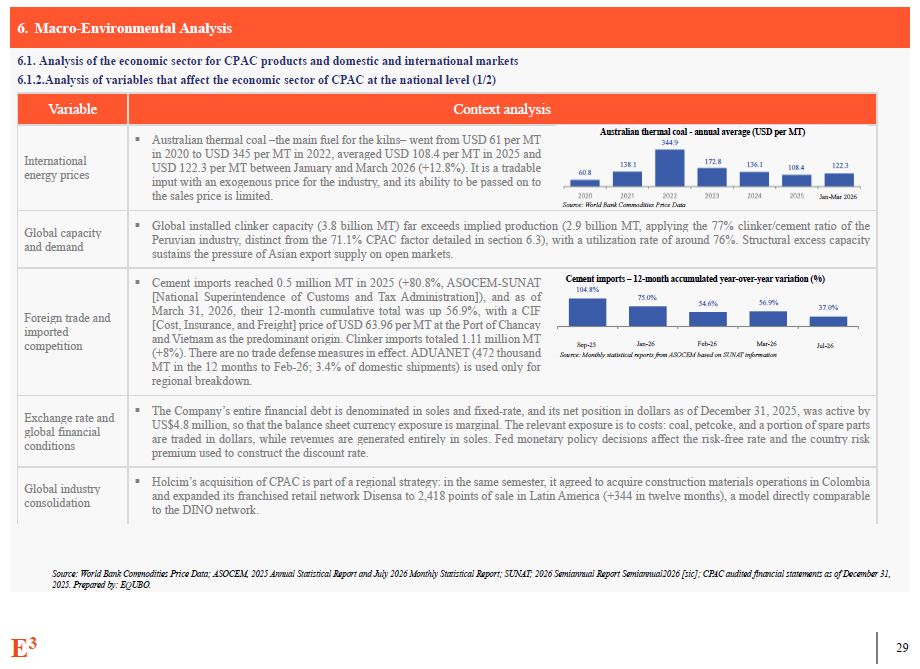
Statistical Report; SUNAT; 2026 Semiannual Report Semiannual2026 [sic]; CPAC audited financial statements as of December 31, 2025. Prepared by: EQUBO. Variable Context analysis International energy prices Australian thermal coal - annual
average (USD per MT) Australian thermal coal –the main fuel for the kilns– went from USD 61 per MT 344.9 in 2020 to USD 345 per MT in 2022, averaged USD 108.4 per MT in 2025 and 172.8 USD 122.3 per MT between January and March 2026
(+12.8%). It is a tradable 138.1 136.1 108.4 122.3 60.8 input with an exogenous price for the industry, and its ability to be passed on to the sales price is limited. Jan-Mar 2026 Source: World Bank Commodities Price Data Global capacity
and demand Global installed clinker capacity (3.8 billion MT) far exceeds implied production (2.9 billion MT, applying the 77% clinker/cement ratio of the Peruvian industry, distinct from the 71.1% CPAC factor detailed in section 6.3), with
a utilization rate of around 76%. Structural excess capacity sustains the pressure of Asian export supply on open markets. Foreign trade and imported competition Cement imports reached 0.5 million MT in 2025 (+80.8%, ASOCEM-SUNAT Cement
imports – 12-month accumulated year-over-year variation (%) 104.8% [National Superintendence of Customs and Tax Administration]), and as of 75.0% 54.6% 56.9% March 31, 2026, their 12-month cumulative total was up 56.9%, with a CIF
37.0% [Cost, Insurance, and Freight] price of USD 63.96 per MT at the Port of Chancay and Vietnam as the predominant origin. Clinker imports totaled 1.11 million MT Sep-25 Jan-26 Feb-26 Mar-26 Jul-26 (+8%). There are no trade defense
measures in effect. ADUANET (472 thousand Source: Monthly statistical reports from ASOCEM based on SUNAT information MT in the 12 months to Feb-26; 3.4% of domestic shipments) is used only for regional breakdown. Exchange rate and global
financial conditions The Company’s entire financial debt is denominated in soles and fixed-rate, and its net position in dollars as of December 31, 2025, was active by US$4.8 million, so that the balance sheet currency exposure is marginal.
The relevant exposure is to costs: coal, petcoke, and a portion of spare parts are traded in dollars, while revenues are generated entirely in soles. Fed monetary policy decisions affect the risk-free rate and the country risk premium used to
construct the discount rate. Global industry consolidation Holcim’s acquisition of CPAC is part of a regional strategy: in the same semester, it agreed to acquire construction materials operations in Colombia and expanded its franchised
retail network Disensa to 2,418 points of sale in Latin America (+344 in twelve months), a model directly comparable to the DINO network. E3 25
Macro-Environmental Analysis Analysis of the economic sector for CPAC products
and domestic and international markets 6.1.2.Analysis of variables affecting CPAC’s economic sector at an international level (2/2) Source: BCRP, Information Note of 02/27/2026 and March 2026 Inflation Report; Regulation (EU) 2023/956 and
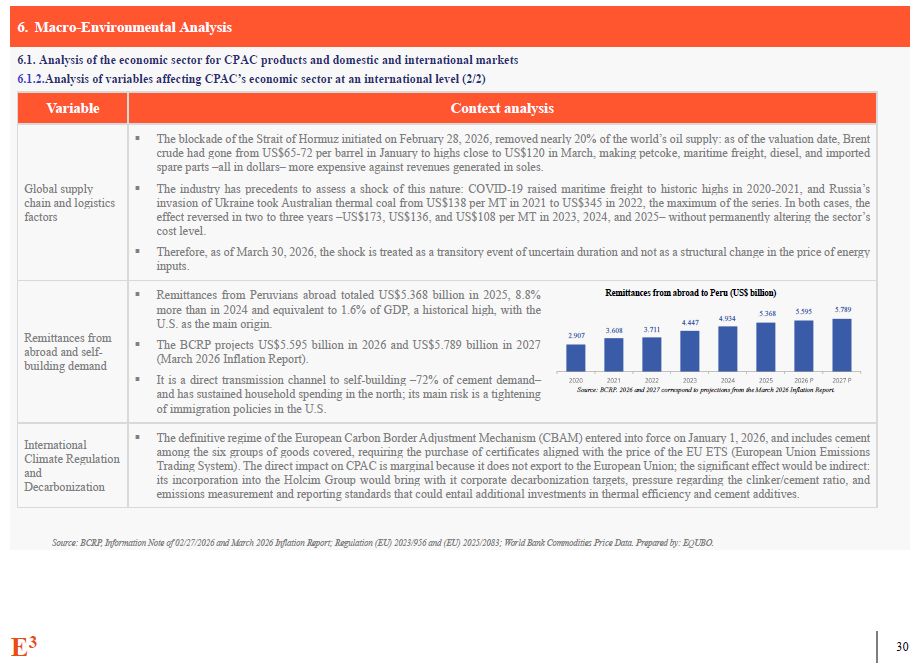
(EU) 2025/2083; World Bank Commodities Price Data. Prepared by: EQUBO. Variable Context analysis Global supply chain and logistics factors The blockade of the Strait of Hormuz initiated on February 28, 2026, removed nearly 20% of the
world’s oil supply: as of the valuation date, Brent crude had gone from US$65-72 per barrel in January to highs close to US$120 in March, making petcoke, maritime freight, diesel, and imported spare parts –all in dollars– more expensive
against revenues generated in soles. The industry has precedents to assess a shock of this nature: COVID-19 raised maritime freight to historic highs in 2020-2021, and Russia’s invasion of Ukraine took Australian thermal coal from US$138 per
MT in 2021 to US$345 in 2022, the maximum of the series. In both cases, the effect reversed in two to three years –US$173, US$136, and US$108 per MT in 2023, 2024, and 2025– without permanently altering the sector’s cost level. Therefore, as
of March 30, 2026, the shock is treated as a transitory event of uncertain duration and not as a structural change in the price of energy inputs. Remittances from abroad and self-building demand Remittances from Peruvians abroad totaled
US$5.368 billion in 2025, 8.8% Remittances from abroad to Peru (US$ billion) more than in 2024 and equivalent to 1.6% of GDP, a historical high, with the 5.368 5.595 5.789 U.S. as the main origin. 4.447 4.934 3.608 3.711 2.907 The BCRP
projects US$5.595 billion in 2026 and US$5.789 billion in 2027 (March 2026 Inflation Report). It is a direct transmission channel to self-building –72% of cement demand– and has sustained household spending in the north; its main risk is a
tightening Source: BCRP. 2026 and 2027 correspond to projections from the March 2026 Inflation Report. of immigration policies in the U.S. International Climate Regulation and Decarbonization The definitive regime of the European Carbon
Border Adjustment Mechanism (CBAM) entered into force on January 1, 2026, and includes cement among the six groups of goods covered, requiring the purchase of certificates aligned with the price of the EU ETS (European Union Emissions Trading
System). The direct impact on CPAC is marginal because it does not export to the European Union; the significant effect would be indirect: its incorporation into the Holcim Group would bring with it corporate decarbonization targets, pressure
regarding the clinker/cement ratio, and emissions measurement and reporting standards that could entail additional investments in thermal efficiency and cement additives. E3 25
6. Macro-Environmental Analysis 6.2. CPAC contingency
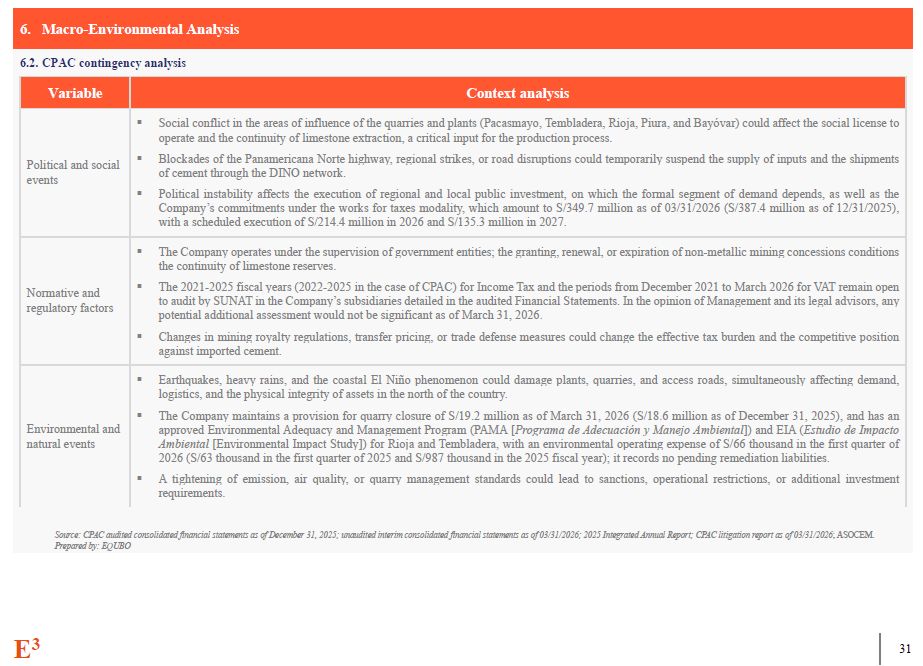
analysis Variable Context analysis Political and social events Social conflict in the areas of influence of the quarries and plants (Pacasmayo, Tembladera, Rioja, Piura, and Bayóvar) could affect the social license to operate and the
continuity of limestone extraction, a critical input for the production process. Blockades of the Panamericana Norte highway, regional strikes, or road disruptions could temporarily suspend the supply of inputs and the shipments of cement
through the DINO network. Political instability affects the execution of regional and local public investment, on which the formal segment of demand depends, as well as the Company’s commitments under the works for taxes modality, which
amount to S/349.7 million as of 03/31/2026 (S/387.4 million as of 12/31/2025), with a scheduled execution of S/214.4 million in 2026 and S/135.3 million in 2027. Normative and regulatory factors The Company operates under the supervision of
government entities; the granting, renewal, or expiration of non-metallic mining concessions conditions the continuity of limestone reserves. The 2021-2025 fiscal years (2022-2025 in the case of CPAC) for Income Tax and the periods from
December 2021 to March 2026 for VAT remain open to audit by SUNAT in the Company’s subsidiaries detailed in the audited Financial Statements. In the opinion of Management and its legal advisors, any potential additional assessment would not
be significant as of March 31, 2026. Changes in mining royalty regulations, transfer pricing, or trade defense measures could change the effective tax burden and the competitive position against imported cement. Environmental and natural
events Earthquakes, heavy rains, and the coastal El Niño phenomenon could damage plants, quarries, and access roads, simultaneously affecting demand, logistics, and the physical integrity of assets in the north of the country. The Company
maintains a provision for quarry closure of S/19.2 million as of March 31, 2026 (S/18.6 million as of December 31, 2025), and has an approved Environmental Adequacy and Management Program (PAMA [Programa de Adecuación y Manejo Ambiental]) and
EIA (Estudio de Impacto Ambiental [Environmental Impact Study]) for Rioja and Tembladera, with an environmental operating expense of S/66 thousand in the first quarter of 2026 (S/63 thousand in the first quarter of 2025 and S/987 thousand in
the 2025 fiscal year); it records no pending remediation liabilities. A tightening of emission, air quality, or quarry management standards could lead to sanctions, operational restrictions, or additional investment requirements. Source:
CPAC audited consolidated financial statements as of December 31, 2025; unaudited interim consolidated financial statements as of 03/31/2026; 2025 Integrated Annual Report; CPAC litigation report as of 03/31/2026; ASOCEM. Prepared by:
EQUBO E3 25
Macro-Environmental Analysis CPAC contingency analysis Legal proceedings
reported by CPAC Source: CPAC audited consolidated financial statements as of December 31, 2025; unaudited interim consolidated financial statements as of 03/31/2026; 2025 Integrated Annual Report; CPAC litigation report as of 03/31/2026;
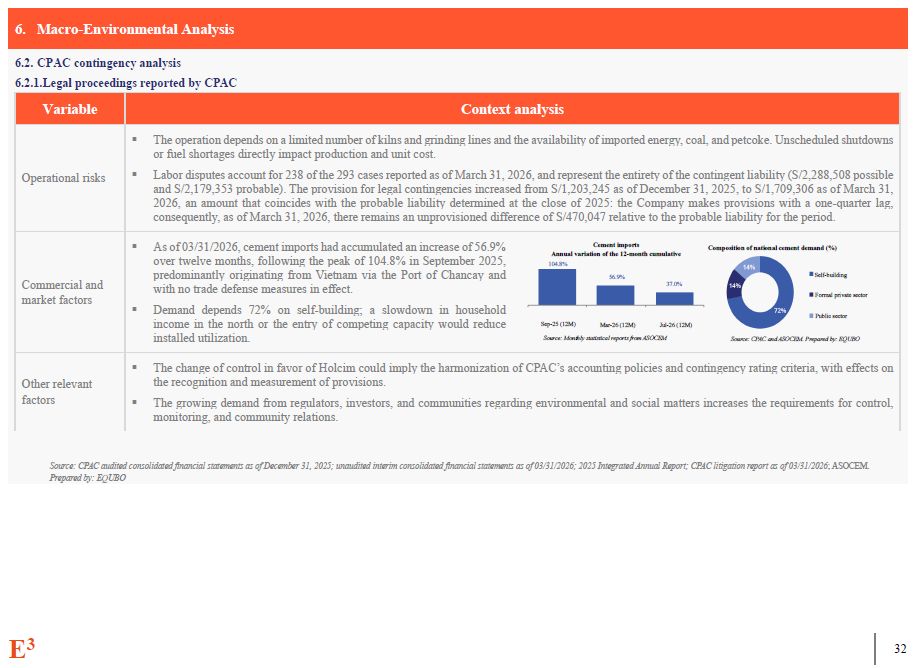
ASOCEM. Prepared by: EQUBO Variable Context analysis Operational risks The operation depends on a limited number of kilns and grinding lines and the availability of imported energy, coal, and petcoke. Unscheduled shutdowns or fuel
shortages directly impact production and unit cost. Labor disputes account for 238 of the 293 cases reported as of March 31, 2026, and represent the entirety of the contingent liability (S/2,288,508 possible and S/2,179,353 probable). The
provision for legal contingencies increased from S/1,203,245 as of December 31, 2025, to S/1,709,306 as of March 31, 2026, an amount that coincides with the probable liability determined at the close of 2025: the Company makes provisions with
a one-quarter lag, consequently, as of March 31, 2026, there remains an unprovisioned difference of S/470,047 relative to the probable liability for the period. Commercial and market factors As of 03/31/2026, cement imports had accumulated
an increase of 56.9% Cement imports Composition of national cement demand (%) Annual variation of the 12-month cumulative over twelve months, following the peak of 104.8% in September 2025, 104.8% predominantly originating from Vietnam via
the Port of Chancay and 56.9% Self-building with no trade defense measures in effect. 37.0% Formal private sector Demand depends 72% on self-building; a slowdown in household Public sector income in the north or the entry of competing
capacity would reduce Sep-25 (12M) Mar-26 (12M) Jul-26 (12M) installed utilization. Source: Monthly statistical reports from ASOCEM Source: CPAC and ASOCEM. Prepared by: EQUBO Other relevant factors The change of control in favor of Holcim
could imply the harmonization of CPAC’s accounting policies and contingency rating criteria, with effects on the recognition and measurement of provisions. The growing demand from regulators, investors, and communities regarding
environmental and social matters increases the requirements for control, monitoring, and community relations. E3 25
Macro-Environmental Analysis CPAC contingency analysis In accordance with IAS
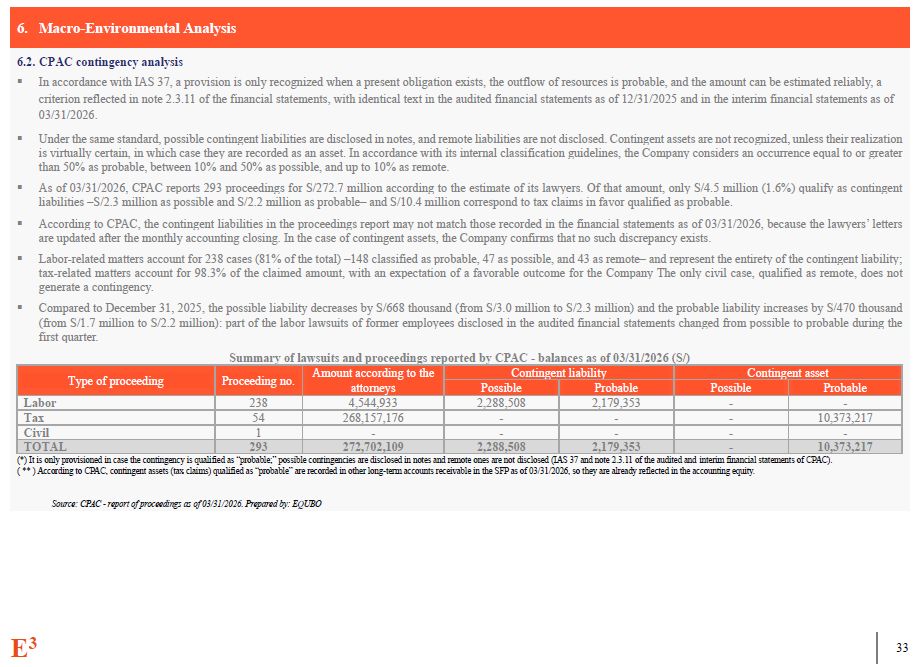
37, a provision is only recognized when a present obligation exists, the outflow of resources is probable, and the amount can be estimated reliably, a criterion reflected in note 2.3.11 of the financial statements, with identical text in the
audited financial statements as of 12/31/2025 and in the interim financial statements as of 03/31/2026. Under the same standard, possible contingent liabilities are disclosed in notes, and remote liabilities are not disclosed. Contingent
assets are not recognized, unless their realization is virtually certain, in which case they are recorded as an asset. In accordance with its internal classification guidelines, the Company considers an occurrence equal to or greater than 50%
as probable, between 10% and 50% as possible, and up to 10% as remote. As of 03/31/2026, CPAC reports 293 proceedings for S/272.7 million according to the estimate of its lawyers. Of that amount, only S/4.5 million (1.6%) qualify as
contingent liabilities –S/2.3 million as possible and S/2.2 million as probable– and S/10.4 million correspond to tax claims in favor qualified as probable. According to CPAC, the contingent liabilities in the proceedings report may not
match those recorded in the financial statements as of 03/31/2026, because the lawyers’ letters are updated after the monthly accounting closing. In the case of contingent assets, the Company confirms that no such discrepancy
exists. Labor-related matters account for 238 cases (81% of the total) –148 classified as probable, 47 as possible, and 43 as remote– and represent the entirety of the contingent liability; tax-related matters account for 98.3% of the
claimed amount, with an expectation of a favorable outcome for the Company The only civil case, qualified as remote, does not generate a contingency. Compared to December 31, 2025, the possible liability decreases by S/668 thousand (from
S/3.0 million to S/2.3 million) and the probable liability increases by S/470 thousand (from S/1.7 million to S/2.2 million): part of the labor lawsuits of former employees disclosed in the audited financial statements changed from possible
to probable during the first quarter. Summary of lawsuits and proceedings reported by CPAC - balances as of 03/31/2026 (S/) Type of proceeding Proceeding no. Amount according to the attorneys Contingent liability Contingent
asset Possible Probable Possible Probable Labor 238 4,544,933 2,288,508 2,179,353 - - Tax 54 268,157,176 - - - 10,373,217 Civil 1 - - - - - TOTAL 293 272,702,109 2,288,508 2,179,353 - 10,373,217 E3 25 (*) It
is only provisioned in case the contingency is qualified as “probable;” possible contingencies are disclosed in notes and remote ones are not disclosed (IAS 37 and note 2.3.11 of the audited and interim financial statements of CPAC). ( ** )
According to CPAC, contingent assets (tax claims) qualified as “probable” are recorded in other long-term accounts receivable in the SFP as of 03/31/2026, so they are already reflected in the accounting equity. Source: CPAC - report of
proceedings as of 03/31/2026. Prepared by: EQUBO
6. Macro-Environmental Analysis 6.3. Other elements that have an impact on the
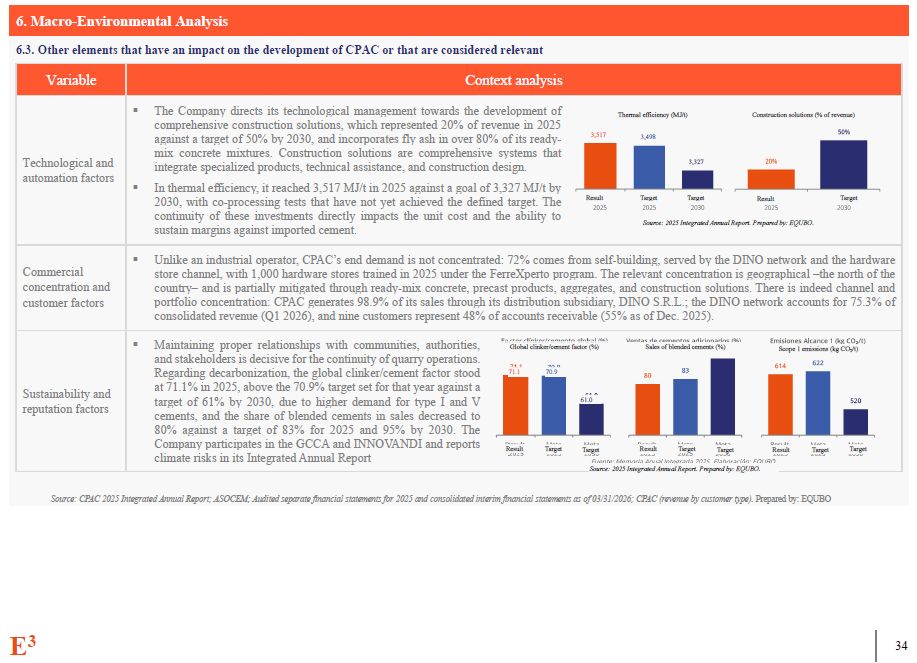
development of CPAC or that are considered relevant Variable Context analysis Technological and automation factors The Company directs its technological management towards the development of comprehensive construction solutions, which
represented 20% of revenue in 2025 against a target of 50% by 2030, and incorporates fly ash in over 80% of its ready- mix concrete mixtures. Construction solutions are comprehensive systems that integrate specialized products, technical
assistance, and construction design. In thermal efficiency, it reached 3,517 MJ/t in 2025 against a goal of 3,327 MJ/t by 2030, with co-processing tests that have not yet achieved the defined target. The continuity of these investments
directly impacts the unit cost and the ability to sustain margins against imported cement. Commercial concentration and customer factors Unlike an industrial operator, CPAC’s end demand is not concentrated: 72% comes from self-building,
served by the DINO network and the hardware store channel, with 1,000 hardware stores trained in 2025 under the FerreXperto program. The relevant concentration is geographical –the north of the country– and is partially mitigated through
ready-mix concrete, precast products, aggregates, and construction solutions. There is indeed channel and portfolio concentration: CPAC generates 98.9% of its sales through its distribution subsidiary, DINO S.R.L.; the DINO network accounts
for 75.3% of consolidated revenue (Q1 2026), and nine customers represent 48% of accounts receivable (55% as of Dec. 2025). Sustainability and reputation factors Maintaining proper relationships with communities, authorities, and
stakeholders is decisive for the continuity of quarry operations. Regarding decarbonization, the global clinker/cement factor stood at 71.1% in 2025, above the 70.9% target set for that year against a target of 61% by 2030, due to higher
demand for type I and V cements, and the share of blended cements in sales decreased to 80% against a target of 83% for 2025 and 95% by 2030. The Company participates in the GCCA and INNOVANDI and reports climate risks in its Integrated
Annual Report Source: CPAC 2025 Integrated Annual Report; ASOCEM; Audited separate financial statements for 2025 and consolidated interim financial statements as of 03/31/2026; CPAC (revenue by customer type). Prepared by: EQUBO Thermal
efficiency (MJ/t) Construction solutions (% of revenue) 3,498 3,327 3,517 Result Target Target Target Result Source: 2025 Integrated Annual Report. Prepared by: EQUBO. Result Result Target Target Target Result Target
Target Source: 2025 Integrated Annual Report. Prepared by: EQUBO. Target 61.0 70.9 71.1 Global clinker/cement factor (%) Sales of blended cements (%) Scope 1 emissions (kg CO2/t) E3 25
6. Macro-Environmental Analysis 6.3. Other elements that have an impact on the
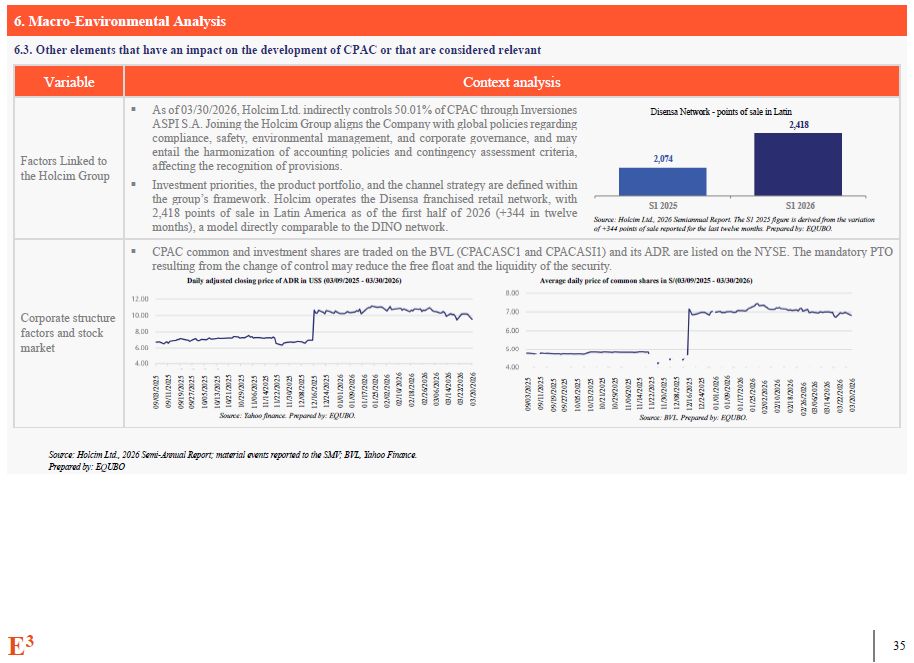
development of CPAC or that are considered relevant Variable Context analysis Factors Linked to the Holcim Group As of 03/30/2026, Holcim Ltd. indirectly controls 50.01% of CPAC through Inversiones ASPI S.A. Joining the Holcim Group aligns
the Company with global policies regarding compliance, safety, environmental management, and corporate governance, and may entail the harmonization of accounting policies and contingency assessment criteria, affecting the recognition of
provisions. Investment priorities, the product portfolio, and the channel strategy are defined within the group’s framework. Holcim operates the Disensa franchised retail network, with 2,418 points of sale in Latin America as of the first
half of 2026 (+344 in twelve months), a model directly comparable to the DINO network. Source: Holcim Ltd., 2026 Semi-Annual Report; material events reported to the SMV; BVL, Yahoo Finance. Prepared by: EQUBO 2,074 Disensa Network - points
of sale in Latin 2,418 S1 2025 S1 2026 Source: Holcim Ltd., 2026 Semiannual Report. The S1 2025 figure is derived from the variation of +344 points of sale reported for the last twelve months. Prepared by: EQUBO. Source: BVL. Prepared by:
EQUBO. Source: Yahoo finance. Prepared by: EQUBO. CPAC common and investment shares are traded on the BVL (CPACASC1 and CPACASI1) and its ADR are listed on the NYSE. The mandatory PTO resulting from the change of control may reduce the free
float and the liquidity of the security. Daily adjusted closing price of ADR in US$ (03/09/2025 - 03/30/2026) Average daily price of common shares in S/(03/09/2025 - 03/30/2026) Corporate structure factors and stock
market 09/03/2025 09/11/2025 09/19/2025 09/27/2025 10/05/2025 10/13/2025 10/21/2025 10/29/2025 11/06/2025 11/14/2025 11/22/2025 11/30/2025 12/08/2025 12/16/2025 12/24/2025 01/01/2026 01/09/2026 01/17/2026 01/25/2026 02/02/2026 02/10/2026 02/18/2026 02/26/2026 03/06/2026 03/14/2026 03/22/2026 03/20/2026 09/03/2025 09/11/2025 09/19/2025 09/27/2025 10/05/2025 10/13/2025 10/21/2025 10/29/2025 11/06/2025 11/14/2025 11/22/2025 11/30/2025 12/08/2025 12/16/2025 12/24/2025 01/01/2026 01/09/2026 01/17/2026 01/25/2026 02/02/2026 02/10/2026 02/18/2026 02/26/2026 03/06/2026 03/14/2026 03/22/2026 03/20/2026 E3 25
07 Macro-Environmental Analysis
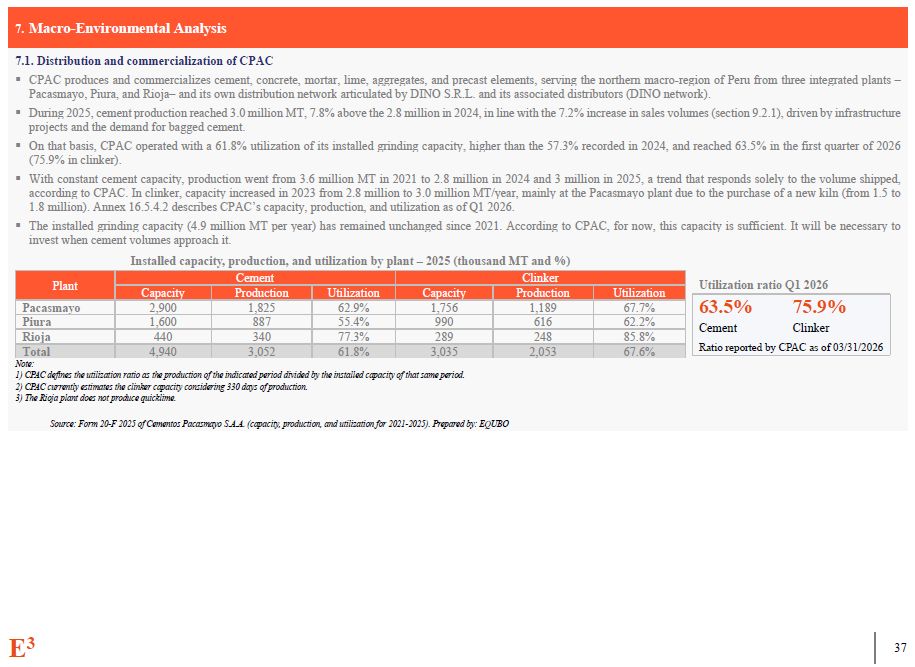
Plant Cement Clinker Capacity Production Utilization Capacity Production Utilization Pacasmayo 2,900 1,825 62.9% 1,756 1,189 67.7% Piura 1,600 887 55.4% 990 616 62.2% Rioja 440 340 77.3% 289 248 85.8% Total 4,940 3,052 61.8% 3,035 2,053 67.6% Note: CPAC
defines the utilization ratio as the production of the indicated period divided by the installed capacity of that same period. CPAC currently estimates the clinker capacity considering 330 days of production. The Rioja plant does not
produce quicklime. Source: Form 20-F 2025 of Cementos Pacasmayo S.A.A. (capacity, production, and utilization for 2021-2025). Prepared by: EQUBO Macro-Environmental Analysis Distribution and commercialization of CPAC CPAC produces and
commercializes cement, concrete, mortar, lime, aggregates, and precast elements, serving the northern macro-region of Peru from three integrated plants – Pacasmayo, Piura, and Rioja– and its own distribution network articulated by DINO S.R.L.
and its associated distributors (DINO network). During 2025, cement production reached 3.0 million MT, 7.8% above the 2.8 million in 2024, in line with the 7.2% increase in sales volumes (section 9.2.1), driven by infrastructure projects and
the demand for bagged cement. On that basis, CPAC operated with a 61.8% utilization of its installed grinding capacity, higher than the 57.3% recorded in 2024, and reached 63.5% in the first quarter of 2026 (75.9% in clinker). With constant
cement capacity, production went from 3.6 million MT in 2021 to 2.8 million in 2024 and 3 million in 2025, a trend that responds solely to the volume shipped, according to CPAC. In clinker, capacity increased in 2023 from 2.8 million to 3.0
million MT/year, mainly at the Pacasmayo plant due to the purchase of a new kiln (from 1.5 to 1.8 million). Annex 16.5.4.2 describes CPAC’s capacity, production, and utilization as of Q1 2026. The installed grinding capacity (4.9 million MT
per year) has remained unchanged since 2021. According to CPAC, for now, this capacity is sufficient. It will be necessary to invest when cement volumes approach it. Installed capacity, production, and utilization by plant – 2025 (thousand
MT and %) Utilization ratio Q1 2026 63.5% Cement 75.9% Clinker Ratio reported by CPAC as of 03/31/2026 E3 37
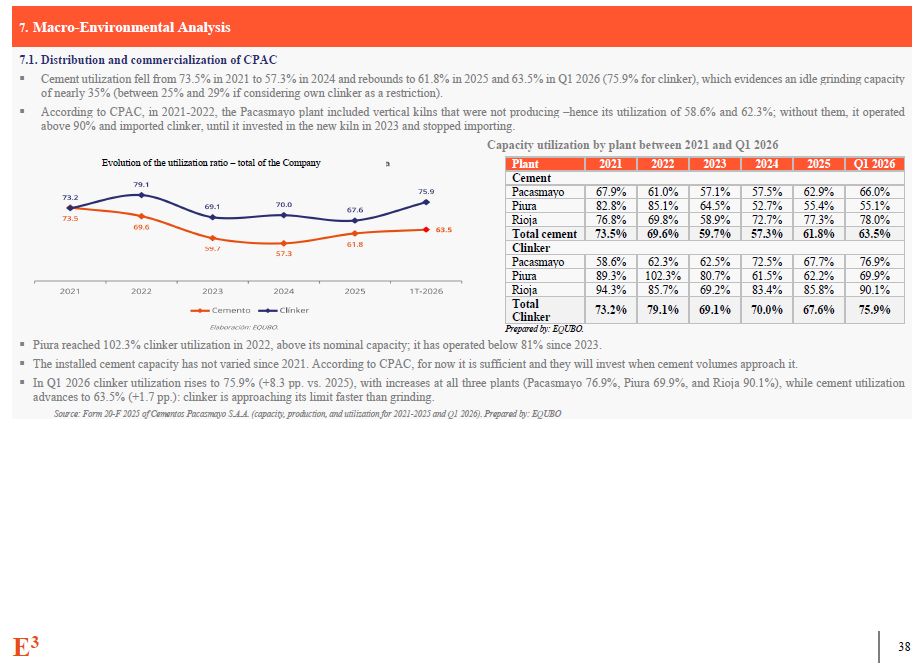
Plant 2021 2022 2023 2024 2025 Q1
2026 Cement Pacasmayo 67.9% 61.0% 57.1% 57.5% 62.9% 66.0% Piura 82.8% 85.1% 64.5% 52.7% 55.4% 55.1% Rioja 76.8% 69.8% 58.9% 72.7% 77.3% 78.0% Total
cement 73.5% 69.6% 59.7% 57.3% 61.8% 63.5% Clinker Pacasmayo 58.6% 62.3% 62.5% 72.5% 67.7% 76.9% Piura 89.3% 102.3% 80.7% 61.5% 62.2% 69.9% Rioja 94.3% 85.7% 69.2% 83.4% 85.8% 90.1% Total
Clinker 73.2% 79.1% 69.1% 70.0% 67.6% 75.9% Prepared by: EQUBO. Piura reached 102.3% clinker utilization in 2022, above its nominal capacity; it has operated below 81% since 2023. The installed cement capacity has not varied since
2021. According to CPAC, for now it is sufficient and they will invest when cement volumes approach it. In Q1 2026 clinker utilization rises to 75.9% (+8.3 pp. vs. 2025), with increases at all three plants (Pacasmayo 76.9%, Piura 69.9%, and
Rioja 90.1%), while cement utilization advances to 63.5% (+1.7 pp.): clinker is approaching its limit faster than grinding. Source: Form 20-F 2025 of Cementos Pacasmayo S.A.A. (capacity, production, and utilization for 2021-2025 and Q1
2026). Prepared by: EQUBO Macro-Environmental Analysis Distribution and commercialization of CPAC Cement utilization fell from 73.5% in 2021 to 57.3% in 2024 and rebounds to 61.8% in 2025 and 63.5% in Q1 2026 (75.9% for clinker), which
evidences an idle grinding capacity of nearly 35% (between 25% and 29% if considering own clinker as a restriction). According to CPAC, in 2021-2022, the Pacasmayo plant included vertical kilns that were not producing –hence its utilization
of 58.6% and 62.3%; without them, it operated above 90% and imported clinker, until it invested in the new kiln in 2023 and stopped importing. Capacity utilization by plant between 2021 and Q1 2026 Evolution of the utilization ratio – total
of the Company E3 37
Macro-Environmental Analysis Distribution and commercialization of CPAC CPAC
markets its production mainly through the DINO network–independent associated distributors supplied by the subsidiary DIN construction companies, independent hardware stores, and the modern channel, with a presence in twelve cities in the
country’s north The breakdown of consolidated revenue by type of service, geography, and type of customer for the 2024 and 2025 fiscal years and gauge what is being sold, where it is distributed, and through which channel the output is
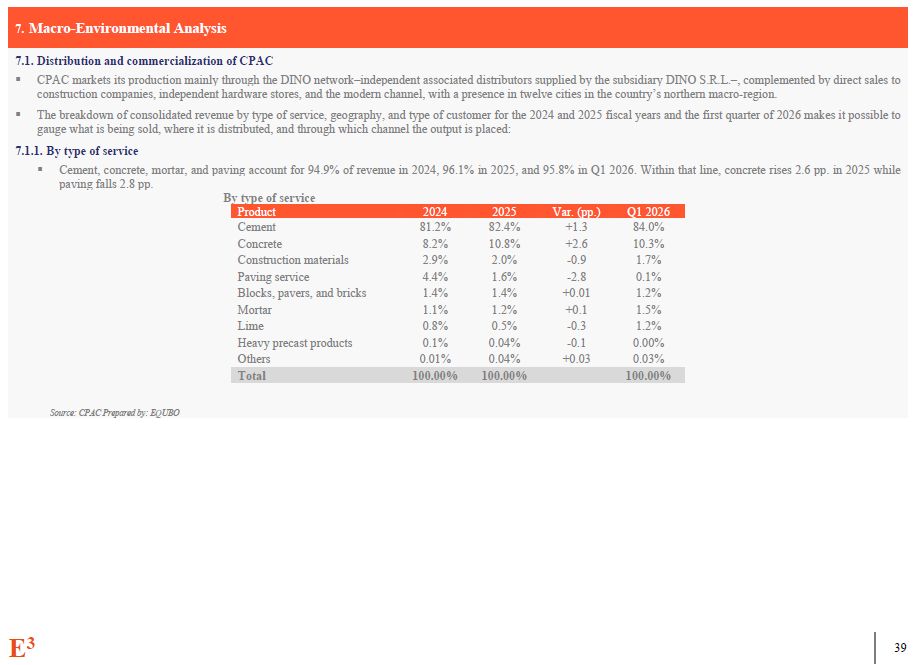
placed: By type of service Cement, concrete, mortar, and paving account for 94.9% of revenue in 2024, 96.1% in 2025, and 95.8% in Q1 2026. Within th paving falls 2.8 pp. By type of service O S.R.L.–, complemented by direct sales to ern
macro-region. the first quarter of 2026 makes it possible to at line, concrete rises 2.6 pp. in 2025 while Product 2024 2025 Var. (pp.) Q1 2026 Cement 81.2% 82.4% +1.3 84.0% Concrete 8.2% 10.8% +2.6 10.3% Construction
materials 2.9% 2.0% -0.9 1.7% Paving service 4.4% 1.6% -2.8 0.1% Blocks, pavers, and bricks 1.4% 1.4% +0.01 1.2% Mortar 1.1% 1.2% +0.1 1.5% Lime 0.8% 0.5% -0.3 1.2% Heavy precast
products 0.1% 0.04% -0.1 0.00% Others 0.01% 0.04% +0.03 0.03% Total 100.00% 100.00% 100.00% Source: CPAC Prepared by: EQUBO E3 37
City 2024 2025 Var. (pp.) Q1
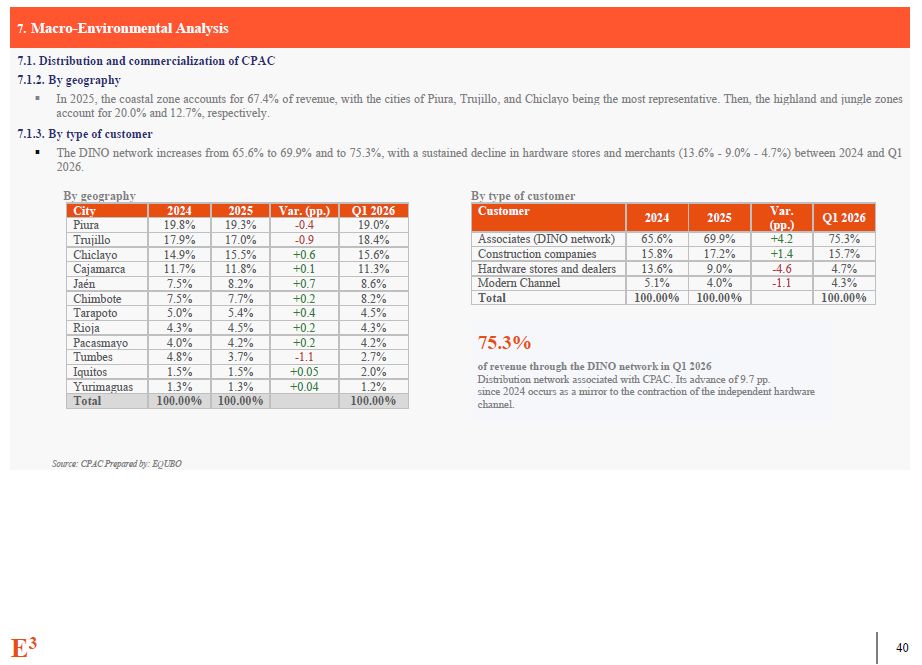
2026 Piura 19.8% 19.3% -0.4 19.0% Trujillo 17.9% 17.0% -0.9 18.4% Chiclayo 14.9% 15.5% +0.6 15.6% Cajamarca 11.7% 11.8% +0.1 11.3% Jaén 7.5% 8.2% +0.7 8.6% Chimbote 7.5% 7.7% +0.2 8.2% Tarapoto 5.0% 5.4% +0.4 4.5% Rioja 4.3% 4.5% +0.2 4.3% Pacasmayo 4.0% 4.2% +0.2 4.2% Tumbes 4.8% 3.7% -1.1 2.7% Iquitos 1.5% 1.5% +0.05 2.0% Yurimaguas 1.3% 1.3% +0.04 1.2% Total 100.00% 100.00% 100.00% Macro-Environmental
Analysis Distribution and commercialization of CPAC By geography In 2025, the coastal zone accounts for 67.4% of revenue, with the cities of Piura, Trujillo, and Chiclayo being the most representative. Then, the highland and jungle zones
account for 20.0% and 12.7%, respectively. By type of customer The DINO network increases from 65.6% to 69.9% and to 75.3%, with a sustained decline in hardware stores and merchants (13.6% - 9.0% - 4.7%) between 2024 and Q1 2026. By
geography By type of customer Customer 2024 2025 Var. (pp.) Q1 2026 Associates (DINO network) 65.6% 69.9% +4.2 75.3% Construction companies 15.8% 17.2% +1.4 15.7% Hardware stores and dealers 13.6% 9.0% -4.6 4.7% Modern
Channel 5.1% 4.0% -1.1 4.3% Total 100.00% 100.00% 100.00% 75.3% of revenue through the DINO network in Q1 2026 Distribution network associated with CPAC. Its advance of 9.7 pp. since 2024 occurs as a mirror to the contraction of
the independent hardware channel. Source: CPAC Prepared by: EQUBO E3 37
7. Macro-Environmental Analysis 7.2. Description of CPAC’s main
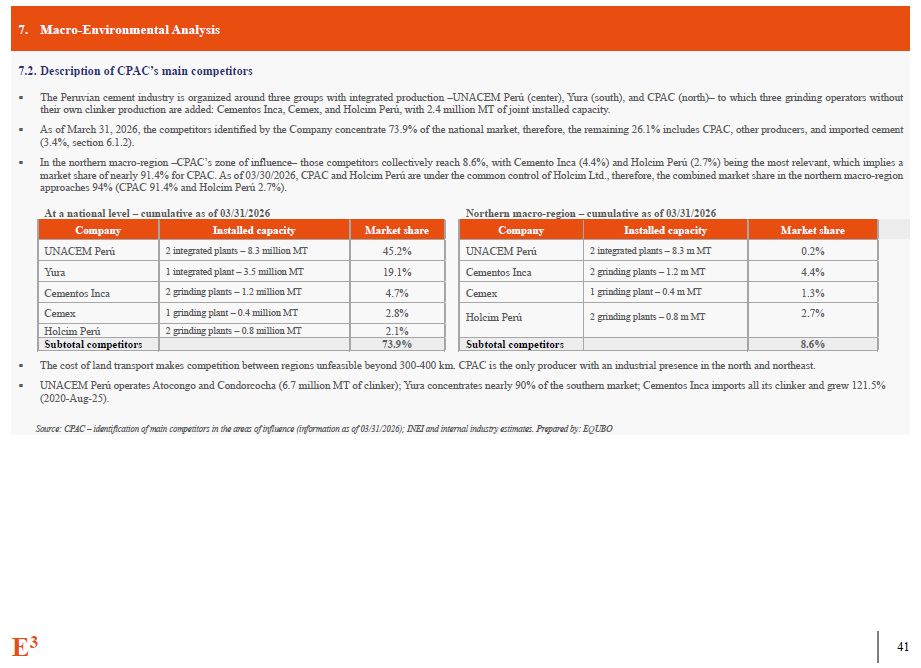
competitors The Peruvian cement industry is organized around three groups with integrated production –UNACEM Perú (center), Yura (south), and CPAC (north)– to which three grinding operators without their own clinker production are added:
Cementos Inca, Cemex, and Holcim Perú, with 2.4 million MT of joint installed capacity. As of March 31, 2026, the competitors identified by the Company concentrate 73.9% of the national market, therefore, the remaining 26.1% includes CPAC,
other producers, and imported cement (3.4%, section 6.1.2). In the northern macro-region –CPAC’s zone of influence– those competitors collectively reach 8.6%, with Cemento Inca (4.4%) and Holcim Perú (2.7%) being the most relevant, which
implies a market share of nearly 91.4% for CPAC. As of 03/30/2026, CPAC and Holcim Perú are under the common control of Holcim Ltd., therefore, the combined market share in the northern macro-region approaches 94% (CPAC 91.4% and Holcim Perú
2.7%). At a national level – cumulative as of 03/31/2026 Northern macro-region – cumulative as of 03/31/2026 Company Installed capacity Market share Company Installed capacity Market share UNACEM Perú 2 integrated plants – 8.3
million MT 45.2% UNACEM Perú 2 integrated plants – 8.3 m MT 0.2% Yura 1 integrated plant – 3.5 million MT 19.1% Cementos Inca 2 grinding plants – 1.2 m MT 4.4% Cementos Inca 2 grinding plants – 1.2 million MT 4.7% Cemex 1
grinding plant – 0.4 m MT 1.3% Cemex 1 grinding plant – 0.4 million MT 2.8% Holcim Perú 2 grinding plants – 0.8 m MT 2.7% 2 grinding plants – 0.8 million MT Holcim Perú 2.1% Subtotal competitors 73.9% Subtotal competitors 8.6% The
cost of land transport makes competition between regions unfeasible beyond 300-400 km. CPAC is the only producer with an industrial presence in the north and northeast. UNACEM Perú operates Atocongo and Condorcocha (6.7 million MT of
clinker); Yura concentrates nearly 90% of the southern market; Cementos Inca imports all its clinker and grew 121.5% (2020-Aug-25). Source: CPAC – identification of main competitors in the areas of influence (information as of 03/31/2026);
INEI and internal industry estimates. Prepared by: EQUBO E3 37
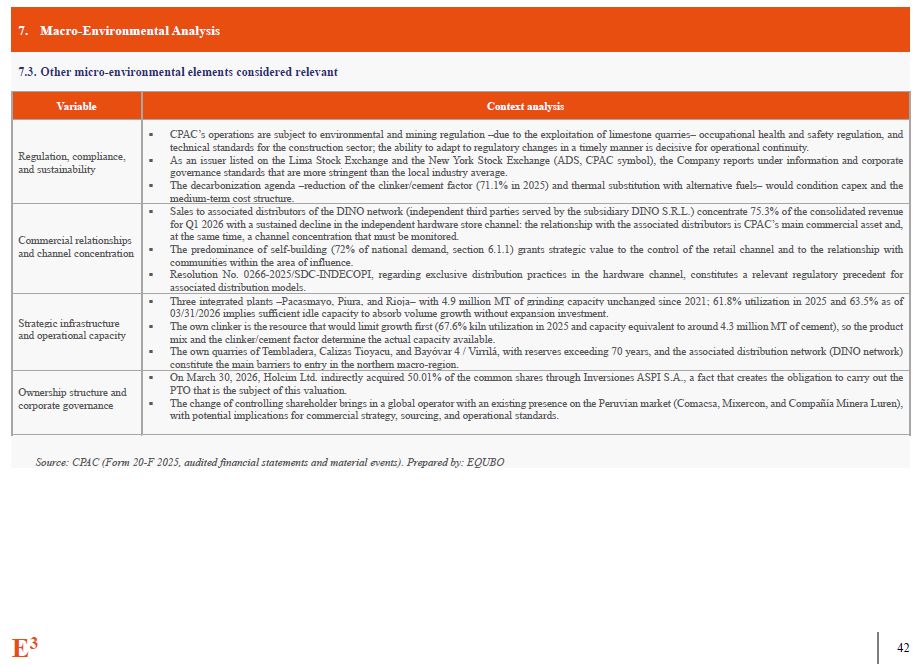
7. Macro-Environmental Analysis 7.3. Other micro-environmental elements
considered relevant Variable Context analysis Regulation, compliance, and sustainability CPAC’s operations are subject to environmental and mining regulation –due to the exploitation of limestone quarries– occupational health and safety
regulation, and technical standards for the construction sector; the ability to adapt to regulatory changes in a timely manner is decisive for operational continuity. As an issuer listed on the Lima Stock Exchange and the New York Stock
Exchange (ADS, CPAC symbol), the Company reports under information and corporate governance standards that are more stringent than the local industry average. The decarbonization agenda –reduction of the clinker/cement factor (71.1% in
2025) and thermal substitution with alternative fuels– would condition capex and the medium-term cost structure. Commercial relationships and channel concentration Sales to associated distributors of the DINO network (independent third
parties served by the subsidiary DINO S.R.L.) concentrate 75.3% of the consolidated revenue for Q1 2026 with a sustained decline in the independent hardware store channel: the relationship with the associated distributors is CPAC’s main
commercial asset and, at the same time, a channel concentration that must be monitored. The predominance of self-building (72% of national demand, section 6.1.1) grants strategic value to the control of the retail channel and to the
relationship with communities within the area of influence. Resolution No. 0266-2025/SDC-INDECOPI, regarding exclusive distribution practices in the hardware channel, constitutes a relevant regulatory precedent for associated distribution
models. Strategic infrastructure and operational capacity Three integrated plants –Pacasmayo, Piura, and Rioja– with 4.9 million MT of grinding capacity unchanged since 2021; 61.8% utilization in 2025 and 63.5% as of 03/31/2026 implies
sufficient idle capacity to absorb volume growth without expansion investment. The own clinker is the resource that would limit growth first (67.6% kiln utilization in 2025 and capacity equivalent to around 4.3 million MT of cement), so the
product mix and the clinker/cement factor determine the actual capacity available. The own quarries of Tembladera, Calizas Tioyacu, and Bayóvar 4 / Virrilá, with reserves exceeding 70 years, and the associated distribution network (DINO
network) constitute the main barriers to entry in the northern macro-region. Ownership structure and corporate governance On March 30, 2026, Holcim Ltd. indirectly acquired 50.01% of the common shares through Inversiones ASPI S.A., a fact
that creates the obligation to carry out the PTO that is the subject of this valuation. The change of controlling shareholder brings in a global operator with an existing presence on the Peruvian market (Comacsa, Mixercon, and Compañía
Minera Luren), with potential implications for commercial strategy, sourcing, and operational standards. Source: CPAC (Form 20-F 2025, audited financial statements and material events). Prepared by: EQUBO E3 37
08 Industry description and analysis
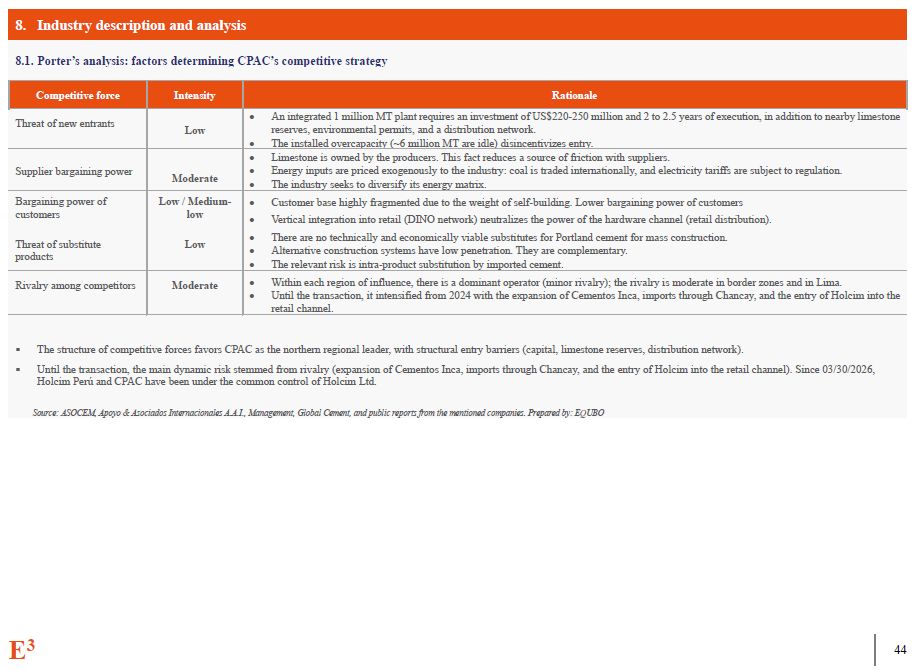
8. Industry description and analysis 8.1. Porter’s analysis: factors
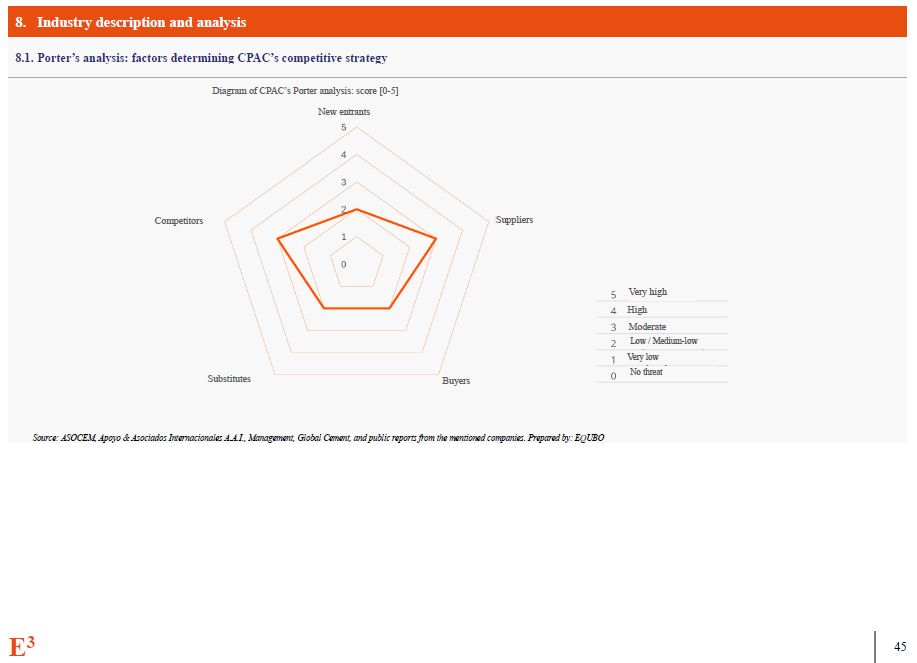
determining CPAC’s competitive strategy Competitive force Intensity Rationale Threat of new entrants Low An integrated 1 million MT plant requires an investment of US$220-250 million and 2 to 2.5 years of execution, in addition to
nearby limestone reserves, environmental permits, and a distribution network. The installed overcapacity (~6 million MT are idle) disincentivizes entry. Supplier bargaining power Moderate Limestone is owned by the producers. This fact
reduces a source of friction with suppliers. Energy inputs are priced exogenously to the industry: coal is traded internationally, and electricity tariffs are subject to regulation. The industry seeks to diversify its energy
matrix. Bargaining power of customers Low / Medium-low Customer base highly fragmented due to the weight of self-building. Lower bargaining power of customers Vertical integration into retail (DINO network) neutralizes the power of the
hardware channel (retail distribution). Threat of substitute products Low There are no technically and economically viable substitutes for Portland cement for mass construction. Alternative construction systems have low penetration. They
are complementary. The relevant risk is intra-product substitution by imported cement. Rivalry among competitors Moderate Within each region of influence, there is a dominant operator (minor rivalry); the rivalry is moderate in border
zones and in Lima. Until the transaction, it intensified from 2024 with the expansion of Cementos Inca, imports through Chancay, and the entry of Holcim into the retail channel. The structure of competitive forces favors CPAC as the
northern regional leader, with structural entry barriers (capital, limestone reserves, distribution network). Until the transaction, the main dynamic risk stemmed from rivalry (expansion of Cementos Inca, imports through Chancay, and the
entry of Holcim into the retail channel). Since 03/30/2026, Holcim Perú and CPAC have been under the common control of Holcim Ltd. Source: ASOCEM, Apoyo & Asociados Internacionales A.A.I., Management, Global Cement, and public reports
from the mentioned companies. Prepared by: EQUBO E3 44
8. Industry description and analysis Source: ASOCEM, Apoyo & Asociados
Internacionales A.A.I., Management, Global Cement, and public reports from the mentioned companies. Prepared by: EQUBO 8.1. Porter’s analysis: factors determining CPAC’s competitive strategy Diagram of CPAC’s Porter analysis: score
[0-5] New entrants Competitors Suppliers Substitutes Buyers Very high High Moderate Low / Medium-low Very low No threat E3 44
8. Industry description and analysis CPAC description regarding the
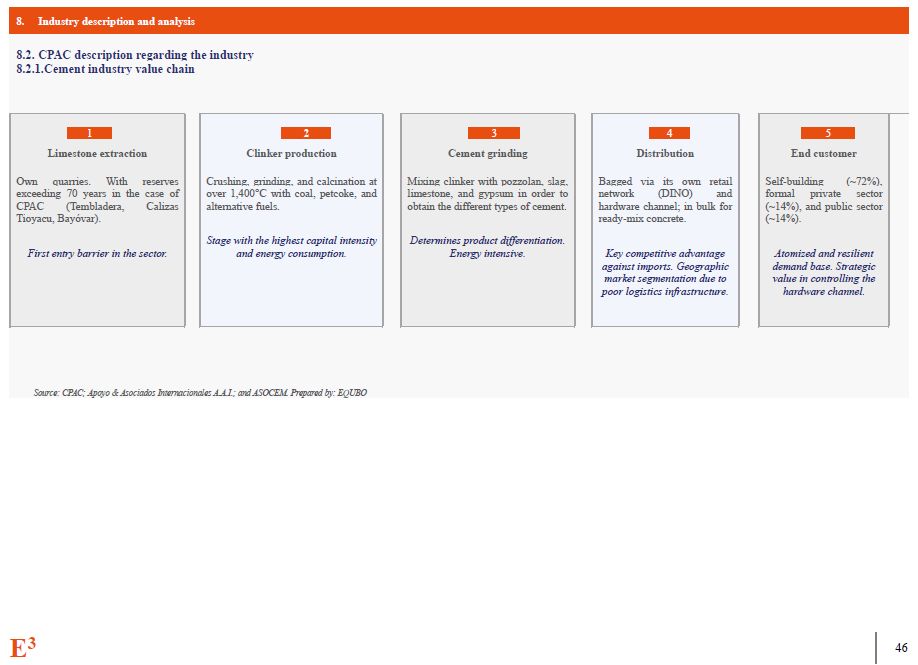
industry Cement industry value chain 4 Distribution Bagged via its own retail network (DINO) and hardware channel; in bulk for ready-mix concrete. Key competitive advantage against imports. Geographic market segmentation due to poor
logistics infrastructure. 1 2 3 5 Limestone extraction Own quarries. With reserves exceeding 70 years in the case of CPAC (Tembladera, Calizas Tioyacu, Bayóvar). First entry barrier in the sector. Clinker production Crushing,
grinding, and calcination at over 1,400°C with coal, petcoke, and alternative fuels. Stage with the highest capital intensity and energy consumption. Cement grinding Mixing clinker with pozzolan, slag, limestone, and gypsum in order to
obtain the different types of cement. Determines product differentiation. Energy intensive. End customer Self-building (~72%), formal private sector (~14%), and public sector (~14%). Atomized and resilient demand base. Strategic value in
controlling the hardware channel. Source: CPAC; Apoyo & Asociados Internacionales A.A.I.; and ASOCEM. Prepared by: EQUBO E3 44
8. Industry description and analysis 8.2. CPAC description regarding the
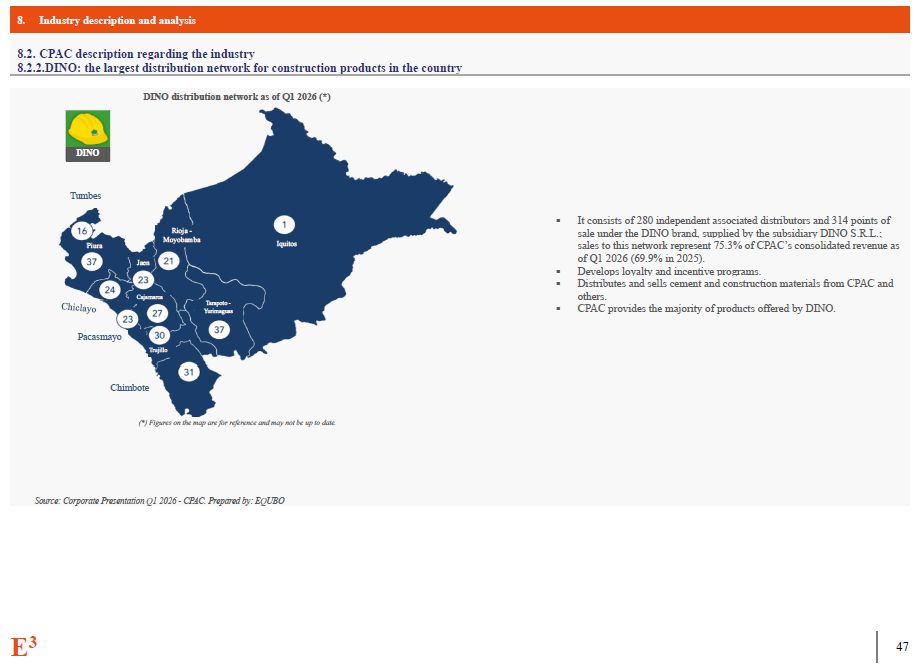
industry 8.2.2.DINO: the largest distribution network for construction products in the country It consists of 280 independent associated distributors and 314 points of sale under the DINO brand, supplied by the subsidiary DINO S.R.L.;
sales to this network represent 75.3% of CPAC’s consolidated revenue as of Q1 2026 (69.9% in 2025). Develops loyalty and incentive programs. Distributes and sells cement and construction materials from CPAC and others. CPAC provides the
majority of products offered by DINO. Source: Corporate Presentation Q1 2026 - CPAC. Prepared by: EQUBO DINO distribution network as of Q1 2026 (*) Tumbes Piura Rioja - Moyobamba Iquitos Jaen Cajamarca Tarapoto -
Yurimaguas Pacasmayo Trujillo Chimbote (*) Figures on the map are for reference and may not be up to date. DINO E3 44
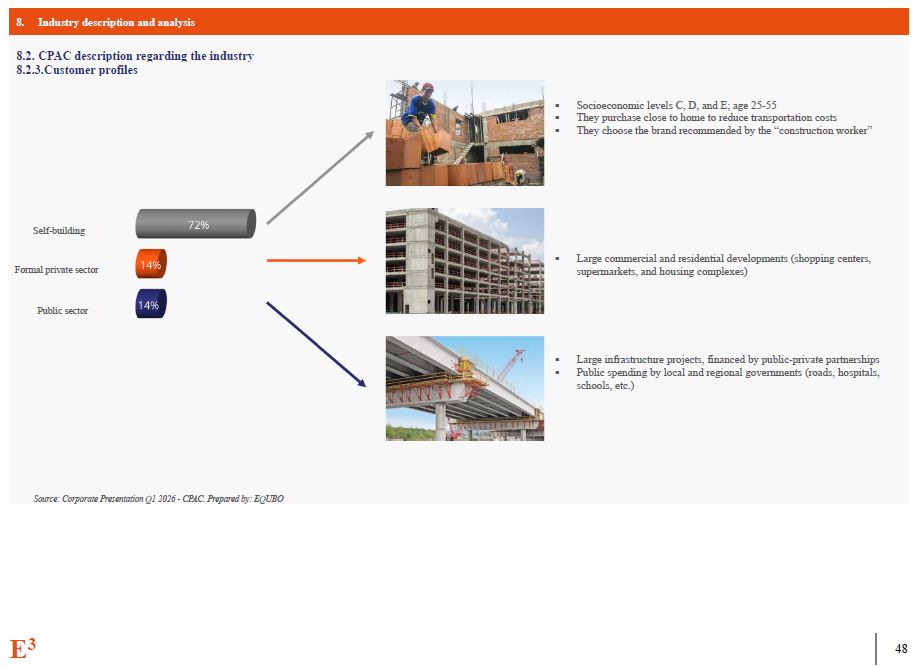
8. Industry description and analysis 8.2. CPAC description regarding the
industry 8.2.3.Customer profiles Socioeconomic levels C, D, and E; age 25-55 They purchase close to home to reduce transportation costs They choose the brand recommended by the “construction worker” Large commercial and residential
developments (shopping centers, supermarkets, and housing complexes) Large infrastructure projects, financed by public-private partnerships Public spending by local and regional governments (roads, hospitals, schools, etc.) Source:
Corporate Presentation Q1 2026 - CPAC. Prepared by: EQUBO Self-building Formal private sector Public sector E3 44
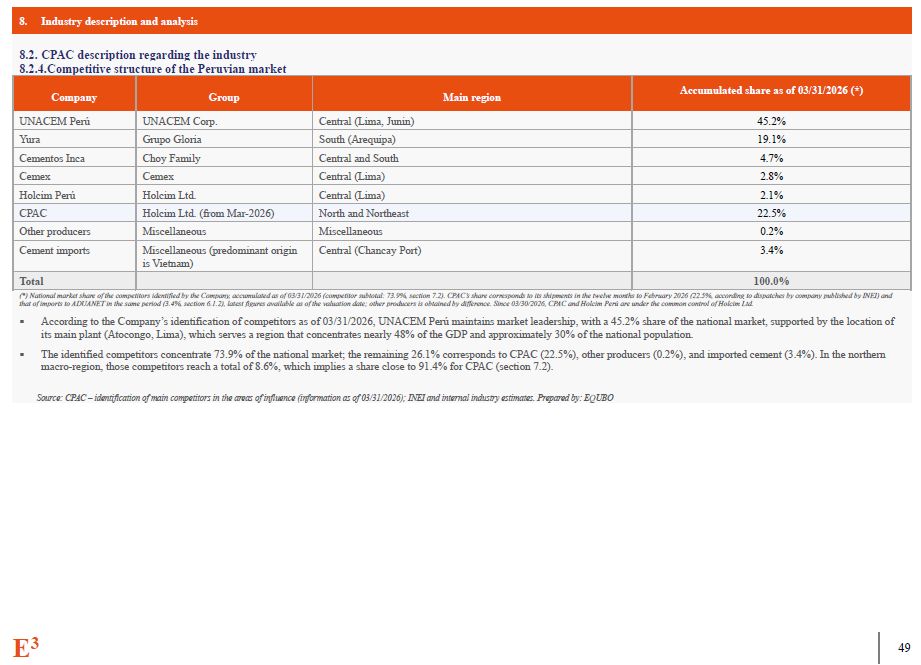
8. Industry description and analysis 8.2. CPAC description regarding the
industry 8.2.4.Competitive structure of the Peruvian market Company Group Main region Accumulated share as of 03/31/2026 (*) UNACEM Perú UNACEM Corp. Central (Lima, Junin) 45.2% Yura Grupo Gloria South (Arequipa) 19.1% Cementos
Inca Choy Family Central and South 4.7% Cemex Cemex Central (Lima) 2.8% Holcim Perú Holcim Ltd. Central (Lima) 2.1% CPAC Holcim Ltd. (from Mar-2026) North and Northeast 22.5% Other
producers Miscellaneous Miscellaneous 0.2% Cement imports Miscellaneous (predominant origin is Vietnam) Central (Chancay Port) 3.4% Total 100.0% (*) National market share of the competitors identified by the Company, accumulated as
of 03/31/2026 (competitor subtotal: 73.9%, section 7.2). CPAC’s share corresponds to its shipments in the twelve months to February 2026 (22.5%, according to dispatches by company published by INEI) and that of imports to ADUANET in the same
period (3.4%, section 6.1.2), latest figures available as of the valuation date; other producers is obtained by difference. Since 03/30/2026, CPAC and Holcim Perú are under the common control of Holcim Ltd. According to the Company’s
identification of competitors as of 03/31/2026, UNACEM Perú maintains market leadership, with a 45.2% share of the national market, supported by the location of its main plant (Atocongo, Lima), which serves a region that concentrates nearly
48% of the GDP and approximately 30% of the national population. The identified competitors concentrate 73.9% of the national market; the remaining 26.1% corresponds to CPAC (22.5%), other producers (0.2%), and imported cement (3.4%). In the
northern macro-region, those competitors reach a total of 8.6%, which implies a share close to 91.4% for CPAC (section 7.2). Source: CPAC – identification of main competitors in the areas of influence (information as of 03/31/2026); INEI and
internal industry estimates. Prepared by: EQUBO E3 44
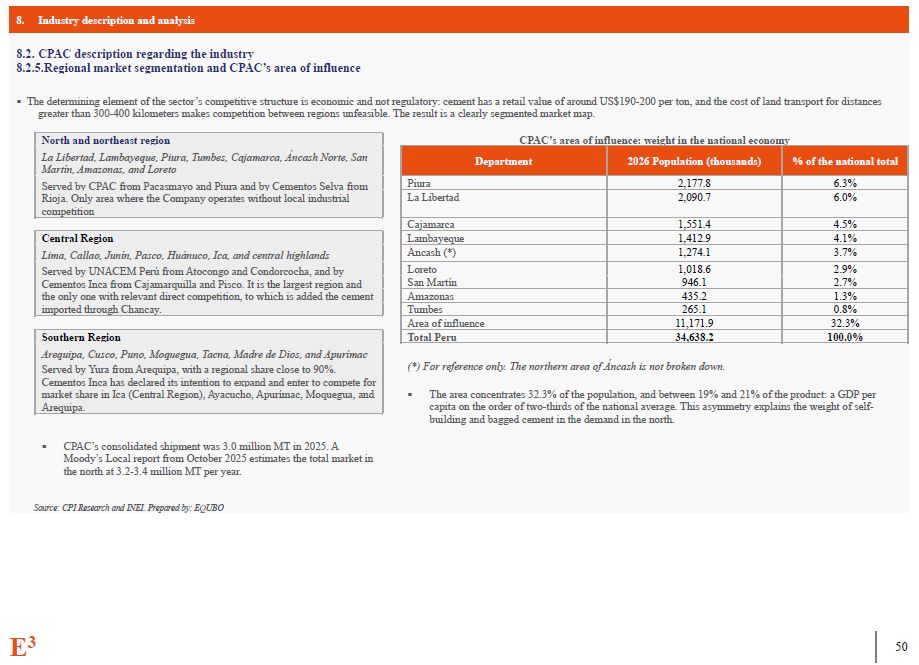
8. Industry description and analysis CPAC description regarding the
industry Regional market segmentation and CPAC’s area of influence The determining element of the sector’s competitive structure is economic and not regulatory: cement has a retail value of around US$190-200 per ton, and the cost of land
transport for distances greater than 300-400 kilometers makes competition between regions unfeasible. The result is a clearly segmented market map. North and northeast region CPAC’s area of influence: weight in the national economy La
Libertad, Lambayeque, Piura, Tumbes, Cajamarca, Áncash Norte, San Martín, Amazonas, and Loreto Served by CPAC from Pacasmayo and Piura and by Cementos Selva from Rioja. Only area where the Company operates without local industrial
competition Department 2026 Population (thousands) % of the national total Piura 2,177.8 6.3% La Libertad 2,090.7 6.0% Central Region Lima, Callao, Junín, Pasco, Huánuco, Ica, and central highlands Served by UNACEM Perú from
Atocongo and Condorcocha, and by Cementos Inca from Cajamarquilla and Pisco. It is the largest region and the only one with relevant direct competition, to which is added the cement imported through
Chancay. Cajamarca 1,551.4 4.5% Lambayeque 1,412.9 4.1% Áncash (*) 1,274.1 3.7% Loreto 1,018.6 2.9% San Martín 946.1 2.7% Amazonas 435.2 1.3% Tumbes 265.1 0.8% Area of influence 11,171.9 32.3% Southern Region Total
Peru 34,638.2 100.0% Arequipa, Cusco, Puno, Moquegua, Tacna, Madre de Dios, and Apurímac Served by Yura from Arequipa, with a regional share close to 90%. Cementos Inca has declared its intention to expand and enter to compete for market
share in Ica (Central Region), Ayacucho, Apurímac, Moquegua, and Arequipa. (*) For reference only. The northern area of Áncash is not broken down. The area concentrates 32.3% of the population, and between 19% and 21% of the product: a GDP
per capita on the order of two-thirds of the national average. This asymmetry explains the weight of self- building and bagged cement in the demand in the north. CPAC’s consolidated shipment was 3.0 million MT in 2025. A Moody’s Local
report from October 2025 estimates the total market in the north at 3.2-3.4 million MT per year. Source: CPI Research and INEI. Prepared by: EQUBO E3 44
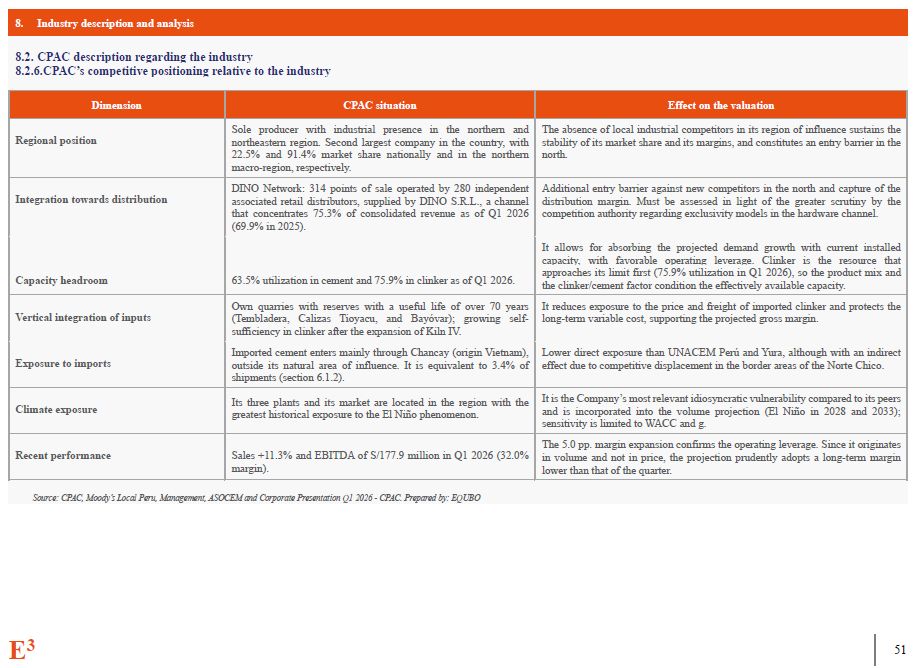
8. Industry description and analysis 8.2. CPAC description regarding the
industry 8.2.6.CPAC’s competitive positioning relative to the industry Dimension CPAC situation Effect on the valuation Regional position Sole producer with industrial presence in the northern and northeastern region. Second largest
company in the country, with 22.5% and 91.4% market share nationally and in the northern macro-region, respectively. The absence of local industrial competitors in its region of influence sustains the stability of its market share and its
margins, and constitutes an entry barrier in the north. Integration towards distribution DINO Network: 314 points of sale operated by 280 independent associated retail distributors, supplied by DINO S.R.L., a channel that concentrates 75.3%
of consolidated revenue as of Q1 2026 (69.9% in 2025). Additional entry barrier against new competitors in the north and capture of the distribution margin. Must be assessed in light of the greater scrutiny by the competition authority
regarding exclusivity models in the hardware channel. Capacity headroom 63.5% utilization in cement and 75.9% in clinker as of Q1 2026. It allows for absorbing the projected demand growth with current installed capacity, with favorable
operating leverage. Clinker is the resource that approaches its limit first (75.9% utilization in Q1 2026), so the product mix and the clinker/cement factor condition the effectively available capacity. Vertical integration of inputs Own
quarries with reserves with a useful life of over 70 years (Tembladera, Calizas Tioyacu, and Bayóvar); growing self-sufficiency in clinker after the expansion of Kiln IV. It reduces exposure to the price and freight of imported clinker and
protects the long-term variable cost, supporting the projected gross margin. Exposure to imports Imported cement enters mainly through Chancay (origin Vietnam), outside its natural area of influence. It is equivalent to 3.4% of shipments
(section 6.1.2). Lower direct exposure than UNACEM Perú and Yura, although with an indirect effect due to competitive displacement in the border areas of the Norte Chico. Climate exposure Its three plants and its market are located in the
region with the greatest historical exposure to the El Niño phenomenon. It is the Company’s most relevant idiosyncratic vulnerability compared to its peers and is incorporated into the volume projection (El Niño in 2028 and 2033);
sensitivity is limited to WACC and g. Recent performance Sales +11.3% and EBITDA of S/177.9 million in Q1 2026 (32.0% margin). The 5.0 pp. margin expansion confirms the operating leverage. Since it originates in volume and not in price,
the projection prudently adopts a long-term margin lower than that of the quarter. Source: CPAC, Moody’s Local Peru, Management, ASOCEM and Corporate Presentation Q1 2026 - CPAC. Prepared by: EQUBO E3 44
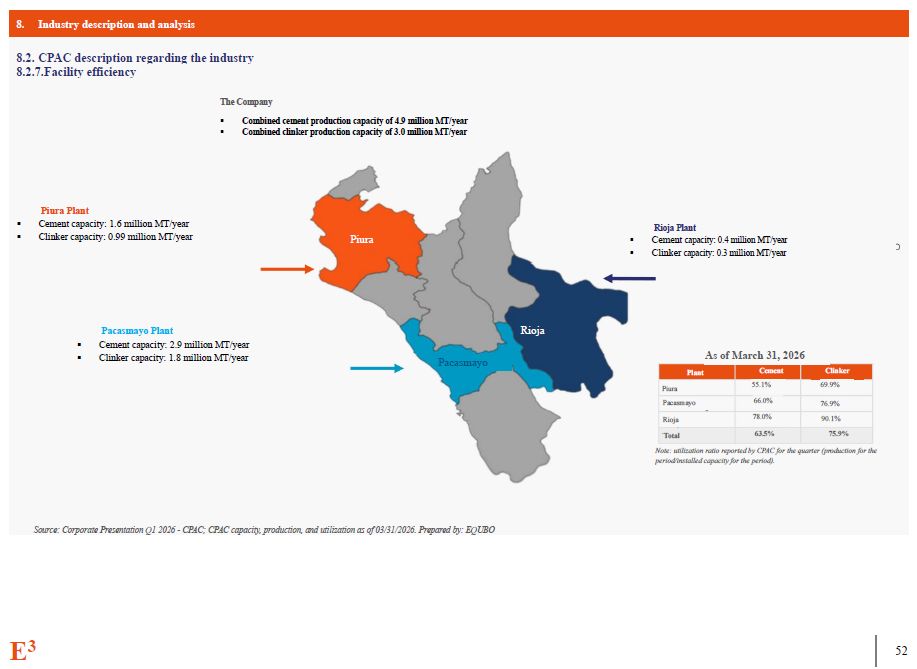
8. Industry description and analysis Source: Corporate Presentation Q1 2026 -
CPAC; CPAC capacity, production, and utilization as of 03/31/2026. Prepared by: EQUBO CPAC description regarding the industry Facility efficiency The Company Combined cement production capacity of 4.9 million MT/year Combined clinker
production capacity of 3.0 million MT/year Piura Plant Cement capacity: 1.6 million MT/year Clinker capacity: 0.99 million MT/year Rioja Plant Cement capacity: 0.4 million MT/year Clinker capacity: 0.3 million MT/year Pacasmayo
Plant Cement capacity: 2.9 million MT/year Clinker capacity: 1.8 million MT/year Piura Pacasmayo Rioja Plant Piura As of March 31,
2026 Cement 55.1% Clinker 69.9% Pacasmayo 66.0% 76.9% Rioja 78.0% 90.1% Total 63.5% 75.9% Note: utilization ratio reported by CPAC for the quarter (production for the period/installed capacity for the period). E3 44
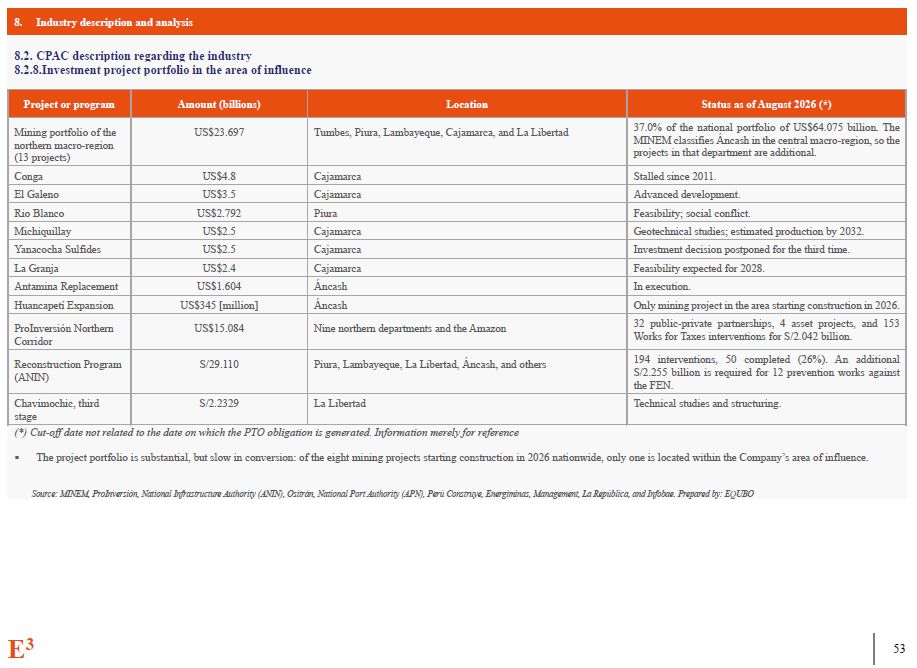
8. Industry description and analysis 8.2. CPAC description regarding the
industry 8.2.8.Investment project portfolio in the area of influence Project or program Amount (billions) Location Status as of August 2026 (*) Mining portfolio of the northern macro-region (13 projects) US$23.697 Tumbes, Piura,
Lambayeque, Cajamarca, and La Libertad 37.0% of the national portfolio of US$64.075 billion. The MINEM classifies Áncash in the central macro-region, so the projects in that department are additional. Conga US$4.8 Cajamarca Stalled since
2011. El Galeno US$3.5 Cajamarca Advanced development. Rio Blanco US$2.792 Piura Feasibility; social conflict. Michiquillay US$2.5 Cajamarca Geotechnical studies; estimated production by 2032. Yanacocha
Sulfides US$2.5 Cajamarca Investment decision postponed for the third time. La Granja US$2.4 Cajamarca Feasibility expected for 2028. Antamina Replacement US$1.604 Áncash In execution. Huancapetí Expansion US$345
[million] Áncash Only mining project in the area starting construction in 2026. ProInversión Northern Corridor US$15.084 Nine northern departments and the Amazon 32 public-private partnerships, 4 asset projects, and 153 Works for Taxes
interventions for S/2.042 billion. Reconstruction Program (ANIN) S/29.110 Piura, Lambayeque, La Libertad, Áncash, and others 194 interventions, 50 completed (26%). An additional S/2.255 billion is required for 12 prevention works against
the FEN. Chavimochic, third stage S/2.2329 La Libertad Technical studies and structuring. (*) Cut-off date not related to the date on which the PTO obligation is generated. Information merely for reference The project portfolio is
substantial, but slow in conversion: of the eight mining projects starting construction in 2026 nationwide, only one is located within the Company’s area of influence. Source: MINEM, ProInversión, National Infrastructure Authority (ANIN),
Ositrán, National Port Authority (APN), Perú Construye, Energiminas, Management, La República, and Infobae. Prepared by: EQUBO E3 44
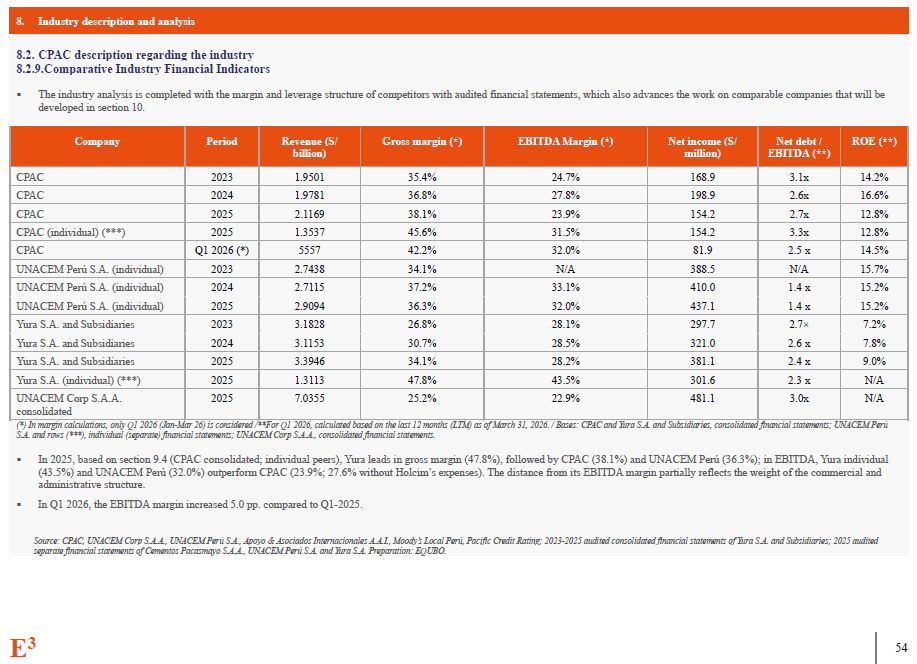
8. Industry description and analysis 8.2. CPAC description regarding the
industry 8.2.9.Comparative Industry Financial Indicators The industry analysis is completed with the margin and leverage structure of competitors with audited financial statements, which also advances the work on comparable companies that
will be developed in section 10. Company Period Revenue (S/ billion) Gross margin (*) EBITDA Margin (*) Net income (S/ million) Net debt / EBITDA (**) ROE
(**) CPAC 2023 1.9501 35.4% 24.7% 168.9 3.1x 14.2% CPAC 2024 1.9781 36.8% 27.8% 198.9 2.6x 16.6% CPAC 2025 2.1169 38.1% 23.9% 154.2 2.7x 12.8% CPAC (individual)
(***) 2025 1.3537 45.6% 31.5% 154.2 3.3x 12.8% CPAC Q1 2026 (*) 5557 42.2% 32.0% 81.9 2.5 x 14.5% UNACEM Perú S.A. (individual) 2023 2.7438 34.1% N/A 388.5 N/A 15.7% UNACEM Perú S.A.
(individual) 2024 2.7115 37.2% 33.1% 410.0 1.4 x 15.2% UNACEM Perú S.A. (individual) 2025 2.9094 36.3% 32.0% 437.1 1.4 x 15.2% Yura S.A. and Subsidiaries 2023 3.1828 26.8% 28.1% 297.7 2.7× 7.2% Yura S.A. and
Subsidiaries 2024 3.1153 30.7% 28.5% 321.0 2.6 x 7.8% Yura S.A. and Subsidiaries 2025 3.3946 34.1% 28.2% 381.1 2.4 x 9.0% Yura S.A. (individual) (***) 2025 1.3113 47.8% 43.5% 301.6 2.3 x N/A UNACEM Corp
S.A.A. consolidated 2025 7.0355 25.2% 22.9% 481.1 3.0x N/A (*) In margin calculations, only Q1 2026 (Jan-Mar 26) is considered /**For Q1 2026, calculated based on the last 12 months (LTM) as of March 31, 2026. / Bases: CPAC and Yura
S.A. and Subsidiaries, consolidated financial statements; UNACEM Perú S.A. and rows (***), individual (separate) financial statements; UNACEM Corp S.A.A., consolidated financial statements. In 2025, based on section 9.4 (CPAC consolidated;
individual peers), Yura leads in gross margin (47.8%), followed by CPAC (38.1%) and UNACEM Perú (36.3%); in EBITDA, Yura individual (43.5%) and UNACEM Perú (32.0%) outperform CPAC (23.9%; 27.6% without Holcim’s expenses). The distance from
its EBITDA margin partially reflects the weight of the commercial and administrative structure. In Q1 2026, the EBITDA margin increased 5.0 pp. compared to Q1-2025. Source: CPAC, UNACEM Corp S.A.A., UNACEM Perú S.A., Apoyo & Asociados
Internacionales A.A.I., Moody’s Local Perú, Pacific Credit Rating; 2023-2025 audited consolidated financial statements of Yura S.A. and Subsidiaries; 2025 audited separate financial statements of Cementos Pacasmayo S.A.A., UNACEM Perú S.A.
and Yura S.A. Preparation: EQUBO. E3 44
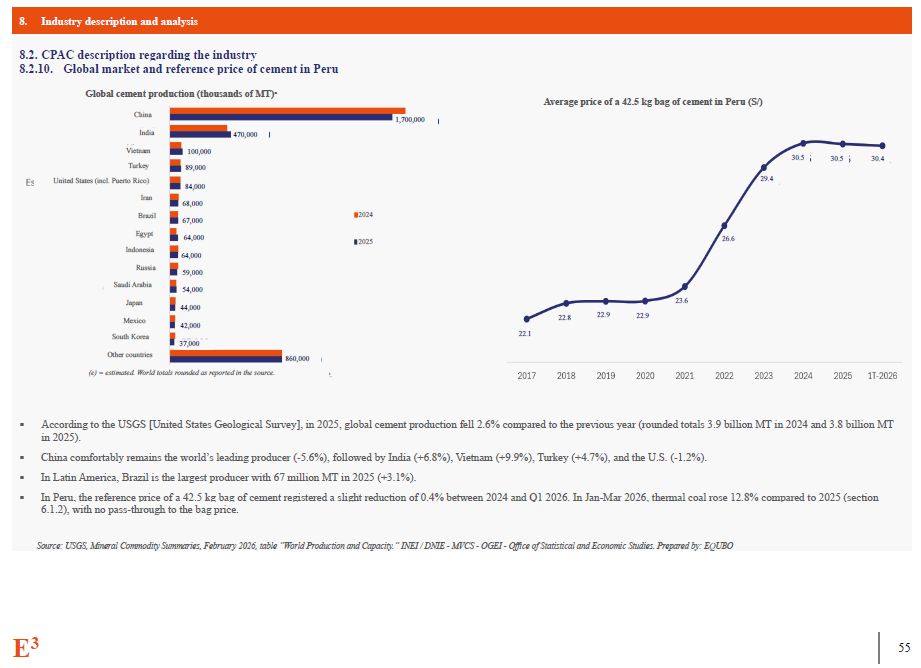
8. Industry description and analysis 8.2. CPAC description regarding the
industry 8.2.10. Global market and reference price of cement in Peru According to the USGS [United States Geological Survey], in 2025, global cement production fell 2.6% compared to the previous year (rounded totals 3.9 billion MT in 2024
and 3.8 billion MT in 2025). China comfortably remains the world’s leading producer (-5.6%), followed by India (+6.8%), Vietnam (+9.9%), Turkey (+4.7%), and the U.S. (-1.2%). In Latin America, Brazil is the largest producer with 67 million
MT in 2025 (+3.1%). In Peru, the reference price of a 42.5 kg bag of cement registered a slight reduction of 0.4% between 2024 and Q1 2026. In Jan-Mar 2026, thermal coal rose 12.8% compared to 2025 (section 6.1.2), with no pass-through to
the bag price. Source: USGS, Mineral Commodity Summaries, February 2026, table “World Production and Capacity.” INEI / DNIE - MVCS - OGEI - Office of Statistical and Economic Studies. Prepared by: EQUBO Global cement production (thousands
of MT)ᵉ China India Vietnam Turkey United States (incl. Puerto Rico) Iran Brazil Egypt Indonesia Russia Saudi Arabia Japan Mexico South Korea Other countries (e) = estimated. World totals rounded as reported in the
source. 470,000 1,700,000 100,000 89,000 84,000 68,000 67,000 64,000 64,000 59,000 54,000 44,000 42,000 37,000 860,000 2024 2025 Average price of a 42.5 kg bag of cement in Peru
(S/) 30.4 30.5 30.5 29.4 26.6 23.6 22.9 22.9 22.8 22.1 E3 44
09 Financial analysis of CPAC
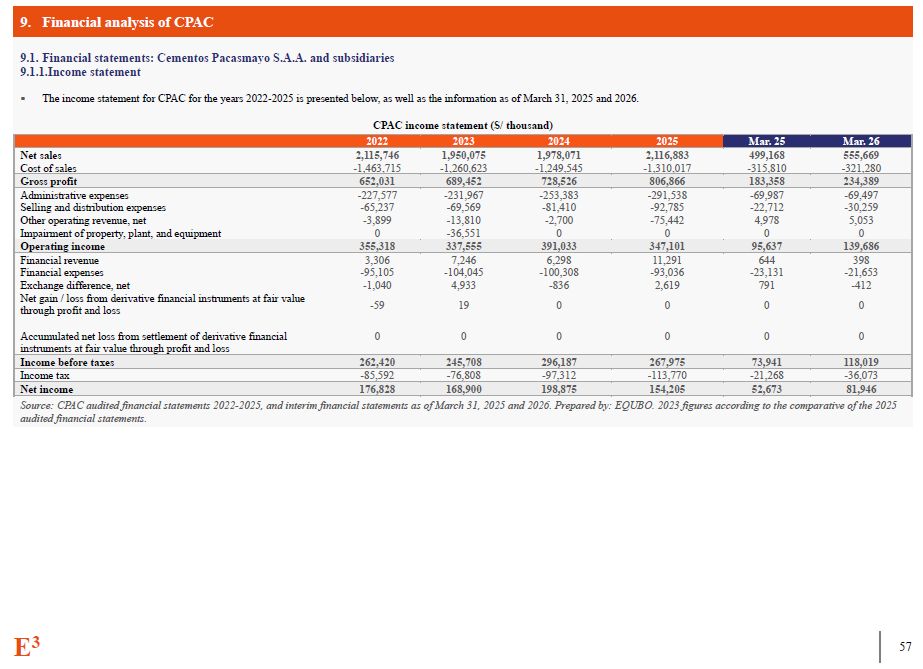
9. Financial analysis of CPAC Financial statements: Cementos Pacasmayo S.A.A.
and subsidiaries Income statement The income statement for CPAC for the years 2022-2025 is presented below, as well as the information as of March 31, 2025 and 2026. CPAC income statement (S/ thousand) 2022 2023 2024 2025 Mar.
25 Mar. 26 Net sales 2,115,746 1,950,075 1,978,071 2,116,883 499,168 555,669 Cost of sales -1,463,715 -1,260,623 -1,249,545 -1,310,017 -315,810 -321,280 Gross
profit 652,031 689,452 728,526 806,866 183,358 234,389 Administrative expenses -227,577 -231,967 -253,383 -291,538 -69,987 -69,497 Selling and distribution expenses -65,237 -69,569 -81,410 -92,785 -22,712 -30,259 Other
operating revenue, net -3,899 -13,810 -2,700 -75,442 4,978 5,053 Impairment of property, plant, and equipment 0 -36,551 0 0 0 0 Operating income 355,318 337,555 391,033 347,101 95,637 139,686 Financial
revenue 3,306 7,246 6,298 11,291 644 398 Financial expenses -95,105 -104,045 -100,308 -93,036 -23,131 -21,653 Exchange difference, net -1,040 4,933 -836 2,619 791 -412 Net gain / loss from derivative financial instruments
at fair value through profit and loss -59 19 0 0 0 0 Accumulated net loss from settlement of derivative financial 0 0 0 0 0 0 instruments at fair value through profit and loss Income before
taxes 262,420 245,708 296,187 267,975 73,941 118,019 Income tax -85,592 -76,808 -97,312 -113,770 -21,268 -36,073 Net income 176,828 168,900 198,875 154,205 52,673 81,946 Source: CPAC audited financial statements
2022-2025, and interim financial statements as of March 31, 2025 and 2026. Prepared by: EQUBO. 2023 figures according to the comparative of the 2025 audited financial statements. E3 100
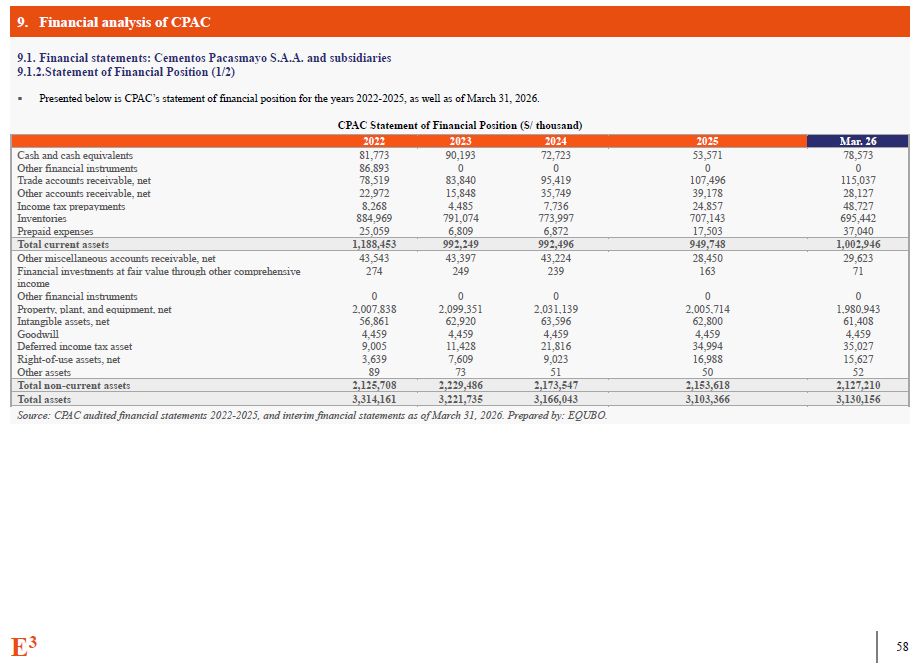
9. Financial analysis of CPAC Financial statements: Cementos Pacasmayo S.A.A.
and subsidiaries Statement of Financial Position (1/2) Presented below is CPAC’s statement of financial position for the years 2022-2025, as well as of March 31, 2026. CPAC Statement of Financial Position (S/
thousand) 2022 2023 2024 2025 Mar. 26 Cash and cash equivalents 81,773 90,193 72,723 53,571 78,573 Other financial instruments 86,893 0 0 0 0 Trade accounts receivable, net 78,519 83,840 95,419 107,496 115,037 Other
accounts receivable, net 22,972 15,848 35,749 39,178 28,127 Income tax prepayments 8,268 4,485 7,736 24,857 48,727 Inventories 884,969 791,074 773,997 707,143 695,442 Prepaid
expenses 25,059 6,809 6,872 17,503 37,040 Total current assets 1,188,453 992,249 992,496 949,748 1,002,946 Other miscellaneous accounts receivable, net 43,543 43,397 43,224 28,450 29,623 Financial investments at fair value
through other comprehensive 274 249 239 163 71 income Other financial instruments 0 0 0 0 0 Property, plant, and equipment, net 2,007,838 2,099,351 2,031,139 2,005,714 1,980,943 Intangible assets,
net 56,861 62,920 63,596 62,800 61,408 Goodwill 4,459 4,459 4,459 4,459 4,459 Deferred income tax asset 9,005 11,428 21,816 34,994 35,027 Right-of-use assets, net 3,639 7,609 9,023 16,988 15,627 Other
assets 89 73 51 50 52 Total non-current assets 2,125,708 2,229,486 2,173,547 2,153,618 2,127,210 Total assets 3,314,161 3,221,735 3,166,043 3,103,366 3,130,156 Source: CPAC audited financial statements 2022-2025, and interim
financial statements as of March 31, 2026. Prepared by: EQUBO. E3 100
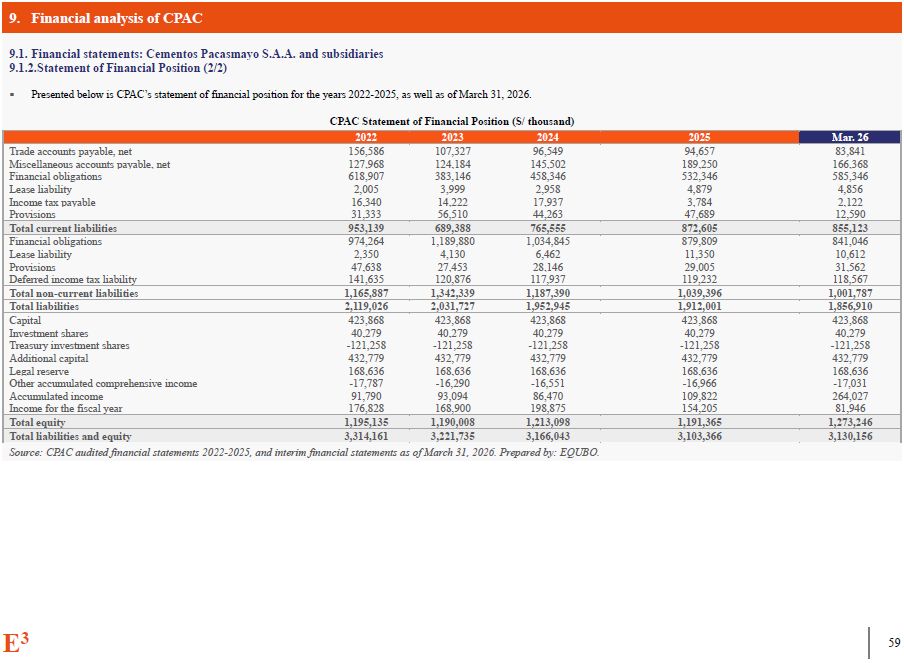
9. Financial analysis of CPAC Financial statements: Cementos Pacasmayo S.A.A.
and subsidiaries Statement of Financial Position (2/2) Presented below is CPAC’s statement of financial position for the years 2022-2025, as well as of March 31, 2026. CPAC Statement of Financial Position (S/
thousand) 2022 2023 2024 2025 Mar. 26 Trade accounts payable, net 156,586 107,327 96,549 94,657 83,841 Miscellaneous accounts payable, net 127,968 124,184 145,502 189,250 166,368 Financial
obligations 618,907 383,146 458,346 532,346 585,346 Lease liability 2,005 3,999 2,958 4,879 4,856 Income tax payable 16,340 14,222 17,937 3,784 2,122 Provisions 31,333 56,510 44,263 47,689 12,590 Total current
liabilities 953,139 689,388 765,555 872,605 855,123 Financial obligations 974,264 1,189,880 1,034,845 879,809 841,046 Lease
liability 2,350 4,130 6,462 11,350 10,612 Provisions 47,638 27,453 28,146 29,005 31,562 Deferred income tax liability 141,635 120,876 117,937 119,232 118,567 Total non-current
liabilities 1,165,887 1,342,339 1,187,390 1,039,396 1,001,787 Total liabilities 2,119,026 2,031,727 1,952,945 1,912,001 1,856,910 Capital 423,868 423,868 423,868 423,868 423,868 Investment
shares 40,279 40,279 40,279 40,279 40,279 Treasury investment shares -121,258 -121,258 -121,258 -121,258 -121,258 Additional capital 432,779 432,779 432,779 432,779 432,779 Legal
reserve 168,636 168,636 168,636 168,636 168,636 Other accumulated comprehensive income -17,787 -16,290 -16,551 -16,966 -17,031 Accumulated income 91,790 93,094 86,470 109,822 264,027 Income for the fiscal
year 176,828 168,900 198,875 154,205 81,946 Total equity 1,195,135 1,190,008 1,213,098 1,191,365 1,273,246 Total liabilities and equity 3,314,161 3,221,735 3,166,043 3,103,366 3,130,156 Source: CPAC audited financial
statements 2022-2025, and interim financial statements as of March 31, 2026. Prepared by: EQUBO. E3 100
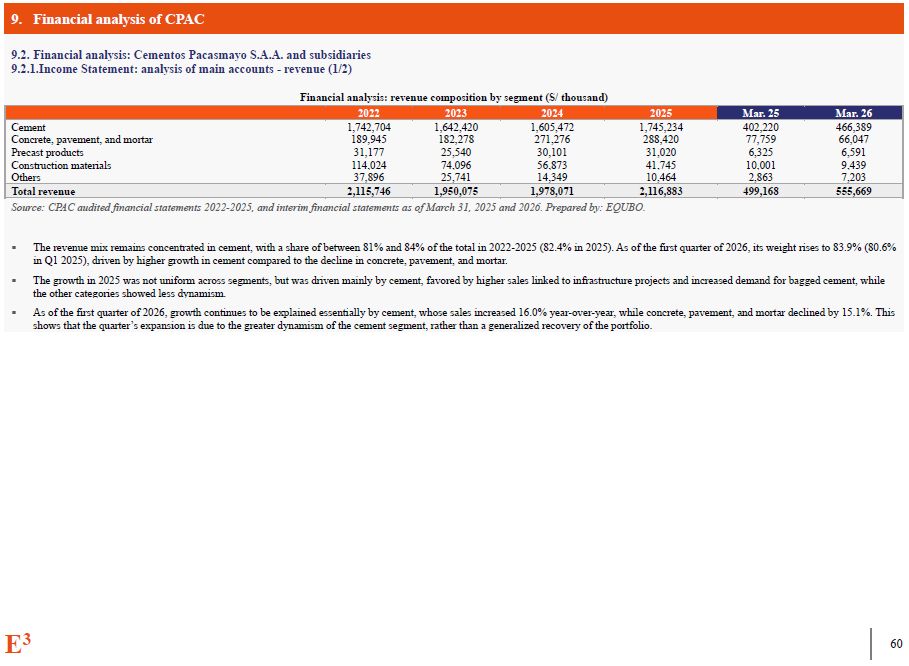
9. Financial analysis of CPAC Financial analysis: Cementos Pacasmayo S.A.A.
and subsidiaries Income Statement: analysis of main accounts - revenue (1/2) Financial analysis: revenue composition by segment (S/ thousand) 2022 2023 2024 2025 Mar. 25 Mar.
26 Cement 1,742,704 1,642,420 1,605,472 1,745,234 402,220 466,389 Concrete, pavement, and mortar 189,945 182,278 271,276 288,420 77,759 66,047 Precast products 31,177 25,540 30,101 31,020 6,325 6,591 Construction
materials 114,024 74,096 56,873 41,745 10,001 9,439 Others 37,896 25,741 14,349 10,464 2,863 7,203 Total revenue 2,115,746 1,950,075 1,978,071 2,116,883 499,168 555,669 Source: CPAC audited financial statements
2022-2025, and interim financial statements as of March 31, 2025 and 2026. Prepared by: EQUBO. The revenue mix remains concentrated in cement, with a share of between 81% and 84% of the total in 2022-2025 (82.4% in 2025). As of the first
quarter of 2026, its weight rises to 83.9% (80.6% in Q1 2025), driven by higher growth in cement compared to the decline in concrete, pavement, and mortar. The growth in 2025 was not uniform across segments, but was driven mainly by
cement, favored by higher sales linked to infrastructure projects and increased demand for bagged cement, while the other categories showed less dynamism. As of the first quarter of 2026, growth continues to be explained essentially by
cement, whose sales increased 16.0% year-over-year, while concrete, pavement, and mortar declined by 15.1%. This shows that the quarter’s expansion is due to the greater dynamism of the cement segment, rather than a generalized recovery of
the portfolio. E3 100
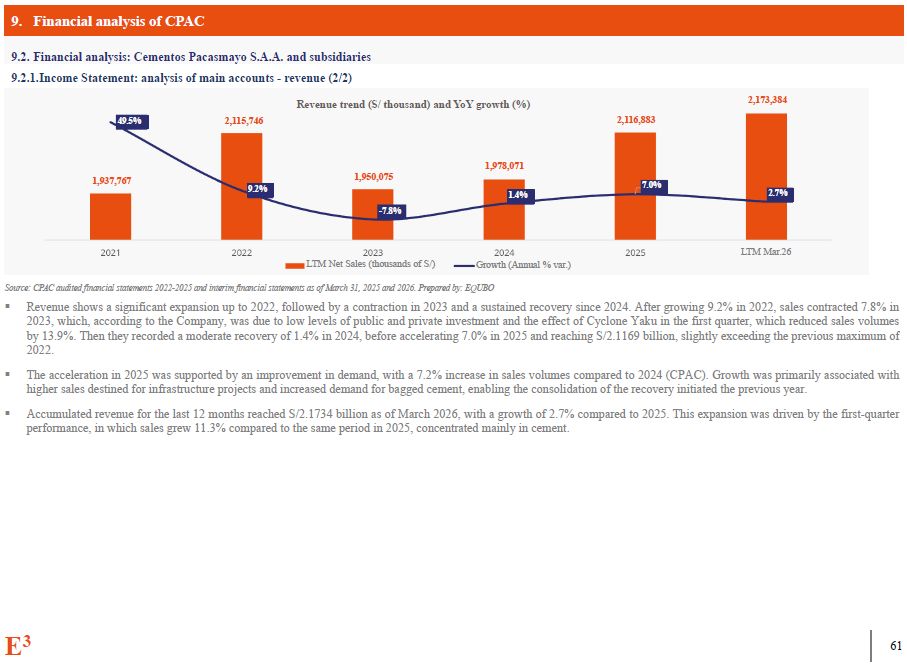
9. Financial analysis of CPAC 9.2. Financial analysis: Cementos Pacasmayo
S.A.A. and subsidiaries 9.2.1.Income Statement: analysis of main accounts - revenue (2/2) Revenue trend (S/ thousand) and YoY growth
(%) 49.5% 9.2% -7.8% 1.4% 7.0% 2.7% 1,937,767 2,115,746 1,950,075 1,978,071 2,116,883 2,173,384 LTM Mar.26 LTM Net Sales (thousands of S/) Growth (Annual % var.) Source: CPAC audited financial statements 2022-2025 and interim
financial statements as of March 31, 2025 and 2026. Prepared by: EQUBO Revenue shows a significant expansion up to 2022, followed by a contraction in 2023 and a sustained recovery since 2024. After growing 9.2% in 2022, sales contracted
7.8% in 2023, which, according to the Company, was due to low levels of public and private investment and the effect of Cyclone Yaku in the first quarter, which reduced sales volumes by 13.9%. Then they recorded a moderate recovery of 1.4%
in 2024, before accelerating 7.0% in 2025 and reaching S/2.1169 billion, slightly exceeding the previous maximum of 2022. The acceleration in 2025 was supported by an improvement in demand, with a 7.2% increase in sales volumes compared to
2024 (CPAC). Growth was primarily associated with higher sales destined for infrastructure projects and increased demand for bagged cement, enabling the consolidation of the recovery initiated the previous year. Accumulated revenue for the
last 12 months reached S/2.1734 billion as of March 2026, with a growth of 2.7% compared to 2025. This expansion was driven by the first-quarter performance, in which sales grew 11.3% compared to the same period in 2025, concentrated mainly
in cement. E3 100
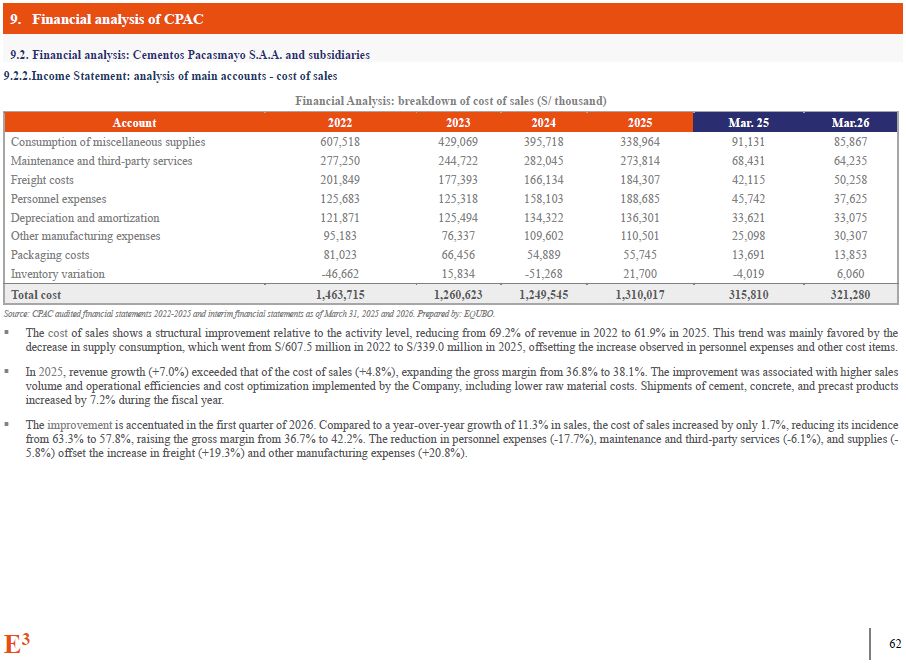
9. Financial analysis of CPAC 9.2. Financial analysis: Cementos Pacasmayo
S.A.A. and subsidiaries E3 100 9.2.2.Income Statement: analysis of main accounts - cost of sales Financial Analysis: breakdown of cost of sales (S/ thousand) Account 2022 2023 2024 2025 Mar. 25 Mar.26 Consumption of
miscellaneous supplies 607,518 429,069 395,718 338,964 91,131 85,867 Maintenance and third-party services 277,250 244,722 282,045 273,814 68,431 64,235 Freight
costs 201,849 177,393 166,134 184,307 42,115 50,258 Personnel expenses 125,683 125,318 158,103 188,685 45,742 37,625 Depreciation and amortization 121,871 125,494 134,322 136,301 33,621 33,075 Other manufacturing
expenses 95,183 76,337 109,602 110,501 25,098 30,307 Packaging costs 81,023 66,456 54,889 55,745 13,691 13,853 Inventory variation -46,662 15,834 -51,268 21,700 -4,019 6,060 Total
cost 1,463,715 1,260,623 1,249,545 1,310,017 315,810 321,280 Source: CPAC audited financial statements 2022-2025 and interim financial statements as of March 31, 2025 and 2026. Prepared by: EQUBO. The cost of sales shows a
structural improvement relative to the activity level, reducing from 69.2% of revenue in 2022 to 61.9% in 2025. This trend was mainly favored by the decrease in supply consumption, which went from S/607.5 million in 2022 to S/339.0 million
in 2025, offsetting the increase observed in personnel expenses and other cost items. In 2025, revenue growth (+7.0%) exceeded that of the cost of sales (+4.8%), expanding the gross margin from 36.8% to 38.1%. The improvement was
associated with higher sales volume and operational efficiencies and cost optimization implemented by the Company, including lower raw material costs. Shipments of cement, concrete, and precast products increased by 7.2% during the fiscal
year. The improvement is accentuated in the first quarter of 2026. Compared to a year-over-year growth of 11.3% in sales, the cost of sales increased by only 1.7%, reducing its incidence from 63.3% to 57.8%, raising the gross margin from
36.7% to 42.2%. The reduction in personnel expenses (-17.7%), maintenance and third-party services (-6.1%), and supplies (- 5.8%) offset the increase in freight (+19.3%) and other manufacturing expenses (+20.8%).
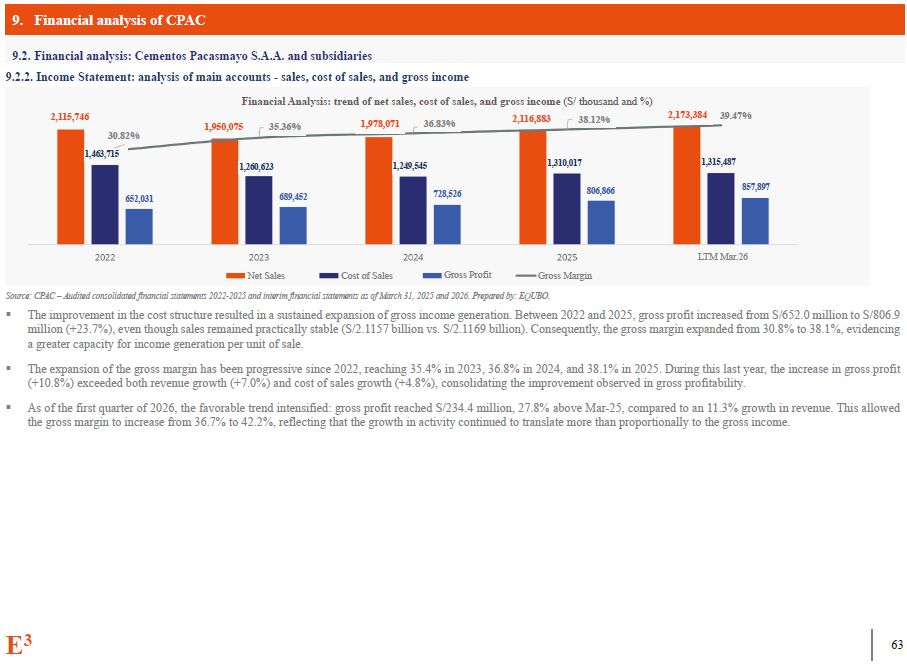
9. Financial analysis of CPAC 9.2. Financial analysis: Cementos Pacasmayo
S.A.A. and subsidiaries 9.2.2. Income Statement: analysis of main accounts - sales, cost of sales, and gross income 30.82% 1,463,715 2,115,746 1,950,075 Financial Analysis: trend of net sales, cost of sales, and gross income (S/
thousand and %) 2,116,883 2,173,384 LTM Mar.26 Net Sales Cost of Sales Gross Profit Gross Margin Source: CPAC – Audited consolidated financial statements 2022-2025 and interim financial statements as of March 31, 2025 and 2026.
Prepared by: EQUBO. The improvement in the cost structure resulted in a sustained expansion of gross income generation. Between 2022 and 2025, gross profit increased from S/652.0 million to S/806.9 million (+23.7%), even though sales
remained practically stable (S/2.1157 billion vs. S/2.1169 billion). Consequently, the gross margin expanded from 30.8% to 38.1%, evidencing a greater capacity for income generation per unit of sale. The expansion of the gross margin has
been progressive since 2022, reaching 35.4% in 2023, 36.8% in 2024, and 38.1% in 2025. During this last year, the increase in gross profit (+10.8%) exceeded both revenue growth (+7.0%) and cost of sales growth (+4.8%), consolidating the
improvement observed in gross profitability. As of the first quarter of 2026, the favorable trend intensified: gross profit reached S/234.4 million, 27.8% above Mar-25, compared to an 11.3% growth in revenue. This allowed the gross margin
to increase from 36.7% to 42.2%, reflecting that the growth in activity continued to translate more than proportionally to the gross income. 1,260,623 1,249,545 1,310,017 1,315,487 652,031 689,452 728,526 857,897 35.36% 1,978,071
36.83% 38.12% 39.47% 806,866 E3 100
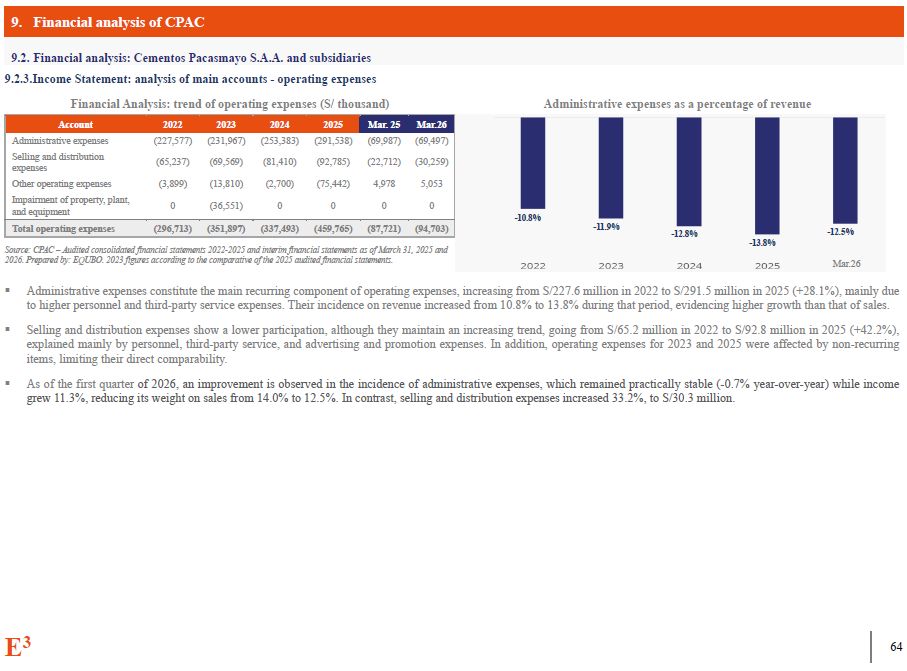
9. Financial analysis of CPAC 9.2. Financial analysis: Cementos Pacasmayo
S.A.A. and subsidiaries 9.2.3.Income Statement: analysis of main accounts - operating expenses Financial Analysis: trend of operating expenses (S/ thousand) Administrative expenses as a percentage of
revenue Account 2022 2023 2024 2025 Mar. 25 Mar.26 Administrative expenses (227,577) (231,967) (253,383) (291,538) (69,987) (69,497) Selling and distribution
expenses (65,237) (69,569) (81,410) (92,785) (22,712) (30,259) Other operating expenses (3,899) (13,810) (2,700) (75,442) 4,978 5,053 Impairment of property, plant, and equipment 0 (36,551) 0 0 0 0 Total operating
expenses (296,713) (351,897) (337,493) (459,765) (87,721) (94,703) Source: CPAC – Audited consolidated financial statements 2022-2025 and interim financial statements as of March 31, 2025 and 2026. Prepared by: EQUBO. 2023 figures
according to the comparative of the 2025 audited financial statements. Administrative expenses constitute the main recurring component of operating expenses, increasing from S/227.6 million in 2022 to S/291.5 million in 2025 (+28.1%),
mainly due to higher personnel and third-party service expenses. Their incidence on revenue increased from 10.8% to 13.8% during that period, evidencing higher growth than that of sales. Selling and distribution expenses show a lower
participation, although they maintain an increasing trend, going from S/65.2 million in 2022 to S/92.8 million in 2025 (+42.2%), explained mainly by personnel, third-party service, and advertising and promotion expenses. In addition,
operating expenses for 2023 and 2025 were affected by non-recurring items, limiting their direct comparability. As of the first quarter of 2026, an improvement is observed in the incidence of administrative expenses, which remained
practically stable (-0.7% year-over-year) while income grew 11.3%, reducing its weight on sales from 14.0% to 12.5%. In contrast, selling and distribution expenses increased 33.2%, to S/30.3
million. -10.8% Mar.26 -11.9% -12.8% -13.8% -12.5% E3 100
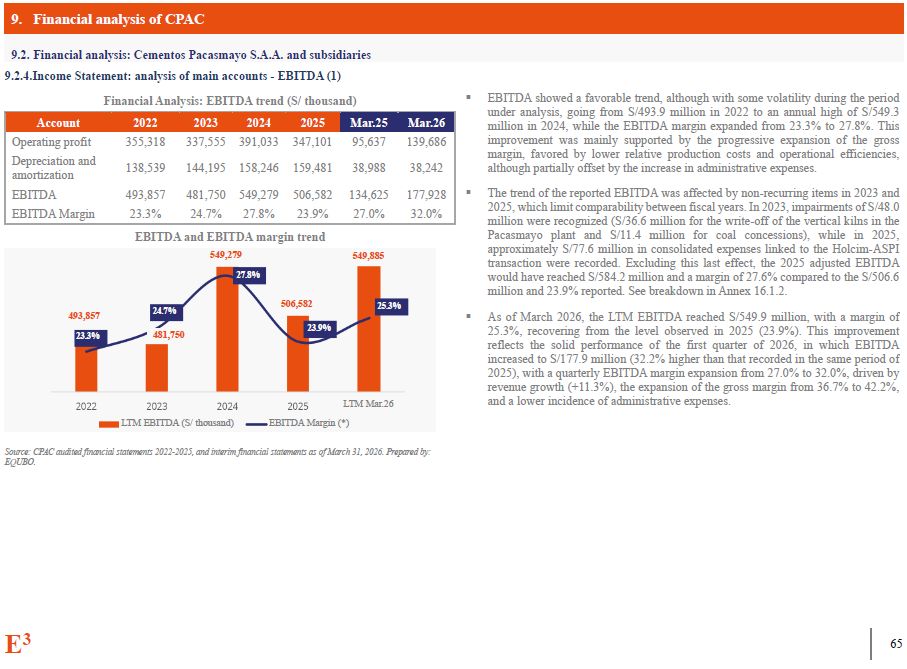
9. Financial analysis of CPAC 9.2. Financial analysis: Cementos Pacasmayo
S.A.A. and subsidiaries 9.2.4.Income Statement: analysis of main accounts - EBITDA (1) Financial Analysis: EBITDA trend (S/ thousand) EBITDA showed a favorable trend, although with some volatility during the period under analysis, going
from S/493.9 million in 2022 to an annual high of S/549.3 million in 2024, while the EBITDA margin expanded from 23.3% to 27.8%. This improvement was mainly supported by the progressive expansion of the gross margin, favored by lower
relative production costs and operational efficiencies, although partially offset by the increase in administrative expenses. The trend of the reported EBITDA was affected by non-recurring items in 2023 and 2025, which limit comparability
between fiscal years. In 2023, impairments of S/48.0 million were recognized (S/36.6 million for the write-off of the vertical kilns in the Pacasmayo plant and S/11.4 million for coal concessions), while in 2025, approximately S/77.6
million in consolidated expenses linked to the Holcim-ASPI transaction were recorded. Excluding this last effect, the 2025 adjusted EBITDA would have reached S/584.2 million and a margin of 27.6% compared to the S/506.6 million and 23.9%
reported. See breakdown in Annex 16.1.2. As of March 2026, the LTM EBITDA reached S/549.9 million, with a margin of 25.3%, recovering from the level observed in 2025 (23.9%). This improvement reflects the solid performance of the first
quarter of 2026, in which EBITDA increased to S/177.9 million (32.2% higher than that recorded in the same period of 2025), with a quarterly EBITDA margin expansion from 27.0% to 32.0%, driven by revenue growth (+11.3%), the expansion of
the gross margin from 36.7% to 42.2%, and a lower incidence of administrative expenses. Account 2022 2023 2024 2025 Mar.25 Mar.26 Operating profit 355,318 337,555 391,033 347,101 95,637 139,686 Depreciation and
amortization 138,539 144,195 158,246 159,481 38,988 38,242 EBITDA 493,857 481,750 549,279 506,582 134,625 177,928 EBITDA Margin 23.3% 24.7% 27.8% 23.9% 27.0% 32.0% Source: CPAC audited financial statements 2022-2025,
and interim financial statements as of March 31, 2026. Prepared by: EQUBO. 24.7% 23.9% 25.3% 493,857 23.3% 506,582 481,750 EBITDA and EBITDA margin trend 549,279 27.8% 549,885 LTM Mar.26 EBITDA Margin (*) LTM EBITDA (S/
thousand) E3 100
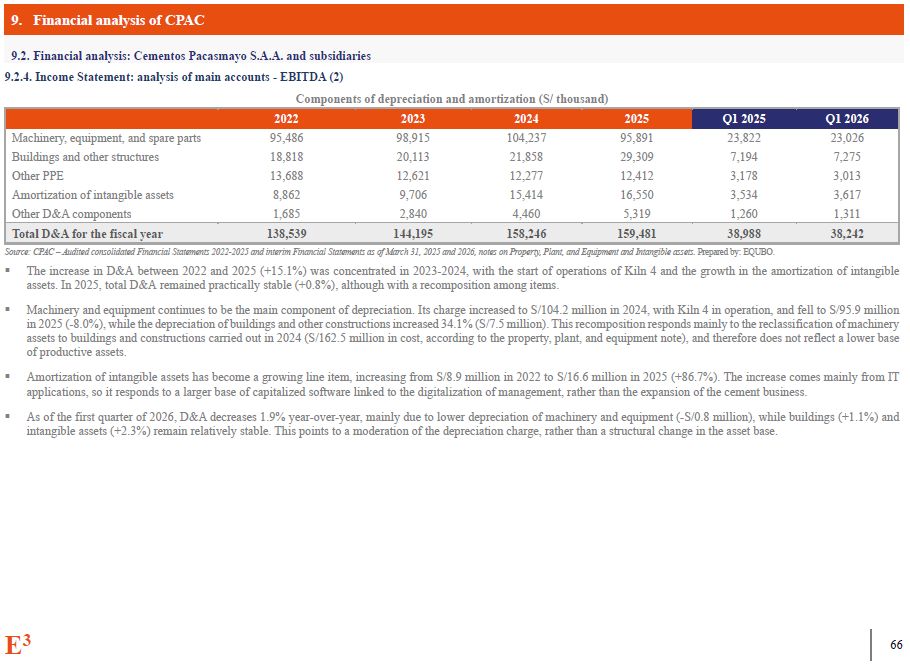
9. Financial analysis of CPAC 9.2. Financial analysis: Cementos Pacasmayo
S.A.A. and subsidiaries E3 100 9.2.4. Income Statement: analysis of main accounts - EBITDA (2) Components of depreciation and amortization (S/ thousand) 2022 2023 2024 2025 Q1 2025 Q1 2026 Machinery, equipment, and spare
parts 95,486 98,915 104,237 95,891 23,822 23,026 Buildings and other structures 18,818 20,113 21,858 29,309 7,194 7,275 Other PPE 13,688 12,621 12,277 12,412 3,178 3,013 Amortization of intangible
assets 8,862 9,706 15,414 16,550 3,534 3,617 Other D&A components 1,685 2,840 4,460 5,319 1,260 1,311 Total D&A for the fiscal year 138,539 144,195 158,246 159,481 38,988 38,242 Source: CPAC – Audited
consolidated Financial Statements 2022-2025 and interim Financial Statements as of March 31, 2025 and 2026, notes on Property, Plant, and Equipment and Intangible assets. Prepared by: EQUBO. The increase in D&A between 2022 and 2025
(+15.1%) was concentrated in 2023-2024, with the start of operations of Kiln 4 and the growth in the amortization of intangible assets. In 2025, total D&A remained practically stable (+0.8%), although with a recomposition among
items. Machinery and equipment continues to be the main component of depreciation. Its charge increased to S/104.2 million in 2024, with Kiln 4 in operation, and fell to S/95.9 million in 2025 (-8.0%), while the depreciation of buildings
and other constructions increased 34.1% (S/7.5 million). This recomposition responds mainly to the reclassification of machinery assets to buildings and constructions carried out in 2024 (S/162.5 million in cost, according to the property,
plant, and equipment note), and therefore does not reflect a lower base of productive assets. Amortization of intangible assets has become a growing line item, increasing from S/8.9 million in 2022 to S/16.6 million in 2025 (+86.7%). The
increase comes mainly from IT applications, so it responds to a larger base of capitalized software linked to the digitalization of management, rather than the expansion of the cement business. As of the first quarter of 2026, D&A
decreases 1.9% year-over-year, mainly due to lower depreciation of machinery and equipment (-S/0.8 million), while buildings (+1.1%) and intangible assets (+2.3%) remain relatively stable. This points to a moderation of the depreciation
charge, rather than a structural change in the asset base.
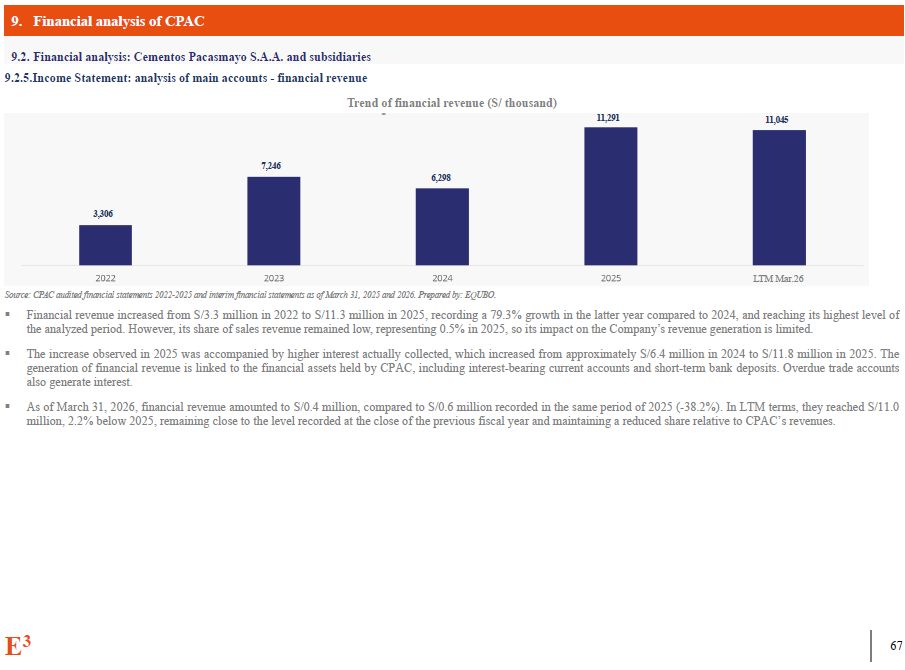
9. Financial analysis of CPAC 9.2. Financial analysis: Cementos Pacasmayo
S.A.A. and subsidiaries 9.2.5.Income Statement: analysis of main accounts - financial revenue Trend of financial revenue (S/ thousand) Source: CPAC audited financial statements 2022-2025 and interim financial statements as of March 31,
2025 and 2026. Prepared by: EQUBO. Financial revenue increased from S/3.3 million in 2022 to S/11.3 million in 2025, recording a 79.3% growth in the latter year compared to 2024, and reaching its highest level of the analyzed period.
However, its share of sales revenue remained low, representing 0.5% in 2025, so its impact on the Company’s revenue generation is limited. The increase observed in 2025 was accompanied by higher interest actually collected, which increased
from approximately S/6.4 million in 2024 to S/11.8 million in 2025. The generation of financial revenue is linked to the financial assets held by CPAC, including interest-bearing current accounts and short-term bank deposits. Overdue trade
accounts also generate interest. As of March 31, 2026, financial revenue amounted to S/0.4 million, compared to S/0.6 million recorded in the same period of 2025 (-38.2%). In LTM terms, they reached S/11.0 million, 2.2% below 2025,
remaining close to the level recorded at the close of the previous fiscal year and maintaining a reduced share relative to CPAC’s revenues. 3,306 LTM Mar.26 7,246 6,298 11,291 11,045 E3 100
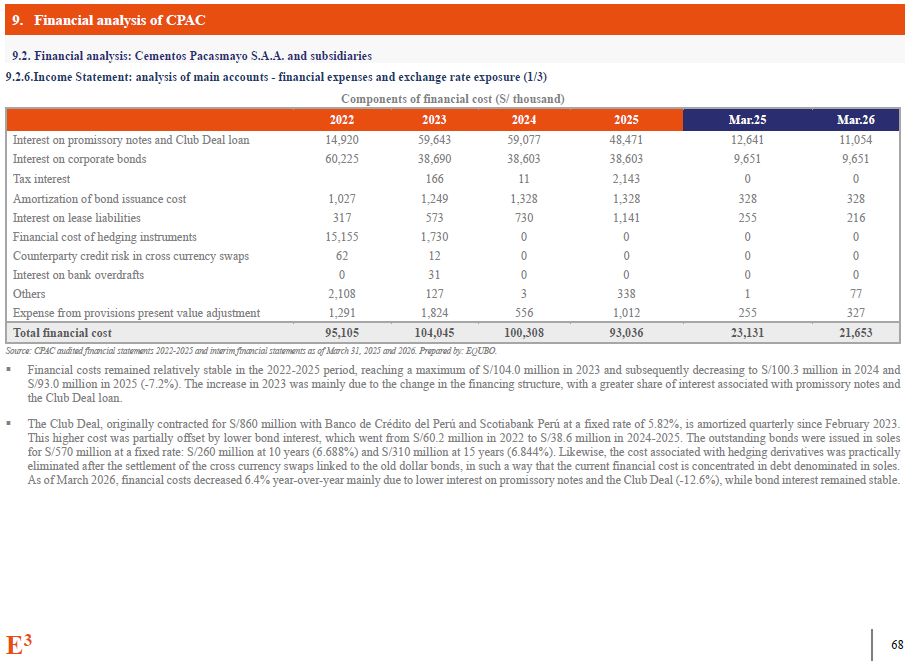
9. Financial analysis of CPAC 9.2. Financial analysis: Cementos Pacasmayo
S.A.A. and subsidiaries 9.2.6.Income Statement: analysis of main accounts - financial expenses and exchange rate exposure (1/3) Components of financial cost (S/ thousand) 2022 2023 2024 2025 Mar.25 Mar.26 Interest on promissory
notes and Club Deal loan 14,920 59,643 59,077 48,471 12,641 11,054 Interest on corporate bonds 60,225 38,690 38,603 38,603 9,651 9,651 Tax interest 166 11 2,143 0 0 Amortization of bond issuance
cost 1,027 1,249 1,328 1,328 328 328 Interest on lease liabilities 317 573 730 1,141 255 216 Financial cost of hedging instruments 15,155 1,730 0 0 0 0 Counterparty credit risk in cross currency
swaps 62 12 0 0 0 0 Interest on bank overdrafts 0 31 0 0 0 0 Others 2,108 127 3 338 1 77 Expense from provisions present value adjustment 1,291 1,824 556 1,012 255 327 Total financial
cost 95,105 104,045 100,308 93,036 23,131 21,653 E3 100 Source: CPAC audited financial statements 2022-2025 and interim financial statements as of March 31, 2025 and 2026. Prepared by: EQUBO. Financial costs remained relatively
stable in the 2022-2025 period, reaching a maximum of S/104.0 million in 2023 and subsequently decreasing to S/100.3 million in 2024 and S/93.0 million in 2025 (-7.2%). The increase in 2023 was mainly due to the change in the financing
structure, with a greater share of interest associated with promissory notes and the Club Deal loan. The Club Deal, originally contracted for S/860 million with Banco de Crédito del Perú and Scotiabank Perú at a fixed rate of 5.82%, is
amortized quarterly since February 2023. This higher cost was partially offset by lower bond interest, which went from S/60.2 million in 2022 to S/38.6 million in 2024-2025. The outstanding bonds were issued in soles for S/570 million at a
fixed rate: S/260 million at 10 years (6.688%) and S/310 million at 15 years (6.844%). Likewise, the cost associated with hedging derivatives was practically eliminated after the settlement of the cross currency swaps linked to the old
dollar bonds, in such a way that the current financial cost is concentrated in debt denominated in soles. As of March 2026, financial costs decreased 6.4% year-over-year mainly due to lower interest on promissory notes and the Club Deal
(-12.6%), while bond interest remained stable.
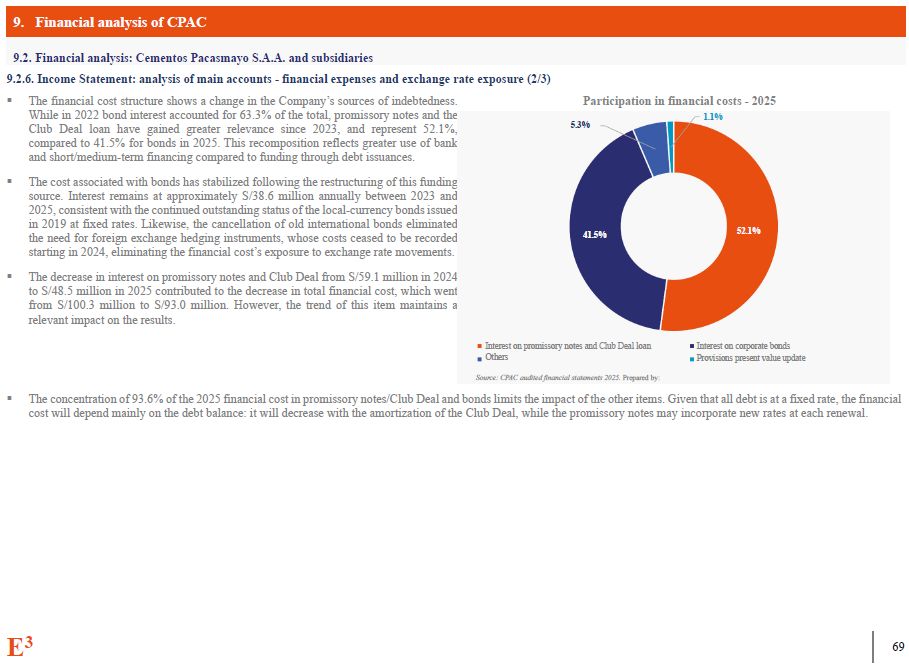
9. Financial analysis of CPAC 9.2. Financial analysis: Cementos Pacasmayo
S.A.A. and subsidiaries 9.2.6. Income Statement: analysis of main accounts - financial expenses and exchange rate exposure (2/3) The financial cost structure shows a change in the Company’s sources of indebtedness. While in 2022 bond
interest accounted for 63.3% of the total, promissory notes and the Club Deal loan have gained greater relevance since 2023, and represent 52.1%, compared to 41.5% for bonds in 2025. This recomposition reflects greater use of bank and
short/medium-term financing compared to funding through debt issuances. The cost associated with bonds has stabilized following the restructuring of this funding source. Interest remains at approximately S/38.6 million annually between
2023 and 2025, consistent with the continued outstanding status of the local-currency bonds issued in 2019 at fixed rates. Likewise, the cancellation of old international bonds eliminated the need for foreign exchange hedging instruments,
whose costs ceased to be recorded starting in 2024, eliminating the financial cost’s exposure to exchange rate movements. The decrease in interest on promissory notes and Club Deal from S/59.1 million in 2024 to S/48.5 million in 2025
contributed to the decrease in total financial cost, which went from S/100.3 million to S/93.0 million. However, the trend of this item maintains a relevant impact on the results. The concentration of 93.6% of the 2025 financial cost in
promissory notes/Club Deal and bonds limits the impact of the other items. Given that all debt is at a fixed rate, the financial cost will depend mainly on the debt balance: it will decrease with the amortization of the Club Deal, while the
promissory notes may incorporate new rates at each renewal. Interest on corporate bonds Provisions present value update Participation in financial costs - 2025 1.1% 5.3% 41.5% Interest on promissory notes and Club Deal loan
Others 52.1% Source: CPAC audited financial statements 2025. Prepared by: E3 100
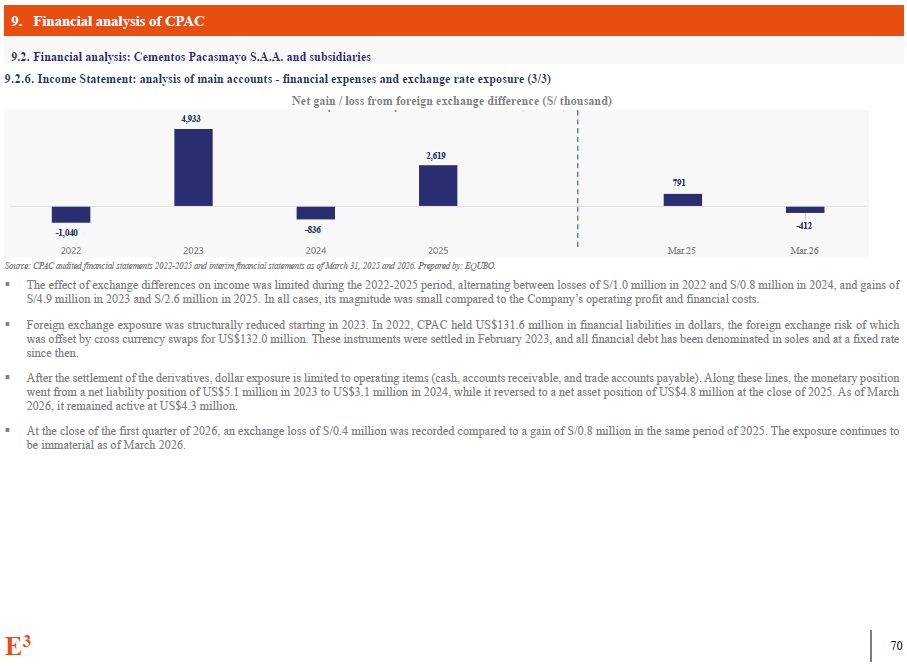
9. Financial analysis of CPAC 9.2. Financial analysis: Cementos Pacasmayo
S.A.A. and subsidiaries Source: CPAC audited financial statements 2022-2025 and interim financial statements as of March 31, 2025 and 2026. Prepared by: EQUBO. The effect of exchange differences on income was limited during the 2022-2025
period, alternating between losses of S/1.0 million in 2022 and S/0.8 million in 2024, and gains of S/4.9 million in 2023 and S/2.6 million in 2025. In all cases, its magnitude was small compared to the Company’s operating profit and
financial costs. Foreign exchange exposure was structurally reduced starting in 2023. In 2022, CPAC held US$131.6 million in financial liabilities in dollars, the foreign exchange risk of which was offset by cross currency swaps for
US$132.0 million. These instruments were settled in February 2023, and all financial debt has been denominated in soles and at a fixed rate since then. After the settlement of the derivatives, dollar exposure is limited to operating items
(cash, accounts receivable, and trade accounts payable). Along these lines, the monetary position went from a net liability position of US$5.1 million in 2023 to US$3.1 million in 2024, while it reversed to a net asset position of US$4.8
million at the close of 2025. As of March 2026, it remained active at US$4.3 million. At the close of the first quarter of 2026, an exchange loss of S/0.4 million was recorded compared to a gain of S/0.8 million in the same period of 2025.
The exposure continues to be immaterial as of March 2026. -1,040 Mar.25 9.2.6. Income Statement: analysis of main accounts - financial expenses and exchange rate exposure (3/3) Net gain / loss from foreign exchange difference (S/
thousand) 4,933 -836 2,619 791 Mar.26 -412 E3 100
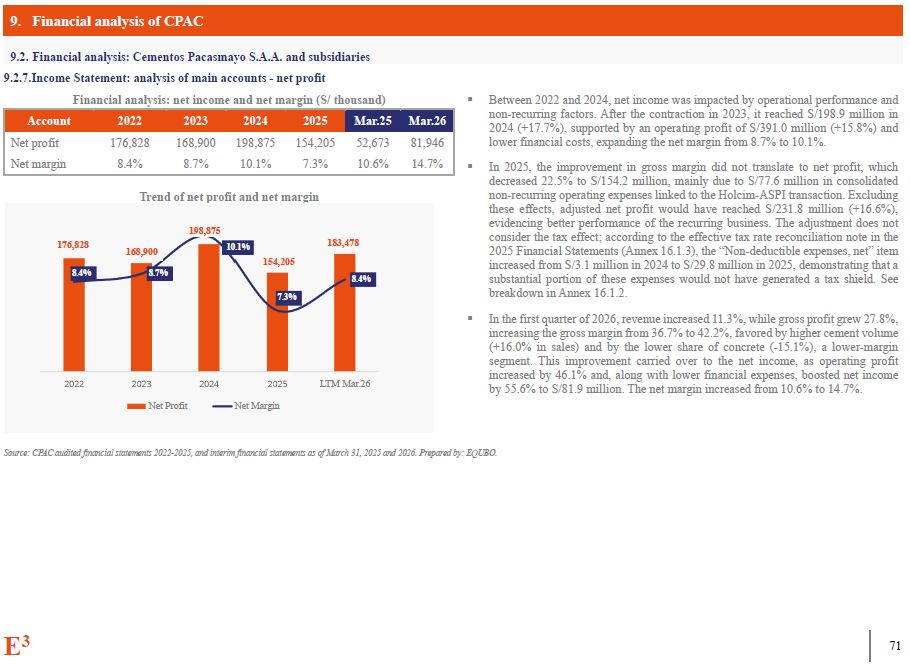
9. Financial analysis of CPAC 9.2. Financial analysis: Cementos Pacasmayo
S.A.A. and subsidiaries 9.2.7.Income Statement: analysis of main accounts - net profit Financial analysis: net income and net margin (S/ thousand) Between 2022 and 2024, net income was impacted by operational performance and
non-recurring factors. After the contraction in 2023, it reached S/198.9 million in 2024 (+17.7%), supported by an operating profit of S/391.0 million (+15.8%) and lower financial costs, expanding the net margin from 8.7% to 10.1%. In
2025, the improvement in gross margin did not translate to net profit, which decreased 22.5% to S/154.2 million, mainly due to S/77.6 million in consolidated non-recurring operating expenses linked to the Holcim-ASPI transaction. Excluding
these effects, adjusted net profit would have reached S/231.8 million (+16.6%), evidencing better performance of the recurring business. The adjustment does not consider the tax effect; according to the effective tax rate reconciliation
note in the 2025 Financial Statements (Annex 16.1.3), the “Non-deductible expenses, net” item increased from S/3.1 million in 2024 to S/29.8 million in 2025, demonstrating that a substantial portion of these expenses would not have
generated a tax shield. See breakdown in Annex 16.1.2. In the first quarter of 2026, revenue increased 11.3%, while gross profit grew 27.8%, increasing the gross margin from 36.7% to 42.2%, favored by higher cement volume (+16.0% in sales)
and by the lower share of concrete (-15.1%), a lower-margin segment. This improvement carried over to the net income, as operating profit increased by 46.1% and, along with lower financial expenses, boosted net income by 55.6% to S/81.9
million. The net margin increased from 10.6% to 14.7%. Account 2022 2023 2024 2025 Mar.25 Mar.26 Net profit 176,828 168,900 198,875 154,205 52,673 81,946 Net margin 8.4% 8.7% 10.1% 7.3% 10.6% 14.7% Trend of net profit
and net margin Source: CPAC audited financial statements 2022-2025, and interim financial statements as of March 31, 2025 and 2026. Prepared by: EQUBO. 8.4% 8.7% 10.1% 7.3% 8.4% 176,828 154,205 168,900 198,875 183,478 LTM
Mar.26 Net Margin Net Profit E3 100
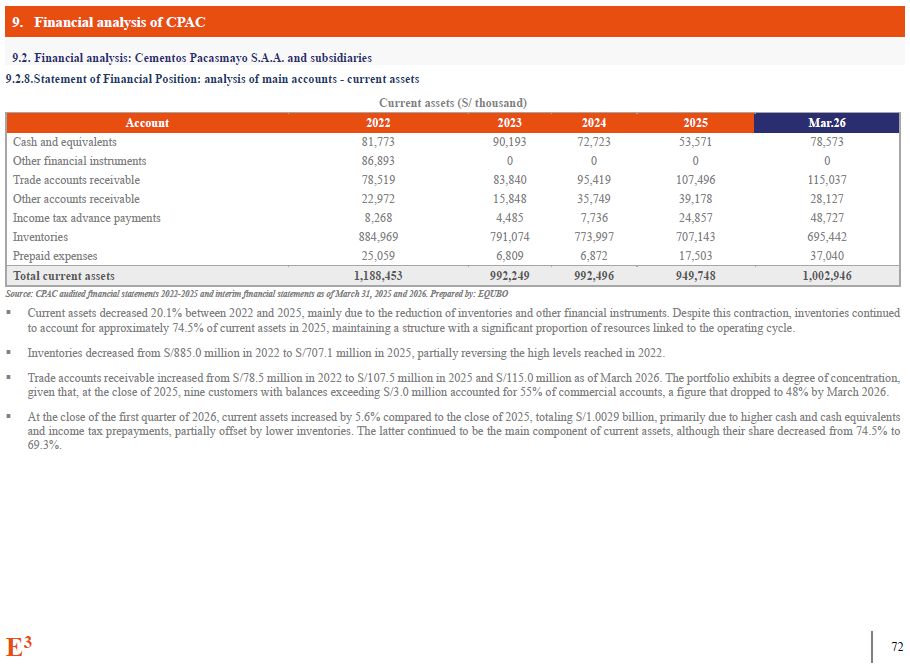
9. Financial analysis of CPAC 9.2. Financial analysis: Cementos Pacasmayo
S.A.A. and subsidiaries E3 100 9.2.8.Statement of Financial Position: analysis of main accounts - current assets Current assets (S/ thousand) Account 2022 2023 2024 2025 Mar.26 Cash and
equivalents 81,773 90,193 72,723 53,571 78,573 Other financial instruments 86,893 0 0 0 0 Trade accounts receivable 78,519 83,840 95,419 107,496 115,037 Other accounts
receivable 22,972 15,848 35,749 39,178 28,127 Income tax advance payments 8,268 4,485 7,736 24,857 48,727 Inventories 884,969 791,074 773,997 707,143 695,442 Prepaid expenses 25,059 6,809 6,872 17,503 37,040 Total
current assets 1,188,453 992,249 992,496 949,748 1,002,946 Source: CPAC audited financial statements 2022-2025 and interim financial statements as of March 31, 2025 and 2026. Prepared by: EQUBO Current assets decreased 20.1% between
2022 and 2025, mainly due to the reduction of inventories and other financial instruments. Despite this contraction, inventories continued to account for approximately 74.5% of current assets in 2025, maintaining a structure with a
significant proportion of resources linked to the operating cycle. Inventories decreased from S/885.0 million in 2022 to S/707.1 million in 2025, partially reversing the high levels reached in 2022. Trade accounts receivable increased
from S/78.5 million in 2022 to S/107.5 million in 2025 and S/115.0 million as of March 2026. The portfolio exhibits a degree of concentration, given that, at the close of 2025, nine customers with balances exceeding S/3.0 million accounted
for 55% of commercial accounts, a figure that dropped to 48% by March 2026. At the close of the first quarter of 2026, current assets increased by 5.6% compared to the close of 2025, totaling S/1.0029 billion, primarily due to higher cash
and cash equivalents and income tax prepayments, partially offset by lower inventories. The latter continued to be the main component of current assets, although their share decreased from 74.5% to 69.3%.
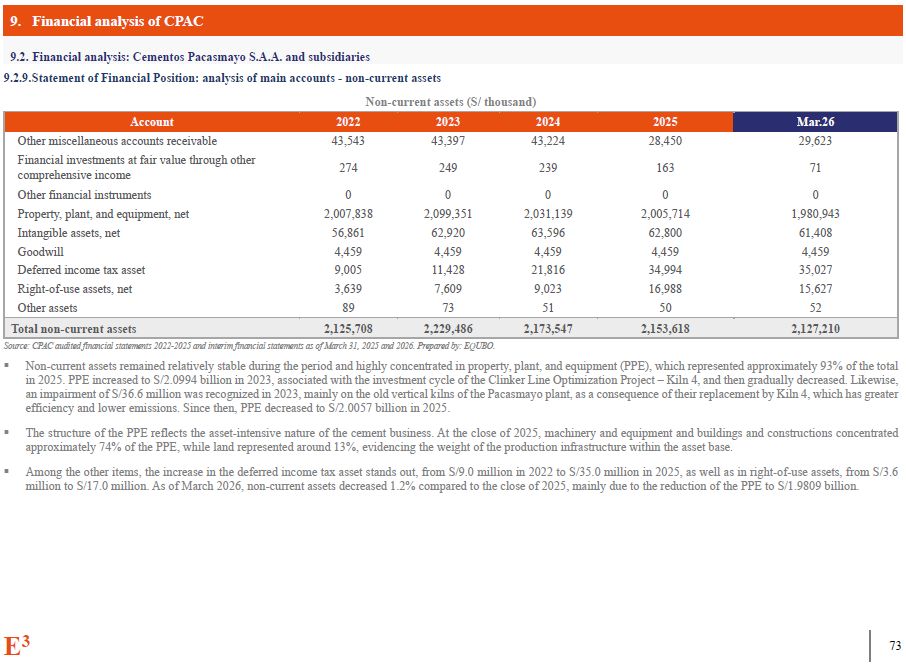
9. Financial analysis of CPAC 9.2. Financial analysis: Cementos Pacasmayo
S.A.A. and subsidiaries E3 100 9.2.9.Statement of Financial Position: analysis of main accounts - non-current assets Non-current assets (S/ thousand) Account 2022 2023 2024 2025 Mar.26 Other miscellaneous accounts
receivable 43,543 43,397 43,224 28,450 29,623 Financial investments at fair value through other comprehensive income 274 249 239 163 71 Other financial instruments 0 0 0 0 0 Property, plant, and equipment,
net 2,007,838 2,099,351 2,031,139 2,005,714 1,980,943 Intangible assets, net 56,861 62,920 63,596 62,800 61,408 Goodwill 4,459 4,459 4,459 4,459 4,459 Deferred income tax
asset 9,005 11,428 21,816 34,994 35,027 Right-of-use assets, net 3,639 7,609 9,023 16,988 15,627 Other assets 89 73 51 50 52 Total non-current assets 2,125,708 2,229,486 2,173,547 2,153,618 2,127,210 Source: CPAC
audited financial statements 2022-2025 and interim financial statements as of March 31, 2025 and 2026. Prepared by: EQUBO. Non-current assets remained relatively stable during the period and highly concentrated in property, plant, and
equipment (PPE), which represented approximately 93% of the total in 2025. PPE increased to S/2.0994 billion in 2023, associated with the investment cycle of the Clinker Line Optimization Project – Kiln 4, and then gradually decreased.
Likewise, an impairment of S/36.6 million was recognized in 2023, mainly on the old vertical kilns of the Pacasmayo plant, as a consequence of their replacement by Kiln 4, which has greater efficiency and lower emissions. Since then, PPE
decreased to S/2.0057 billion in 2025. The structure of the PPE reflects the asset-intensive nature of the cement business. At the close of 2025, machinery and equipment and buildings and constructions concentrated approximately 74% of the
PPE, while land represented around 13%, evidencing the weight of the production infrastructure within the asset base. Among the other items, the increase in the deferred income tax asset stands out, from S/9.0 million in 2022 to S/35.0
million in 2025, as well as in right-of-use assets, from S/3.6 million to S/17.0 million. As of March 2026, non-current assets decreased 1.2% compared to the close of 2025, mainly due to the reduction of the PPE to S/1.9809 billion.
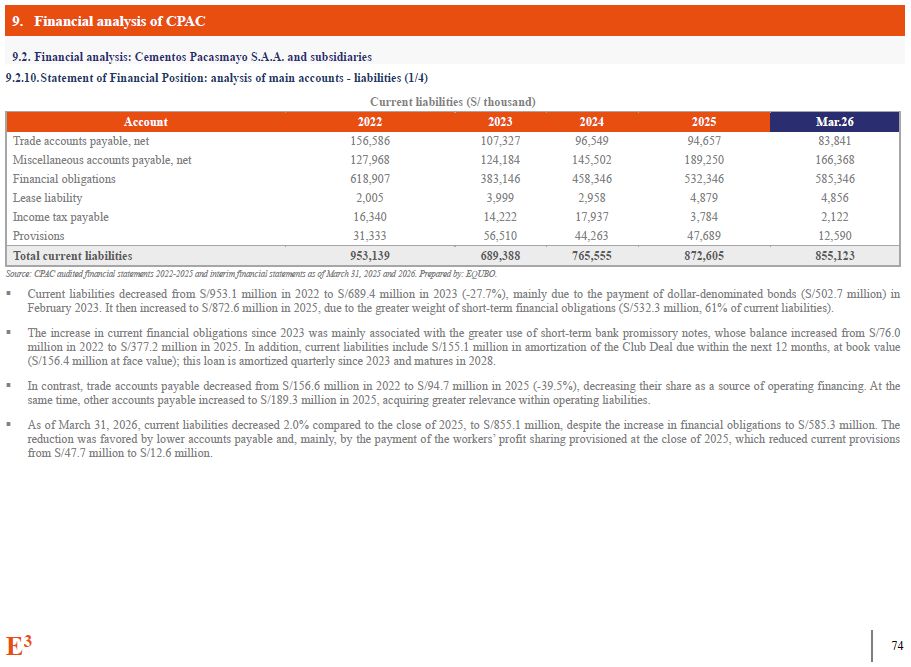
9. Financial analysis of CPAC 9.2. Financial analysis: Cementos Pacasmayo
S.A.A. and subsidiaries E3 100 9.2.10.Statement of Financial Position: analysis of main accounts - liabilities (1/4) Current liabilities (S/ thousand) Account 2022 2023 2024 2025 Mar.26 Trade accounts payable,
net 156,586 107,327 96,549 94,657 83,841 Miscellaneous accounts payable, net 127,968 124,184 145,502 189,250 166,368 Financial obligations 618,907 383,146 458,346 532,346 585,346 Lease
liability 2,005 3,999 2,958 4,879 4,856 Income tax payable 16,340 14,222 17,937 3,784 2,122 Provisions 31,333 56,510 44,263 47,689 12,590 Total current liabilities 953,139 689,388 765,555 872,605 855,123 Source: CPAC
audited financial statements 2022-2025 and interim financial statements as of March 31, 2025 and 2026. Prepared by: EQUBO. Current liabilities decreased from S/953.1 million in 2022 to S/689.4 million in 2023 (-27.7%), mainly due to the
payment of dollar-denominated bonds (S/502.7 million) in February 2023. It then increased to S/872.6 million in 2025, due to the greater weight of short-term financial obligations (S/532.3 million, 61% of current liabilities). The increase
in current financial obligations since 2023 was mainly associated with the greater use of short-term bank promissory notes, whose balance increased from S/76.0 million in 2022 to S/377.2 million in 2025. In addition, current liabilities
include S/155.1 million in amortization of the Club Deal due within the next 12 months, at book value (S/156.4 million at face value); this loan is amortized quarterly since 2023 and matures in 2028. In contrast, trade accounts payable
decreased from S/156.6 million in 2022 to S/94.7 million in 2025 (-39.5%), decreasing their share as a source of operating financing. At the same time, other accounts payable increased to S/189.3 million in 2025, acquiring greater relevance
within operating liabilities. As of March 31, 2026, current liabilities decreased 2.0% compared to the close of 2025, to S/855.1 million, despite the increase in financial obligations to S/585.3 million. The reduction was favored by lower
accounts payable and, mainly, by the payment of the workers’ profit sharing provisioned at the close of 2025, which reduced current provisions from S/47.7 million to S/12.6 million.
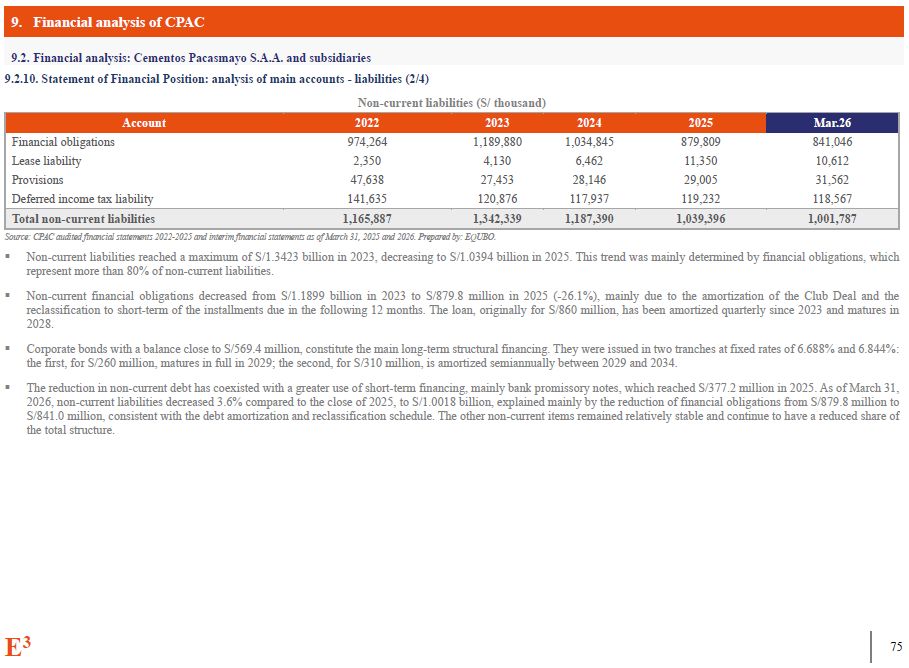
9. Financial analysis of CPAC 9.2. Financial analysis: Cementos Pacasmayo
S.A.A. and subsidiaries E3 100 9.2.10. Statement of Financial Position: analysis of main accounts - liabilities (2/4) Non-current liabilities (S/ thousand) Account 2022 2023 2024 2025 Mar.26 Financial
obligations 974,264 1,189,880 1,034,845 879,809 841,046 Lease liability 2,350 4,130 6,462 11,350 10,612 Provisions 47,638 27,453 28,146 29,005 31,562 Deferred income tax
liability 141,635 120,876 117,937 119,232 118,567 Total non-current liabilities 1,165,887 1,342,339 1,187,390 1,039,396 1,001,787 Source: CPAC audited financial statements 2022-2025 and interim financial statements as of March
31, 2025 and 2026. Prepared by: EQUBO. Non-current liabilities reached a maximum of S/1.3423 billion in 2023, decreasing to S/1.0394 billion in 2025. This trend was mainly determined by financial obligations, which represent more than 80%
of non-current liabilities. Non-current financial obligations decreased from S/1.1899 billion in 2023 to S/879.8 million in 2025 (-26.1%), mainly due to the amortization of the Club Deal and the reclassification to short-term of the
installments due in the following 12 months. The loan, originally for S/860 million, has been amortized quarterly since 2023 and matures in 2028. Corporate bonds with a balance close to S/569.4 million, constitute the main long-term
structural financing. They were issued in two tranches at fixed rates of 6.688% and 6.844%: the first, for S/260 million, matures in full in 2029; the second, for S/310 million, is amortized semiannually between 2029 and 2034. The
reduction in non-current debt has coexisted with a greater use of short-term financing, mainly bank promissory notes, which reached S/377.2 million in 2025. As of March 31, 2026, non-current liabilities decreased 3.6% compared to the close
of 2025, to S/1.0018 billion, explained mainly by the reduction of financial obligations from S/879.8 million to S/841.0 million, consistent with the debt amortization and reclassification schedule. The other non-current items remained
relatively stable and continue to have a reduced share of the total structure.
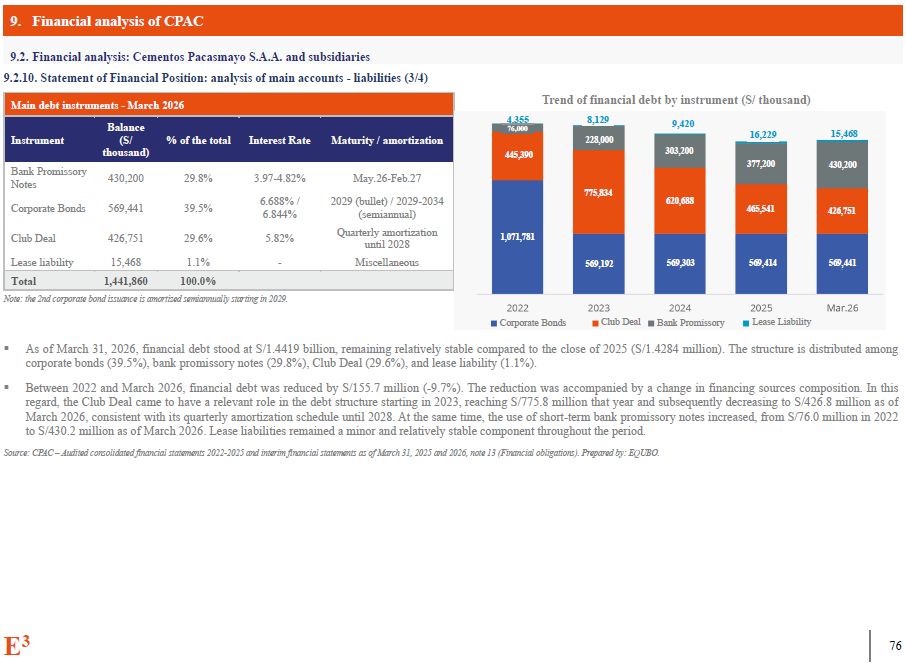
9. Financial analysis of CPAC 9.2. Financial analysis: Cementos Pacasmayo
S.A.A. and subsidiaries 9.2.10. Statement of Financial Position: analysis of main accounts - liabilities (3/4) Main debt instruments - March 2026 Instrument Balance (S/ thousand) % of the total Interest Rate Maturity /
amortization Bank Promissory Notes 430,200 29.8% 3.97-4.82% May.26-Feb.27 Corporate Bonds 569,441 39.5% 6.688% / 6.844% 2029 (bullet) / 2029-2034 (semiannual) Club Deal 426,751 29.6% 5.82% Quarterly amortization until
2028 Lease liability 15,468 1.1% - Miscellaneous Total 1,441,860 100.0% Trend of financial debt by instrument (S/
thousand) 8,129 9,420 16,229 15,468 4,355 76,000 228,000 303,200 377,200 430,200 426,751 465,541 620,688 775,834 445,390 1,071,781 569,192 569,303 569,414 569,441 Note: the 2nd corporate bond issuance is amortized
semiannually starting in 2029. Corporate Bonds Club Deal Bank Promissory Lease Liability As of March 31, 2026, financial debt stood at S/1.4419 billion, remaining relatively stable compared to the close of 2025 (S/1.4284 million). The
structure is distributed among corporate bonds (39.5%), bank promissory notes (29.8%), Club Deal (29.6%), and lease liability (1.1%). Between 2022 and March 2026, financial debt was reduced by S/155.7 million (-9.7%). The reduction was
accompanied by a change in financing sources composition. In this regard, the Club Deal came to have a relevant role in the debt structure starting in 2023, reaching S/775.8 million that year and subsequently decreasing to S/426.8 million
as of March 2026, consistent with its quarterly amortization schedule until 2028. At the same time, the use of short-term bank promissory notes increased, from S/76.0 million in 2022 to S/430.2 million as of March 2026. Lease liabilities
remained a minor and relatively stable component throughout the period. Source: CPAC – Audited consolidated financial statements 2022-2025 and interim financial statements as of March 31, 2025 and 2026, note 13 (Financial obligations).
Prepared by: EQUBO. E3 100
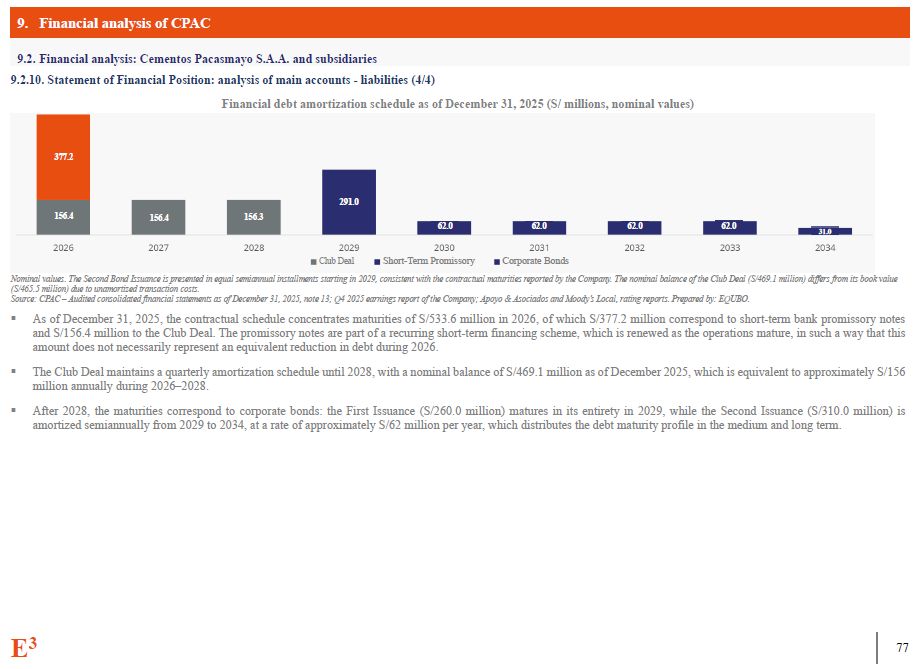
9. Financial analysis of CPAC 9.2. Financial analysis: Cementos Pacasmayo
S.A.A. and subsidiaries 9.2.10. Statement of Financial Position: analysis of main accounts - liabilities (4/4) Financial debt amortization schedule as of December 31, 2025 (S/ millions, nominal values) Nominal values. The Second Bond
Issuance is presented in equal semiannual installments starting in 2029, consistent with the contractual maturities reported by the Company. The nominal balance of the Club Deal (S/469.1 million) differs from its book value (S/465.5
million) due to unamortized transaction costs. Source: CPAC – Audited consolidated financial statements as of December 31, 2025, note 13; Q4 2025 earnings report of the Company; Apoyo & Asociados and Moody’s Local, rating reports.
Prepared by: EQUBO. As of December 31, 2025, the contractual schedule concentrates maturities of S/533.6 million in 2026, of which S/377.2 million correspond to short-term bank promissory notes and S/156.4 million to the Club Deal. The
promissory notes are part of a recurring short-term financing scheme, which is renewed as the operations mature, in such a way that this amount does not necessarily represent an equivalent reduction in debt during 2026. The Club Deal
maintains a quarterly amortization schedule until 2028, with a nominal balance of S/469.1 million as of December 2025, which is equivalent to approximately S/156 million annually during 2026–2028. After 2028, the maturities correspond to
corporate bonds: the First Issuance (S/260.0 million) matures in its entirety in 2029, while the Second Issuance (S/310.0 million) is amortized semiannually from 2029 to 2034, at a rate of approximately S/62 million per year, which
distributes the debt maturity profile in the medium and long term. 377.2 156.4 156.4 156.3 291.0 62.0 62.0 62.0 62.0 31.0 Club Deal Short-Term Promissory Corporate Bonds E3 100
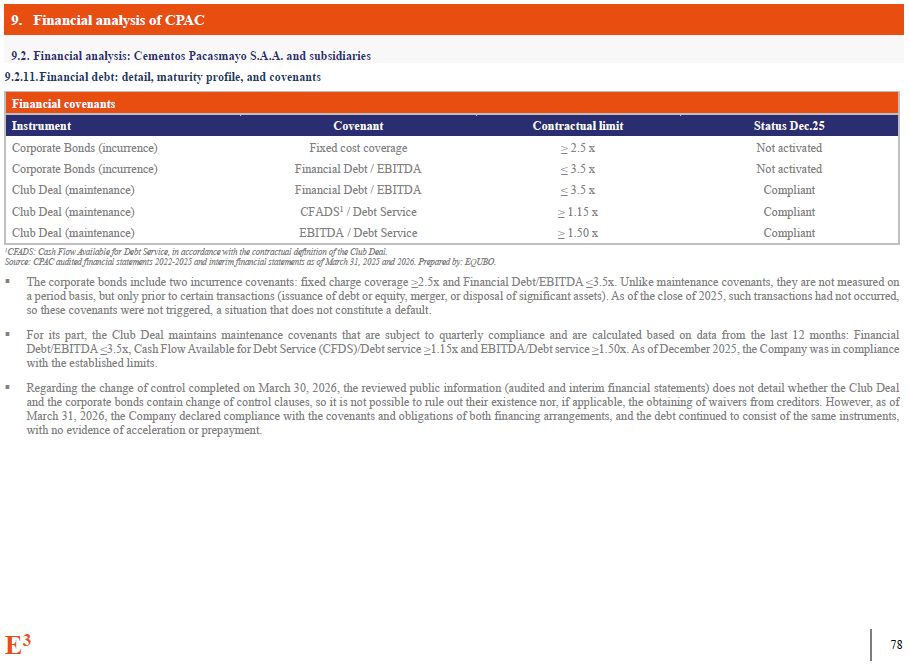
9. Financial analysis of CPAC 9.2. Financial analysis: Cementos Pacasmayo
S.A.A. and subsidiaries E3 100 9.2.11.Financial debt: detail, maturity profile, and covenants Financial covenants Instrument Covenant Contractual limit Status Dec.25 Corporate Bonds (incurrence) Fixed cost coverage ≥ 2.5 x Not
activated Corporate Bonds (incurrence) Financial Debt / EBITDA ≤ 3.5 x Not activated Club Deal (maintenance) Financial Debt / EBITDA ≤ 3.5 x Compliant Club Deal (maintenance) CFADS1 / Debt Service ≥ 1.15 x Compliant Club Deal
(maintenance) EBITDA / Debt Service ≥ 1.50 x Compliant 1CFADS: Cash Flow Available for Debt Service, in accordance with the contractual definition of the Club Deal. Source: CPAC audited financial statements 2022-2025 and interim
financial statements as of March 31, 2025 and 2026. Prepared by: EQUBO. The corporate bonds include two incurrence covenants: fixed charge coverage ≥2.5x and Financial Debt/EBITDA ≤3.5x. Unlike maintenance covenants, they are not measured
on a period basis, but only prior to certain transactions (issuance of debt or equity, merger, or disposal of significant assets). As of the close of 2025, such transactions had not occurred, so these covenants were not triggered, a
situation that does not constitute a default. For its part, the Club Deal maintains maintenance covenants that are subject to quarterly compliance and are calculated based on data from the last 12 months: Financial Debt/EBITDA ≤3.5x, Cash
Flow Available for Debt Service (CFDS)/Debt service ≥1.15x and EBITDA/Debt service ≥1.50x. As of December 2025, the Company was in compliance with the established limits. Regarding the change of control completed on March 30, 2026, the
reviewed public information (audited and interim financial statements) does not detail whether the Club Deal and the corporate bonds contain change of control clauses, so it is not possible to rule out their existence nor, if applicable,
the obtaining of waivers from creditors. However, as of March 31, 2026, the Company declared compliance with the covenants and obligations of both financing arrangements, and the debt continued to consist of the same instruments, with no
evidence of acceleration or prepayment.
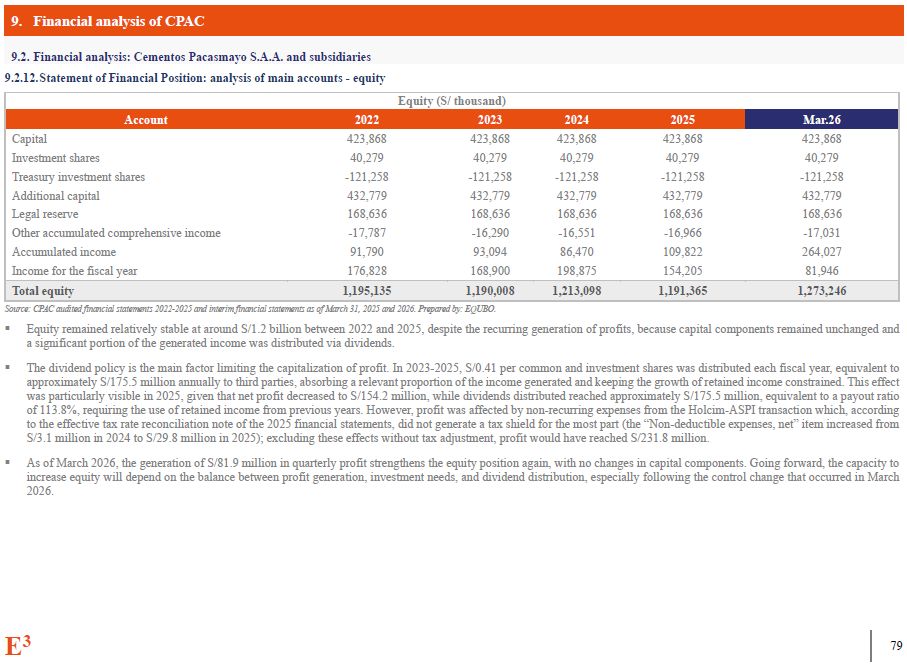
9. Financial analysis of CPAC 9.2. Financial analysis: Cementos Pacasmayo
S.A.A. and subsidiaries E3 100 9.2.12.Statement of Financial Position: analysis of main accounts - equity Equity (S/ thousand) Account 2022 2023 2024 2025 Mar.26 Capital 423,868 423,868 423,868 423,868 423,868 Investment
shares 40,279 40,279 40,279 40,279 40,279 Treasury investment shares -121,258 -121,258 -121,258 -121,258 -121,258 Additional capital 432,779 432,779 432,779 432,779 432,779 Legal
reserve 168,636 168,636 168,636 168,636 168,636 Other accumulated comprehensive income -17,787 -16,290 -16,551 -16,966 -17,031 Accumulated income 91,790 93,094 86,470 109,822 264,027 Income for the fiscal
year 176,828 168,900 198,875 154,205 81,946 Total equity 1,195,135 1,190,008 1,213,098 1,191,365 1,273,246 Source: CPAC audited financial statements 2022-2025 and interim financial statements as of March 31, 2025 and 2026.
Prepared by: EQUBO. Equity remained relatively stable at around S/1.2 billion between 2022 and 2025, despite the recurring generation of profits, because capital components remained unchanged and a significant portion of the generated
income was distributed via dividends. The dividend policy is the main factor limiting the capitalization of profit. In 2023-2025, S/0.41 per common and investment shares was distributed each fiscal year, equivalent to approximately S/175.5
million annually to third parties, absorbing a relevant proportion of the income generated and keeping the growth of retained income constrained. This effect was particularly visible in 2025, given that net profit decreased to S/154.2
million, while dividends distributed reached approximately S/175.5 million, equivalent to a payout ratio of 113.8%, requiring the use of retained income from previous years. However, profit was affected by non-recurring expenses from the
Holcim-ASPI transaction which, according to the effective tax rate reconciliation note of the 2025 financial statements, did not generate a tax shield for the most part (the “Non-deductible expenses, net” item increased from S/3.1 million
in 2024 to S/29.8 million in 2025); excluding these effects without tax adjustment, profit would have reached S/231.8 million. As of March 2026, the generation of S/81.9 million in quarterly profit strengthens the equity position again,
with no changes in capital components. Going forward, the capacity to increase equity will depend on the balance between profit generation, investment needs, and dividend distribution, especially following the control change that occurred
in March 2026.
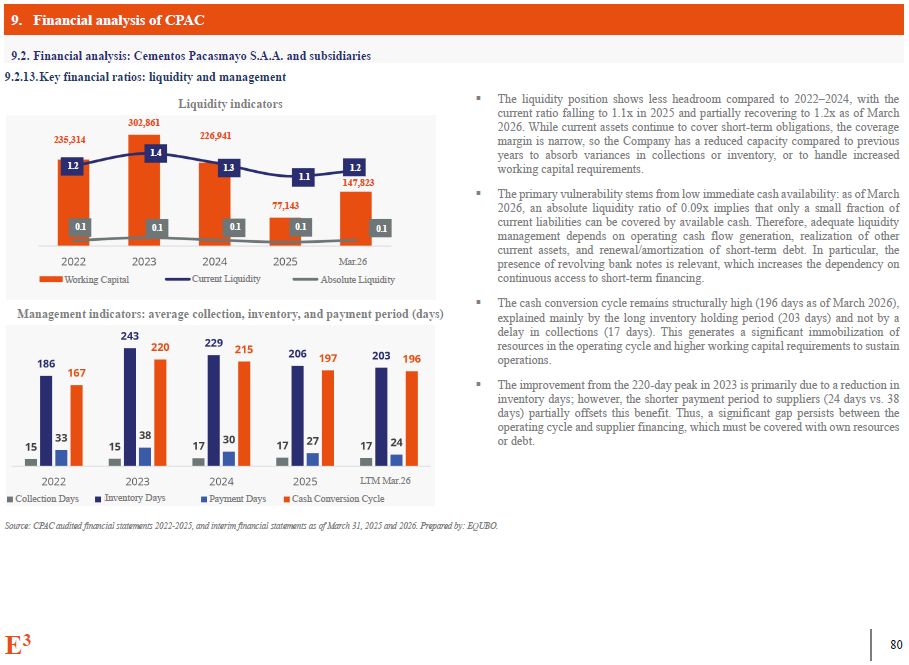
9. Financial analysis of CPAC 9.2. Financial analysis: Cementos Pacasmayo
S.A.A. and subsidiaries 9.2.13.Key financial ratios: liquidity and management Liquidity indicators The liquidity position shows less headroom compared to 2022–2024, with the current ratio falling to 1.1x in 2025 and partially recovering
to 1.2x as of March 2026. While current assets continue to cover short-term obligations, the coverage margin is narrow, so the Company has a reduced capacity compared to previous years to absorb variances in collections or inventory, or to
handle increased working capital requirements. The primary vulnerability stems from low immediate cash availability: as of March 2026, an absolute liquidity ratio of 0.09x implies that only a small fraction of current liabilities can be
covered by available cash. Therefore, adequate liquidity management depends on operating cash flow generation, realization of other current assets, and renewal/amortization of short-term debt. In particular, the presence of revolving bank
notes is relevant, which increases the dependency on continuous access to short-term financing. The cash conversion cycle remains structurally high (196 days as of March 2026), explained mainly by the long inventory holding period (203
days) and not by a delay in collections (17 days). This generates a significant immobilization of resources in the operating cycle and higher working capital requirements to sustain operations. The improvement from the 220-day peak in 2023
is primarily due to a reduction in inventory days; however, the shorter payment period to suppliers (24 days vs. 38 days) partially offsets this benefit. Thus, a significant gap persists between the operating cycle and supplier financing,
which must be covered with own resources or debt. Management indicators: average collection, inventory, and payment period (days) Source: CPAC audited financial statements 2022-2025, and interim financial statements as of March 31, 2025
and 2026. Prepared by: EQUBO. 1.2 1.4 1.3 1.1 235,314 302,861 226,941 77,143 1.2 147,823 0.1 0.1 0.1 0.1 0.1 Working Capital Current Liquidity Mar.26 Absolute Liquidity Collection Days Inventory Days Payment Days LTM
Mar.26 Cash Conversion Cycle E3 100
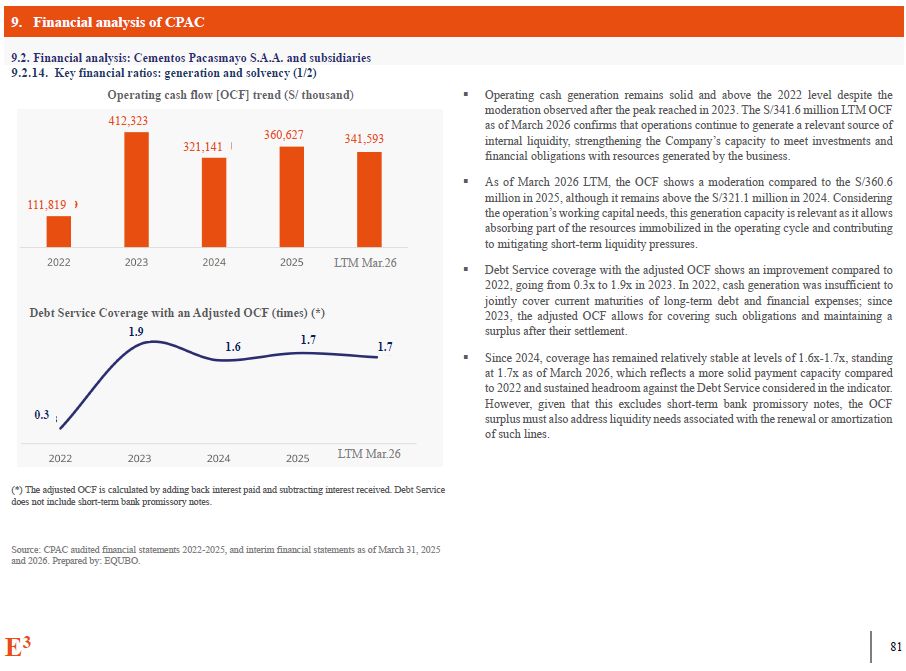
9. Financial analysis of CPAC 9.2. Financial analysis: Cementos Pacasmayo
S.A.A. and subsidiaries 9.2.14. Key financial ratios: generation and solvency (1/2) Operating cash flow [OCF] trend (S/ thousand) Operating cash generation remains solid and above the 2022 level despite the moderation observed after the
peak reached in 2023. The S/341.6 million LTM OCF as of March 2026 confirms that operations continue to generate a relevant source of internal liquidity, strengthening the Company’s capacity to meet investments and financial obligations
with resources generated by the business. As of March 2026 LTM, the OCF shows a moderation compared to the S/360.6 million in 2025, although it remains above the S/321.1 million in 2024. Considering the operation’s working capital needs,
this generation capacity is relevant as it allows absorbing part of the resources immobilized in the operating cycle and contributing to mitigating short-term liquidity pressures. Debt Service coverage with the adjusted OCF shows an
improvement compared to 2022, going from 0.3x to 1.9x in 2023. In 2022, cash generation was insufficient to jointly cover current maturities of long-term debt and financial expenses; since 2023, the adjusted OCF allows for covering such
obligations and maintaining a surplus after their settlement. Since 2024, coverage has remained relatively stable at levels of 1.6x-1.7x, standing at 1.7x as of March 2026, which reflects a more solid payment capacity compared to 2022 and
sustained headroom against the Debt Service considered in the indicator. However, given that this excludes short-term bank promissory notes, the OCF surplus must also address liquidity needs associated with the renewal or amortization of
such lines. Source: CPAC audited financial statements 2022-2025, and interim financial statements as of March 31, 2025 and 2026. Prepared by: EQUBO. 111,819 412,323 321,141 360,627 341,593 LTM Mar.26 Debt Service Coverage with an
Adjusted OCF (times) (*) 0.3 1.9 1.6 1.7 1.7 LTM Mar.26 (*) The adjusted OCF is calculated by adding back interest paid and subtracting interest received. Debt Service does not include short-term bank promissory notes. E3 100
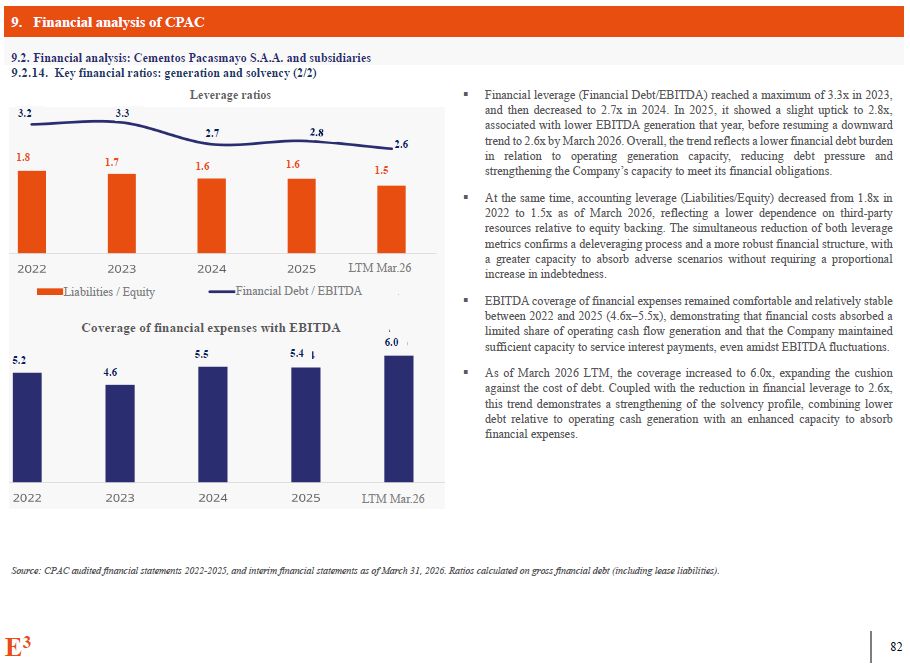
9. Financial analysis of CPAC 9.2. Financial analysis: Cementos Pacasmayo
S.A.A. and subsidiaries Financial leverage (Financial Debt/EBITDA) reached a maximum of 3.3x in 2023, and then decreased to 2.7x in 2024. In 2025, it showed a slight uptick to 2.8x, associated with lower EBITDA generation that year, before
resuming a downward trend to 2.6x by March 2026. Overall, the trend reflects a lower financial debt burden in relation to operating generation capacity, reducing debt pressure and strengthening the Company’s capacity to meet its financial
obligations. At the same time, accounting leverage (Liabilities/Equity) decreased from 1.8x in 2022 to 1.5x as of March 2026, reflecting a lower dependence on third-party resources relative to equity backing. The simultaneous reduction of
both leverage metrics confirms a deleveraging process and a more robust financial structure, with a greater capacity to absorb adverse scenarios without requiring a proportional increase in indebtedness. EBITDA coverage of financial
expenses remained comfortable and relatively stable between 2022 and 2025 (4.6x–5.5x), demonstrating that financial costs absorbed a limited share of operating cash flow generation and that the Company maintained sufficient capacity to
service interest payments, even amidst EBITDA fluctuations. As of March 2026 LTM, the coverage increased to 6.0x, expanding the cushion against the cost of debt. Coupled with the reduction in financial leverage to 2.6x, this trend
demonstrates a strengthening of the solvency profile, combining lower debt relative to operating cash generation with an enhanced capacity to absorb financial expenses. Source: CPAC audited financial statements 2022-2025, and interim
financial statements as of March 31, 2026. Ratios calculated on gross financial debt (including lease liabilities). 9.2.14. Key financial ratios: generation and solvency (2/2) Leverage ratios 3.2
3.3 2.7 2.6 1.8 1.7 1.6 1.6 1.5 LTM Mar.26 5.2 4.6 6.0 LTM Mar.26 Liabilities / Equity LTM Mar.26 Financial Debt / EBITDA Coverage of financial expenses with EBITDA 5.5 5.4 E3 100
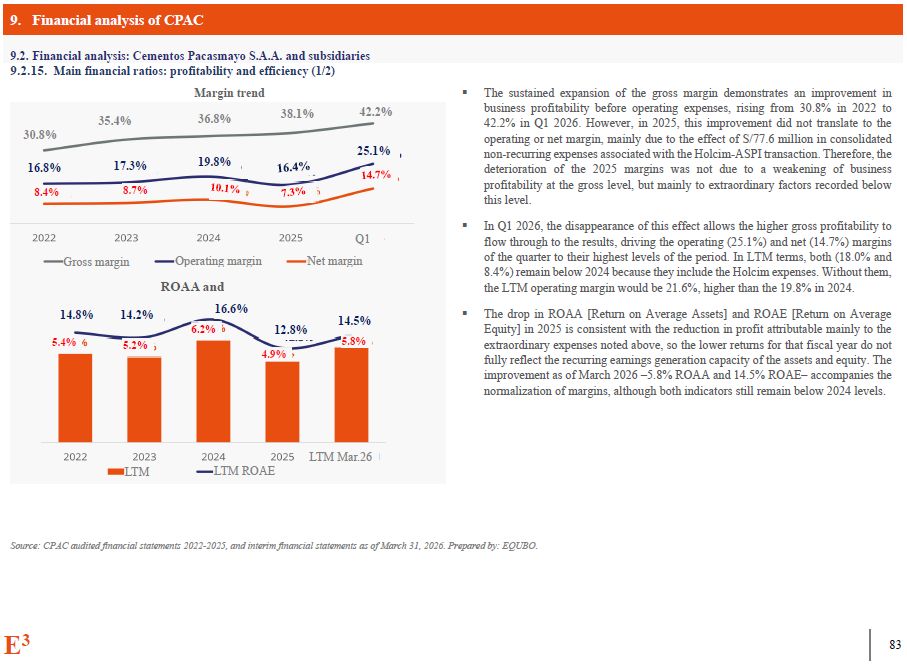
9. Financial analysis of CPAC 9.2. Financial analysis: Cementos Pacasmayo
S.A.A. and subsidiaries 9.2.15. Main financial ratios: profitability and efficiency (1/2) Margin trend The sustained expansion of the gross margin demonstrates an improvement in business profitability before operating expenses, rising
from 30.8% in 2022 to 42.2% in Q1 2026. However, in 2025, this improvement did not translate to the operating or net margin, mainly due to the effect of S/77.6 million in consolidated non-recurring expenses associated with the Holcim-ASPI
transaction. Therefore, the deterioration of the 2025 margins was not due to a weakening of business profitability at the gross level, but mainly to extraordinary factors recorded below this level. In Q1 2026, the disappearance of this
effect allows the higher gross profitability to flow through to the results, driving the operating (25.1%) and net (14.7%) margins of the quarter to their highest levels of the period. In LTM terms, both (18.0% and 8.4%) remain below 2024
because they include the Holcim expenses. Without them, the LTM operating margin would be 21.6%, higher than the 19.8% in 2024. The drop in ROAA [Return on Average Assets] and ROAE [Return on Average Equity] in 2025 is consistent with the
reduction in profit attributable mainly to the extraordinary expenses noted above, so the lower returns for that fiscal year do not fully reflect the recurring earnings generation capacity of the assets and equity. The improvement as of
March 2026 –5.8% ROAA and 14.5% ROAE– accompanies the normalization of margins, although both indicators still remain below 2024 levels. Source: CPAC audited financial statements 2022-2025, and interim financial statements as of March 31,
2026. Prepared by: EQUBO. 30.8% 35.4% 36.8% 38.1% 42.2% 19.8% 25.1% 16.8% 8.4% 17.3% 8.7% Gross margin Operating margin 14.8% 14.2% 12.8% 5.4% 5.2% 16.6% 6.2% 4.9% 14.5% 5.8% Q1 Net margin LTM Mar.26 LTM
ROAE LTM ROAA and E3 100
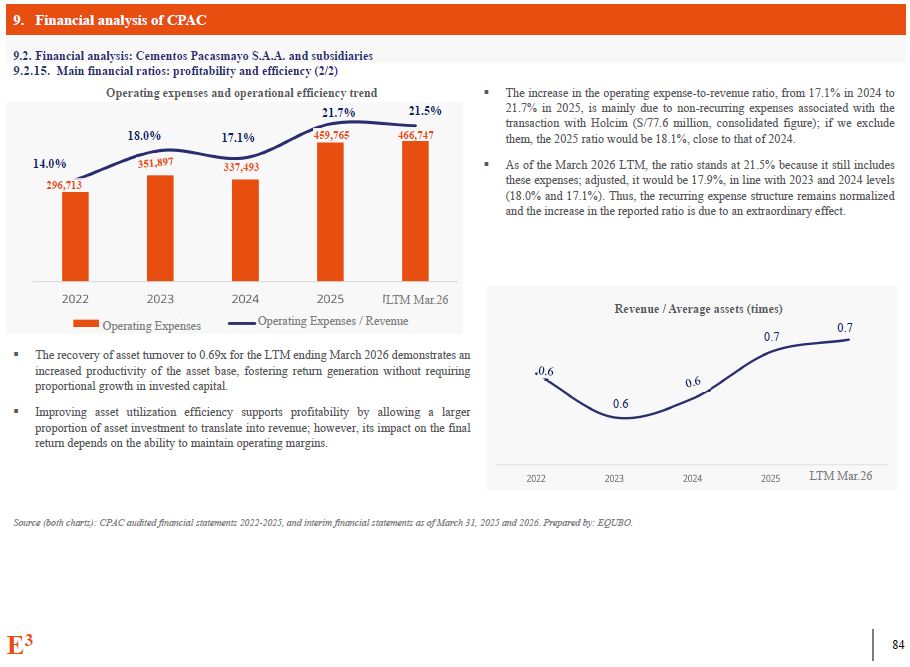
9. Financial analysis of CPAC 9.2. Financial analysis: Cementos Pacasmayo
S.A.A. and subsidiaries The increase in the operating expense-to-revenue ratio, from 17.1% in 2024 to 21.7% in 2025, is mainly due to non-recurring expenses associated with the transaction with Holcim (S/77.6 million, consolidated figure);
if we exclude them, the 2025 ratio would be 18.1%, close to that of 2024. As of the March 2026 LTM, the ratio stands at 21.5% because it still includes these expenses; adjusted, it would be 17.9%, in line with 2023 and 2024 levels (18.0%
and 17.1%). Thus, the recurring expense structure remains normalized and the increase in the reported ratio is due to an extraordinary effect. The recovery of asset turnover to 0.69x for the LTM ending March 2026 demonstrates an increased
productivity of the asset base, fostering return generation without requiring proportional growth in invested capital. Improving asset utilization efficiency supports profitability by allowing a larger proportion of asset investment to
translate into revenue; however, its impact on the final return depends on the ability to maintain operating margins. Source (both charts): CPAC audited financial statements 2022-2025, and interim financial statements as of March 31, 2025
and 2026. Prepared by: EQUBO. 18.0% 17.1% 9.2.15. Main financial ratios: profitability and efficiency (2/2) Operating expenses and operational efficiency trend 21.7% 14.0% 296,713 337,493 459,765 21.5% 466,747 LTM
Mar.26 Operating Expenses Operating Expenses / Revenue Revenue / Average assets (times) 0.6 0.7 0.7 LTM Mar.26 E3 100
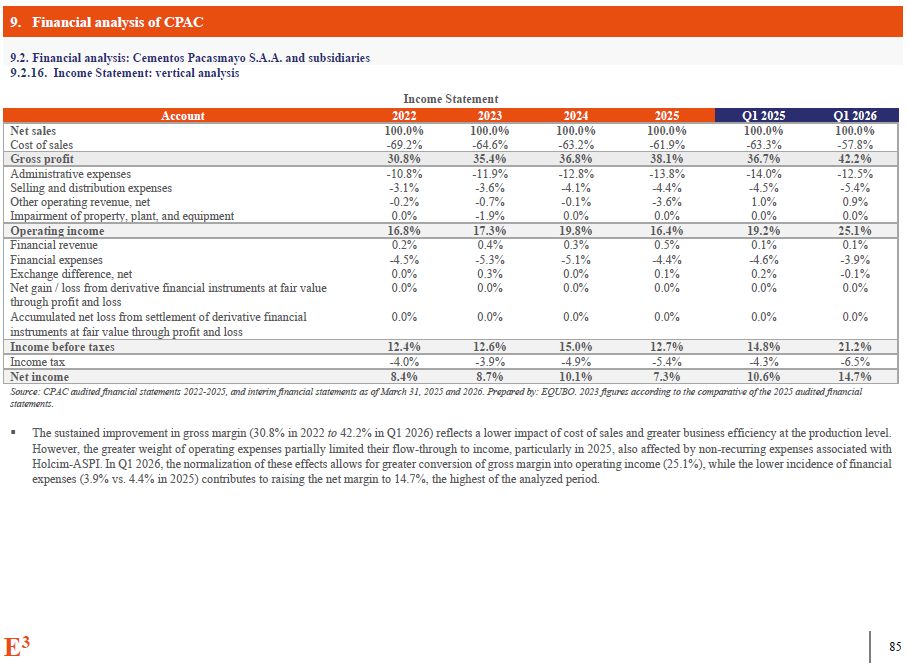
9. Financial analysis of CPAC 9.2. Financial analysis: Cementos Pacasmayo
S.A.A. and subsidiaries E3 100 9.2.16. Income Statement: vertical analysis Income Statement Account 2022 2023 2024 2025 Q1 2025 Q1 2026 Net sales 100.0% 100.0% 100.0% 100.0% 100.0% 100.0% Cost of
sales -69.2% -64.6% -63.2% -61.9% -63.3% -57.8% Gross profit 30.8% 35.4% 36.8% 38.1% 36.7% 42.2% Administrative expenses -10.8% -11.9% -12.8% -13.8% -14.0% -12.5% Selling and distribution
expenses -3.1% -3.6% -4.1% -4.4% -4.5% -5.4% Other operating revenue, net -0.2% -0.7% -0.1% -3.6% 1.0% 0.9% Impairment of property, plant, and equipment 0.0% -1.9% 0.0% 0.0% 0.0% 0.0% Operating
income 16.8% 17.3% 19.8% 16.4% 19.2% 25.1% Financial revenue 0.2% 0.4% 0.3% 0.5% 0.1% 0.1% Financial expenses -4.5% -5.3% -5.1% -4.4% -4.6% -3.9% Exchange difference, net 0.0% 0.3% 0.0% 0.1% 0.2% -0.1% Net gain /
loss from derivative financial instruments at fair value 0.0% 0.0% 0.0% 0.0% 0.0% 0.0% through profit and loss Accumulated net loss from settlement of derivative financial 0.0% 0.0% 0.0% 0.0% 0.0% 0.0% instruments at fair
value through profit and loss Income before taxes 12.4% 12.6% 15.0% 12.7% 14.8% 21.2% Income tax -4.0% -3.9% -4.9% -5.4% -4.3% -6.5% Net income 8.4% 8.7% 10.1% 7.3% 10.6% 14.7% Source: CPAC audited financial statements
2022-2025, and interim financial statements as of March 31, 2025 and 2026. Prepared by: EQUBO. 2023 figures according to the comparative of the 2025 audited financial statements. The sustained improvement in gross margin (30.8% in 2022 to
42.2% in Q1 2026) reflects a lower impact of cost of sales and greater business efficiency at the production level. However, the greater weight of operating expenses partially limited their flow-through to income, particularly in 2025, also
affected by non-recurring expenses associated with Holcim-ASPI. In Q1 2026, the normalization of these effects allows for greater conversion of gross margin into operating income (25.1%), while the lower incidence of financial expenses
(3.9% vs. 4.4% in 2025) contributes to raising the net margin to 14.7%, the highest of the analyzed period.
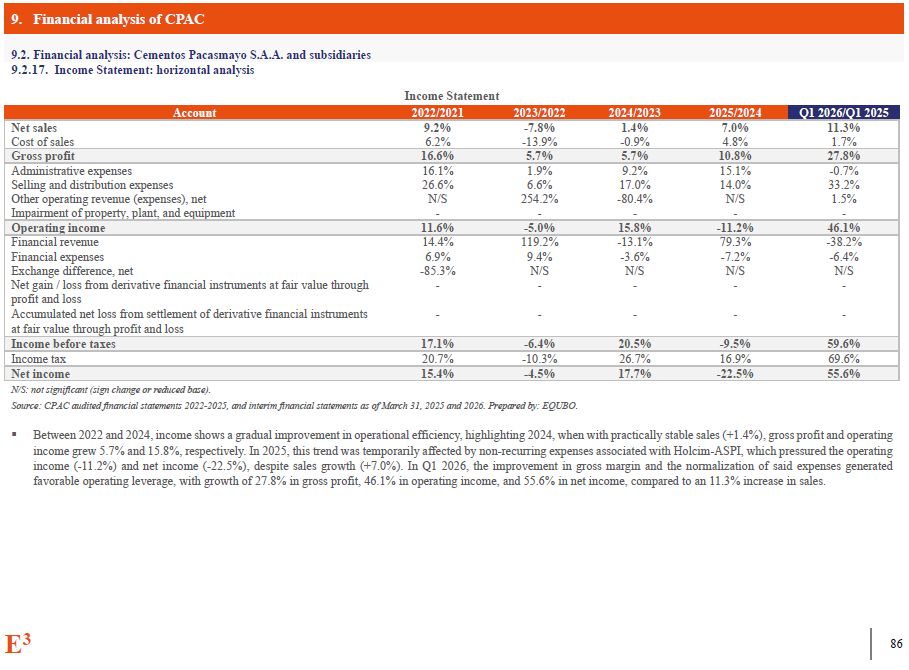
9. Financial analysis of CPAC 9.2. Financial analysis: Cementos Pacasmayo
S.A.A. and subsidiaries E3 100 9.2.17. Income Statement: horizontal analysis Income Statement Account 2022/2021 2023/2022 2024/2023 2025/2024 Q1 2026/Q1 2025 Net sales 9.2% -7.8% 1.4% 7.0% 11.3% Cost of
sales 6.2% -13.9% -0.9% 4.8% 1.7% Gross profit 16.6% 5.7% 5.7% 10.8% 27.8% Administrative expenses 16.1% 1.9% 9.2% 15.1% -0.7% Selling and distribution expenses 26.6% 6.6% 17.0% 14.0% 33.2% Other operating revenue
(expenses), net N/S 254.2% -80.4% N/S 1.5% Impairment of property, plant, and equipment - - - - - Operating income 11.6% -5.0% 15.8% -11.2% 46.1% Financial revenue 14.4% 119.2% -13.1% 79.3% -38.2% Financial
expenses 6.9% 9.4% -3.6% -7.2% -6.4% Exchange difference, net -85.3% N/S N/S N/S N/S Net gain / loss from derivative financial instruments at fair value through - - - - - profit and loss Accumulated net loss from
settlement of derivative financial instruments - - - - - at fair value through profit and loss Income before taxes 17.1% -6.4% 20.5% -9.5% 59.6% Income tax 20.7% -10.3% 26.7% 16.9% 69.6% Net
income 15.4% -4.5% 17.7% -22.5% 55.6% N/S: not significant (sign change or reduced base). Source: CPAC audited financial statements 2022-2025, and interim financial statements as of March 31, 2025 and 2026. Prepared by:
EQUBO. Between 2022 and 2024, income shows a gradual improvement in operational efficiency, highlighting 2024, when with practically stable sales (+1.4%), gross profit and operating income grew 5.7% and 15.8%, respectively. In 2025, this
trend was temporarily affected by non-recurring expenses associated with Holcim-ASPI, which pressured the operating income (-11.2%) and net income (-22.5%), despite sales growth (+7.0%). In Q1 2026, the improvement in gross margin and the
normalization of said expenses generated favorable operating leverage, with growth of 27.8% in gross profit, 46.1% in operating income, and 55.6% in net income, compared to an 11.3% increase in sales.
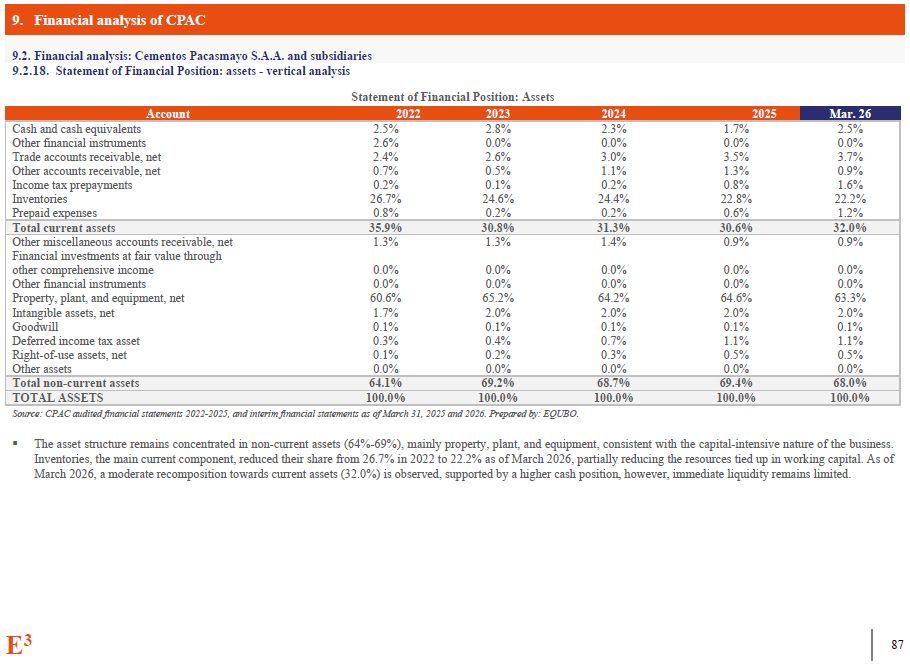
9. Financial analysis of CPAC 9.2. Financial analysis: Cementos Pacasmayo
S.A.A. and subsidiaries E3 100 9.2.18. Statement of Financial Position: assets - vertical analysis Statement of Financial Position: Assets Account 2022 2023 2024 2025 Mar. 26 Cash and cash
equivalents 2.5% 2.8% 2.3% 1.7% 2.5% Other financial instruments 2.6% 0.0% 0.0% 0.0% 0.0% Trade accounts receivable, net 2.4% 2.6% 3.0% 3.5% 3.7% Other accounts receivable, net 0.7% 0.5% 1.1% 1.3% 0.9% Income tax
prepayments 0.2% 0.1% 0.2% 0.8% 1.6% Inventories 26.7% 24.6% 24.4% 22.8% 22.2% Prepaid expenses 0.8% 0.2% 0.2% 0.6% 1.2% Total current assets 35.9% 30.8% 31.3% 30.6% 32.0% Other miscellaneous accounts receivable,
net 1.3% 1.3% 1.4% 0.9% 0.9% Financial investments at fair value through other comprehensive income 0.0% 0.0% 0.0% 0.0% 0.0% Other financial instruments 0.0% 0.0% 0.0% 0.0% 0.0% Property, plant, and equipment,
net 60.6% 65.2% 64.2% 64.6% 63.3% Intangible assets, net 1.7% 2.0% 2.0% 2.0% 2.0% Goodwill 0.1% 0.1% 0.1% 0.1% 0.1% Deferred income tax asset 0.3% 0.4% 0.7% 1.1% 1.1% Right-of-use assets,
net 0.1% 0.2% 0.3% 0.5% 0.5% Other assets 0.0% 0.0% 0.0% 0.0% 0.0% Total non-current assets 64.1% 69.2% 68.7% 69.4% 68.0% TOTAL ASSETS 100.0% 100.0% 100.0% 100.0% 100.0% Source: CPAC audited financial statements
2022-2025, and interim financial statements as of March 31, 2025 and 2026. Prepared by: EQUBO. The asset structure remains concentrated in non-current assets (64%-69%), mainly property, plant, and equipment, consistent with the
capital-intensive nature of the business. Inventories, the main current component, reduced their share from 26.7% in 2022 to 22.2% as of March 2026, partially reducing the resources tied up in working capital. As of March 2026, a moderate
recomposition towards current assets (32.0%) is observed, supported by a higher cash position, however, immediate liquidity remains limited.
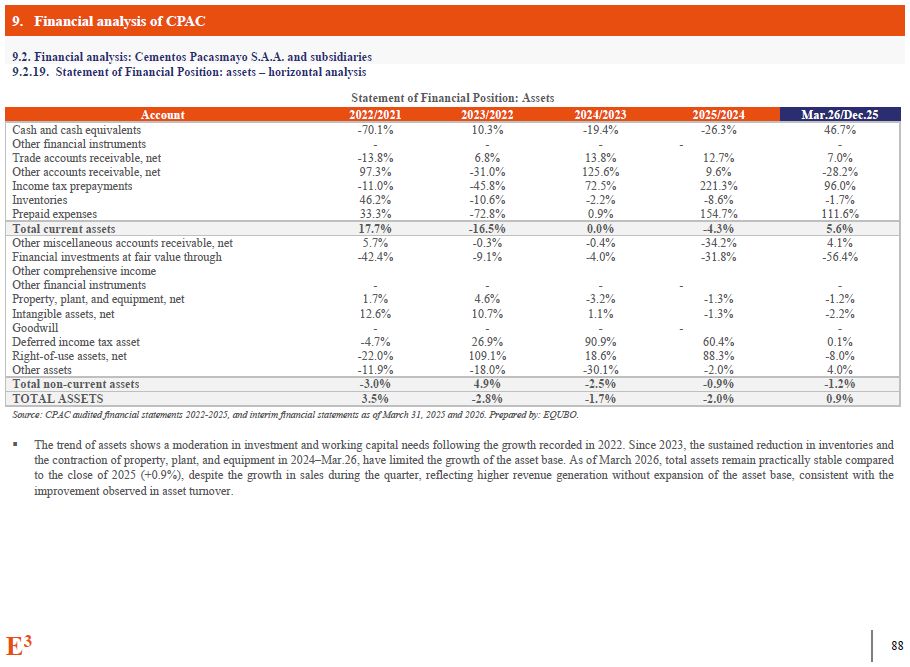
9. Financial analysis of CPAC 9.2. Financial analysis: Cementos Pacasmayo
S.A.A. and subsidiaries E3 100 9.2.19. Statement of Financial Position: assets – horizontal analysis Statement of Financial Position: Assets Account 2022/2021 2023/2022 2024/2023 2025/2024 Mar.26/Dec.25 Cash and cash
equivalents -70.1% 10.3% -19.4% -26.3% 46.7% Other financial instruments - - - - - Trade accounts receivable, net -13.8% 6.8% 13.8% 12.7% 7.0% Other accounts receivable, net 97.3% -31.0% 125.6% 9.6% -28.2% Income tax
prepayments -11.0% -45.8% 72.5% 221.3% 96.0% Inventories 46.2% -10.6% -2.2% -8.6% -1.7% Prepaid expenses 33.3% -72.8% 0.9% 154.7% 111.6% Total current assets 17.7% -16.5% 0.0% -4.3% 5.6% Other miscellaneous accounts
receivable, net 5.7% -0.3% -0.4% -34.2% 4.1% Financial investments at fair value through -42.4% -9.1% -4.0% -31.8% -56.4% Other comprehensive income Other financial instruments - - - - - Property, plant, and equipment,
net 1.7% 4.6% -3.2% -1.3% -1.2% Intangible assets, net 12.6% 10.7% 1.1% -1.3% -2.2% Goodwill - - - - - Deferred income tax asset -4.7% 26.9% 90.9% 60.4% 0.1% Right-of-use assets,
net -22.0% 109.1% 18.6% 88.3% -8.0% Other assets -11.9% -18.0% -30.1% -2.0% 4.0% Total non-current assets -3.0% 4.9% -2.5% -0.9% -1.2% TOTAL ASSETS 3.5% -2.8% -1.7% -2.0% 0.9% Source: CPAC audited financial
statements 2022-2025, and interim financial statements as of March 31, 2025 and 2026. Prepared by: EQUBO. The trend of assets shows a moderation in investment and working capital needs following the growth recorded in 2022. Since 2023, the
sustained reduction in inventories and the contraction of property, plant, and equipment in 2024–Mar.26, have limited the growth of the asset base. As of March 2026, total assets remain practically stable compared to the close of 2025
(+0.9%), despite the growth in sales during the quarter, reflecting higher revenue generation without expansion of the asset base, consistent with the improvement observed in asset turnover.
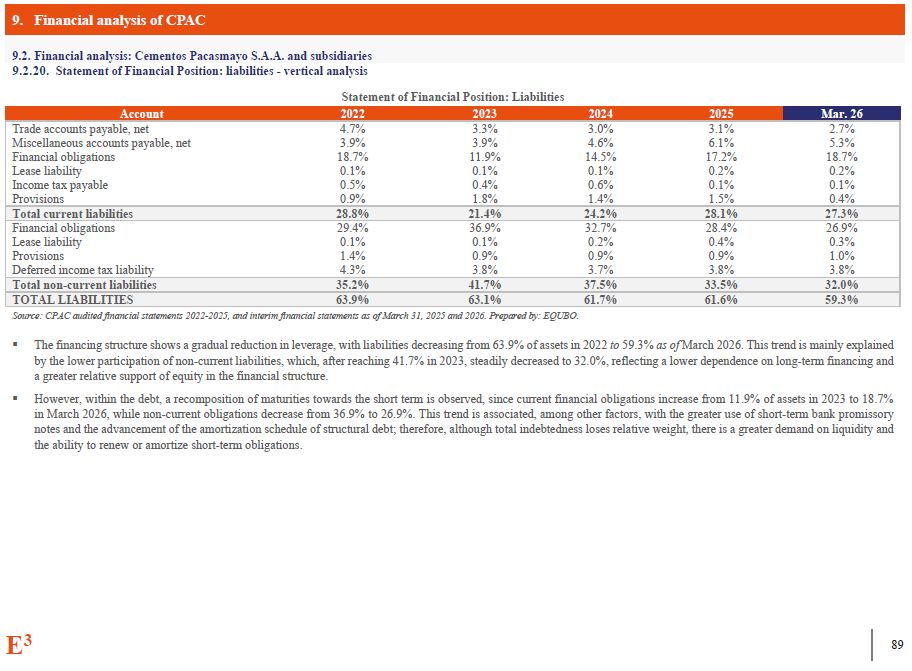
9. Financial analysis of CPAC 9.2. Financial analysis: Cementos Pacasmayo
S.A.A. and subsidiaries E3 100 9.2.20. Statement of Financial Position: liabilities - vertical analysis Statement of Financial Position: Liabilities Account 2022 2023 2024 2025 Mar. 26 Trade accounts payable,
net 4.7% 3.3% 3.0% 3.1% 2.7% Miscellaneous accounts payable, net 3.9% 3.9% 4.6% 6.1% 5.3% Financial obligations 18.7% 11.9% 14.5% 17.2% 18.7% Lease liability 0.1% 0.1% 0.1% 0.2% 0.2% Income tax
payable 0.5% 0.4% 0.6% 0.1% 0.1% Provisions 0.9% 1.8% 1.4% 1.5% 0.4% Total current liabilities 28.8% 21.4% 24.2% 28.1% 27.3% Financial obligations 29.4% 36.9% 32.7% 28.4% 26.9% Lease
liability 0.1% 0.1% 0.2% 0.4% 0.3% Provisions 1.4% 0.9% 0.9% 0.9% 1.0% Deferred income tax liability 4.3% 3.8% 3.7% 3.8% 3.8% Total non-current liabilities 35.2% 41.7% 37.5% 33.5% 32.0% TOTAL
LIABILITIES 63.9% 63.1% 61.7% 61.6% 59.3% Source: CPAC audited financial statements 2022-2025, and interim financial statements as of March 31, 2025 and 2026. Prepared by: EQUBO. The financing structure shows a gradual reduction in
leverage, with liabilities decreasing from 63.9% of assets in 2022 to 59.3% as of March 2026. This trend is mainly explained by the lower participation of non-current liabilities, which, after reaching 41.7% in 2023, steadily decreased to
32.0%, reflecting a lower dependence on long-term financing and a greater relative support of equity in the financial structure. However, within the debt, a recomposition of maturities towards the short term is observed, since current
financial obligations increase from 11.9% of assets in 2023 to 18.7% in March 2026, while non-current obligations decrease from 36.9% to 26.9%. This trend is associated, among other factors, with the greater use of short-term bank
promissory notes and the advancement of the amortization schedule of structural debt; therefore, although total indebtedness loses relative weight, there is a greater demand on liquidity and the ability to renew or amortize short-term
obligations.
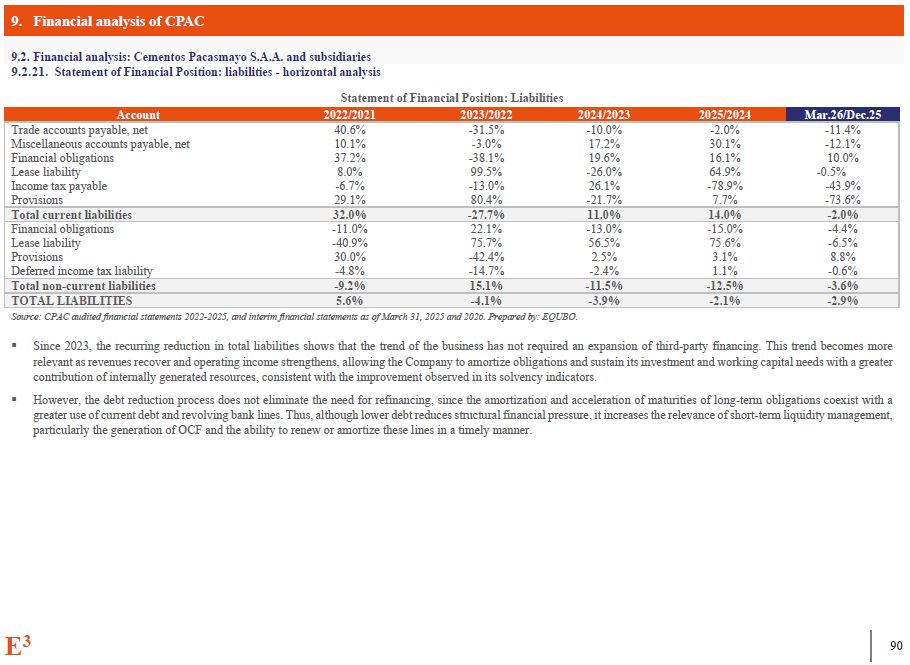
9. Financial analysis of CPAC 9.2. Financial analysis: Cementos Pacasmayo
S.A.A. and subsidiaries E3 100 9.2.21. Statement of Financial Position: liabilities - horizontal analysis Statement of Financial Position: Liabilities Account 2022/2021 2023/2022 2024/2023 2025/2024 Mar.26/Dec.25 Trade accounts
payable, net 40.6% -31.5% -10.0% -2.0% -11.4% Miscellaneous accounts payable, net 10.1% -3.0% 17.2% 30.1% -12.1% Financial obligations 37.2% -38.1% 19.6% 16.1% 10.0% Lease
liability 8.0% 99.5% -26.0% 64.9% -0.5% Income tax payable -6.7% -13.0% 26.1% -78.9% -43.9% Provisions 29.1% 80.4% -21.7% 7.7% -73.6% Total current liabilities 32.0% -27.7% 11.0% 14.0% -2.0% Financial
obligations -11.0% 22.1% -13.0% -15.0% -4.4% Lease liability -40.9% 75.7% 56.5% 75.6% -6.5% Provisions 30.0% -42.4% 2.5% 3.1% 8.8% Deferred income tax liability -4.8% -14.7% -2.4% 1.1% -0.6% Total non-current
liabilities -9.2% 15.1% -11.5% -12.5% -3.6% TOTAL LIABILITIES 5.6% -4.1% -3.9% -2.1% -2.9% Source: CPAC audited financial statements 2022-2025, and interim financial statements as of March 31, 2025 and 2026. Prepared by:
EQUBO. Since 2023, the recurring reduction in total liabilities shows that the trend of the business has not required an expansion of third-party financing. This trend becomes more relevant as revenues recover and operating income
strengthens, allowing the Company to amortize obligations and sustain its investment and working capital needs with a greater contribution of internally generated resources, consistent with the improvement observed in its solvency
indicators. However, the debt reduction process does not eliminate the need for refinancing, since the amortization and acceleration of maturities of long-term obligations coexist with a greater use of current debt and revolving bank
lines. Thus, although lower debt reduces structural financial pressure, it increases the relevance of short-term liquidity management, particularly the generation of OCF and the ability to renew or amortize these lines in a timely manner.
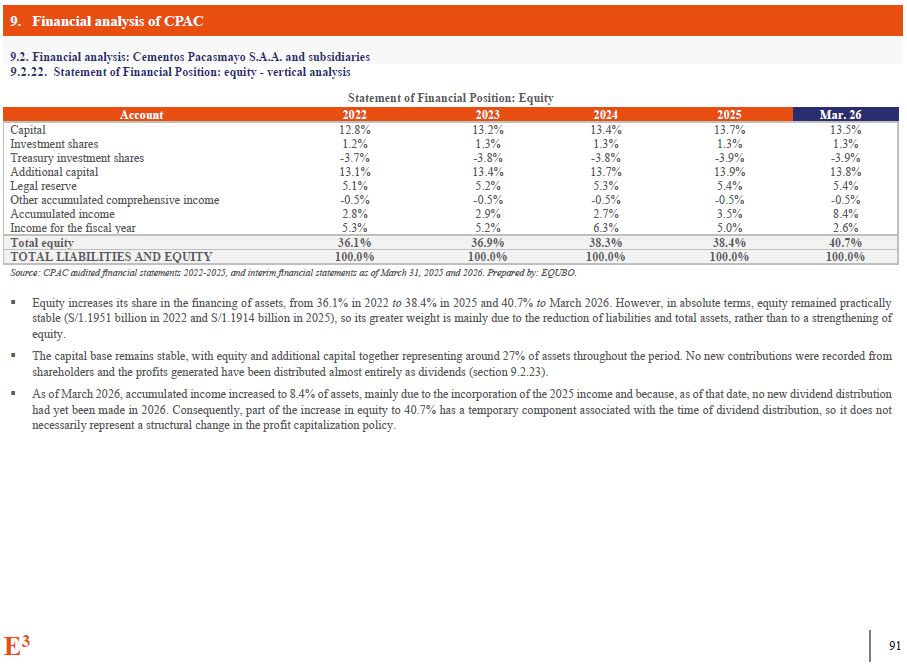
9. Financial analysis of CPAC 9.2. Financial analysis: Cementos Pacasmayo
S.A.A. and subsidiaries E3 100 9.2.22. Statement of Financial Position: equity - vertical analysis Statement of Financial Position: Equity Account 2022 2023 2024 2025 Mar. 26 Capital 12.8% 13.2% 13.4% 13.7% 13.5% Investment
shares 1.2% 1.3% 1.3% 1.3% 1.3% Treasury investment shares -3.7% -3.8% -3.8% -3.9% -3.9% Additional capital 13.1% 13.4% 13.7% 13.9% 13.8% Legal reserve 5.1% 5.2% 5.3% 5.4% 5.4% Other accumulated comprehensive
income -0.5% -0.5% -0.5% -0.5% -0.5% Accumulated income 2.8% 2.9% 2.7% 3.5% 8.4% Income for the fiscal year 5.3% 5.2% 6.3% 5.0% 2.6% Total equity 36.1% 36.9% 38.3% 38.4% 40.7% TOTAL LIABILITIES AND
EQUITY 100.0% 100.0% 100.0% 100.0% 100.0% Source: CPAC audited financial statements 2022-2025, and interim financial statements as of March 31, 2025 and 2026. Prepared by: EQUBO. Equity increases its share in the financing of assets,
from 36.1% in 2022 to 38.4% in 2025 and 40.7% to March 2026. However, in absolute terms, equity remained practically stable (S/1.1951 billion in 2022 and S/1.1914 billion in 2025), so its greater weight is mainly due to the reduction of
liabilities and total assets, rather than to a strengthening of equity. The capital base remains stable, with equity and additional capital together representing around 27% of assets throughout the period. No new contributions were
recorded from shareholders and the profits generated have been distributed almost entirely as dividends (section 9.2.23). As of March 2026, accumulated income increased to 8.4% of assets, mainly due to the incorporation of the 2025 income
and because, as of that date, no new dividend distribution had yet been made in 2026. Consequently, part of the increase in equity to 40.7% has a temporary component associated with the time of dividend distribution, so it does not
necessarily represent a structural change in the profit capitalization policy.
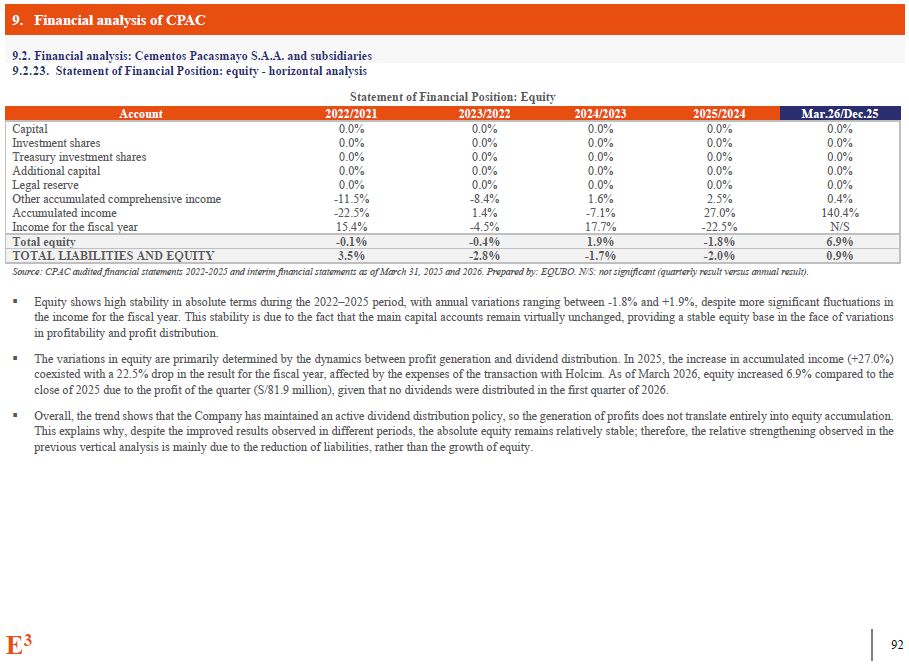
9. Financial analysis of CPAC 9.2. Financial analysis: Cementos Pacasmayo
S.A.A. and subsidiaries E3 100 9.2.23. Statement of Financial Position: equity - horizontal analysis Statement of Financial Position:
Equity Account 2022/2021 2023/2022 2024/2023 2025/2024 Mar.26/Dec.25 Capital 0.0% 0.0% 0.0% 0.0% 0.0% Investment shares 0.0% 0.0% 0.0% 0.0% 0.0% Treasury investment shares 0.0% 0.0% 0.0% 0.0% 0.0% Additional
capital 0.0% 0.0% 0.0% 0.0% 0.0% Legal reserve 0.0% 0.0% 0.0% 0.0% 0.0% Other accumulated comprehensive income -11.5% -8.4% 1.6% 2.5% 0.4% Accumulated income -22.5% 1.4% -7.1% 27.0% 140.4% Income for the fiscal
year 15.4% -4.5% 17.7% -22.5% N/S Total equity -0.1% -0.4% 1.9% -1.8% 6.9% TOTAL LIABILITIES AND EQUITY 3.5% -2.8% -1.7% -2.0% 0.9% Source: CPAC audited financial statements 2022-2025 and interim financial statements as of
March 31, 2025 and 2026. Prepared by: EQUBO. N/S: not significant (quarterly result versus annual result). Equity shows high stability in absolute terms during the 2022–2025 period, with annual variations ranging between -1.8% and +1.9%,
despite more significant fluctuations in the income for the fiscal year. This stability is due to the fact that the main capital accounts remain virtually unchanged, providing a stable equity base in the face of variations in profitability
and profit distribution. The variations in equity are primarily determined by the dynamics between profit generation and dividend distribution. In 2025, the increase in accumulated income (+27.0%) coexisted with a 22.5% drop in the result
for the fiscal year, affected by the expenses of the transaction with Holcim. As of March 2026, equity increased 6.9% compared to the close of 2025 due to the profit of the quarter (S/81.9 million), given that no dividends were distributed
in the first quarter of 2026. Overall, the trend shows that the Company has maintained an active dividend distribution policy, so the generation of profits does not translate entirely into equity accumulation. This explains why, despite
the improved results observed in different periods, the absolute equity remains relatively stable; therefore, the relative strengthening observed in the previous vertical analysis is mainly due to the reduction of liabilities, rather than
the growth of equity.
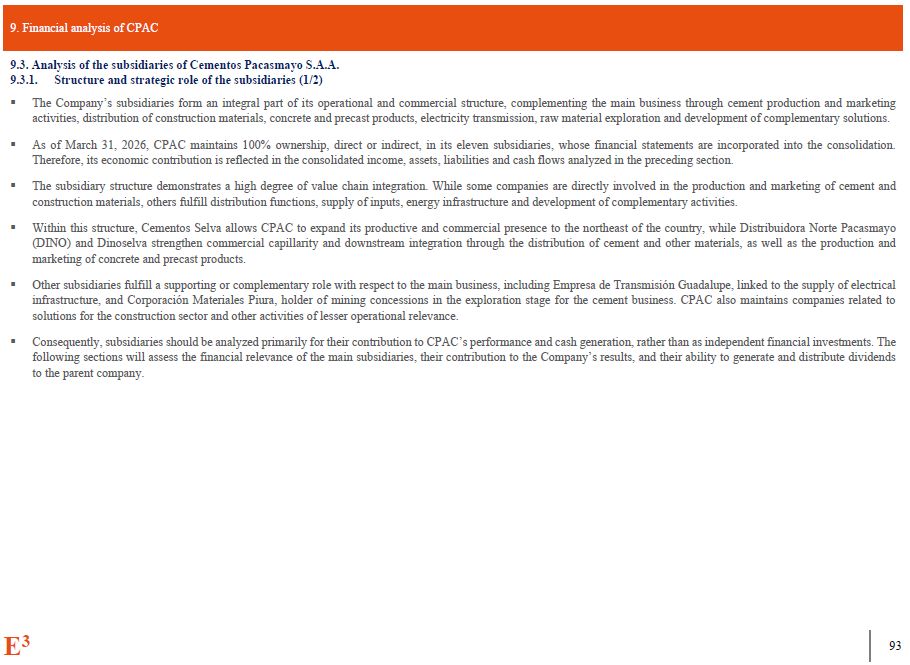
9. Financial analysis of CPAC E3 100 Analysis of the subsidiaries of
Cementos Pacasmayo S.A.A. Structure and strategic role of the subsidiaries (1/2) The Company’s subsidiaries form an integral part of its operational and commercial structure, complementing the main business through cement production and
marketing activities, distribution of construction materials, concrete and precast products, electricity transmission, raw material exploration and development of complementary solutions. As of March 31, 2026, CPAC maintains 100%
ownership, direct or indirect, in its eleven subsidiaries, whose financial statements are incorporated into the consolidation. Therefore, its economic contribution is reflected in the consolidated income, assets, liabilities and cash flows
analyzed in the preceding section. The subsidiary structure demonstrates a high degree of value chain integration. While some companies are directly involved in the production and marketing of cement and construction materials, others
fulfill distribution functions, supply of inputs, energy infrastructure and development of complementary activities. Within this structure, Cementos Selva allows CPAC to expand its productive and commercial presence to the northeast of the
country, while Distribuidora Norte Pacasmayo (DINO) and Dinoselva strengthen commercial capillarity and downstream integration through the distribution of cement and other materials, as well as the production and marketing of concrete and
precast products. Other subsidiaries fulfill a supporting or complementary role with respect to the main business, including Empresa de Transmisión Guadalupe, linked to the supply of electrical infrastructure, and Corporación Materiales
Piura, holder of mining concessions in the exploration stage for the cement business. CPAC also maintains companies related to solutions for the construction sector and other activities of lesser operational relevance. Consequently,
subsidiaries should be analyzed primarily for their contribution to CPAC’s performance and cash generation, rather than as independent financial investments. The following sections will assess the financial relevance of the main
subsidiaries, their contribution to the Company’s results, and their ability to generate and distribute dividends to the parent company.
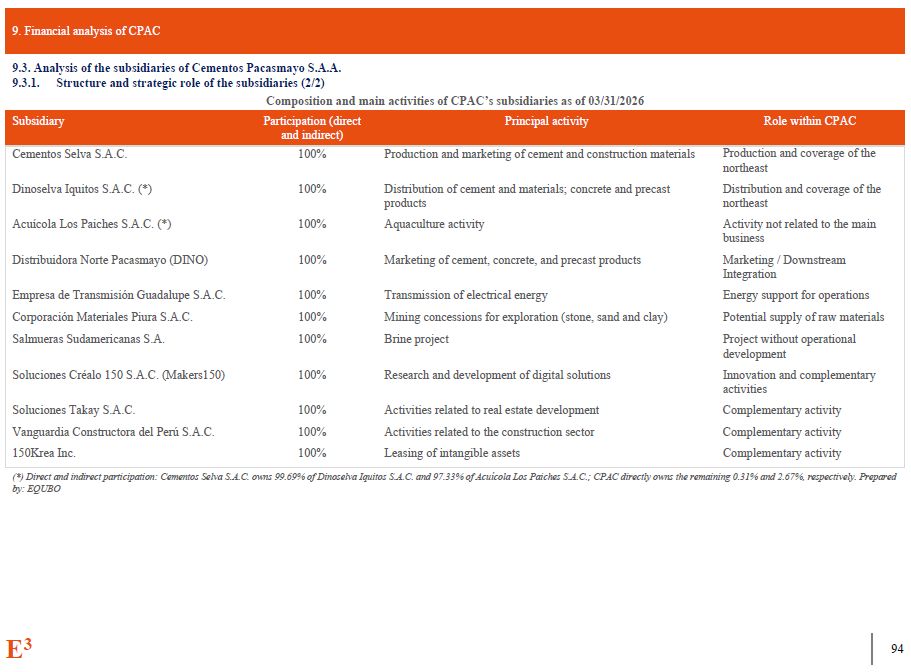
9. Financial analysis of CPAC E3 100 Analysis of the subsidiaries of
Cementos Pacasmayo S.A.A. Structure and strategic role of the subsidiaries (2/2) Composition and main activities of CPAC’s subsidiaries as of 03/31/2026 Subsidiary Participation (direct and indirect) Principal activity Role within
CPAC Cementos Selva S.A.C. 100% Production and marketing of cement and construction materials Production and coverage of the northeast Dinoselva Iquitos S.A.C. (*) 100% Distribution of cement and materials; concrete and precast
products Distribution and coverage of the northeast Acuícola Los Paiches S.A.C. (*) 100% Aquaculture activity Activity not related to the main business Distribuidora Norte Pacasmayo (DINO) 100% Marketing of cement, concrete, and
precast products Marketing / Downstream Integration Empresa de Transmisión Guadalupe S.A.C. 100% Transmission of electrical energy Energy support for operations Corporación Materiales Piura S.A.C. 100% Mining concessions for
exploration (stone, sand and clay) Potential supply of raw materials Salmueras Sudamericanas S.A. 100% Brine project Project without operational development Soluciones Créalo 150 S.A.C. (Makers150) 100% Research and development of
digital solutions Innovation and complementary activities Soluciones Takay S.A.C. 100% Activities related to real estate development Complementary activity Vanguardia Constructora del Perú S.A.C. 100% Activities related to the
construction sector Complementary activity 150Krea Inc. 100% Leasing of intangible assets Complementary activity (*) Direct and indirect participation: Cementos Selva S.A.C. owns 99.69% of Dinoselva Iquitos S.A.C. and 97.33% of
Acuícola Los Paiches S.A.C.; CPAC directly owns the remaining 0.31% and 2.67%, respectively. Prepared by: EQUBO
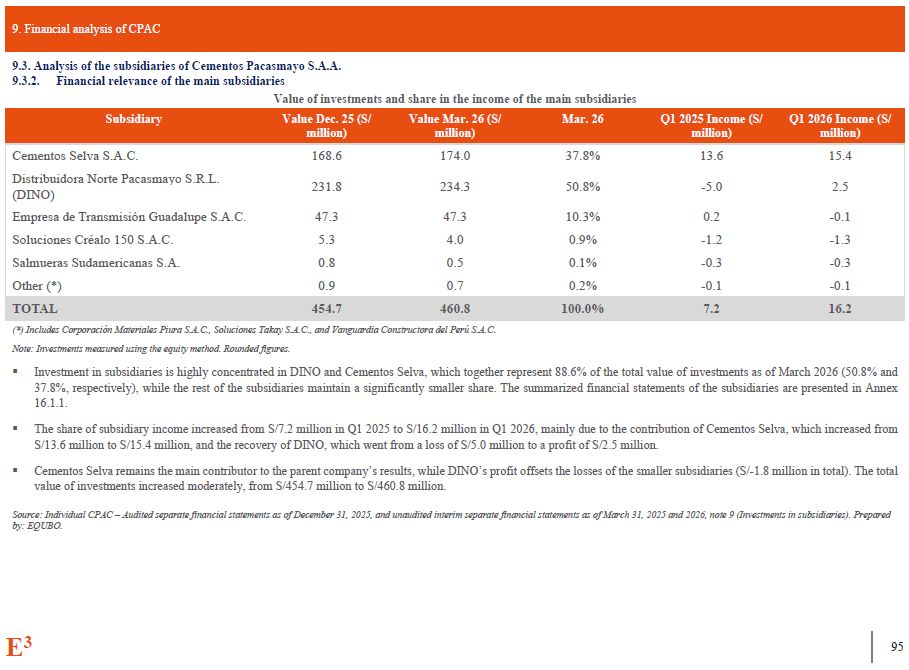
9. Financial analysis of CPAC E3 100 9.3. Analysis of the subsidiaries of
Cementos Pacasmayo S.A.A. 9.3.2. Financial relevance of the main subsidiaries Value of investments and share in the income of the main subsidiaries Subsidiary Value Dec. 25 (S/ million) Value Mar. 26 (S/ million) Mar. 26 Q1 2025
Income (S/ million) Q1 2026 Income (S/ million) Cementos Selva S.A.C. 168.6 174.0 37.8% 13.6 15.4 Distribuidora Norte Pacasmayo S.R.L. 231.8 234.3 50.8% -5.0 2.5 (DINO) Empresa de Transmisión Guadalupe
S.A.C. 47.3 47.3 10.3% 0.2 -0.1 Soluciones Créalo 150 S.A.C. 5.3 4.0 0.9% -1.2 -1.3 Salmueras Sudamericanas S.A. 0.8 0.5 0.1% -0.3 -0.3 Other (*) 0.9 0.7 0.2% -0.1 -0.1 TOTAL 454.7 460.8 100.0% 7.2 16.2 (*)
Includes Corporación Materiales Piura S.A.C., Soluciones Takay S.A.C., and Vanguardia Constructora del Perú S.A.C. Note: Investments measured using the equity method. Rounded figures. Investment in subsidiaries is highly concentrated in
DINO and Cementos Selva, which together represent 88.6% of the total value of investments as of March 2026 (50.8% and 37.8%, respectively), while the rest of the subsidiaries maintain a significantly smaller share. The summarized financial
statements of the subsidiaries are presented in Annex 16.1.1. The share of subsidiary income increased from S/7.2 million in Q1 2025 to S/16.2 million in Q1 2026, mainly due to the contribution of Cementos Selva, which increased from
S/13.6 million to S/15.4 million, and the recovery of DINO, which went from a loss of S/5.0 million to a profit of S/2.5 million. Cementos Selva remains the main contributor to the parent company’s results, while DINO’s profit offsets the
losses of the smaller subsidiaries (S/-1.8 million in total). The total value of investments increased moderately, from S/454.7 million to S/460.8 million. Source: Individual CPAC – Audited separate financial statements as of December 31,
2025, and unaudited interim separate financial statements as of March 31, 2025 and 2026, note 9 (Investments in subsidiaries). Prepared by: EQUBO.
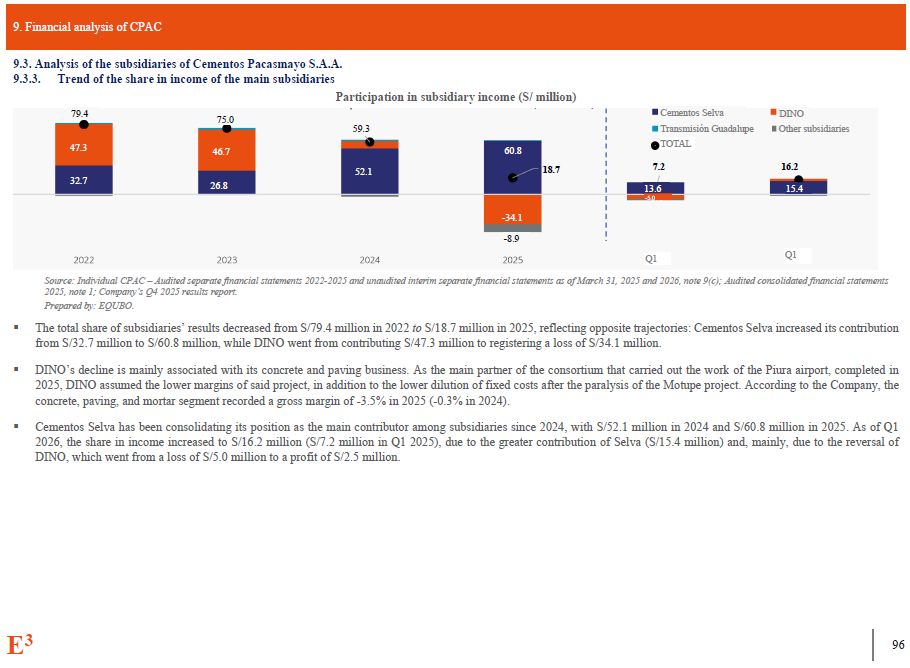
9. Financial analysis of CPAC 9.3. Analysis of the subsidiaries of Cementos
Pacasmayo S.A.A. 9.3.3. Trend of the share in income of the main subsidiaries Participation in subsidiary income (S/ million) Source: Individual CPAC – Audited separate financial statements 2022-2025 and unaudited interim separate
financial statements as of March 31, 2025 and 2026, note 9(c); Audited consolidated financial statements 2025, note 1; Company’s Q4 2025 results report. Prepared by: EQUBO. The total share of subsidiaries’ results decreased from S/79.4
million in 2022 to S/18.7 million in 2025, reflecting opposite trajectories: Cementos Selva increased its contribution from S/32.7 million to S/60.8 million, while DINO went from contributing S/47.3 million to registering a loss of S/34.1
million. DINO’s decline is mainly associated with its concrete and paving business. As the main partner of the consortium that carried out the work of the Piura airport, completed in 2025, DINO assumed the lower margins of said project, in
addition to the lower dilution of fixed costs after the paralysis of the Motupe project. According to the Company, the concrete, paving, and mortar segment recorded a gross margin of -3.5% in 2025 (-0.3% in 2024). Cementos Selva has been
consolidating its position as the main contributor among subsidiaries since 2024, with S/52.1 million in 2024 and S/60.8 million in 2025. As of Q1 2026, the share in income increased to S/16.2 million (S/7.2 million in Q1 2025), due to the
greater contribution of Selva (S/15.4 million) and, mainly, due to the reversal of DINO, which went from a loss of S/5.0 million to a profit of S/2.5
million. 79.4 75.0 59.3 18.7 47.3 32.7 46.7 26.8 52.1 -34.1 -8.9 60.8 15.4 13.6 -5.0 Cementos Selva Transmisión Guadalupe DINO Other subsidiaries TOTAL 7.2 16.2 Q1 Q1 E3 100
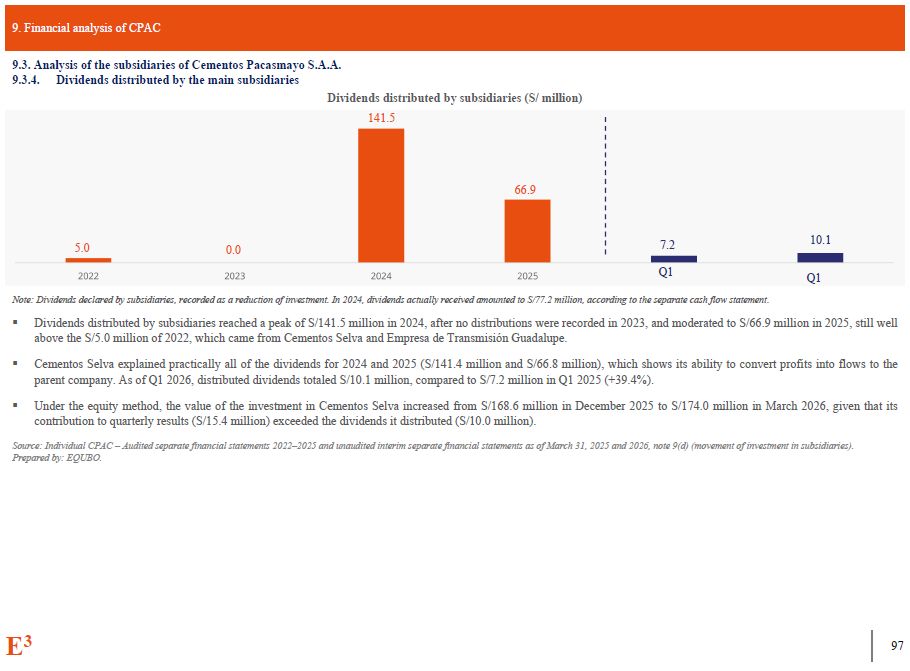
9. Financial analysis of CPAC Note: Dividends declared by subsidiaries,
recorded as a reduction of investment. In 2024, dividends actually received amounted to S/77.2 million, according to the separate cash flow statement. Dividends distributed by subsidiaries reached a peak of S/141.5 million in 2024, after
no distributions were recorded in 2023, and moderated to S/66.9 million in 2025, still well above the S/5.0 million of 2022, which came from Cementos Selva and Empresa de Transmisión Guadalupe. Cementos Selva explained practically all of
the dividends for 2024 and 2025 (S/141.4 million and S/66.8 million), which shows its ability to convert profits into flows to the parent company. As of Q1 2026, distributed dividends totaled S/10.1 million, compared to S/7.2 million in Q1
2025 (+39.4%). Under the equity method, the value of the investment in Cementos Selva increased from S/168.6 million in December 2025 to S/174.0 million in March 2026, given that its contribution to quarterly results (S/15.4 million)
exceeded the dividends it distributed (S/10.0 million). Source: Individual CPAC – Audited separate financial statements 2022–2025 and unaudited interim separate financial statements as of March 31, 2025 and 2026, note 9(d) (movement of
investment in subsidiaries). Prepared by: EQUBO. 5.0 0.0 9.3. Analysis of the subsidiaries of Cementos Pacasmayo S.A.A. 9.3.4. Dividends distributed by the main subsidiaries Dividends distributed by subsidiaries (S/
million) 141.5 66.9 7.2 10.1 Q1 Q1 E3 100
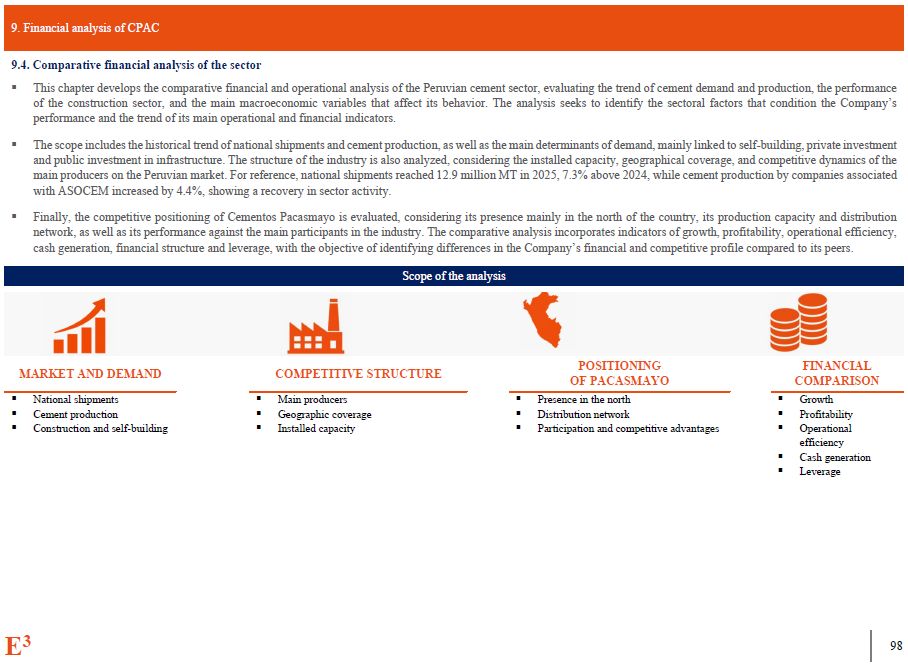
9. Financial analysis of CPAC 9.4. Comparative financial analysis of the
sector This chapter develops the comparative financial and operational analysis of the Peruvian cement sector, evaluating the trend of cement demand and production, the performance of the construction sector, and the main macroeconomic
variables that affect its behavior. The analysis seeks to identify the sectoral factors that condition the Company’s performance and the trend of its main operational and financial indicators. The scope includes the historical trend of
national shipments and cement production, as well as the main determinants of demand, mainly linked to self-building, private investment and public investment in infrastructure. The structure of the industry is also analyzed, considering
the installed capacity, geographical coverage, and competitive dynamics of the main producers on the Peruvian market. For reference, national shipments reached 12.9 million MT in 2025, 7.3% above 2024, while cement production by companies
associated with ASOCEM increased by 4.4%, showing a recovery in sector activity. Finally, the competitive positioning of Cementos Pacasmayo is evaluated, considering its presence mainly in the north of the country, its production capacity
and distribution network, as well as its performance against the main participants in the industry. The comparative analysis incorporates indicators of growth, profitability, operational efficiency, cash generation, financial structure and
leverage, with the objective of identifying differences in the Company’s financial and competitive profile compared to its peers. Scope of the analysis MARKET AND DEMAND COMPETITIVE STRUCTURE POSITIONING OF PACASMAYO FINANCIAL
COMPARISON National shipments Cement production Construction and self-building Main producers Geographic coverage Installed capacity Presence in the north Distribution network Participation and competitive
advantages Growth Profitability Operational efficiency Cash generation Leverage E3 100
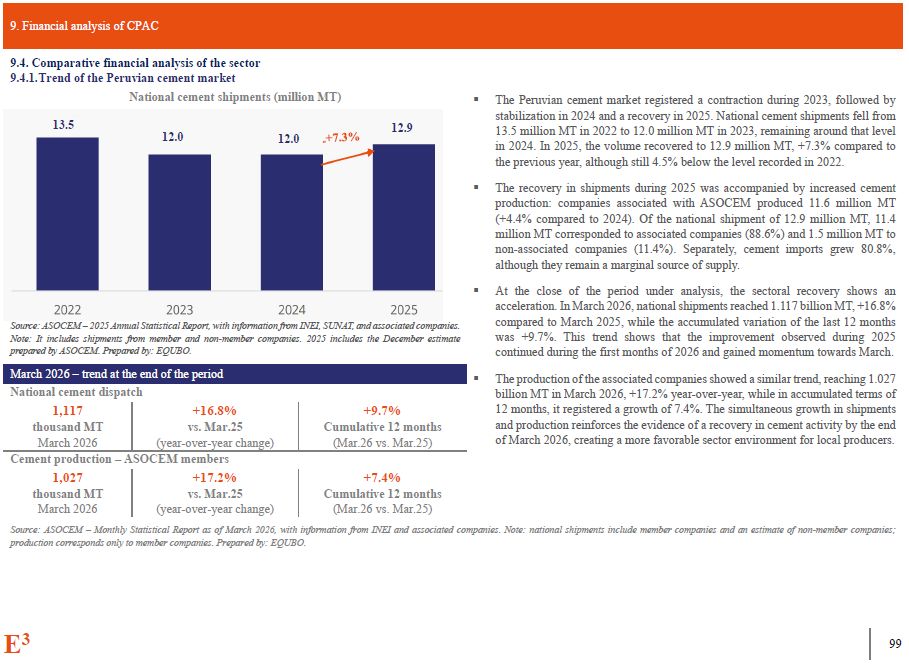
9. Financial analysis of CPAC Comparative financial analysis of the
sector Trend of the Peruvian cement market National cement shipments (million MT) The Peruvian cement market registered a contraction during 2023, followed by stabilization in 2024 and a recovery in 2025. National cement shipments fell
from 13.5 million MT in 2022 to 12.0 million MT in 2023, remaining around that level in 2024. In 2025, the volume recovered to 12.9 million MT, +7.3% compared to the previous year, although still 4.5% below the level recorded in 2022. The
recovery in shipments during 2025 was accompanied by increased cement production: companies associated with ASOCEM produced 11.6 million MT (+4.4% compared to 2024). Of the national shipment of 12.9 million MT, 11.4 million MT corresponded
to associated companies (88.6%) and 1.5 million MT to non-associated companies (11.4%). Separately, cement imports grew 80.8%, although they remain a marginal source of supply. At the close of the period under analysis, the sectoral
recovery shows an acceleration. In March 2026, national shipments reached 1.117 billion MT, +16.8% compared to March 2025, while the accumulated variation of the last 12 months was +9.7%. This trend shows that the improvement observed
during 2025 continued during the first months of 2026 and gained momentum towards March. The production of the associated companies showed a similar trend, reaching 1.027 billion MT in March 2026, +17.2% year-over-year, while in
accumulated terms of 12 months, it registered a growth of 7.4%. The simultaneous growth in shipments and production reinforces the evidence of a recovery in cement activity by the end of March 2026, creating a more favorable sector
environment for local producers. Source: ASOCEM – 2025 Annual Statistical Report, with information from INEI, SUNAT, and associated companies. Note: It includes shipments from member and non-member companies. 2025 includes the December
estimate prepared by ASOCEM. Prepared by: EQUBO. March 2026 – trend at the end of the period National cement dispatch 1,117 thousand MT March 2026 +16.8% vs. Mar.25 (year-over-year change) +9.7% Cumulative 12 months (Mar.26 vs.
Mar.25) Cement production – ASOCEM members 1,027 thousand MT March 2026 +17.2% vs. Mar.25 (year-over-year change) +7.4% Cumulative 12 months (Mar.26 vs. Mar.25) Source: ASOCEM – Monthly Statistical Report as of March 2026, with
information from INEI and associated companies. Note: national shipments include member companies and an estimate of non-member companies; production corresponds only to member companies. Prepared by:
EQUBO. 13.5 12.0 12.0 12.9 E3 100
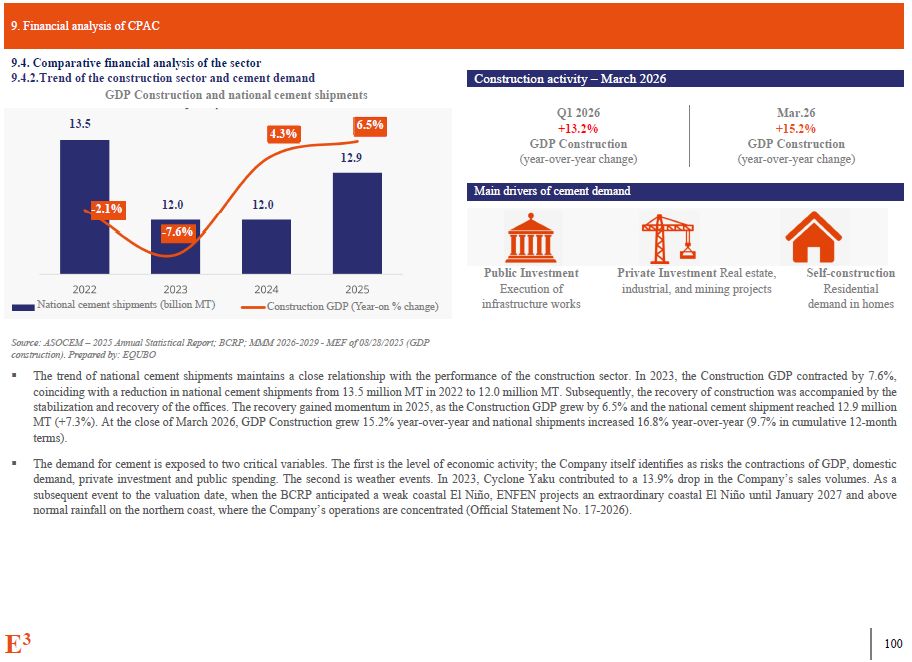
9. Financial analysis of CPAC 9.4. Comparative financial analysis of the
sector 9.4.2.Trend of the construction sector and cement demand GDP Construction and national cement shipments Construction activity – March 2026 Q1 2026 +13.2% GDP Construction (year-over-year change) Mar.26 +15.2% GDP
Construction (year-over-year change) Main drivers of cement demand Public Investment Execution of infrastructure works Private Investment Real estate, industrial, and mining projects Self-construction Residential demand in
homes Source: ASOCEM – 2025 Annual Statistical Report; BCRP; MMM 2026-2029 - MEF of 08/28/2025 (GDP construction). Prepared by: EQUBO The trend of national cement shipments maintains a close relationship with the performance of the
construction sector. In 2023, the Construction GDP contracted by 7.6%, coinciding with a reduction in national cement shipments from 13.5 million MT in 2022 to 12.0 million MT. Subsequently, the recovery of construction was accompanied by
the stabilization and recovery of the offices. The recovery gained momentum in 2025, as the Construction GDP grew by 6.5% and the national cement shipment reached 12.9 million MT (+7.3%). At the close of March 2026, GDP Construction grew
15.2% year-over-year and national shipments increased 16.8% year-over-year (9.7% in cumulative 12-month terms). The demand for cement is exposed to two critical variables. The first is the level of economic activity; the Company itself
identifies as risks the contractions of GDP, domestic demand, private investment and public spending. The second is weather events. In 2023, Cyclone Yaku contributed to a 13.9% drop in the Company’s sales volumes. As a subsequent event to
the valuation date, when the BCRP anticipated a weak coastal El Niño, ENFEN projects an extraordinary coastal El Niño until January 2027 and above normal rainfall on the northern coast, where the Company’s operations are concentrated
(Official Statement No. 17-2026). 12.0 12.0 12.9 National cement shipments (billion MT) Construction GDP (Year-on % change) -7.6% -2.1% 4.3% 13.5 6.5% E3 100
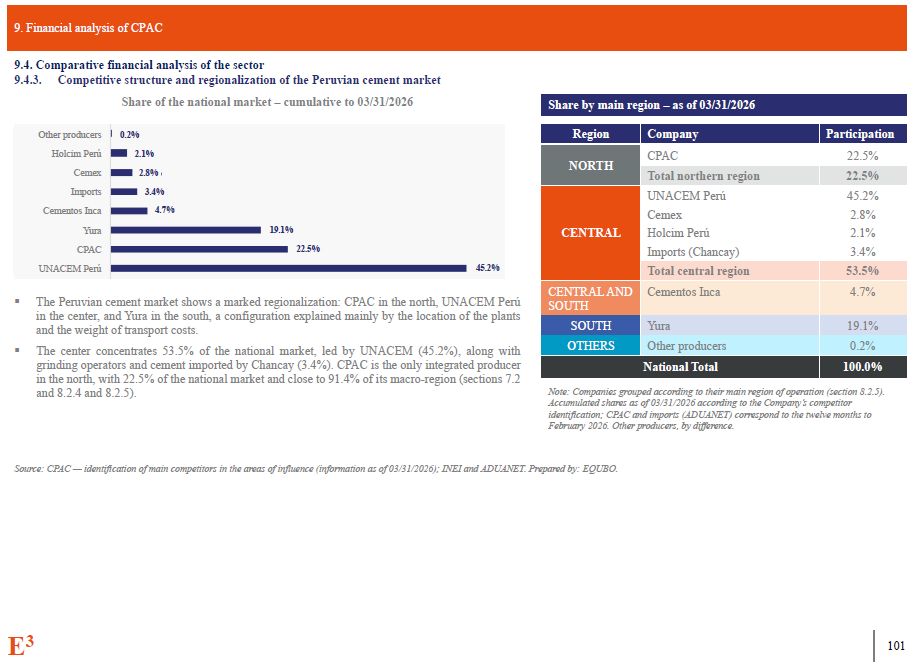
9. Financial analysis of CPAC 9.4. Comparative financial analysis of the
sector 9.4.3. Competitive structure and regionalization of the Peruvian cement market Share of the national market – cumulative to 03/31/2026 Share by main region – as of 03/31/2026 The Peruvian cement market shows a marked
regionalization: CPAC in the north, UNACEM Perú in the center, and Yura in the south, a configuration explained mainly by the location of the plants and the weight of transport costs. The center concentrates 53.5% of the national market,
led by UNACEM (45.2%), along with grinding operators and cement imported by Chancay (3.4%). CPAC is the only integrated producer in the north, with 22.5% of the national market and close to 91.4% of its macro-region (sections 7.2 and 8.2.4
and 8.2.5). Region Company Participation NORTH CPAC 22.5% Total northern region 22.5% UNACEM Perú 45.2% Cemex 2.8% CENTRAL Holcim Perú 2.1% Imports (Chancay) 3.4% Total central region 53.5% CENTRAL AND SOUTH Cementos
Inca 4.7% SOUTH Yura 19.1% OTHERS Other producers 0.2% National Total 100.0% Note: Companies grouped according to their main region of operation (section 8.2.5). Accumulated shares as of 03/31/2026 according to the Company’s
competitor identification; CPAC and imports (ADUANET) correspond to the twelve months to February 2026. Other producers, by difference. Source: CPAC — identification of main competitors in the areas of influence (information as of
03/31/2026); INEI and ADUANET. Prepared by: EQUBO. Other producers 0.2% Holcim Perú 2.1% Cemex 2.8% Imports 3.4% Cementos Inca 4.7% Yura 19.1% CPAC 22.5% UNACEM Perú 45.2% E3 100
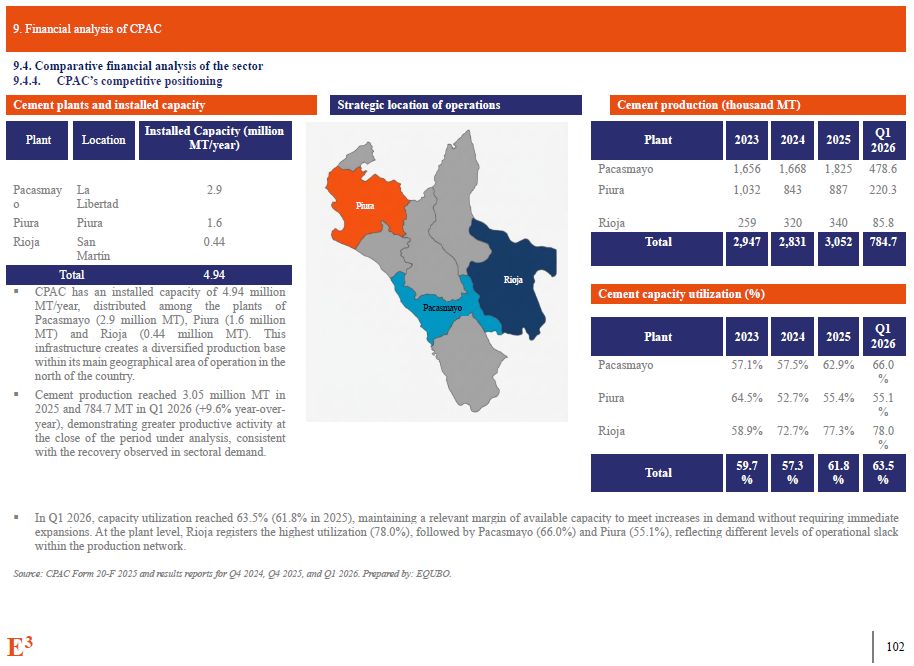
9. Financial analysis of CPAC 9.4. Comparative financial analysis of the
sector 9.4.4. CPAC’s competitive positioning Cement plants and installed capacity Plant Location Installed Capacity (million MT/year) Strategic location of operations Cement production (thousand MT) Plant 2023 2024 2025 Q1
2026 Pacasmayo 1,656 1,668 1,825 478.6 Piura 1,032 843 887 220.3 Rioja 259 320 340 85.8 Total 2,947 2,831 3,052 784.7 CPAC has an installed capacity of 4.94 million MT/year, distributed among the plants of Pacasmayo
(2.9 million MT), Piura (1.6 million MT) and Rioja (0.44 million MT). This infrastructure creates a diversified production base within its main geographical area of operation in the north of the country. Cement production reached 3.05
million MT in 2025 and 784.7 MT in Q1 2026 (+9.6% year-over- year), demonstrating greater productive activity at the close of the period under analysis, consistent with the recovery observed in sectoral demand. Cement capacity utilization
(%) Plant 2023 2024 2025 Q1 2026 Pacasmayo 57.1% 57.5% 62.9% 66.0 % Piura 64.5% 52.7% 55.4% 55.1 % Rioja 58.9% 72.7% 77.3% 78.0 % Total 59.7 57.3 61.8 63.5 % % % % In Q1 2026, capacity utilization reached
63.5% (61.8% in 2025), maintaining a relevant margin of available capacity to meet increases in demand without requiring immediate expansions. At the plant level, Rioja registers the highest utilization (78.0%), followed by Pacasmayo
(66.0%) and Piura (55.1%), reflecting different levels of operational slack within the production network. Source: CPAC Form 20-F 2025 and results reports for Q4 2024, Q4 2025, and Q1 2026. Prepared by:
EQUBO. Pacasmay o La Libertad 2.9 Piura Piura Piura 1.6 Rioja San Martín 0.44 Total 4.94 Rioja Pacasmayo E3 100
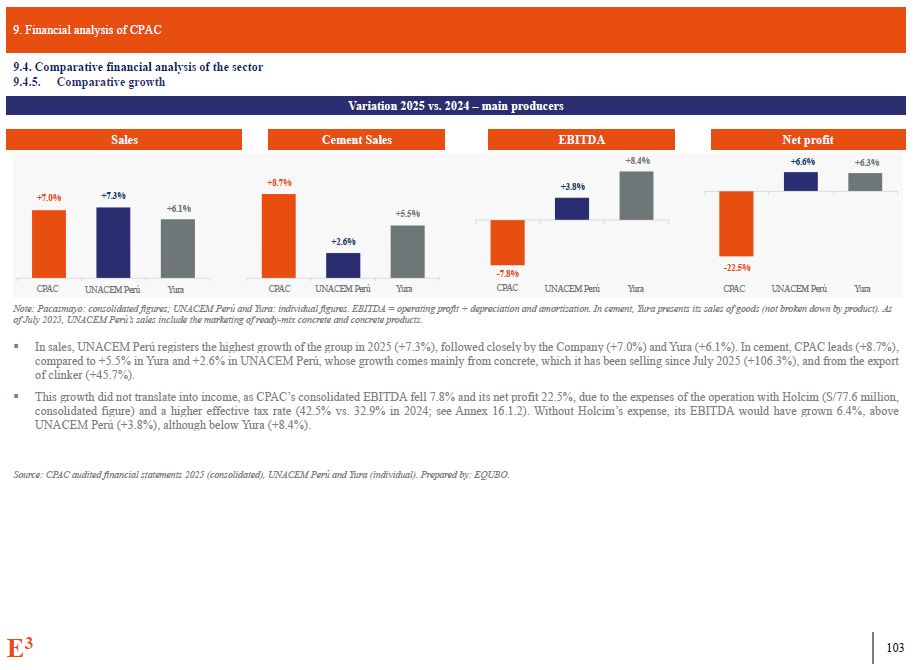
9. Financial analysis of CPAC 9.4. Comparative financial analysis of the
sector 9.4.5. Comparative growth Variation 2025 vs. 2024 – main producers Sales Cement Sales EBITDA Net profit Note: Pacasmayo: consolidated figures; UNACEM Perú and Yura: individual figures. EBITDA = operating profit + depreciation
and amortization. In cement, Yura presents its sales of goods (not broken down by product). As of July 2025, UNACEM Perú’s sales include the marketing of ready-mix concrete and concrete products. In sales, UNACEM Perú registers the highest
growth of the group in 2025 (+7.3%), followed closely by the Company (+7.0%) and Yura (+6.1%). In cement, CPAC leads (+8.7%), compared to +5.5% in Yura and +2.6% in UNACEM Perú, whose growth comes mainly from concrete, which it has been
selling since July 2025 (+106.3%), and from the export of clinker (+45.7%). This growth did not translate into income, as CPAC’s consolidated EBITDA fell 7.8% and its net profit 22.5%, due to the expenses of the operation with Holcim
(S/77.6 million, consolidated figure) and a higher effective tax rate (42.5% vs. 32.9% in 2024; see Annex 16.1.2). Without Holcim’s expense, its EBITDA would have grown 6.4%, above UNACEM Perú (+3.8%), although below Yura (+8.4%). Source:
CPAC audited financial statements 2025 (consolidated), UNACEM Perú and Yura (individual). Prepared by: EQUBO. +7.0% +7.3% +6.1% +8.7% +2.6% +5.5% +3.8% +8.4% +6.6% +6.3% CPAC UNACEM Perú Yura CPAC UNACEM Perú Yura -7.8%
-22.5% CPAC UNACEM Perú Yura CPAC UNACEM Perú Yura E3 100
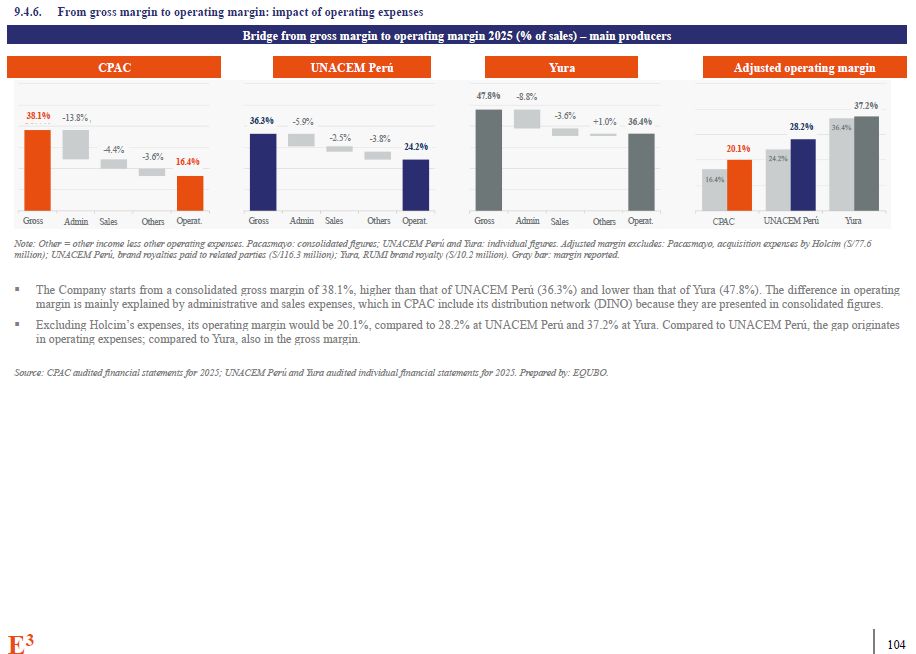
9.4.6. From gross margin to operating margin: impact of operating
expenses Bridge from gross margin to operating margin 2025 (% of sales) – main producers CPAC UNACEM Perú Yura Adjusted operating margin Note: Other = other income less other operating expenses. Pacasmayo: consolidated figures; UNACEM
Perú and Yura: individual figures. Adjusted margin excludes: Pacasmayo, acquisition expenses by Holcim (S/77.6 million); UNACEM Perú, brand royalties paid to related parties (S/116.3 million); Yura, RUMI brand royalty (S/10.2 million). Gray
bar: margin reported. The Company starts from a consolidated gross margin of 38.1%, higher than that of UNACEM Perú (36.3%) and lower than that of Yura (47.8%). The difference in operating margin is mainly explained by administrative and
sales expenses, which in CPAC include its distribution network (DINO) because they are presented in consolidated figures. Excluding Holcim’s expenses, its operating margin would be 20.1%, compared to 28.2% at UNACEM Perú and 37.2% at Yura.
Compared to UNACEM Perú, the gap originates in operating expenses; compared to Yura, also in the gross margin. Source: CPAC audited financial statements for 2025; UNACEM Perú and Yura audited individual financial statements for 2025.
Prepared by: EQUBO. 38.1% 16.4% 20.1% -13.8% -4.4% -3.6% -5.9% -2.5% -3.8% 47.8% -8.8% -3.6% +1.0% 36.4% 37.2% 16.4% 24.2% 36.3% 24.2% 28.2% 36.4% Gross Admin Sales Others Operat. Gross Admin Sales Others Operat. Gross
Admin Sales Others Operat. CPAC UNACEM Perú Yura E3 100
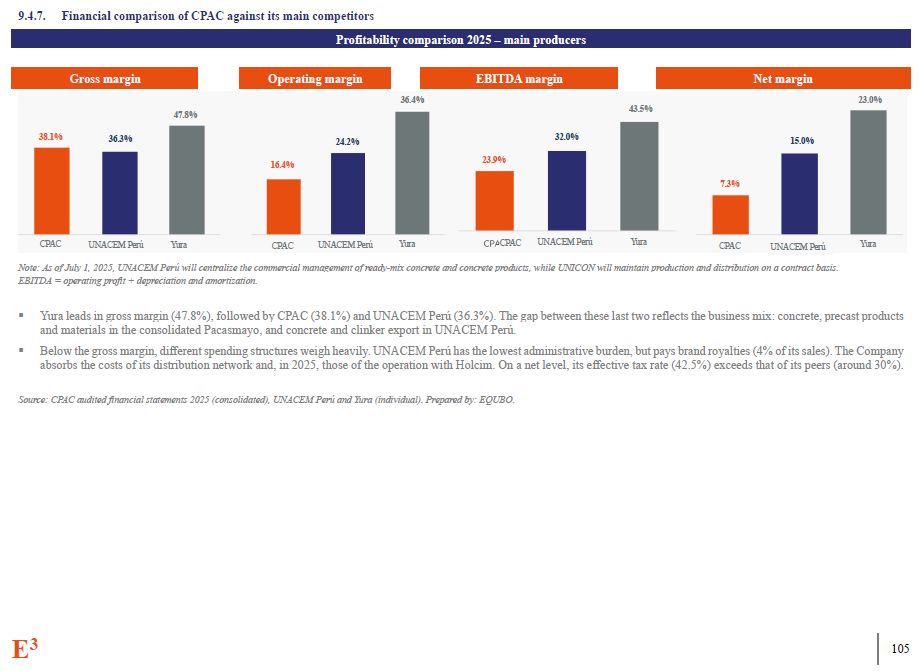
9.4.7. Financial comparison of CPAC against its main
competitors Profitability comparison 2025 – main producers Gross margin Operating margin EBITDA margin Net margin Note: As of July 1, 2025, UNACEM Perú will centralize the commercial management of ready-mix concrete and concrete
products, while UNICON will maintain production and distribution on a contract basis. EBITDA = operating profit + depreciation and amortization. Yura leads in gross margin (47.8%), followed by CPAC (38.1%) and UNACEM Perú (36.3%). The gap
between these last two reflects the business mix: concrete, precast products and materials in the consolidated Pacasmayo, and concrete and clinker export in UNACEM Perú. Below the gross margin, different spending structures weigh heavily.
UNACEM Perú has the lowest administrative burden, but pays brand royalties (4% of its sales). The Company absorbs the costs of its distribution network and, in 2025, those of the operation with Holcim. On a net level, its effective tax rate
(42.5%) exceeds that of its peers (around 30%). Source: CPAC audited financial statements 2025 (consolidated), UNACEM Perú and Yura (individual). Prepared by:
EQUBO. 38.1% 36.3% 47.8% 16.4% 24.2% 36.4% 23.9% 32.0% 43.5% 7.3% 15.0% 23.0% CPAC UNACEM Perú Yura UNACEM Perú Yura CPAC UNACEM Perú Yura CPAC CPAC UNACEM Perú Yura E3 100
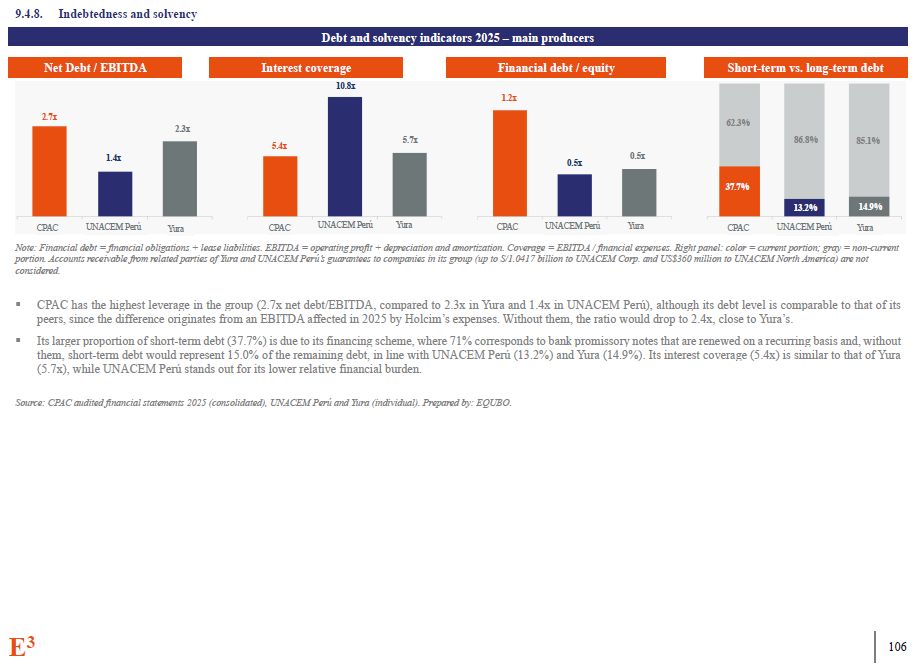
9.4.8. Indebtedness and solvency Debt and solvency indicators 2025 – main
producers Net Debt / EBITDA Interest coverage Financial debt / equity Short-term vs. long-term debt Note: Financial debt = financial obligations + lease liabilities. EBITDA = operating profit + depreciation and amortization. Coverage =
EBITDA / financial expenses. Right panel: color = current portion; gray = non-current portion. Accounts receivable from related parties of Yura and UNACEM Perú’s guarantees to companies in its group (up to S/1.0417 billion to UNACEM Corp.
and US$360 million to UNACEM North America) are not considered. CPAC has the highest leverage in the group (2.7x net debt/EBITDA, compared to 2.3x in Yura and 1.4x in UNACEM Perú), although its debt level is comparable to that of its
peers, since the difference originates from an EBITDA affected in 2025 by Holcim’s expenses. Without them, the ratio would drop to 2.4x, close to Yura’s. Its larger proportion of short-term debt (37.7%) is due to its financing scheme,
where 71% corresponds to bank promissory notes that are renewed on a recurring basis and, without them, short-term debt would represent 15.0% of the remaining debt, in line with UNACEM Perú (13.2%) and Yura (14.9%). Its interest coverage
(5.4x) is similar to that of Yura (5.7x), while UNACEM Perú stands out for its lower relative financial burden. Source: CPAC audited financial statements 2025 (consolidated), UNACEM Perú and Yura (individual). Prepared by:
EQUBO. 2.7x 1.4x 2.3x 5.4x 10.8x 5.7x 1.2x 0.5x 0.5x 37.7% UNACEM Perú Yura CPAC UNACEM Perú Yura CPAC UNACEM Perú Yura CPAC CPAC UNACEM Perú Yura 62.3% 86.8% 85.1% 14.9% 13.2% E3 100
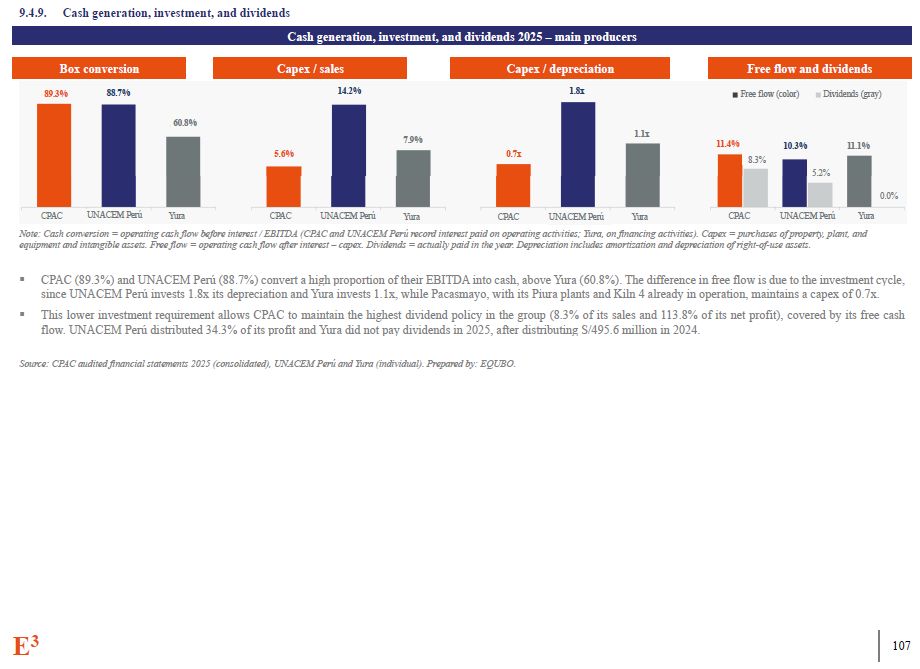
9.4.9. Cash generation, investment, and dividends Cash generation,
investment, and dividends 2025 – main producers Box conversion Capex / sales Capex / depreciation Free flow and dividends 89.3% 88.7% 60.8% 5.6% 14.2% 7.9% 0.7x 1.8x 1.1x 11.4% 10.3% 11.1% 5.2% 0.0% CPAC UNACEM Perú Yura
CPAC UNACEM Perú Yura CPAC UNACEM Perú Yura CPAC UNACEM Perú Yura Note: Cash conversion = operating cash flow before interest / EBITDA (CPAC and UNACEM Perú record interest paid on operating activities; Yura, on financing activities).
Capex = purchases of property, plant, and equipment and intangible assets. Free flow = operating cash flow after interest – capex. Dividends = actually paid in the year. Depreciation includes amortization and depreciation of right-of-use
assets. CPAC (89.3%) and UNACEM Perú (88.7%) convert a high proportion of their EBITDA into cash, above Yura (60.8%). The difference in free flow is due to the investment cycle, since UNACEM Perú invests 1.8x its depreciation and Yura
invests 1.1x, while Pacasmayo, with its Piura plants and Kiln 4 already in operation, maintains a capex of 0.7x. This lower investment requirement allows CPAC to maintain the highest dividend policy in the group (8.3% of its sales and
113.8% of its net profit), covered by its free cash flow. UNACEM Perú distributed 34.3% of its profit and Yura did not pay dividends in 2025, after distributing S/495.6 million in 2024. Source: CPAC audited financial statements 2025
(consolidated), UNACEM Perú and Yura (individual). Prepared by: EQUBO. 8.3% Free flow (color) Dividends (gray) E3 100
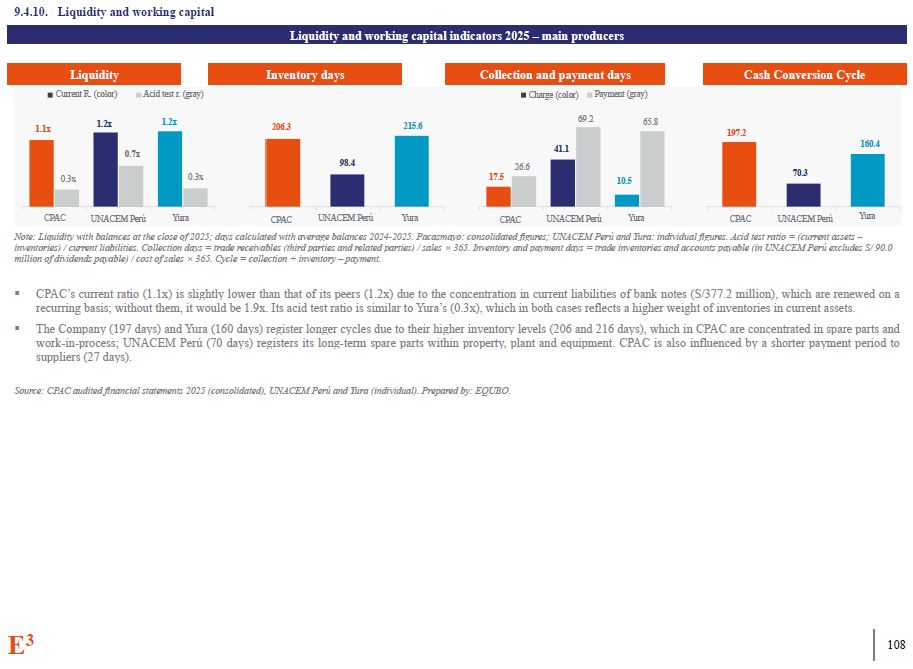
9.4.10. Liquidity and working capital Liquidity and working capital
indicators 2025 – main producers Liquidity Inventory days Collection and payment days Cash Conversion Cycle Note: Liquidity with balances at the close of 2025; days calculated with average balances 2024-2025. Pacasmayo: consolidated
figures; UNACEM Perú and Yura: individual figures. Acid test ratio = (current assets – inventories) / current liabilities. Collection days = trade receivables (third parties and related parties) / sales × 365. Inventory and payment days =
trade inventories and accounts payable (in UNACEM Perú excludes S/ 90.0 million of dividends payable) / cost of sales × 365. Cycle = collection + inventory – payment. CPAC’s current ratio (1.1x) is slightly lower than that of its peers
(1.2x) due to the concentration in current liabilities of bank notes (S/377.2 million), which are renewed on a recurring basis; without them, it would be 1.9x. Its acid test ratio is similar to Yura’s (0.3x), which in both cases reflects a
higher weight of inventories in current assets. The Company (197 days) and Yura (160 days) register longer cycles due to their higher inventory levels (206 and 216 days), which in CPAC are concentrated in spare parts and work-in-process;
UNACEM Perú (70 days) registers its long-term spare parts within property, plant and equipment. CPAC is also influenced by a shorter payment period to suppliers (27 days). Source: CPAC audited financial statements 2025 (consolidated),
UNACEM Perú and Yura (individual). Prepared by: EQUBO. 1.1x 1.2x 0.7x 206.3 98.4 17.5 CPAC UNACEM Perú Yura CPAC UNACEM Perú Yura CPAC UNACEM Perú Yura CPAC UNACEM Perú Yura 41.1 26.6 197.2 70.3 160.4 Current R. (color) Acid
test r. (gray) 69.2 65.8 0.3x 0.3x 1.2x 215.6 10.5 Charge (color) Payment (gray) E3 100
10 Valuation criteria and methodologies
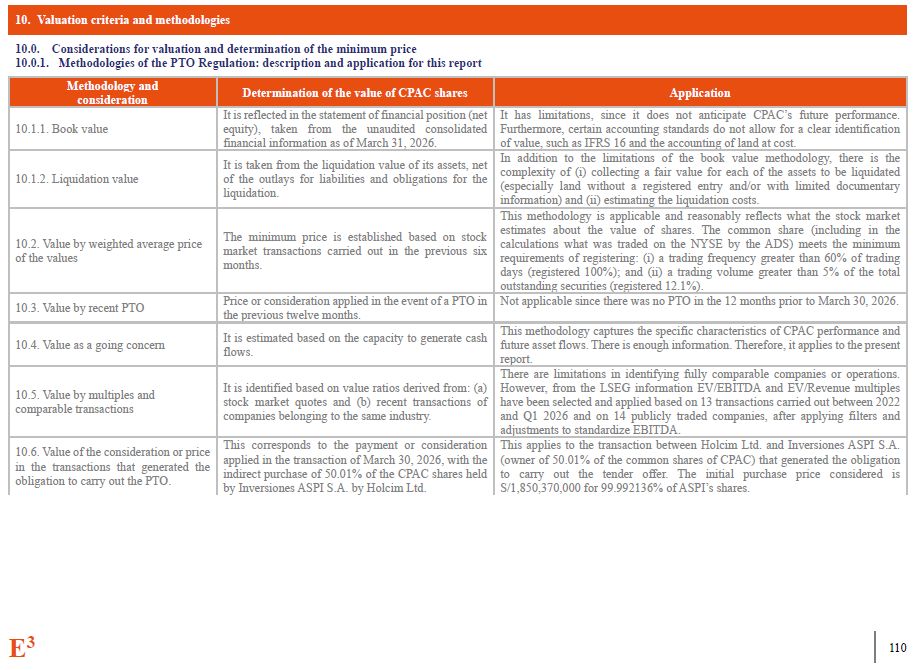
10. Valuation criteria and methodologies E3 110 Considerations for valuation and determination of the
minimum price Methodologies of the PTO Regulation: description and application for this report Methodology and consideration Determination of the value of CPAC shares Application 10.1.1. Book value It is reflected in the statement of
financial position (net equity), taken from the unaudited consolidated financial information as of March 31, 2026. It has limitations, since it does not anticipate CPAC’s future performance. Furthermore, certain accounting standards do not
allow for a clear identification of value, such as IFRS 16 and the accounting of land at cost. 10.1.2. Liquidation value It is taken from the liquidation value of its assets, net of the outlays for liabilities and obligations for the
liquidation. In addition to the limitations of the book value methodology, there is the complexity of (i) collecting a fair value for each of the assets to be liquidated (especially land without a registered entry and/or with limited
documentary information) and (ii) estimating the liquidation costs. 10.2. Value by weighted average price of the values The minimum price is established based on stock market transactions carried out in the previous six months. This
methodology is applicable and reasonably reflects what the stock market estimates about the value of shares. The common share (including in the calculations what was traded on the NYSE by the ADS) meets the minimum requirements of
registering: (i) a trading frequency greater than 60% of trading days (registered 100%); and (ii) a trading volume greater than 5% of the total outstanding securities (registered 12.1%). 10.3. Value by recent PTO Price or consideration
applied in the event of a PTO in the previous twelve months. Not applicable since there was no PTO in the 12 months prior to March 30, 2026. 10.4. Value as a going concern It is estimated based on the capacity to generate cash
flows. This methodology captures the specific characteristics of CPAC performance and future asset flows. There is enough information. Therefore, it applies to the present report. 10.5. Value by multiples and comparable transactions It
is identified based on value ratios derived from: (a) stock market quotes and (b) recent transactions of companies belonging to the same industry. There are limitations in identifying fully comparable companies or operations. However, from
the LSEG information EV/EBITDA and EV/Revenue multiples have been selected and applied based on 13 transactions carried out between 2022 and Q1 2026 and on 14 publicly traded companies, after applying filters and adjustments to standardize
EBITDA. 10.6. Value of the consideration or price in the transactions that generated the obligation to carry out the PTO. This corresponds to the payment or consideration applied in the transaction of March 30, 2026, with the indirect
purchase of 50.01% of the CPAC shares held by Inversiones ASPI S.A. by Holcim Ltd. This applies to the transaction between Holcim Ltd. and Inversiones ASPI S.A. (owner of 50.01% of the common shares of CPAC) that generated the obligation
to carry out the tender offer. The initial purchase price considered is S/1,850,370,000 for 99.992136% of ASPI’s shares.
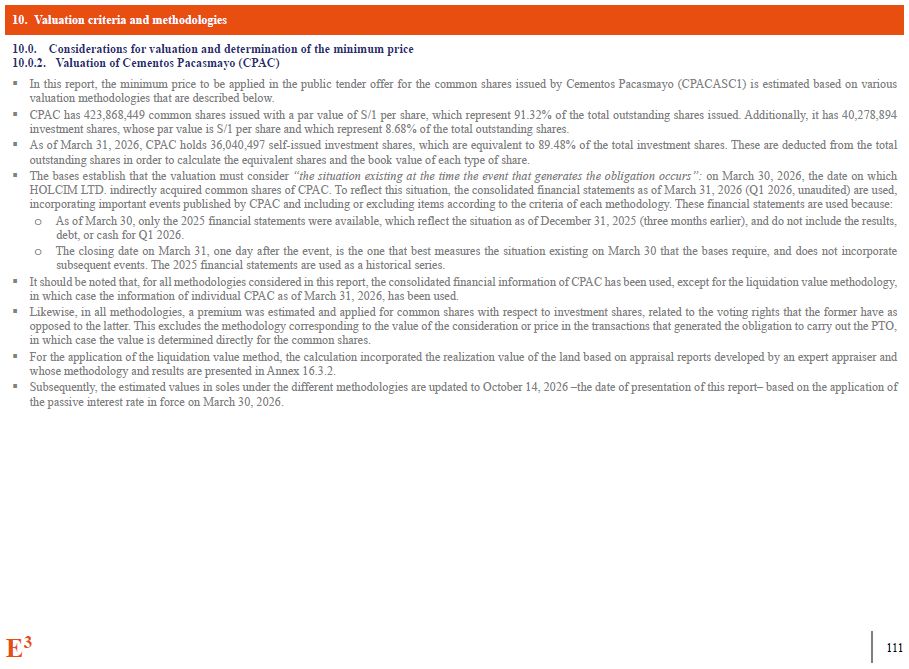
10. Valuation criteria and methodologies E3 110 Considerations for
valuation and determination of the minimum price Valuation of Cementos Pacasmayo (CPAC) In this report, the minimum price to be applied in the public tender offer for the common shares issued by Cementos Pacasmayo (CPACASC1) is estimated
based on various valuation methodologies that are described below. CPAC has 423,868,449 common shares issued with a par value of S/1 per share, which represent 91.32% of the total outstanding shares issued. Additionally, it has 40,278,894
investment shares, whose par value is S/1 per share and which represent 8.68% of the total outstanding shares. As of March 31, 2026, CPAC holds 36,040,497 self-issued investment shares, which are equivalent to 89.48% of the total
investment shares. These are deducted from the total outstanding shares in order to calculate the equivalent shares and the book value of each type of share. The bases establish that the valuation must consider “the situation existing at
the time the event that generates the obligation occurs”: on March 30, 2026, the date on which HOLCIM LTD. indirectly acquired common shares of CPAC. To reflect this situation, the consolidated financial statements as of March 31, 2026 (Q1
2026, unaudited) are used, incorporating important events published by CPAC and including or excluding items according to the criteria of each methodology. These financial statements are used because: As of March 30, only the 2025
financial statements were available, which reflect the situation as of December 31, 2025 (three months earlier), and do not include the results, debt, or cash for Q1 2026. The closing date on March 31, one day after the event, is the one
that best measures the situation existing on March 30 that the bases require, and does not incorporate subsequent events. The 2025 financial statements are used as a historical series. It should be noted that, for all methodologies
considered in this report, the consolidated financial information of CPAC has been used, except for the liquidation value methodology, in which case the information of individual CPAC as of March 31, 2026, has been used. Likewise, in all
methodologies, a premium was estimated and applied for common shares with respect to investment shares, related to the voting rights that the former have as opposed to the latter. This excludes the methodology corresponding to the value of
the consideration or price in the transactions that generated the obligation to carry out the PTO, in which case the value is determined directly for the common shares. For the application of the liquidation value method, the calculation
incorporated the realization value of the land based on appraisal reports developed by an expert appraiser and whose methodology and results are presented in Annex 16.3.2. Subsequently, the estimated values in soles under the different
methodologies are updated to October 14, 2026 –the date of presentation of this report– based on the application of the passive interest rate in force on March 30, 2026.
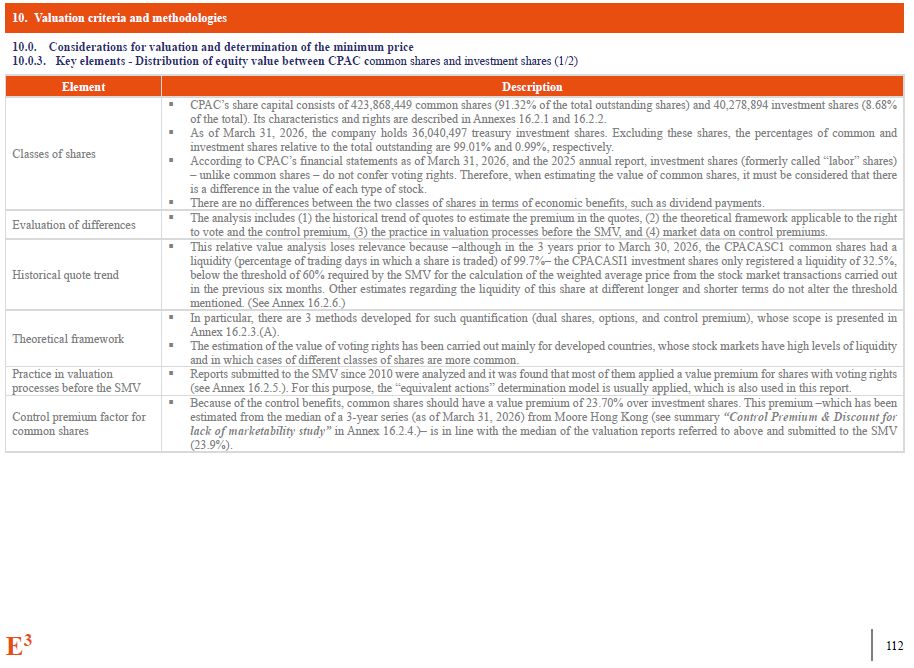
10. Valuation criteria and methodologies E3 110 10.0. Considerations for
valuation and determination of the minimum price 10.0.3. Key elements - Distribution of equity value between CPAC common shares and investment shares (1/2) Element Description Classes of shares CPAC’s share capital consists of
423,868,449 common shares (91.32% of the total outstanding shares) and 40,278,894 investment shares (8.68% of the total). Its characteristics and rights are described in Annexes 16.2.1 and 16.2.2. As of March 31, 2026, the company holds
36,040,497 treasury investment shares. Excluding these shares, the percentages of common and investment shares relative to the total outstanding are 99.01% and 0.99%, respectively. According to CPAC’s financial statements as of March 31,
2026, and the 2025 annual report, investment shares (formerly called “labor” shares) – unlike common shares – do not confer voting rights. Therefore, when estimating the value of common shares, it must be considered that there is a
difference in the value of each type of stock. There are no differences between the two classes of shares in terms of economic benefits, such as dividend payments. Evaluation of differences The analysis includes (1) the historical trend
of quotes to estimate the premium in the quotes, (2) the theoretical framework applicable to the right to vote and the control premium, (3) the practice in valuation processes before the SMV, and (4) market data on control
premiums. Historical quote trend This relative value analysis loses relevance because –although in the 3 years prior to March 30, 2026, the CPACASC1 common shares had a liquidity (percentage of trading days in which a share is traded) of
99.7%– the CPACASI1 investment shares only registered a liquidity of 32.5%, below the threshold of 60% required by the SMV for the calculation of the weighted average price from the stock market transactions carried out in the previous six
months. Other estimates regarding the liquidity of this share at different longer and shorter terms do not alter the threshold mentioned. (See Annex 16.2.6.) Theoretical framework In particular, there are 3 methods developed for such
quantification (dual shares, options, and control premium), whose scope is presented in Annex 16.2.3.(A). The estimation of the value of voting rights has been carried out mainly for developed countries, whose stock markets have high
levels of liquidity and in which cases of different classes of shares are more common. Practice in valuation processes before the SMV Reports submitted to the SMV since 2010 were analyzed and it was found that most of them applied a
value premium for shares with voting rights (see Annex 16.2.5.). For this purpose, the “equivalent actions” determination model is usually applied, which is also used in this report. Control premium factor for common shares Because of the
control benefits, common shares should have a value premium of 23.70% over investment shares. This premium –which has been estimated from the median of a 3-year series (as of March 31, 2026) from Moore Hong Kong (see summary “Control
Premium & Discount for lack of marketability study” in Annex 16.2.4.)– is in line with the median of the valuation reports referred to above and submitted to the SMV (23.9%).
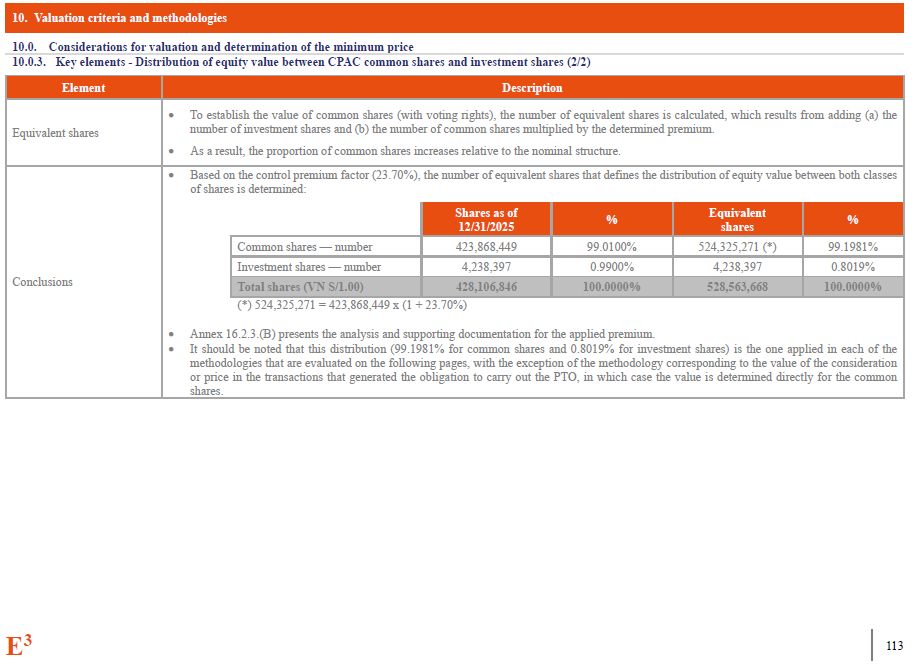
10. Valuation criteria and methodologies 10.0. Considerations for valuation
and determination of the minimum price 10.0.3. Key elements - Distribution of equity value between CPAC common shares and investment shares (2/2) Element Description Equivalent shares To establish the value of common shares (with
voting rights), the number of equivalent shares is calculated, which results from adding (a) the number of investment shares and (b) the number of common shares multiplied by the determined premium. As a result, the proportion of common
shares increases relative to the nominal structure. Conclusions Based on the control premium factor (23.70%), the number of equivalent shares that defines the distribution of equity value between both classes of shares is
determined: Shares as of 12/31/2025 % Equivalent shares % Common shares — number 423,868,449 99.0100% 524,325,271 (*) 99.1981% Investment shares — number 4,238,397 0.9900% 4,238,397 0.8019% Total shares (VN
S/1.00) 428,106,846 100.0000% 528,563,668 100.0000% (*) 524,325,271 = 423,868,449 x (1 + 23.70%) Annex 16.2.3.(B) presents the analysis and supporting documentation for the applied premium. It should be noted that this distribution
(99.1981% for common shares and 0.8019% for investment shares) is the one applied in each of the methodologies that are evaluated on the following pages, with the exception of the methodology corresponding to the value of the consideration
or price in the transactions that generated the obligation to carry out the PTO, in which case the value is determined directly for the common shares. E3 110
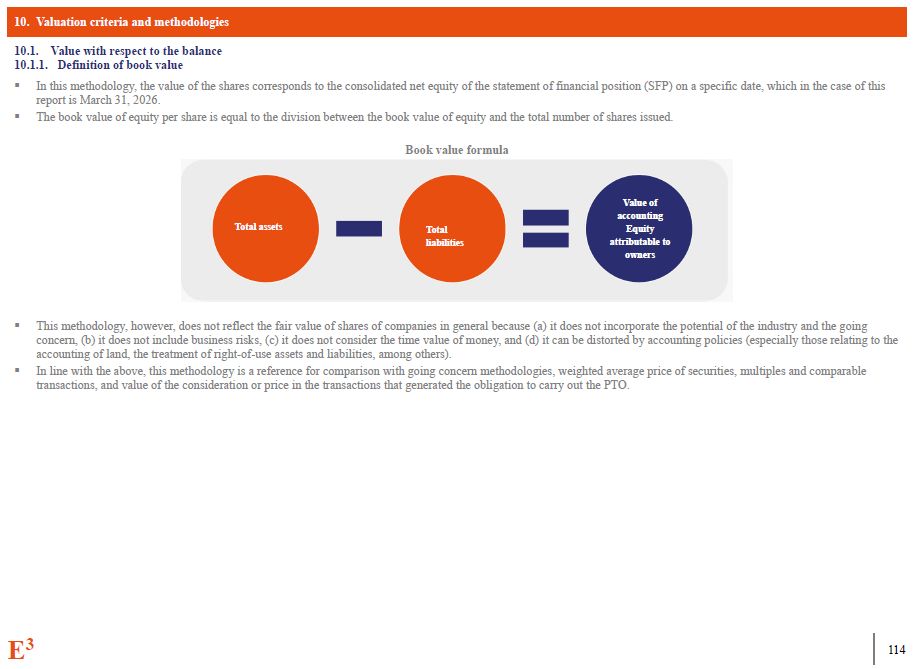
10. Valuation criteria and methodologies Value with respect to the
balance Definition of book value In this methodology, the value of the shares corresponds to the consolidated net equity of the statement of financial position (SFP) on a specific date, which in the case of this report is March 31,
2026. The book value of equity per share is equal to the division between the book value of equity and the total number of shares issued. Book value formula This methodology, however, does not reflect the fair value of shares of
companies in general because (a) it does not incorporate the potential of the industry and the going concern, (b) it does not include business risks, (c) it does not consider the time value of money, and (d) it can be distorted by
accounting policies (especially those relating to the accounting of land, the treatment of right-of-use assets and liabilities, among others). In line with the above, this methodology is a reference for comparison with going concern
methodologies, weighted average price of securities, multiples and comparable transactions, and value of the consideration or price in the transactions that generated the obligation to carry out the PTO. Total assets Total
liabilities Value of accounting Equity attributable to owners E3 110
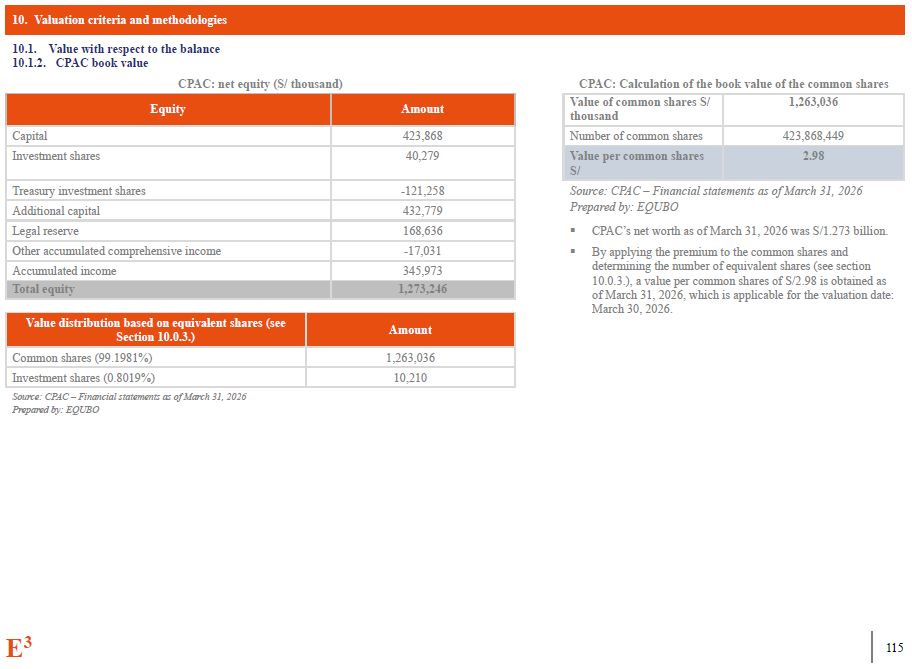
10. Valuation criteria and methodologies E3 110 10.1. Value with respect to
the balance 10.1.2. CPAC book value CPAC: net equity (S/ thousand) CPAC: Calculation of the book value of the common shares Equity Amount Capital 423,868 Investment shares 40,279 Treasury investment shares -121,258 Additional
capital 432,779 Legal reserve 168,636 Other accumulated comprehensive income -17,031 Accumulated income 345,973 Total equity 1,273,246 Value of common shares S/ thousand 1,263,036 Number of common shares 423,868,449 Value per
common shares S/ 2.98 Source: CPAC – Financial statements as of March 31, 2026 Prepared by: EQUBO CPAC’s net worth as of March 31, 2026 was S/1.273 billion. By applying the premium to the common shares and determining the number of
equivalent shares (see section 10.0.3.), a value per common shares of S/2.98 is obtained as of March 31, 2026, which is applicable for the valuation date: March 30, 2026. Value distribution based on equivalent shares (see Section
10.0.3.) Amount Common shares (99.1981%) 1,263,036 Investment shares (0.8019%) 10,210 Source: CPAC – Financial statements as of March 31, 2026 Prepared by: EQUBO
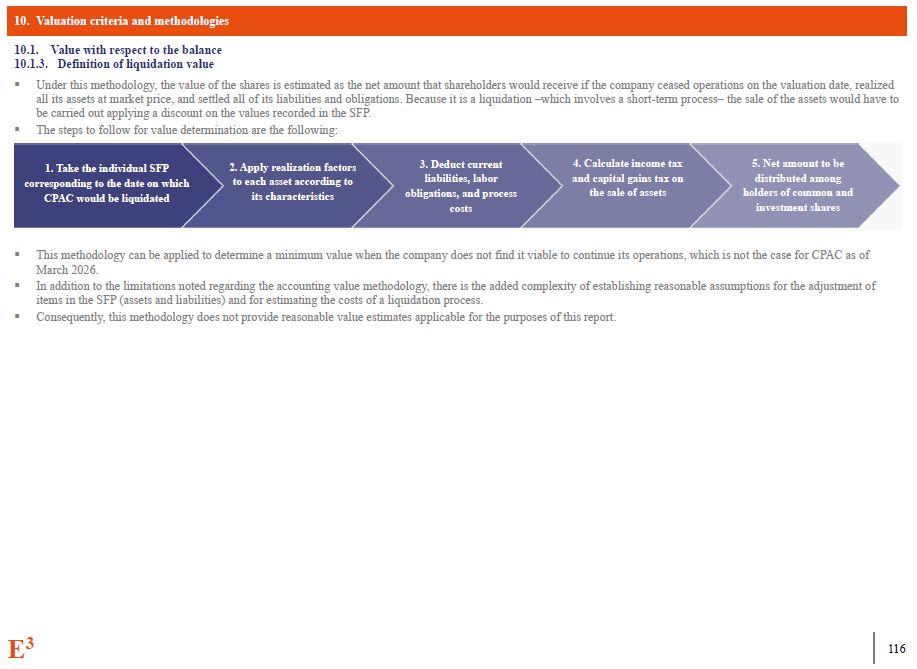
10. Valuation criteria and methodologies Value with respect to the
balance Definition of liquidation value Under this methodology, the value of the shares is estimated as the net amount that shareholders would receive if the company ceased operations on the valuation date, realized all its assets at
market price, and settled all of its liabilities and obligations. Because it is a liquidation –which involves a short-term process– the sale of the assets would have to be carried out applying a discount on the values recorded in the
SFP. The steps to follow for value determination are the following: This methodology can be applied to determine a minimum value when the company does not find it viable to continue its operations, which is not the case for CPAC as of
March 2026. In addition to the limitations noted regarding the accounting value methodology, there is the added complexity of establishing reasonable assumptions for the adjustment of items in the SFP (assets and liabilities) and for
estimating the costs of a liquidation process. Consequently, this methodology does not provide reasonable value estimates applicable for the purposes of this report. 1. Take the individual SFP corresponding to the date on which CPAC
would be liquidated 2. Apply realization factors to each asset according to its characteristics 3. Deduct current liabilities, labor obligations, and process costs 4. Calculate income tax and capital gains tax on the sale of
assets 5. Net amount to be distributed among holders of common and investment shares E3 110
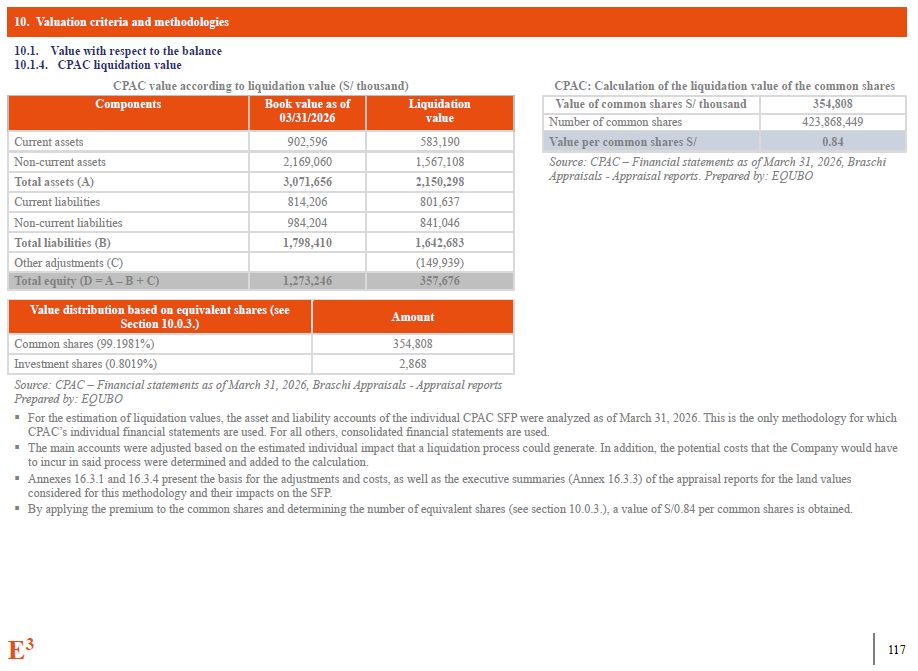
10. Valuation criteria and methodologies E3 110 10.1. Value with respect
to the balance 10.1.4. CPAC liquidation value CPAC value according to liquidation value (S/ thousand) CPAC: Calculation of the liquidation value of the common shares Components Book value as of 03/31/2026 Liquidation value Current
assets 902,596 583,190 Non-current assets 2,169,060 1,567,108 Total assets (A) 3,071,656 2,150,298 Current liabilities 814,206 801,637 Non-current liabilities 984,204 841,046 Total liabilities
(B) 1,798,410 1,642,683 Other adjustments (C) (149,939) Total equity (D = A – B + C) 1,273,246 357,676 Value of common shares S/ thousand 354,808 Number of common shares 423,868,449 Value per common shares S/ 0.84 Source:
CPAC – Financial statements as of March 31, 2026, Braschi Appraisals - Appraisal reports. Prepared by: EQUBO Value distribution based on equivalent shares (see Section 10.0.3.) Amount Common shares (99.1981%) 354,808 Investment
shares (0.8019%) 2,868 Source: CPAC – Financial statements as of March 31, 2026, Braschi Appraisals - Appraisal reports Prepared by: EQUBO For the estimation of liquidation values, the asset and liability accounts of the individual
CPAC SFP were analyzed as of March 31, 2026. This is the only methodology for which CPAC’s individual financial statements are used. For all others, consolidated financial statements are used. The main accounts were adjusted based on the
estimated individual impact that a liquidation process could generate. In addition, the potential costs that the Company would have to incur in said process were determined and added to the calculation. Annexes 16.3.1 and 16.3.4 present
the basis for the adjustments and costs, as well as the executive summaries (Annex 16.3.3) of the appraisal reports for the land values considered for this methodology and their impacts on the SFP. By applying the premium to the common
shares and determining the number of equivalent shares (see section 10.0.3.), a value of S/0.84 per common shares is obtained.
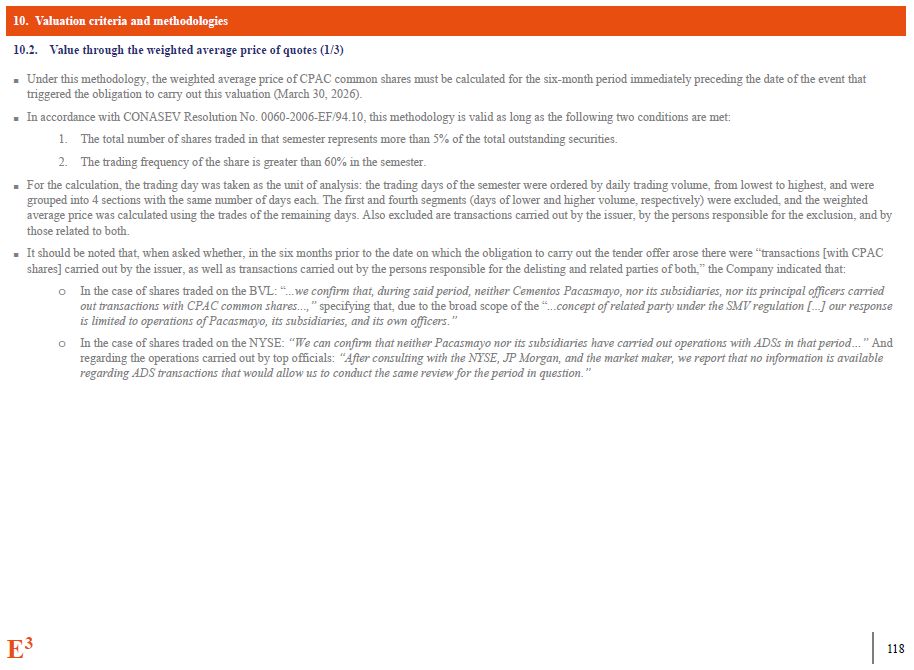
10. Valuation criteria and methodologies E3 110 Value through the
weighted average price of quotes (1/3) Under this methodology, the weighted average price of CPAC common shares must be calculated for the six-month period immediately preceding the date of the event that triggered the obligation to
carry out this valuation (March 30, 2026). In accordance with CONASEV Resolution No. 0060-2006-EF/94.10, this methodology is valid as long as the following two conditions are met: The total number of shares traded in that semester
represents more than 5% of the total outstanding securities. The trading frequency of the share is greater than 60% in the semester. For the calculation, the trading day was taken as the unit of analysis: the trading days of the
semester were ordered by daily trading volume, from lowest to highest, and were grouped into 4 sections with the same number of days each. The first and fourth segments (days of lower and higher volume, respectively) were excluded, and
the weighted average price was calculated using the trades of the remaining days. Also excluded are transactions carried out by the issuer, by the persons responsible for the exclusion, and by those related to both. It should be noted
that, when asked whether, in the six months prior to the date on which the obligation to carry out the tender offer arose there were “transactions [with CPAC shares] carried out by the issuer, as well as transactions carried out by the
persons responsible for the delisting and related parties of both,” the Company indicated that: In the case of shares traded on the BVL: “...we confirm that, during said period, neither Cementos Pacasmayo, nor its subsidiaries, nor its
principal officers carried out transactions with CPAC common shares...,” specifying that, due to the broad scope of the “...concept of related party under the SMV regulation [...] our response is limited to operations of Pacasmayo, its
subsidiaries, and its own officers.” In the case of shares traded on the NYSE: “We can confirm that neither Pacasmayo nor its subsidiaries have carried out operations with ADSs in that period…” And regarding the operations carried out by
top officials: “After consulting with the NYSE, JP Morgan, and the market maker, we report that no information is available regarding ADS transactions that would allow us to conduct the same review for the period in question.”
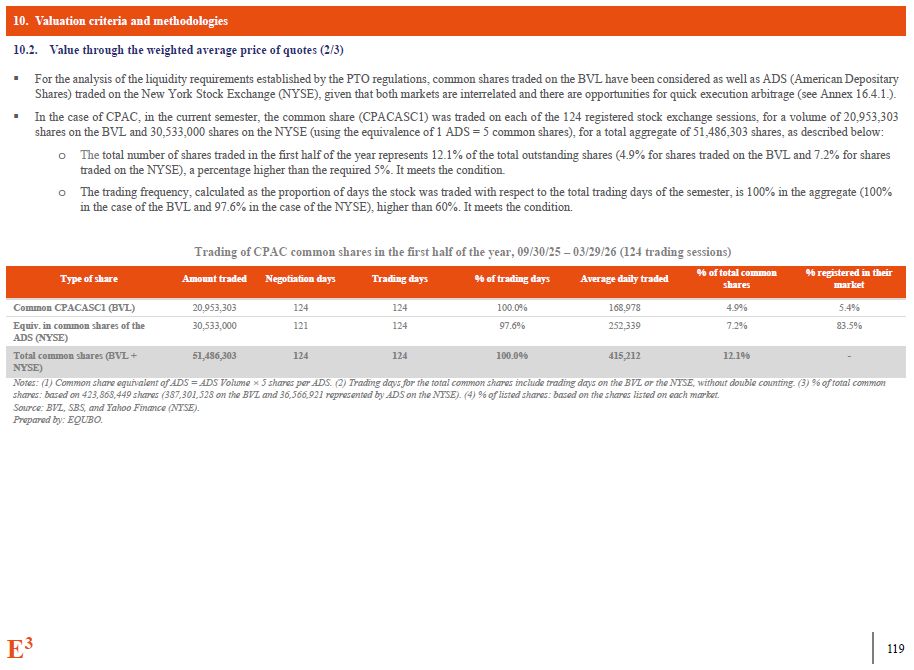
10. Valuation criteria and methodologies Value through the weighted average
price of quotes (2/3) For the analysis of the liquidity requirements established by the PTO regulations, common shares traded on the BVL have been considered as well as ADS (American Depositary Shares) traded on the New York Stock
Exchange (NYSE), given that both markets are interrelated and there are opportunities for quick execution arbitrage (see Annex 16.4.1.). In the case of CPAC, in the current semester, the common share (CPACASC1) was traded on each of the
124 registered stock exchange sessions, for a volume of 20,953,303 shares on the BVL and 30,533,000 shares on the NYSE (using the equivalence of 1 ADS = 5 common shares), for a total aggregate of 51,486,303 shares, as described
below: The total number of shares traded in the first half of the year represents 12.1% of the total outstanding shares (4.9% for shares traded on the BVL and 7.2% for shares traded on the NYSE), a percentage higher than the required 5%.
It meets the condition. The trading frequency, calculated as the proportion of days the stock was traded with respect to the total trading days of the semester, is 100% in the aggregate (100% in the case of the BVL and 97.6% in the case
of the NYSE), higher than 60%. It meets the condition. Trading of CPAC common shares in the first half of the year, 09/30/25 – 03/29/26 (124 trading sessions) Type of share Amount traded Negotiation days Trading days % of trading
days Average daily traded % of total common shares % registered in their market Common CPACASC1 (BVL) 20,953,303 124 124 100.0% 168,978 4.9% 5.4% Equiv. in common shares of the ADS
(NYSE) 30,533,000 121 124 97.6% 252,339 7.2% 83.5% Total common shares (BVL + NYSE) 51,486,303 124 124 100.0% 415,212 12.1% - E3 110 Notes: (1) Common share equivalent of ADS = ADS Volume × 5 shares per ADS. (2) Trading
days for the total common shares include trading days on the BVL or the NYSE, without double counting. (3) % of total common shares: based on 423,868,449 shares (387,301,528 on the BVL and 36,566,921 represented by ADS on the NYSE). (4) %
of listed shares: based on the shares listed on each market. Source: BVL, SBS, and Yahoo Finance (NYSE). Prepared by: EQUBO.
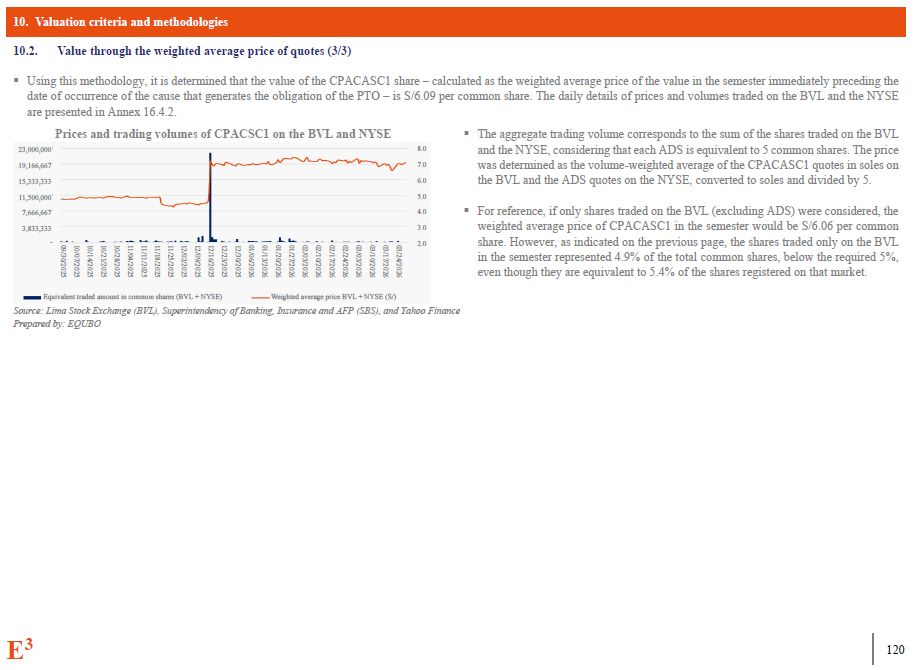
10. Valuation criteria and methodologies Value through the weighted average
price of quotes (3/3) Using this methodology, it is determined that the value of the CPACASC1 share – calculated as the weighted average price of the value in the semester immediately preceding the date of occurrence of the cause that
generates the obligation of the PTO – is S/6.09 per common share. The daily details of prices and volumes traded on the BVL and the NYSE are presented in Annex 16.4.2. Source: Lima Stock Exchange (BVL), Superintendency of Banking,
Insurance and AFP (SBS), and Yahoo Finance Prepared by: EQUBO Prices and trading volumes of CPACSC1 on the BVL and NYSE The aggregate trading volume corresponds to the sum of the shares traded on the BVL 23,000,000 8.0 and the NYSE,
considering that each ADS is equivalent to 5 common shares. The price 19,166,667 7.0 was determined as the volume-weighted average of the CPACASC1 quotes in soles on 15,333,333 6.0 the BVL and the ADS quotes on the NYSE, converted
to soles and divided by 5. 11,500,000 5.0 7,666,667 4.0 For reference, if only shares traded on the BVL (excluding ADS) were considered, the 3,833,333 3.0 weighted average price of CPACASC1 in the semester would be S/6.06 per
common 03/24/2026 03/17/2026 03/10/2026 03/03/2026 02/24/2026 02/17/2026 02/10/2026 02/03/2026 01/27/2026 01/20/2026 01/13/2026 01/06/2026 12/30/2025 12/23/2025 12/16/2025 12/09/2025 12/02/2025 11/25/2025 11/18/2025 11/11/2025 11/04/2025 10/28/2025 10/21/2025 10/14/2025 10/07/2025 09/30/2025 2.0 share.
However, as indicated on the previous page, the shares traded only on the BVL in the semester represented 4.9% of the total common shares, below the required 5%, even though they are equivalent to 5.4% of the shares registered on that
market. Equivalent traded amount in common shares (BVL + NYSE) Weighted average price BVL + NYSE (S/) E3 110
10. Valuation criteria and methodologies 10.3. Value of PTO made during the
12 months prior to the transaction This methodology establishes that the share price or the exchange ratios between shares will be equal to those paid or applied in PTOs made within the twelve months prior to the date of the occurrence
of the cause that generates the obligation to carry out the offer. Between March 30, 2025, and March 29, 2026, no PTO was executed on CPAC’s common shares, so it is not possible to apply this methodology. E3 110
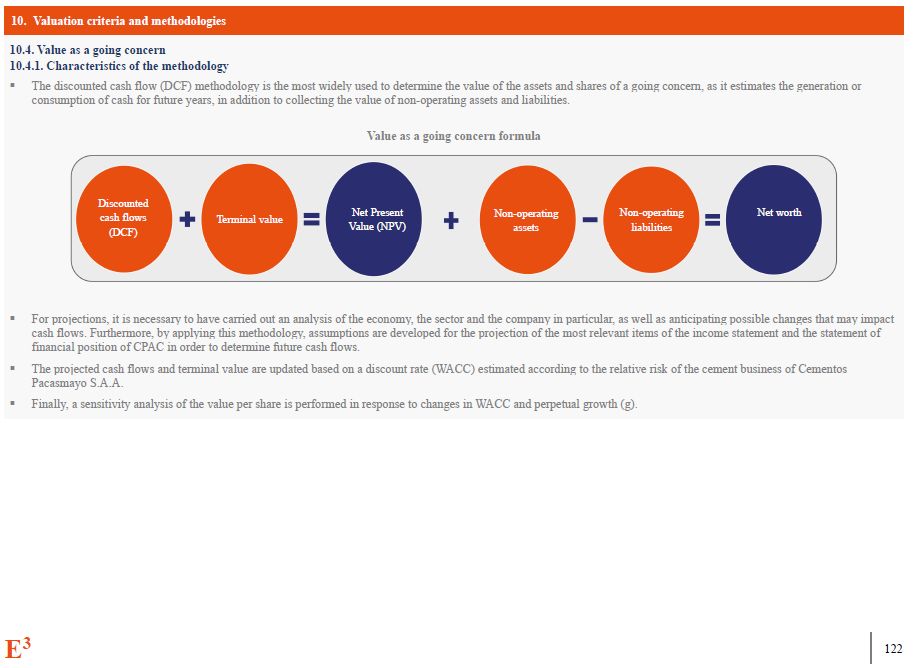
Valuation criteria and methodologies Value as a going
concern Characteristics of the methodology The discounted cash flow (DCF) methodology is the most widely used to determine the value of the assets and shares of a going concern, as it estimates the generation or consumption of cash for
future years, in addition to collecting the value of non-operating assets and liabilities. Value as a going concern formula For projections, it is necessary to have carried out an analysis of the economy, the sector and the company in
particular, as well as anticipating possible changes that may impact cash flows. Furthermore, by applying this methodology, assumptions are developed for the projection of the most relevant items of the income statement and the statement
of financial position of CPAC in order to determine future cash flows. The projected cash flows and terminal value are updated based on a discount rate (WACC) estimated according to the relative risk of the cement business of Cementos
Pacasmayo S.A.A. Finally, a sensitivity analysis of the value per share is performed in response to changes in WACC and perpetual growth (g). Discounted cash flows (DCF) Terminal value Non-operating assets Non-operating
liabilities Net worth Net Present Value (NPV) E3 110
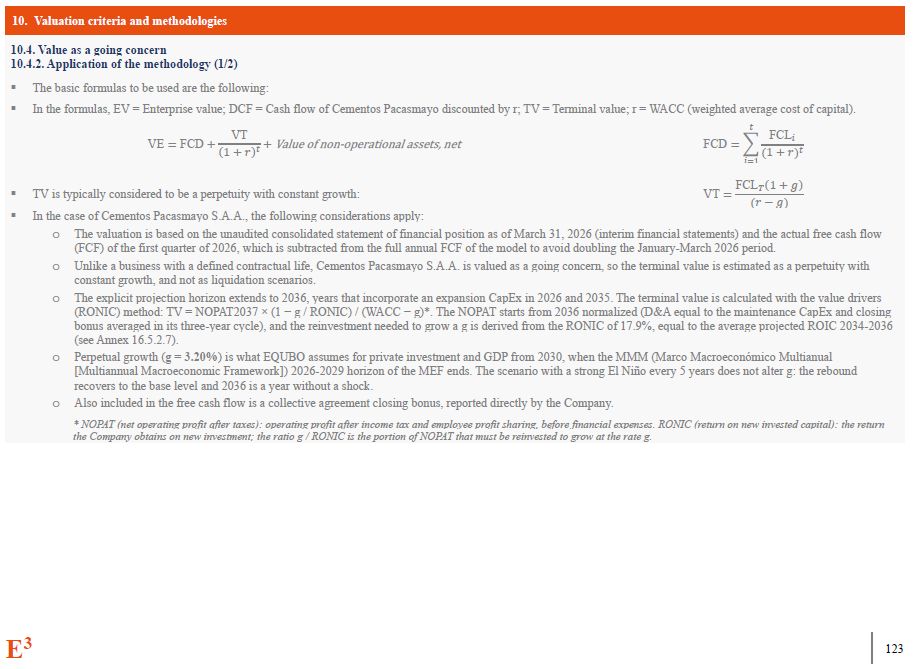
Valuation criteria and methodologies Value as a going concern Application
of the methodology (1/2) The basic formulas to be used are the following: In the formulas, EV = Enterprise value; DCF = Cash flow of Cementos Pacasmayo discounted by r; TV = Terminal value; r = WACC (weighted average cost of
capital). VE = FCD + VT (1 + ��)t + Value of non-operational assets, net FCLi (1+ ��)t t FCD = I i=1 VT = FCLT(1+ ��) (��− ��) TV is typically considered to be a perpetuity with constant growth: In the case of Cementos
Pacasmayo S.A.A., the following considerations apply: E3 110 The valuation is based on the unaudited consolidated statement of financial position as of March 31, 2026 (interim financial statements) and the actual free cash flow (FCF)
of the first quarter of 2026, which is subtracted from the full annual FCF of the model to avoid doubling the January-March 2026 period. Unlike a business with a defined contractual life, Cementos Pacasmayo S.A.A. is valued as a going
concern, so the terminal value is estimated as a perpetuity with constant growth, and not as liquidation scenarios. The explicit projection horizon extends to 2036, years that incorporate an expansion CapEx in 2026 and 2035. The terminal
value is calculated with the value drivers (RONIC) method: TV = NOPAT2037 × (1 − g / RONIC) / (WACC − g)*. The NOPAT starts from 2036 normalized (D&A equal to the maintenance CapEx and closing bonus averaged in its three-year cycle),
and the reinvestment needed to grow a g is derived from the RONIC of 17.9%, equal to the average projected ROIC 2034-2036 (see Annex 16.5.2.7). Perpetual growth (g = 3.20%) is what EQUBO assumes for private investment and GDP from 2030,
when the MMM (Marco Macroeconómico Multianual [Multiannual Macroeconomic Framework]) 2026-2029 horizon of the MEF ends. The scenario with a strong El Niño every 5 years does not alter g: the rebound recovers to the base level and 2036 is
a year without a shock. Also included in the free cash flow is a collective agreement closing bonus, reported directly by the Company. * NOPAT (net operating profit after taxes): operating profit after income tax and employee profit
sharing, before financial expenses. RONIC (return on new invested capital): the return the Company obtains on new investment; the ratio g / RONIC is the portion of NOPAT that must be reinvested to grow at the rate g.
10. Valuation criteria and methodologies Value as a going
concern Application of the methodology (2/2) Cash flows from operations are determined as (a) profit before financial expenses and taxes (EBIT), (b) less income tax and employee participation, (c) plus depreciation and amortization, and
(d) plus or minus the change in working capital. Cash flows from investments include purchases of property, plant, and equipment, and intangible assets (normal CapEx plus expansion CapEx in 2026 and 2035). The working capital projection
(accounts receivable, inventories, prepaid expenses, and accounts payable) is presented in Annex 16.5.2.4. Revenues are projected based on volume (metric tons of cement and other lines of business) and price/mix, depending on private
investment (volume) and price projections. Volume grows by 8.0% in 2026 (double the private investment), and from 2027 onwards, it follows the path of expansion of private investment (see Annex 16.5.2.1). The projections are made in
soles, the functional currency and presentation currency of CPAC’s consolidated financial statements. Income tax and employee participation are determined by applying a combined effective rate of 36.06%, calculated on EBIT before
employee participation (Annex 16.5.1.1). Since CPAC maintains financial obligations with third parties, the discount rate used corresponds to the weighted average cost of capital (WACC), estimated at 9.82% nominal in soles, after
taxes. CPAC’s financial statements are presented and projected under IFRS 16 (see Annexes 16.5.2.6 and 16.5.3), a standard that changed the accounting treatment of leases. However, the following adjustments are made to determine the cash
flows: (1) the depreciation of the right-of-use asset and the amortization of the lease liability are excluded from the operating income, and (2) the lease payment is included in the operating income. As a result, a free cash flow is
structured and projected that is consistent with the Company’s actual payments (see explanation and reconciliation of items in Annex 16.5.3.2). E3 110
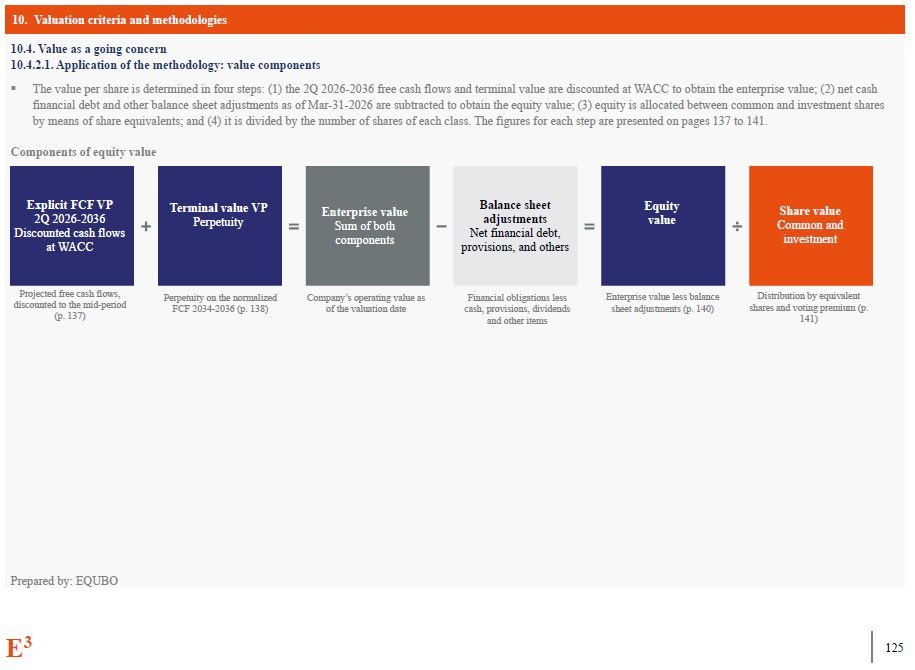
10. Valuation criteria and methodologies 10.4. Value as a going
concern Application of the methodology: value components The value per share is determined in four steps: (1) the 2Q 2026-2036 free cash flows and terminal value are discounted at WACC to obtain the enterprise value; (2) net cash
financial debt and other balance sheet adjustments as of Mar-31-2026 are subtracted to obtain the equity value; (3) equity is allocated between common and investment shares by means of share equivalents; and (4) it is divided by the
number of shares of each class. The figures for each step are presented on pages 137 to 141. Components of equity value Prepared by: EQUBO Explicit FCF VP 2Q 2026-2036 Discounted cash flows at WACC Terminal value
VP Perpetuity Enterprise value Sum of both components Balance sheet adjustments Net financial debt, provisions, and others Equity value Share value Common and investment Projected free cash flows, discounted to the mid-period (p.
137) Perpetuity on the normalized FCF 2034-2036 (p. 138) Company’s operating value as of the valuation date Financial obligations less cash, provisions, dividends and other items Enterprise value less balance sheet adjustments (p.
140) Distribution by equivalent shares and voting premium (p. 141) E3 110
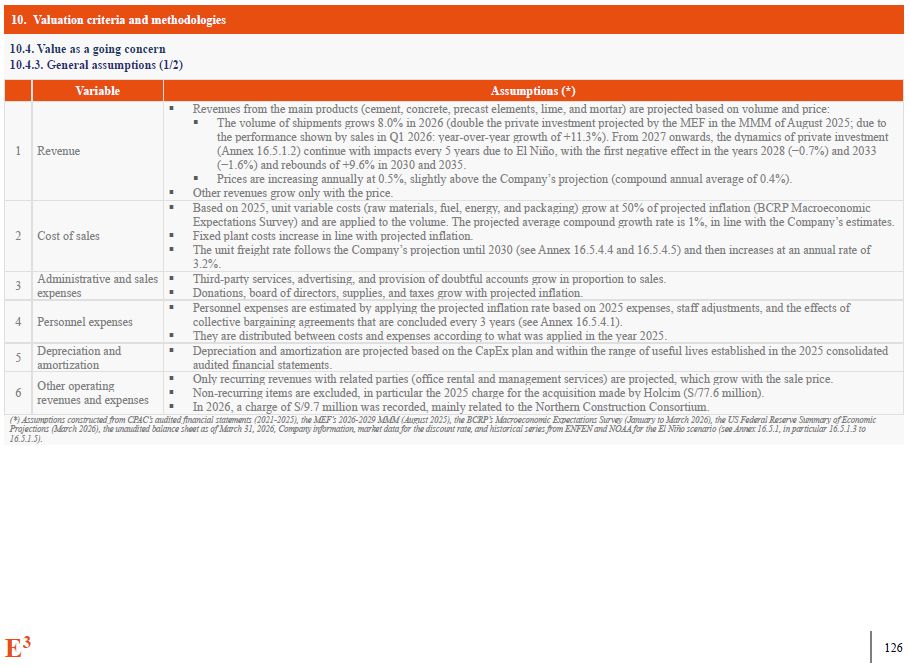
10. Valuation criteria and methodologies 10.4. Value as a going
concern 10.4.3. General assumptions (1/2) Variable Assumptions (*) 1 Revenue Revenues from the main products (cement, concrete, precast elements, lime, and mortar) are projected based on volume and price: The volume of shipments
grows 8.0% in 2026 (double the private investment projected by the MEF in the MMM of August 2025; due to the performance shown by sales in Q1 2026: year-over-year growth of +11.3%). From 2027 onwards, the dynamics of private investment
(Annex 16.5.1.2) continue with impacts every 5 years due to El Niño, with the first negative effect in the years 2028 (−0.7%) and 2033 (−1.6%) and rebounds of +9.6% in 2030 and 2035. Prices are increasing annually at 0.5%, slightly above
the Company’s projection (compound annual average of 0.4%). Other revenues grow only with the price. 2 Cost of sales Based on 2025, unit variable costs (raw materials, fuel, energy, and packaging) grow at 50% of projected inflation
(BCRP Macroeconomic Expectations Survey) and are applied to the volume. The projected average compound growth rate is 1%, in line with the Company’s estimates. Fixed plant costs increase in line with projected inflation. The unit
freight rate follows the Company’s projection until 2030 (see Annex 16.5.4.4 and 16.5.4.5) and then increases at an annual rate of 3.2%. 3 Administrative and sales expenses Third-party services, advertising, and provision of doubtful
accounts grow in proportion to sales. Donations, board of directors, supplies, and taxes grow with projected inflation. 4 Personnel expenses Personnel expenses are estimated by applying the projected inflation rate based on 2025
expenses, staff adjustments, and the effects of collective bargaining agreements that are concluded every 3 years (see Annex 16.5.4.1). They are distributed between costs and expenses according to what was applied in the year
2025. 5 Depreciation and amortization Depreciation and amortization are projected based on the CapEx plan and within the range of useful lives established in the 2025 consolidated audited financial statements. 6 Other operating
revenues and expenses Only recurring revenues with related parties (office rental and management services) are projected, which grow with the sale price. Non-recurring items are excluded, in particular the 2025 charge for the
acquisition made by Holcim (S/77.6 million). In 2026, a charge of S/9.7 million was recorded, mainly related to the Northern Construction Consortium. (*) Assumptions constructed from CPAC’s audited financial statements (2021-2025), the
MEF’s 2026-2029 MMM (August 2025), the BCRP’s Macroeconomic Expectations Survey (January to March 2026), the US Federal Reserve Summary of Economic Projections (March 2026), the unaudited balance sheet as of March 31, 2026, Company
information, market data for the discount rate, and historical series from ENFEN and NOAA for the El Niño scenario (see Annex 16.5.1, in particular 16.5.1.3 to 16.5.1.5). E3 110
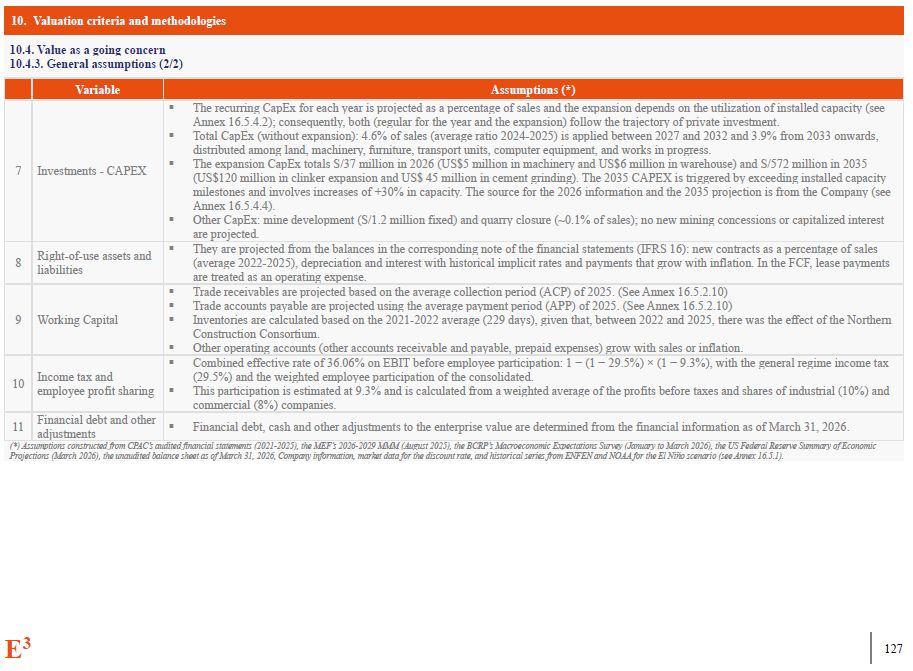
10. Valuation criteria and methodologies 10.4. Value as a going
concern 10.4.3. General assumptions (2/2) Variable Assumptions (*) 7 Investments - CAPEX The recurring CapEx for each year is projected as a percentage of sales and the expansion depends on the utilization of installed capacity (see
Annex 16.5.4.2); consequently, both (regular for the year and the expansion) follow the trajectory of private investment. Total CapEx (without expansion): 4.6% of sales (average ratio 2024-2025) is applied between 2027 and 2032 and 3.9%
from 2033 onwards, distributed among land, machinery, furniture, transport units, computer equipment, and works in progress. The expansion CapEx totals S/37 million in 2026 (US$5 million in machinery and US$6 million in warehouse) and
S/572 million in 2035 (US$120 million in clinker expansion and US$ 45 million in cement grinding). The 2035 CAPEX is triggered by exceeding installed capacity milestones and involves increases of +30% in capacity. The source for the 2026
information and the 2035 projection is from the Company (see Annex 16.5.4.4). Other CapEx: mine development (S/1.2 million fixed) and quarry closure (~0.1% of sales); no new mining concessions or capitalized interest are
projected. 8 Right-of-use assets and liabilities They are projected from the balances in the corresponding note of the financial statements (IFRS 16): new contracts as a percentage of sales (average 2022-2025), depreciation and
interest with historical implicit rates and payments that grow with inflation. In the FCF, lease payments are treated as an operating expense. 9 Working Capital Trade receivables are projected based on the average collection period
(ACP) of 2025. (See Annex 16.5.2.10) Trade accounts payable are projected using the average payment period (APP) of 2025. (See Annex 16.5.2.10) Inventories are calculated based on the 2021-2022 average (229 days), given that, between
2022 and 2025, there was the effect of the Northern Construction Consortium. Other operating accounts (other accounts receivable and payable, prepaid expenses) grow with sales or inflation. 10 Income tax and employee profit
sharing Combined effective rate of 36.06% on EBIT before employee participation: 1 − (1 − 29.5%) × (1 − 9.3%), with the general regime income tax (29.5%) and the weighted employee participation of the consolidated. This participation is
estimated at 9.3% and is calculated from a weighted average of the profits before taxes and shares of industrial (10%) and commercial (8%) companies. 11 Financial debt and other adjustments Financial debt, cash and other adjustments
to the enterprise value are determined from the financial information as of March 31, 2026. (*) Assumptions constructed from CPAC’s audited financial statements (2021-2025), the MEF’s 2026-2029 MMM (August 2025), the BCRP’s Macroeconomic
Expectations Survey (January to March 2026), the US Federal Reserve Summary of Economic Projections (March 2026), the unaudited balance sheet as of March 31, 2026, Company information, market data for the discount rate, and historical
series from ENFEN and NOAA for the El Niño scenario (see Annex 16.5.1). E3 110
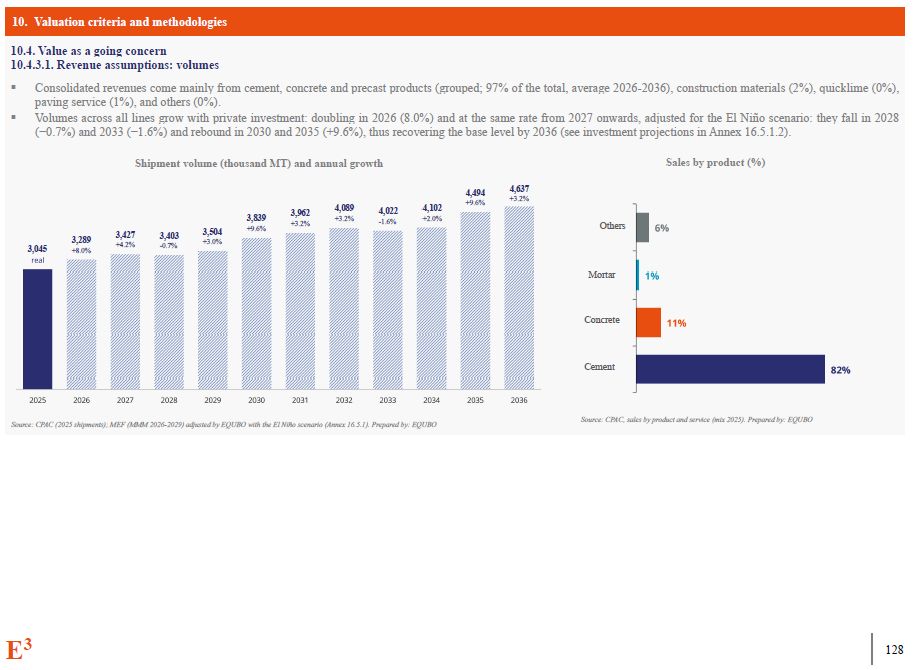
3,045 3,289 +8.0% 3,427 +4.2% 3,403 -0.7% 3,504 +3.0% 3,839 +9.6% 3,962 +3.2% 4,089 4,022 4,102 +3.2% -1.6% +2.0% 4,494 +9.6% 4,637 +3.2% Source:
CPAC (2025 shipments); MEF (MMM 2026-2029) adjusted by EQUBO with the El Niño scenario (Annex 16.5.1). Prepared by: EQUBO Source: CPAC, sales by product and service (mix 2025). Prepared by: EQUBO Cement Concrete Mortar Others 10.
Valuation criteria and methodologies 10.4. Value as a going concern Revenue assumptions: volumes Consolidated revenues come mainly from cement, concrete and precast products (grouped; 97% of the total, average 2026-2036), construction
materials (2%), quicklime (0%), paving service (1%), and others (0%). Volumes across all lines grow with private investment: doubling in 2026 (8.0%) and at the same rate from 2027 onwards, adjusted for the El Niño scenario: they fall in
2028 (−0.7%) and 2033 (−1.6%) and rebound in 2030 and 2035 (+9.6%), thus recovering the base level by 2036 (see investment projections in Annex 16.5.1.2). Shipment volume (thousand MT) and annual growth Sales by product (%) E3 110
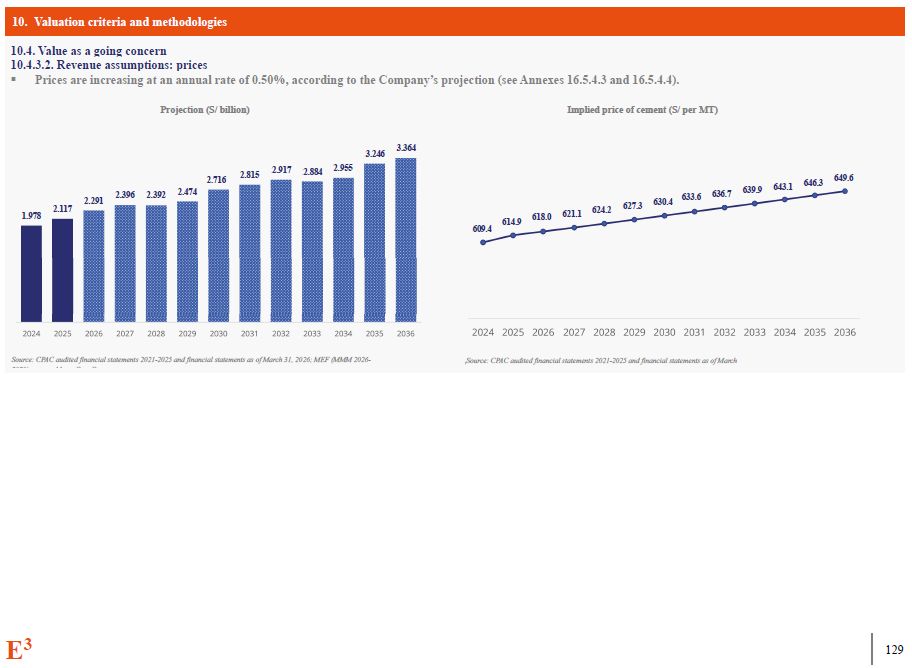
10. Valuation criteria and methodologies 1.978 2.117 2.291 2.396
2.392 2.474 2.716 2.815 2.917 2.884 2.955 3.246 3.364 609.4 Source: CPAC audited financial statements 2021-2025 and financial statements as of March 31, 2026; MEF (MMM 2026- Source: CPAC audited financial statements 2021-2025
and financial statements as of March 10.4. Value as a going concern 10.4.3.2. Revenue assumptions: prices Prices are increasing at an annual rate of 0.50%, according to the Company’s projection (see Annexes 16.5.4.3 and
16.5.4.4). Projection (S/ billion) Implied price of cement (S/ per MT) 614.9 618.0 621.1 624.2 627.3 630.4 633.6 636.7 639.9 643.1 646.3 649.6 E3 110
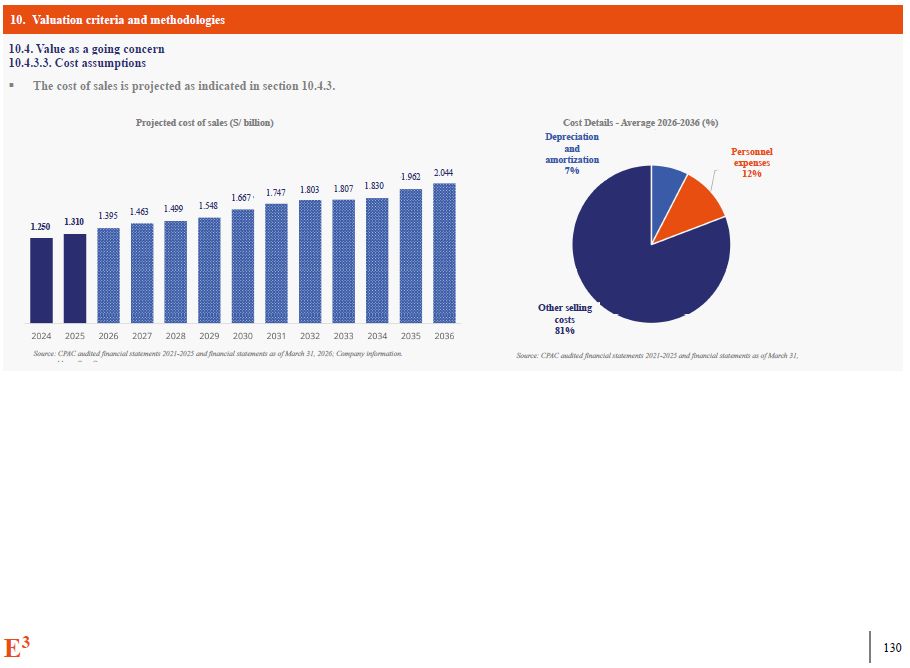
10. Valuation criteria and methodologies 10.4. Value as a going
concern 10.4.3.3. Cost assumptions The cost of sales is projected as indicated in section 10.4.3. 1.250 1.310 1.395 1.463 1.499 1.548 1.667 1.747 1.803 1.807 1.830 1.962 2.044 Source: CPAC audited financial statements
2021-2025 and financial statements as of March 31, 2026; Company information. Source: CPAC audited financial statements 2021-2025 and financial statements as of March 31, Projected cost of sales (S/ billion) Cost Details - Average
2026-2036 (%) Depreciation and amortization 7% Personnel expenses 12% Other selling costs 81% E3 110
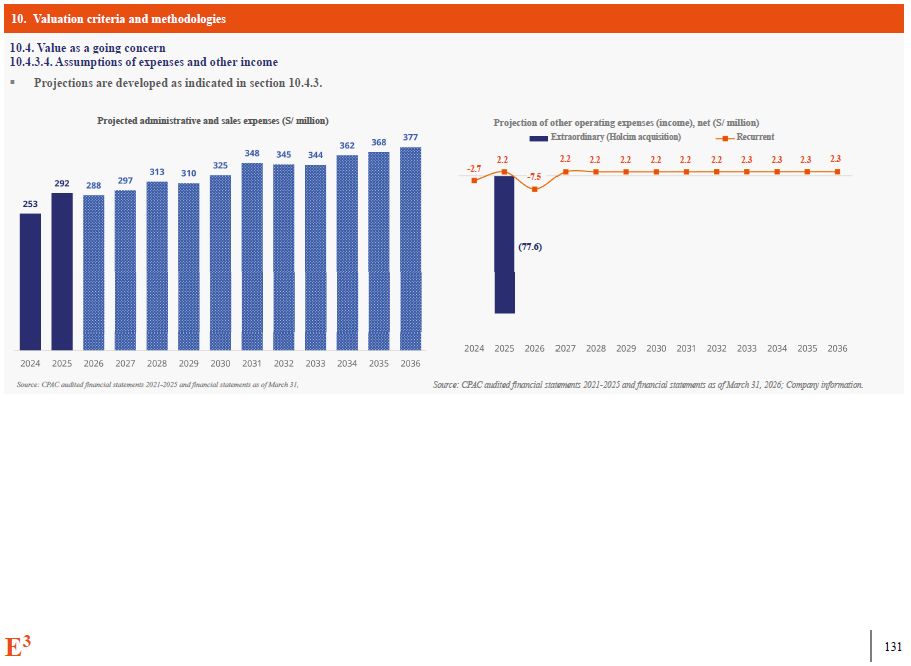
10. Valuation criteria and methodologies 10.4. Value as a going
concern 10.4.3.4. Assumptions of expenses and other income Projections are developed as indicated in section 10.4.3. Projected administrative and sales expenses (S/ million) Source: CPAC audited financial statements 2021-2025 and
financial statements as of March 31, Source: CPAC audited financial statements 2021-2025 and financial statements as of March 31, 2026; Company information. (77.6) -2.7 -7.5 Projection of other operating expenses (income), net (S/
million) Extraordinary (Holcim acquisition) Recurrent 2.2 2.2 2.2 2.2 2.2 2.2 2.2 2.3 2.3 2.3 2.3 E3 110
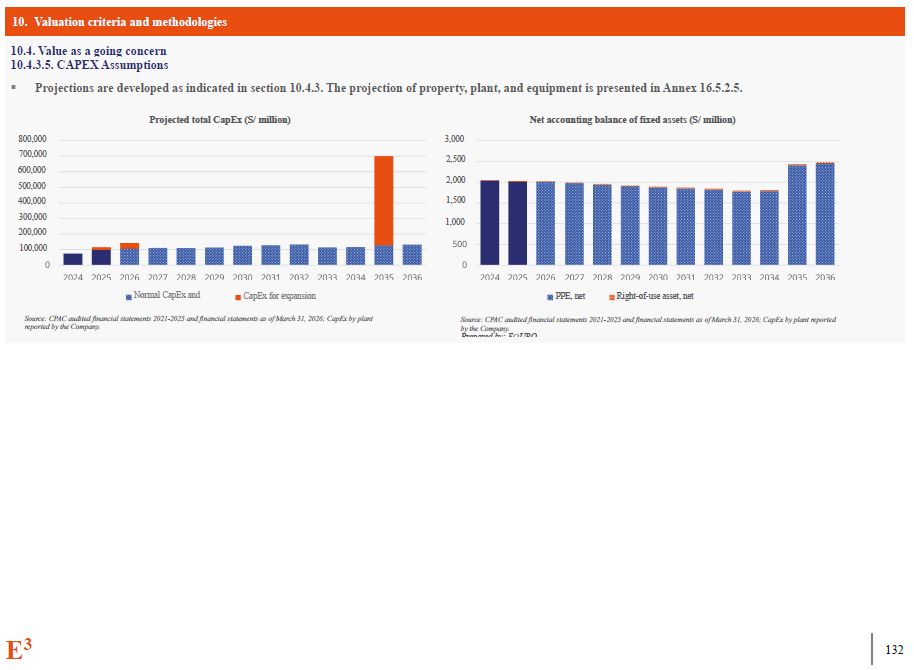
10. Valuation criteria and methodologies 10.4. Value as a going
concern 10.4.3.5. CAPEX Assumptions Projections are developed as indicated in section 10.4.3. The projection of property, plant, and equipment is presented in Annex
16.5.2.5. 800,000 700,000 600,000 500,000 400,000 300,000 200,000 100,000 PPE, net Right-of-use asset, net Source: CPAC audited financial statements 2021-2025 and financial statements as of March 31, 2026; CapEx by plant
reported by the Company. Normal CapEx and CapEx for expansion Source: CPAC audited financial statements 2021-2025 and financial statements as of March 31, 2026; CapEx by plant reported by the Company. Projected total CapEx (S/
million) Net accounting balance of fixed assets (S/ million) 3,000 2,500 2,000 1,500 1,000 E3 110
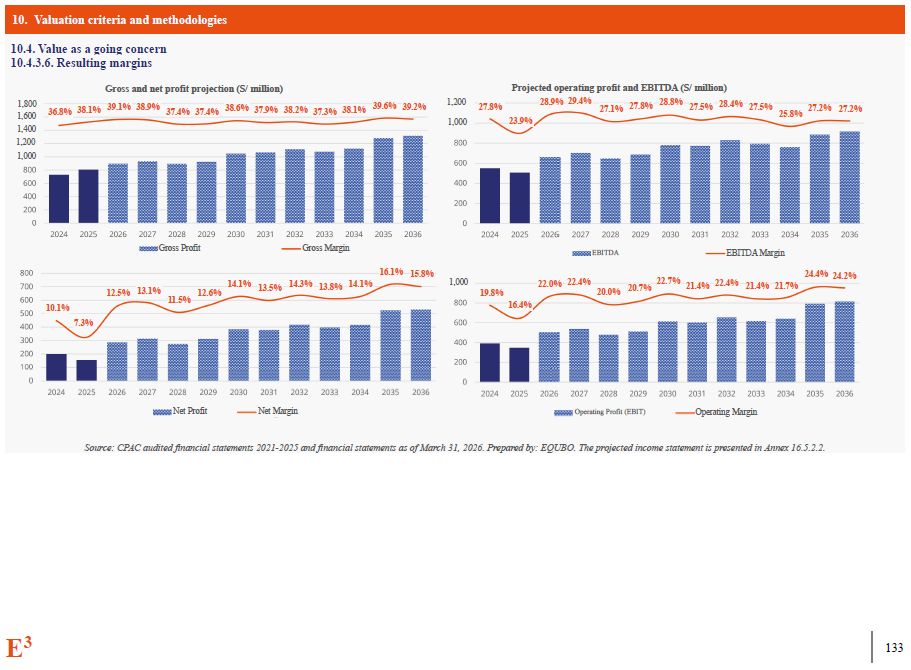
10. Valuation criteria and methodologies 10.4. Value as a going
concern 10.4.3.6. Resulting margins Source: CPAC audited financial statements 2021-2025 and financial statements as of March 31, 2026. Prepared by: EQUBO. The projected income statement is presented in Annex
16.5.2.2. 1,800 1,600 1,400 1,200 1,000 Gross and net profit projection (S/ million) Projected operating profit and EBITDA (S/ million) 1,200 1,000 EBITDA EBITDA Margin Gross Margin Gross Profit Net Margin Net
Profit Operating Profit (EBIT) Operating Margin 36.8% 38.1% 39.1% 38.9% 37.4% 37.4% 38.6% 37.9% 38.2% 37.3% 38.1% 39.6% 39.2% 27.8% 23.9% 28.9% 29.4% 27.8% 28.8% 27.5% 28.4% 27.5% 27.1% 25.8% 27.2% 27.2% 19.8% 16.4% 22.0%
22.4% 20.0% 20.7% 22.7% 21.4% 22.4% 21.4% 21.7% 24.4% 24.2% 16.1% 15.8% 14.1% 13.8% 14.3% 13.5% 14.1% 12.6% 11.5% 12.5% 13.1% 7.3% 10.1% 1,000 E3 110
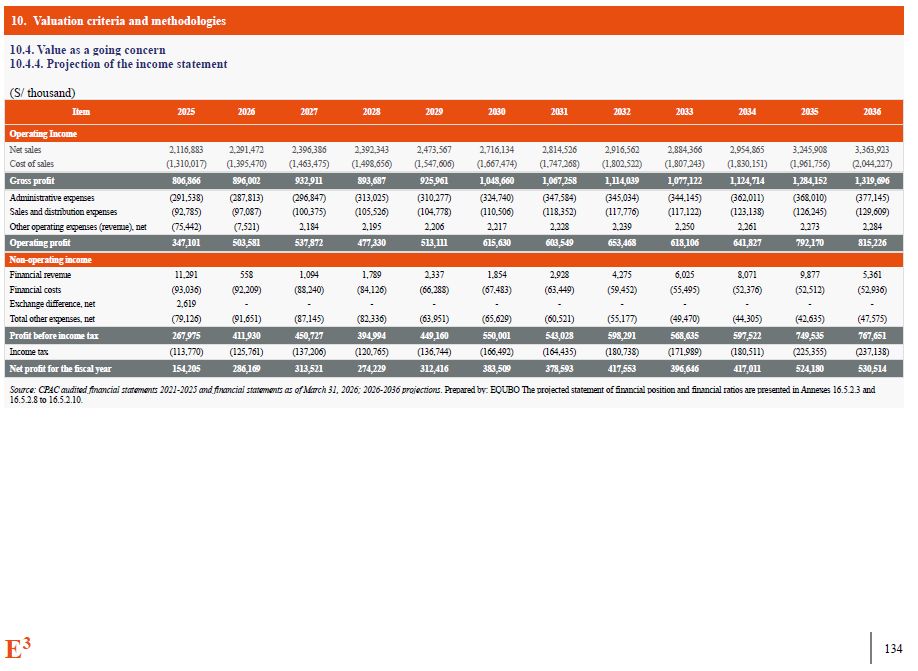
10. Valuation criteria and methodologies 10.4. Value as a going
concern 10.4.4. Projection of the income statement (S/ thousand) Item 2025 2026 2027 2028 2029 2030 2031 2032 2033 2034 2035 2036 Operating Income Net
sales 2,116,883 2,291,472 2,396,386 2,392,343 2,473,567 2,716,134 2,814,526 2,916,562 2,884,366 2,954,865 3,245,908 3,363,923 Cost of
sales (1,310,017) (1,395,470) (1,463,475) (1,498,656) (1,547,606) (1,667,474) (1,747,268) (1,802,522) (1,807,243) (1,830,151) (1,961,756) (2,044,227) Gross
profit 806,866 896,002 932,911 893,687 925,961 1,048,660 1,067,258 1,114,039 1,077,122 1,124,714 1,284,152 1,319,696 Administrative
expenses (291,538) (287,813) (296,847) (313,025) (310,277) (324,740) (347,584) (345,034) (344,145) (362,011) (368,010) (377,145) Sales and distribution
expenses (92,785) (97,087) (100,375) (105,526) (104,778) (110,506) (118,352) (117,776) (117,122) (123,138) (126,245) (129,609) Other operating expenses (revenue),
net (75,442) (7,521) 2,184 2,195 2,206 2,217 2,228 2,239 2,250 2,261 2,273 2,284 Operating profit 347,101 503,581 537,872 477,330 513,111 615,630 603,549 653,468 618,106 641,827 792,170 815,226 Non-operating
income Financial revenue 11,291 558 1,094 1,789 2,337 1,854 2,928 4,275 6,025 8,071 9,877 5,361 Financial
costs (93,036) (92,209) (88,240) (84,126) (66,288) (67,483) (63,449) (59,452) (55,495) (52,376) (52,512) (52,936) Exchange difference, net 2,619 - - - - - - - - - - - Total other expenses,
net (79,126) (91,651) (87,145) (82,336) (63,951) (65,629) (60,521) (55,177) (49,470) (44,305) (42,635) (47,575) Profit before income
tax 267,975 411,930 450,727 394,994 449,160 550,001 543,028 598,291 568,635 597,522 749,535 767,651 Income
tax (113,770) (125,761) (137,206) (120,765) (136,744) (166,492) (164,435) (180,738) (171,989) (180,511) (225,355) (237,138) Net profit for the fiscal
year 154,205 286,169 313,521 274,229 312,416 383,509 378,593 417,553 396,646 417,011 524,180 530,514 Source: CPAC audited financial statements 2021-2025 and financial statements as of March 31, 2026; 2026-2036 projections.
Prepared by: EQUBO The projected statement of financial position and financial ratios are presented in Annexes 16.5.2.3 and 16.5.2.8 to 16.5.2.10. E3 110
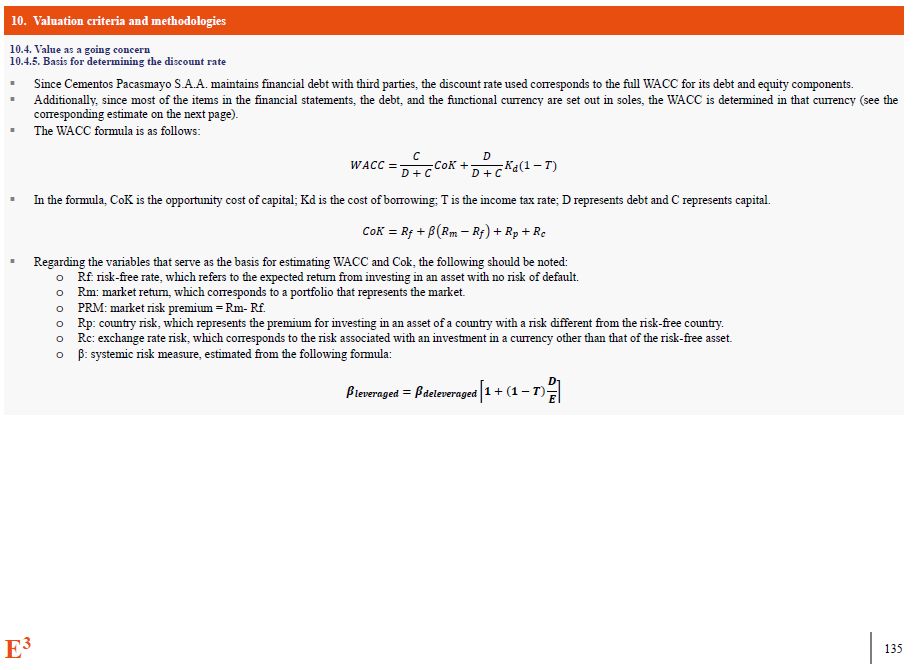
Valuation criteria and methodologies Value as a going concern Basis for
determining the discount rate Since Cementos Pacasmayo S.A.A. maintains financial debt with third parties, the discount rate used corresponds to the full WACC for its debt and equity components. Additionally, since most of the items in
the financial statements, the debt, and the functional currency are set out in soles, the WACC is determined in that currency (see the corresponding estimate on the next page). The WACC formula is as follows: �������� = �� �� �� + ��
�� + �� d ������ + �� (1 − ��) In the formula, CoK is the opportunity cost of capital; Kd is the cost of borrowing; T is the income tax rate; D represents debt and C represents capital. ������ = �� + ��൫�� − ��൯ + �� +
�� Regarding the variables that serve as the basis for estimating WACC and Cok, the following should be noted: Rf: risk-free rate, which refers to the expected return from investing in an asset with no risk of default. Rm: market
return, which corresponds to a portfolio that represents the market. PRM: market risk premium = Rm- Rf. Rp: country risk, which represents the premium for investing in an asset of a country with a risk different from the risk-free
country. Rc: exchange rate risk, which corresponds to the risk associated with an investment in a currency other than that of the risk-free asset. β: systemic risk measure, estimated from the following formula: �������������������� =
������������������������ [�� + (�� − ��) �� ��] E3 110
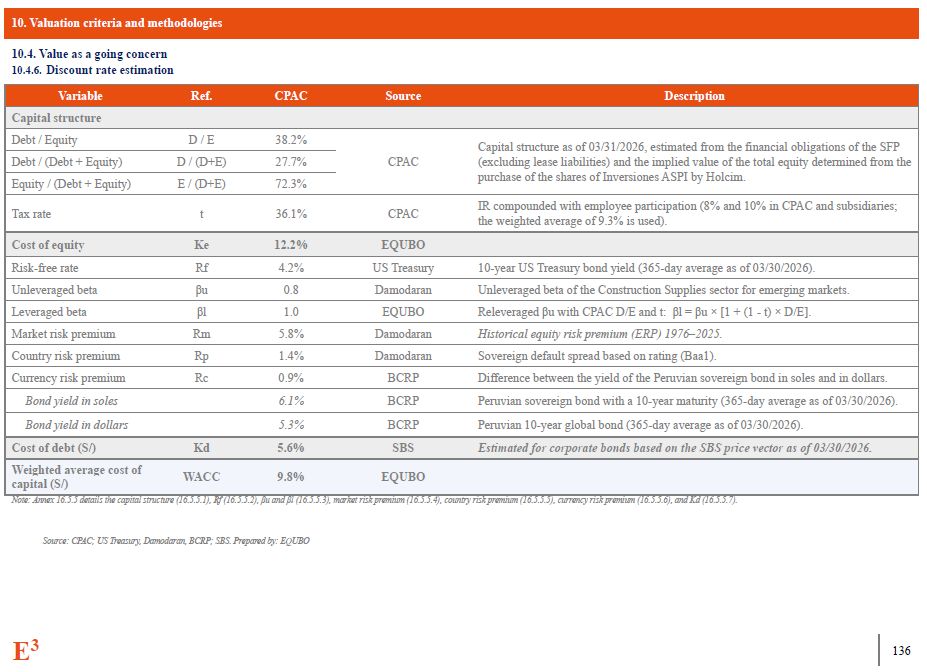
10. Valuation criteria and methodologies E3 110 10.4. Value as a going
concern 10.4.6. Discount rate estimation Variable Ref. CPAC Source Description Capital structure Debt / Equity D / E 38.2% CPAC Capital structure as of 03/31/2026, estimated from the financial obligations of the SFP (excluding
lease liabilities) and the implied value of the total equity determined from the purchase of the shares of Inversiones ASPI by Holcim. Debt / (Debt + Equity) D / (D+E) 27.7% Equity / (Debt + Equity) E / (D+E) 72.3% Tax
rate t 36.1% CPAC IR compounded with employee participation (8% and 10% in CPAC and subsidiaries; the weighted average of 9.3% is used). Cost of equity Ke 12.2% EQUBO Risk-free rate Rf 4.2% US Treasury 10-year US Treasury
bond yield (365-day average as of 03/30/2026). Unleveraged beta βu 0.8 Damodaran Unleveraged beta of the Construction Supplies sector for emerging markets. Leveraged beta βl 1.0 EQUBO Releveraged βu with CPAC D/E and t: βl = βu
× [1 + (1 - t) × D/E]. Market risk premium Rm 5.8% Damodaran Historical equity risk premium (ERP) 1976–2025. Country risk premium Rp 1.4% Damodaran Sovereign default spread based on rating (Baa1). Currency risk
premium Rc 0.9% BCRP Difference between the yield of the Peruvian sovereign bond in soles and in dollars. Bond yield in soles 6.1% BCRP Peruvian sovereign bond with a 10-year maturity (365-day average as of 03/30/2026). Bond
yield in dollars 5.3% BCRP Peruvian 10-year global bond (365-day average as of 03/30/2026). Cost of debt (S/) Kd 5.6% SBS Estimated for corporate bonds based on the SBS price vector as of 03/30/2026. Weighted average cost of
capital (S/) WACC 9.8% EQUBO Note: Annex 16.5.5 details the capital structure (16.5.5.1), Rf (16.5.5.2), βu and βl (16.5.5.3), market risk premium (16.5.5.4), country risk premium (16.5.5.5), currency risk premium (16.5.5.6), and Kd
(16.5.5.7). Source: CPAC; US Treasury, Damodaran, BCRP; SBS. Prepared by: EQUBO
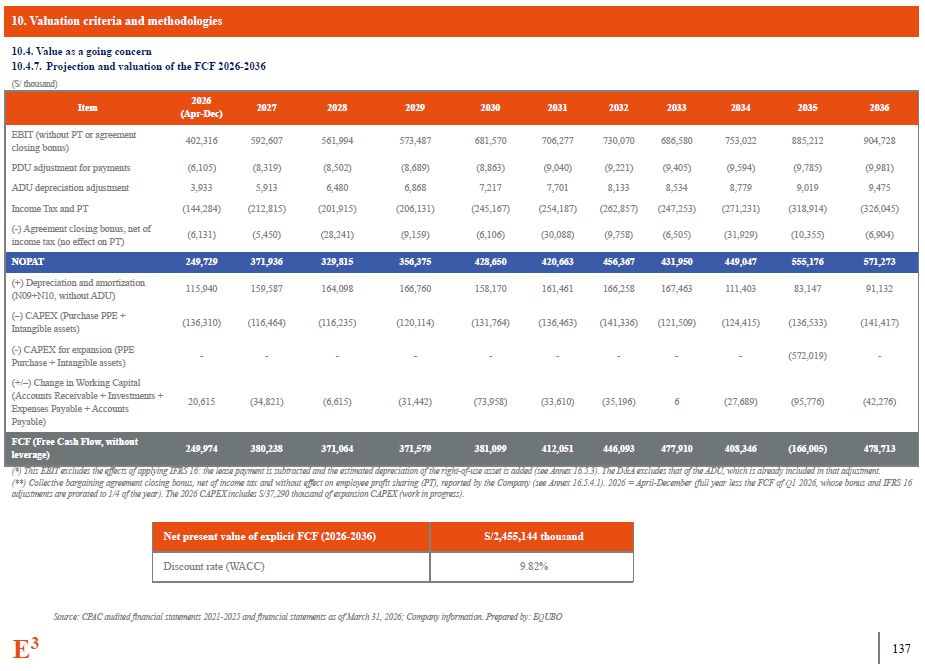
10. Valuation criteria and methodologies E3 110 10.4. Value as a going
concern 10.4.7. Projection and valuation of the FCF 2026-2036 (S/ thousand) Item 2026 (Apr-Dec) 2027 2028 2029 2030 2031 2032 2033 2034 2035 2036 EBIT (without PT or
agreement 402,316 592,607 561,994 573,487 681,570 706,277 730,070 686,580 753,022 885,212 904,728 closing bonus) PDU adjustment for
payments (6,105) (8,319) (8,502) (8,689) (8,863) (9,040) (9,221) (9,405) (9,594) (9,785) (9,981) ADU depreciation adjustment 3,933 5,913 6,480 6,868 7,217 7,701 8,133 8,534 8,779 9,019 9,475 Income Tax and
PT (144,284) (212,815) (201,915) (206,131) (245,167) (254,187) (262,857) (247,253) (271,231) (318,914) (326,045) (-) Agreement closing bonus, net
of (6,131) (5,450) (28,241) (9,159) (6,106) (30,088) (9,758) (6,505) (31,929) (10,355) (6,904) income tax (no effect on
PT) NOPAT 249,729 371,936 329,815 356,375 428,650 420,663 456,367 431,950 449,047 555,176 571,273 (+) Depreciation and
amortization 115,940 159,587 164,098 166,760 158,170 161,461 166,258 167,463 111,403 83,147 91,132 (N09+N10, without ADU) (–) CAPEX (Purchase PPE
+ (136,310) (116,464) (116,235) (120,114) (131,764) (136,463) (141,336) (121,509) (124,415) (136,533) (141,417) Intangible assets) (-) CAPEX for expansion (PPE - - - - - - - - - (572,019) - Purchase + Intangible
assets) (+/–) Change in Working Capital (Accounts Receivable + Investments + 20,615 (34,821) (6,615) (31,442) (73,958) (33,610) (35,196) 6 (27,689) (95,776) (42,276) Expenses Payable + Accounts Payable) FCF (Free Cash
Flow, without leverage) 249,974 380,238 371,064 371,579 381,099 412,051 446,093 477,910 408,346 (166,005) 478,713 (*) This EBIT excludes the effects of applying IFRS 16: the lease payment is subtracted and the estimated
depreciation of the right-of-use asset is added (see Annex 16.5.3). The D&A excludes that of the ADU, which is already included in that adjustment. (**) Collective bargaining agreement closing bonus, net of income tax and without
effect on employee profit sharing (PT), reported by the Company (see Annex 16.5.4.1). 2026 = April-December (full year less the FCF of Q1 2026, whose bonus and IFRS 16 adjustments are prorated to 1/4 of the year). The 2026 CAPEX includes
S/37,290 thousand of expansion CAPEX (work in progress). Net present value of explicit FCF (2026-2036) S/2,455,144 thousand Discount rate (WACC) 9.82% Source: CPAC audited financial statements 2021-2025 and financial statements as of
March 31, 2026; Company information. Prepared by: EQUBO
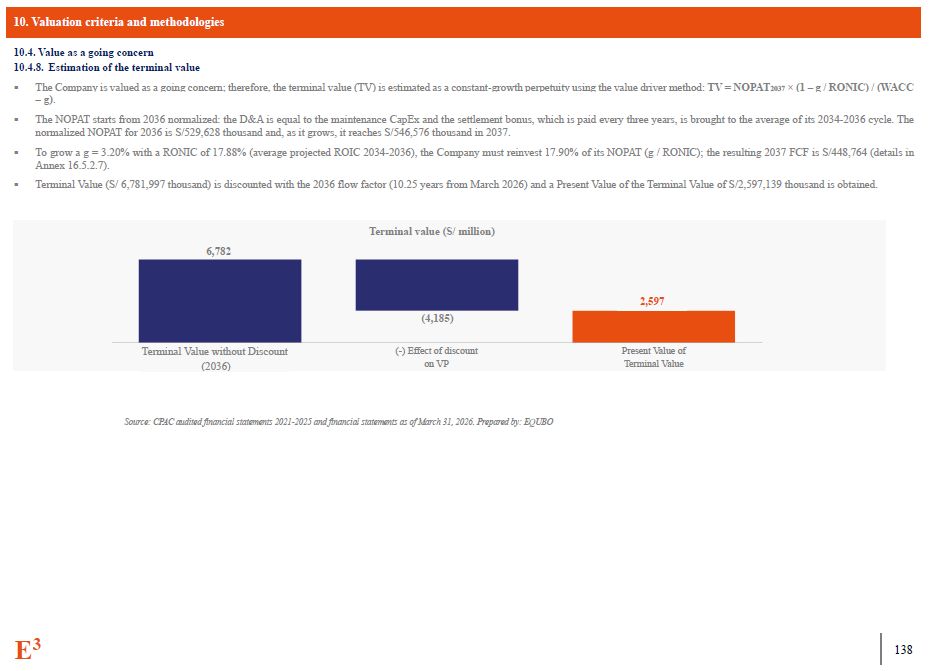
10. Valuation criteria and methodologies Source: CPAC audited financial
statements 2021-2025 and financial statements as of March 31, 2026. Prepared by: EQUBO Value as a going concern Estimation of the terminal value The Company is valued as a going concern; therefore, the terminal value (TV) is estimated
as a constant-growth perpetuity using the value driver method: TV = NOPAT2037 × (1 – g / RONIC) / (WACC – g). The NOPAT starts from 2036 normalized: the D&A is equal to the maintenance CapEx and the settlement bonus, which is paid
every three years, is brought to the average of its 2034-2036 cycle. The normalized NOPAT for 2036 is S/529,628 thousand and, as it grows, it reaches S/546,576 thousand in 2037. To grow a g = 3.20% with a RONIC of 17.88% (average
projected ROIC 2034-2036), the Company must reinvest 17.90% of its NOPAT (g / RONIC); the resulting 2037 FCF is S/448,764 (details in Annex 16.5.2.7). Terminal Value (S/ 6,781,997 thousand) is discounted with the 2036 flow factor (10.25
years from March 2026) and a Present Value of the Terminal Value of S/2,597,139 thousand is obtained. Terminal value (S/ million) 6,782 2,597 Terminal Value without Discount (2036) (-) Effect of discount on VP Present Value of
Terminal Value (4,185) E3 110
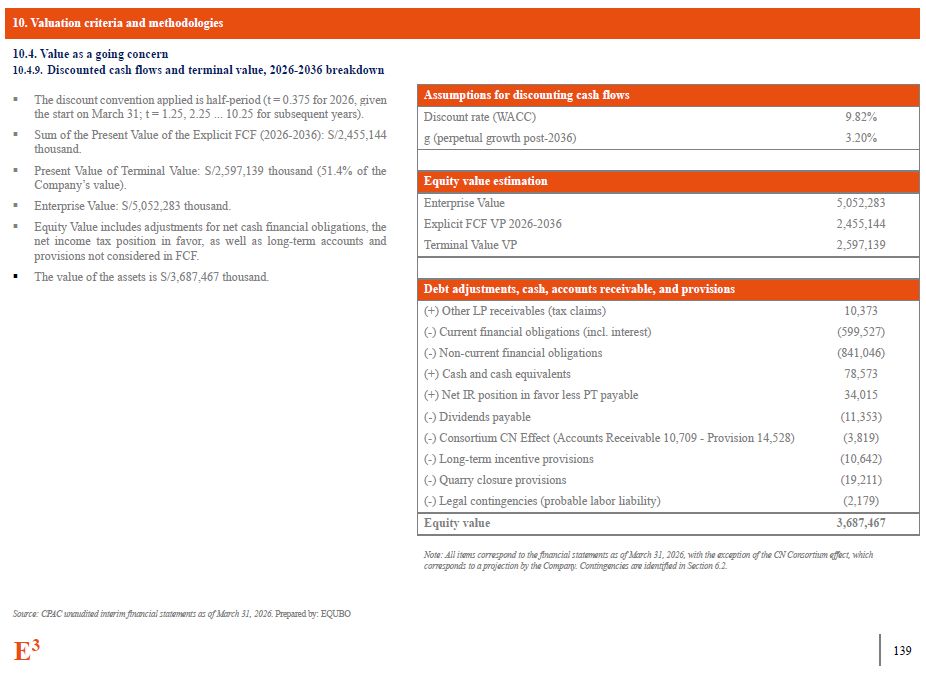
10. Valuation criteria and methodologies E3 110 10.4. Value as a going
concern 10.4.9. Discounted cash flows and terminal value, 2026-2036 breakdown The discount convention applied is half-period (t = 0.375 for 2026, given the start on March 31; t = 1.25, 2.25 ... 10.25 for subsequent years). Sum of the
Present Value of the Explicit FCF (2026-2036): S/2,455,144 thousand. Present Value of Terminal Value: S/2,597,139 thousand (51.4% of the Company’s value). Enterprise Value: S/5,052,283 thousand. Equity Value includes adjustments for
net cash financial obligations, the net income tax position in favor, as well as long-term accounts and provisions not considered in FCF. The value of the assets is S/3,687,467 thousand. Assumptions for discounting cash flows Discount
rate (WACC) g (perpetual growth post-2036) 9.82% 3.20% Equity value estimation Enterprise Value 5,052,283 Explicit FCF VP 2026-2036 2,455,144 Terminal Value VP 2,597,139 Debt adjustments, cash, accounts receivable, and
provisions (+) Other LP receivables (tax claims) 10,373 (-) Current financial obligations (incl. interest) (599,527) (-) Non-current financial obligations (841,046) (+) Cash and cash equivalents 78,573 (+) Net IR position in
favor less PT payable 34,015 (-) Dividends payable (11,353) (-) Consortium CN Effect (Accounts Receivable 10,709 - Provision 14,528) (3,819) (-) Long-term incentive provisions (10,642) (-) Quarry closure provisions (19,211) (-)
Legal contingencies (probable labor liability) (2,179) Equity value 3,687,467 Note: All items correspond to the financial statements as of March 31, 2026, with the exception of the CN Consortium effect, which corresponds to a
projection by the Company. Contingencies are identified in Section 6.2. Source: CPAC unaudited interim financial statements as of March 31, 2026. Prepared by: EQUBO
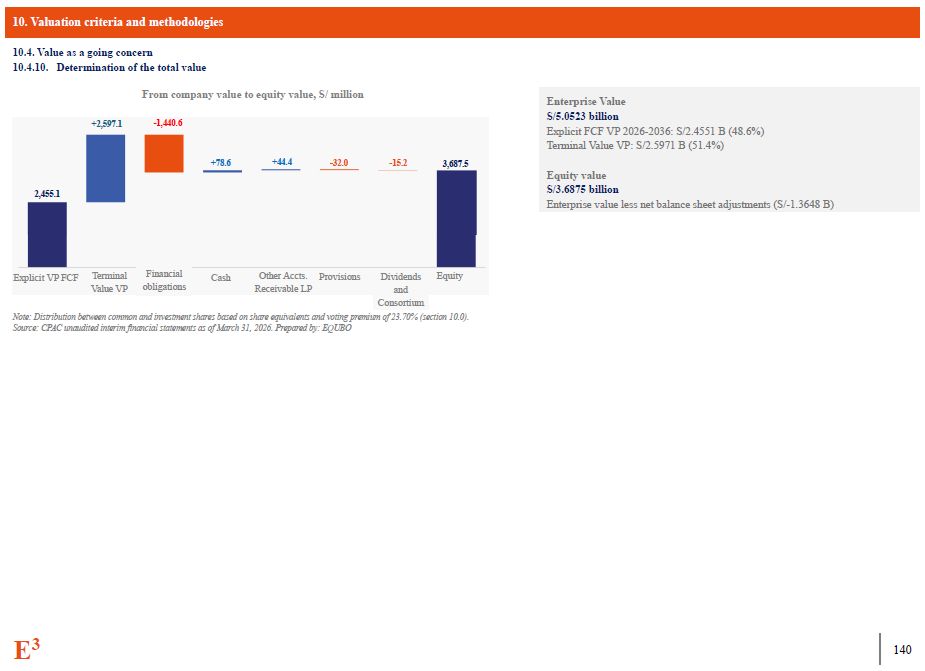
10. Valuation criteria and methodologies 10.4. Value as a going
concern 10.4.10. Determination of the total value From company value to equity value, S/ million Enterprise Value S/5.0523 billion Explicit FCF VP 2026-2036: S/2.4551 B (48.6%) Terminal Value VP: S/2.5971 B (51.4%) Equity value
S/3.6875 billion Enterprise value less net balance sheet adjustments (S/-1.3648 B) Note: Distribution between common and investment shares based on share equivalents and voting premium of 23.70% (section 10.0). Source: CPAC unaudited
interim financial statements as of March 31, 2026. Prepared by: EQUBO 2,455.1 +2,597.1 -1,440.6 +78.6 +44.4 -32.0 -15.2 3,687.5 Explicit VP FCF Terminal Value VP Financial obligations Cash Other Accts. Receivable
LP Provisions Dividends and Consortium Equity E3 110
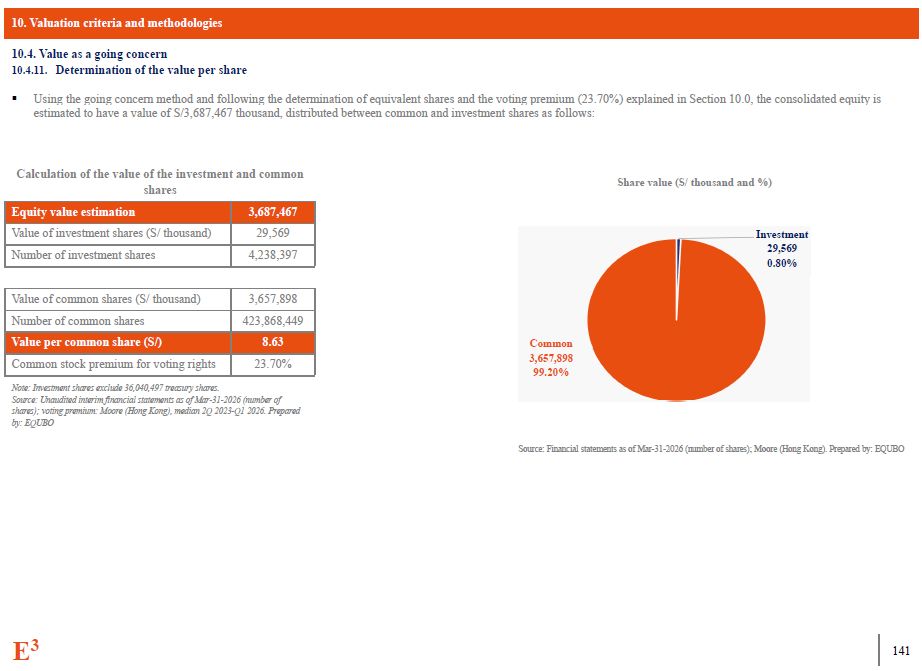
10. Valuation criteria and methodologies 10.4. Value as a going
concern 10.4.11. Determination of the value per share Using the going concern method and following the determination of equivalent shares and the voting premium (23.70%) explained in Section 10.0, the consolidated equity is estimated to
have a value of S/3,687,467 thousand, distributed between common and investment shares as follows: Calculation of the value of the investment and common shares Share value (S/ thousand and %) Equity value estimation 3,687,467 Value
of investment shares (S/ thousand) 29,569 Number of investment shares 4,238,397 Value of common shares (S/ thousand) 3,657,898 Number of common shares 423,868,449 Value per common share (S/) 8.63 Common stock premium for voting
rights 23.70% Note: Investment shares exclude 36,040,497 treasury shares. Source: Unaudited interim financial statements as of Mar-31-2026 (number of shares); voting premium: Moore (Hong Kong), median 2Q 2023-Q1 2026. Prepared by:
EQUBO Source: Financial statements as of Mar-31-2026 (number of shares); Moore (Hong Kong). Prepared by: EQUBO Common 3,657,898 99.20% E3 110 Investment 29,569 0.80%
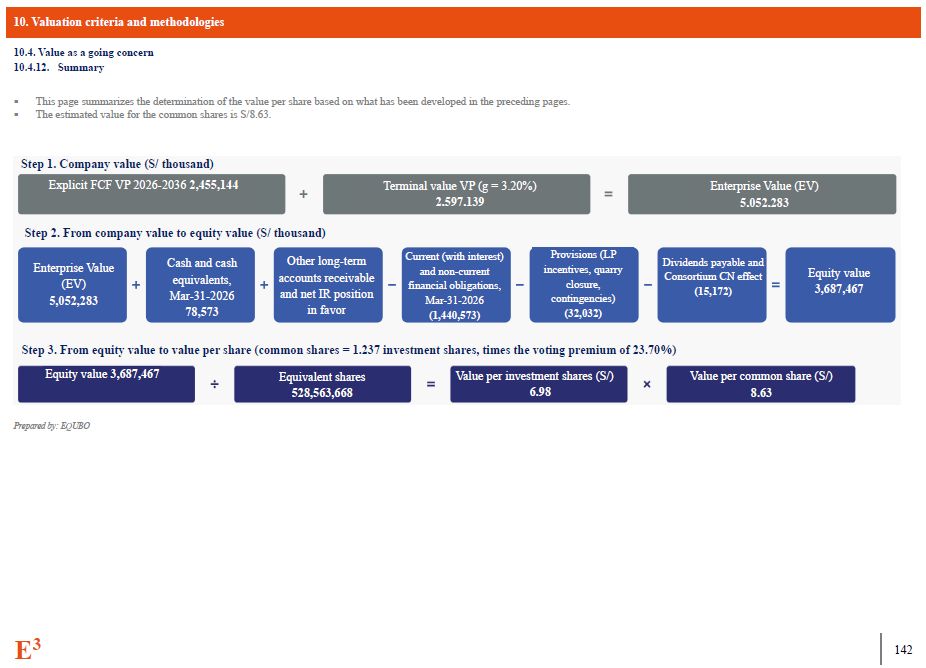
10. Valuation criteria and methodologies 10.4. Value as a going
concern 10.4.12. Summary This page summarizes the determination of the value per share based on what has been developed in the preceding pages. The estimated value for the common shares is S/8.63. Prepared by: EQUBO Step 2. From
company value to equity value (S/ thousand) Step 3. From equity value to value per share (common shares = 1.237 investment shares, times the voting premium of 23.70%) Step 1. Company value (S/ thousand) Explicit FCF VP 2026-2036
2,455,144 Terminal value VP (g = 3.20%) 2,597,139 Enterprise Value (EV) 5,052,283 Enterprise Value (EV) 5,052,283 Cash and cash equivalents, Mar-31-2026 78,573 Other long-term accounts receivable and net IR position in
favor Current (with interest) and non-current financial obligations, Mar-31-2026 (1,440,573) Provisions (LP incentives, quarry closure, contingencies) (32,032) Dividends payable and Consortium CN effect (15,172) Equity
value 3,687,467 Equity value 3,687,467 Equivalent shares 528,563,668 Value per investment shares (S/) 6.98 Value per common share (S/) 8.63 E3 110
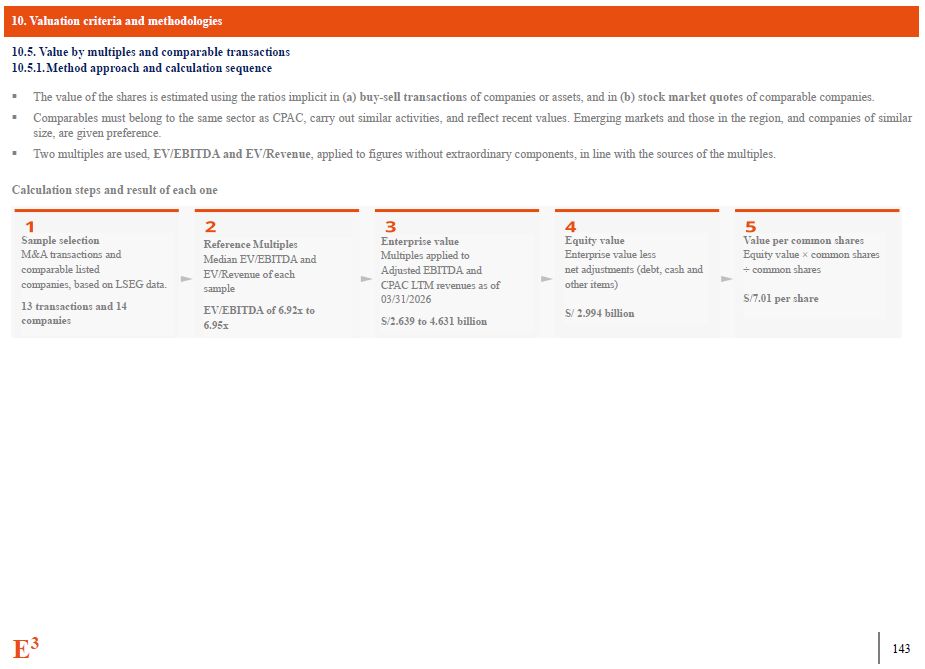
10. Valuation criteria and methodologies Value by multiples and comparable
transactions Method approach and calculation sequence The value of the shares is estimated using the ratios implicit in (a) buy-sell transactions of companies or assets, and in (b) stock market quotes of comparable
companies. Comparables must belong to the same sector as CPAC, carry out similar activities, and reflect recent values. Emerging markets and those in the region, and companies of similar size, are given preference. Two multiples are
used, EV/EBITDA and EV/Revenue, applied to figures without extraordinary components, in line with the sources of the multiples. Calculation steps and result of each one Sample selection M&A transactions and comparable
listed companies, based on LSEG data. 13 transactions and 14 companies Equity value Enterprise value less net adjustments (debt, cash and other items) S/ 2.994 billion Enterprise value Multiples applied to Adjusted EBITDA and CPAC
LTM revenues as of 03/31/2026 S/2.639 to 4.631 billion Reference Multiples Median EV/EBITDA and EV/Revenue of each sample EV/EBITDA of 6.92x to 6.95x Value per common shares Equity value × common shares ÷ common
shares E3 110 S/7.01 per share
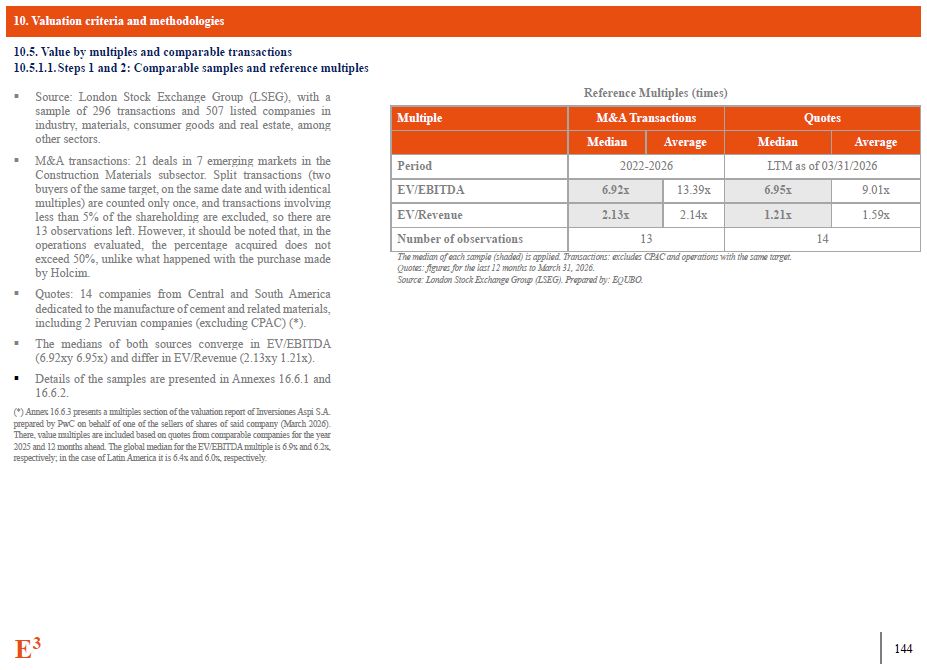
10. Valuation criteria and methodologies E3 110 10.5. Value by multiples
and comparable transactions 10.5.1.1. Steps 1 and 2: Comparable samples and reference multiples Source: London Stock Exchange Group (LSEG), with a sample of 296 transactions and 507 listed companies in industry, materials, consumer
goods and real estate, among other sectors. M&A transactions: 21 deals in 7 emerging markets in the Construction Materials subsector. Split transactions (two buyers of the same target, on the same date and with identical multiples)
are counted only once, and transactions involving less than 5% of the shareholding are excluded, so there are 13 observations left. However, it should be noted that, in the operations evaluated, the percentage acquired does not exceed
50%, unlike what happened with the purchase made by Holcim. Quotes: 14 companies from Central and South America dedicated to the manufacture of cement and related materials, including 2 Peruvian companies (excluding CPAC) (*). The
medians of both sources converge in EV/EBITDA (6.92xy 6.95x) and differ in EV/Revenue (2.13xy 1.21x). Details of the samples are presented in Annexes 16.6.1 and 16.6.2. Reference Multiples (times) Multiple M&A
Transactions Quotes Median Average Median Average Period 2022-2026 LTM as of 03/31/2026 EV/EBITDA 6.92x 13.39x 6.95x 9.01x EV/Revenue 2.13x 2.14x 1.21x 1.59x Number of observations 13 14 The median of each sample
(shaded) is applied. Transactions: excludes CPAC and operations with the same target. Quotes: figures for the last 12 months to March 31, 2026. Source: London Stock Exchange Group (LSEG). Prepared by: EQUBO. (*) Annex 16.6.3 presents a
multiples section of the valuation report of Inversiones Aspi S.A. prepared by PwC on behalf of one of the sellers of shares of said company (March 2026). There, value multiples are included based on quotes from comparable companies for
the year 2025 and 12 months ahead. The global median for the EV/EBITDA multiple is 6.9x and 6.2x, respectively; in the case of Latin America it is 6.4x and 6.0x, respectively.
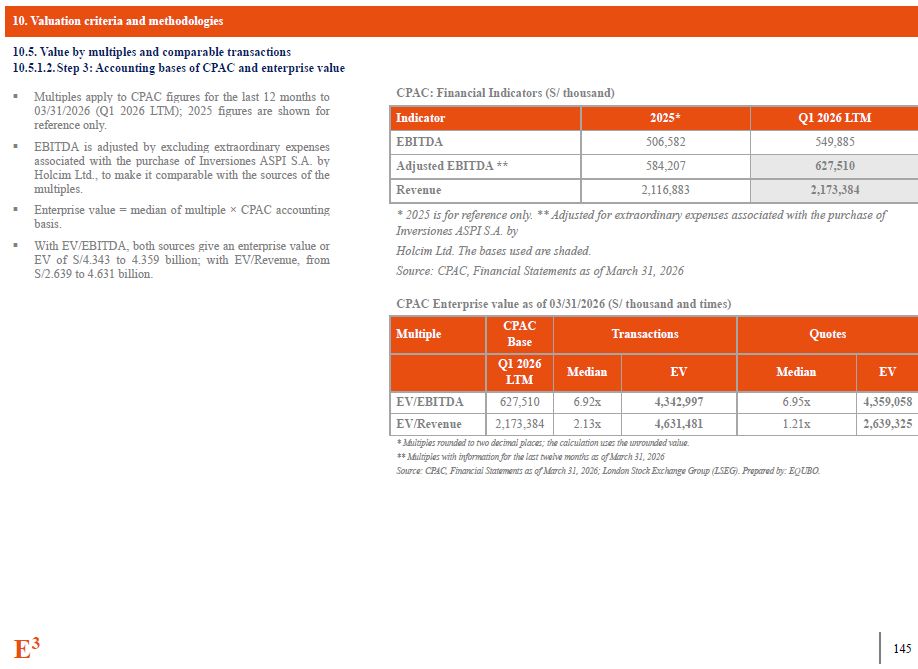
10. Valuation criteria and methodologies E3 110 10.5. Value by multiples
and comparable transactions 10.5.1.2. Step 3: Accounting bases of CPAC and enterprise value Multiples apply to CPAC figures for the last 12 months to 03/31/2026 (Q1 2026 LTM); 2025 figures are shown for reference only. EBITDA is
adjusted by excluding extraordinary expenses associated with the purchase of Inversiones ASPI S.A. by Holcim Ltd., to make it comparable with the sources of the multiples. Enterprise value = median of multiple × CPAC accounting
basis. With EV/EBITDA, both sources give an enterprise value or EV of S/4.343 to 4.359 billion; with EV/Revenue, from S/2.639 to 4.631 billion. CPAC: Financial Indicators (S/ thousand) Indicator 2025* Q1 2026
LTM EBITDA 506,582 549,885 Adjusted EBITDA ** 584,207 627,510 Revenue 2,116,883 2,173,384 * 2025 is for reference only. ** Adjusted for extraordinary expenses associated with the purchase of Inversiones ASPI S.A. by Holcim Ltd.
The bases used are shaded. Source: CPAC, Financial Statements as of March 31, 2026 CPAC Enterprise value as of 03/31/2026 (S/ thousand and times) Multiple CPAC Base Transactions Quotes Q1 2026
LTM Median EV Median EV EV/EBITDA 627,510 6.92x 4,342,997 6.95x 4,359,058 EV/Revenue 2,173,384 2.13x 4,631,481 1.21x 2,639,325 * Multiples rounded to two decimal places; the calculation uses the unrounded value. **
Multiples with information for the last twelve months as of March 31, 2026 Source: CPAC, Financial Statements as of March 31, 2026; London Stock Exchange Group (LSEG). Prepared by: EQUBO.
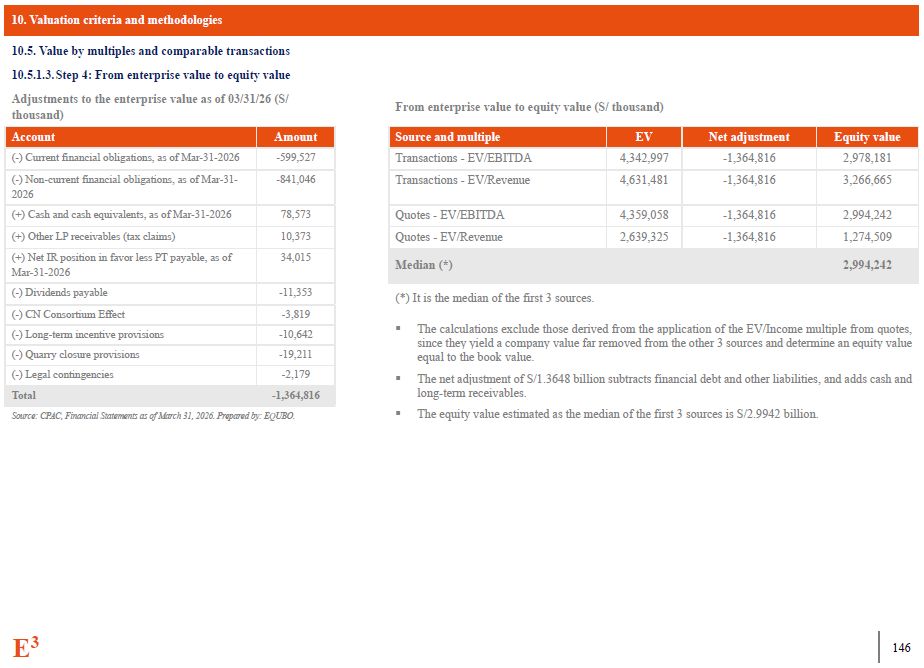
10. Valuation criteria and methodologies E3 110 10.5. Value by multiples
and comparable transactions 10.5.1.3. Step 4: From enterprise value to equity value Adjustments to the enterprise value as of 03/31/26 (S/ thousand) From enterprise value to equity value (S/ thousand) Account Amount (-) Current
financial obligations, as of Mar-31-2026 -599,527 (-) Non-current financial obligations, as of Mar-31-2026 -841,046 (+) Cash and cash equivalents, as of Mar-31-2026 78,573 (+) Other LP receivables (tax claims) 10,373 (+) Net IR
position in favor less PT payable, as of Mar-31-2026 34,015 (-) Dividends payable -11,353 (-) CN Consortium Effect -3,819 (-) Long-term incentive provisions -10,642 (-) Quarry closure provisions -19,211 (-) Legal
contingencies -2,179 Total -1,364,816 Source and multiple EV Net adjustment Equity value Transactions - EV/EBITDA 4,342,997 -1,364,816 2,978,181 Transactions - EV/Revenue 4,631,481 -1,364,816 3,266,665 Quotes -
EV/EBITDA 4,359,058 -1,364,816 2,994,242 Quotes - EV/Revenue 2,639,325 -1,364,816 1,274,509 Median (*) 2,994,242 (*) It is the median of the first 3 sources. The calculations exclude those derived from the application of the
EV/Income multiple from quotes, since they yield a company value far removed from the other 3 sources and determine an equity value equal to the book value. The net adjustment of S/1.3648 billion subtracts financial debt and other
liabilities, and adds cash and long-term receivables. The equity value estimated as the median of the first 3 sources is S/2.9942 billion. Source: CPAC, Financial Statements as of March 31, 2026. Prepared by: EQUBO.
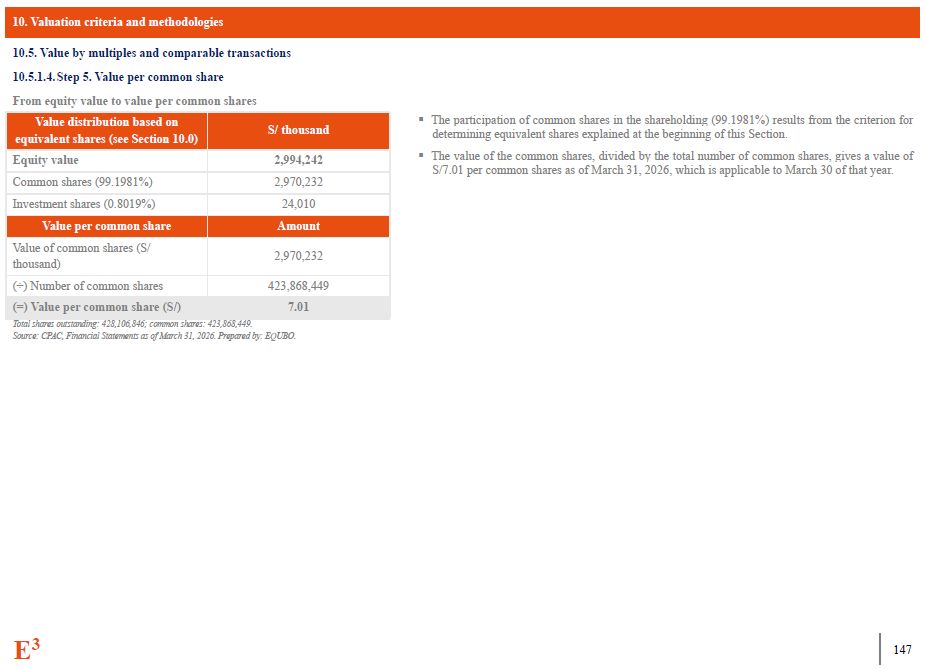
10. Valuation criteria and methodologies E3 110 10.5. Value by multiples
and comparable transactions 10.5.1.4. Step 5. Value per common share From equity value to value per common shares The participation of common shares in the shareholding (99.1981%) results from the criterion for determining equivalent
shares explained at the beginning of this Section. The value of the common shares, divided by the total number of common shares, gives a value of S/7.01 per common shares as of March 31, 2026, which is applicable to March 30 of that
year. Value distribution based on equivalent shares (see Section 10.0) S/ thousand Equity value 2,994,242 Common shares (99.1981%) 2,970,232 Investment shares (0.8019%) 24,010 Value per common share Amount Value of common
shares (S/ thousand) 2,970,232 (÷) Number of common shares 423,868,449 (=) Value per common share (S/) 7.01 Total shares outstanding: 428,106,846; common shares: 423,868,449. Source: CPAC, Financial Statements as of March 31, 2026.
Prepared by: EQUBO.
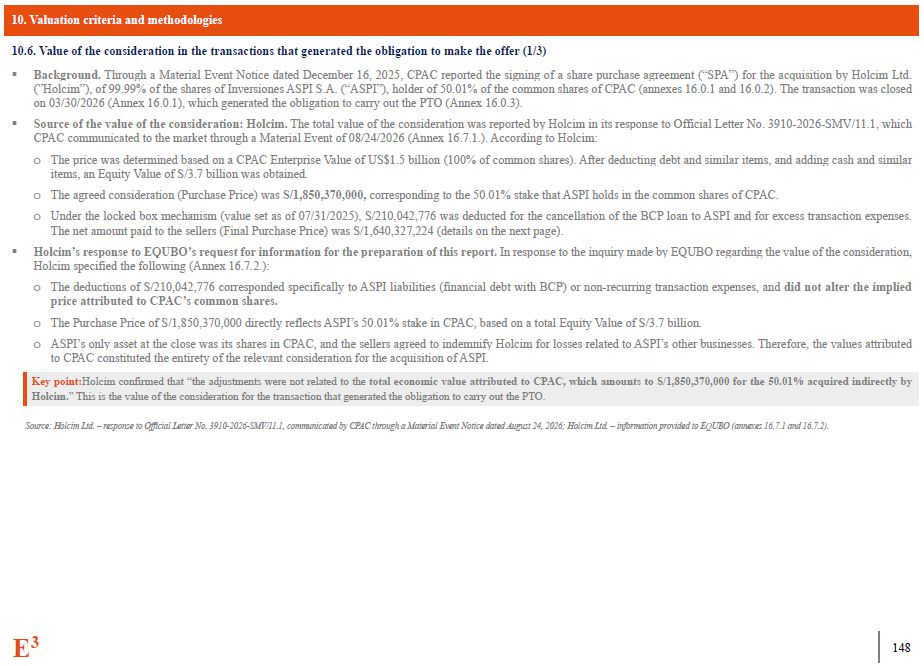
10. Valuation criteria and methodologies 10.6. Value of the consideration
in the transactions that generated the obligation to make the offer (1/3) Background. Through a Material Event Notice dated December 16, 2025, CPAC reported the signing of a share purchase agreement (“SPA”) for the acquisition by Holcim
Ltd. (”Holcim”), of 99.99% of the shares of Inversiones ASPI S.A. (“ASPI”), holder of 50.01% of the common shares of CPAC (annexes 16.0.1 and 16.0.2). The transaction was closed on 03/30/2026 (Annex 16.0.1), which generated the obligation
to carry out the PTO (Annex 16.0.3). Source of the value of the consideration: Holcim. The total value of the consideration was reported by Holcim in its response to Official Letter No. 3910-2026-SMV/11.1, which CPAC communicated to the
market through a Material Event of 08/24/2026 (Annex 16.7.1.). According to Holcim: The price was determined based on a CPAC Enterprise Value of US$1.5 billion (100% of common shares). After deducting debt and similar items, and adding
cash and similar items, an Equity Value of S/3.7 billion was obtained. The agreed consideration (Purchase Price) was S/1,850,370,000, corresponding to the 50.01% stake that ASPI holds in the common shares of CPAC. Under the locked box
mechanism (value set as of 07/31/2025), S/210,042,776 was deducted for the cancellation of the BCP loan to ASPI and for excess transaction expenses. The net amount paid to the sellers (Final Purchase Price) was S/1,640,327,224 (details on
the next page). Holcim’s response to EQUBO’s request for information for the preparation of this report. In response to the inquiry made by EQUBO regarding the value of the consideration, Holcim specified the following (Annex
16.7.2.): The deductions of S/210,042,776 corresponded specifically to ASPI liabilities (financial debt with BCP) or non-recurring transaction expenses, and did not alter the implied price attributed to CPAC’s common shares. The
Purchase Price of S/1,850,370,000 directly reflects ASPI’s 50.01% stake in CPAC, based on a total Equity Value of S/3.7 billion. ASPI’s only asset at the close was its shares in CPAC, and the sellers agreed to indemnify Holcim for losses
related to ASPI’s other businesses. Therefore, the values attributed to CPAC constituted the entirety of the relevant consideration for the acquisition of ASPI. Key point:Holcim confirmed that “the adjustments were not related to the
total economic value attributed to CPAC, which amounts to S/1,850,370,000 for the 50.01% acquired indirectly by Holcim.” This is the value of the consideration for the transaction that generated the obligation to carry out the
PTO. Source: Holcim Ltd. – response to Official Letter No. 3910-2026-SMV/11.1, communicated by CPAC through a Material Event Notice dated August 24, 2026; Holcim Ltd. – information provided to EQUBO (annexes 16.7.1 and 16.7.2). E3 110
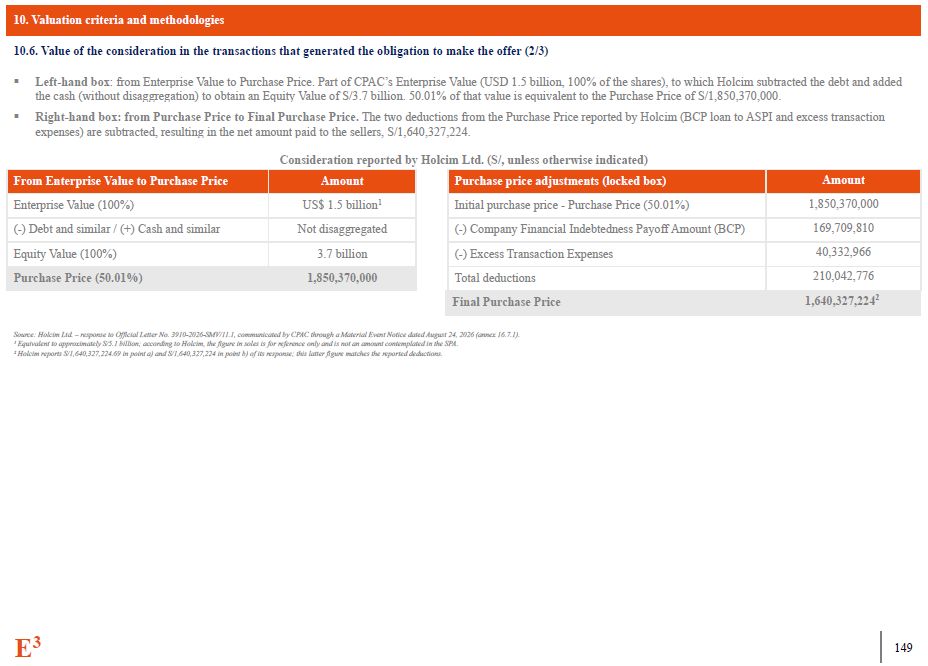
10. Valuation criteria and methodologies 10.6. Value of the consideration
in the transactions that generated the obligation to make the offer (2/3) Left-hand box: from Enterprise Value to Purchase Price. Part of CPAC’s Enterprise Value (USD 1.5 billion, 100% of the shares), to which Holcim subtracted the debt
and added the cash (without disaggregation) to obtain an Equity Value of S/3.7 billion. 50.01% of that value is equivalent to the Purchase Price of S/1,850,370,000. Right-hand box: from Purchase Price to Final Purchase Price. The two
deductions from the Purchase Price reported by Holcim (BCP loan to ASPI and excess transaction expenses) are subtracted, resulting in the net amount paid to the sellers, S/1,640,327,224. Consideration reported by Holcim Ltd. (S/, unless
otherwise indicated) From Enterprise Value to Purchase Price Amount Enterprise Value (100%) US$ 1.5 billion1 (-) Debt and similar / (+) Cash and similar Not disaggregated Equity Value (100%) 3.7 billion Purchase Price (50.01%)
1,850,370,000 Purchase price adjustments (locked box) Amount Initial purchase price - Purchase Price (50.01%) 1,850,370,000 (-) Company Financial Indebtedness Payoff Amount (BCP) 169,709,810 (-) Excess Transaction
Expenses 40,332,966 Total deductions 210,042,776 Final Purchase Price 1,640,327,2242 Source: Holcim Ltd. – response to Official Letter No. 3910-2026-SMV/11.1, communicated by CPAC through a Material Event Notice dated August 24, 2026
(annex 16.7.1). ¹ Equivalent to approximately S/5.1 billion; according to Holcim, the figure in soles is for reference only and is not an amount contemplated in the SPA. ² Holcim reports S/1,640,327,224.69 in point a) and S/1,640,327,224
in point b) of its response; this latter figure matches the reported deductions. E3 110
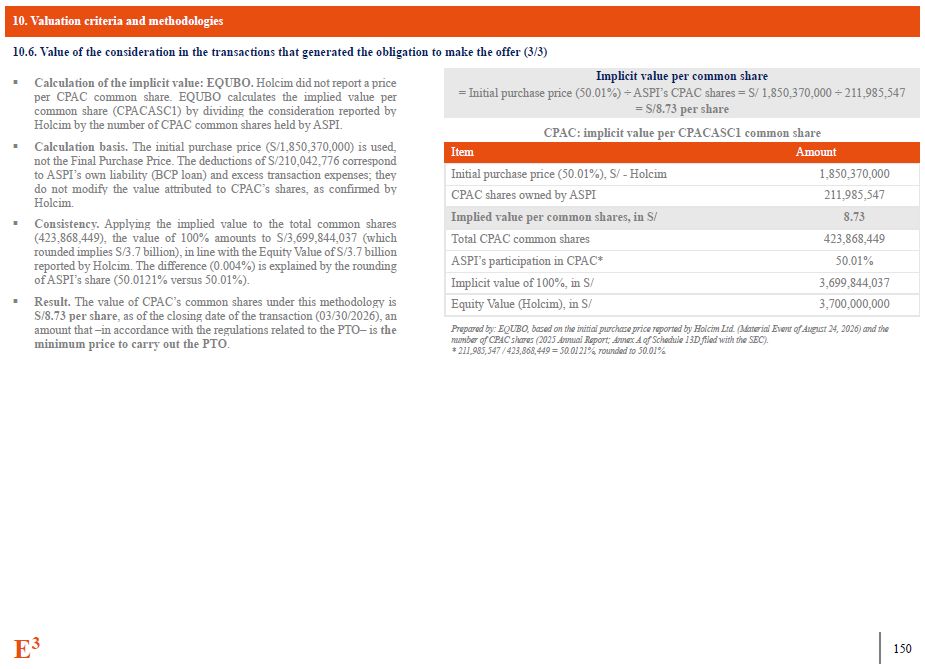
10. Valuation criteria and methodologies E3 110 10.6. Value of the
consideration in the transactions that generated the obligation to make the offer (3/3) Calculation of the implicit value: EQUBO. Holcim did not report a price per CPAC common share. EQUBO calculates the implied value per common share
(CPACASC1) by dividing the consideration reported by Holcim by the number of CPAC common shares held by ASPI. Calculation basis. The initial purchase price (S/1,850,370,000) is used, not the Final Purchase Price. The deductions of
S/210,042,776 correspond to ASPI’s own liability (BCP loan) and excess transaction expenses; they do not modify the value attributed to CPAC’s shares, as confirmed by Holcim. Consistency. Applying the implied value to the total common
shares (423,868,449), the value of 100% amounts to S/3,699,844,037 (which rounded implies S/3.7 billion), in line with the Equity Value of S/3.7 billion reported by Holcim. The difference (0.004%) is explained by the rounding of ASPI’s
share (50.0121% versus 50.01%). Result. The value of CPAC’s common shares under this methodology is S/8.73 per share, as of the closing date of the transaction (03/30/2026), an amount that –in accordance with the regulations related to
the PTO– is the minimum price to carry out the PTO. Implicit value per common share = Initial purchase price (50.01%) ÷ ASPI’s CPAC shares = S/ 1,850,370,000 ÷ 211,985,547 = S/8.73 per share CPAC: implicit value per CPACASC1 common
share Item Amount Initial purchase price (50.01%), S/ - Holcim 1,850,370,000 CPAC shares owned by ASPI 211,985,547 Implied value per common shares, in S/ 8.73 Total CPAC common shares 423,868,449 ASPI’s participation in
CPAC* 50.01% Implicit value of 100%, in S/ 3,699,844,037 Equity Value (Holcim), in S/ 3,700,000,000 Prepared by: EQUBO, based on the initial purchase price reported by Holcim Ltd. (Material Event of August 24, 2026) and the number
of CPAC shares (2025 Annual Report; Annex A of Schedule 13D filed with the SEC). * 211,985,547 / 423,868,449 = 50.0121%, rounded to 50.01%.
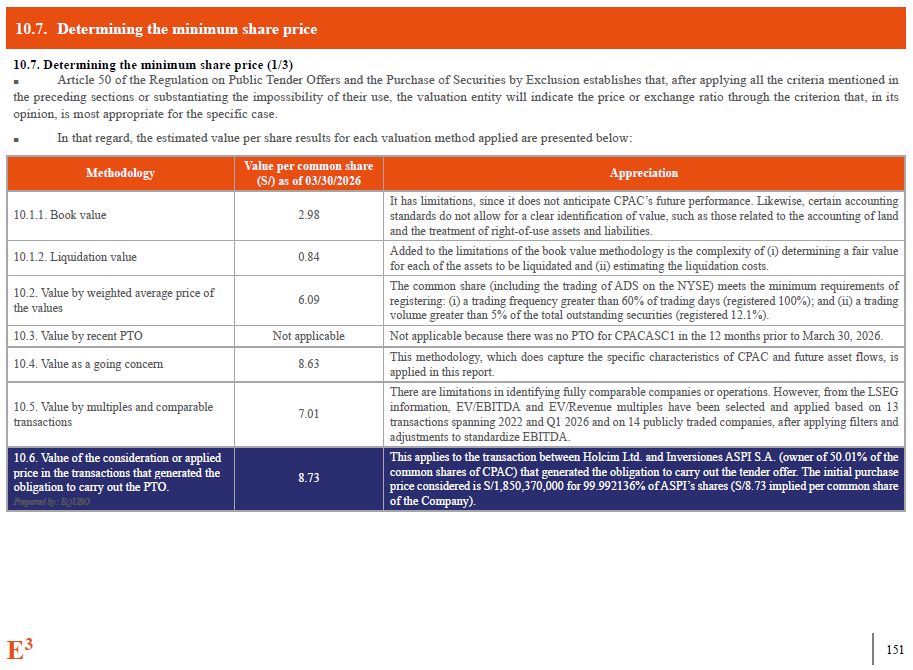
10.7. Determining the minimum share price E3 110 10.7. Determining the
minimum share price (1/3) ■ Article 50 of the Regulation on Public Tender Offers and the Purchase of Securities by Exclusion establishes that, after applying all the criteria mentioned in the preceding sections or substantiating the
impossibility of their use, the valuation entity will indicate the price or exchange ratio through the criterion that, in its opinion, is most appropriate for the specific case. ■ In that regard, the estimated value per share results
for each valuation method applied are presented below: Methodology Value per common share (S/) as of 03/30/2026 Appreciation 10.1.1. Book value 2.98 It has limitations, since it does not anticipate CPAC’s future performance.
Likewise, certain accounting standards do not allow for a clear identification of value, such as those related to the accounting of land and the treatment of right-of-use assets and liabilities. 10.1.2. Liquidation value 0.84 Added to
the limitations of the book value methodology is the complexity of (i) determining a fair value for each of the assets to be liquidated and (ii) estimating the liquidation costs. 10.2. Value by weighted average price of the
values 6.09 The common share (including the trading of ADS on the NYSE) meets the minimum requirements of registering: (i) a trading frequency greater than 60% of trading days (registered 100%); and (ii) a trading volume greater than 5%
of the total outstanding securities (registered 12.1%). 10.3. Value by recent PTO Not applicable Not applicable because there was no PTO for CPACASC1 in the 12 months prior to March 30, 2026. 10.4. Value as a going concern 8.63 This
methodology, which does capture the specific characteristics of CPAC and future asset flows, is applied in this report. 10.5. Value by multiples and comparable transactions 7.01 There are limitations in identifying fully comparable
companies or operations. However, from the LSEG information, EV/EBITDA and EV/Revenue multiples have been selected and applied based on 13 transactions spanning 2022 and Q1 2026 and on 14 publicly traded companies, after applying filters
and adjustments to standardize EBITDA. 10.6. Value of the consideration or applied price in the transactions that generated the obligation to carry out the PTO. Prepared by: EQUBO 8.73 This applies to the transaction between Holcim
Ltd. and Inversiones ASPI S.A. (owner of 50.01% of the common shares of CPAC) that generated the obligation to carry out the tender offer. The initial purchase price considered is S/1,850,370,000 for 99.992136% of ASPI’s shares (S/8.73
implied per common share of the Company).
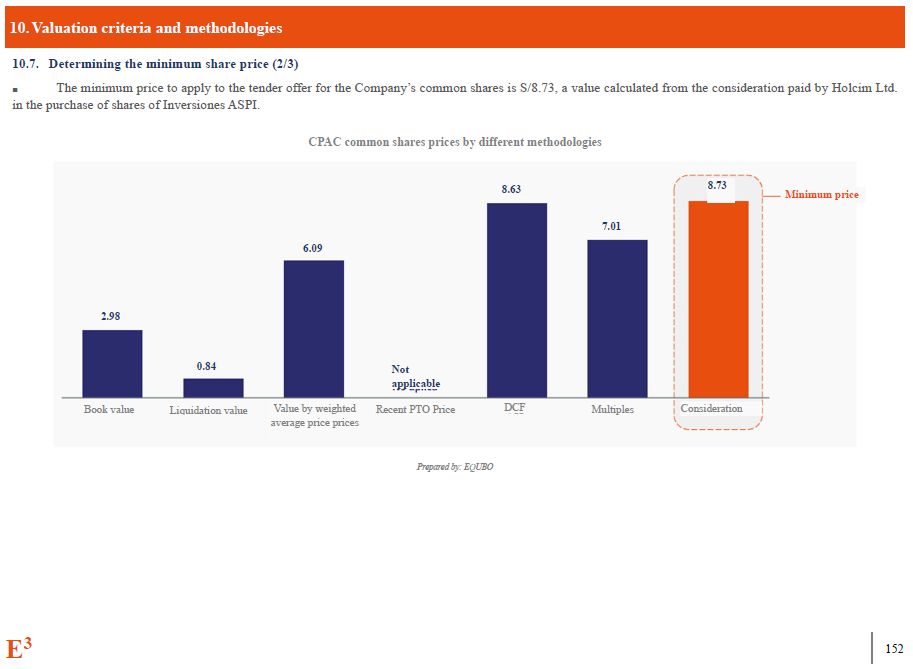
10. Valuation criteria and methodologies 10.7. Determining the minimum
share price (2/3) ■ The minimum price to apply to the tender offer for the Company’s common shares is S/8.73, a value calculated from the consideration paid by Holcim Ltd. in the purchase of shares of Inversiones ASPI. CPAC common
shares prices by different methodologies Prepared by: EQUBO 0.84 2.98 6.09 8.63 7.01 8.73 Multiples Not applicable Consideration DCF Recent PTO Price Value by weighted average price prices Liquidation value Book
value Minimum price E3 110
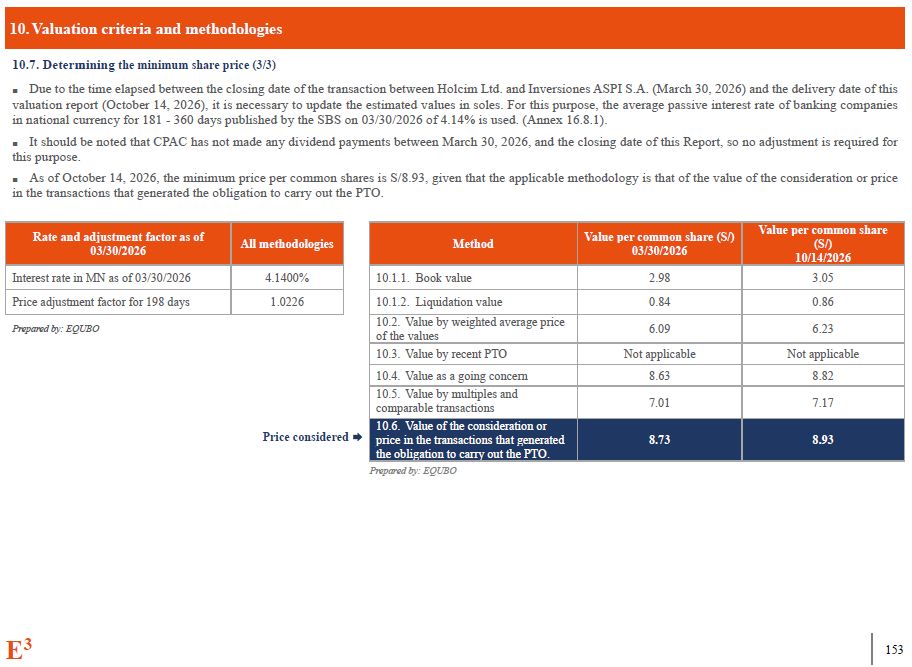
10. Valuation criteria and methodologies E3 110 10.7. Determining the
minimum share price (3/3) Due to the time elapsed between the closing date of the transaction between Holcim Ltd. and Inversiones ASPI S.A. (March 30, 2026) and the delivery date of this valuation report (October 14, 2026), it is
necessary to update the estimated values in soles. For this purpose, the average passive interest rate of banking companies in national currency for 181 - 360 days published by the SBS on 03/30/2026 of 4.14% is used. (Annex 16.8.1). It
should be noted that CPAC has not made any dividend payments between March 30, 2026, and the closing date of this Report, so no adjustment is required for this purpose. As of October 14, 2026, the minimum price per common shares is
S/8.93, given that the applicable methodology is that of the value of the consideration or price in the transactions that generated the obligation to carry out the PTO. Rate and adjustment factor as of 03/30/2026 All
methodologies Interest rate in MN as of 03/30/2026 4.1400% Price adjustment factor for 198 days 1.0226 Method Value per common share (S/) 03/30/2026 Value per common share (S/) 10/14/2026 10.1.1. Book value 2.98 3.05 10.1.2.
Liquidation value 0.84 0.86 10.2. Value by weighted average price of the values 6.09 6.23 10.3. Value by recent PTO Not applicable Not applicable 10.4. Value as a going concern 8.63 8.82 10.5. Value by multiples and comparable
transactions 7.01 7.17 10.6. Value of the consideration or price in the transactions that generated the obligation to carry out the PTO. 8.73 8.93 Prepared by: EQUBO Price considered Prepared by: EQUBO
11 Results of the application of the methodologies
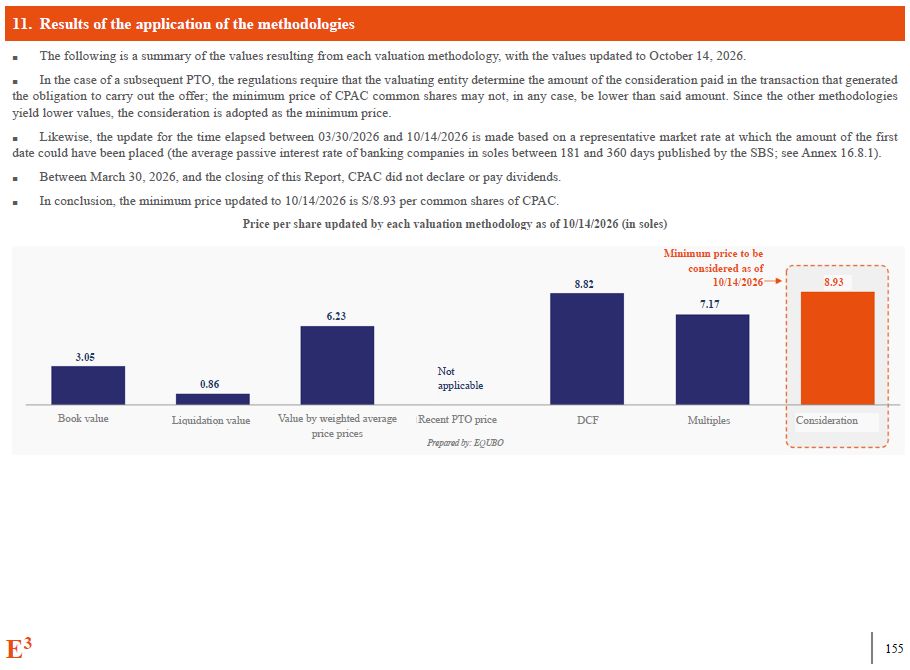
11. Results of the application of the methodologies The following is a
summary of the values resulting from each valuation methodology, with the values updated to October 14, 2026. In the case of a subsequent PTO, the regulations require that the valuating entity determine the amount of the consideration
paid in the transaction that generated the obligation to carry out the offer; the minimum price of CPAC common shares may not, in any case, be lower than said amount. Since the other methodologies yield lower values, the consideration is
adopted as the minimum price. Likewise, the update for the time elapsed between 03/30/2026 and 10/14/2026 is made based on a representative market rate at which the amount of the first date could have been placed (the average passive
interest rate of banking companies in soles between 181 and 360 days published by the SBS; see Annex 16.8.1). Between March 30, 2026, and the closing of this Report, CPAC did not declare or pay dividends. In conclusion, the minimum
price updated to 10/14/2026 is S/8.93 per common shares of CPAC. Price per share updated by each valuation methodology as of 10/14/2026 (in soles) Multiples Not applicable Consideration DCF Recent PTO price Value by weighted
average price prices Liquidation value Book value Minimum price to be considered as of 10/14/2026 Prepared by: EQUBO E3 155 3.05 0.86 6.23 7.17 8.93 8.82
12 Sensitivity analysis of critical variables
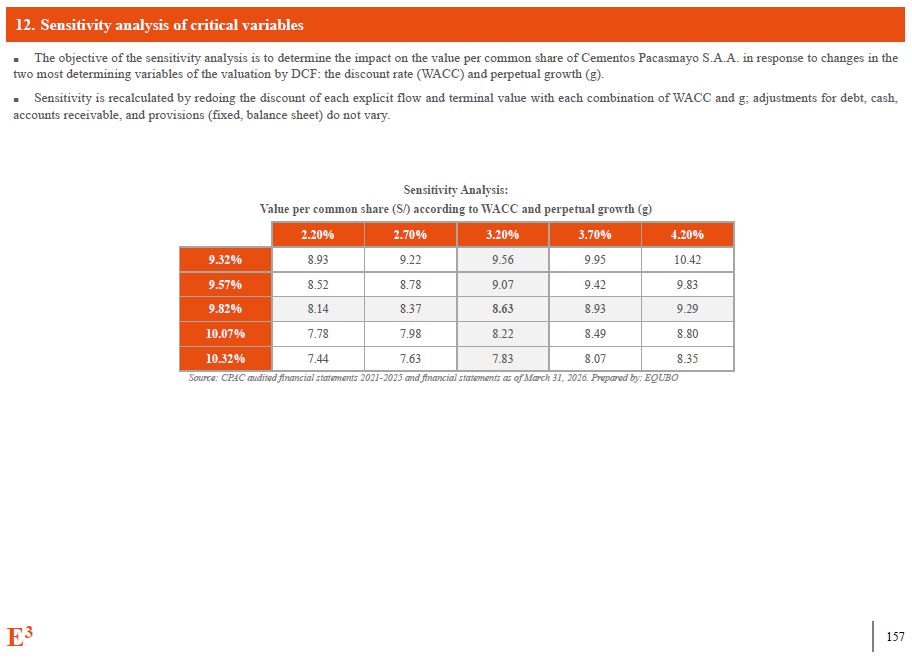
12. Sensitivity analysis of critical variables E3 157 The objective of
the sensitivity analysis is to determine the impact on the value per common share of Cementos Pacasmayo S.A.A. in response to changes in the two most determining variables of the valuation by DCF: the discount rate (WACC) and perpetual
growth (g). Sensitivity is recalculated by redoing the discount of each explicit flow and terminal value with each combination of WACC and g; adjustments for debt, cash, accounts receivable, and provisions (fixed, balance sheet) do not
vary. Sensitivity Analysis: Value per common share (S/) according to WACC and perpetual growth
(g) 2.20% 2.70% 3.20% 3.70% 4.20% 9.32% 8.93 9.22 9.56 9.95 10.42 9.57% 8.52 8.78 9.07 9.42 9.83 9.82% 8.14 8.37 8.63 8.93 9.29 10.07% 7.78 7.98 8.22 8.49 8.80 10.32% 7.44 7.63 7.83 8.07 8.35 Source:
CPAC audited financial statements 2021-2025 and financial statements as of March 31, 2026. Prepared by: EQUBO
13 Other important information to disclose
13. Other important information to disclose E3 159 According to the
terms, the valuation considers the situation existing on March 30, 2026. The following events occurred after that date and up to October 14, 2026, the date of delivery of the Valuation Report: El Niño Phenomenon.Since March 2026, the
probability of a Coastal El Niño and a strong to extraordinary global El Niño has increased, and its occurrence has been anticipated: ENFEN projects an extraordinary Coastal El Niño until January 2027 (Official Statement No. 17-2026).
EQUBO’s projection incorporates El Niño episodes in 2028 and 2033, with recovery in the following years. See Annex 16.5.1. Potential exit from the NYSE.On April 6, 2026, CPAC reported that Holcim filed a Schedule 13D with the SEC
expressing its intention to delist its ADS from the NYSE and cancel its registration in the U.S. once the PTO is completed. CPAC clarified that it is an intention of the shareholder and not a decision of the Company. If this were to
happen, the common shares would only be traded on the BVL, which would reduce their liquidity; as of March 31, 2026, 8.63% of the common shares were represented by ADSs. Q2 2026 income.In Q2 2026, consolidated revenues grew 15.4%
compared to Q2 2025, to S/ 558.9 million, and net profit grew 61.5%, to S/77.2 million. These results do not change the valuation, which is based on information available as of March 31, 2026. Responses to official communications from
the SMV.On July 15 and 16, 2026, CPAC responded to Official Letter No. 3113-2026-SMV/11.1 with the sequence of important events of the transaction. Through Official Letter No. 3910-2026-SMV/11.1 of 08/17/2026, the SMV requested CPAC to
specify the deductions applied to the purchase price; on 08/24/2026 Holcim confirmed in writing that said deductions “were not related to the total economic value attributed to CPAC,” which is the Purchase Price of S/1,850,370,000. See
section 10.6, Annex 16.0 and Annex 16.7.1. Dividends. Between March 30, 2026, and the closing of this Report, CPAC did not declare or pay dividends, so there is no adjustment for this concept and the minimum price is updated directly to
October 14, 2026. Source: ENFEN, Official Statement No. 17-2026; CPAC’s material events before the SMV and Form 6-K before the SEC (04/06/2026, 07/15-16/2026, 07/20/2026 and 08/24/2026); Official Letters No. 3113-2026-SMV/11.1 and No.
3910-2026-SMV/11.1. Prepared by: EQUBO.
14 Conclusions and recommendations
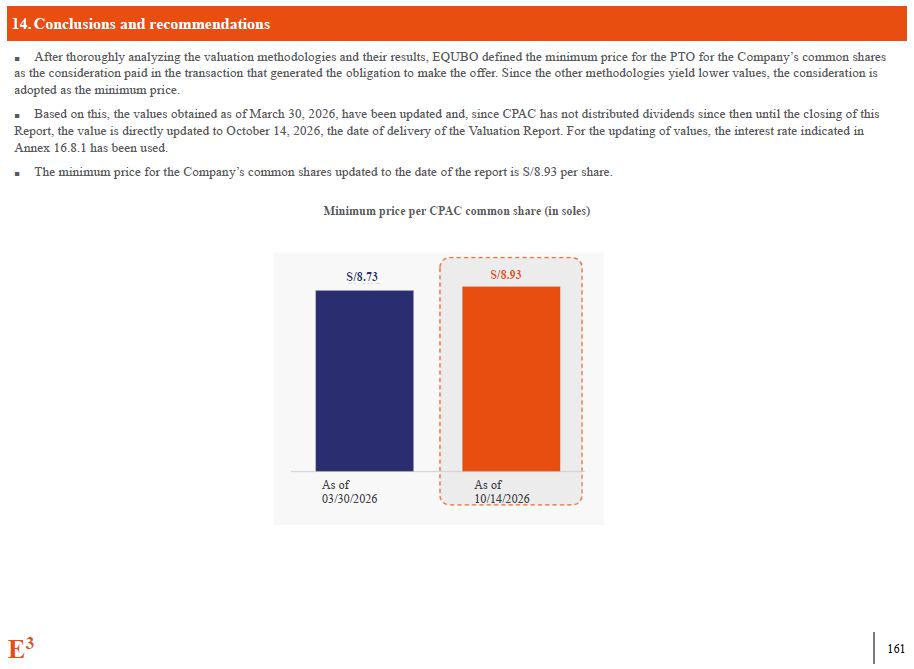
14. Conclusions and recommendations After thoroughly analyzing the
valuation methodologies and their results, EQUBO defined the minimum price for the PTO for the Company’s common shares as the consideration paid in the transaction that generated the obligation to make the offer. Since the other
methodologies yield lower values, the consideration is adopted as the minimum price. Based on this, the values obtained as of March 30, 2026, have been updated and, since CPAC has not distributed dividends since then until the closing of
this Report, the value is directly updated to October 14, 2026, the date of delivery of the Valuation Report. For the updating of values, the interest rate indicated in Annex 16.8.1 has been used. The minimum price for the Company’s
common shares updated to the date of the report is S/8.93 per share. Minimum price per CPAC common share (in soles) S/8.93 S/8.73 As of 10/14/2026 As of 03/30/2026 E3 161
15 Sources
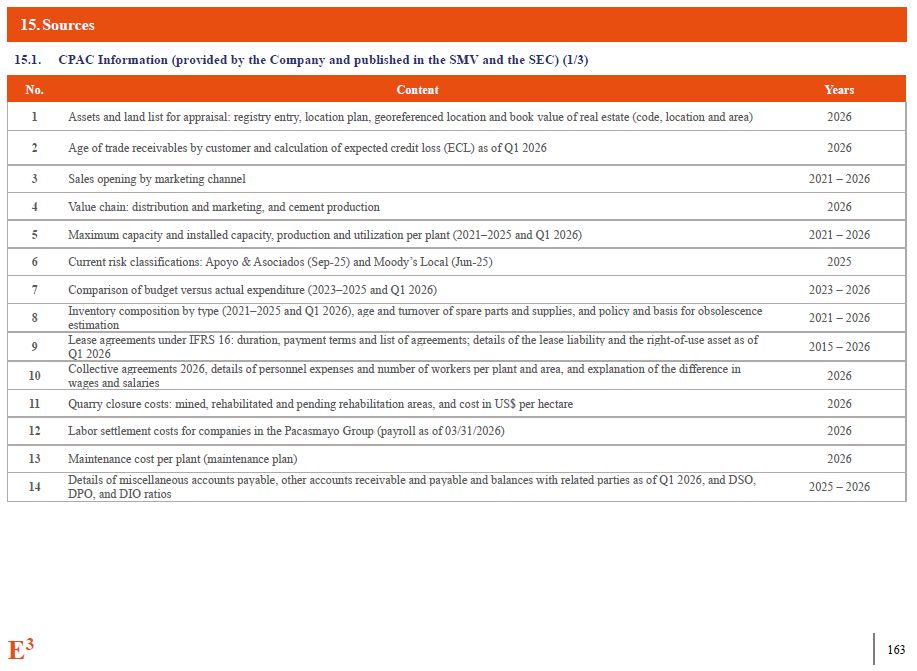
15. Sources E3 163 15.1. CPAC Information (provided by the Company and
published in the SMV and the SEC) (1/3) No. Content Years 1 Assets and land list for appraisal: registry entry, location plan, georeferenced location and book value of real estate (code, location and area) 2026 2 Age of trade
receivables by customer and calculation of expected credit loss (ECL) as of Q1 2026 2026 3 Sales opening by marketing channel 2021 – 2026 4 Value chain: distribution and marketing, and cement production 2026 5 Maximum capacity
and installed capacity, production and utilization per plant (2021–2025 and Q1 2026) 2021 – 2026 6 Current risk classifications: Apoyo & Asociados (Sep-25) and Moody’s Local (Jun-25) 2025 7 Comparison of budget versus actual
expenditure (2023–2025 and Q1 2026) 2023 – 2026 8 Inventory composition by type (2021–2025 and Q1 2026), age and turnover of spare parts and supplies, and policy and basis for obsolescence estimation 2021 – 2026 9 Lease agreements
under IFRS 16: duration, payment terms and list of agreements; details of the lease liability and the right-of-use asset as of Q1 2026 2015 – 2026 10 Collective agreements 2026, details of personnel expenses and number of workers per
plant and area, and explanation of the difference in wages and salaries 2026 11 Quarry closure costs: mined, rehabilitated and pending rehabilitation areas, and cost in US$ per hectare 2026 12 Labor settlement costs for companies in
the Pacasmayo Group (payroll as of 03/31/2026) 2026 13 Maintenance cost per plant (maintenance plan) 2026 14 Details of miscellaneous accounts payable, other accounts receivable and payable and balances with related parties as of Q1
2026, and DSO, DPO, and DIO ratios 2025 – 2026
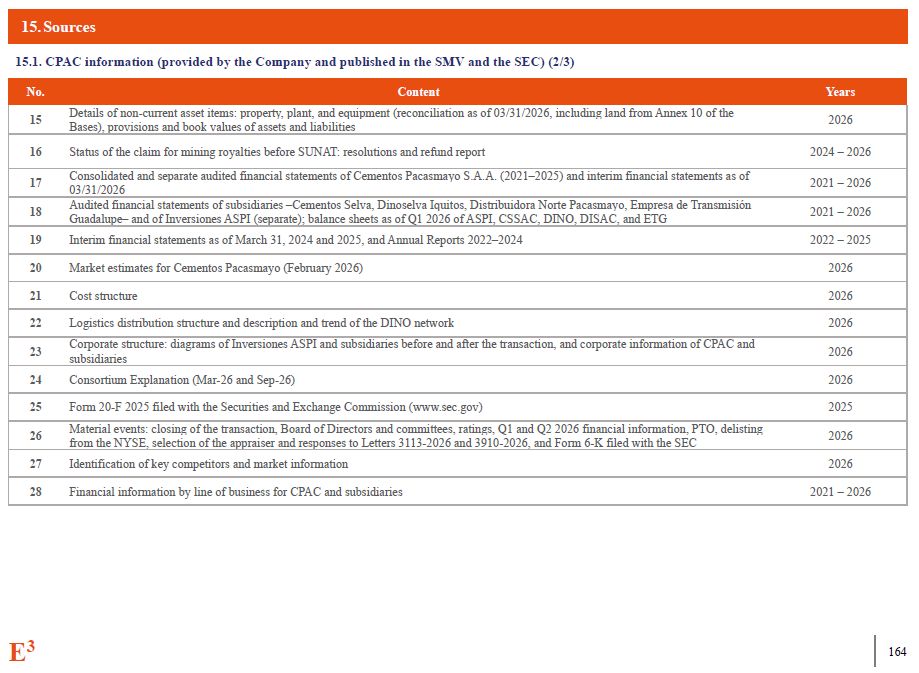
15. Sources E3 163 15.1. CPAC information (provided by the Company and
published in the SMV and the SEC) (2/3) No. Content Years 15 Details of non-current asset items: property, plant, and equipment (reconciliation as of 03/31/2026, including land from Annex 10 of the Bases), provisions and book values
of assets and liabilities 2026 16 Status of the claim for mining royalties before SUNAT: resolutions and refund report 2024 – 2026 17 Consolidated and separate audited financial statements of Cementos Pacasmayo S.A.A. (2021–2025)
and interim financial statements as of 03/31/2026 2021 – 2026 18 Audited financial statements of subsidiaries –Cementos Selva, Dinoselva Iquitos, Distribuidora Norte Pacasmayo, Empresa de Transmisión Guadalupe– and of Inversiones ASPI
(separate); balance sheets as of Q1 2026 of ASPI, CSSAC, DINO, DISAC, and ETG 2021 – 2026 19 Interim financial statements as of March 31, 2024 and 2025, and Annual Reports 2022–2024 2022 – 2025 20 Market estimates for Cementos
Pacasmayo (February 2026) 2026 21 Cost structure 2026 22 Logistics distribution structure and description and trend of the DINO network 2026 23 Corporate structure: diagrams of Inversiones ASPI and subsidiaries before and after
the transaction, and corporate information of CPAC and subsidiaries 2026 24 Consortium Explanation (Mar-26 and Sep-26) 2026 25 Form 20-F 2025 filed with the Securities and Exchange Commission (www.sec.gov) 2025 26 Material
events: closing of the transaction, Board of Directors and committees, ratings, Q1 and Q2 2026 financial information, PTO, delisting from the NYSE, selection of the appraiser and responses to Letters 3113-2026 and 3910-2026, and Form 6-K
filed with the SEC 2026 27 Identification of key competitors and market information 2026 28 Financial information by line of business for CPAC and subsidiaries 2021 – 2026
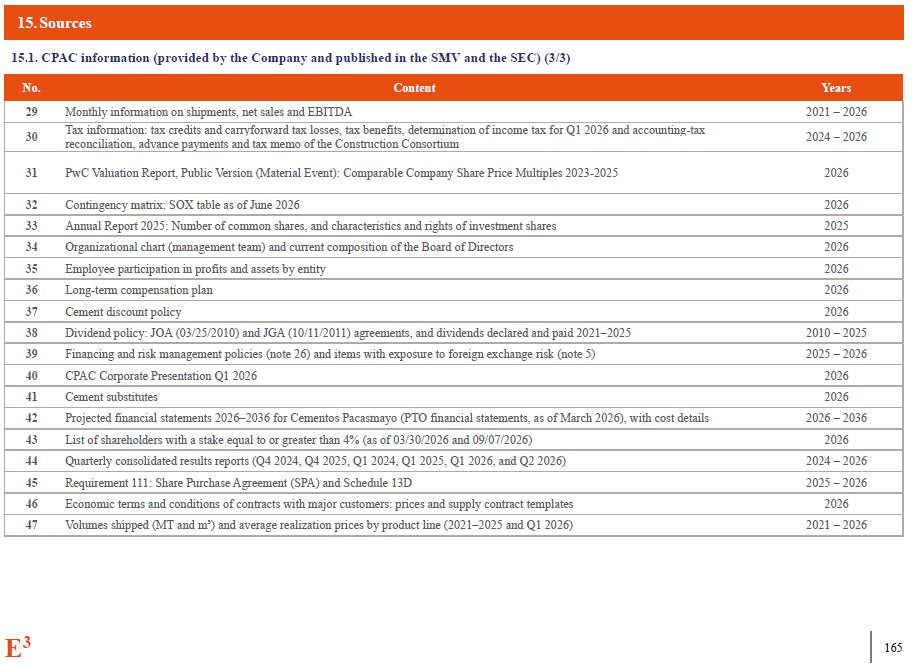
15. Sources E3 163 15.1. CPAC information (provided by the Company and
published in the SMV and the SEC) (3/3) No. Content Years 29 Monthly information on shipments, net sales and EBITDA 2021 – 2026 30 Tax information: tax credits and carryforward tax losses, tax benefits, determination of income tax
for Q1 2026 and accounting-tax reconciliation, advance payments and tax memo of the Construction Consortium 2024 – 2026 31 PwC Valuation Report, Public Version (Material Event): Comparable Company Share Price Multiples
2023-2025 2026 32 Contingency matrix: SOX table as of June 2026 2026 33 Annual Report 2025: Number of common shares, and characteristics and rights of investment shares 2025 34 Organizational chart (management team) and current
composition of the Board of Directors 2026 35 Employee participation in profits and assets by entity 2026 36 Long-term compensation plan 2026 37 Cement discount policy 2026 38 Dividend policy: JOA (03/25/2010) and JGA
(10/11/2011) agreements, and dividends declared and paid 2021–2025 2010 – 2025 39 Financing and risk management policies (note 26) and items with exposure to foreign exchange risk (note 5) 2025 – 2026 40 CPAC Corporate Presentation
Q1 2026 2026 41 Cement substitutes 2026 42 Projected financial statements 2026–2036 for Cementos Pacasmayo (PTO financial statements, as of March 2026), with cost details 2026 – 2036 43 List of shareholders with a stake equal to
or greater than 4% (as of 03/30/2026 and 09/07/2026) 2026 44 Quarterly consolidated results reports (Q4 2024, Q4 2025, Q1 2024, Q1 2025, Q1 2026, and Q2 2026) 2024 – 2026 45 Requirement 111: Share Purchase Agreement (SPA) and
Schedule 13D 2025 – 2026 46 Economic terms and conditions of contracts with major customers: prices and supply contract templates 2026 47 Volumes shipped (MT and m³) and average realization prices by product line (2021–2025 and Q1
2026) 2021 – 2026
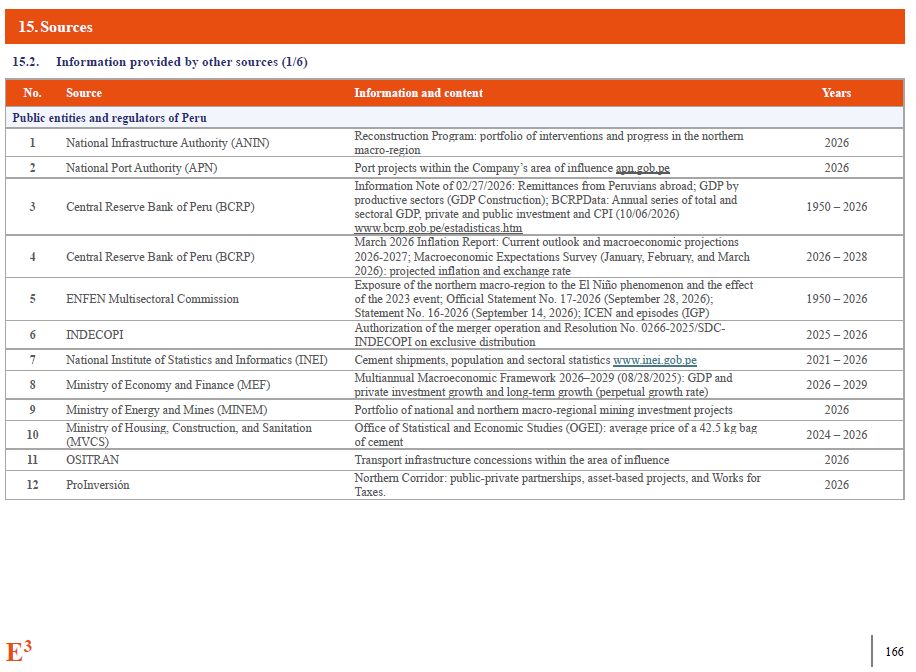
15. Sources E3 163 15.2. Information provided by other sources
(1/6) No. Source Information and content Years Public entities and regulators of Peru 1 National Infrastructure Authority (ANIN) Reconstruction Program: portfolio of interventions and progress in the northern
macro-region 2026 2 National Port Authority (APN) Port projects within the Company’s area of influence apn.gob.pe 2026 Information Note of 02/27/2026: Remittances from Peruvians abroad; GDP by 3 Central Reserve Bank of Peru
(BCRP) productive sectors (GDP Construction); BCRPData: Annual series of total and 1950 – 2026 sectoral GDP, private and public investment and CPI (10/06/2026) www.bcrp.gob.pe/estadisticas.htm March 2026 Inflation Report: Current
outlook and macroeconomic projections 4 Central Reserve Bank of Peru (BCRP) 2026-2027; Macroeconomic Expectations Survey (January, February, and March 2026 – 2028 2026): projected inflation and exchange rate Exposure of the northern
macro-region to the El Niño phenomenon and the effect 5 ENFEN Multisectoral Commission of the 2023 event; Official Statement No. 17-2026 (September 28, 2026); 1950 – 2026 Statement No. 16-2026 (September 14, 2026); ICEN and episodes
(IGP) 6 INDECOPI Authorization of the merger operation and Resolution No. 0266-2025/SDC-INDECOPI on exclusive distribution 2025 – 2026 7 National Institute of Statistics and Informatics (INEI) Cement shipments, population and
sectoral statistics www.inei.gob.pe 2021 – 2026 8 Ministry of Economy and Finance (MEF) Multiannual Macroeconomic Framework 2026–2029 (08/28/2025): GDP and private investment growth and long-term growth (perpetual growth rate) 2026 –
2029 9 Ministry of Energy and Mines (MINEM) Portfolio of national and northern macro-regional mining investment projects 2026 10 Ministry of Housing, Construction, and Sanitation (MVCS) Office of Statistical and Economic Studies
(OGEI): average price of a 42.5 kg bag of cement 2024 – 2026 11 OSITRAN Transport infrastructure concessions within the area of influence 2026 12 ProInversión Northern Corridor: public-private partnerships, asset-based projects,
and Works for Taxes. 2026
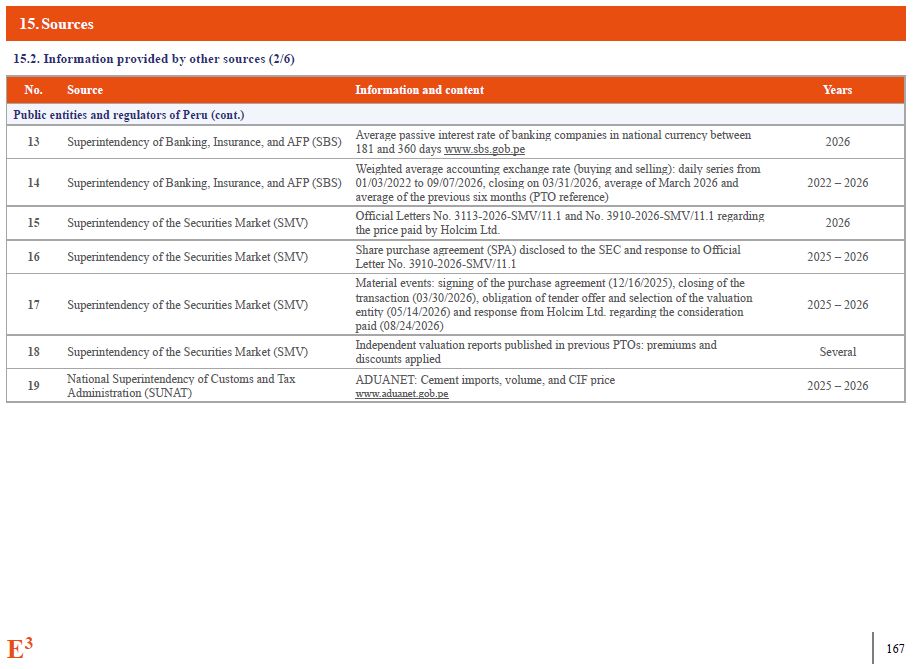
15. Sources E3 163 15.2. Information provided by other sources
(2/6) No. Source Information and content Years Public entities and regulators of Peru (cont.) 13 Superintendency of Banking, Insurance, and AFP (SBS) Average passive interest rate of banking companies in national currency between
181 and 360 days www.sbs.gob.pe 2026 Weighted average accounting exchange rate (buying and selling): daily series from 14 Superintendency of Banking, Insurance, and AFP (SBS) 01/03/2022 to 09/07/2026, closing on 03/31/2026, average
of March 2026 and 2022 – 2026 average of the previous six months (PTO reference) 15 Superintendency of the Securities Market (SMV) Official Letters No. 3113-2026-SMV/11.1 and No. 3910-2026-SMV/11.1 regarding the price paid by Holcim
Ltd. 2026 16 Superintendency of the Securities Market (SMV) Share purchase agreement (SPA) disclosed to the SEC and response to Official Letter No. 3910-2026-SMV/11.1 2025 – 2026 Material events: signing of the purchase agreement
(12/16/2025), closing of the 17 Superintendency of the Securities Market (SMV) transaction (03/30/2026), obligation of tender offer and selection of the valuation 2025 – 2026 entity (05/14/2026) and response from Holcim Ltd.
regarding the consideration paid (08/24/2026) 18 Superintendency of the Securities Market (SMV) Independent valuation reports published in previous PTOs: premiums and discounts applied Several 19 National Superintendency of Customs
and Tax Administration (SUNAT) ADUANET: Cement imports, volume, and CIF price www.aduanet.gob.pe 2025 – 2026
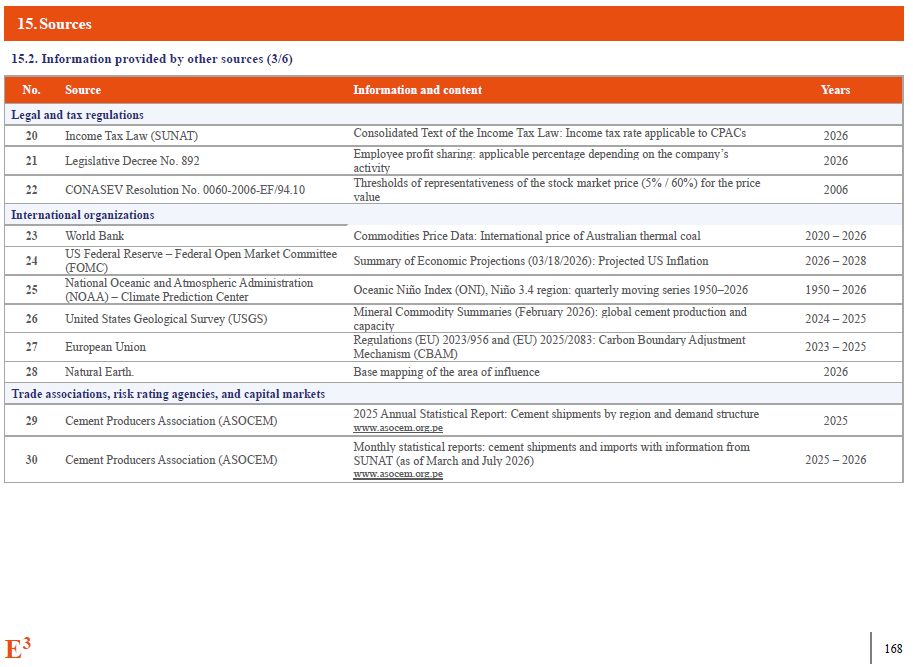
15. Sources E3 163 15.2. Information provided by other sources
(3/6) No. Source Information and content Years Legal and tax regulations 20 Income Tax Law (SUNAT) Consolidated Text of the Income Tax Law: Income tax rate applicable to CPACs 2026 21 Legislative Decree No. 892 Employee profit
sharing: applicable percentage depending on the company’s activity 2026 22 CONASEV Resolution No. 0060-2006-EF/94.10 Thresholds of representativeness of the stock market price (5% / 60%) for the price value 2006 International
organizations 23 World Bank Commodities Price Data: International price of Australian thermal coal 2020 – 2026 24 US Federal Reserve – Federal Open Market Committee (FOMC) Summary of Economic Projections (03/18/2026): Projected US
Inflation 2026 – 2028 25 National Oceanic and Atmospheric Administration (NOAA) – Climate Prediction Center Oceanic Niño Index (ONI), Niño 3.4 region: quarterly moving series 1950–2026 1950 – 2026 26 United States Geological Survey
(USGS) Mineral Commodity Summaries (February 2026): global cement production and capacity 2024 – 2025 27 European Union Regulations (EU) 2023/956 and (EU) 2025/2083: Carbon Boundary Adjustment Mechanism (CBAM) 2023 –
2025 28 Natural Earth. Base mapping of the area of influence 2026 Trade associations, risk rating agencies, and capital markets 29 Cement Producers Association (ASOCEM) 2025 Annual Statistical Report: Cement shipments by region
and demand structure www.asocem.org.pe 2025 30 Cement Producers Association (ASOCEM) Monthly statistical reports: cement shipments and imports with information from SUNAT (as of March and July 2026) www.asocem.org.pe 2025 – 2026
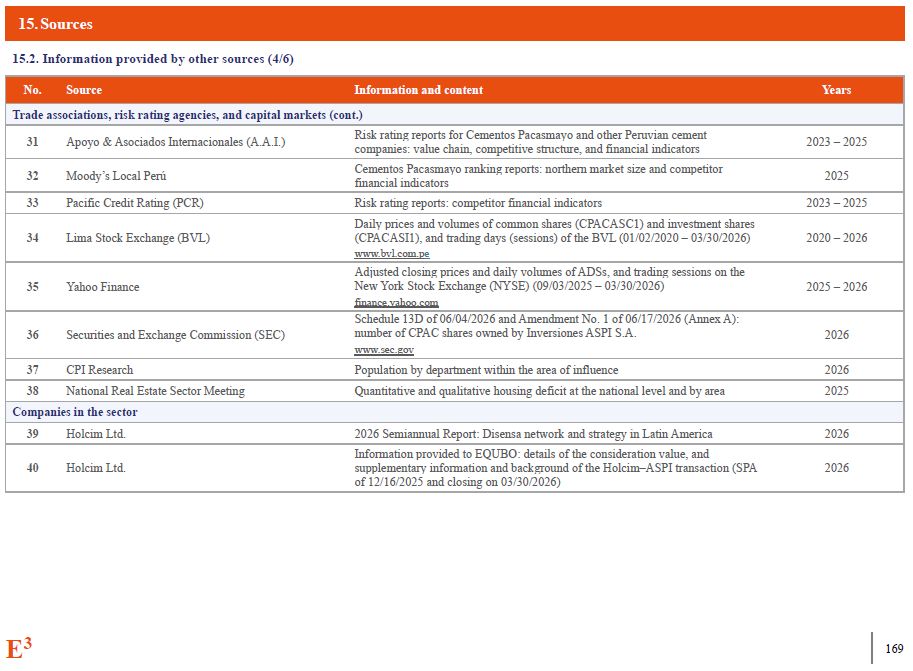
15. Sources E3 163 15.2. Information provided by other sources
(4/6) No. Source Information and content Years Trade associations, risk rating agencies, and capital markets (cont.) 31 Apoyo & Asociados Internacionales (A.A.I.) Risk rating reports for Cementos Pacasmayo and other Peruvian
cement companies: value chain, competitive structure, and financial indicators 2023 – 2025 32 Moody’s Local Perú Cementos Pacasmayo ranking reports: northern market size and competitor financial indicators 2025 33 Pacific Credit
Rating (PCR) Risk rating reports: competitor financial indicators 2023 – 2025 Daily prices and volumes of common shares (CPACASC1) and investment shares 34 Lima Stock Exchange (BVL) (CPACASI1), and trading days (sessions) of the BVL
(01/02/2020 – 03/30/2026) 2020 – 2026 www.bvl.com.pe Adjusted closing prices and daily volumes of ADSs, and trading sessions on the 35 Yahoo Finance New York Stock Exchange (NYSE) (09/03/2025 – 03/30/2026) 2025 –
2026 finance.yahoo.com Schedule 13D of 06/04/2026 and Amendment No. 1 of 06/17/2026 (Annex A): 36 Securities and Exchange Commission (SEC) number of CPAC shares owned by Inversiones ASPI S.A. 2026 www.sec.gov 37 CPI
Research Population by department within the area of influence 2026 38 National Real Estate Sector Meeting Quantitative and qualitative housing deficit at the national level and by area 2025 Companies in the sector 39 Holcim
Ltd. 2026 Semiannual Report: Disensa network and strategy in Latin America 2026 Information provided to EQUBO: details of the consideration value, and 40 Holcim Ltd. supplementary information and background of the Holcim–ASPI
transaction (SPA 2026 of 12/16/2025 and closing on 03/30/2026)
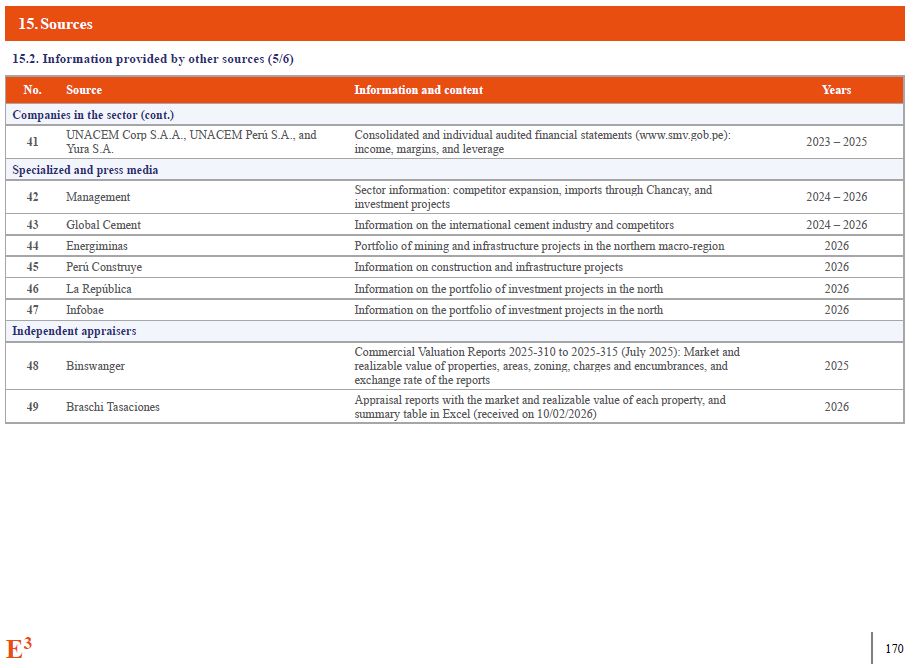
15. Sources E3 163 15.2. Information provided by other sources
(5/6) No. Source Information and content Years Companies in the sector (cont.) 41 UNACEM Corp S.A.A., UNACEM Perú S.A., and Yura S.A. Consolidated and individual audited financial statements (www.smv.gob.pe): income, margins, and
leverage 2023 – 2025 Specialized and press media 42 Management Sector information: competitor expansion, imports through Chancay, and investment projects 2024 – 2026 43 Global Cement Information on the international cement
industry and competitors 2024 – 2026 44 Energiminas Portfolio of mining and infrastructure projects in the northern macro-region 2026 45 Perú Construye Information on construction and infrastructure projects 2026 46 La
República Information on the portfolio of investment projects in the north 2026 47 Infobae Information on the portfolio of investment projects in the north 2026 Independent appraisers 48 Binswanger Commercial Valuation Reports
2025-310 to 2025-315 (July 2025): Market and realizable value of properties, areas, zoning, charges and encumbrances, and exchange rate of the reports 2025 49 Braschi Tasaciones Appraisal reports with the market and realizable value
of each property, and summary table in Excel (received on 10/02/2026) 2026
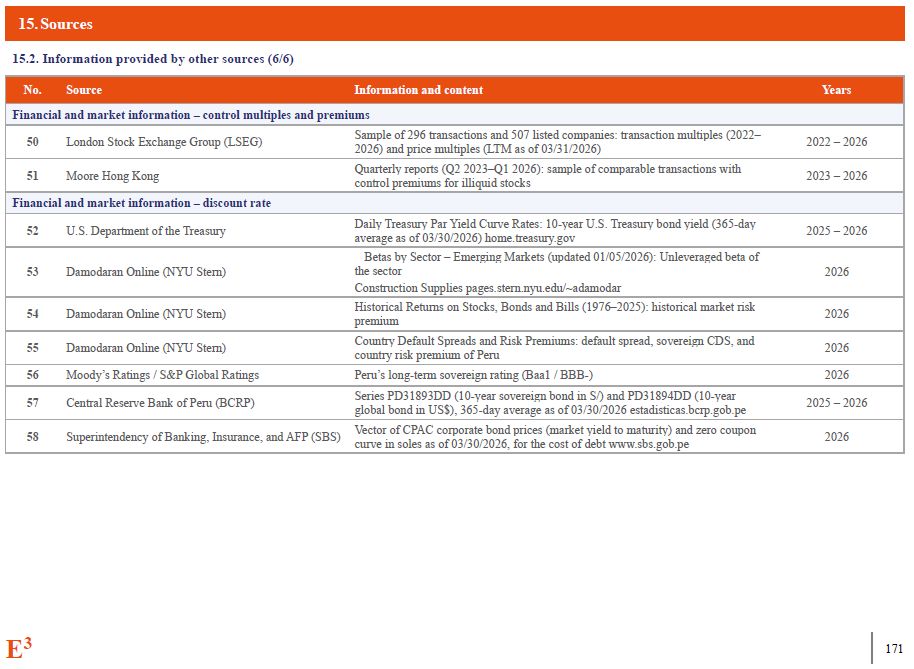
15. Sources E3 163 15.2. Information provided by other sources
(6/6) No. Source Information and content Years Financial and market information – control multiples and premiums 50 London Stock Exchange Group (LSEG) Sample of 296 transactions and 507 listed companies: transaction multiples
(2022–2026) and price multiples (LTM as of 03/31/2026) 2022 – 2026 51 Moore Hong Kong Quarterly reports (Q2 2023–Q1 2026): sample of comparable transactions with control premiums for illiquid stocks 2023 – 2026 Financial and market
information – discount rate 52 U.S. Department of the Treasury Daily Treasury Par Yield Curve Rates: 10-year U.S. Treasury bond yield (365-day average as of 03/30/2026) home.treasury.gov 2025 – 2026 53 Damodaran Online (NYU
Stern) Betas by Sector – Emerging Markets (updated 01/05/2026): Unleveraged beta of the sector Construction Supplies pages.stern.nyu.edu/~adamodar 2026 54 Damodaran Online (NYU Stern) Historical Returns on Stocks, Bonds and Bills
(1976–2025): historical market risk premium 2026 55 Damodaran Online (NYU Stern) Country Default Spreads and Risk Premiums: default spread, sovereign CDS, and country risk premium of Peru 2026 56 Moody’s Ratings / S&P Global
Ratings Peru’s long-term sovereign rating (Baa1 / BBB-) 2026 57 Central Reserve Bank of Peru (BCRP) Series PD31893DD (10-year sovereign bond in S/) and PD31894DD (10-year global bond in US$), 365-day average as of 03/30/2026
estadisticas.bcrp.gob.pe 2025 – 2026 58 Superintendency of Banking, Insurance, and AFP (SBS) Vector of CPAC corporate bond prices (market yield to maturity) and zero coupon curve in soles as of 03/30/2026, for the cost of debt
www.sbs.gob.pe 2026

E3 172 E3 QUBO Copyright © 2026