
Q3 2026 Update 1 Exhibit 99.1
Highlights 03 Financial Summary 04 Operational Summary 05 Manufacturing & Hardware 06 Supporting Infrastructure 07 SI & Other Services 08 Outlook 09 Photos & Charts 10 Key Metrics 23 Financial Statements 26 Additional Information 32 2
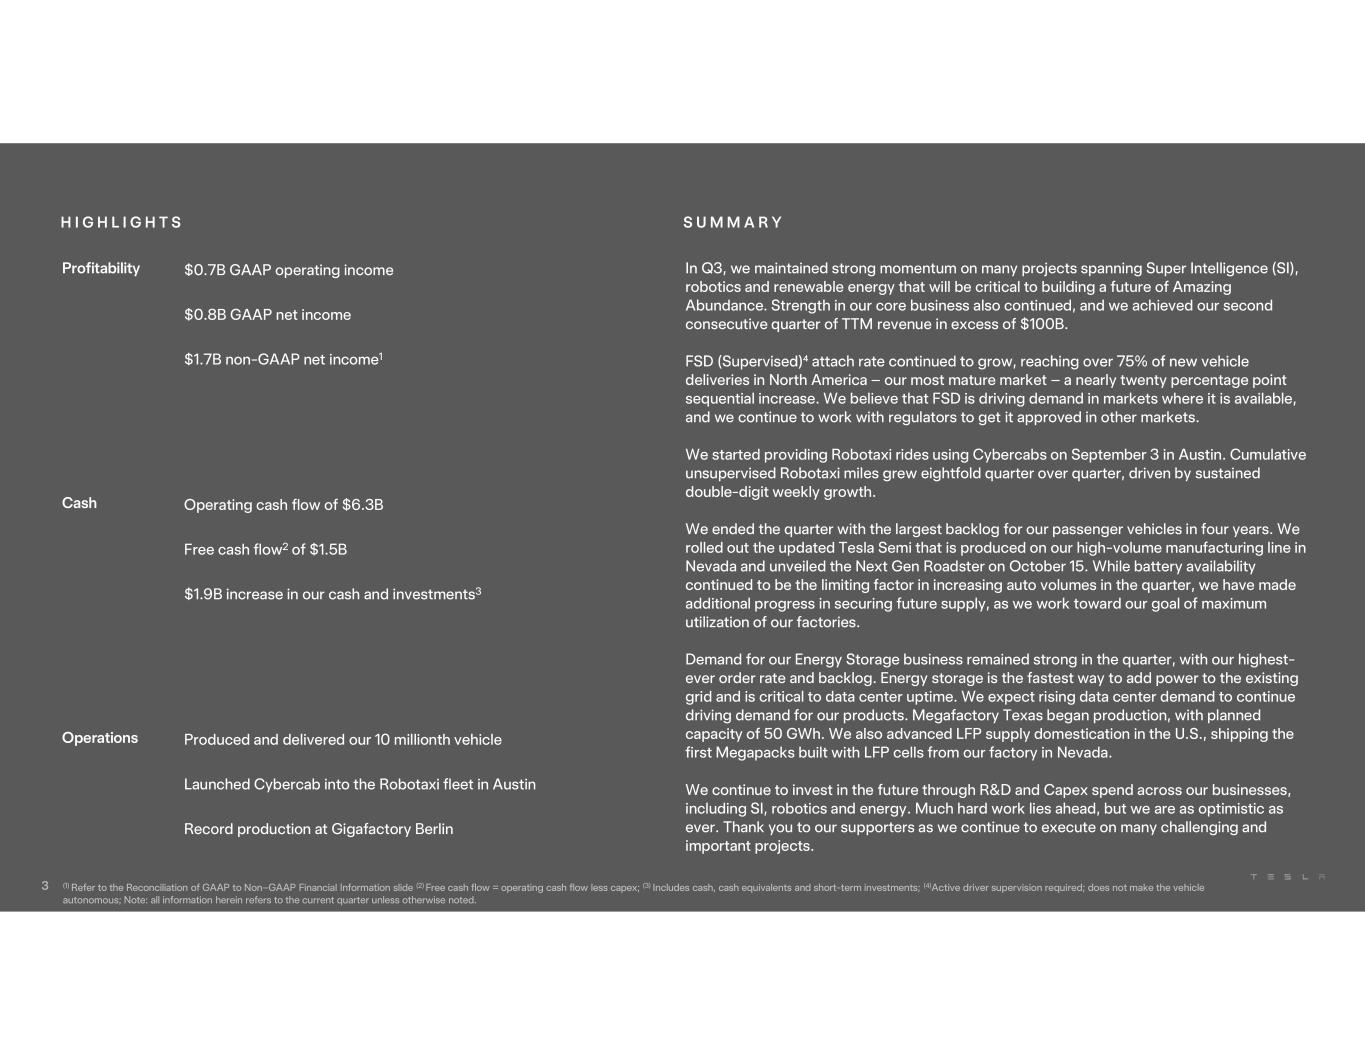
S U M M A R YH I G H L I G H T S (1) Refer to the Reconciliation of GAAP to Non–GAAP Financial Information slide (2) Free cash flow = operating cash flow less capex; (3) Includes cash, cash equivalents and short-term investments; (4)Active driver supervision required; does not make the vehicle autonomous; Note: all information herein refers to the current quarter unless otherwise noted. Profitability $0.7B GAAP operating income $0.8B GAAP net income $1.7B non-GAAP net income1 In Q3, we maintained strong momentum on many projects spanning Super Intelligence (SI), robotics and renewable energy that will be critical to building a future of Amazing Abundance. Strength in our core business also continued, and we achieved our second consecutive quarter of TTM revenue in excess of $100B. deliveries in North America – our most mature market – a nearly twenty percentage point sequential increase. We believe that FSD is driving demand in markets where it is available, and we continue to work with regulators to get it approved in other markets. We started providing Robotaxi rides using Cybercabs on September 3 in Austin. Cumulative unsupervised Robotaxi miles grew eightfold quarter over quarter, driven by sustained double-digit weekly growth. We ended the quarter with the largest backlog for our passenger vehicles in four years. We rolled out the updated Tesla Semi that is produced on our high-volume manufacturing line in Nevada and unveiled the Next Gen Roadster on October 15. While battery availability continued to be the limiting factor in increasing auto volumes in the quarter, we have made additional progress in securing future supply, as we work toward our goal of maximum utilization of our factories. Demand for our Energy Storage business remained strong in the quarter, with our highest- ever order rate and backlog. Energy storage is the fastest way to add power to the existing grid and is critical to data center uptime. We expect rising data center demand to continue driving demand for our products. Megafactory Texas began production, with planned capacity of 50 GWh. We also advanced LFP supply domestication in the U.S., shipping the first Megapacks built with LFP cells from our factory in Nevada. We continue to invest in the future through R&D and Capex spend across our businesses, including SI, robotics and energy. Much hard work lies ahead, but we are as optimistic as ever. Thank you to our supporters as we continue to execute on many challenging and important projects. Cash Operating cash flow of $6.3B Free cash flow2 of $1.5B $1.9B increase in our cash and investments3 Operations Produced and delivered our 10 millionth vehicle Launched Cybercab into the Robotaxi fleet in Austin Record production at Gigafactory Berlin 3
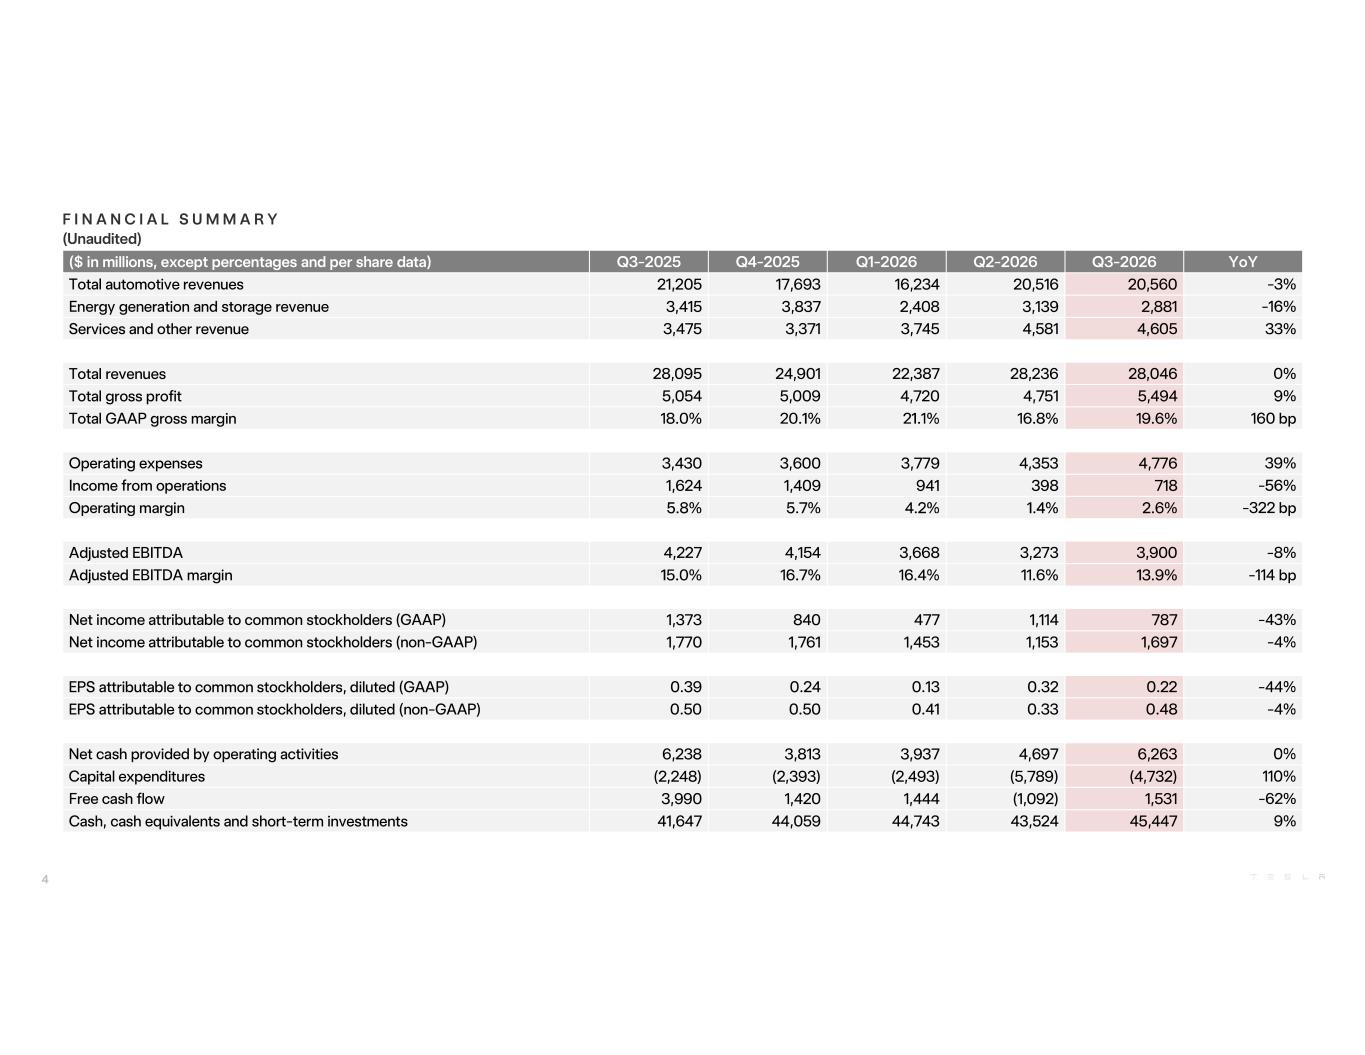
F I N A N C I A L S U M M A R Y (Unaudited) ($ in millions, except percentages and per share data) Q3-2025 Q4-2025 Q1-2026 Q2-2026 Q3-2026 YoY Total automotive revenues 21,205 17,693 16,234 20,516 20,560 - Energy generation and storage revenue 3,415 3,837 2,408 3,139 2,881 - Services and other revenue 3,475 3,371 3,745 4,581 4,605 Total revenues 28,095 24,901 22,387 28,236 28,046 Total gross profit 5,054 5,009 4,720 4,751 5,494 Total GAAP gross margin 160 bp Operating expenses 3,430 3,600 3,779 4,353 4,776 Income from operations 1,624 1,409 941 398 718 - Operating margin -322 bp Adjusted EBITDA 4,227 4,154 3,668 3,273 3,900 - Adjusted EBITDA margin -114 bp Net income attributable to common stockholders (GAAP) 1,373 840 477 1,114 787 - Net income attributable to common stockholders (non-GAAP) 1,770 1,761 1,453 1,153 1,697 - EPS attributable to common stockholders, diluted (GAAP) 0.39 0.24 0.13 0.32 0.22 - EPS attributable to common stockholders, diluted (non-GAAP) 0.50 0.50 0.41 0.33 0.48 - Net cash provided by operating activities 6,238 3,813 3,937 4,697 6,263 Capital expenditures (2,248) (2,393) (2,493) (5,789) (4,732) Free cash flow 3,990 1,420 1,444 (1,092) 1,531 - Cash, cash equivalents and short-term investments 41,647 44,059 44,743 43,524 45,447 4
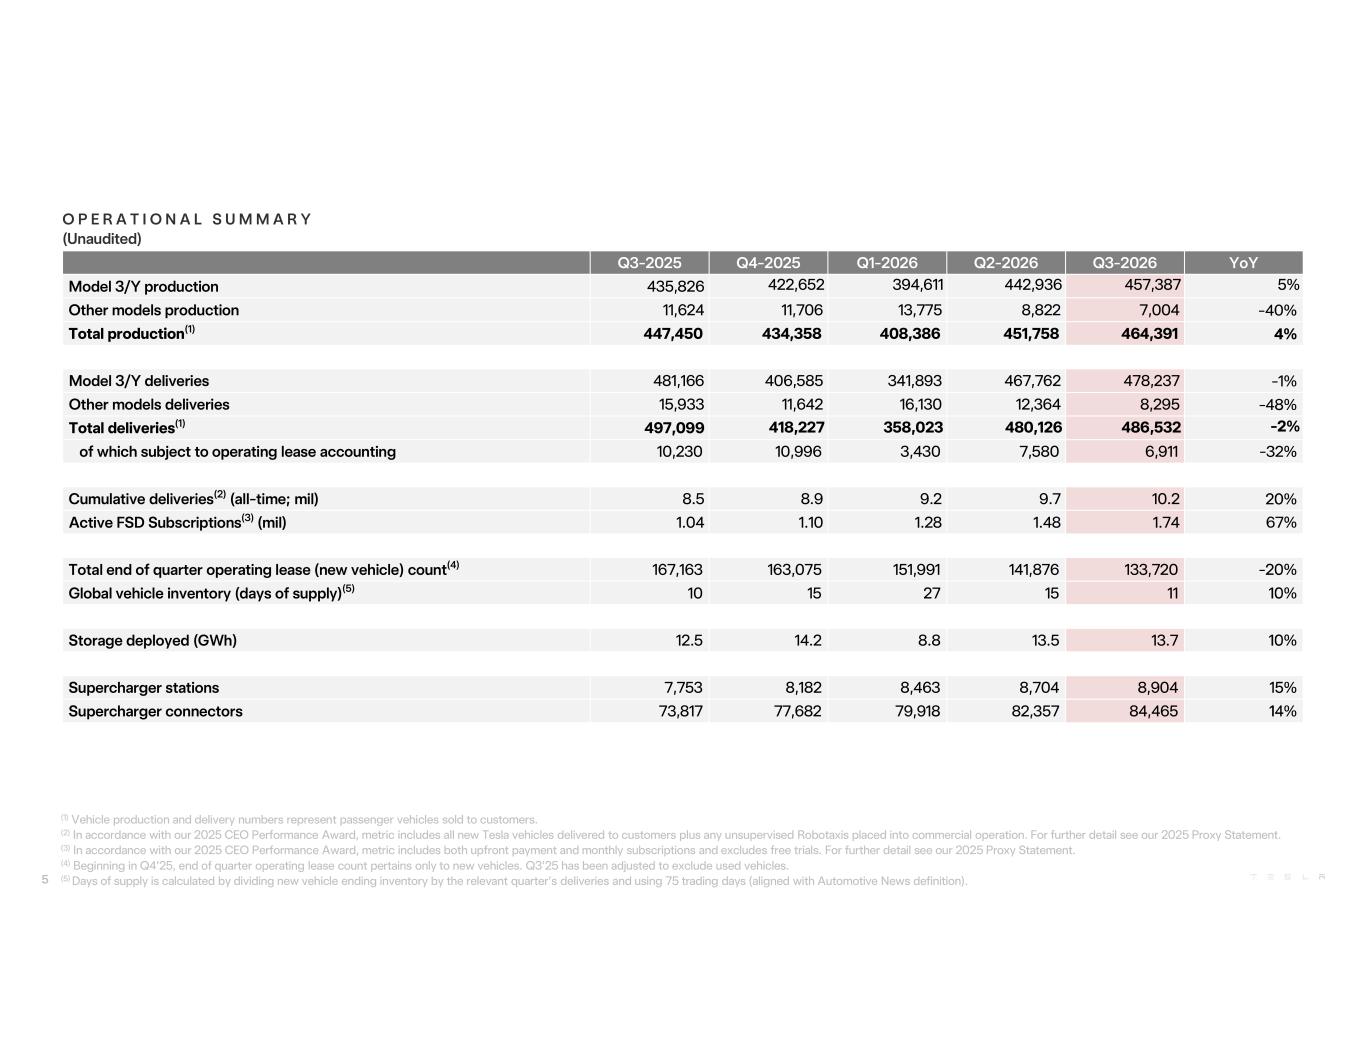
Q3-2025 Q4-2025 Q1-2026 Q2-2026 Q3-2026 YoY Model 3/Y production 435,826 422,652 394,611 442,936 457,387 Other models production 11,624 11,706 13,775 8,822 7,004 - Total production(1) 447,450 434,358 408,386 451,758 464,391 4% Model 3/Y deliveries 481,166 406,585 341,893 467,762 478,237 - Other models deliveries 15,933 11,642 16,130 12,364 8,295 - Total deliveries(1) 497,099 418,227 358,023 480,126 486,532 -2% of which subject to operating lease accounting 10,230 10,996 3,430 7,580 6,911 - Cumulative deliveries(2) (all-time; mil) 8.5 8.9 9.2 9.7 10.2 Active FSD Subscriptions(3) (mil) 1.04 1.10 1.28 1.48 1.74 Total end of quarter operating lease (new vehicle) count(4) 167,163 163,075 151,991 141,876 133,720 - Global vehicle inventory (days of supply)(5) 10 15 27 15 11 Storage deployed (GWh) 12.5 14.2 8.8 13.5 13.7 Supercharger stations 7,753 8,182 8,463 8,704 8,904 Supercharger connectors 73,817 77,682 79,918 82,357 84,465 O P E R A T I O N A L S U M M A R Y (Unaudited) 5 (1) Vehicle production and delivery numbers represent passenger vehicles sold to customers. (2) In accordance with our 2025 CEO Performance Award, metric includes all new Tesla vehicles delivered to customers plus any unsupervised Robotaxis placed into commercial operation. For further detail see our 2025 Proxy Statement. (3) In accordance with our 2025 CEO Performance Award, metric includes both upfront payment and monthly subscriptions and excludes free trials. For further detail see our 2025 Proxy Statement. (4) Beginning in Q4’25, end of quarter operating lease count pertains only to new vehicles. Q3’25 has been adjusted to exclude used vehicles. (5) Days of supply is calculated by dividing new vehicle ending inventory by the relevant quarter’s deliveries and using 75 trading days (aligned with Automotive News definition).
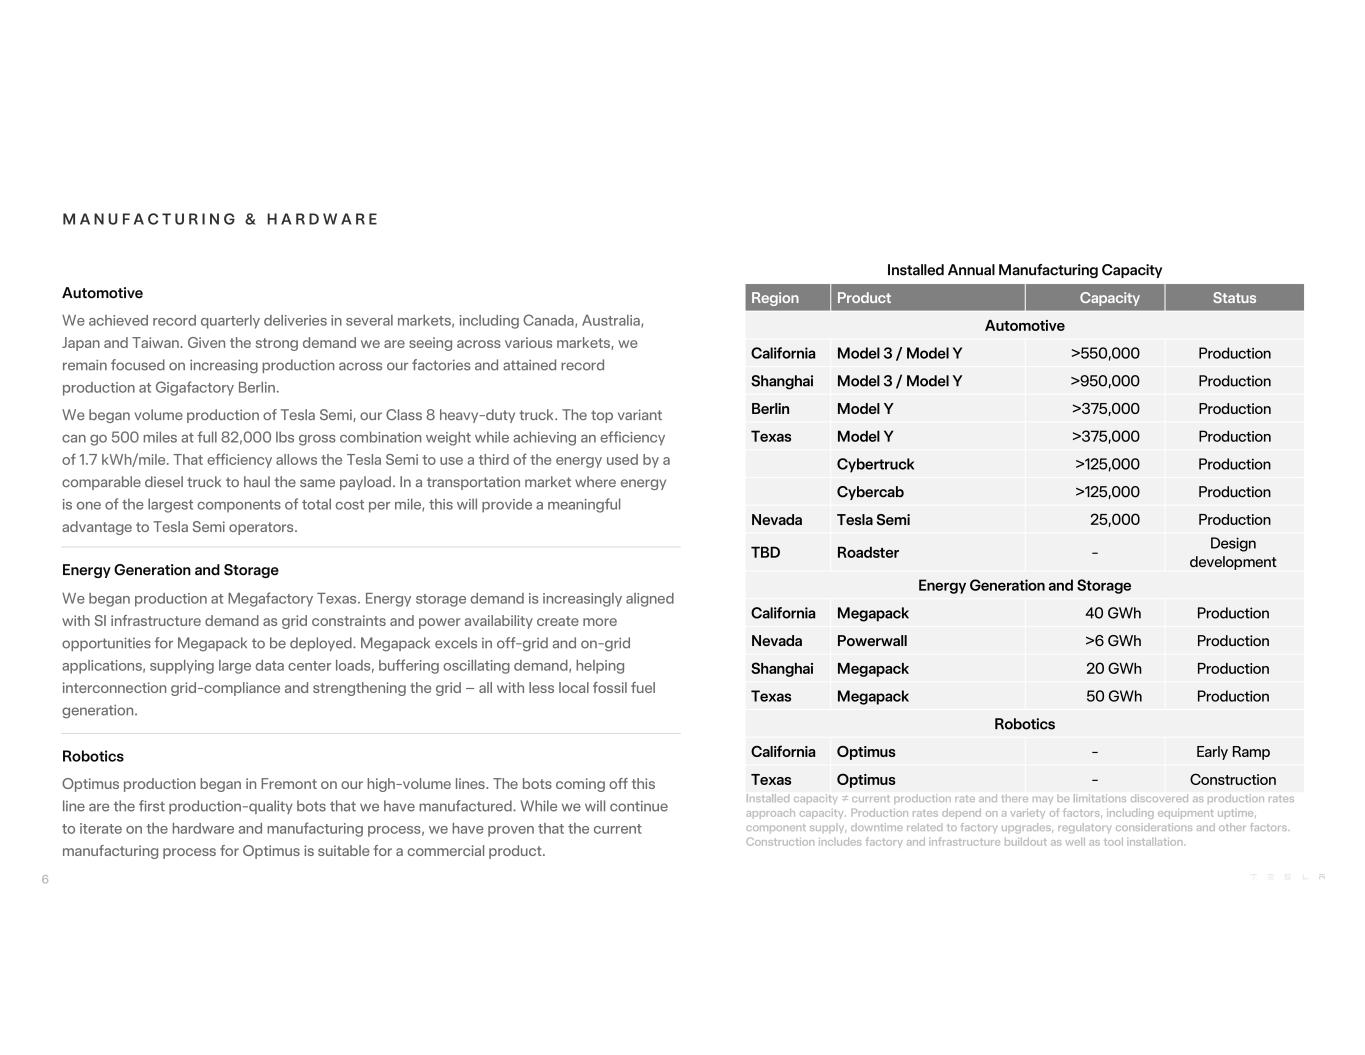
M A N U F A C T U R I N G & H A R D W A R E Installed Annual Manufacturing Capacity Region Product Capacity Status Automotive California Model 3 / Model Y >550,000 Production Shanghai Model 3 / Model Y >950,000 Production Berlin Model Y >375,000 Production Texas Model Y >375,000 Production Cybertruck >125,000 Production Cybercab >125,000 Production Nevada Tesla Semi 25,000 Production TBD Roadster - Design development Energy Generation and Storage California Megapack 40 GWh Production Nevada Powerwall >6 GWh Production Shanghai Megapack 20 GWh Production Texas Megapack 50 GWh Production Robotics California Optimus - Early Ramp Texas Optimus - Construction approach capacity. Production rates depend on a variety of factors, including equipment uptime, component supply, downtime related to factory upgrades, regulatory considerations and other factors. Construction includes factory and infrastructure buildout as well as tool installation. Automotive We achieved record quarterly deliveries in several markets, including Canada, Australia, Japan and Taiwan. Given the strong demand we are seeing across various markets, we remain focused on increasing production across our factories and attained record production at Gigafactory Berlin. We began volume production of Tesla Semi, our Class 8 heavy-duty truck. The top variant can go 500 miles at full 82,000 lbs gross combination weight while achieving an efficiency of 1.7 kWh/mile. That efficiency allows the Tesla Semi to use a third of the energy used by a comparable diesel truck to haul the same payload. In a transportation market where energy is one of the largest components of total cost per mile, this will provide a meaningful advantage to Tesla Semi operators. Energy Generation and Storage We began production at Megafactory Texas. Energy storage demand is increasingly aligned with SI infrastructure demand as grid constraints and power availability create more opportunities for Megapack to be deployed. Megapack excels in off-grid and on-grid applications, supplying large data center loads, buffering oscillating demand, helping interconnection grid-compliance and strengthening the grid – all with less local fossil fuel generation. Robotics Optimus production began in Fremont on our high-volume lines. The bots coming off this line are the first production-quality bots that we have manufactured. While we will continue to iterate on the hardware and manufacturing process, we have proven that the current manufacturing process for Optimus is suitable for a commercial product. 6
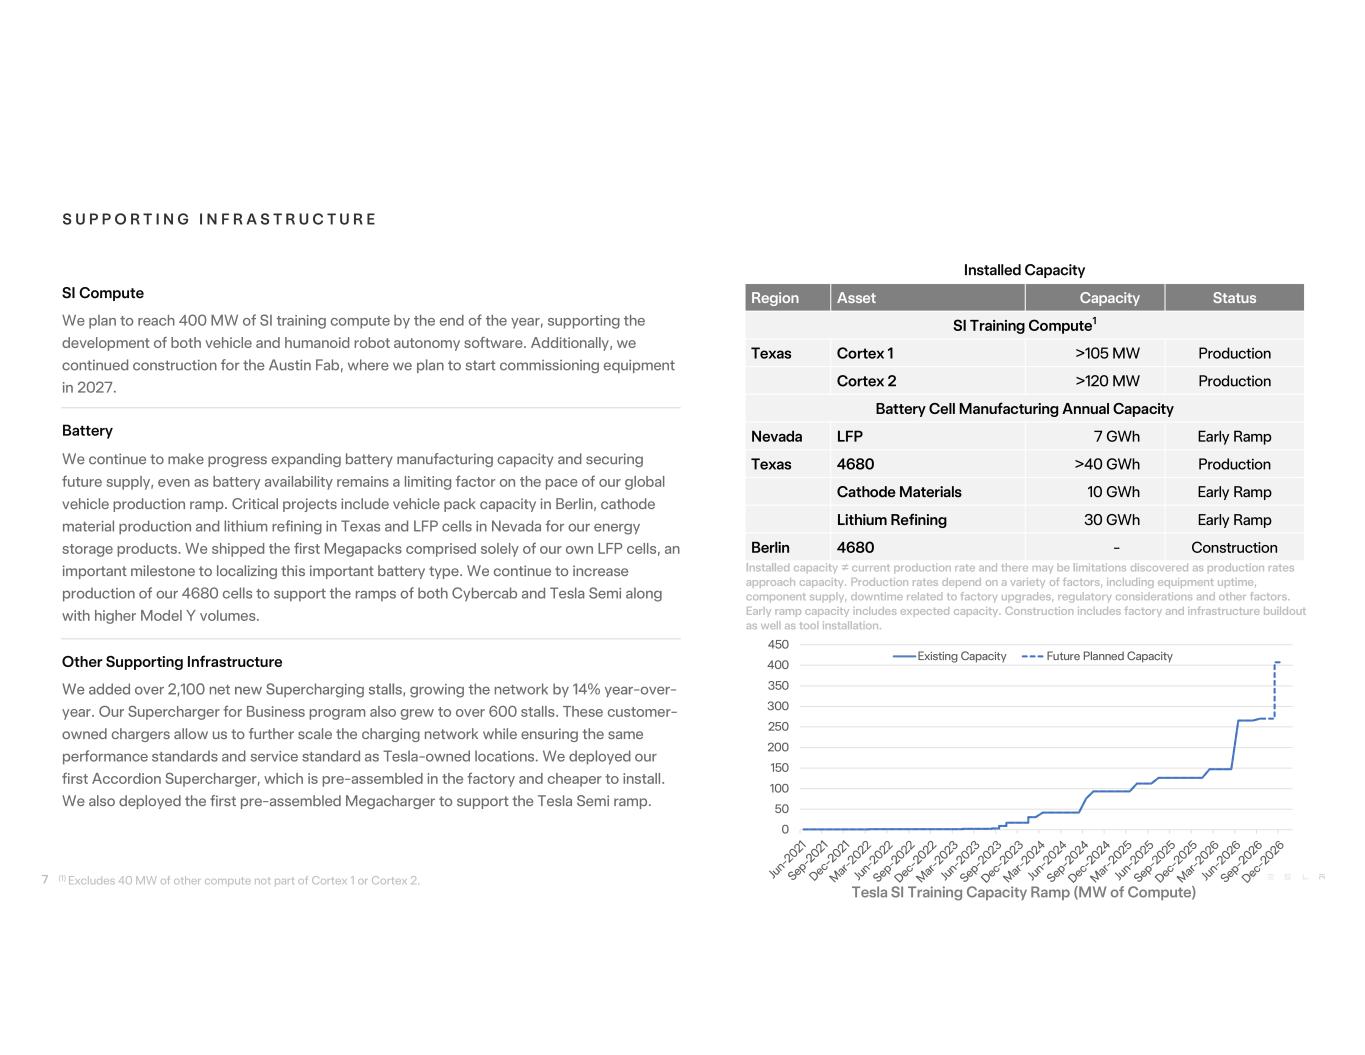
S U P P O R T I N G I N F R A S T R U C T U R E Installed Capacity Region Asset Capacity Status SI Training Compute1 Texas Cortex 1 >105 MW Production Cortex 2 >120 MW Production Battery Cell Manufacturing Annual Capacity Nevada LFP 7 GWh Early Ramp Texas 4680 >40 GWh Production Cathode Materials 10 GWh Early Ramp Lithium Refining 30 GWh Early Ramp Berlin 4680 - Construction approach capacity. Production rates depend on a variety of factors, including equipment uptime, component supply, downtime related to factory upgrades, regulatory considerations and other factors. Early ramp capacity includes expected capacity. Construction includes factory and infrastructure buildout as well as tool installation. SI Compute We plan to reach 400 MW of SI training compute by the end of the year, supporting the development of both vehicle and humanoid robot autonomy software. Additionally, we continued construction for the Austin Fab, where we plan to start commissioning equipment in 2027. Battery We continue to make progress expanding battery manufacturing capacity and securing future supply, even as battery availability remains a limiting factor on the pace of our global vehicle production ramp. Critical projects include vehicle pack capacity in Berlin, cathode material production and lithium refining in Texas and LFP cells in Nevada for our energy storage products. We shipped the first Megapacks comprised solely of our own LFP cells, an important milestone to localizing this important battery type. We continue to increase production of our 4680 cells to support the ramps of both Cybercab and Tesla Semi along with higher Model Y volumes. Other Supporting Infrastructure -over- year. Our Supercharger for Business program also grew to over 600 stalls. These customer- owned chargers allow us to further scale the charging network while ensuring the same performance standards and service standard as Tesla-owned locations. We deployed our first Accordion Supercharger, which is pre-assembled in the factory and cheaper to install. We also deployed the first pre-assembled Megacharger to support the Tesla Semi ramp. 7 Tesla SI Training Capacity Ramp (MW of Compute) 0 50 100 150 200 250 300 350 400 450 Existing Capacity Future Planned Capacity (1) Excludes 40 MW of other compute not part of Cortex 1 or Cortex 2.
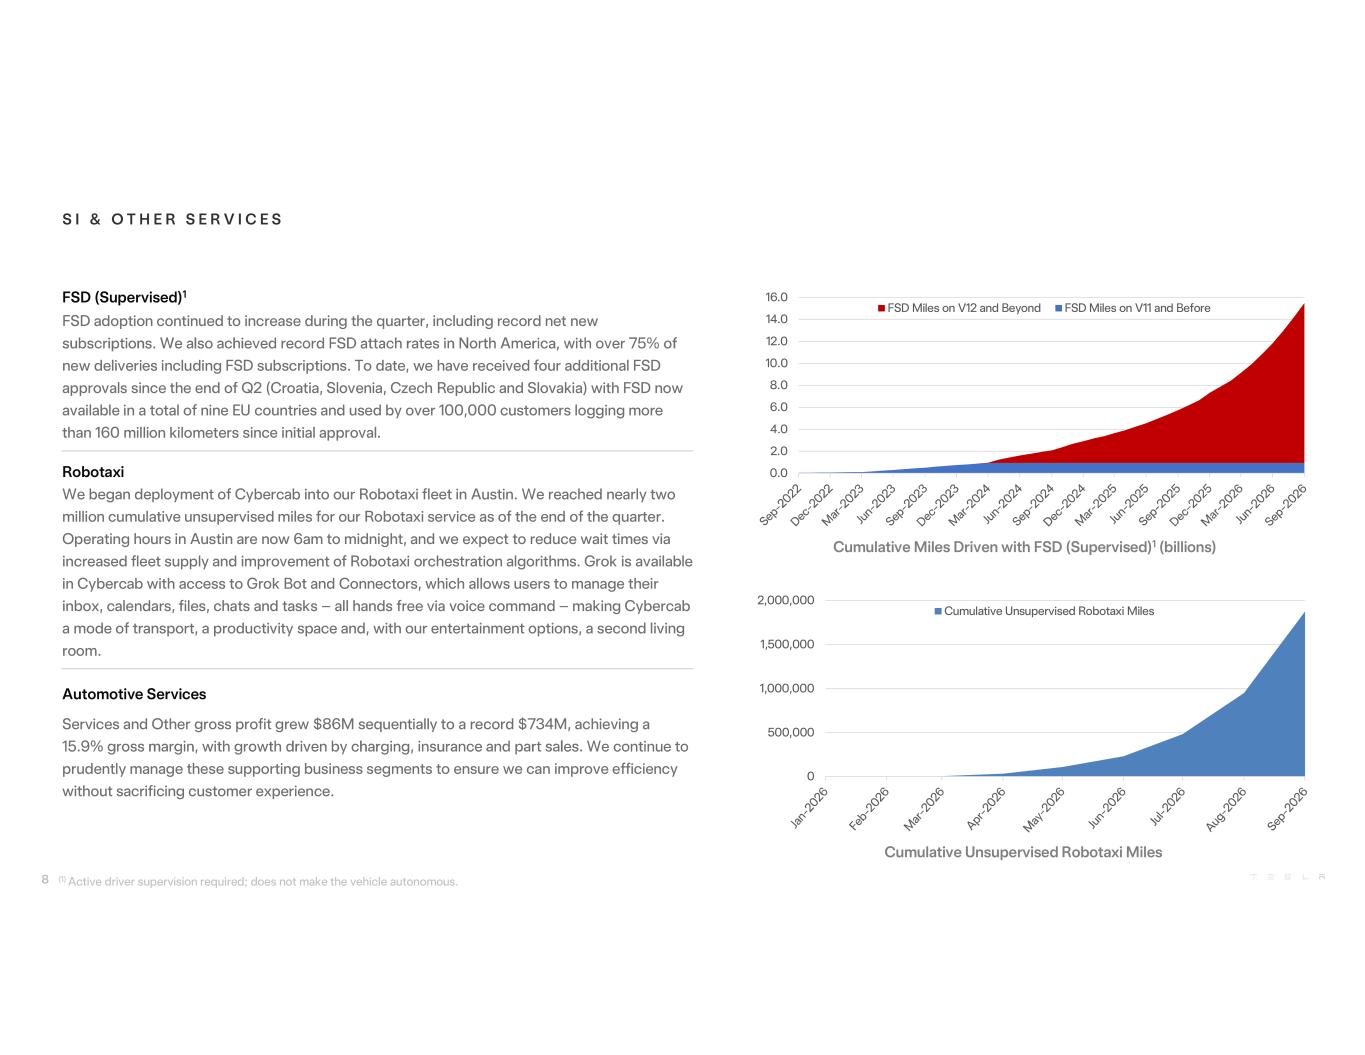
S I & O T H E R S E R V I C E S Cumulative Unsupervised Robotaxi Miles Cumulative Miles Driven with FSD (Supervised)1 (billions) 8 (1) Active driver supervision required; does not make the vehicle autonomous. FSD (Supervised)1 FSD adoption continued to increase during the quarter, including record net new new deliveries including FSD subscriptions. To date, we have received four additional FSD approvals since the end of Q2 (Croatia, Slovenia, Czech Republic and Slovakia) with FSD now available in a total of nine EU countries and used by over 100,000 customers logging more than 160 million kilometers since initial approval. Robotaxi We began deployment of Cybercab into our Robotaxi fleet in Austin. We reached nearly two million cumulative unsupervised miles for our Robotaxi service as of the end of the quarter. Operating hours in Austin are now 6am to midnight, and we expect to reduce wait times via increased fleet supply and improvement of Robotaxi orchestration algorithms. Grok is available in Cybercab with access to Grok Bot and Connectors, which allows users to manage their inbox, calendars, files, chats and tasks – all hands free via voice command – making Cybercab a mode of transport, a productivity space and, with our entertainment options, a second living room. Automotive Services Services and Other gross profit grew $86M sequentially to a record $734M, achieving a prudently manage these supporting business segments to ensure we can improve efficiency without sacrificing customer experience. 0.0 2.0 4.0 6.0 8.0 10.0 12.0 14.0 16.0 FSD Miles on V12 and Beyond FSD Miles on V11 and Before 0 500,000 1,000,000 1,500,000 2,000,000 Cumulative Unsupervised Robotaxi Miles
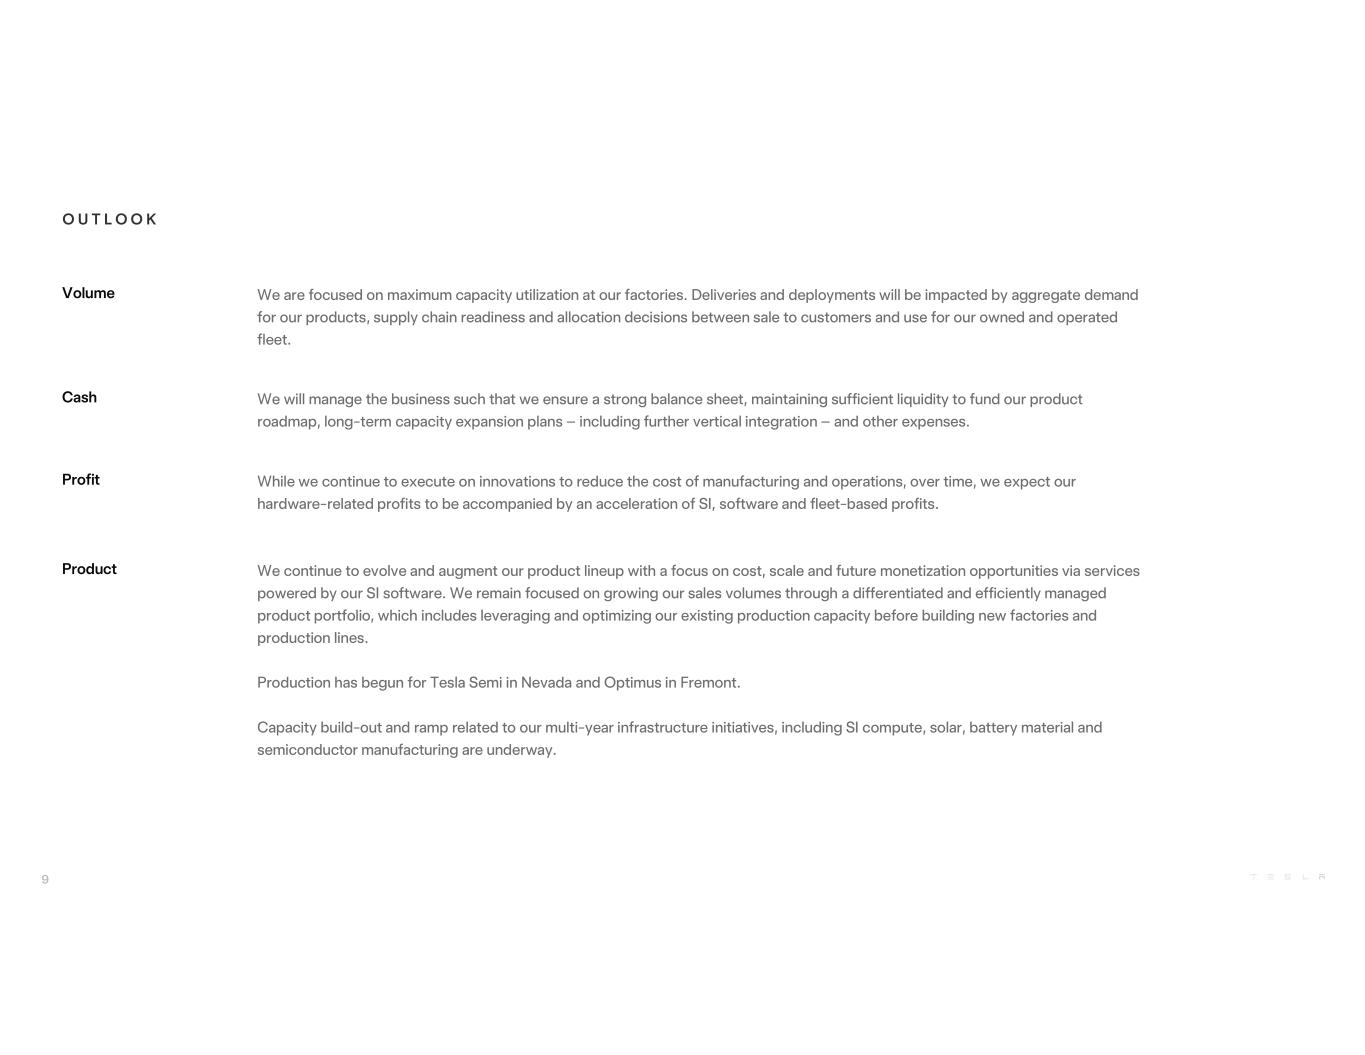
O U T L O O K Volume We are focused on maximum capacity utilization at our factories. Deliveries and deployments will be impacted by aggregate demand for our products, supply chain readiness and allocation decisions between sale to customers and use for our owned and operated fleet. Cash We will manage the business such that we ensure a strong balance sheet, maintaining sufficient liquidity to fund our product roadmap, long-term capacity expansion plans – including further vertical integration – and other expenses. Profit While we continue to execute on innovations to reduce the cost of manufacturing and operations, over time, we expect our hardware-related profits to be accompanied by an acceleration of SI, software and fleet-based profits. Product We continue to evolve and augment our product lineup with a focus on cost, scale and future monetization opportunities via services powered by our SI software. We remain focused on growing our sales volumes through a differentiated and efficiently managed product portfolio, which includes leveraging and optimizing our existing production capacity before building new factories and production lines. Production has begun for Tesla Semi in Nevada and Optimus in Fremont. Capacity build-out and ramp related to our multi-year infrastructure initiatives, including SI compute, solar, battery material and semiconductor manufacturing are underway. 9

P H O T O S & C H A R T S
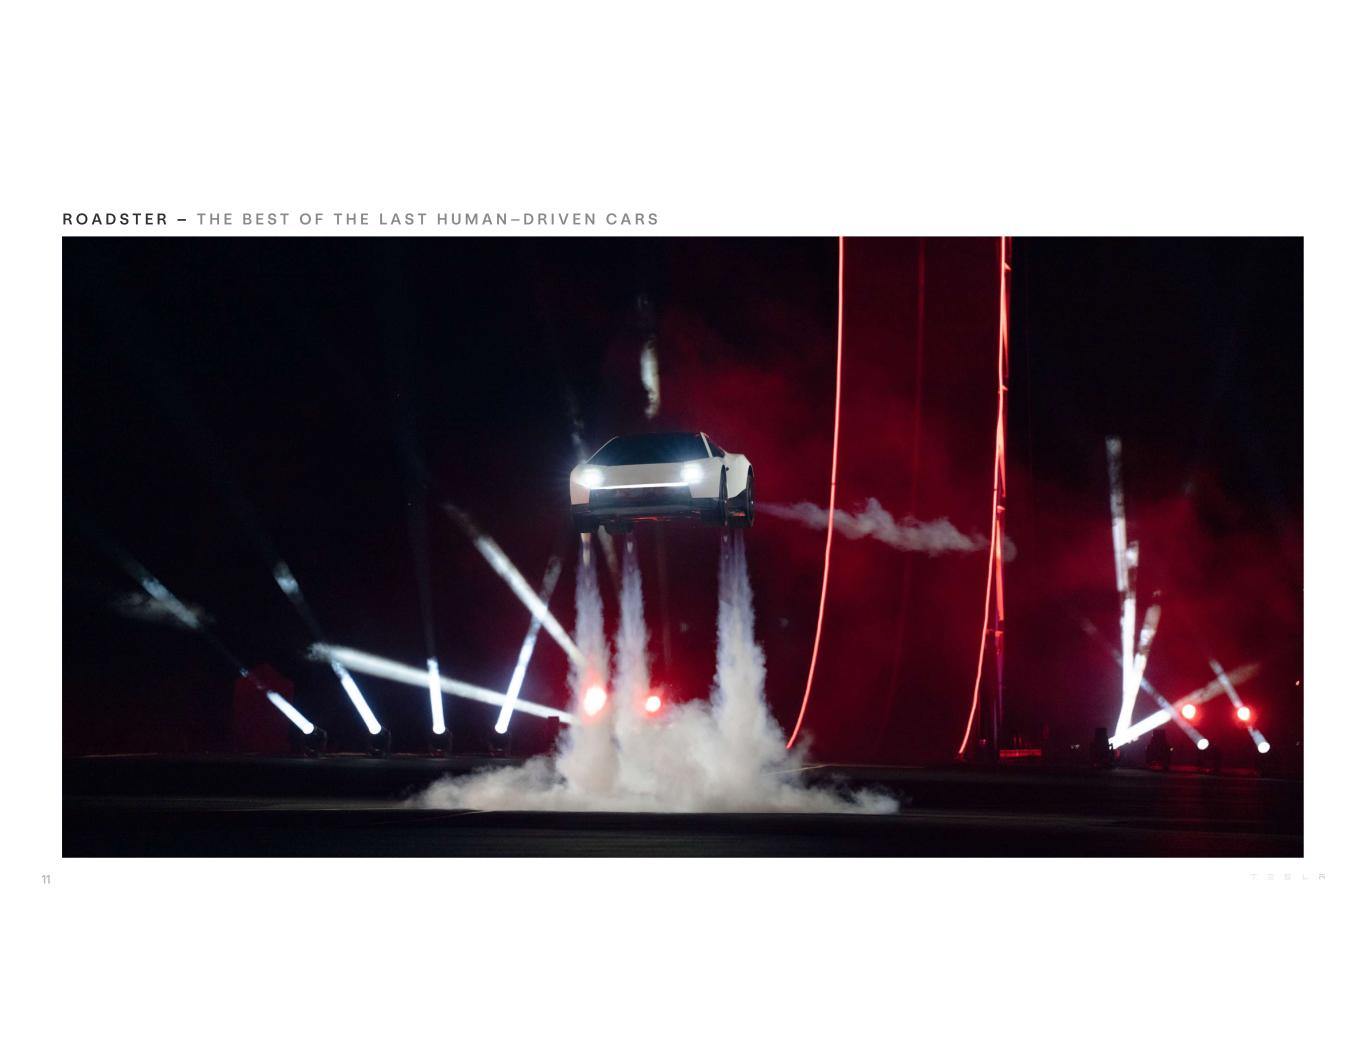
11 R O A D S T E R – T H E B E S T O F T H E L A S T H U M A N – D R I V E N C A R S
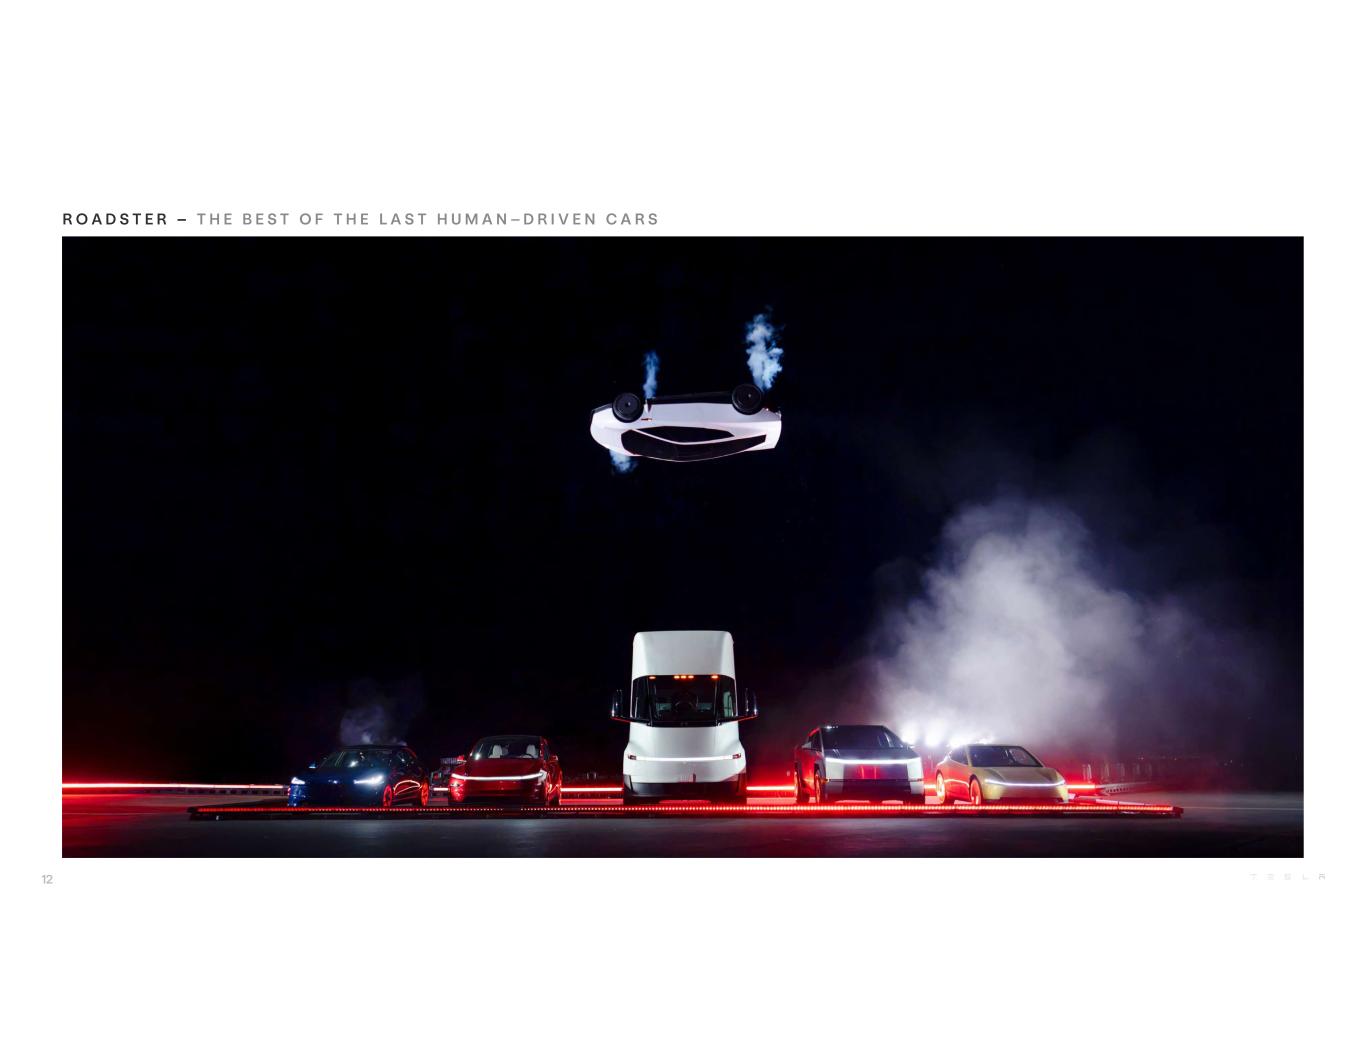
12 R O A D S T E R – T H E B E S T O F T H E L A S T H U M A N – D R I V E N C A R S
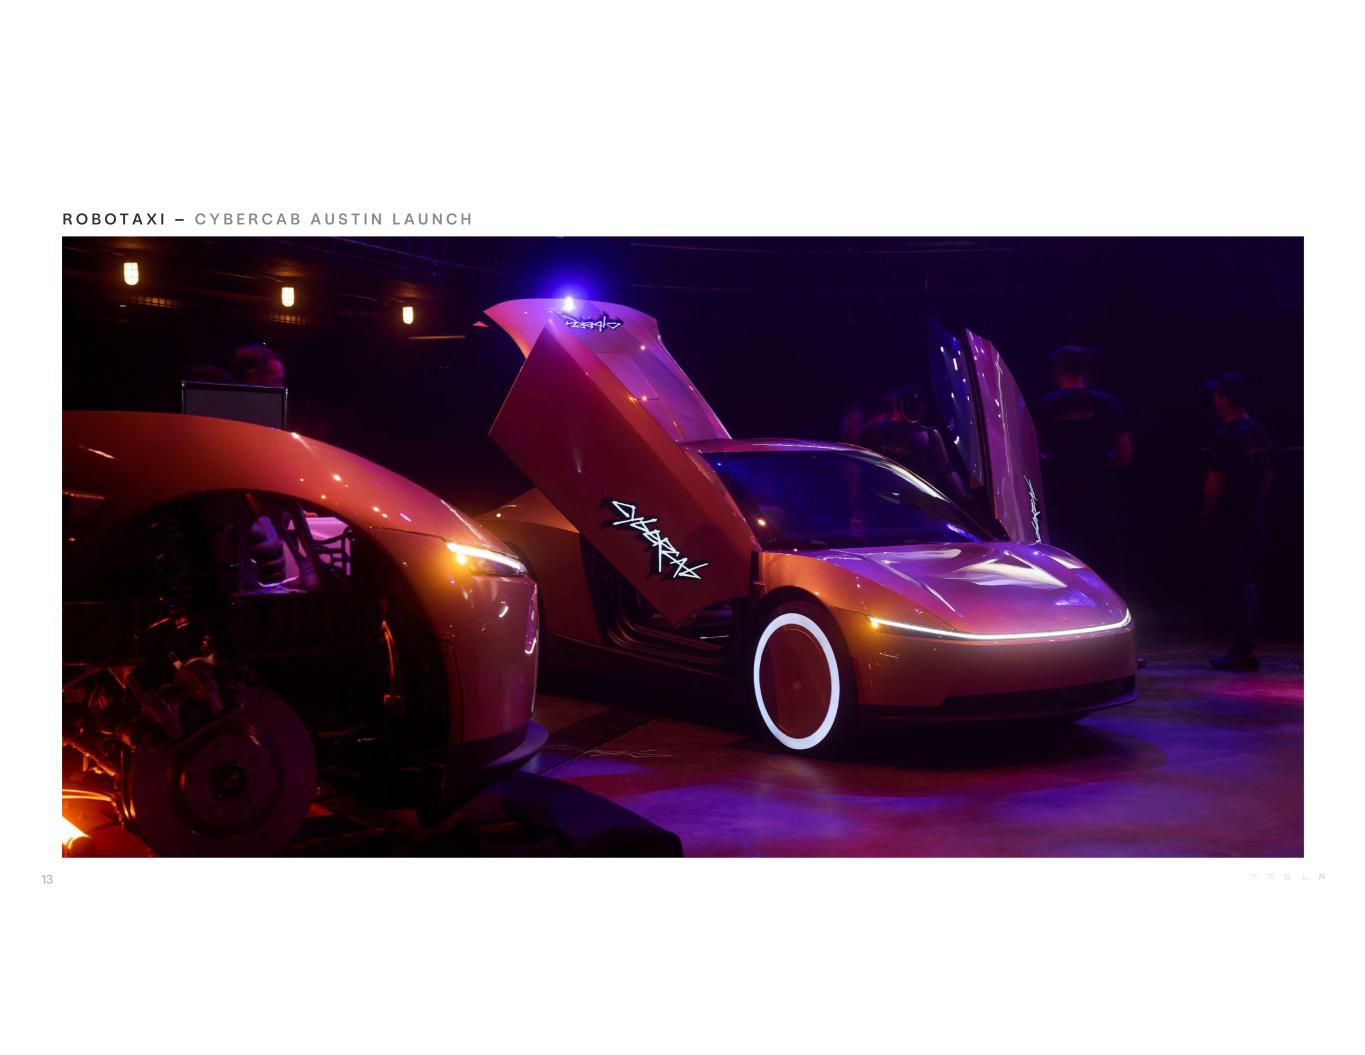
13 R O B O T A X I – C Y B E R C A B A U S T I N L A U N C H

14 R O B O T A X I – C Y B E R C A B A U S T I N L A U N C H

15 R O B O T A X I – C Y B E R C A B A U S T I N L A U N C H
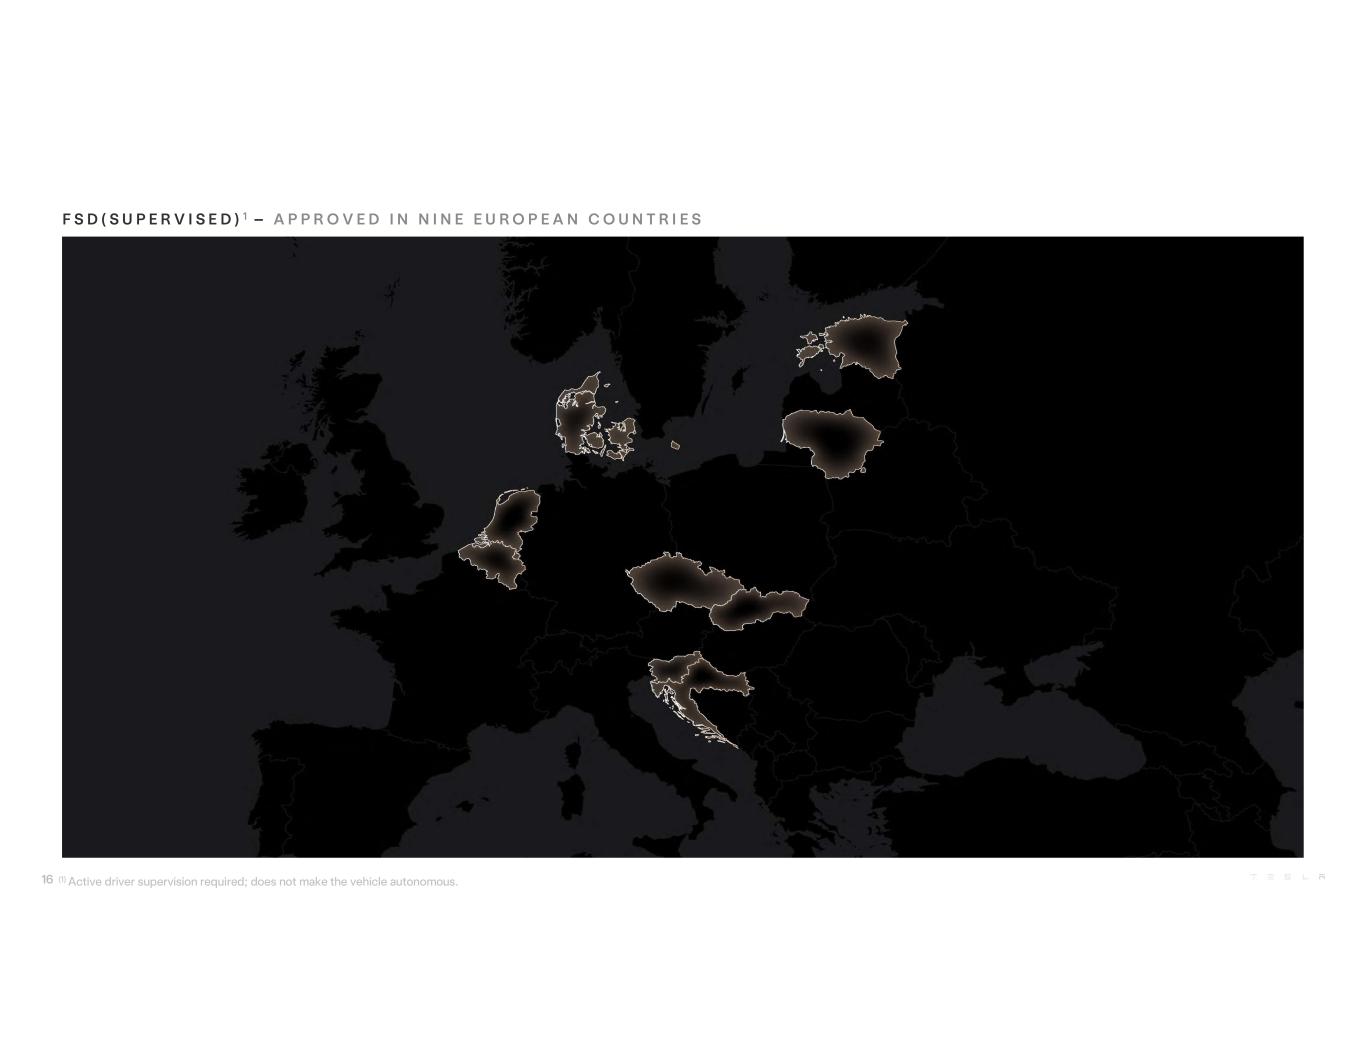
F S D ( S U P E R V I S E D ) 1 – A P P R O V E D I N N I N E E U R O P E A N C O U N T R I E S 16 (1) Active driver supervision required; does not make the vehicle autonomous.
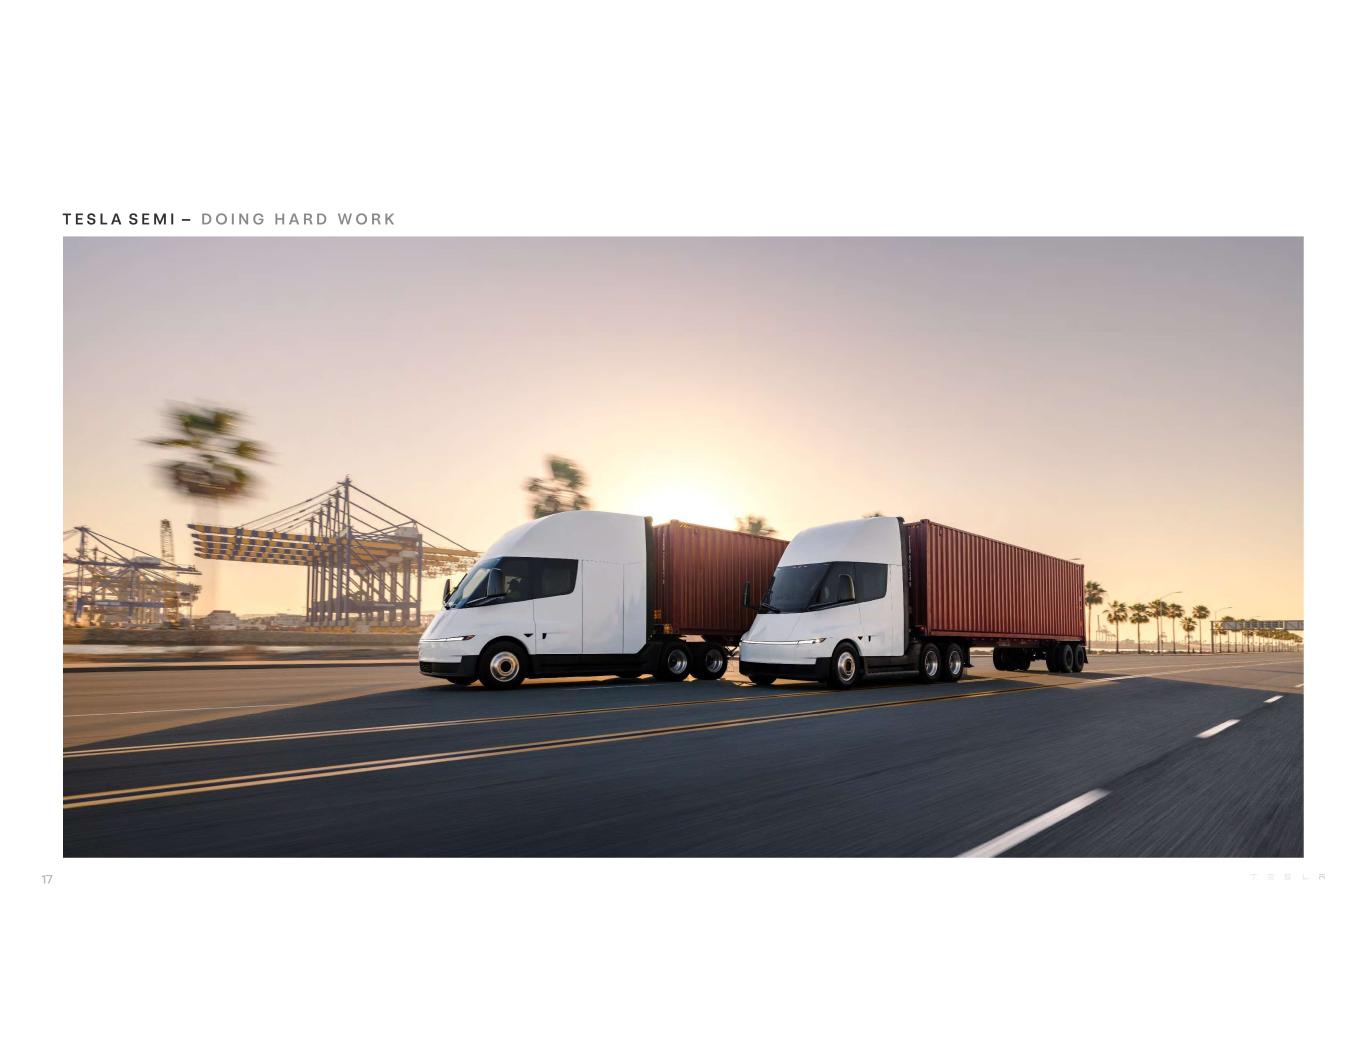
T E S L A S E M I – D O I N G H A R D W O R K 17
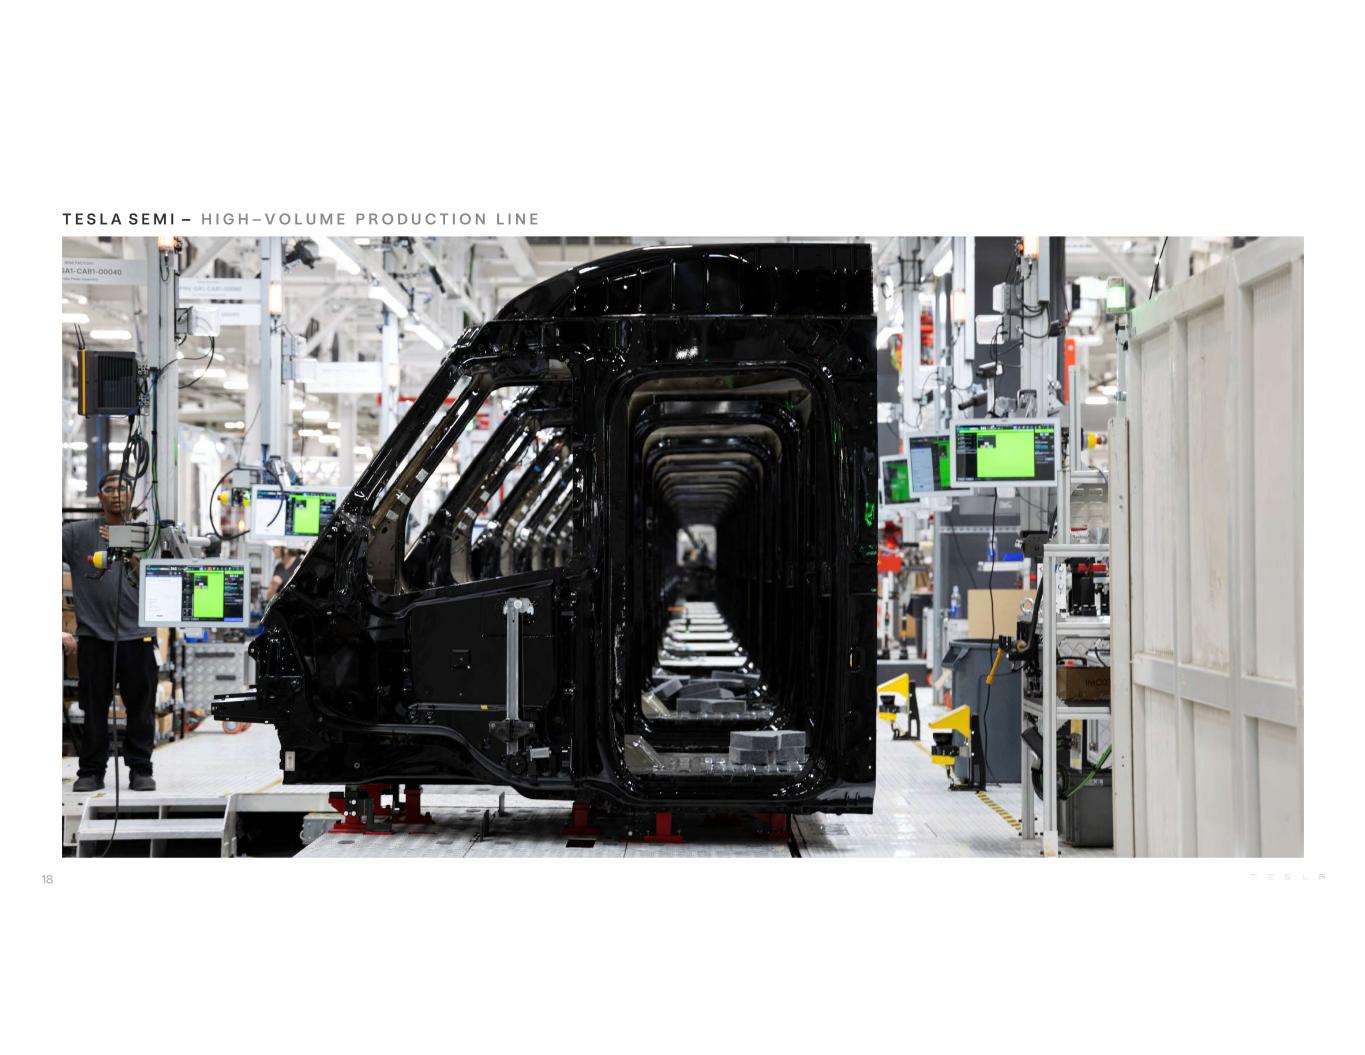
T E S L A S E M I – H I G H – V O L U M E P R O D U C T I O N L I N E 18
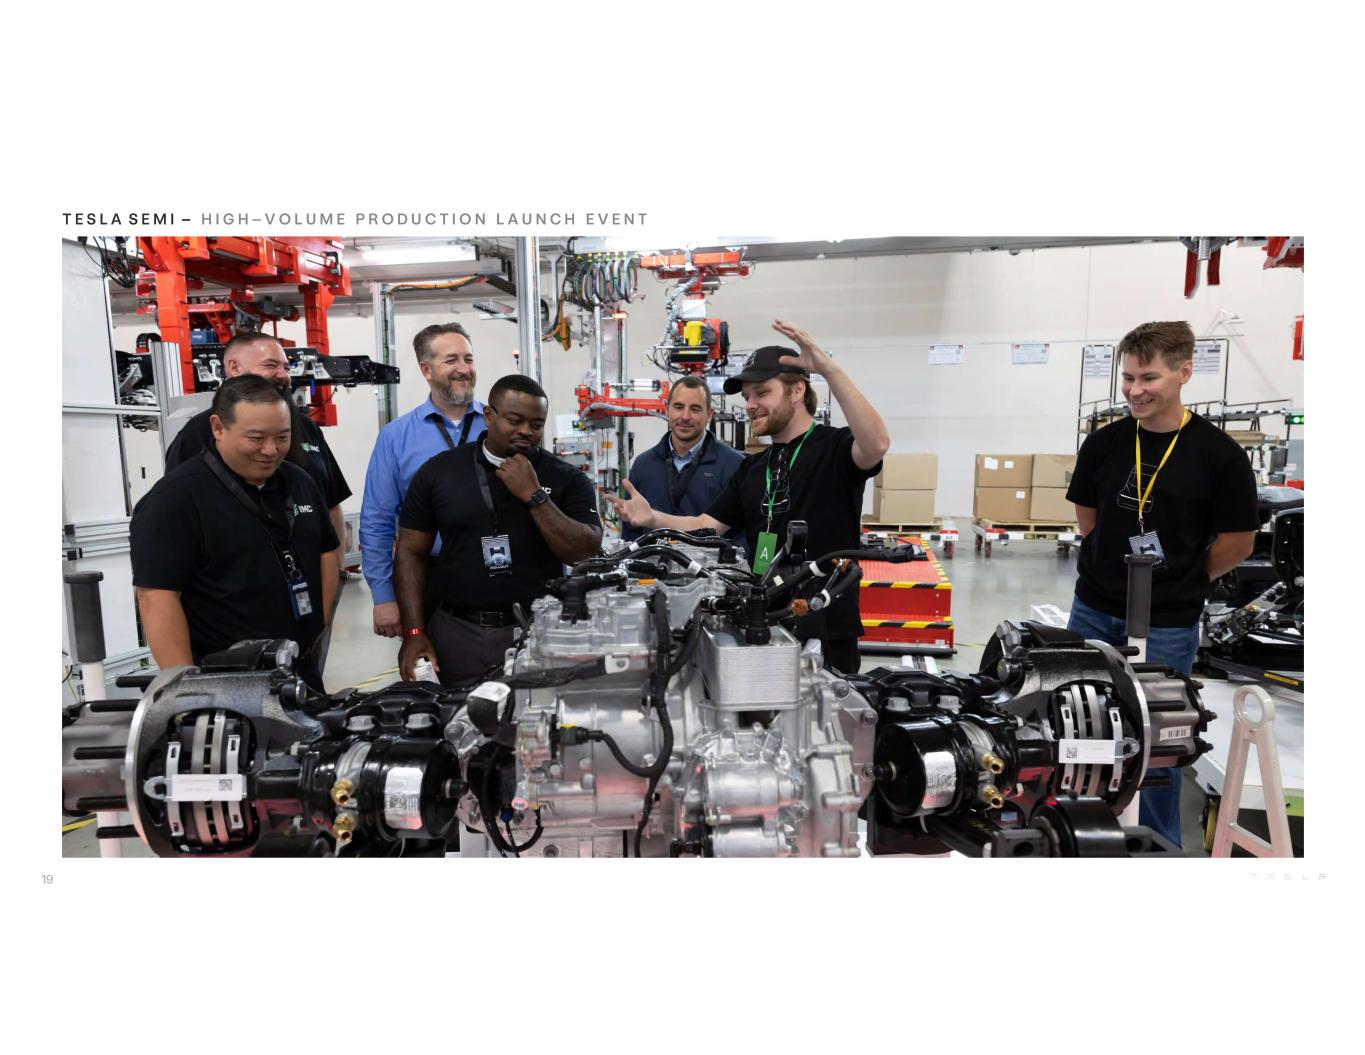
19 T E S L A S E M I – H I G H – V O L U M E P R O D U C T I O N L A U N C H E V E N T
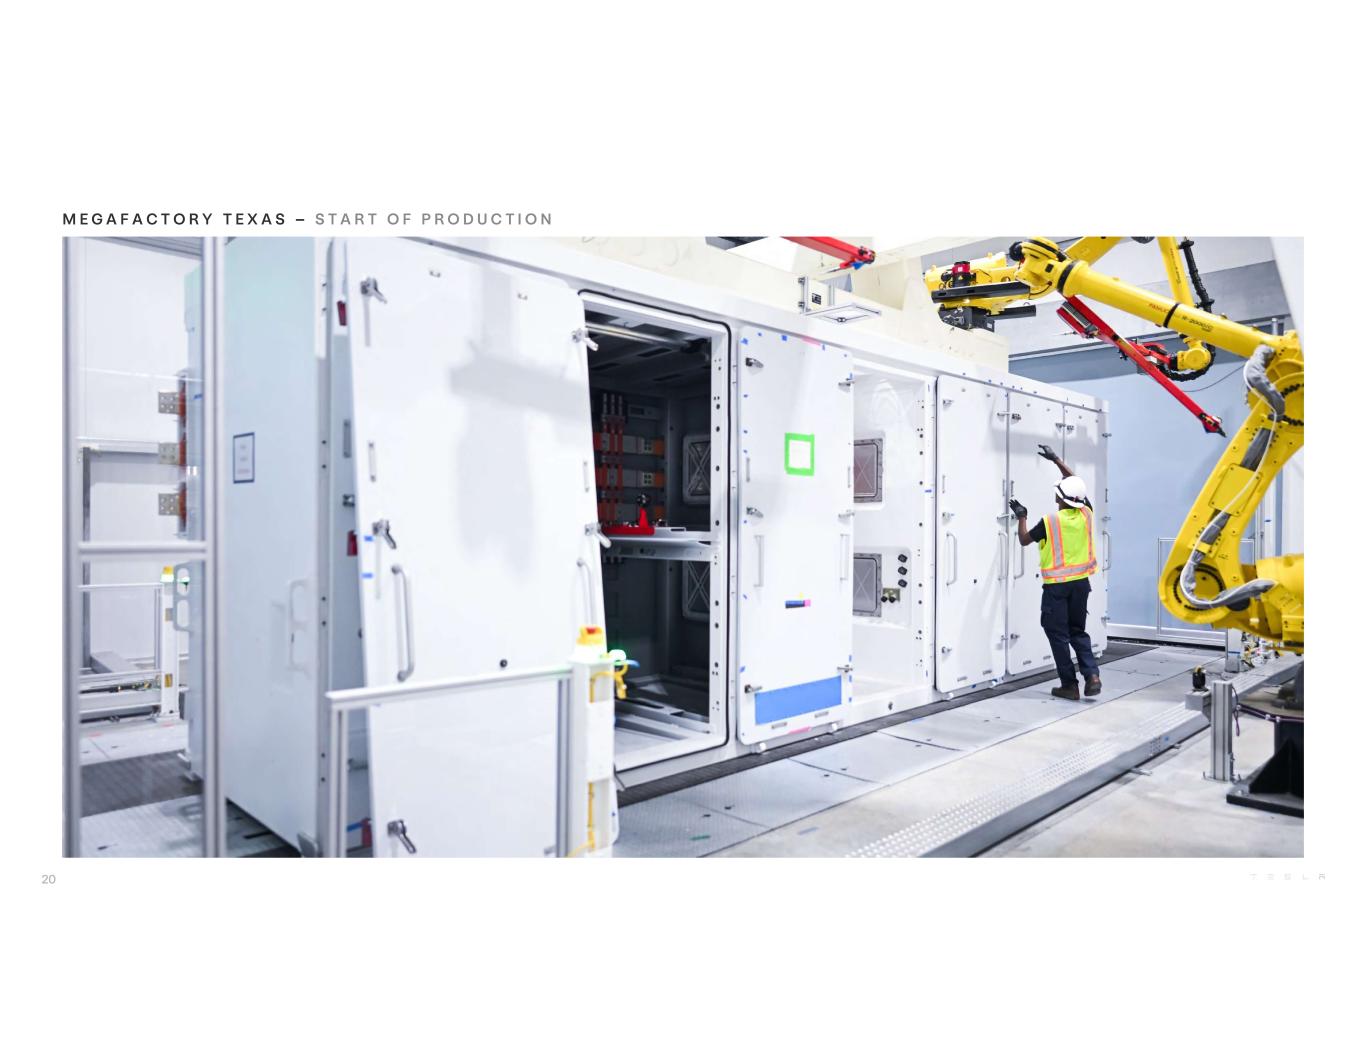
M E G A F A C T O R Y T E X A S – S T A R T O F P R O D U C T I O N 20
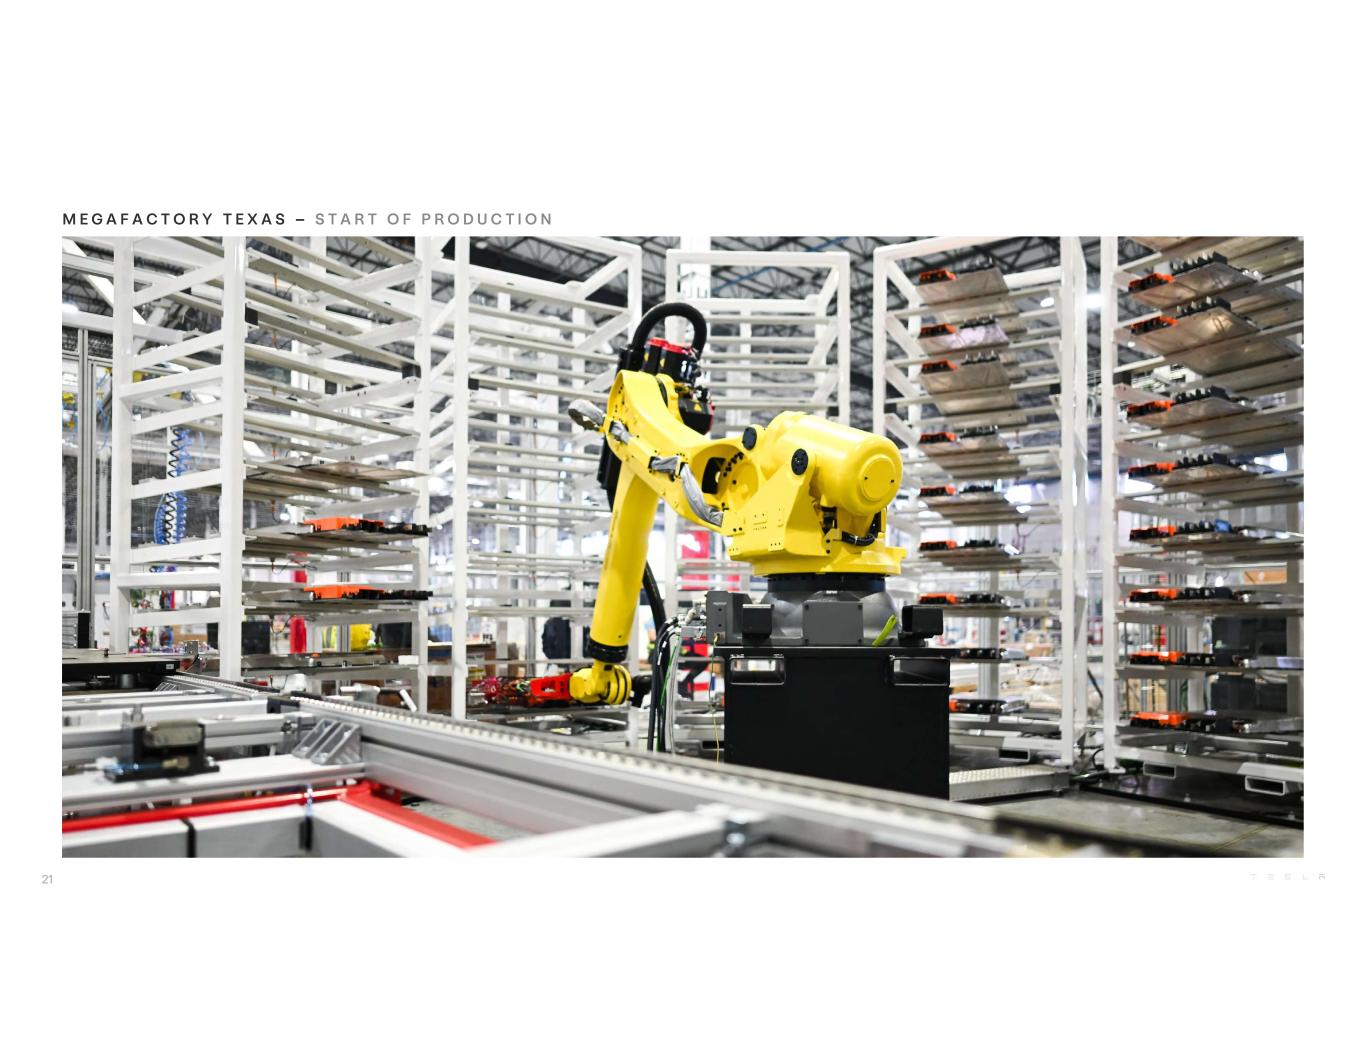
M E G A F A C T O R Y T E X A S – S T A R T O F P R O D U C T I O N 21
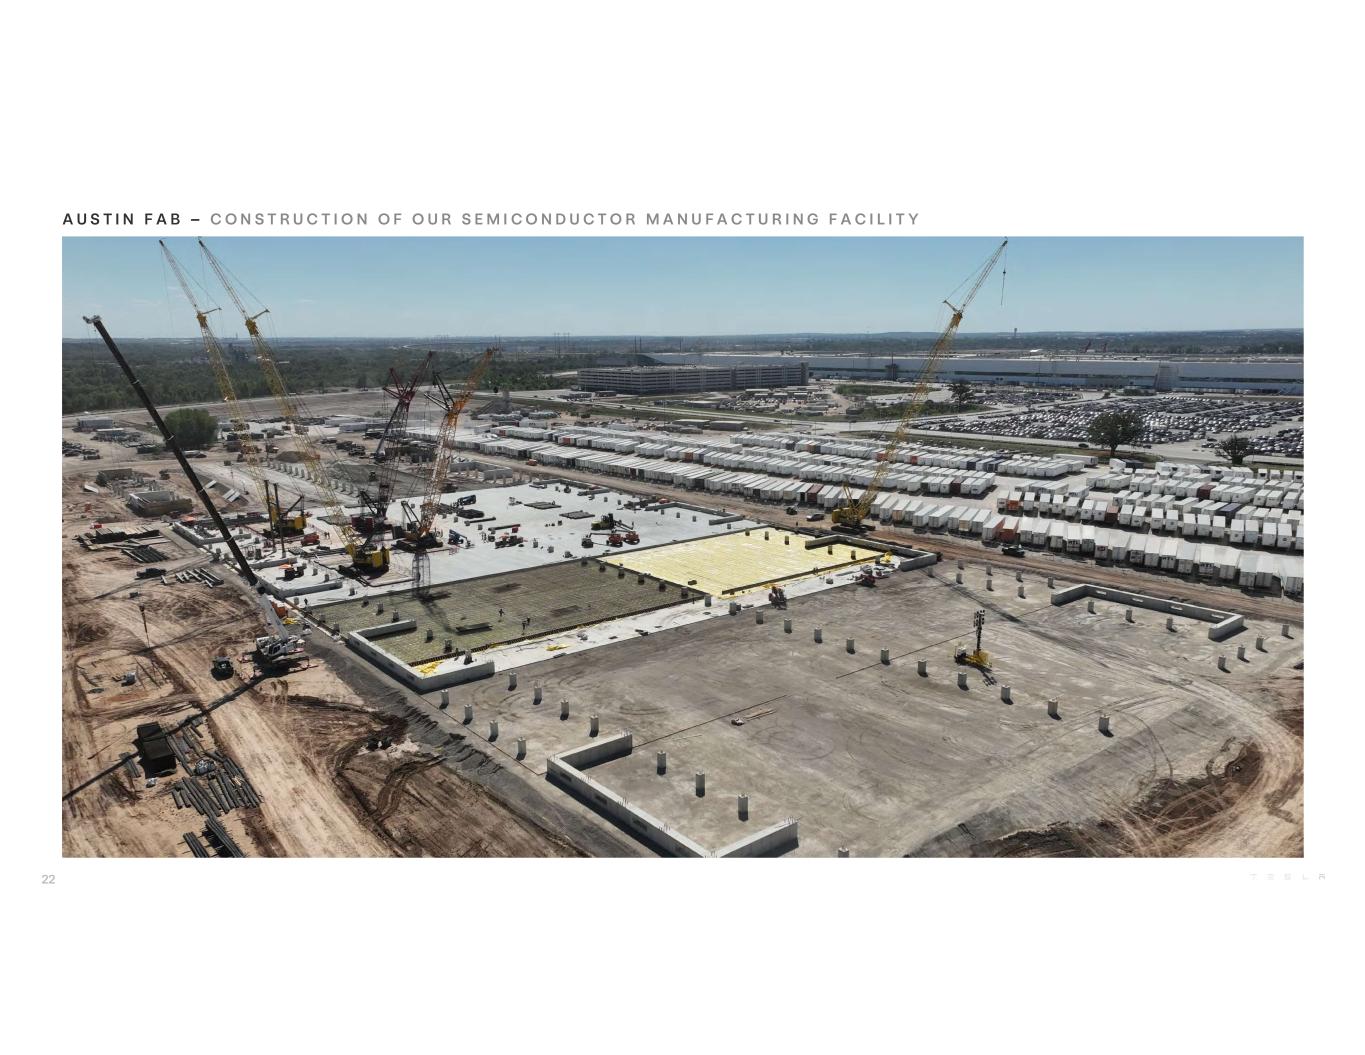
A U S T I N F A B – C O N S T R U C T I O N O F O U R S E M I C O N D U C T O R M A N U F A C T U R I N G F A C I L I T Y 22
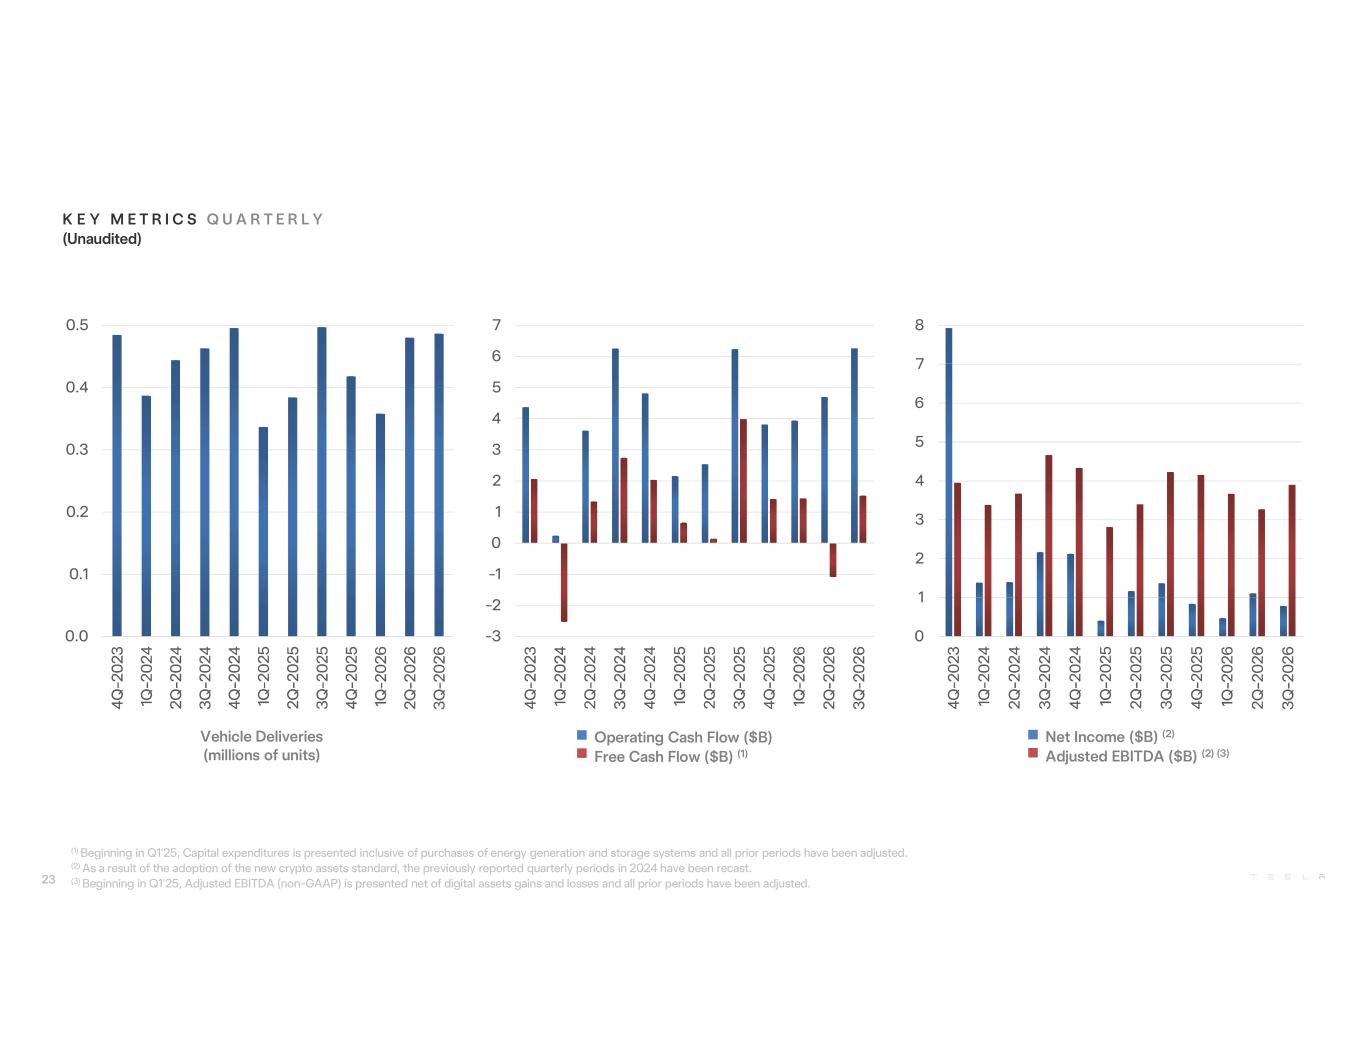
Vehicle Deliveries (millions of units) K E Y M E T R I C S Q U A R T E R L Y (Unaudited) Operating Cash Flow ($B) Free Cash Flow ($B) (1) Net Income ($B) (2) Adjusted EBITDA ($B) (2) (3) 23 (1) Beginning in Q1'25, Capital expenditures is presented inclusive of purchases of energy generation and storage systems and all prior periods have been adjusted. (2) As a result of the adoption of the new crypto assets standard, the previously reported quarterly periods in 2024 have been recast. (3) Beginning in Q1'25, Adjusted EBITDA (non-GAAP) is presented net of digital assets gains and losses and all prior periods have been adjusted. 0.0 0.1 0.2 0.3 0.4 0.5 -3 -2 -1 0 1 2 3 4 5 6 7 0 1 2 3 4 5 6 7 8
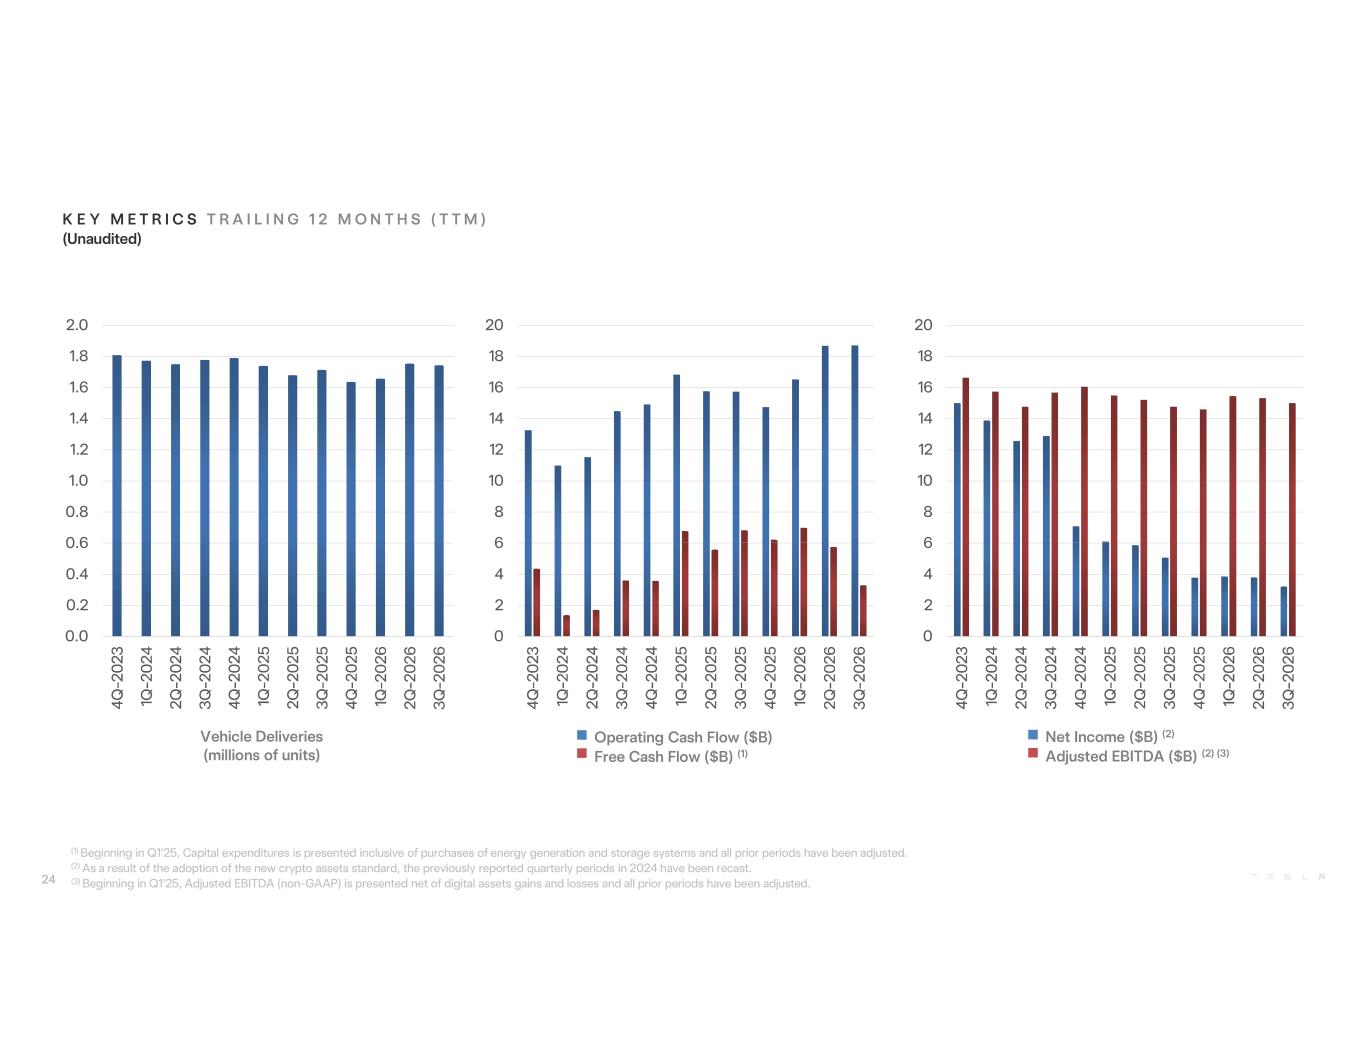
Operating Cash Flow ($B) Free Cash Flow ($B) (1) K E Y M E T R I C S T R A I L I N G 1 2 M O N T H S ( T T M ) (Unaudited) Net Income ($B) (2) Adjusted EBITDA ($B) (2) (3) Vehicle Deliveries (millions of units) 24 (1) Beginning in Q1'25, Capital expenditures is presented inclusive of purchases of energy generation and storage systems and all prior periods have been adjusted. (2) As a result of the adoption of the new crypto assets standard, the previously reported quarterly periods in 2024 have been recast. (3) Beginning in Q1'25, Adjusted EBITDA (non-GAAP) is presented net of digital assets gains and losses and all prior periods have been adjusted. 0.0 0.2 0.4 0.6 0.8 1.0 1.2 1.4 1.6 1.8 2.0 0 2 4 6 8 10 12 14 16 18 20 0 2 4 6 8 10 12 14 16 18 20
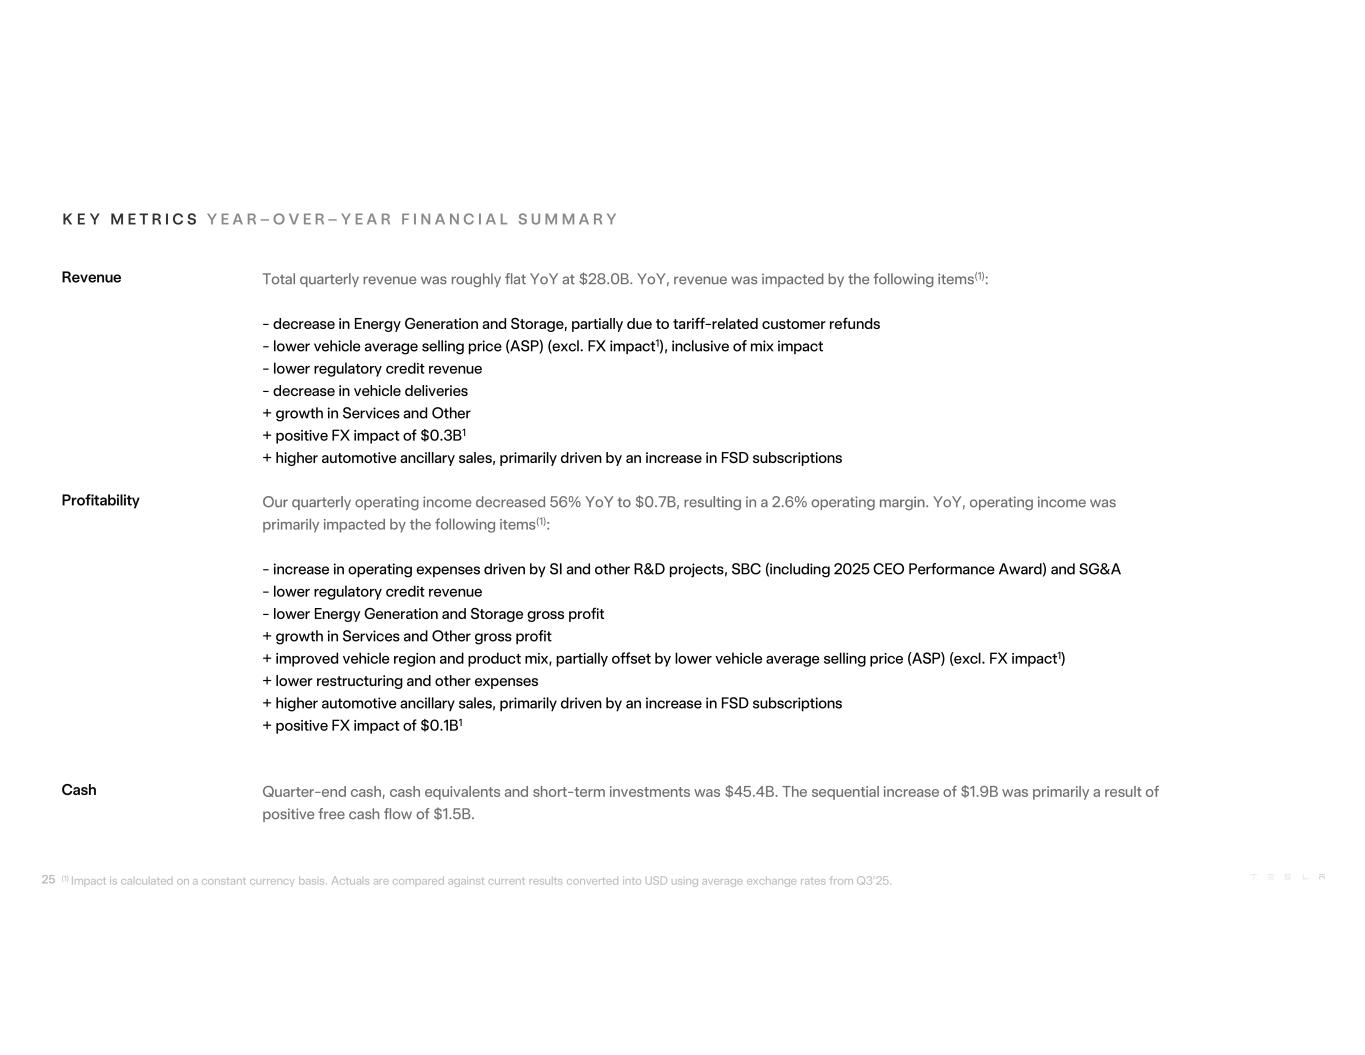
Revenue Total quarterly revenue was roughly flat YoY at $28.0B. YoY, revenue was impacted by the following items(1): - decrease in Energy Generation and Storage, partially due to tariff-related customer refunds - lower vehicle average selling price (ASP) (excl. FX impact1), inclusive of mix impact - lower regulatory credit revenue - decrease in vehicle deliveries + growth in Services and Other + positive FX impact of $0.3B1 + higher automotive ancillary sales, primarily driven by an increase in FSD subscriptions Profitability YoY, operating income was primarily impacted by the following items(1): - increase in operating expenses driven by SI and other R&D projects, SBC (including 2025 CEO Performance Award) and SG&A - lower regulatory credit revenue - lower Energy Generation and Storage gross profit + growth in Services and Other gross profit + improved vehicle region and product mix, partially offset by lower vehicle average selling price (ASP) (excl. FX impact1) + lower restructuring and other expenses + higher automotive ancillary sales, primarily driven by an increase in FSD subscriptions + positive FX impact of $0.1B1 Cash Quarter-end cash, cash equivalents and short-term investments was $45.4B. The sequential increase of $1.9B was primarily a result of positive free cash flow of $1.5B. 25 (1) Impact is calculated on a constant currency basis. Actuals are compared against current results converted into USD using average exchange rates from Q3’25. K E Y M E T R I C S Y E A R – O V E R – Y E A R F I N A N C I A L S U M M A R Y

F I N A N C I A L S T A T E M E N T S
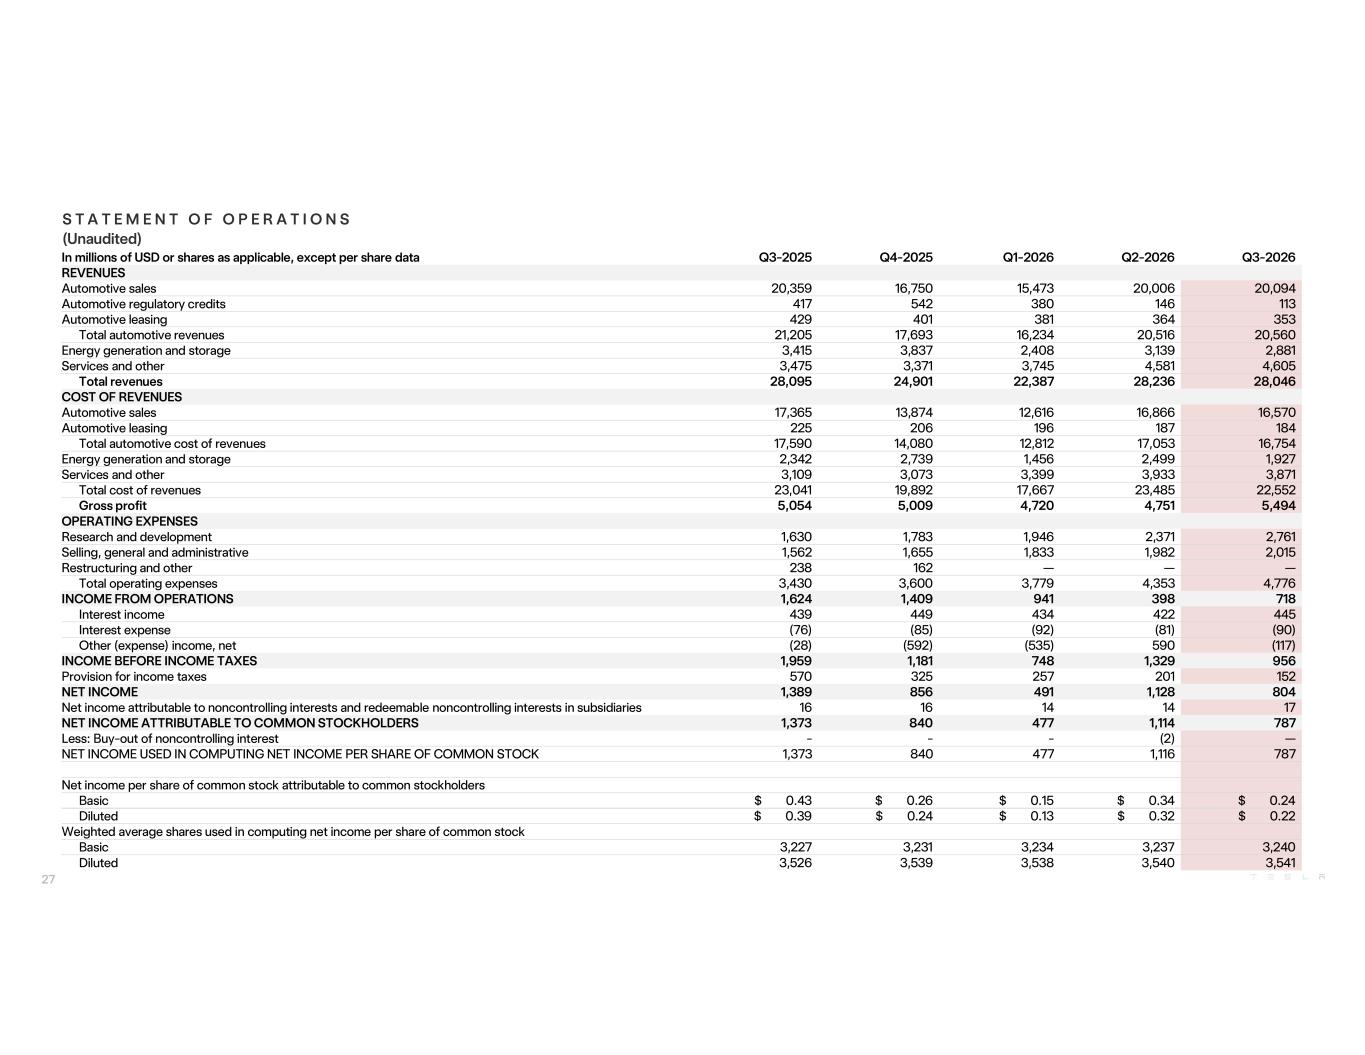
In millions of USD or shares as applicable, except per share data Q3-2025 Q4-2025 Q1-2026 Q2-2026 Q3-2026 REVENUES Automotive sales 20,359 16,750 15,473 20,006 20,094 Automotive regulatory credits 417 542 380 146 113 Automotive leasing 429 401 381 364 353 Total automotive revenues 21,205 17,693 16,234 20,516 20,560 Energy generation and storage 3,415 3,837 2,408 3,139 2,881 Services and other 3,475 3,371 3,745 4,581 4,605 Total revenues 28,095 24,901 22,387 28,236 28,046 COST OF REVENUES Automotive sales 17,365 13,874 12,616 16,866 16,570 Automotive leasing 225 206 196 187 184 Total automotive cost of revenues 17,590 14,080 12,812 17,053 16,754 Energy generation and storage 2,342 2,739 1,456 2,499 1,927 Services and other 3,109 3,073 3,399 3,933 3,871 Total cost of revenues 23,041 19,892 17,667 23,485 22,552 Gross profit 5,054 5,009 4,720 4,751 5,494 OPERATING EXPENSES Research and development 1,630 1,783 1,946 2,371 2,761 Selling, general and administrative 1,562 1,655 1,833 1,982 2,015 Restructuring and other 238 162 — — — Total operating expenses 3,430 3,600 3,779 4,353 4,776 INCOME FROM OPERATIONS 1,624 1,409 941 398 718 Interest income 439 449 434 422 445 Interest expense (76) (85) (92) (81) (90) Other (expense) income, net (28) (592) (535) 590 (117) INCOME BEFORE INCOME TAXES 1,959 1,181 748 1,329 956 Provision for income taxes 570 325 257 201 152 NET INCOME 1,389 856 491 1,128 804 Net income attributable to noncontrolling interests and redeemable noncontrolling interests in subsidiaries 16 16 14 14 17 NET INCOME ATTRIBUTABLE TO COMMON STOCKHOLDERS 1,373 840 477 1,114 787 Less: Buy-out of noncontrolling interest - - - (2) — NET INCOME USED IN COMPUTING NET INCOME PER SHARE OF COMMON STOCK 1,373 840 477 1,116 787 Net income per share of common stock attributable to common stockholders Basic $ 0.43 $ 0.26 $ 0.15 $ 0.34 $ 0.24 Diluted $ 0.39 $ 0.24 $ 0.13 $ 0.32 $ 0.22 Weighted average shares used in computing net income per share of common stock Basic 3,227 3,231 3,234 3,237 3,240 Diluted 3,526 3,539 3,538 3,540 3,541 S T A T E M E N T O F O P E R A T I O N S (Unaudited) 27
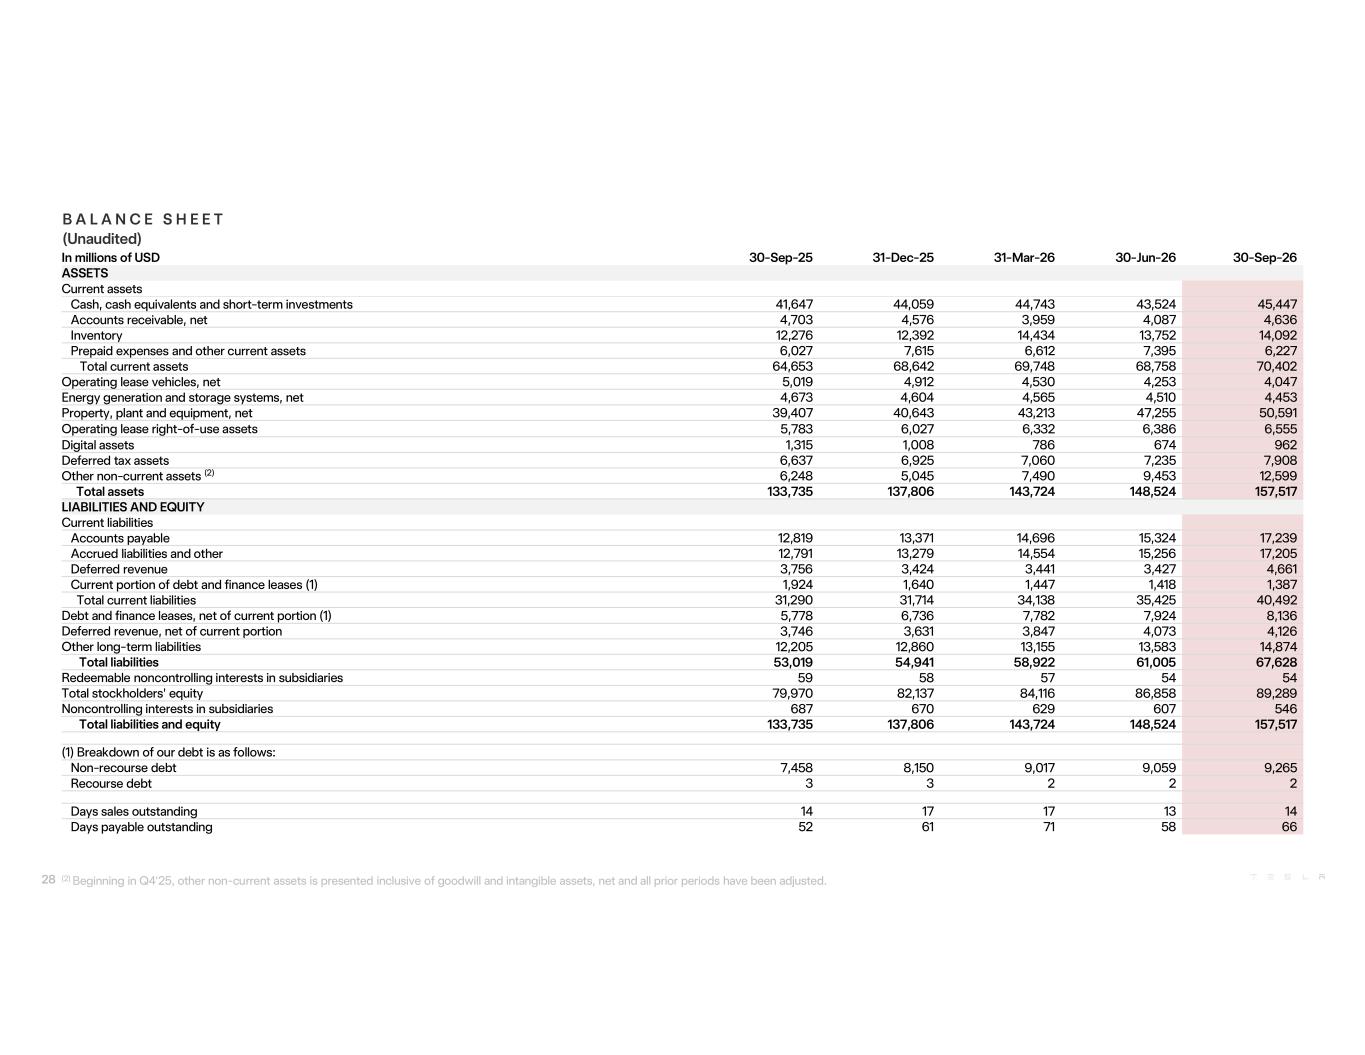
B A L A N C E S H E E T (Unaudited) In millions of USD 30-Sep-25 31-Dec-25 31-Mar-26 30-Jun-26 30-Sep-26 ASSETS Current assets Cash, cash equivalents and short-term investments 41,647 44,059 44,743 43,524 45,447 Accounts receivable, net 4,703 4,576 3,959 4,087 4,636 Inventory 12,276 12,392 14,434 13,752 14,092 Prepaid expenses and other current assets 6,027 7,615 6,612 7,395 6,227 Total current assets 64,653 68,642 69,748 68,758 70,402 Operating lease vehicles, net 5,019 4,912 4,530 4,253 4,047 Energy generation and storage systems, net 4,673 4,604 4,565 4,510 4,453 Property, plant and equipment, net 39,407 40,643 43,213 47,255 50,591 Operating lease right-of-use assets 5,783 6,027 6,332 6,386 6,555 Digital assets 1,315 1,008 786 674 962 Deferred tax assets 6,637 6,925 7,060 7,235 7,908 Other non-current assets (2) 6,248 5,045 7,490 9,453 12,599 Total assets 133,735 137,806 143,724 148,524 157,517 LIABILITIES AND EQUITY Current liabilities Accounts payable 12,819 13,371 14,696 15,324 17,239 Accrued liabilities and other 12,791 13,279 14,554 15,256 17,205 Deferred revenue 3,756 3,424 3,441 3,427 4,661 Current portion of debt and finance leases (1) 1,924 1,640 1,447 1,418 1,387 Total current liabilities 31,290 31,714 34,138 35,425 40,492 Debt and finance leases, net of current portion (1) 5,778 6,736 7,782 7,924 8,136 Deferred revenue, net of current portion 3,746 3,631 3,847 4,073 4,126 Other long-term liabilities 12,205 12,860 13,155 13,583 14,874 Total liabilities 53,019 54,941 58,922 61,005 67,628 Redeemable noncontrolling interests in subsidiaries 59 58 57 54 54 Total stockholders' equity 79,970 82,137 84,116 86,858 89,289 Noncontrolling interests in subsidiaries 687 670 629 607 546 Total liabilities and equity 133,735 137,806 143,724 148,524 157,517 (1) Breakdown of our debt is as follows: Non-recourse debt 7,458 8,150 9,017 9,059 9,265 Recourse debt 3 3 2 2 2 Days sales outstanding 14 17 17 13 14 Days payable outstanding 52 61 71 58 66 28 (2) Beginning in Q4'25, other non-current assets is presented inclusive of goodwill and intangible assets, net and all prior periods have been adjusted.
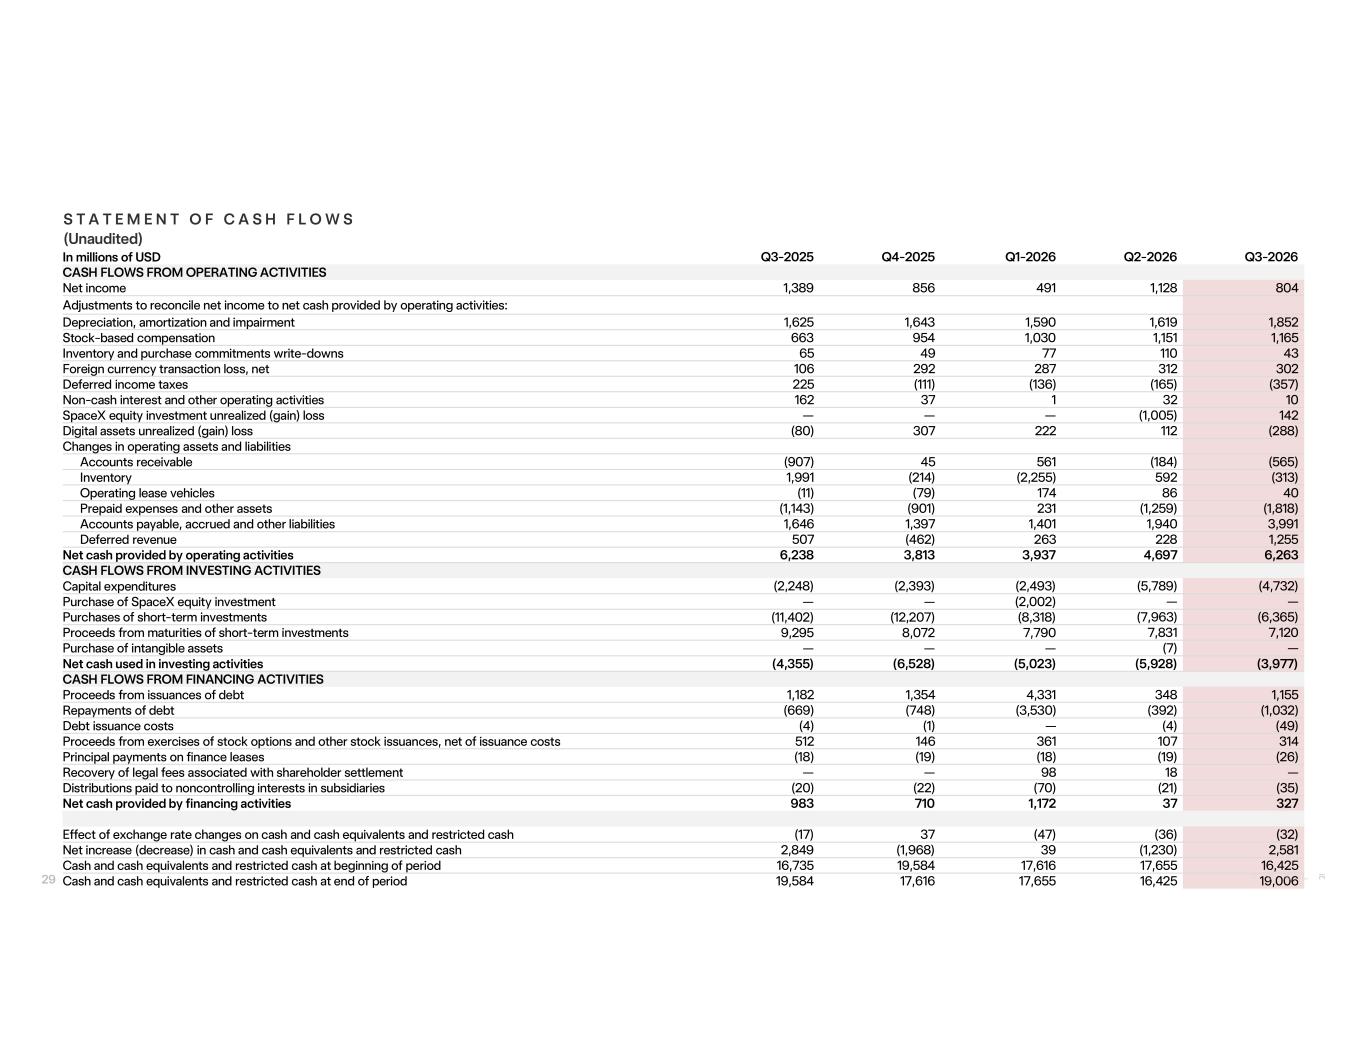
In millions of USD Q3-2025 Q4-2025 Q1-2026 Q2-2026 Q3-2026 CASH FLOWS FROM OPERATING ACTIVITIES Net income 1,389 856 491 1,128 804 Adjustments to reconcile net income to net cash provided by operating activities: Depreciation, amortization and impairment 1,625 1,643 1,590 1,619 1,852 Stock-based compensation 663 954 1,030 1,151 1,165 Inventory and purchase commitments write-downs 65 49 77 110 43 Foreign currency transaction loss, net 106 292 287 312 302 Deferred income taxes 225 (111) (136) (165) (357) Non-cash interest and other operating activities 162 37 1 32 10 SpaceX equity investment unrealized (gain) loss — — — (1,005) 142 Digital assets unrealized (gain) loss (80) 307 222 112 (288) Changes in operating assets and liabilities Accounts receivable (907) 45 561 (184) (565) Inventory 1,991 (214) (2,255) 592 (313) Operating lease vehicles (11) (79) 174 86 40 Prepaid expenses and other assets (1,143) (901) 231 (1,259) (1,818) Accounts payable, accrued and other liabilities 1,646 1,397 1,401 1,940 3,991 Deferred revenue 507 (462) 263 228 1,255 Net cash provided by operating activities 6,238 3,813 3,937 4,697 6,263 CASH FLOWS FROM INVESTING ACTIVITIES Capital expenditures (2,248) (2,393) (2,493) (5,789) (4,732) Purchase of SpaceX equity investment — — (2,002) — — Purchases of short-term investments (11,402) (12,207) (8,318) (7,963) (6,365) Proceeds from maturities of short-term investments 9,295 8,072 7,790 7,831 7,120 Purchase of intangible assets — — — (7) — Net cash used in investing activities (4,355) (6,528) (5,023) (5,928) (3,977) CASH FLOWS FROM FINANCING ACTIVITIES Proceeds from issuances of debt 1,182 1,354 4,331 348 1,155 Repayments of debt (669) (748) (3,530) (392) (1,032) Debt issuance costs (4) (1) — (4) (49) Proceeds from exercises of stock options and other stock issuances, net of issuance costs 512 146 361 107 314 Principal payments on finance leases (18) (19) (18) (19) (26) Recovery of legal fees associated with shareholder settlement — — 98 18 — Distributions paid to noncontrolling interests in subsidiaries (20) (22) (70) (21) (35) Net cash provided by financing activities 983 710 1,172 37 327 Effect of exchange rate changes on cash and cash equivalents and restricted cash (17) 37 (47) (36) (32) Net increase (decrease) in cash and cash equivalents and restricted cash 2,849 (1,968) 39 (1,230) 2,581 Cash and cash equivalents and restricted cash at beginning of period 16,735 19,584 17,616 17,655 16,425 Cash and cash equivalents and restricted cash at end of period 19,584 17,616 17,655 16,425 19,006 S T A T E M E N T O F C A S H F L O W S (Unaudited) 29
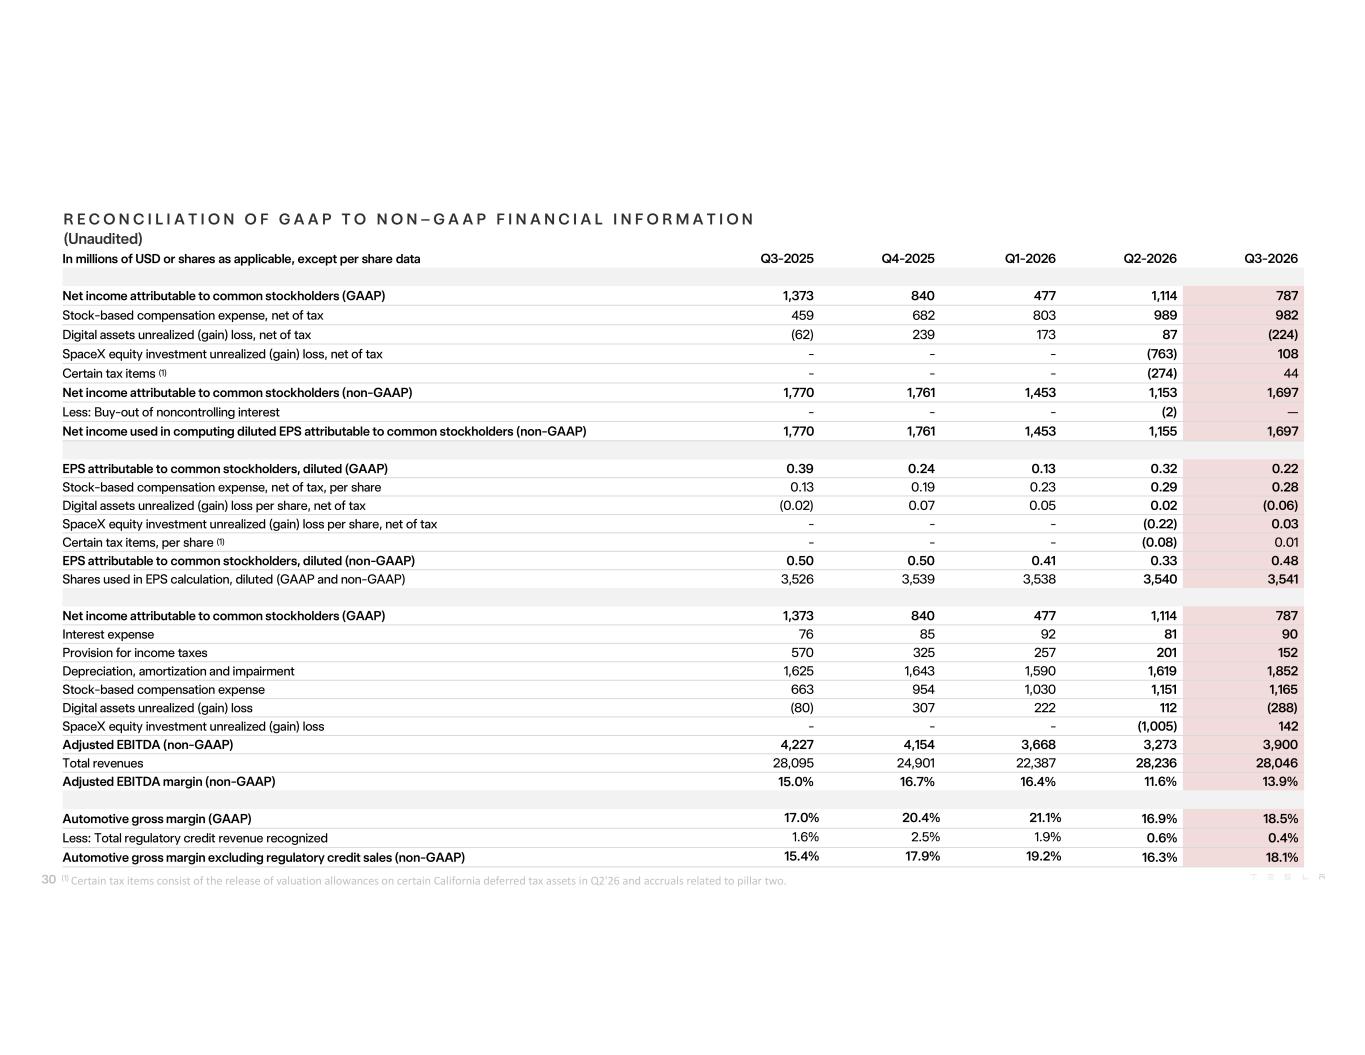
In millions of USD or shares as applicable, except per share data Q3-2025 Q4-2025 Q1-2026 Q2-2026 Q3-2026 Net income attributable to common stockholders (GAAP) 1,373 840 477 1,114 787 Stock-based compensation expense, net of tax 459 682 803 989 982 Digital assets unrealized (gain) loss, net of tax (62) 239 173 87 (224) SpaceX equity investment unrealized (gain) loss, net of tax - - - (763) 108 Certain tax items (1) - - - (274) 44 Net income attributable to common stockholders (non-GAAP) 1,770 1,761 1,453 1,153 1,697 Less: Buy-out of noncontrolling interest - - - (2) — Net income used in computing diluted EPS attributable to common stockholders (non-GAAP) 1,770 1,761 1,453 1,155 1,697 EPS attributable to common stockholders, diluted (GAAP) 0.39 0.24 0.13 0.32 0.22 Stock-based compensation expense, net of tax, per share 0.13 0.19 0.23 0.29 0.28 Digital assets unrealized (gain) loss per share, net of tax (0.02) 0.07 0.05 0.02 (0.06) SpaceX equity investment unrealized (gain) loss per share, net of tax - - - (0.22) 0.03 Certain tax items, per share (1) - - - (0.08) 0.01 EPS attributable to common stockholders, diluted (non-GAAP) 0.50 0.50 0.41 0.33 0.48 Shares used in EPS calculation, diluted (GAAP and non-GAAP) 3,526 3,539 3,538 3,540 3,541 Net income attributable to common stockholders (GAAP) 1,373 840 477 1,114 787 Interest expense 76 85 92 81 90 Provision for income taxes 570 325 257 201 152 Depreciation, amortization and impairment 1,625 1,643 1,590 1,619 1,852 Stock-based compensation expense 663 954 1,030 1,151 1,165 Digital assets unrealized (gain) loss (80) 307 222 112 (288) SpaceX equity investment unrealized (gain) loss - - - (1,005) 142 Adjusted EBITDA (non-GAAP) 4,227 4,154 3,668 3,273 3,900 Total revenues 28,095 24,901 22,387 28,236 28,046 Adjusted EBITDA margin (non-GAAP) 15.0% 16.7% 16.4% 11.6% 13.9% Automotive gross margin (GAAP) 17.0% 20.4% 21.1% 16.9% 18.5% Less: Total regulatory credit revenue recognized 0.6% 0.4% Automotive gross margin excluding regulatory credit sales (non-GAAP) 15.4% 17.9% 19.2% 16.3% 18.1% R E C O N C I L I A T I O N O F G A A P T O N O N – G A A P F I N A N C I A L I N F O R M A T I O N (Unaudited) 30 (1) Certain tax items consist of the release of valuation allowances on certain California deferred tax assets in Q2'26 and accruals related to pillar two.
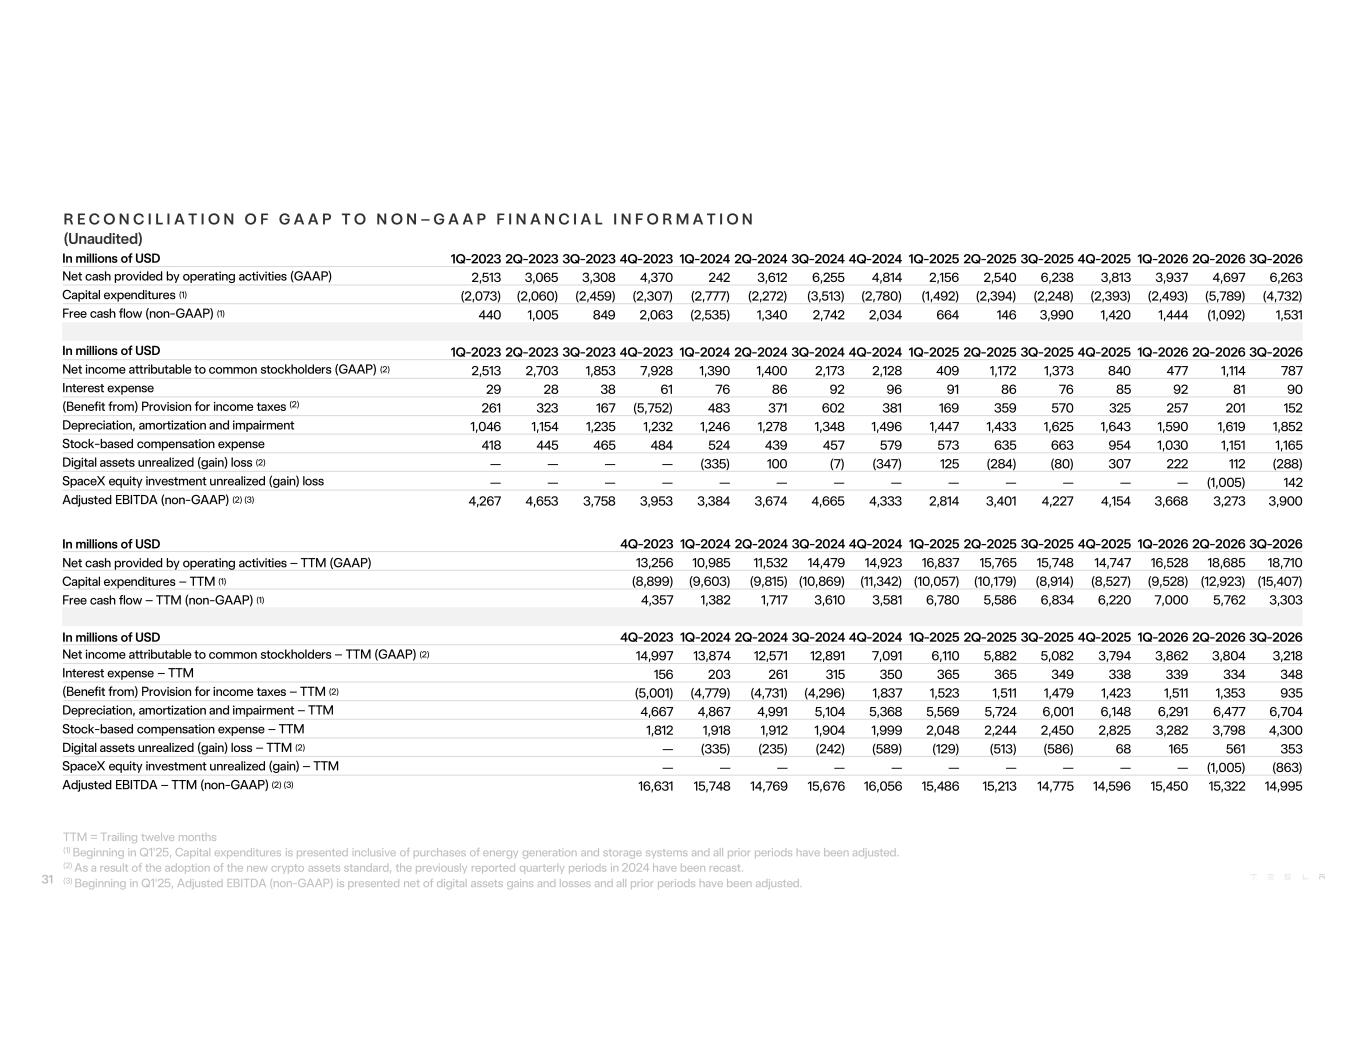
R E C O N C I L I A T I O N O F G A A P T O N O N – G A A P F I N A N C I A L I N F O R M A T I O N (Unaudited) In millions of USD 4Q-2023 1Q-2024 2Q-2024 3Q-2024 4Q-2024 1Q-2025 2Q-2025 3Q-2025 4Q-2025 1Q-2026 2Q-2026 3Q-2026 Net cash provided by operating activities – TTM (GAAP) 13,256 10,985 11,532 14,479 14,923 16,837 15,765 15,748 14,747 16,528 18,685 18,710 Capital expenditures – TTM (1) (8,899) (9,603) (9,815) (10,869) (11,342) (10,057) (10,179) (8,914) (8,527) (9,528) (12,923) (15,407) Free cash flow – TTM (non-GAAP) (1) 4,357 1,382 1,717 3,610 3,581 6,780 5,586 6,834 6,220 7,000 5,762 3,303 In millions of USD 4Q-2023 1Q-2024 2Q-2024 3Q-2024 4Q-2024 1Q-2025 2Q-2025 3Q-2025 4Q-2025 1Q-2026 2Q-2026 3Q-2026 Net income attributable to common stockholders – TTM (GAAP) (2) 14,997 13,874 12,571 12,891 7,091 6,110 5,882 5,082 3,794 3,862 3,804 3,218 Interest expense – TTM 156 203 261 315 350 365 365 349 338 339 334 348 (Benefit from) Provision for income taxes – TTM (2) (5,001) (4,779) (4,731) (4,296) 1,837 1,523 1,511 1,479 1,423 1,511 1,353 935 Depreciation, amortization and impairment – TTM 4,667 4,867 4,991 5,104 5,368 5,569 5,724 6,001 6,148 6,291 6,477 6,704 Stock-based compensation expense – TTM 1,812 1,918 1,912 1,904 1,999 2,048 2,244 2,450 2,825 3,282 3,798 4,300 Digital assets unrealized (gain) loss – TTM (2) — (335) (235) (242) (589) (129) (513) (586) 68 165 561 353 SpaceX equity investment unrealized (gain) – TTM — — — — — — — — — — (1,005) (863) Adjusted EBITDA – TTM (non-GAAP) (2) (3) 16,631 15,748 14,769 15,676 16,056 15,486 15,213 14,775 14,596 15,450 15,322 14,995 In millions of USD 1Q-2023 2Q-2023 3Q-2023 4Q-2023 1Q-2024 2Q-2024 3Q-2024 4Q-2024 1Q-2025 2Q-2025 3Q-2025 4Q-2025 1Q-2026 2Q-2026 3Q-2026 Net cash provided by operating activities (GAAP) 2,513 3,065 3,308 4,370 242 3,612 6,255 4,814 2,156 2,540 6,238 3,813 3,937 4,697 6,263 Capital expenditures (1) (2,073) (2,060) (2,459) (2,307) (2,777) (2,272) (3,513) (2,780) (1,492) (2,394) (2,248) (2,393) (2,493) (5,789) (4,732) Free cash flow (non-GAAP) (1) 440 1,005 849 2,063 (2,535) 1,340 2,742 2,034 664 146 3,990 1,420 1,444 (1,092) 1,531 In millions of USD 1Q-2023 2Q-2023 3Q-2023 4Q-2023 1Q-2024 2Q-2024 3Q-2024 4Q-2024 1Q-2025 2Q-2025 3Q-2025 4Q-2025 1Q-2026 2Q-2026 3Q-2026 Net income attributable to common stockholders (GAAP) (2) 2,513 2,703 1,853 7,928 1,390 1,400 2,173 2,128 409 1,172 1,373 840 477 1,114 787 Interest expense 29 28 38 61 76 86 92 96 91 86 76 85 92 81 90 (Benefit from) Provision for income taxes (2) 261 323 167 (5,752) 483 371 602 381 169 359 570 325 257 201 152 Depreciation, amortization and impairment 1,046 1,154 1,235 1,232 1,246 1,278 1,348 1,496 1,447 1,433 1,625 1,643 1,590 1,619 1,852 Stock-based compensation expense 418 445 465 484 524 439 457 579 573 635 663 954 1,030 1,151 1,165 Digital assets unrealized (gain) loss (2) — — — — (335) 100 (7) (347) 125 (284) (80) 307 222 112 (288) SpaceX equity investment unrealized (gain) loss — — — — — — — — — — — — — (1,005) 142 Adjusted EBITDA (non-GAAP) (2) (3) 4,267 4,653 3,758 3,953 3,384 3,674 4,665 4,333 2,814 3,401 4,227 4,154 3,668 3,273 3,900 31 TTM = Trailing twelve months (1) Beginning in Q1'25, Capital expenditures is presented inclusive of purchases of energy generation and storage systems and all prior periods have been adjusted. (2) As a result of the adoption of the new crypto assets standard, the previously reported quarterly periods in 2024 have been recast. (3) Beginning in Q1'25, Adjusted EBITDA (non-GAAP) is presented net of digital assets gains and losses and all prior periods have been adjusted.
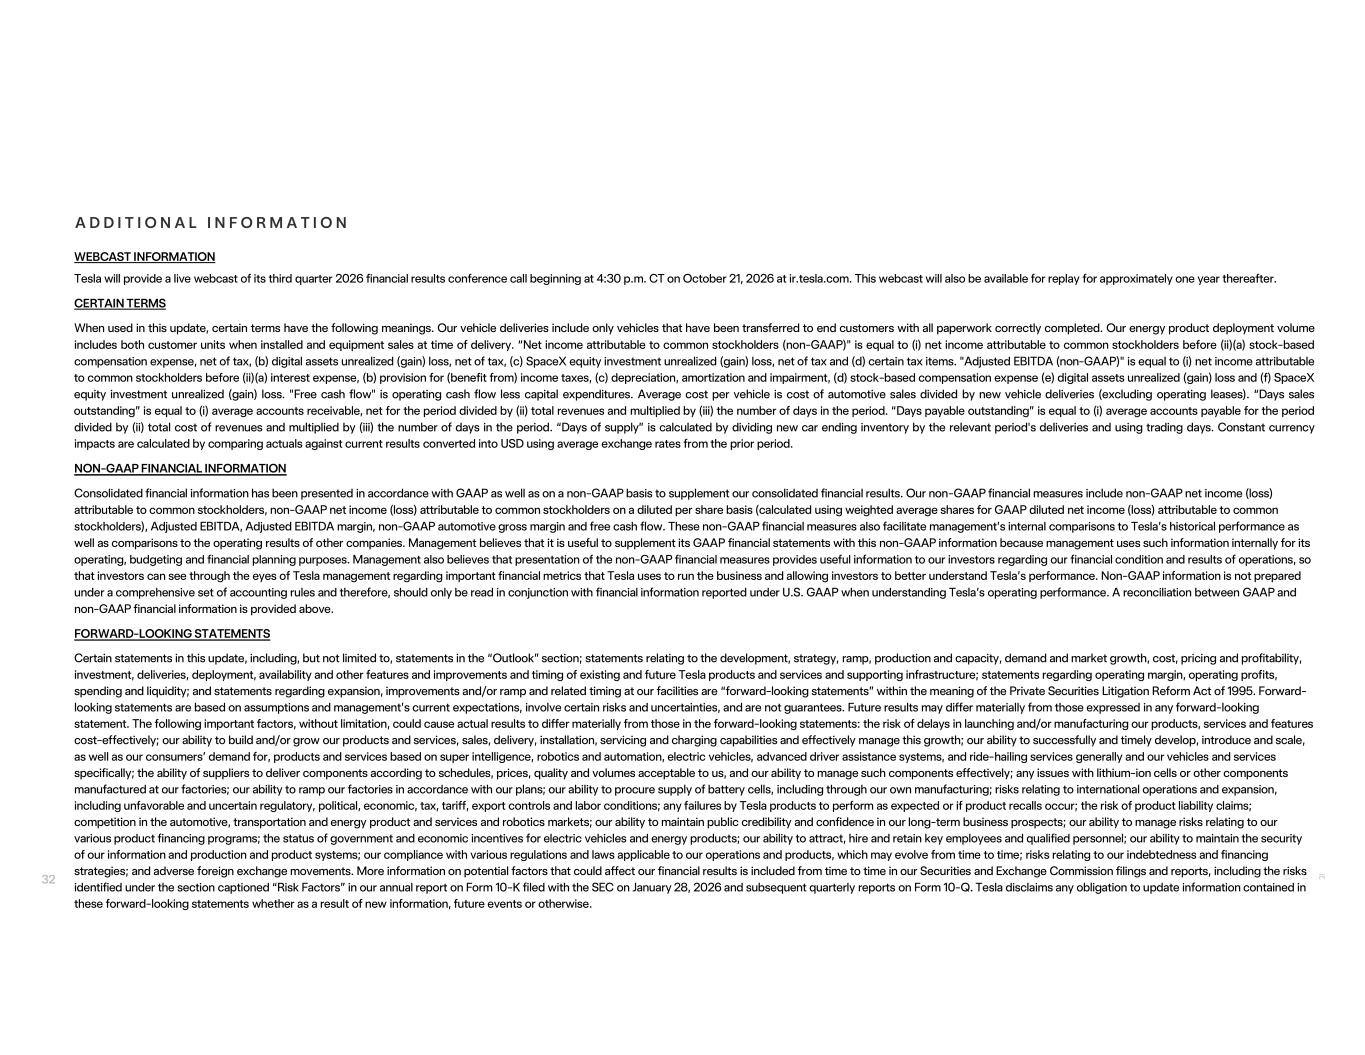
A D D I T I O N A L I N F O R M A T I O N WEBCAST INFORMATION Tesla will provide a live webcast of its third quarter 2026 financial results conference call beginning at 4:30 p.m. CT on October 21, 2026 at ir.tesla.com. This webcast will also be available for replay for approximately one year thereafter. CERTAIN TERMS When used in this update, certain terms have the following meanings. Our vehicle deliveries include only vehicles that have been transferred to end customers with all paperwork correctly completed. Our energy product deployment volume includes both customer units when installed and equipment sales at time of delivery. “Net income attributable to common stockholders (non-GAAP)" is equal to (i) net income attributable to common stockholders before (ii)(a) stock-based compensation expense, net of tax, (b) digital assets unrealized (gain) loss, net of tax, (c) SpaceX equity investment unrealized (gain) loss, net of tax and (d) certain tax items. "Adjusted EBITDA (non-GAAP)" is equal to (i) net income attributable to common stockholders before (ii)(a) interest expense, (b) provision for (benefit from) income taxes, (c) depreciation, amortization and impairment, (d) stock-based compensation expense (e) digital assets unrealized (gain) loss and (f) SpaceX equity investment unrealized (gain) loss. "Free cash flow" is operating cash flow less capital expenditures. Average cost per vehicle is cost of automotive sales divided by new vehicle deliveries (excluding operating leases). “Days sales outstanding” is equal to (i) average accounts receivable, net for the period divided by (ii) total revenues and multiplied by (iii) the number of days in the period. “Days payable outstanding” is equal to (i) average accounts payable for the period divided by (ii) total cost of revenues and multiplied by (iii) the number of days in the period. “Days of supply” is calculated by dividing new car ending inventory by the relevant period's deliveries and using trading days. Constant currency impacts are calculated by comparing actuals against current results converted into USD using average exchange rates from the prior period. NON-GAAP FINANCIAL INFORMATION Consolidated financial information has been presented in accordance with GAAP as well as on a non-GAAP basis to supplement our consolidated financial results. Our non-GAAP financial measures include non-GAAP net income (loss) attributable to common stockholders, non-GAAP net income (loss) attributable to common stockholders on a diluted per share basis (calculated using weighted average shares for GAAP diluted net income (loss) attributable to common stockholders), Adjusted EBITDA, Adjusted EBITDA margin, non-GAAP automotive gross margin and free cash flow. These non-GAAP financial measures also facilitate management’s internal comparisons to Tesla’s historical performance as well as comparisons to the operating results of other companies. Management believes that it is useful to supplement its GAAP financial statements with this non-GAAP information because management uses such information internally for its operating, budgeting and financial planning purposes. Management also believes that presentation of the non-GAAP financial measures provides useful information to our investors regarding our financial condition and results of operations, so that investors can see through the eyes of Tesla management regarding important financial metrics that Tesla uses to run the business and allowing investors to better understand Tesla’s performance. Non-GAAP information is not prepared under a comprehensive set of accounting rules and therefore, should only be read in conjunction with financial information reported under U.S. GAAP when understanding Tesla’s operating performance. A reconciliation between GAAP and non-GAAP financial information is provided above. FORWARD-LOOKING STATEMENTS Certain statements in this update, including, but not limited to, statements in the “Outlook” section; statements relating to the development, strategy, ramp, production and capacity, demand and market growth, cost, pricing and profitability, investment, deliveries, deployment, availability and other features and improvements and timing of existing and future Tesla products and services and supporting infrastructure; statements regarding operating margin, operating profits, spending and liquidity; and statements regarding expansion, improvements and/or ramp and related timing at our facilities are “forward-looking statements” within the meaning of the Private Securities Litigation Reform Act of 1995. Forward- looking statements are based on assumptions and management’s current expectations, involve certain risks and uncertainties, and are not guarantees. Future results may differ materially from those expressed in any forward-looking statement. The following important factors, without limitation, could cause actual results to differ materially from those in the forward-looking statements: the risk of delays in launching and/or manufacturing our products, services and features cost-effectively; our ability to build and/or grow our products and services, sales, delivery, installation, servicing and charging capabilities and effectively manage this growth; our ability to successfully and timely develop, introduce and scale, as well as our consumers’ demand for, products and services based on super intelligence, robotics and automation, electric vehicles, advanced driver assistance systems, and ride-hailing services generally and our vehicles and services specifically; the ability of suppliers to deliver components according to schedules, prices, quality and volumes acceptable to us, and our ability to manage such components effectively; any issues with lithium-ion cells or other components manufactured at our factories; our ability to ramp our factories in accordance with our plans; our ability to procure supply of battery cells, including through our own manufacturing; risks relating to international operations and expansion, including unfavorable and uncertain regulatory, political, economic, tax, tariff, export controls and labor conditions; any failures by Tesla products to perform as expected or if product recalls occur; the risk of product liability claims; competition in the automotive, transportation and energy product and services and robotics markets; our ability to maintain public credibility and confidence in our long-term business prospects; our ability to manage risks relating to our various product financing programs; the status of government and economic incentives for electric vehicles and energy products; our ability to attract, hire and retain key employees and qualified personnel; our ability to maintain the security of our information and production and product systems; our compliance with various regulations and laws applicable to our operations and products, which may evolve from time to time; risks relating to our indebtedness and financing strategies; and adverse foreign exchange movements. More information on potential factors that could affect our financial results is included from time to time in our Securities and Exchange Commission filings and reports, including the risks identified under the section captioned “Risk Factors” in our annual report on Form 10-K filed with the SEC on January 28, 2026 and subsequent quarterly reports on Form 10-Q. Tesla disclaims any obligation to update information contained in these forward-looking statements whether as a result of new information, future events or otherwise. 32