
T h i r d Q u a r t e r 2 0 2 6 Since 1890
Disclosure Statement 1 This presentation includes forward-looking statements. These statements include descriptions of management’s plans, objectives or goals for future operations, products or services, forecast of financial or other performance measures and statements about Banner’s general outlook for economic and other conditions. Additional forward-looking statements may be made in the question-and-answer period following the presentation. These forward-looking statements are subject to several risks and uncertainties and actual results may differ materially from those discussed today. Information on the risk factors that could cause actual results to differ are available from the earnings press release that was released October 21, 2026 as well as the Form 10-K for the year ended December 31, 2025 and Forms 10-Q filed quarterly thereafter. Forward-looking statements are effective only as of the date they are made, and Banner assumes no obligation to update information concerning its expectations.
Third quarter 2026 highlights 2 • Net income of $47.7 million, compared to $48.9 million for the prior quarter • Completed the acquisition of Pacific Financial Corporation, the holding company of Bank of the Pacific, adding $766 million in total loans and $1.14 billion in deposits • Organic loan growth of $235 million quarter-over-quarter (8% annualized) • Total loan originations (excluding HFS) were $1.28 billion • Organic deposit growth of $463 million quarter-over-quarter (13% annualized) • Net interest margin (tax equivalent) increased by 1 basis points to 4.14% • Efficiency ratio (GAAP) was 65.25%, compared to 62.80% in the prior quarter; adjusted, non- GAAP efficiency ratio was 59.53% compared to 61.30% in the prior quarter • Return on average assets of 1.11%, and return on average tangible common equity of 11.58%, compared to 1.20% and 12.27%, respectively, for the prior quarter • $1.8 million provision for credit losses - loans and $1.0 million provision for credit losses - unfunded commitments; Allowance for credit losses – loans was 1.32% of total loans • Non-performing assets remained low at 0.35% of total assets, down 1 basis point from last quarter • Repurchased 200,000 shares of Banner common stock at an average price of $71.03 per share • Announced cash dividend to $0.52 per share to be paid in November 2026
Building value at Banner Building value for stakeholders … by focusing on core banking competency … that is sustainable through change events … and scalable with acquisition growth Banner Corporation Assets $18.1B Deposits $15.4B Loans $13.0B Offices 153 Employees 2,084 3 Acquisition History Assets Deposits Loans Offices Bank of the Pacific 2026 Q3 $1.3B $1.1B $0.8B 18 AltaPacific Bank 2019 Q4 $0.4B $0.3B $0.3B 6 Skagit Bank 2018 Q4 $0.9B $0.8B $0.6B 11 AmericanWest Bank 2015 Q4 $4.5B $3.6B $3.0B 98 Siuslaw Bank 2015 Q1 $0.4B $0.3B $0.2B 10 SW Oregon Branches 2014 Q2 $0.2B $0.2B $0.1B 6
Building value at Banner Growing with … Scale in attractive markets Low-cost deposit franchise Commercially focused loan portfolio Conservative balance sheet Financially appealing opportunity Pacific Financial Corp Assets $ 1.3B Deposits $ 1.1B Loans $ 0.8B Offices 18 4 Transaction closed September 1, 2026. Core conversion and systems integration planned for November.
Building value at Banner Core banking competency Growing revenue Protecting net interest margin Spending carefully Maintaining a moderate risk profile Employing capital wisely Growing revenue Take advantage of ideal geography Offer super community bank value proposition Guard and improve reputation Grow market share 5
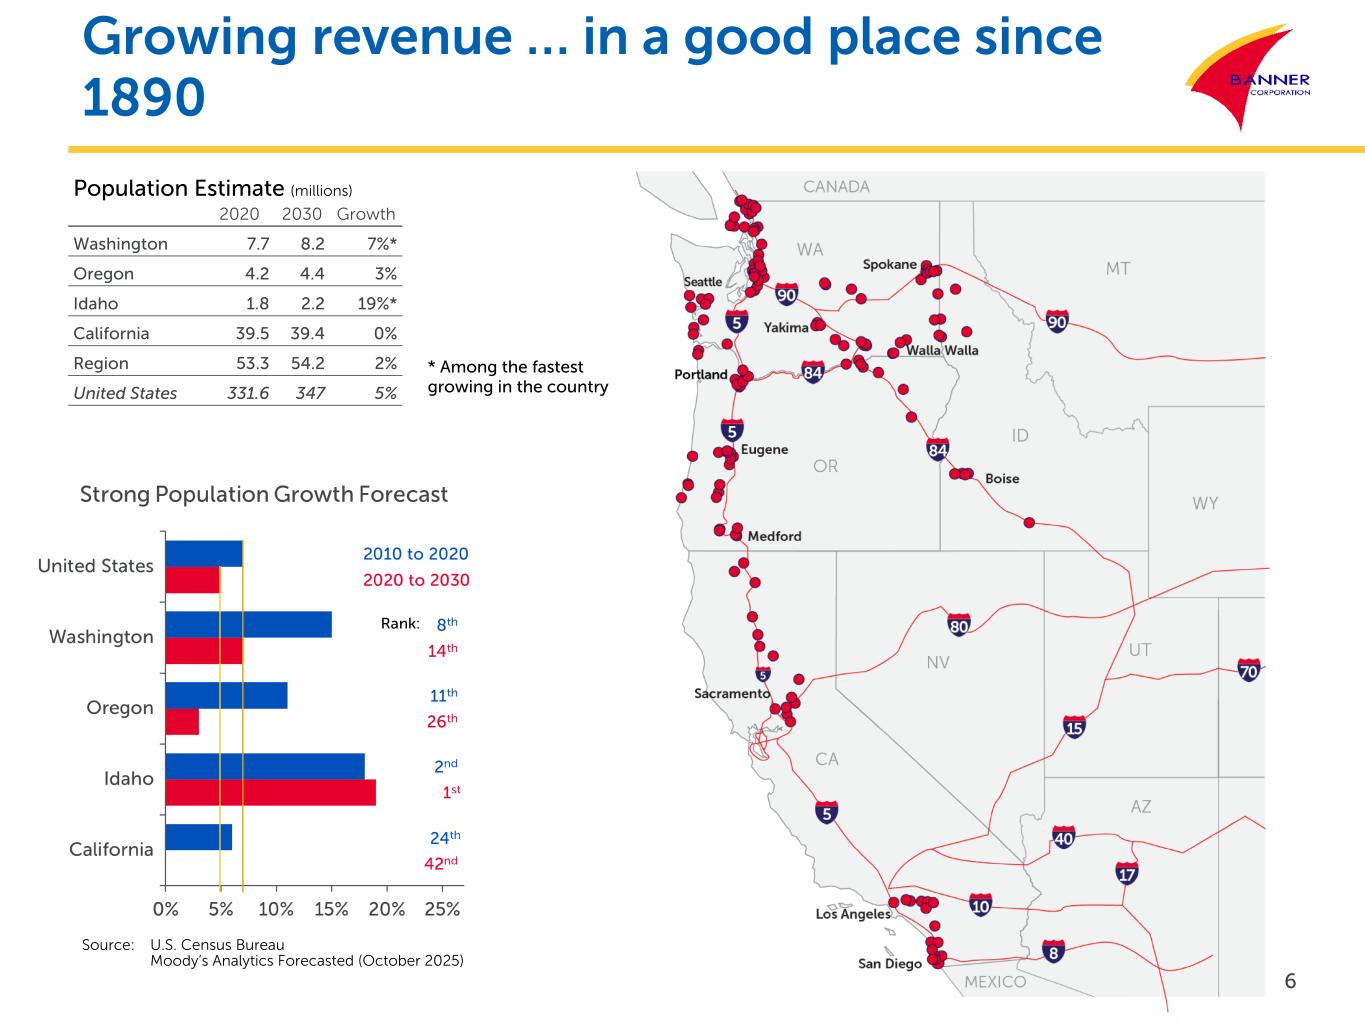
Growing revenue … in a good place since 1890 6 Source: U.S. Census Bureau Moody’s Analytics Forecasted (October 2025) Population Estimate (millions) 2020 2030 Growth Washington 7.7 8.2 7%* Oregon 4.2 4.4 3% Idaho 1.8 2.2 19%* California 39.5 39.4 0% Region 53.3 54.2 2% United States 331.6 347 5% * Among the fastest growing in the country
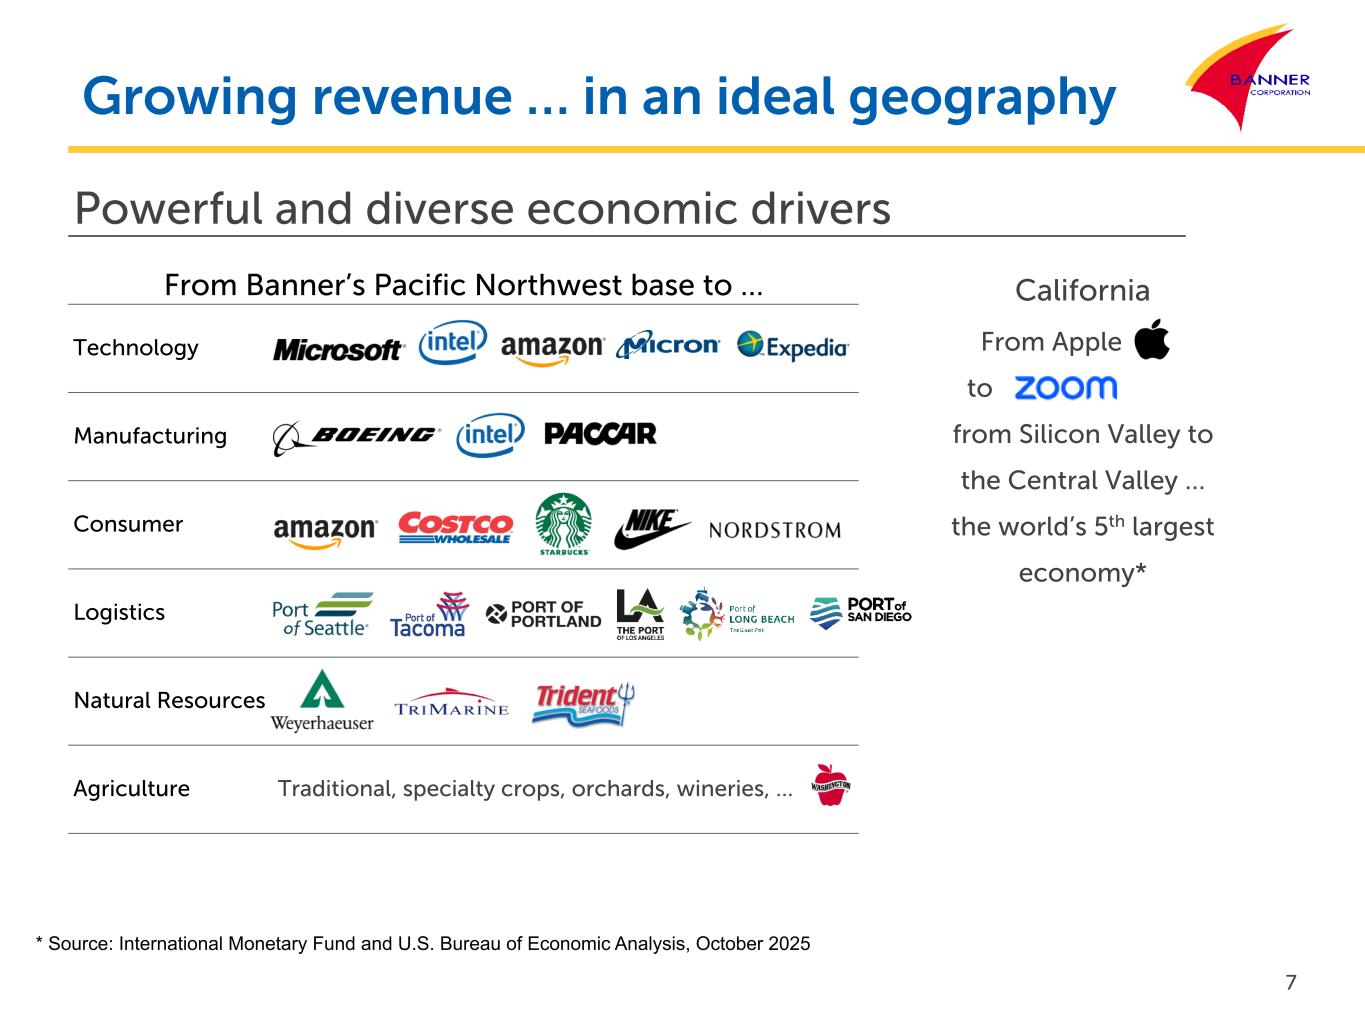
Growing revenue … in an ideal geography Powerful and diverse economic drivers From Banner’s Pacific Northwest base to … Technology Manufacturing Consumer Logistics Natural Resources Agriculture Traditional, specialty crops, orchards, wineries, … California From Apple to from Silicon Valley to the Central Valley … the world’s 5th largest economy* 7 * Source: International Monetary Fund and U.S. Bureau of Economic Analysis, October 2025
Growing revenue Our super community bank value proposition Broad product offerings serving middle market, small business and consumer client base Decision-making as close to client as possible Delivery channels aligned to maximize tactical execution of strategic plan Community investment 8
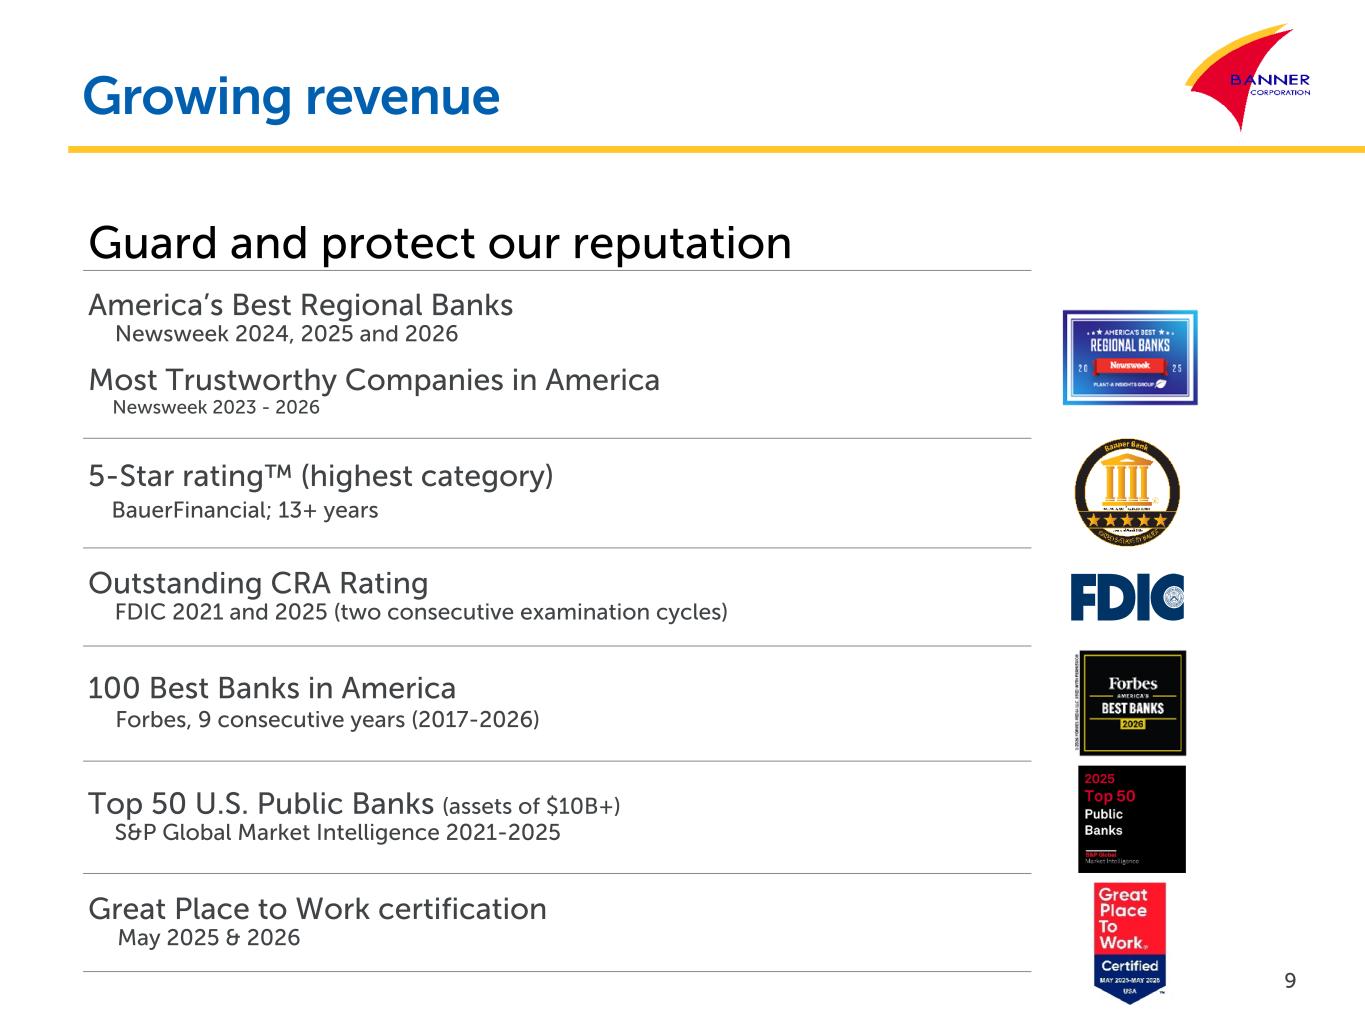
Growing revenue Guard and protect our reputation America’s Best Regional Banks Newsweek 2024, 2025 and 2026 Most Trustworthy Companies in America Newsweek 2023 - 2026 5-Star rating™ (highest category) BauerFinancial; 13+ years Outstanding CRA Rating FDIC 2021 and 2025 (two consecutive examination cycles) 100 Best Banks in America Forbes, 9 consecutive years (2017-2026) Top 50 U.S. Public Banks (assets of $10B+) S&P Global Market Intelligence 2021-2025 Great Place to Work certification May 2025 & 2026 9
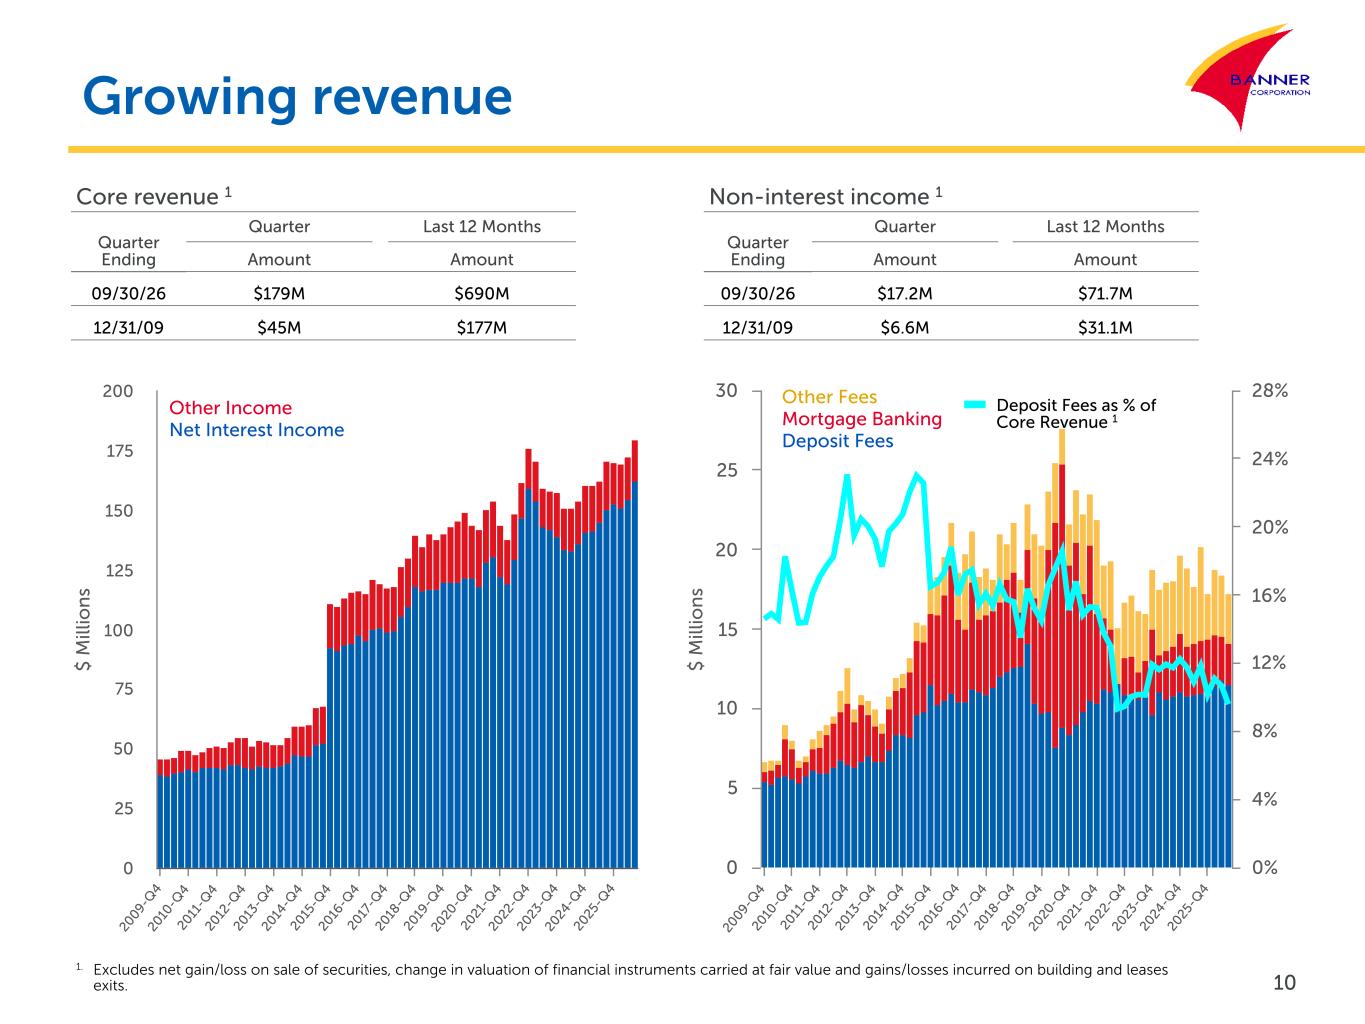
$ M ill io n s 20 09- Q 4 20 10 -Q 4 20 11 -Q 4 20 12 -Q 4 20 13 -Q 4 20 14 -Q 4 20 15 -Q 4 20 16 -Q 4 20 17 -Q 4 20 18 -Q 4 20 19 -Q 4 20 20 -Q 4 20 21 -Q 4 20 22 -Q 4 20 23 -Q 4 20 24 -Q 4 20 25 -Q 4 0 5 10 15 20 25 30 0% 4% 8% 12% 16% 20% 24% 28% $ M ill io n s 20 09- Q 4 20 10 -Q 4 20 11 -Q 4 20 12 -Q 4 20 13 -Q 4 20 14 -Q 4 20 15 -Q 4 20 16 -Q 4 20 17 -Q 4 20 18 -Q 4 20 19 -Q 4 20 20 -Q 4 20 21 -Q 4 20 22 -Q 4 20 23 -Q 4 20 24 -Q 4 20 25 -Q 4 0 25 50 75 100 125 150 175 200 Growing revenue Deposit Fees as % of Core Revenue 1 Other Fees Mortgage Banking Deposit Fees 10 1. Excludes net gain/loss on sale of securities, change in valuation of financial instruments carried at fair value and gains/losses incurred on building and leases exits. Core revenue 1 Quarter Ending Quarter Last 12 Months Amount Amount 09/30/26 $179M $690M 12/31/09 $45M $177M Non-interest income 1 Quarter Ending Quarter Last 12 Months Amount Amount 09/30/26 $17.2M $71.7M 12/31/09 $6.6M $31.1M Other Income Net Interest Income
Building value at Banner Core banking competency Growing revenue Protecting net interest margin Spending carefully Maintaining a moderate risk profile Employing capital wisely Protecting net interest margin Improve earning asset mix Improve funding mix Reduce deposit costs Maintain loan-to-deposit ratio 11
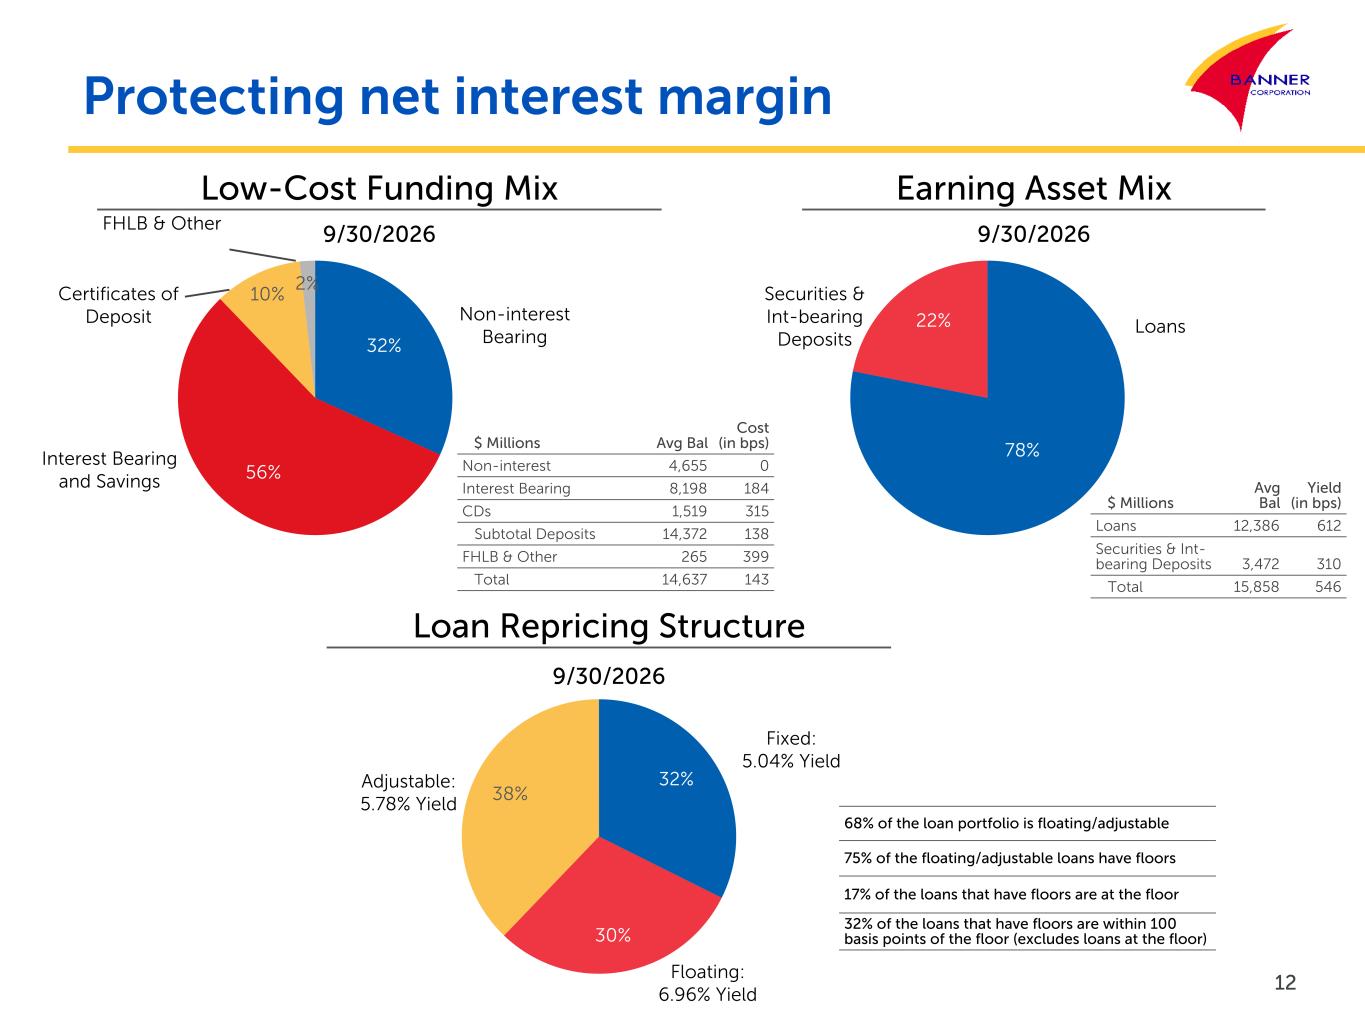
Protecting net interest margin $ Millions Avg Bal Cost (in bps) Non-interest 4,655 0 Interest Bearing 8,198 184 CDs 1,519 315 Subtotal Deposits 14,372 138 FHLB & Other 265 399 Total 14,637 143 12 32% 56% 10% 2% 78% 22% 32% 30% 38% Non-interest Bearing Certificates of Deposit Interest Bearing and Savings Securities & Int-bearing Deposits Loans Fixed: 5.04% Yield Floating: 6.96% Yield Low-Cost Funding Mix 9/30/2026 Adjustable: 5.78% Yield Earning Asset Mix 9/30/2026 Loan Repricing Structure 9/30/2026 $ Millions Avg Bal Yield (in bps) Loans 12,386 612 Securities & Int- bearing Deposits 3,472 310 Total 15,858 546 68% of the loan portfolio is floating/adjustable 75% of the floating/adjustable loans have floors 17% of the loans that have floors are at the floor 32% of the loans that have floors are within 100 basis points of the floor (excludes loans at the floor) FHLB & Other
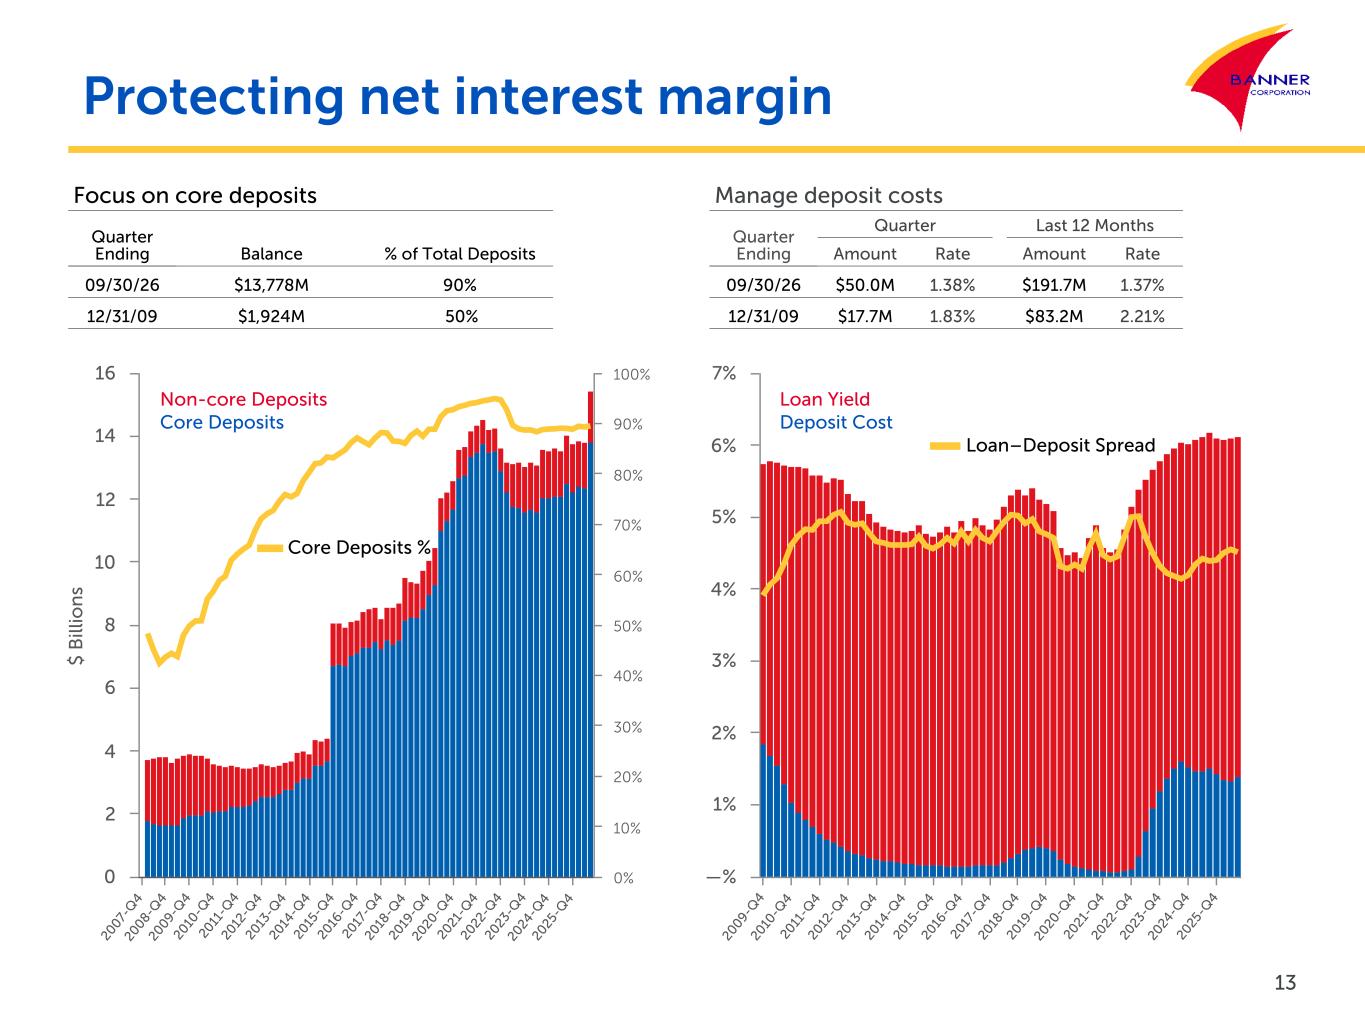
20 09- Q 4 20 10 -Q 4 20 11 -Q 4 20 12 -Q 4 20 13 -Q 4 20 14 -Q 4 20 15 -Q 4 20 16 -Q 4 20 17 -Q 4 20 18 -Q 4 20 19 -Q 4 20 20 -Q 4 20 21 -Q 4 20 22 -Q 4 20 23 -Q 4 20 24 -Q 4 20 25 -Q 4 —% 1% 2% 3% 4% 5% 6% 7% $ B ill io n s 20 07- Q 4 20 08-Q 4 20 09- Q 4 20 10 -Q 4 20 11 -Q 4 20 12 -Q 4 20 13 -Q 4 20 14 -Q 4 20 15 -Q 4 20 16 -Q 4 20 17 -Q 4 20 18 -Q 4 20 19 -Q 4 20 20 -Q 4 20 21 -Q 4 20 22 -Q 4 20 23 -Q 4 20 24 -Q 4 20 25 -Q 4 0 2 4 6 8 10 12 14 16 0% 10% 20% 30% 40% 50% 60% 70% 80% 90% 100% Protecting net interest margin Non-core Deposits Core Deposits Manage deposit costs Quarter Ending Quarter Last 12 Months Amount Rate Amount Rate 09/30/26 $50.0M 1.38% $191.7M 1.37% 12/31/09 $17.7M 1.83% $83.2M 2.21% 13 Focus on core deposits Quarter Ending Balance % of Total Deposits 09/30/26 $13,778M 90% 12/31/09 $1,924M 50% Loan Yield Deposit Cost Core Deposits % Loan–Deposit Spread
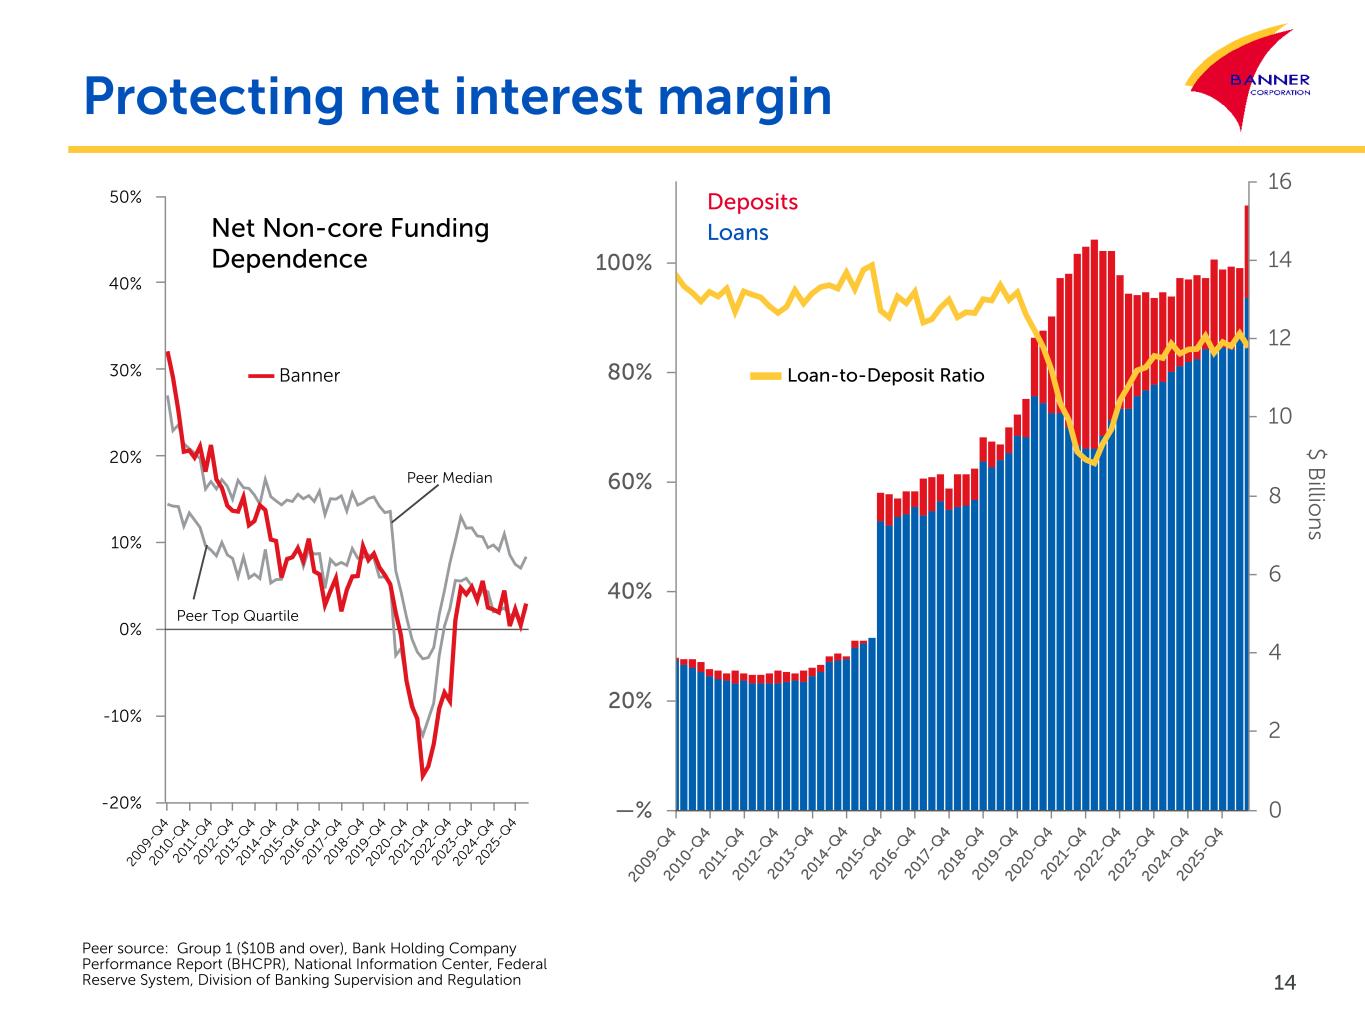
20 09 -Q 4 20 10 -Q 4 20 11 -Q 4 20 12 -Q 4 20 13 -Q 4 20 14 -Q 4 20 15 -Q 4 20 16 -Q 4 20 17 -Q 4 20 18 -Q 4 20 19 -Q 4 20 20 -Q 4 20 21 -Q 4 20 22 -Q 4 20 23 -Q 4 20 24 -Q 4 20 25 -Q 4 -20% -10% 0% 10% 20% 30% 40% 50% Protecting net interest margin Peer Median Peer source: Group 1 ($10B and over), Bank Holding Company Performance Report (BHCPR), National Information Center, Federal Reserve System, Division of Banking Supervision and Regulation Net Non-core Funding Dependence Peer Top Quartile 14 $ B illio n s 20 09- Q 4 20 10 -Q 4 20 11 -Q 4 20 12 -Q 4 20 13 -Q 4 20 14 -Q 4 20 15 -Q 4 20 16 -Q 4 20 17 -Q 4 20 18 -Q 4 20 19 -Q 4 20 20 -Q 4 20 21 -Q 4 20 22 -Q 4 20 23 -Q 4 20 24 -Q 4 20 25 -Q 4 —% 20% 40% 60% 80% 100% 0 2 4 6 8 10 12 14 16 Banner Loan-to-Deposit Ratio Deposits Loans
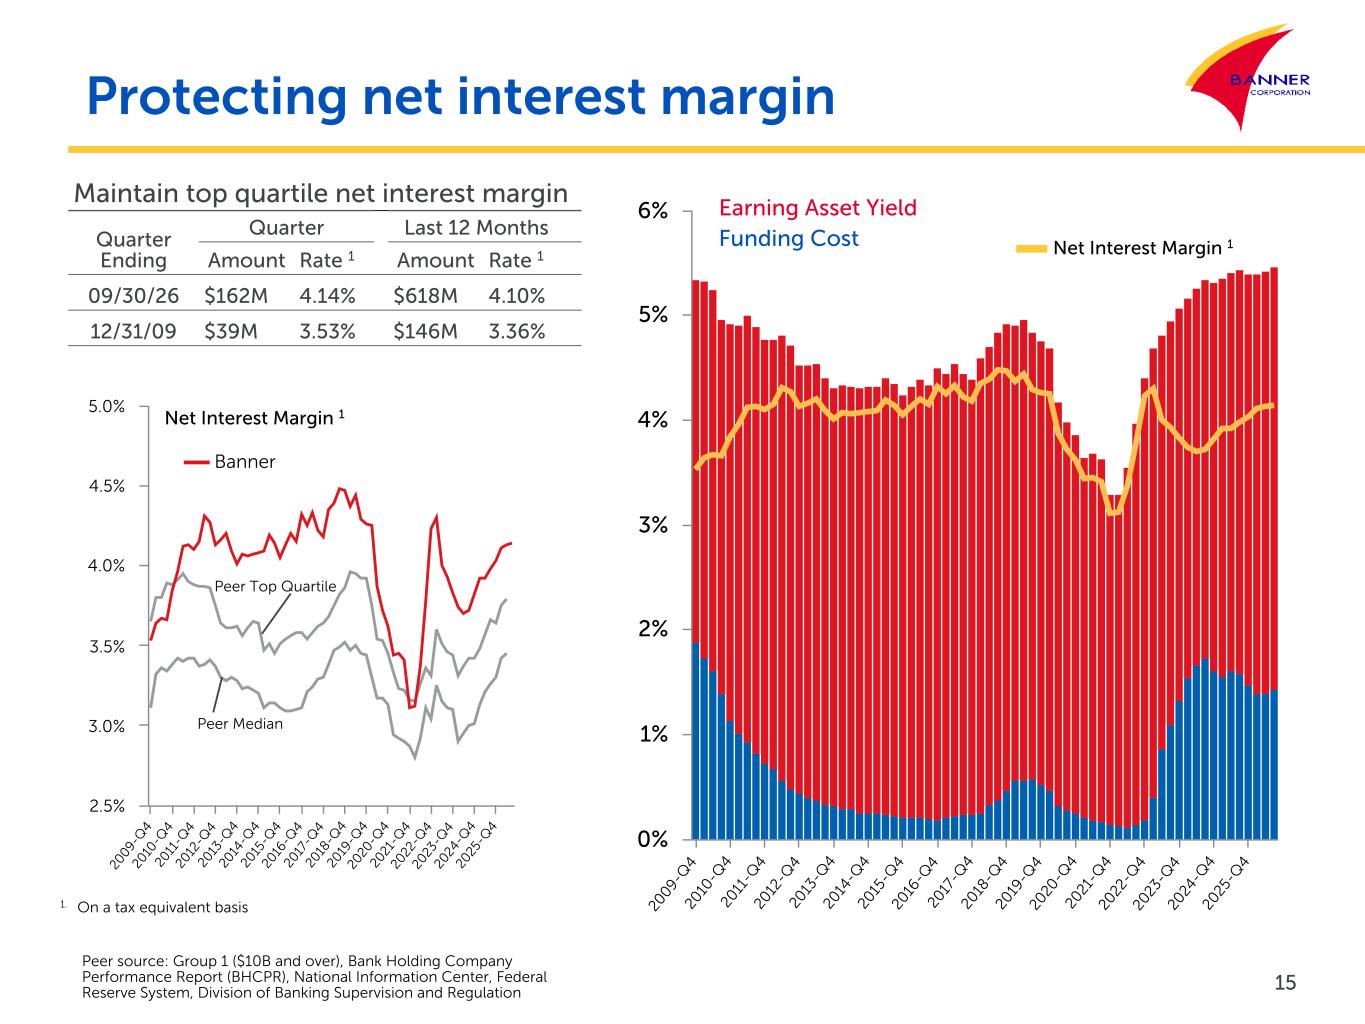
20 09 -Q 4 20 10 -Q 4 20 11 -Q 4 20 12 -Q 4 20 13 -Q 4 20 14 -Q 4 20 15 -Q 4 20 16 -Q 4 20 17 -Q 4 20 18 -Q 4 20 19 -Q 4 20 20 -Q 4 20 21 -Q 4 20 22 -Q 4 20 23 -Q 4 20 24 -Q 4 20 25 -Q 4 0% 1% 2% 3% 4% 5% 6% 20 09 -Q 4 20 10 -Q 4 20 11 -Q 4 20 12 -Q 4 20 13 -Q 4 20 14 -Q 4 20 15 -Q 4 20 16 -Q 4 20 17 -Q 4 20 18 -Q 4 20 19 -Q 4 20 20 -Q 4 20 21 -Q 4 20 22 -Q 4 20 23 -Q 4 20 24 -Q 4 20 25 -Q 4 2.5% 3.0% 3.5% 4.0% 4.5% 5.0% Protecting net interest margin Maintain top quartile net interest margin Quarter Ending Quarter Last 12 Months Amount Rate 1 Amount Rate 1 09/30/26 $162M 4.14% $618M 4.10% 12/31/09 $39M 3.53% $146M 3.36% Peer source: Group 1 ($10B and over), Bank Holding Company Performance Report (BHCPR), National Information Center, Federal Reserve System, Division of Banking Supervision and Regulation 15 Peer Top Quartile Peer Median Net Interest Margin 1 Banner Net Interest Margin 1 Earning Asset Yield Funding Cost 1. On a tax equivalent basis
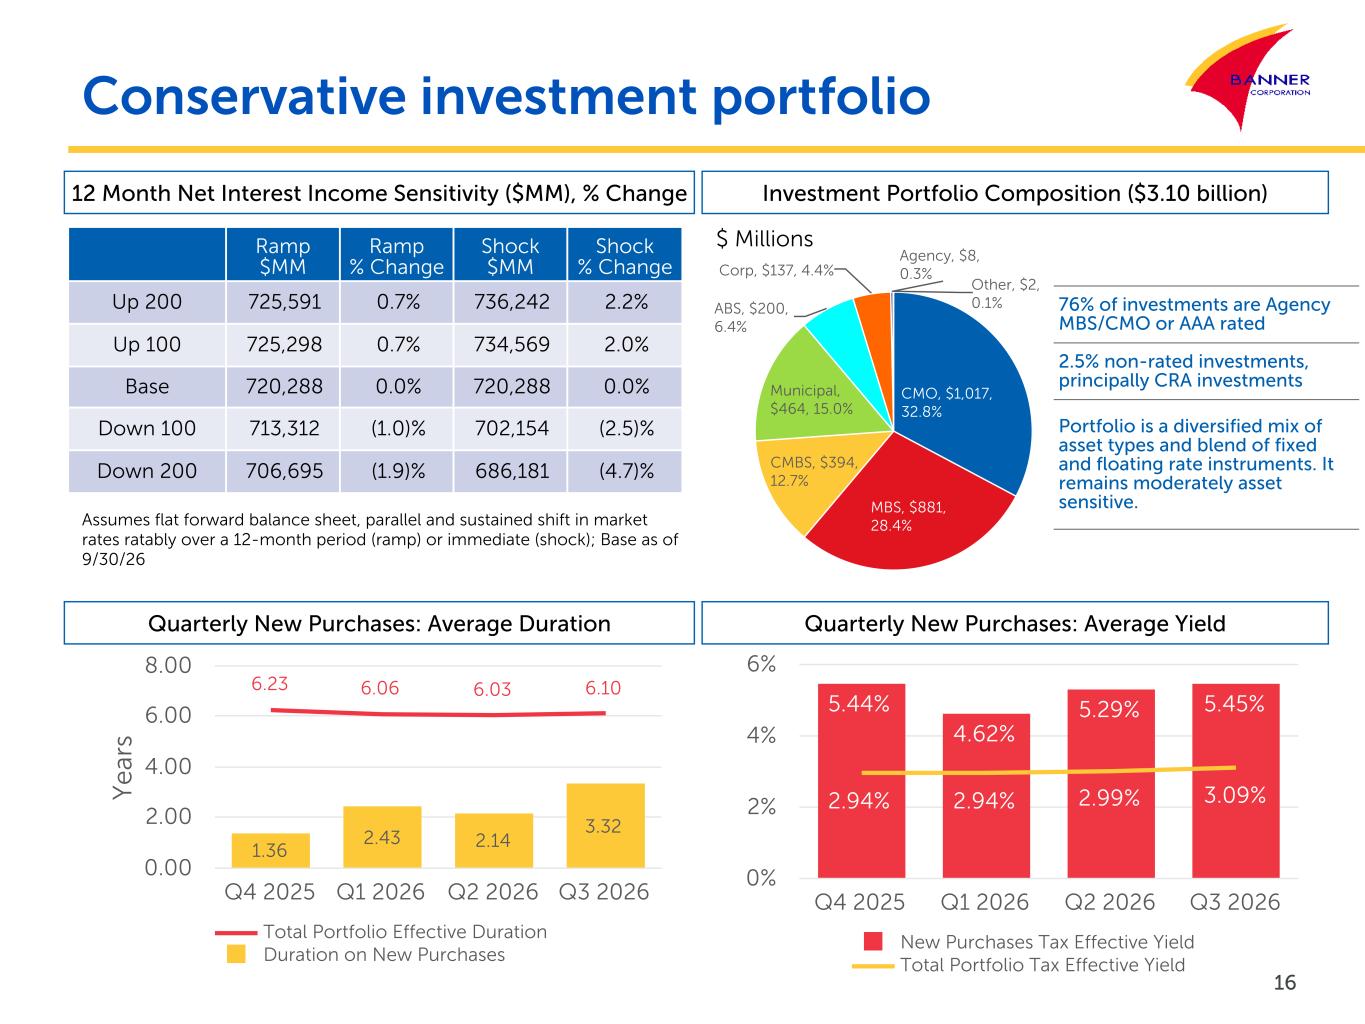
Conservative investment portfolio 16 Assumes flat forward balance sheet, parallel and sustained shift in market rates ratably over a 12-month period (ramp) or immediate (shock); Base as of 9/30/26 CMO, $1,017, 32.8% MBS, $881, 28.4% CMBS, $394, 12.7% Municipal, $464, 15.0% ABS, $200, 6.4% Corp, $137, 4.4% Agency, $8, 0.3% Other, $2, 0.1% Y e ar s 1.36 2.43 2.14 3.32 6.23 6.06 6.03 6.10 Total Portfolio Effective Duration Duration on New Purchases Q4 2025 Q1 2026 Q2 2026 Q3 2026 0.00 2.00 4.00 6.00 8.00 5.44% 4.62% 5.29% 5.45% 2.94% 2.94% 2.99% 3.09% New Purchases Tax Effective Yield Total Portfolio Tax Effective Yield Q4 2025 Q1 2026 Q2 2026 Q3 2026 0% 2% 4% 6% 12 Month Net Interest Income Sensitivity ($MM), % Change Quarterly New Purchases: Average Duration Investment Portfolio Composition ($3.10 billion) 76% of investments are Agency MBS/CMO or AAA rated 2.5% non-rated investments, principally CRA investments Portfolio is a diversified mix of asset types and blend of fixed and floating rate instruments. It remains moderately asset sensitive. Quarterly New Purchases: Average Yield $ MillionsRamp $MM Ramp % Change Shock $MM Shock % Change Up 200 725,591 0.7% 736,242 2.2% Up 100 725,298 0.7% 734,569 2.0% Base 720,288 0.0% 720,288 0.0% Down 100 713,312 (1.0)% 702,154 (2.5)% Down 200 706,695 (1.9)% 686,181 (4.7)%
Building value at Banner Core banking competency Growing revenue Protecting net interest margin Spending carefully Maintaining a moderate risk profile Employing capital wisely Spending carefully Benefit from scale Control core operating expense 17
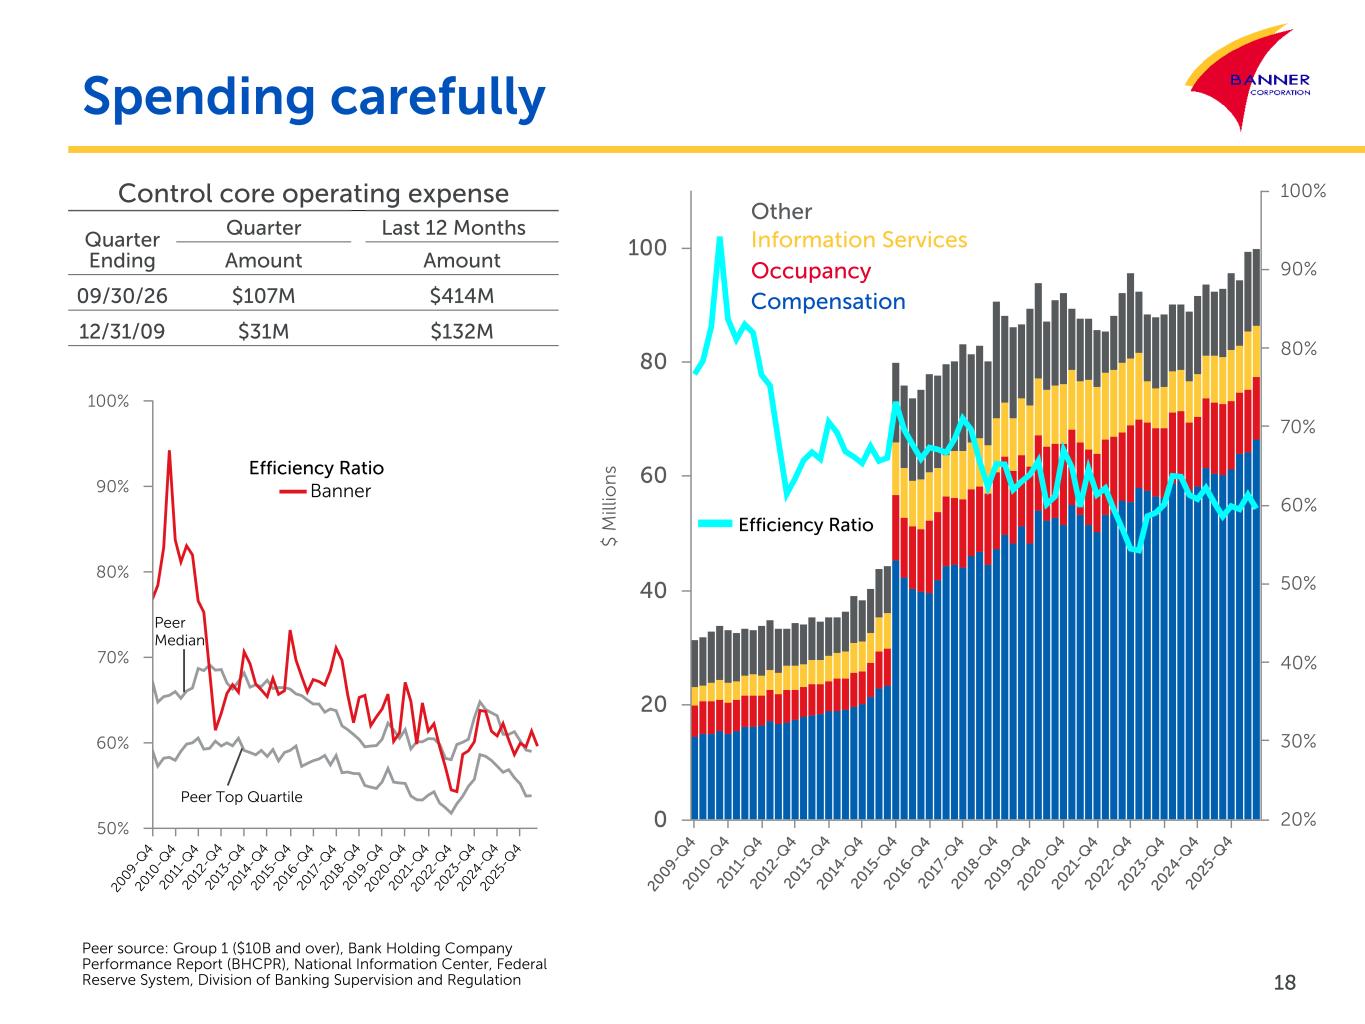
$ M ill io n s 20 09- Q 4 20 10 -Q 4 20 11 -Q 4 20 12 -Q 4 20 13 -Q 4 20 14 -Q 4 20 15 -Q 4 20 16 -Q 4 20 17 -Q 4 20 18 -Q 4 20 19 -Q 4 20 20 -Q 4 20 21 -Q 4 20 22 -Q 4 20 23 -Q 4 20 24 -Q 4 20 25 -Q 4 0 20 40 60 80 100 20% 30% 40% 50% 60% 70% 80% 90% 100% 20 09 -Q 4 20 10 -Q 4 20 11 -Q 4 20 12 -Q 4 20 13 -Q 4 20 14 -Q 4 20 15 -Q 4 20 16 -Q 4 20 17 -Q 4 20 18 -Q 4 20 19 -Q 4 20 20 -Q 4 20 21 -Q 4 20 22 -Q 4 20 23 -Q 4 20 24 -Q 4 20 25 -Q 4 50% 60% 70% 80% 90% 100% Spending carefully Peer source: Group 1 ($10B and over), Bank Holding Company Performance Report (BHCPR), National Information Center, Federal Reserve System, Division of Banking Supervision and Regulation 18 Control core operating expense Quarter Ending Quarter Last 12 Months Amount Amount 09/30/26 $107M $414M 12/31/09 $31M $132M Peer Top Quartile Peer Median Banner Efficiency Ratio Occupancy Compensation Information Services Other Efficiency Ratio
Maintaining a moderate risk profile Embrace effective enterprise risk management Minimize non-performing assets Maintain appropriate loan loss reserve Maintain appropriate risk capital Building value at Banner Core banking competency Growing revenue Protecting net interest margin Spending carefully Maintaining a moderate risk profile Employing capital wisely 19
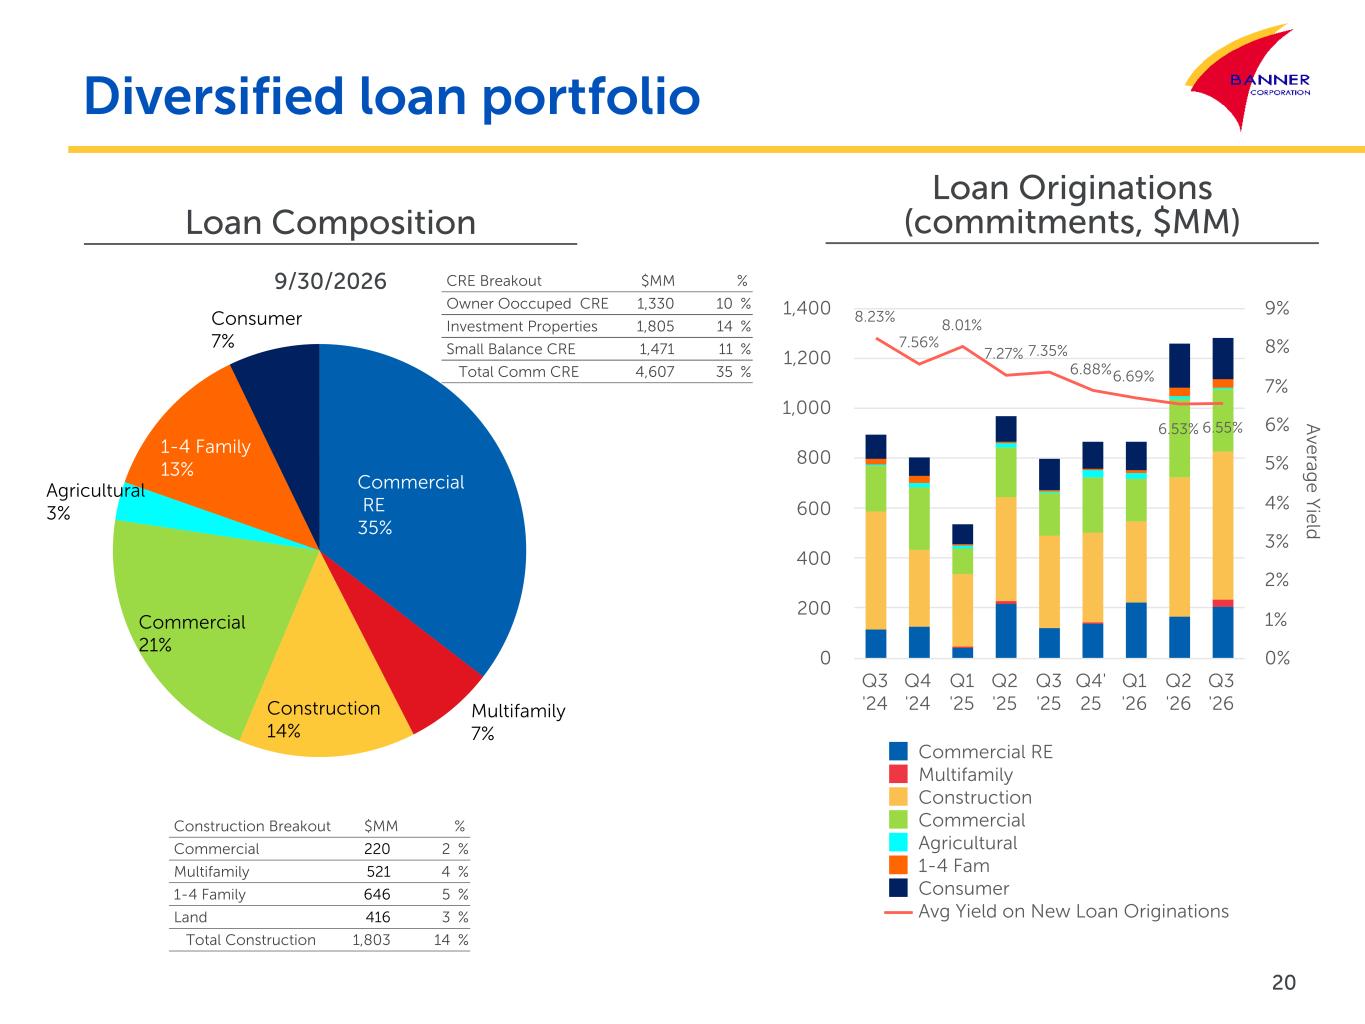
Commercial RE 35% Multifamily 7% Construction 14% Commercial 21% Agricultural 3% 1-4 Family 13% Consumer 7% Diversified loan portfolio 20 Loan Composition 9/30/2026 CRE Breakout $MM % Owner Ooccuped CRE 1,330 10 % Investment Properties 1,805 14 % Small Balance CRE 1,471 11 % Total Comm CRE 4,607 35 % Construction Breakout $MM % Commercial 220 2 % Multifamily 521 4 % 1-4 Family 646 5 % Land 416 3 % Total Construction 1,803 14 % Loan Originations (commitments, $MM) A ve rag e Y ie ld 8.23% 7.56% 8.01% 7.27% 7.35% 6.88%6.69% 6.53% 6.55% Commercial RE Multifamily Construction Commercial Agricultural 1-4 Fam Consumer Avg Yield on New Loan Originations Q3 '24 Q4 '24 Q1 '25 Q2 '25 Q3 '25 Q4' 25 Q1 '26 Q2 '26 Q3 '26 0 200 400 600 800 1,000 1,200 1,400 0% 1% 2% 3% 4% 5% 6% 7% 8% 9%
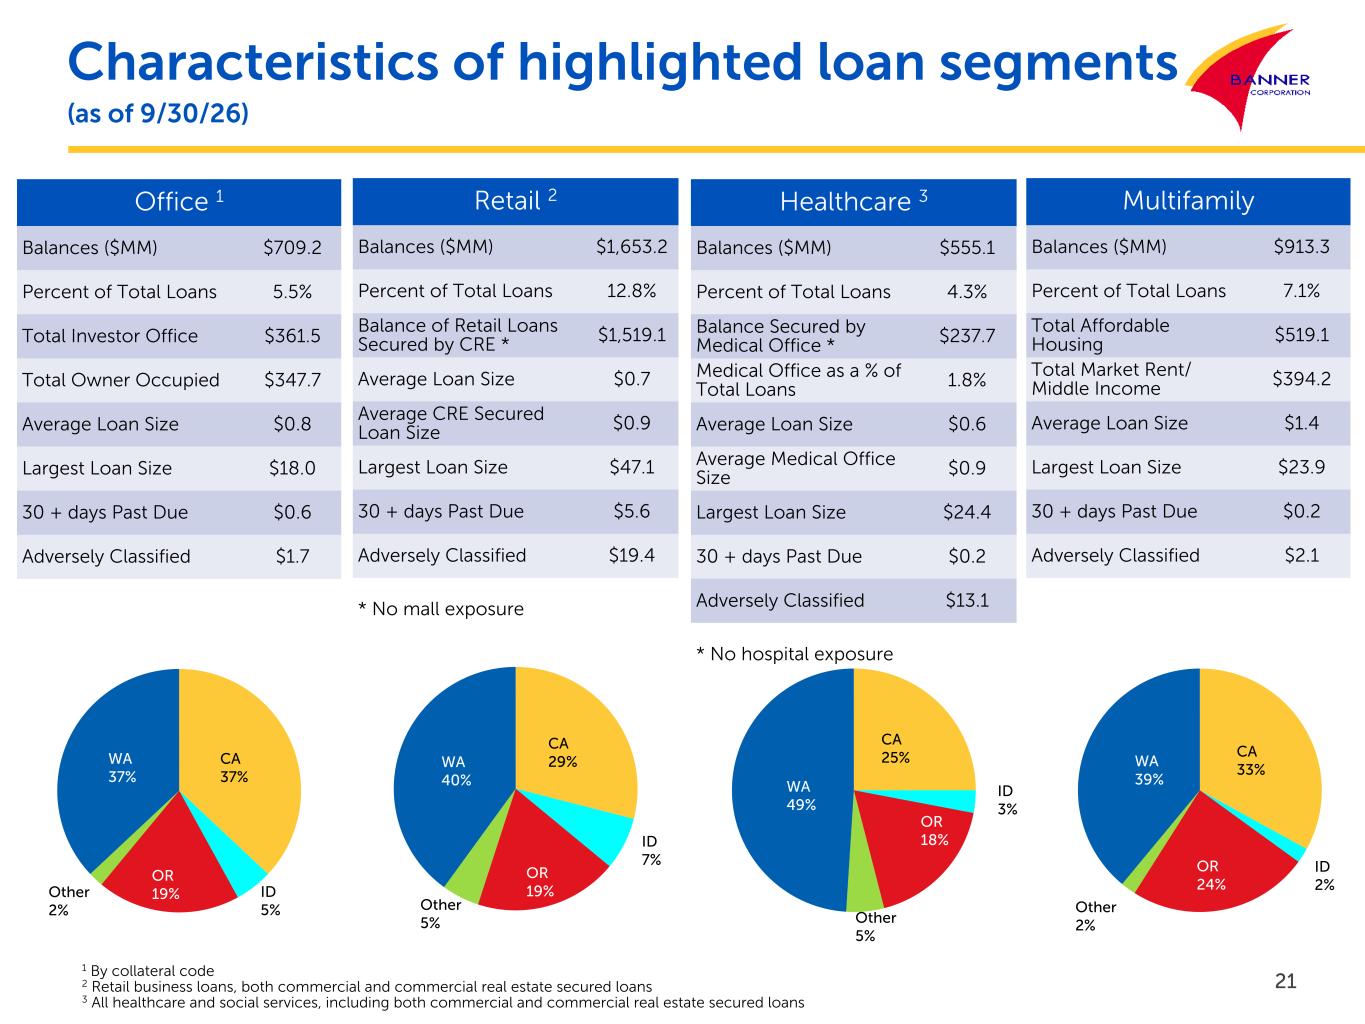
21 Characteristics of highlighted loan segments (as of 9/30/26) Office 1 Balances ($MM) $709.2 Percent of Total Loans 5.5% Total Investor Office $361.5 Total Owner Occupied $347.7 Average Loan Size $0.8 Largest Loan Size $18.0 30 + days Past Due $0.6 Adversely Classified $1.7 Retail 2 Balances ($MM) $1,653.2 Percent of Total Loans 12.8% Balance of Retail Loans Secured by CRE * $1,519.1 Average Loan Size $0.7 Average CRE Secured Loan Size $0.9 Largest Loan Size $47.1 30 + days Past Due $5.6 Adversely Classified $19.4 * No mall exposure Healthcare 3 Balances ($MM) $555.1 Percent of Total Loans 4.3% Balance Secured by Medical Office * $237.7 Medical Office as a % of Total Loans 1.8% Average Loan Size $0.6 Average Medical Office Size $0.9 Largest Loan Size $24.4 30 + days Past Due $0.2 Adversely Classified $13.1 * No hospital exposure 1 By collateral code 2 Retail business loans, both commercial and commercial real estate secured loans 3 All healthcare and social services, including both commercial and commercial real estate secured loans Multifamily Balances ($MM) $913.3 Percent of Total Loans 7.1% Total Affordable Housing $519.1 Total Market Rent/ Middle Income $394.2 Average Loan Size $1.4 Largest Loan Size $23.9 30 + days Past Due $0.2 Adversely Classified $2.1 CA 37% ID 5% OR 19%Other 2% WA 37% CA 29% ID 7% OR 19% Other 5% WA 40% CA 25% ID 3% OR 18% Other 5% WA 49% CA 33% ID 2% OR 24% Other 2% WA 39%
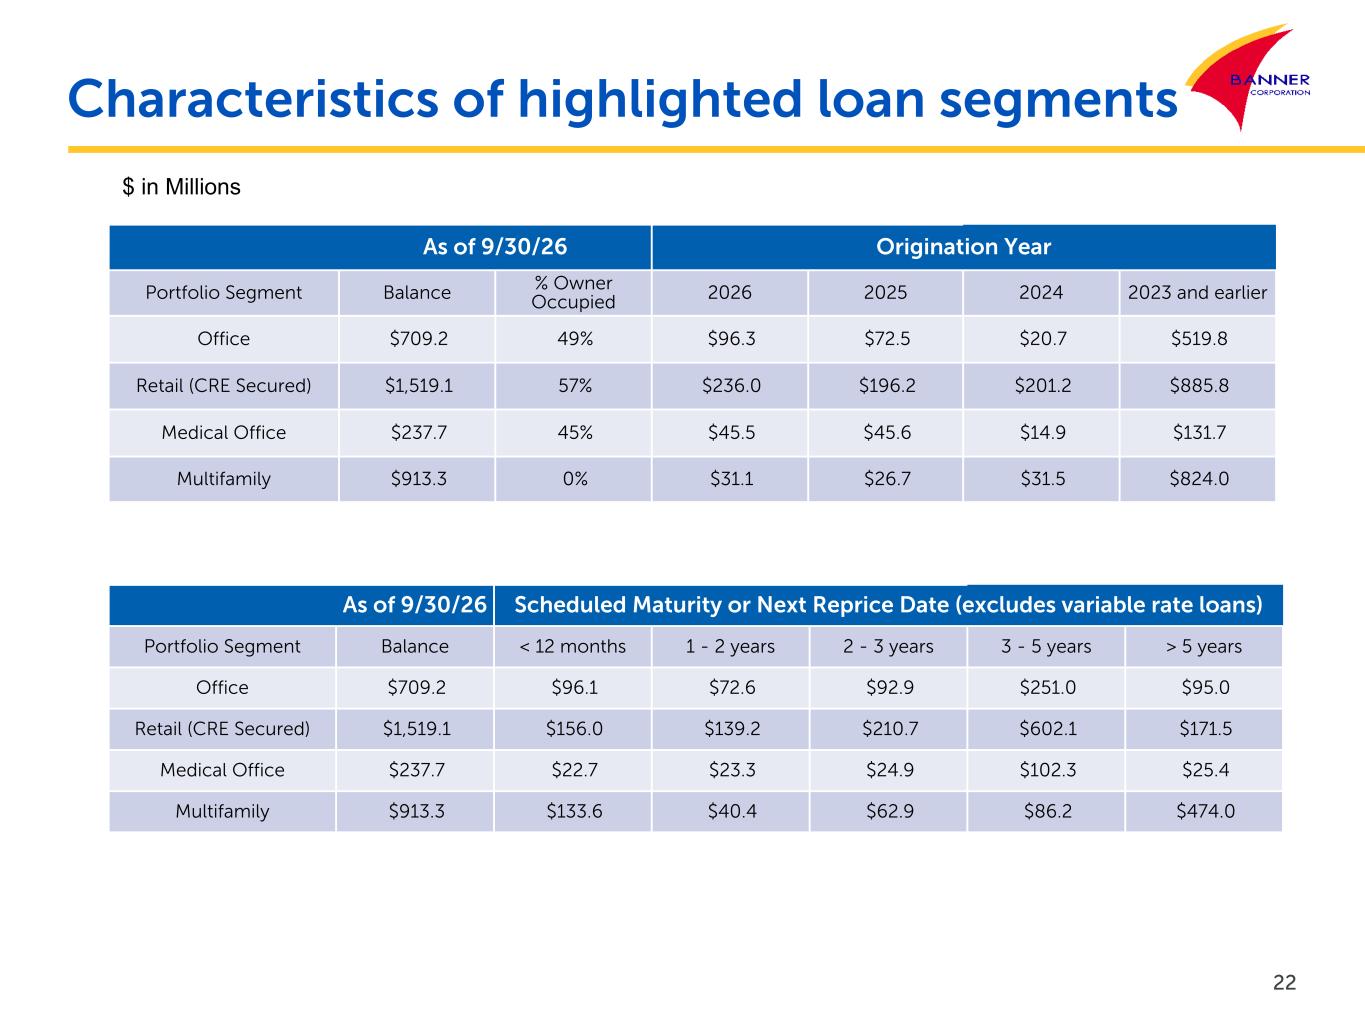
22 As of 9/30/26 Origination Year Portfolio Segment Balance % Owner Occupied 2026 2025 2024 2023 and earlier Office $709.2 49% $96.3 $72.5 $20.7 $519.8 Retail (CRE Secured) $1,519.1 57% $236.0 $196.2 $201.2 $885.8 Medical Office $237.7 45% $45.5 $45.6 $14.9 $131.7 Multifamily $913.3 0% $31.1 $26.7 $31.5 $824.0 As of 9/30/26 Scheduled Maturity or Next Reprice Date (excludes variable rate loans) Portfolio Segment Balance < 12 months 1 - 2 years 2 - 3 years 3 - 5 years > 5 years Office $709.2 $96.1 $72.6 $92.9 $251.0 $95.0 Retail (CRE Secured) $1,519.1 $156.0 $139.2 $210.7 $602.1 $171.5 Medical Office $237.7 $22.7 $23.3 $24.9 $102.3 $25.4 Multifamily $913.3 $133.6 $40.4 $62.9 $86.2 $474.0 Characteristics of highlighted loan segments $ in Millions
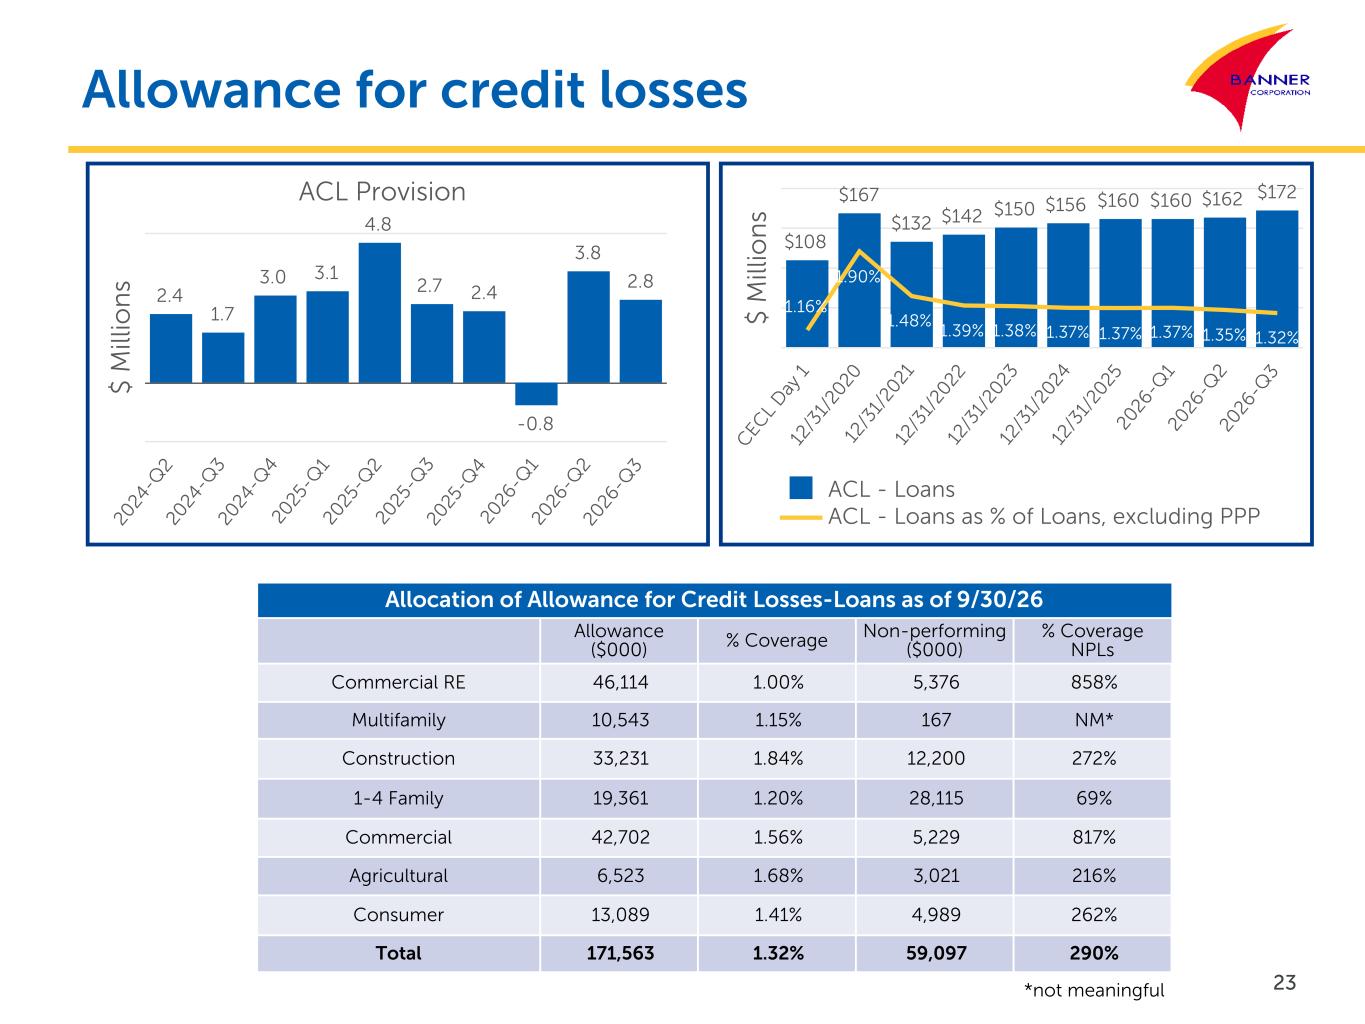
Allowance for credit losses 23 $ M ill io n s ACL Provision 2.4 1.7 3.0 3.1 4.8 2.7 2.4 3.8 2.8 -0.8 20 24 -Q 2 20 24 -Q 3 20 24 -Q 4 20 25 -Q 1 20 25 -Q 2 20 25 -Q 3 20 25 -Q 4 20 26 -Q 1 20 26 -Q 2 20 26 -Q 3 $ M ill io n s $108 $167 $132 $142 $150 $156 $160 $160 $162 $172 1.16% 1.90% 1.48% 1.39% 1.38% 1.37% 1.37% 1.37% 1.35% 1.32% ACL - Loans ACL - Loans as % of Loans, excluding PPP C EC L D ay 1 12 /3 1/ 20 20 12 /3 1/ 20 21 12 /3 1/ 20 22 12 /3 1/ 20 23 12 /3 1/ 20 24 12 /3 1/ 20 25 20 26 -Q 1 20 26 -Q 2 20 26 -Q 3 Allocation of Allowance for Credit Losses-Loans as of 9/30/26 Allowance ($000) % Coverage Non-performing ($000) % Coverage NPLs Commercial RE 46,114 1.00% 5,376 858% Multifamily 10,543 1.15% 167 NM* Construction 33,231 1.84% 12,200 272% 1-4 Family 19,361 1.20% 28,115 69% Commercial 42,702 1.56% 5,229 817% Agricultural 6,523 1.68% 3,021 216% Consumer 13,089 1.41% 4,989 262% Total 171,563 1.32% 59,097 290% *not meaningful
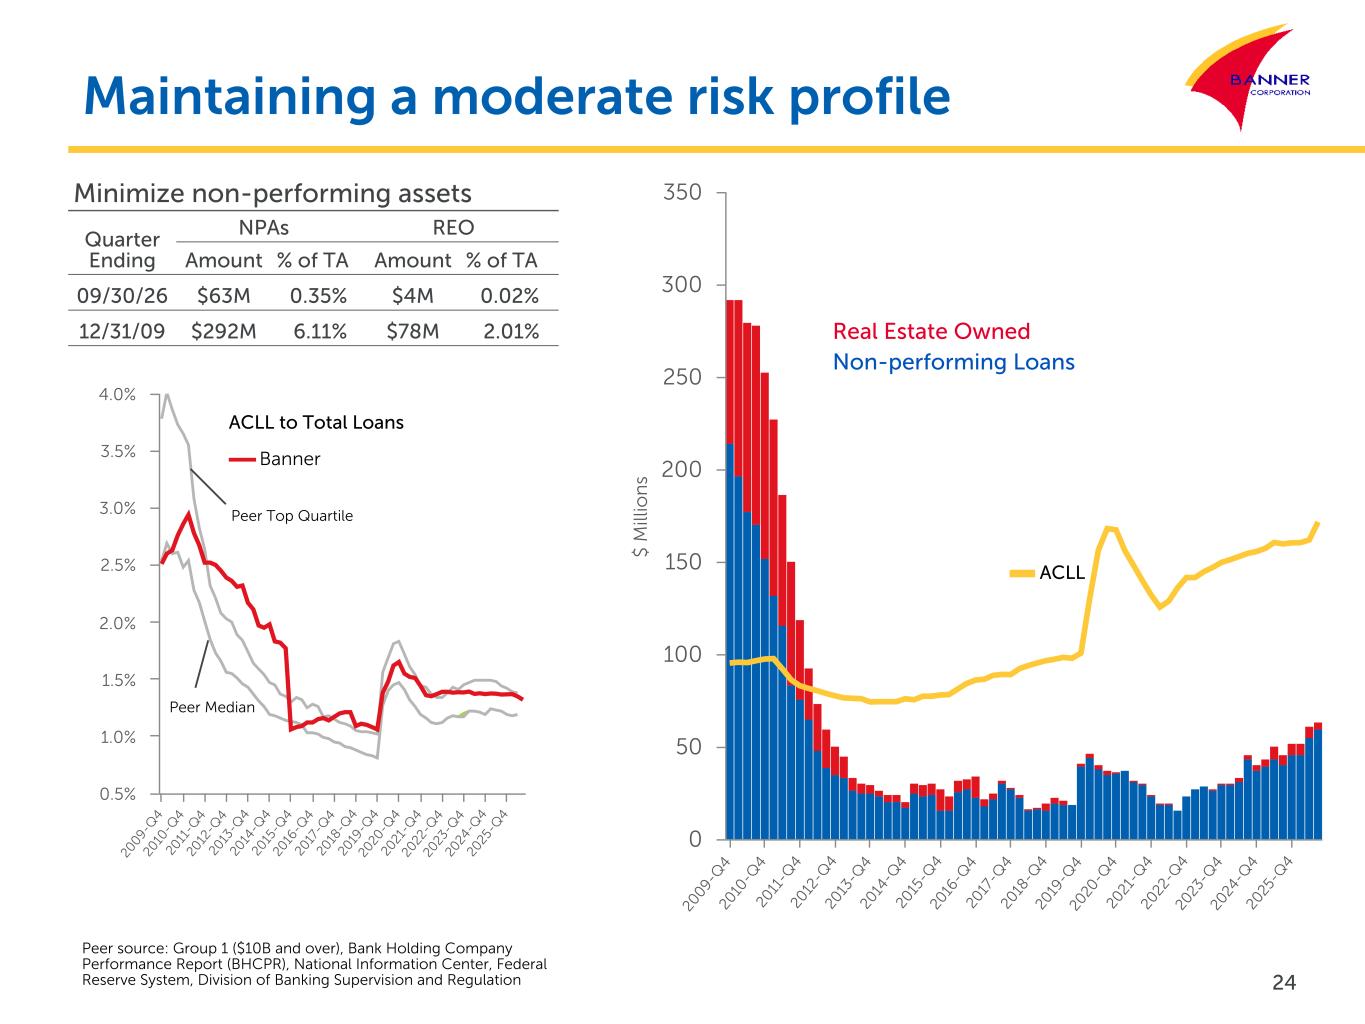
20 09 -Q 4 20 10 -Q 4 20 11 -Q 4 20 12 -Q 4 20 13 -Q 4 20 14 -Q 4 20 15 -Q 4 20 16 -Q 4 20 17 -Q 4 20 18 -Q 4 20 19 -Q 4 20 20 -Q 4 20 21 -Q 4 20 22 -Q 4 20 23 -Q 4 20 24 -Q 4 20 25 -Q 4 0.5% 1.0% 1.5% 2.0% 2.5% 3.0% 3.5% 4.0% $ M ill io n s 20 09 -Q 4 20 10 -Q 4 20 11 -Q 4 20 12 -Q 4 20 13 -Q 4 20 14 -Q 4 20 15 -Q 4 20 16 -Q 4 20 17 -Q 4 20 18 -Q 4 20 19 -Q 4 20 20 -Q 4 20 21 -Q 4 20 22 -Q 4 20 23 -Q 4 20 24 -Q 4 20 25 -Q 4 0 50 100 150 200 250 300 350Minimize non-performing assets Quarter Ending NPAs REO Amount % of TA Amount % of TA 09/30/26 $63M 0.35% $4M 0.02% 12/31/09 $292M 6.11% $78M 2.01% Peer source: Group 1 ($10B and over), Bank Holding Company Performance Report (BHCPR), National Information Center, Federal Reserve System, Division of Banking Supervision and Regulation Maintaining a moderate risk profile ACLL Real Estate Owned Non-performing Loans Peer Top Quartile Peer Median Banner ACLL to Total Loans 24
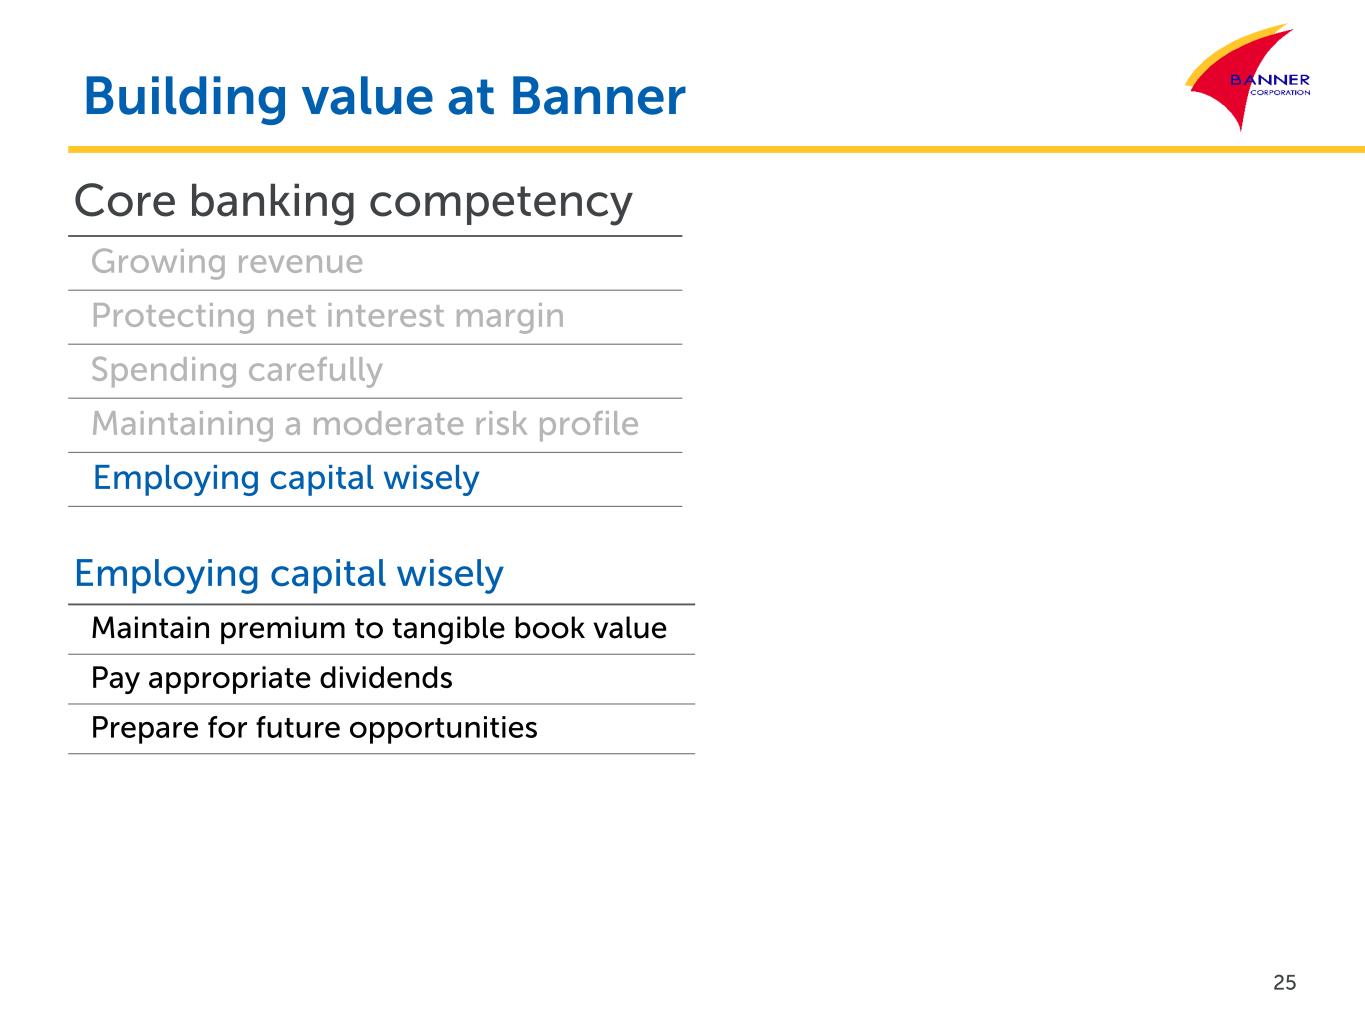
Building value at Banner Core banking competency Growing revenue Protecting net interest margin Spending carefully Maintaining a moderate risk profile Employing capital wisely Employing capital wisely Maintain premium to tangible book value Pay appropriate dividends Prepare for future opportunities 25
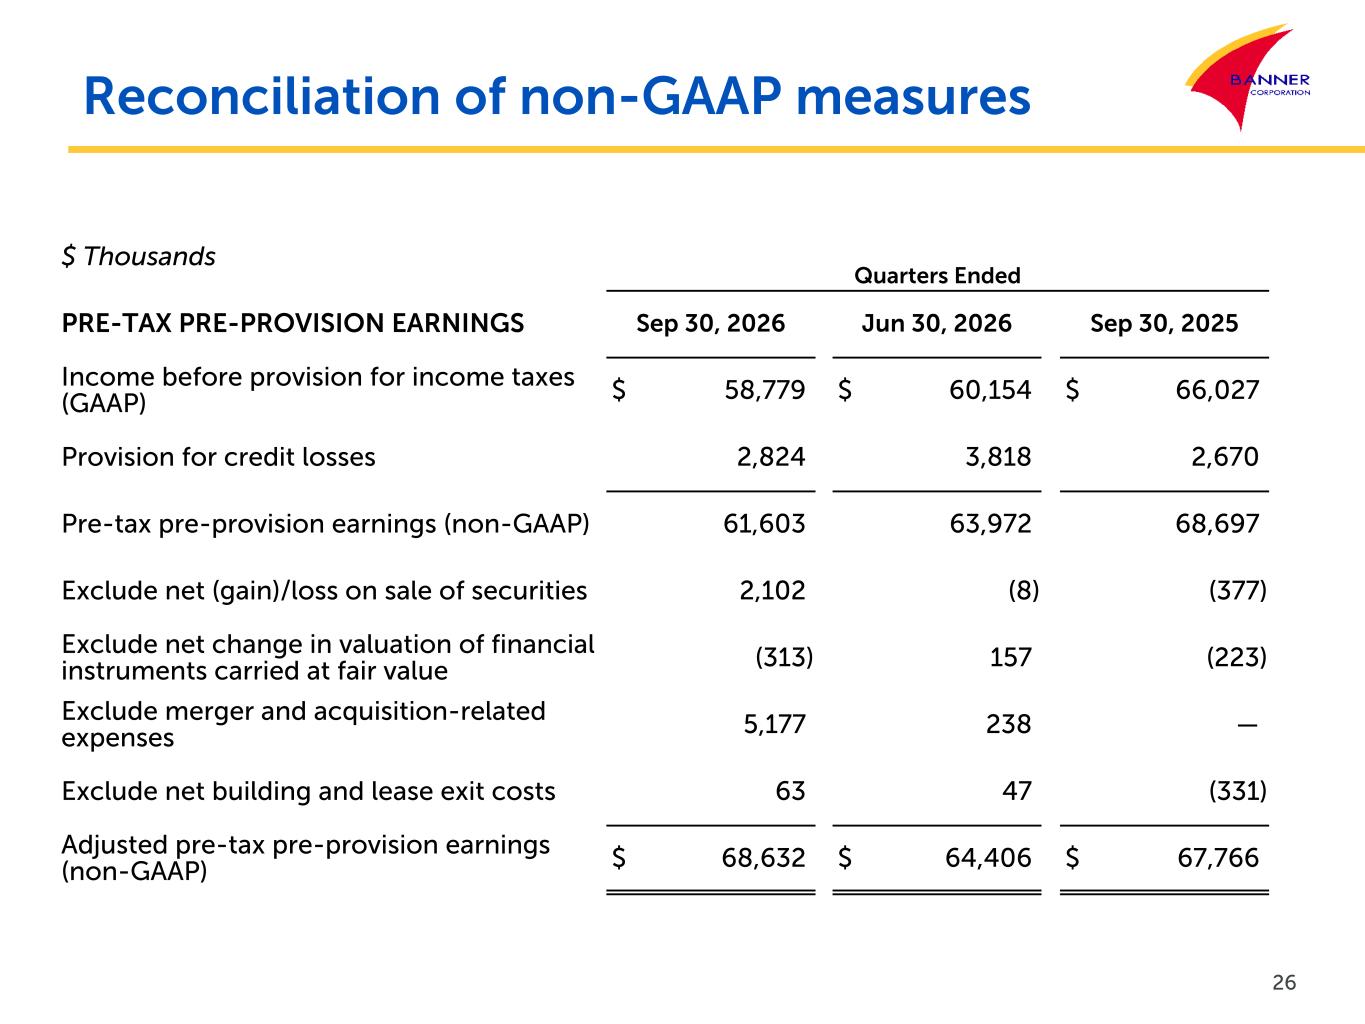
Reconciliation of non-GAAP measures 26 $ Thousands Quarters Ended PRE-TAX PRE-PROVISION EARNINGS Sep 30, 2026 Jun 30, 2026 Sep 30, 2025 Income before provision for income taxes (GAAP) $ 58,779 $ 60,154 $ 66,027 Provision for credit losses 2,824 3,818 2,670 Pre-tax pre-provision earnings (non-GAAP) 61,603 63,972 68,697 Exclude net (gain)/loss on sale of securities 2,102 (8) (377) Exclude net change in valuation of financial instruments carried at fair value (313) 157 (223) Exclude merger and acquisition-related expenses 5,177 238 — Exclude net building and lease exit costs 63 47 (331) Adjusted pre-tax pre-provision earnings (non-GAAP) $ 68,632 $ 64,406 $ 67,766
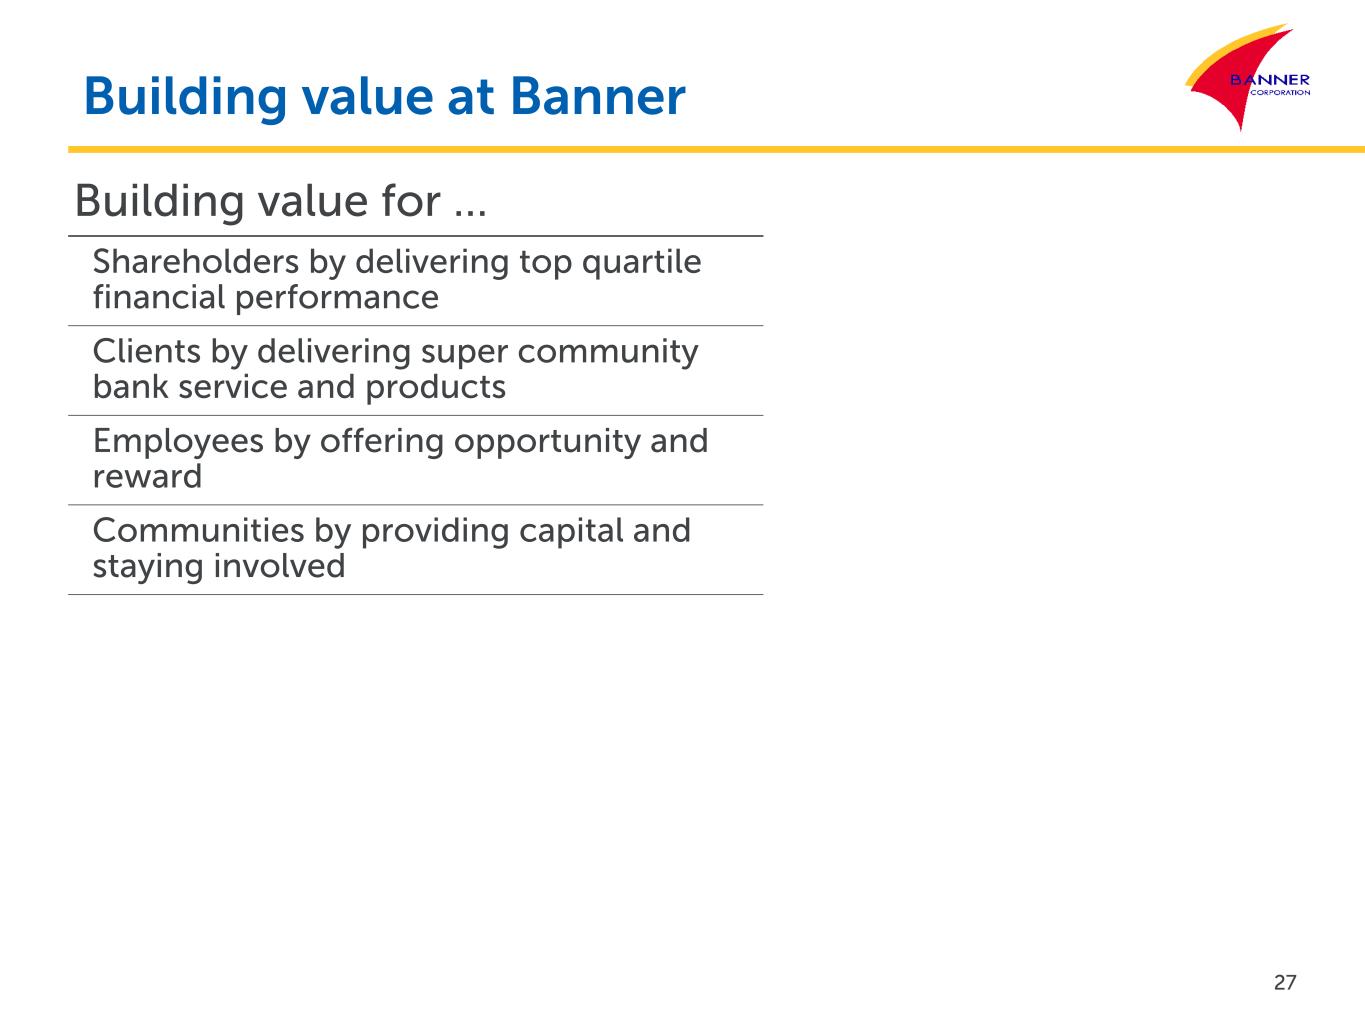
Building value at Banner Building value for … Shareholders by delivering top quartile financial performance Clients by delivering super community bank service and products Employees by offering opportunity and reward Communities by providing capital and staying involved 27