ARMOUR RESIDENTIAL REIT Q3 2026 Investor Presentation OCTOBER 21, 2026 1
CORPORATE PROFILE 2 ARMOUR Residential REIT, Inc. (NYSE: ARR) ARMOUR Residential REIT, Inc. (“ARMOUR”; NYSE: ARR) brings private capital into the mortgage markets to support home ownership for a broad and diverse spectrum of homeowners. We seek to create shareholder value through thoughtful investment and risk management of a leveraged and diversified portfolio of mortgage-backed securities issued or guaranteed by U.S Government-sponsored entities. We rely on the decades of experience of our management team for (i) MBS securities portfolio analysis and selection, (ii) access to equity capital and repurchase financing at potentially attractive rates and terms, and (iii) hedging and liquidity strategies to moderate interest rate and MBS price risk. We prioritize maintaining common share dividends appropriate for the intermediate term rather than focusing on short-term market fluctuations. ARMOUR is externally managed by ARMOUR Capital Management LP, an SEC registered investment advisor, which is under common control with BUCKLER Securities LLC, an SEC registered broker-dealer and a member of FICC and FINRA. BUCKLER Securities, LLC, is the largest provider of repurchase financing to ARMOUR. ARMOUR owns a 10.8% equity interest in BUCKLER Securities LLC.
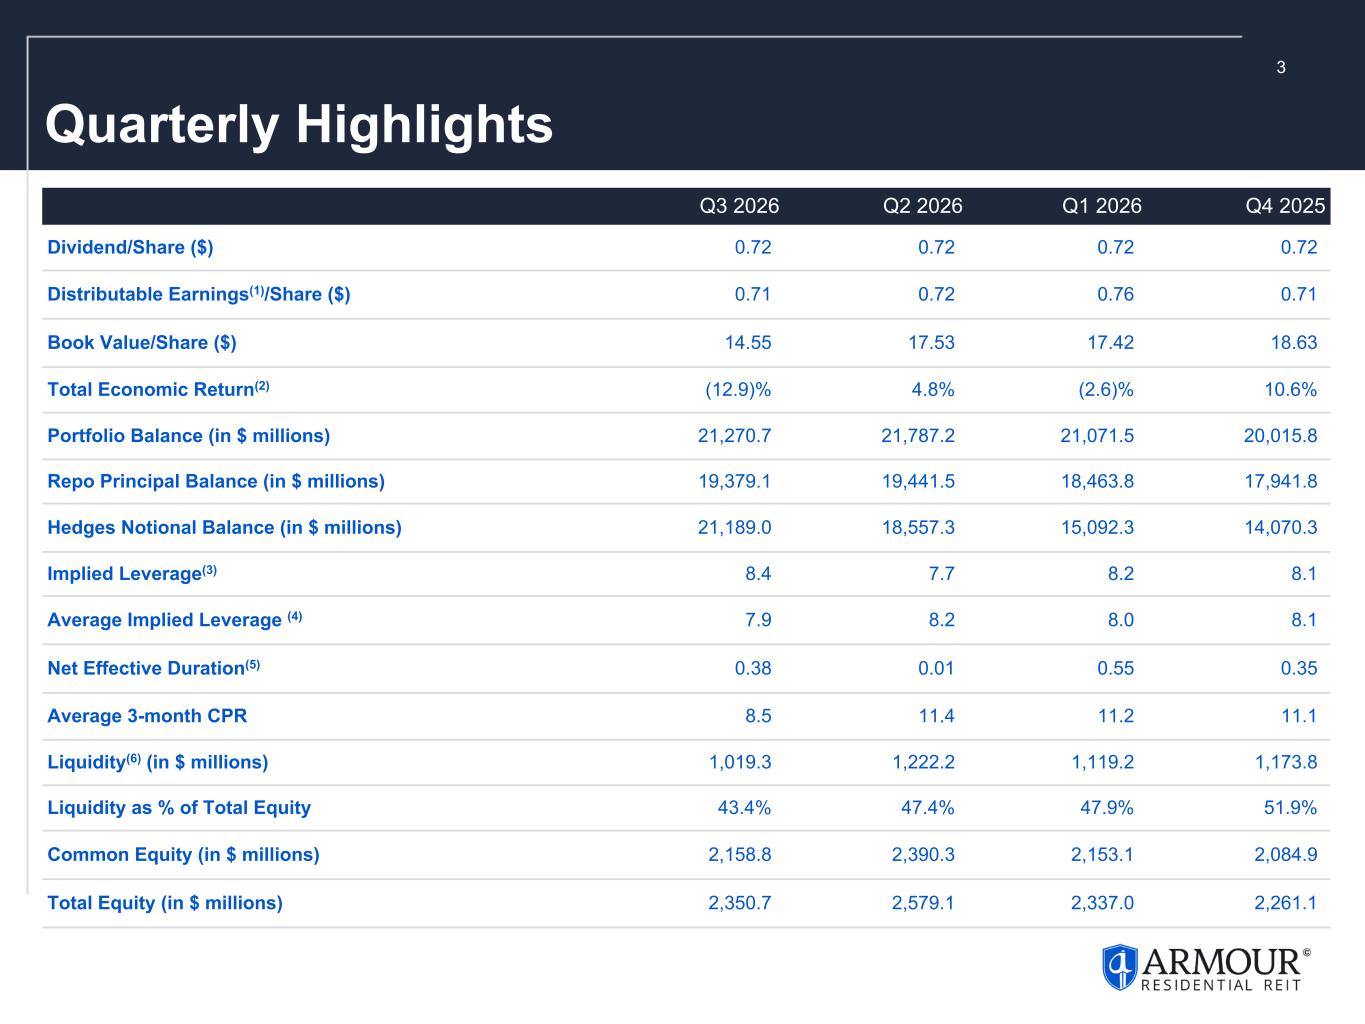
3 Quarterly Highlights Q3 2026 Q2 2026 Q1 2026 Q4 2025 Dividend/Share ($) 0.72 0.72 0.72 0.72 Distributable Earnings(1)/Share ($) 0.71 0.72 0.76 0.71 Book Value/Share ($) 14.55 17.53 17.42 18.63 Total Economic Return(2) (12.9) % 4.8 % (2.6) % 10.6 % Portfolio Balance (in $ millions) 21,270.7 21,787.2 21,071.5 20,015.8 Repo Principal Balance (in $ millions) 19,379.1 19,441.5 18,463.8 17,941.8 Hedges Notional Balance (in $ millions) 21,189.0 18,557.3 15,092.3 14,070.3 Implied Leverage(3) 8.4 7.7 8.2 8.1 Average Implied Leverage (4) 7.9 8.2 8.0 8.1 Net Effective Duration(5) 0.38 0.01 0.55 0.35 Average 3-month CPR 8.5 11.4 11.2 11.1 Liquidity(6) (in $ millions) 1,019.3 1,222.2 1,119.2 1,173.8 Liquidity as % of Total Equity 43.4 % 47.4 % 47.9 % 51.9 % Common Equity (in $ millions) 2,158.8 2,390.3 2,153.1 2,084.9 Total Equity (in $ millions) 2,350.7 2,579.1 2,337.0 2,261.1
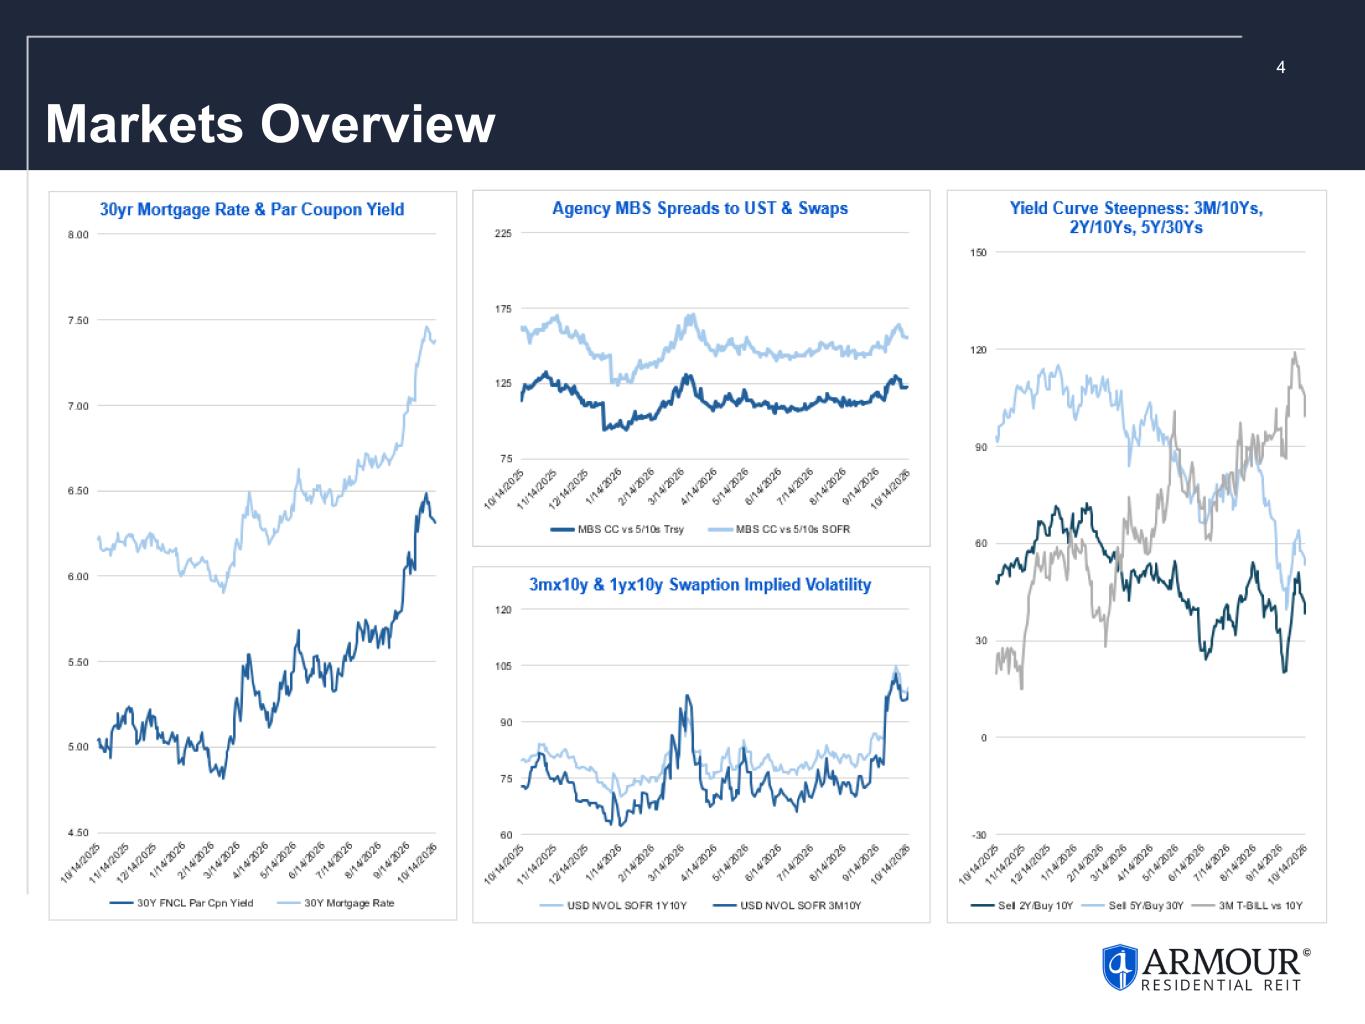
4 Markets Overview

5 Investment Portfolio as of 9/30/2026
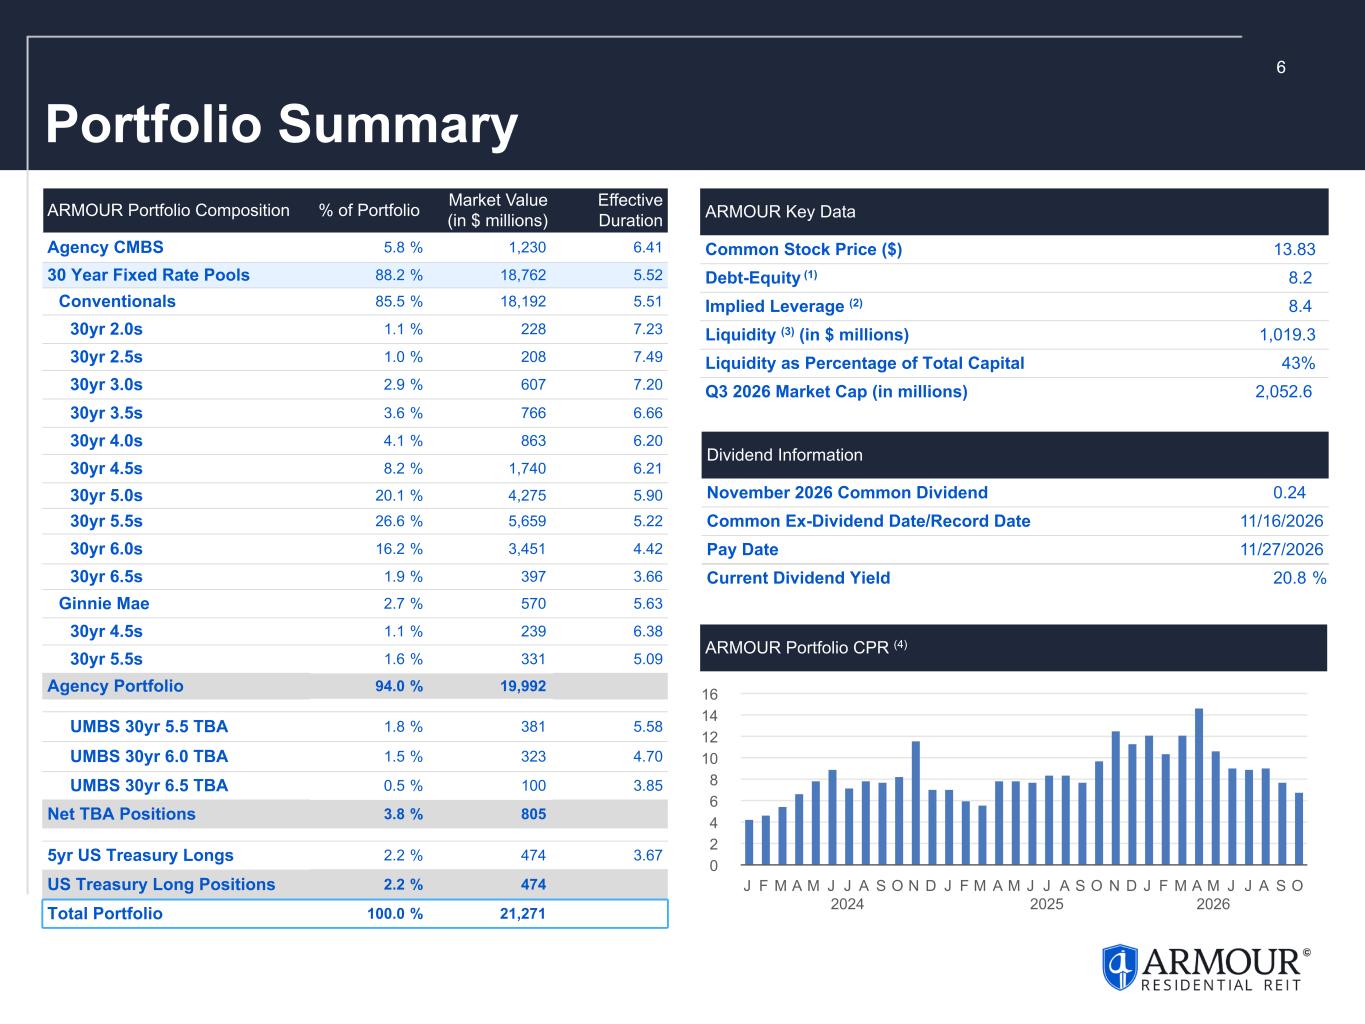
6 Portfolio Summary ARMOUR Portfolio Composition % of Portfolio Market Value (in $ millions) Effective Duration Agency CMBS 5.8 % 1,230 6.41 30 Year Fixed Rate Pools 88.2 % 18,762 5.52 Conventionals 85.5 % 18,192 5.51 30yr 2.0s 1.1 % 228 7.23 30yr 2.5s 1.0 % 208 7.49 30yr 3.0s 2.9 % 607 7.20 30yr 3.5s 3.6 % 766 6.66 30yr 4.0s 4.1 % 863 6.20 30yr 4.5s 8.2 % 1,740 6.21 30yr 5.0s 20.1 % 4,275 5.90 30yr 5.5s 26.6 % 5,659 5.22 30yr 6.0s 16.2 % 3,451 4.42 30yr 6.5s 1.9 % 397 3.66 Ginnie Mae 2.7 % 570 5.63 30yr 4.5s 1.1 % 239 6.38 30yr 5.5s 1.6 % 331 5.09 Agency Portfolio 94.0 % 19,992 UMBS 30yr 5.5 TBA 1.8 % 381 5.58 UMBS 30yr 6.0 TBA 1.5 % 323 4.70 UMBS 30yr 6.5 TBA 0.5 % 100 3.85 Net TBA Positions 3.8 % 805 5yr US Treasury Longs 2.2 % 474 3.67 US Treasury Long Positions 2.2 % 474 Total Portfolio 100.0 % 21,271 ARMOUR Key Data Common Stock Price ($) 13.83 Debt-Equity (1) 8.2 Implied Leverage (2) 8.4 Liquidity (3) (in $ millions) 1,019.3 Liquidity as Percentage of Total Capital 43 % Q3 2026 Market Cap (in millions) 2,052.6 Dividend Information November 2026 Common Dividend 0.24 Common Ex-Dividend Date/Record Date 11/16/2026 Pay Date 11/27/2026 Current Dividend Yield 20.8 % ARMOUR Portfolio CPR (4) J F M A M J J 2024 A S O N D J F M A M J J 2025 A S O N D J F M A M 2026 J J A S O 0 2 4 6 8 10 12 14 16
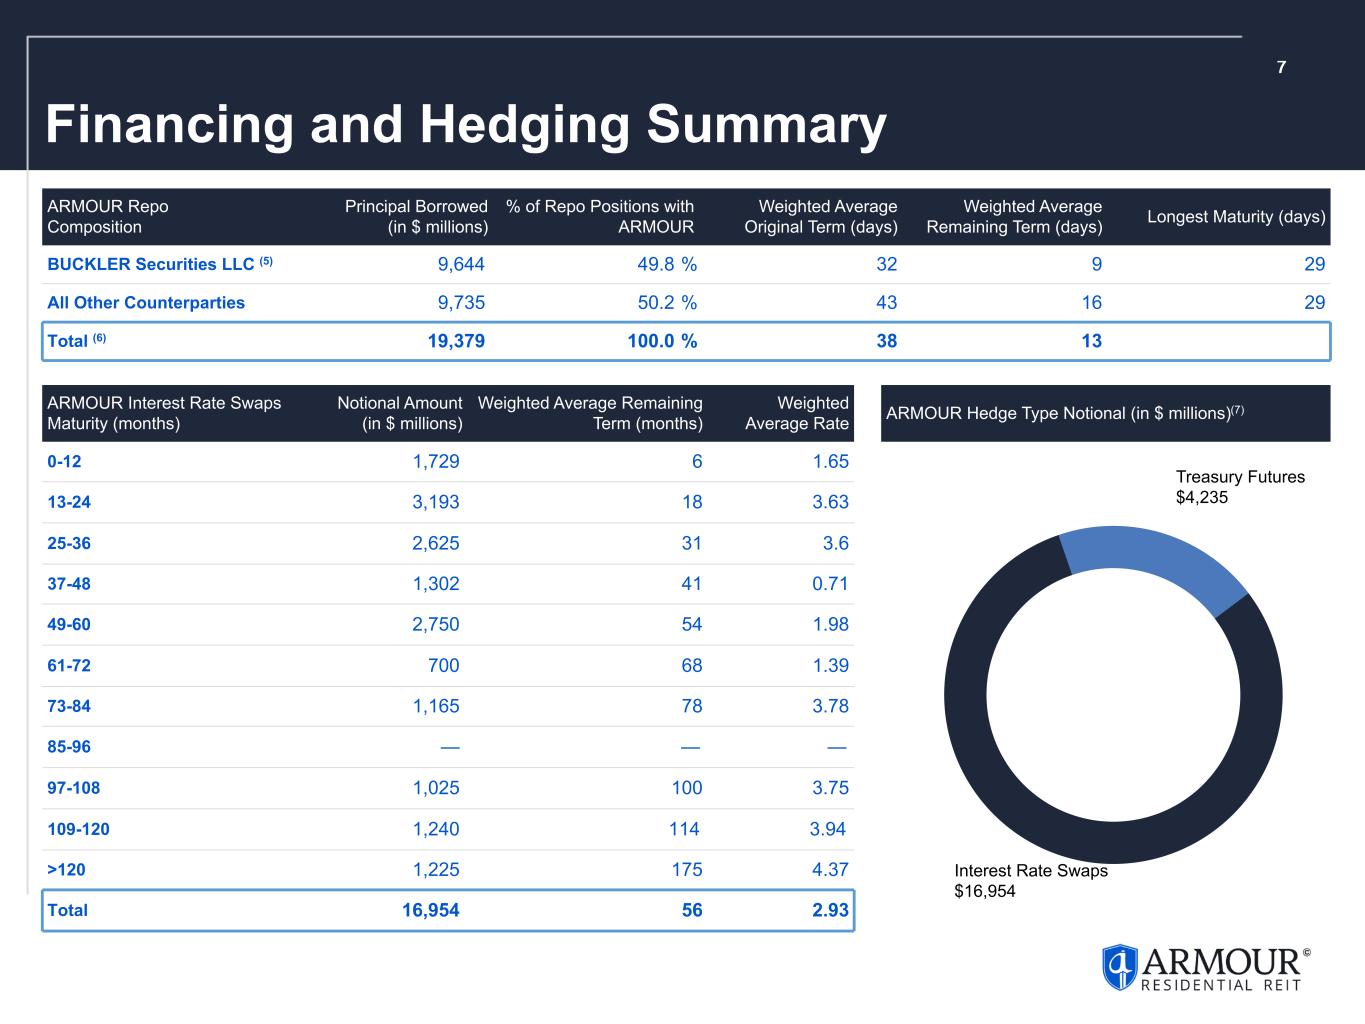
7 Financing and Hedging Summary ARMOUR Hedge Type Notional (in $ millions)(7) ARMOUR Repo Composition Principal Borrowed (in $ millions) % of Repo Positions with ARMOUR Weighted Average Original Term (days) Weighted Average Remaining Term (days) Longest Maturity (days) BUCKLER Securities LLC (5) 9,644 49.8 % 32 9 29 All Other Counterparties 9,735 50.2 % 43 16 29 Total (6) 19,379 100.0 % 38 13 ARMOUR Interest Rate Swaps Maturity (months) Notional Amount (in $ millions) Weighted Average Remaining Term (months) Weighted Average Rate 0-12 1,729 6 1.65 13-24 3,193 18 3.63 25-36 2,625 31 3.6 37-48 1,302 41 0.71 49-60 2,750 54 1.98 61-72 700 68 1.39 73-84 1,165 78 3.78 85-96 — — — 97-108 1,025 100 3.75 109-120 1,240 114 3.94 >120 1,225 175 4.37 Total 16,954 56 2.93 Interest Rate Swaps $16,954 Treasury Futures $4,235

8 Condensed Financials as of 9/30/2026
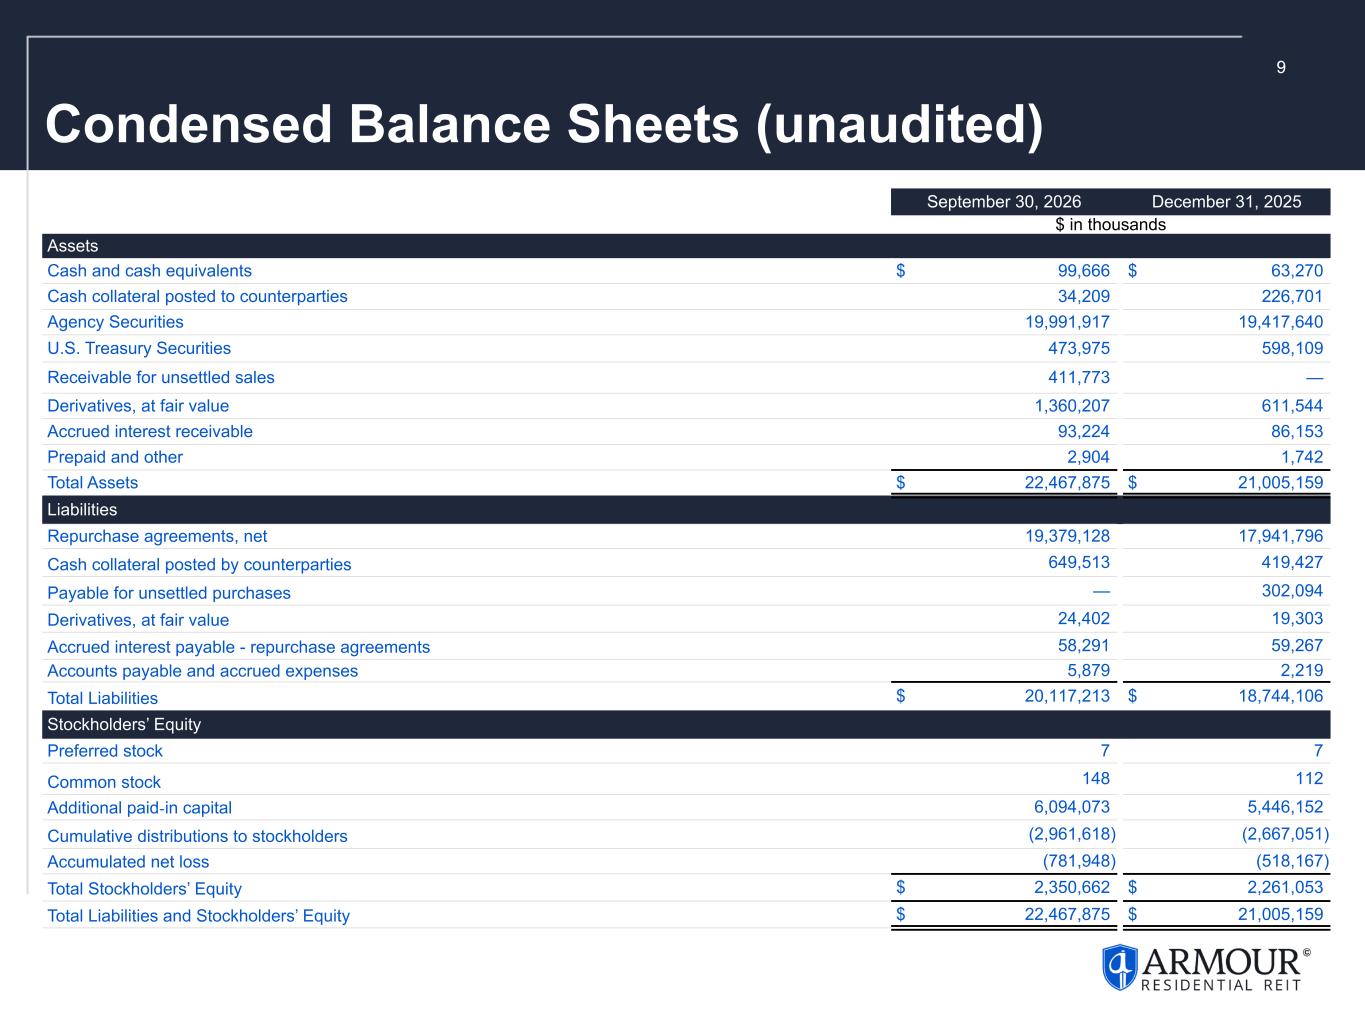
9 Condensed Balance Sheets (unaudited) September 30, 2026 December 31, 2025 $ in thousands Assets Cash and cash equivalents $ 99,666 $ 63,270 Cash collateral posted to counterparties 34,209 226,701 Agency Securities 19,991,917 19,417,640 U.S. Treasury Securities 473,975 598,109 Receivable for unsettled sales 411,773 — Derivatives, at fair value 1,360,207 611,544 Accrued interest receivable 93,224 86,153 Prepaid and other 2,904 1,742 Total Assets $ 22,467,875 $ 21,005,159 Liabilities Repurchase agreements, net 19,379,128 17,941,796 Cash collateral posted by counterparties 649,513 419,427 Payable for unsettled purchases — 302,094 Derivatives, at fair value 24,402 19,303 Accrued interest payable - repurchase agreements 58,291 59,267 Accounts payable and accrued expenses 5,879 2,219 Total Liabilities $ 20,117,213 $ 18,744,106 Stockholders’ Equity Preferred stock 7 7 Common stock 148 112 Additional paid‑in capital 6,094,073 5,446,152 Cumulative distributions to stockholders (2,961,618) (2,667,051) Accumulated net loss (781,948) (518,167) Total Stockholders’ Equity $ 2,350,662 $ 2,261,053 Total Liabilities and Stockholders’ Equity $ 22,467,875 $ 21,005,159
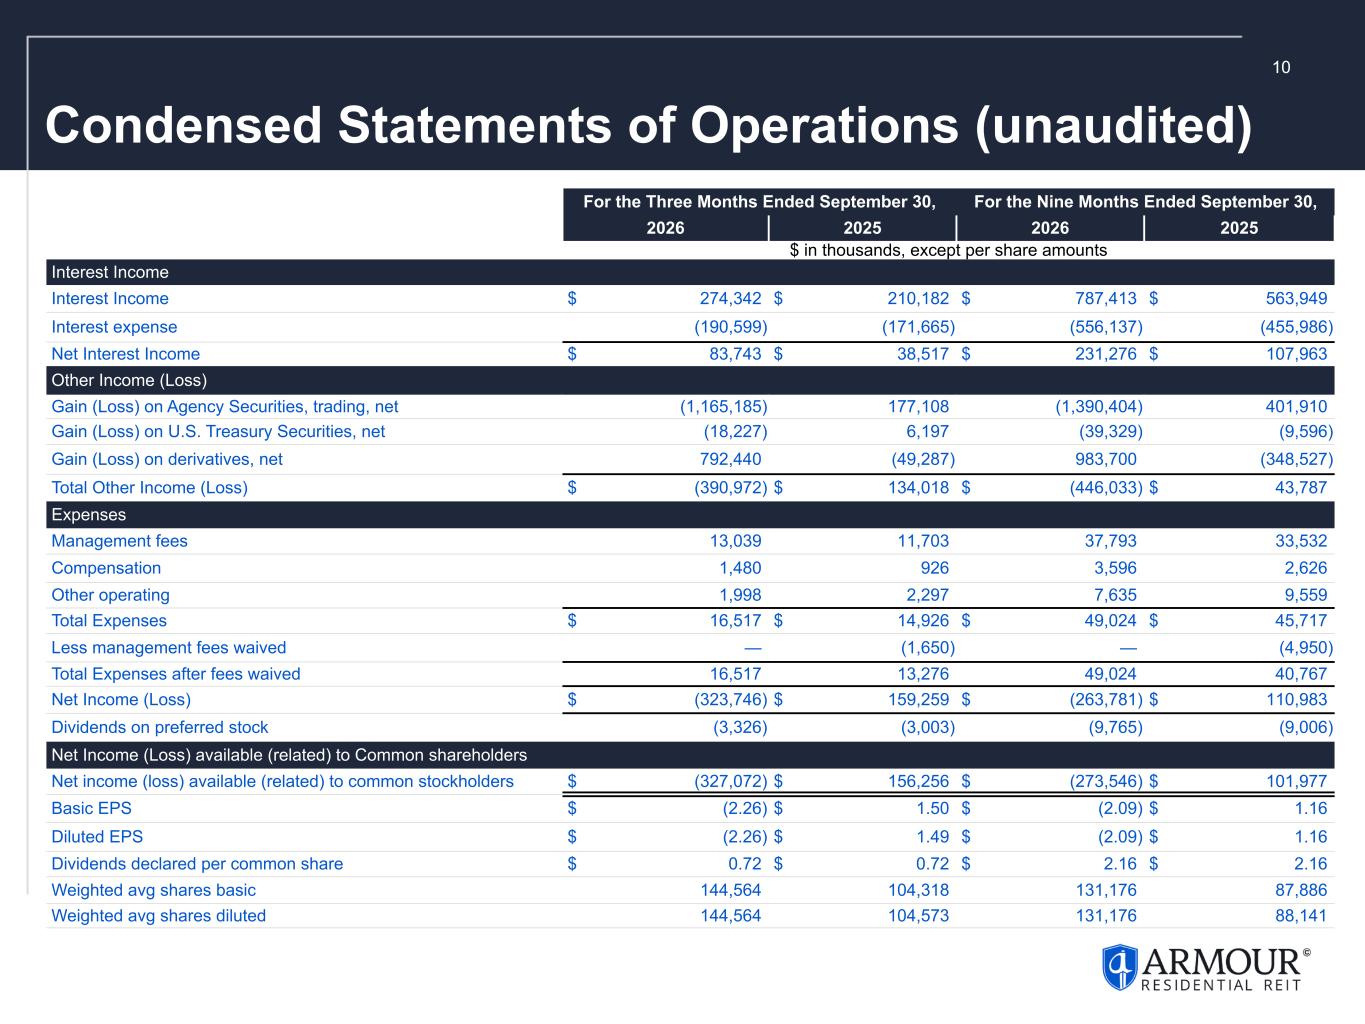
10 Condensed Statements of Operations (unaudited) For the Three Months Ended September 30, For the Nine Months Ended September 30, 2026 2025 2026 2025 $ in thousands, except per share amounts Interest Income Interest Income $ 274,342 $ 210,182 $ 787,413 $ 563,949 Interest expense (190,599) (171,665) (556,137) (455,986) Net Interest Income $ 83,743 $ 38,517 $ 231,276 $ 107,963 Other Income (Loss) Gain (Loss) on Agency Securities, trading, net (1,165,185) 177,108 (1,390,404) 401,910 Gain (Loss) on U.S. Treasury Securities, net (18,227) 6,197 (39,329) (9,596) Gain (Loss) on derivatives, net 792,440 (49,287) 983,700 (348,527) Total Other Income (Loss) $ (390,972) $ 134,018 $ (446,033) $ 43,787 Expenses Management fees 13,039 11,703 37,793 33,532 Compensation 1,480 926 3,596 2,626 Other operating 1,998 2,297 7,635 9,559 Total Expenses $ 16,517 $ 14,926 $ 49,024 $ 45,717 Less management fees waived — (1,650) — (4,950) Total Expenses after fees waived 16,517 13,276 49,024 40,767 Net Income (Loss) $ (323,746) $ 159,259 $ (263,781) $ 110,983 Dividends on preferred stock (3,326) (3,003) (9,765) (9,006) Net Income (Loss) available (related) to Common shareholders Net income (loss) available (related) to common stockholders $ (327,072) $ 156,256 $ (273,546) $ 101,977 Basic EPS $ (2.26) $ 1.50 $ (2.09) $ 1.16 Diluted EPS $ (2.26) $ 1.49 $ (2.09) $ 1.16 Dividends declared per common share $ 0.72 $ 0.72 $ 2.16 $ 2.16 Weighted avg shares basic 144,564 104,318 131,176 87,886 Weighted avg shares diluted 144,564 104,573 131,176 88,141
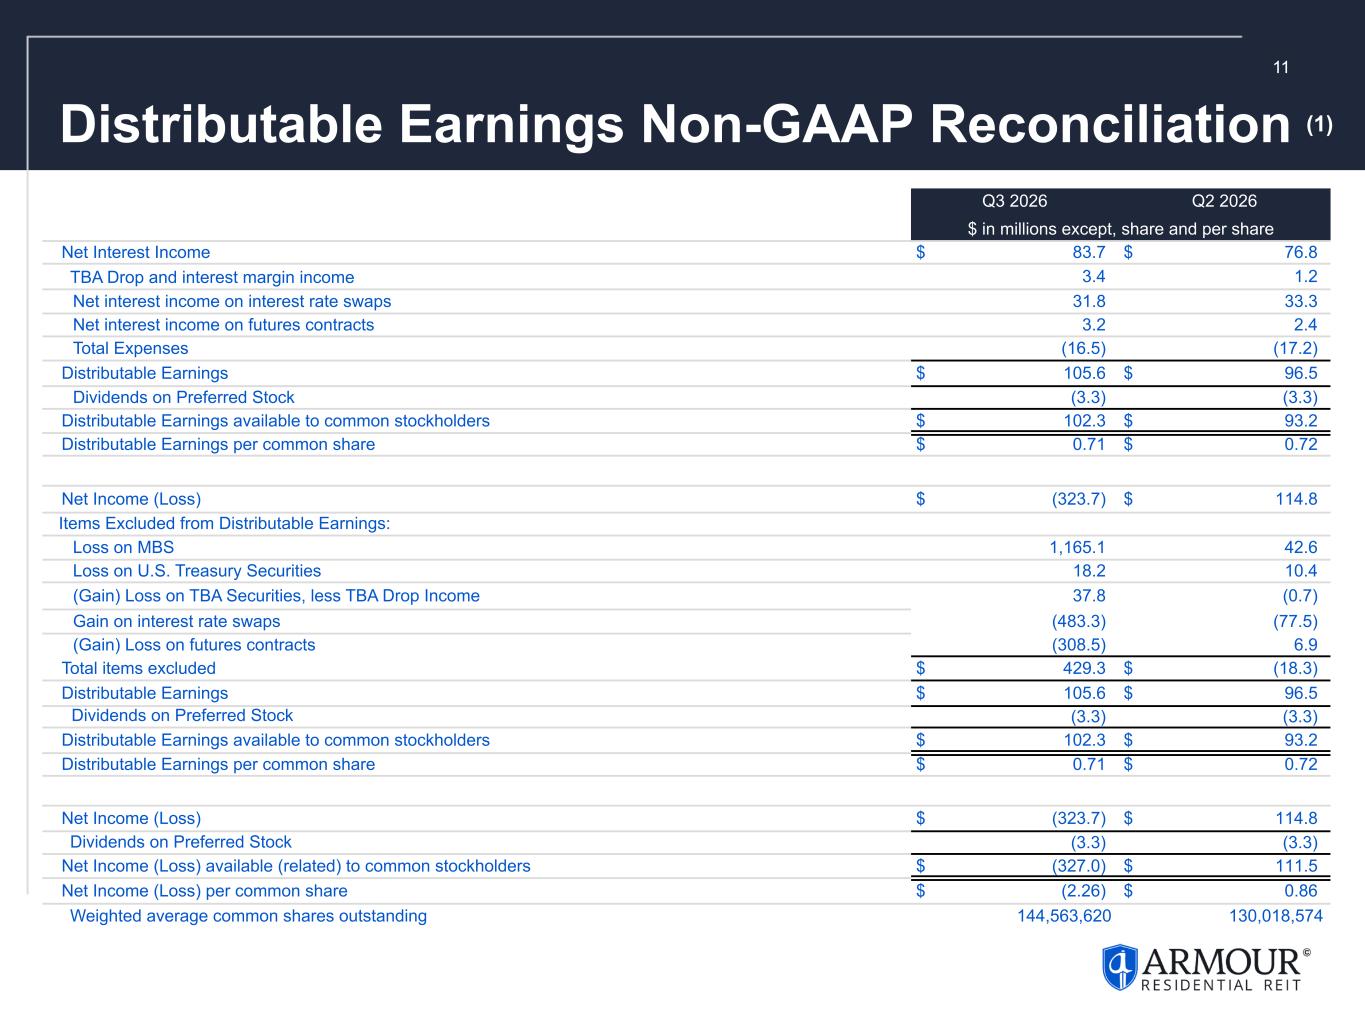
11 Distributable Earnings Non-GAAP Reconciliation (1) Q3 2026 Q2 2026 $ in millions except, share and per share Net Interest Income $ 83.7 $ 76.8 TBA Drop and interest margin income 3.4 1.2 Net interest income on interest rate swaps 31.8 33.3 Net interest income on futures contracts 3.2 2.4 Total Expenses (16.5) (17.2) Distributable Earnings $ 105.6 $ 96.5 Dividends on Preferred Stock (3.3) (3.3) Distributable Earnings available to common stockholders $ 102.3 $ 93.2 Distributable Earnings per common share $ 0.71 $ 0.72 Net Income (Loss) $ (323.7) $ 114.8 Items Excluded from Distributable Earnings: Loss on MBS 1,165.1 42.6 Loss on U.S. Treasury Securities 18.2 10.4 (Gain) Loss on TBA Securities, less TBA Drop Income 37.8 (0.7) Gain on interest rate swaps (483.3) (77.5) (Gain) Loss on futures contracts (308.5) 6.9 Total items excluded $ 429.3 $ (18.3) Distributable Earnings $ 105.6 $ 96.5 Dividends on Preferred Stock (3.3) (3.3) Distributable Earnings available to common stockholders $ 102.3 $ 93.2 Distributable Earnings per common share $ 0.71 $ 0.72 Net Income (Loss) $ (323.7) $ 114.8 Dividends on Preferred Stock (3.3) (3.3) Net Income (Loss) available (related) to common stockholders $ (327.0) $ 111.5 Net Income (Loss) per common share $ (2.26) $ 0.86 Weighted average common shares outstanding 144,563,620 130,018,574
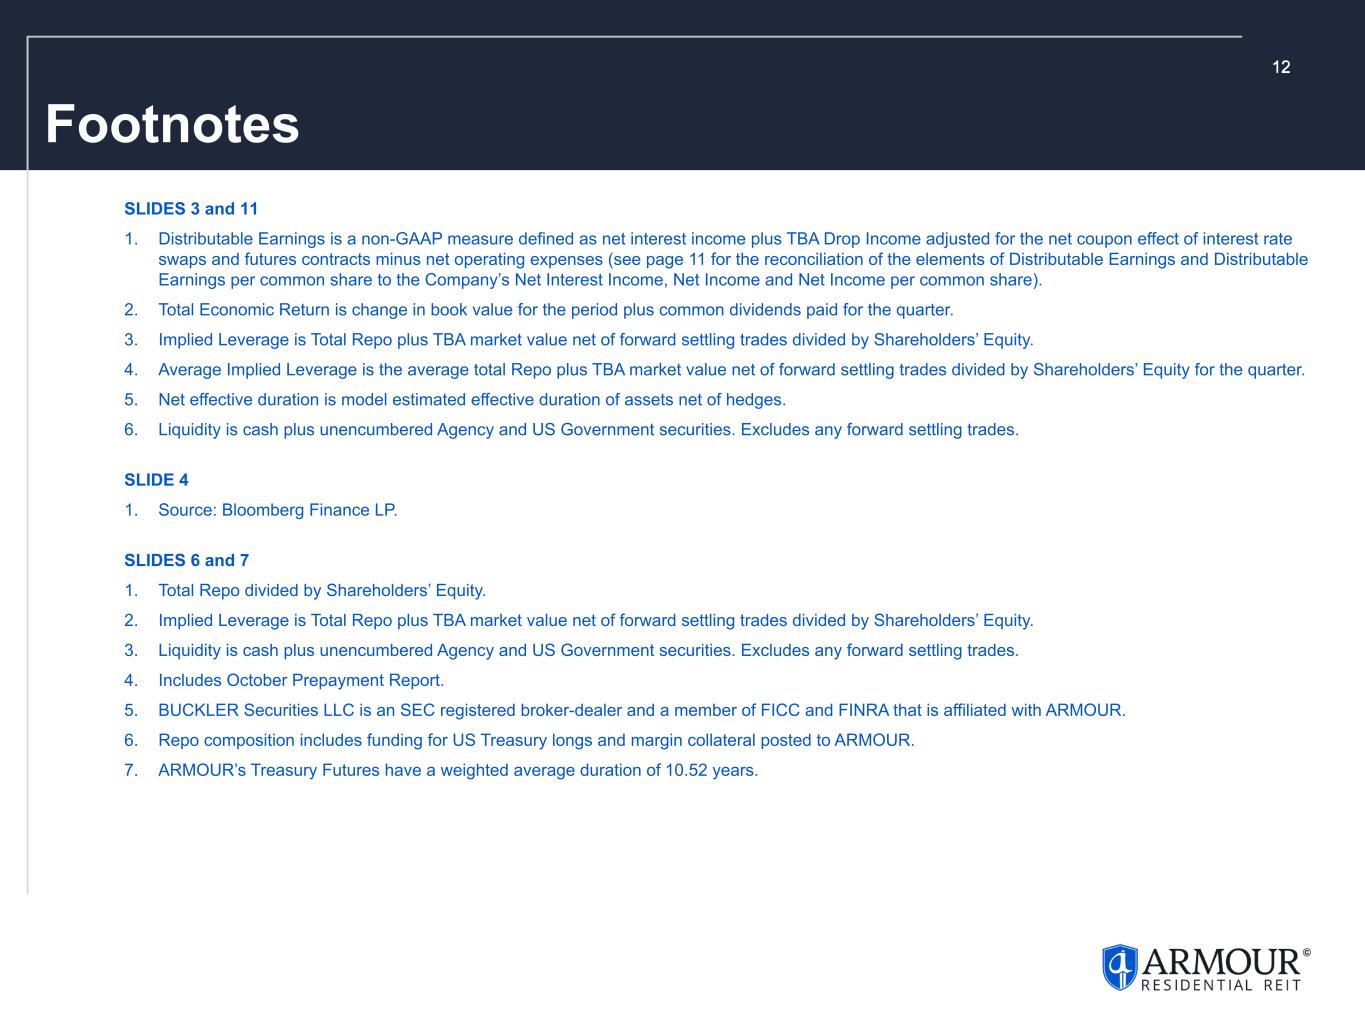
12 SLIDES 3 and 11 1. Distributable Earnings is a non-GAAP measure defined as net interest income plus TBA Drop Income adjusted for the net coupon effect of interest rate swaps and futures contracts minus net operating expenses (see page 11 for the reconciliation of the elements of Distributable Earnings and Distributable Earnings per common share to the Company’s Net Interest Income, Net Income and Net Income per common share). 2. Total Economic Return is change in book value for the period plus common dividends paid for the quarter. 3. Implied Leverage is Total Repo plus TBA market value net of forward settling trades divided by Shareholders’ Equity. 4. Average Implied Leverage is the average total Repo plus TBA market value net of forward settling trades divided by Shareholders’ Equity for the quarter. 5. Net effective duration is model estimated effective duration of assets net of hedges. 6. Liquidity is cash plus unencumbered Agency and US Government securities. Excludes any forward settling trades. SLIDE 4 1. Source: Bloomberg Finance LP. SLIDES 6 and 7 1. Total Repo divided by Shareholders’ Equity. 2. Implied Leverage is Total Repo plus TBA market value net of forward settling trades divided by Shareholders’ Equity. 3. Liquidity is cash plus unencumbered Agency and US Government securities. Excludes any forward settling trades. 4. Includes October Prepayment Report. 5. BUCKLER Securities LLC is an SEC registered broker-dealer and a member of FICC and FINRA that is affiliated with ARMOUR. 6. Repo composition includes funding for US Treasury longs and margin collateral posted to ARMOUR. 7. ARMOUR’s Treasury Futures have a weighted average duration of 10.52 years. Footnotes
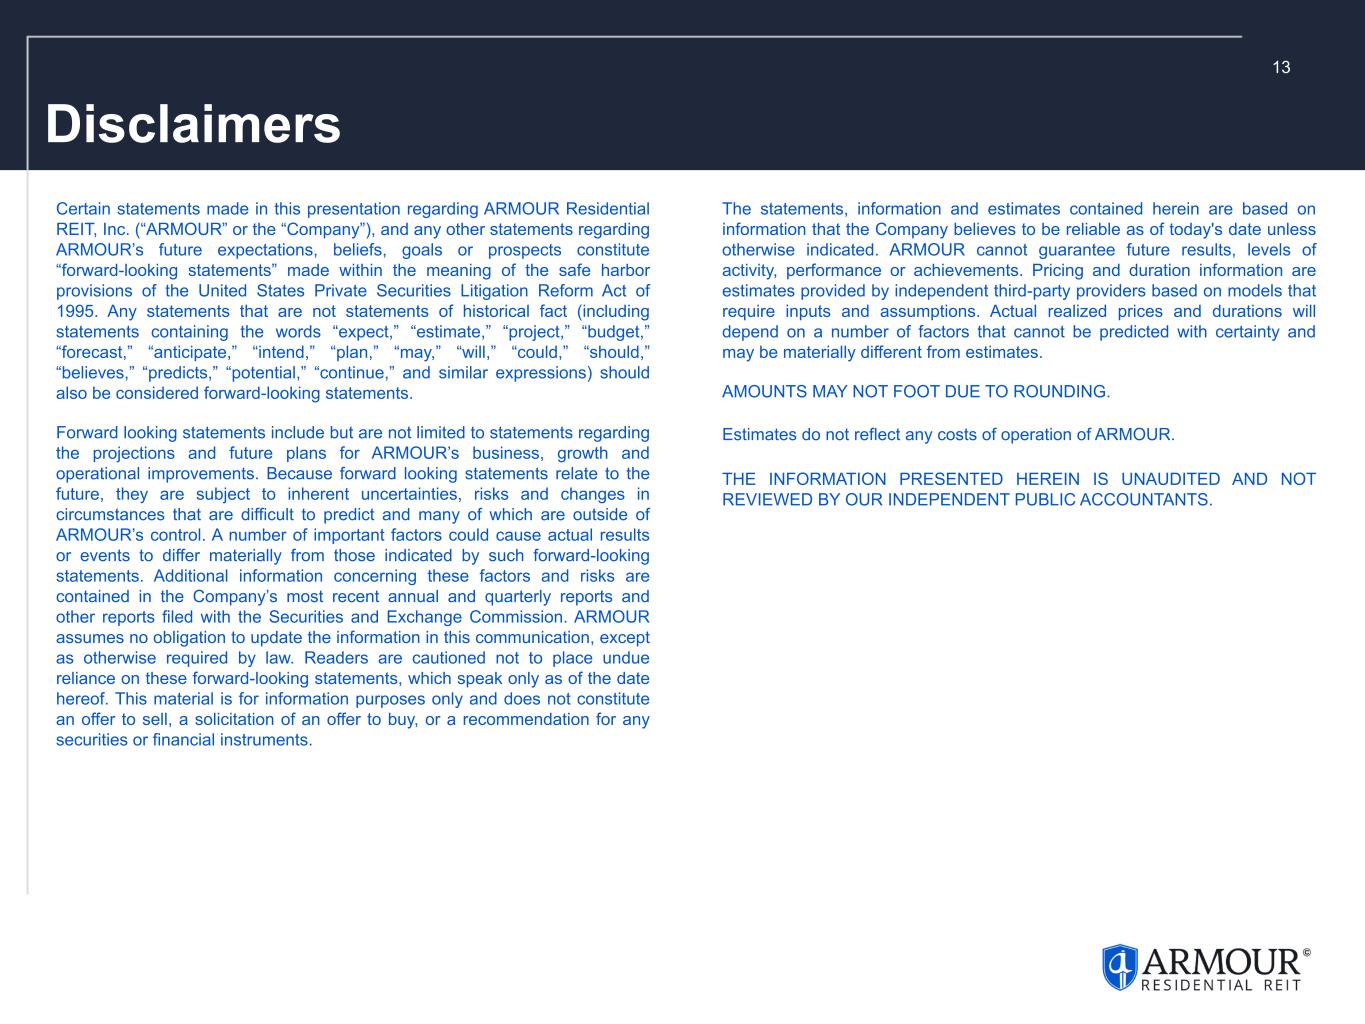
13 Certain statements made in this presentation regarding ARMOUR Residential REIT, Inc. (“ARMOUR” or the “Company”), and any other statements regarding ARMOUR’s future expectations, beliefs, goals or prospects constitute “forward-looking statements” made within the meaning of the safe harbor provisions of the United States Private Securities Litigation Reform Act of 1995. Any statements that are not statements of historical fact (including statements containing the words “expect,” “estimate,” “project,” “budget,” “forecast,” “anticipate,” “intend,” “plan,” “may,” “will,” “could,” “should,” “believes,” “predicts,” “potential,” “continue,” and similar expressions) should also be considered forward-looking statements. Forward looking statements include but are not limited to statements regarding the projections and future plans for ARMOUR’s business, growth and operational improvements. Because forward looking statements relate to the future, they are subject to inherent uncertainties, risks and changes in circumstances that are difficult to predict and many of which are outside of ARMOUR’s control. A number of important factors could cause actual results or events to differ materially from those indicated by such forward-looking statements. Additional information concerning these factors and risks are contained in the Company’s most recent annual and quarterly reports and other reports filed with the Securities and Exchange Commission. ARMOUR assumes no obligation to update the information in this communication, except as otherwise required by law. Readers are cautioned not to place undue reliance on these forward-looking statements, which speak only as of the date hereof. This material is for information purposes only and does not constitute an offer to sell, a solicitation of an offer to buy, or a recommendation for any securities or financial instruments. The statements, information and estimates contained herein are based on information that the Company believes to be reliable as of today's date unless otherwise indicated. ARMOUR cannot guarantee future results, levels of activity, performance or achievements. Pricing and duration information are estimates provided by independent third-party providers based on models that require inputs and assumptions. Actual realized prices and durations will depend on a number of factors that cannot be predicted with certainty and may be materially different from estimates. AMOUNTS MAY NOT FOOT DUE TO ROUNDING. Estimates do not reflect any costs of operation of ARMOUR. THE INFORMATION PRESENTED HEREIN IS UNAUDITED AND NOT REVIEWED BY OUR INDEPENDENT PUBLIC ACCOUNTANTS. Disclaimers