2026 No. 27
|
TSX, NYSE - HBM 2026 No. 27 |
| 25 York Street, Suite 800 Toronto, Ontario Canada M5J 2V5 tel 416 362-8181 fax 416 362-7844 hudbay.com |
News Release |
Hudbay and Mitsubishi Approve Copper World Project Construction; Advancing Next Major U.S. Copper Mine Towards First Production in 2029
Toronto, Ontario, October 21, 2026 - Hudbay Minerals Inc. ("Hudbay" or the "Company") (TSX, NYSE: HBM) today announced the results of the definitive feasibility study and related pre-feasibility studies (collectively, the "DFS") for its 70%-owned Copper World project in Arizona, located approximately 50 kilometres (31 miles) southeast of Tucson. Copper World is 30%-owned by Mitsubishi Corporation ("Mitsubishi") pursuant to a joint venture agreement entered into with Hudbay in January 2026. Supported by a robust DFS, Hudbay and Mitsubishi have formally approved the final investment decision to proceed with the construction and development of Copper World as the next major copper mine in the U.S. with first production targeted for the second half of 2029. Hudbay will be filing a technical report pursuant to National Instrument 43-101 containing the results of the DFS for Copper World. All dollar amounts are in U.S. dollars, unless otherwise noted. "Tonnes" refer to metric tonnes and "tons" refer to imperial or U.S. short tons.
Copper World Will Be One of the Largest Open-Pit Copper Mines in the United States, Doubling Hudbay's Annual Copper Production Levels
● With first production projected in the second half of 2029, Copper World will be the first of the next generation of long-life, low-cost copper mines in the Americas.
● Copper World DFS outlines annual copper production of 102,000 tonnes over the first 10 years, an 11% increase when compared to 92,000 tonnes in Hudbay's 2023 pre-feasibility study for Copper World ("2023 PFS").
● Average annual cash costsi of $1.65 per pound over the first 10 years continues to position Copper World as one of the lowest cost open-pit copper mines in the U.S.ii
● Hudbay's consolidated annual copper production is expected to increase to approximately 250,000 tonnes, doubling current production levels, with other brownfield growth projects underway.
Robust Base Case Project Economics and Strong Returns with Unique Extension Optionality
● The base case for the Copper World project ("Base Case") contemplates a 15-year mine life utilizing mineral reserves, requires only state and local permits and contemplates a comparable total mill feed tonnage to the 2023 PFS. Base Case after-tax net present value (8%) of $1.2 billion and internal rate of return of 17% at a long-term copper price of $5.00 per pound, increasing to $2.3 billion and 22%, respectively, at a copper price of $6.00 per pound.
● Base Case further optimizes the 2023 PFS mine plan with an in-pit crushing and conveying system in year four and an expansion of the concentrator from 60,000 tons per day to 90,000 tons per day in year five. Concentrator expansion enables a 43% increase in average annual copper production to 120,000 tonnes in years six to 10 compared to 84,000 tonnes over the first five years.
● The extension case for the Copper World project contemplates a 37-year mine life utilizing only measured and indicated mineral resources and expands mining activities onto federal lands in year 10, subject to obtaining federal permits ("Extension Case"), maintaining annual copper production of 117,000 tonnes from years 11 to 20. The Extension Case incorporates and further optimizes the second phase from Hudbay's 2022 preliminary economic assessment ("2022 PEA") with less additional growth capital. Extension Case after-tax net present value (8%) of $2.5 billion and internal rate of return of 19% at a long-term copper price of $5.00 per pound, increasing to $4.0 billion and 24%, respectively, at a copper price of $6.00 per pound.
|
TSX, NYSE - HBM 2026 No. 27 |
Copper World is One of the Lowest Capital Intensity Copper Projects, Prudently Funded with Low-Leverage Financing Plan
● Initial growth capital of $2.07 billioniii ($1.84 billion net of precious metals stream deposit) includes approximately $200 million related to changes in project scope since the 2023 PFS providing an optimized pathway to the expansion to 90,000 tons per day in year five.
● Copper World maintains an attractive capital intensity of approximately $22,600 per annual copper tonne using average production in years five to twelve, including the expansion capital in years three and four.
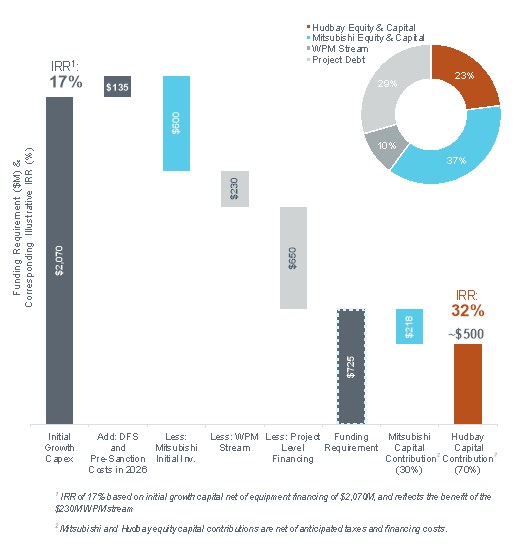
● Well balanced project funding plan with initial capital provided by Mitsubishi's $600 million initial joint venture equity investment and Wheaton Precious Metals Corp.'s ("Wheaton") $230 million deposit for the existing precious metals stream, followed by approximately $650 million in anticipated project-level debt financing, representing less than 30% leverage. Balance of funding from Hudbay and Mitsubishi's pro-rata equity capital contributions is deferred to 2028.
Transformative Copper World Project to be Delivered with Disciplined Capital Allocation and Prudent Funding Plan Leading to Superior IRRs for Hudbay
● With the successful execution of its disciplined capital allocation strategy, attracting Mitsubishi as a long-term strategic joint venture partner and prudent project funding plan, Hudbay's Copper World capital contributions are expected to be approximately $500 million, representing less than 25% of the initial growth capital, with capital contributions not required until 2028. Hudbay is well-positioned to fund capital contributions from its existing cash balance and liquidity, as well as projected strong free cash flow from its diversified operations during Copper World's project development.
● The levered IRR to Hudbay increases to 32% at $5.00 per pound of copper long-term in the Base Case and to 44% at $6.00 per pound of copper in the Extension Case. Copper World's final investment decision enables Hudbay to deliver on its growth initiatives and maximize long-term risk-adjusted returns, while maintaining strong financial discipline within Hudbay's holistic capital allocation framework.
● Copper World is expected to deliver average annual EBITDAiv of $661 million over the first 10 years in the Base Case and $735 million over the next 10 years in the Extension Case at a copper price of $5.00 per pound. Using a copper price of $6.00 per pound, Copper World's annual EBITDA over these periods increases to $859 million and $963 million in the Base Case and Extension Case, respectively, representing an 80% to 90% increase in Hudbay's consolidated annual EBITDA as compared to 2025.
● Copper World project sanctioning is supported by Hudbay's strong balance sheet, which has been further improved with a proactive two-year extension of the Company's senior secured revolving credit facilities from November 2028 to November 2030 and an upsize of the facilities to $700 million. Closing of the upsized credit facilities is expected in the fourth quarter and the extended term will provide increased financial flexibility to manage the maturity of the Company's 6.125% coupon 2029 senior unsecured notes and develop the Copper World project. The amended credit facilities also include an improved pricing grid reflecting the enhanced financial position of Hudbay and feature an opportunity to increase the facility by an additional $150 million at Hudbay's discretion during the four-year tenor, providing additional financial flexibility.
Copper World Expected to Deliver Strong Benefits to All Stakeholders for Decades
● Copper World is one of the highest-grade open pit copper projects in the Americasv with proven and probable mineral reserves of 390 million tonnes at 0.47% copper and a 15-year mine life with a low strip ratio of 1.5.
● Measured and indicated resources of 1.2 billion tonnes (inclusive of reserves) at 0.40% copper have the potential to extend the mine life for decades, to a total of 37 years, as demonstrated by the Extension Case.
● Significant benefits for the community and local economy in Arizona through payments of $1.1 billion to $3.7 billion in total U.S. taxes and the creation of over 1,000 construction jobs, 500 permanent, multi-generational jobs and up to 3,000 indirect jobs.
|
TSX, NYSE - HBM 2026 No. 27 |
● The fully permitted concentrate leach facility-which would produce "Made in America" copper cathode for the U.S. critical minerals supply chain-represents a key future upside opportunity. Backed by advanced engineering work, it has the potential to add approximately $377 million of additional after-tax net present value to Copper Worldvi.
"The approval of the development of Copper World represents a significant milestone for Hudbay, our partners at Mitsubishi, our stakeholders, and the copper landscape in the U.S.," said Peter Kukielski, Hudbay's Chief Executive Officer. "Copper World is one of the most attractive copper growth projects in the Americas, offering some of the highest copper grades, lowest cash costs and favourable capital intensity. This project adds more than 100,000 tonnes of annual copper production over the first 10 years, and the DFS demonstrates the full potential of the project in the Extension Case, delivering higher annual copper production for more than 30 years. It also adds a fourth operating asset to our diversified operating platform and further enhances our tier one operating jurisdictions profile with the addition of the U.S. We are continuing to set the new gold standard in copper as we embark on building a leading copper district in Arizona."
"The robust Copper World DFS and our joint final investment decision paves the road to production in the second half of 2029, establishing a low-capital intensity, high-margin operation that will generate strong long-term returns for Hudbay, Mitsubishi and our stakeholders," said Eugene Lei, Hudbay's President and Chief Financial Officer and Chair of the Copper World Joint Venture Board. "We successfully executed a disciplined capital allocation strategy and ideal funding plan that only requires Hudbay to fund one-quarter of the project capital cost and defers Hudbay's first capital contribution to 2028, resulting in superior IRRs. We are well-positioned to fund our share of the Copper World project capital and make generational investments in our operating mines with existing cash on hand and strong free cash flow from our diversified operations to double our copper production per share."
"The final investment decision for Copper World marks the beginning of a new phase for the joint venture," said Taro Abe, Mitsubishi's Critical Minerals Division COO, Mineral Resources Group. "We are pleased to move forward with the project and advance it toward first production in the second half of 2029. Copper World is important to our growth strategy and the U.S. copper landscape, with the potential to deliver lasting benefits to communities and stakeholders. As a committed long-term partner, we continue to leverage our broad business footprint in North America and extensive experience in mining project development and marketing to maximize the value of the Copper World joint venture."
Copper World De-Risked and Optimized Through Feasibility and Pre-feasibility Studies
The Copper World project includes four deposits discovered in 2021, together with the East deposit. Copper World is planned to be a traditional open pit shovel and truck operation with a conventional flotation concentrator producing copper concentrate and molybdenum concentrate. A new resource model was completed for the 2022 PEA, which contemplated a two-phased mine plan with Phase I as a stand-alone operation requiring state and local permits only and Phase II expanding onto federal lands requiring federal permits. Phase I contemplated a 60,000 tons per day sulfide concentrator and Phase II assumed an expansion of the concentrator to 90,000 tons per day.
In September 2023, Hudbay released the 2023 PFS for Copper World reflecting the results of further technical work on Phase I of the project. Phase I had a mine life of 20 years, reflecting a 60,000 tons per day sulfide concentrator that would produce copper concentrate as a final product. The 2023 PFS also contemplated the addition of a concentrate leach facility and a solvent extraction and electrowinning plant in year five that would allow the project to produce copper cathode.
Since 2023, Hudbay has focused on metallurgical testing and progressing the engineering of the initial operation to a feasibility study level, in addition to completing related pre-feasibility studies on the mill expansion and IPCC projects listed below, trade-off studies and de-risking activities. Hudbay has also received all major permits required to bring the mine plan into operation under the 60,000 tons per day concentrator scenario and secured Mitsubishi as a 30% joint venture partner.
|
TSX, NYSE - HBM 2026 No. 27 |
The principal enhancements since the 2023 PFS include several optimizations:
● Concentrator Expansion to 90,000 tons per day - The current plan contemplates an expansion of the milling capacity starting in year five to 90,000 tons per day from 60,000 tons per day. The $443 million in capital invested in year four for the concentrator expansion is expected to be funded from cash flows from the operation and a $70 million additional payment from Wheaton in year five.
● In-Pit Crushing and Conveying ("IPCC") - Copper World's development plan contemplates the addition of an IPCC system starting in year four to efficiently manage the higher mined material tonnages to match the concentrator expansion throughput in year five. The IPCC system will have a nominal design capacity of 100,000 tons per day and forms a critical component of the mine plan that will convey ore from the East pit to stockpiles and the processing plant. The IPCC will enable fewer haul trucks and lower emissions and operating costs.
● Enhanced Tailings Strategy - The current plan contemplates a conversion from conventional tailings deposition to filtered tailings for approximately one-third of the total volume of tailings in the Base Case starting in year five, enabling the concentrator expansion with no additional water supply required.
● Lower Mine Strip Ratio - The mine plan has been optimized for space constraints for tailings and waste rock disposition in the Base Case, reflecting a new flotation recovery formulation with updated price and cost assumptions and resulting in an approximately 20% smaller East pit with a significant reduction in the strip ratio through lower waste mined.
● Extension Case Illustrates Project's Full Potential - Pre-feasibility work has been advanced on the scenario that contemplates an extension of mining activities onto Copper World's unpatented claims and the associated federal lands in year 10, subject to obtaining federal permits. The Extension Case incorporates and further optimizes the second phase from Hudbay's 2022 PEA, illustrating the full potential of Copper World and extending the mine life to 37 years. Under FAST41, mining projects in Arizona have received federal permits in approximately three years.
● Concentrate Leach Facility Continues to Provide Future Optionality - Significant engineering work has advanced to pre-feasibility level on the concentrate leach facility to establish its technical viability and provide the option to produce "Made in America" copper cathode in the future. The Company will continue to evaluate Copper World's concentrate leach facility considering future market conditions, such as premiums for copper metal in the U.S., and the unique strategic opportunity it presents as one of the few fully permitted domestic copper cathode producing facilities in the U.S. It also presents opportunities to unlock potential synergies with Hudbay's Cactus project in Arizona.
2026 DFS Summary
The Base Case presented in the DFS is used to support the mineral reserve estimates of 390 million tonnes with strong copper grades of 0.47% over a 15 year mine plan. Total mill feed tonnage in the Base Case is comparable to the 2023 PFS. The Base Case is limited to the exterior boundary of Copper World's private landholdings requiring only state and local permits. All major permits have been obtained for construction and initial operations. Please refer to Figure 1 for an overview of the site layout in the Base Case.
● Base Case after-tax net present value (8%) is $1.2 billion with an internal rate of return of 17% and an initial payback period of 5.4 years at a long-term copper price of $5.00 per pound. At a copper price of $6.00 per pound, the after-tax net present value (8%) increases to $2.3 billion and the internal rate of return increases to 22%.
● Base Case average annual copper production is 102,000 tonnes over the first 10 years at average cash costsi and sustaining cash costsi of $1.65 and $2.22 per pound of copper, respectively.
● Base Case annual average EBITDA is $566 million at a long-term copper price of $5.00 per pound, increasing to $742 million at a long-term copper price of $6.00 per pound.
The Extension Case reflects a phased development approach that minimizes initial waste rock movement while operations remain constrained to the existing exterior boundary over the first 10 years and then expand beyond Copper World's private property and onto its unpatented lode and mill site claims starting in year 10 to achieve and sustain a higher total material movement capacity. The Extension Case contemplates a 37-year mine life utilizing only measured and indicated mineral resources totalling 1,048 million tonnes and requires federal permits by year 10 of operations.
● Extension Case after-tax net present value (8%) is $2.5 billion with an internal rate of return of 19% and an initial payback period of 5.4 years at a long-term copper price of $5.00 per pound. At a copper price of $6.00 per pound, the after-tax net present value (8%) increases to $4.0 billion and the internal rate of return increases to 24%.
|
TSX, NYSE - HBM 2026 No. 27 |
● Extension Case average annual copper production over the first 10 years is similar to the Base Case with 101,000 tonnes and increases to 117,000 tonnes on over the period from year 11 to 20. Average cash costsi and sustaining cash costsi over the 10-year period from year 11 to 20 are expected to be $1.76 and $2.20 per pound of copper, respectively.
● Extension Case average annual EBITDA is $522 million over the mine life and $735 million over the period from year 11 to 20 at a long-term copper price of $5.00 per pound.
As shown in Figure 2, following the concentrator expansion in year five, annual copper production increases to an average of 122,000 tonnes between year five and year twelve in the Base Case, excluding low-grade stockpile years at the end of the mine life, and average annual cash costsi decrease to $1.46 per pound of copper over this period. The elevated production levels further extend to beyond year 20 in the Extension Case as additional resources are mined and utilize the larger concentrator capacity.
A summary of key valuation, production and cost details can be found below. For further details, including operating and cash flow metrics provided on an annual basis, please refer to Exhibit 1 at the end of this news release.
| BASE CASE - Summary of Key Metrics (at $5.00/lb Cu long-term) | ||||||||||||
| Valuation Metrics (Unlevered)1 | Unit | Base Case | ||||||||||
| Net present value @ 8% | $ millions | $1,241 | ||||||||||
| Internal rate of return | % | 16.8% | ||||||||||
| Payback period | # years | 5.4 | ||||||||||
| Initial & Expansionary Capital | Unit | Base Case | ||||||||||
| Growth capital - initial (year -3 to year -1)2 | $ millions | $2,070 | ||||||||||
| Growth capital - molybdenum plant (year 1) | $ millions | $25 | ||||||||||
| Growth capital - IPCC (year 3)3 | $ millions | $242 | ||||||||||
| Growth capital - concentrator expansion (year 4)3 | $ millions | $443 | ||||||||||
| Operating Metrics | Unit | Years 1-5 |
Years 6-10 |
Years 11-15 |
Years 1-10 |
LOM | ||||||
| Copper production (annual avg.)4 | 000 tonnes | 84 | 120 | 77 | 102 | 95 | ||||||
| EBITDA (annual avg.)5 | $ millions | $531 | $791 | $377 | $661 | $566 | ||||||
| Sustaining capital (annual avg.) | $ millions | $50 | $35 | $11 | $43 | $32 | ||||||
| Cash cost6 | $/lb Cu | $1.80 | $1.55 | $1.85 | $1.65 | $1.70 | ||||||
| Sustaining cash cost6 | $/lb Cu | $2.57 | $1.98 | $2.17 | $2.22 | $2.21 | ||||||
| BASE CASE - Copper Price Sensitivity Analysis | ||||||||||||
| Unit | $4.50/lb | Base Case $5.00/lb |
$5.50/lb | $6.00/lb | $6.50/lb | |||||||
| Net present value1 @ 8% | $ millions | $663 | $1,241 | $1,725 | $2,258 | $2,783 | ||||||
| Net present value1 @ 10% | $ millions | $345 | $845 | $1,254 | $1,708 | $2,156 | ||||||
| Internal rate of return1 | % | 12.9% | 16.8% | 19.5% | 22.5% | 25.2% | ||||||
| Payback period | # years | 5.9 | 5.4 | 5.1 | 4.8 | 4.5 | ||||||
| EBITDA (annual avg.)5 | $ millions | $471 | $566 | $652 | $742 | $833 | ||||||
| EXTENSION CASE - Summary of Key Metrics (at $5.00/lb Cu long-term) | |||||||
| Valuation Metrics (Unlevered)1 | Unit | Extension Case | |||||
| Net present value @ 8% | $ millions | $2,510 | |||||
| Internal rate of return | % | 18.8% | |||||
| Payback period7 | # years | 5.4 | |||||
| Initial & Expansionary Capital | Unit | Extension Case | |||||
| Growth capital - initial (year -3 to year -1)2 | $ millions | $2,070 | |||||
| Growth capital - molybdenum plant (year 1) | $ millions | $25 | |||||
| Growth capital - IPCC (year 3)3 | $ millions | $242 | |||||
| Growth capital - concentrator expansion (year 4)3 | $ millions | $443 | |||||
| Growth capital - filtered tailings and starter dams (years 10 and 11)3 | $ millions | $395 | |||||
| Operating Metrics | Unit | Years 1-10 |
Years 11-20 |
Years 21-30 |
Years 31-37 |
Years 1-30 |
LOM |
| Copper production (annual avg.)4 | 000 tonnes | 101 | 117 | 88 | 33 | 102 | 89 |
| EBITDA (annual avg.)5 | $ millions | $634 | $735 | $513 | $73 | $627 | $522 |
| Sustaining capital (annual avg.) | $ millions | $38 | $24 | $19 | $10 | $27 | $24 | ||||||
| Cash cost6 | $/lb Cu | $1.79 | $1.76 | $1.94 | $3.51 | $1.82 | $1.94 | ||||||
| Sustaining cash cost6 | $/lb Cu | $2.32 | $2.20 | $2.31 | $3.88 | $2.27 | $2.38 | ||||||
|
TSX, NYSE - HBM 2026 No. 27 |
| EXTENSION CASE - Copper Price Sensitivity Analysis | |||||||||||||
| Unit | $4.50/lb | Ext. Case | $5.50/lb | $6.00/lb | $6.50/lb | ||||||||
| Net present value1 @ 8% | $ millions | $1,702 | $2,510 | $3,225 | $3,983 | $4,726 | |||||||
| Net present value1 @ 10% | $ millions | $1,033 | $1,685 | $2,247 | $2,851 | $3,440 | |||||||
| Internal rate of return1 | % | 15.5% | 18.8% | 21.2% | 23.9% | 26.3% | |||||||
| Payback period | # years | 5.9 | 5.4 | 5.1 | 4.8 | 4.5 | |||||||
| EBITDA (annual avg.)5 | $ millions | $433 | $522 | $608 | $695 | $782 | |||||||
1 Calculated assuming the following long-term commodity prices: copper price of $5.00 per pound ($5.50 per pound in year 1 and $5.13 per pound in year 2), gold stream price of $540 per ounce (15% of market price), silver stream price of $6.75 per ounce (15% of market price), and molybdenum price of $17.50 per pound. Reflects the terms of the amended Wheaton stream agreement, including an upfront deposit of $230 million in the first year of construction in exchange for the delivery of 92.5% of the gold and silver contained in the mineral production, followed by an additional deposit of $70 million five years after commercial production is achieved, subject to the concentrator expansion reaching 90,000 tons per day.
2 Total initial growth capital expenditures are in 2026 dollars and net of $127 million of anticipated equipment financing. Equipment financing payments are incorporated in sustaining cash costs.
3 Expansion project capital estimates are based on pre-feasibility studies.
4 Copper production includes copper contained in concentrate sold. Average annual copper production excludes partial year of production in year 15 in the Base Case.
5 EBITDA is a non-GAAP financial performance measure with no standardized definition under IFRS. For further information, please refer to the Company's most recent Management's Discussion and Analysis for the three and six months ended June 30, 2026.
6 By-product credits calculated using amortization of deferred revenue for gold and silver stream sales as per the Company's approach in its quarterly financial reporting. Sustaining cash cost includes sustaining capital expenditures and royalties. Cash cost and sustaining cash cost are non-GAAP financial performance measures with no standardized definition under IFRS. For further information, please refer to the Company's most recent Management's Discussion and Analysis for the three and six months ended June 30, 2026.
7 Payback period in Extension Case does not include filtered tailings capital in years 10 and 11.
Initial Growth Capital Represents Attractive Capital Intensity of $22,600 per tonne
Growth capital includes two phases of construction. The first phase consists of the mine, 60,000 tons per day concentrator process plant, and related infrastructure totalling $2,070 millioniii in 2026 dollars ($1,840 million net of the precious metal stream payment) to be incurred over a 36-month period prior to commercial production in the second half of 2029. This includes approximately $200 million of initial growth capital related to project scope changes since the 2023 PFS. The second phase of construction consists of optimizations including the molybdenum processing plant, the IPCC system and the concentrator expansion. The molybdenum processing plant is planned for year one of operations and totals $25 million. The IPCC investment totals $242 million and is planned for year three in order to optimize hauling and rehandling costs starting in year four as the mine operations approach the East pit. The concentrator expansion capital totals $443 million and is planned for year four of operations to expand the daily processing capacity to 90,000 tons per day starting in year five, incorporating additional equipment and construction activities. The expansion capital in the second phase of construction is based on feasibility and pre-feasibility level studies and is expected to be fully funded by the cash flow generated by the operation. For further details on the capital cost estimates, timing and cash flows, please refer to Exhibit 1.
Copper World's capital intensity is approximately $22,600 per annual copper tonne using the increased average annual production in years five to twelve and reflecting the initial growth capital of $2,070 millioniii, IPCC expansion growth capital of $242 million in year three and concentrator expansion growth capital of $443 million in year four. This favourably positions Copper World at a lower capital intensity cost than peer copper projects and recent builds, as shown in Figure 3.
Hudbay's 2026 growth capital spending guidance related to the Copper World joint venture includes approximately $135 million of expenditures before project sanctioning, as previously disclosed. With the sanctioning of Copper World, the Company now expects growth expenditures related to the Copper World joint venture to total $245 million in 2026, reflecting an increase of $110 million related to project construction and development costs in the fourth quarter of 2026.
|
TSX, NYSE - HBM 2026 No. 27 |
Mineral Reserve and Resource Estimates
The changes between the 2023 and 2026 mineral resource estimates inclusive of mineral reserves represent the impacts of changes in the technical and economic criteria used to report resources, including the use of a NSR cut-off replacing a copper cut-off, updated metal prices, use of a new flotation recovery formulation and removal of the leachable mineral resource estimates. The change in copper metal contained in the measured and indicated mineral resource estimates is negligible, while the metal content in inferred mineral resource estimates has increased by 5% and presents additional upside potential in the future to enhance the production profile and further extend mine life beyond the Extension Case. The overall reduction in head grade is due to the replacement of high-grade leachable resources at low recoveries with lower grade flotation resources but with higher processing recovery.
The 2026 mineral reserve estimates of 390 million tonnes at 0.47% copper represent a comparable tonnage at a lower average copper grade to the 2023 PFS mineral reserve estimates of 385 million tonnes at 0.54% copper. The reduction in grade is related to a change in the mine planning strategy aiming at an approximately 20% smaller pit compared to the 2023 PFS, resulting in a significant reduction in the strip ratio. As the space for tailings and waste rock disposal is the main constraint on mine planning in the Base Case, the significant reduction in the strip ratio offsets the loss in metal production while also considering the new flotation recovery formulation and updated metal price forecast and cost assumptions. The higher-grade mineralization to be recovered at the expense of more waste excavation is not lost and is later recovered in the mine plan of the Extension Case which is not subject to the same land constraints for waste and tailings disposal.
The current mineral reserve and resource estimates for Copper World (effective as of August 1, 2026) are summarized below and replace the prior mineral reserve and resource estimates set forth in the 2023 PFS.
| Copper World Project Mineral Reserve and Resource Estimates1,2,3,4,5,6 |
Tonnes (millions) |
Cu Grade (%) |
Mo Grade (g/t) |
Au Grade (g/t) |
Ag Grade (g/t) |
| Proven reserves | 330 | 0.47 | 105 | 0.024 | 5.25 |
| Probable reserves | 60 | 0.46 | 94 | 0.018 | 4.14 |
| Total Proven and Probable Reserves | 390 | 0.47 | 103 | 0.023 | 5.08 |
| Measured resources (inclusive of reserves) | 890 | 0.42 | 124 | 0.022 | 4.43 |
| Indicated resources (inclusive of reserves) | 347 | 0.35 | 109 | 0.015 | 3.32 |
| Total Measured and Indicated (inclusive of reserves) | 1,236 | 0.40 | 120 | 0.020 | 4.12 |
| Inferred resources | 309 | 0.30 | 103 | 0.012 | 2.69 |
Note: totals may not add up correctly due to rounding.
1 CIM Definition Standards (2014) were used for reporting the mineral reserves and mineral resources.
2 Mineral resources are estimated as of August 1, 2026. Mineral resource estimates are inclusive of mineral reserves and have been calculated using the following assumptions: metal prices of $5.00 per pound copper, $20.00 per pound molybdenum, $3,600 per ounce gold and $50.00 per ounce silver; operating costs of $1.61 per ton mined, $5.34 per ton processed, G&A costs of $0.69 per ton processed; metallurgical recovery rates vary according to elemental content and are based on preliminary metallurgical test work.
3 Mineral resource estimates that are not mineral reserves do not have demonstrated economic viability. Mineral resource estimates are based on resource pit design and do not include factors for mining recovery or dilution.
4 An NSR cut-off value of $5.80 per ton was used to define material reserve estimates. A minimum copper grade of 0.1% and a minimum copper recovery of 48% were also applied to mineral reserves due to the limited tailings capacity.
5 An NSR cut-off value of $6.03 per ton was used to define mineral resource estimates.
6 Mineral resources are not mineral reserves as they do not have demonstrated economic viability.
|
TSX, NYSE - HBM 2026 No. 27 |
| Copper World Comparison of Mineral Resource Estimates1 | |||||||
| 2023 PFS2 | 2026 DFS | % Change | |||||
| Tonnes (millions) |
Cu (%) |
Cu (000 tonnes) |
Tonnes (millions) |
Cu (%) |
Cu (000 tonnes) |
Cu (000 tonnes) |
|
| Measured and indicated | 1,205 | 0.42 | 5,061 | 1,236 | 0.40 | 4,993 | -1% |
| Inferred | 275 | 0.32 | 880 | 309 | 0.30 | 927 | 5% |
Note: totals may not add up correctly due to rounding.
1 Mineral resource estimates are inclusive of mineral reserve estimates.
2 Refer to the 2023 PFS for the differing technical and economic criteria that were used in the 2023 mineral resource estimate.
Executed a Disciplined Capital Allocation Strategy to Deliver Superior Financial Returns with Significant Financial Flexibility
In 2022, Hudbay introduced a three prerequisites ("3-P") plan for Copper World that included a prudent financial strategy and balance sheet targets that would need to be achieved prior to a final investment decision. The Company successfully completed all of the key elements of the 3-P plan with the completion of the joint venture transaction with Mitsubishi, the enhanced precious metals stream agreement with Wheaton and the achievement of stated balance sheet targets well ahead of schedule. In early 2026, Hudbay implemented a holistic capital allocation framework to maintain strong financial discipline, deliver growth initiatives and maximize long-term risk-adjusted returns. The final investment decision to proceed with the development of Copper World is fully aligned with Hudbay's capital allocation framework.
As a result of Hudbay's disciplined capital allocation strategy and prudent funding plan for Copper World, the Company's first capital contribution is deferred to 2028 after Mitsubishi's $600 million initial investment, Wheaton $230 million deposit for the existing precious metals stream, $127 million of equipment financing, approximately $650 million of low-cost debt financing at the asset level, alongside Mitsubishi's future pro-rata equity capital contributions, as shown in Figure 4. This results in an increase in the expected Copper World project's levered IRR to Hudbay to 32% in the Base Case at a long-term price of $5.00 per pound of copper and 44% in the Extension Case at a long-term price of $6.00 per pound of copper.
Hudbay is well-positioned to fund its capital contributions through the Company's existing cash balance, continued free cash flow generation from the existing operations and significant undrawn availability under its credit facilities. Hudbay has recently improved long-term balance sheet resilience with a proactive two-year extension and upsize of the Company's senior secured credit facilities which is expected to close in the fourth quarter. Under the revised terms, the size of the credit facilities has been increased to $700 million from the existing $450 million and the term has been extended from November 2028 to November 2030, providing additional financial flexibility to manage the maturity of the 6.125% coupon 2029 senior unsecured notes and develop the Copper World project. The upsized $700 million revolving credit facility includes an improved pricing grid reflecting the enhanced financial position of Hudbay and features an opportunity to increase the facility by an additional $150 million at Hudbay's discretion during the four-year tenor, providing additional financial flexibility. After adjusting for the expected increase in size of the credit facilities, Hudbay's proforma liquidity as of June 30, 2026 is approximately $1.3 billion.
|
TSX, NYSE - HBM 2026 No. 27 |
Copper World Generates Significant Social & Environmental Benefits
Global copper market fundamentals are expected to be strong with a structural deficit emerging in the near to medium term. Global mine production is expected to struggle to keep pace with metal demand from electrification and the rapid expansion of datacentres. The U.S. is expected to remain a copper metal importer during this period, and domestic supply will be required to help meet growing U.S. metal demand related to increased manufacturing capacity, infrastructure development, bolstering the country's energy independence and national security needs.
The Copper World project is expected to generate significant benefits for the community and local economy in Arizona through significant job creation, tax revenue, economic development and the ability to produce "Arizona Copper Made for America". Over the anticipated 15-year life of the operation in the Base Case, the Company expects to contribute more than $1.1 billion in total U.S. taxes, including approximately $200 million in taxes to the state of Arizona and $362 million in local property taxes. This increases to $3.7 billion in total U.S. taxes over the 37-year mine life in the Extension Case. Hudbay expects Copper World to create more than 1,000 construction jobs, 500 permanent operating roles and up to 3,000 indirect employment opportunities in Arizona.
Significant engineering work has been advanced on the concentrate leach facility, including the recent completion of a PFS that confirmed the technical viability of the facility for Copper World and the ability to produce copper cathode. Using the Extension Case, the concentrate leach facility adds approximately $226 million to the after-tax net present value (8%), which increases to $377 million at time of sanctioning the construction of the facility, assuming a 10% cathode premium to the long-term copper price of $5.00 per pound. Producing copper cathode is expected to reduce the logistics costs and greenhouse gas emissions associated with overseas shipping, and smelting and refining activities related to copper concentrate The Company will continue to evaluate the concentrate leach facility considering future market conditions, such as premiums for copper metal in the U.S., potential government incentives and the unique strategic opportunity it presents as one of the few fully permitted domestic copper cathode producing facilities in the U.S. Copper World's concentrate leach facility also has the potential to unlock synergies with Hudbay's Cactus project in Arizona.
Non-IFRS Financial Performance Measures
This news release contains certain non-IFRS financial performance measures. Cash cost and sustaining cash cost per pound of copper produced are shown because the Company believes they help investors and management assess the performance of its operations, including the margin generated by the operations and the Company. Unit operating costs are shown because Hudbay believes they help investors and management assess the cost structure and margins that are not impacted by variability in by-product commodity prices. EBITDA is shown to help users analyze Hudbay's results and to provide additional information about the Company's ongoing cash generating potential in order to assess its capacity to service and repay debt, carry out investments and cover working capital needs. These measures are non-GAAP performance measures and do not have a meaning prescribed by IFRS and are therefore unlikely to be comparable to similar measures presented by other issuers. These measures should not be considered in isolation or as a substitute for measures prepared in accordance with IFRS and are not necessarily indicative of operating profit or cash flow from operations as determined under IFRS. Other companies may calculate these measures differently. For further details on these measures, please refer to Hudbay's management's discussion and analysis for the three and six months ended June 30, 2026 available on SEDAR+ at www.sedarplus.ca and EDGAR at www.sec.gov.
Qualified Person and NI 43-101
The scientific and technical information contained in this news release has been approved by Olivier Tavchandjian, P. Geo, Hudbay's Senior Vice President, Exploration and Technical Services. Mr. Tavchandjian is a qualified person pursuant to Canadian Securities Administrators' National Instrument 43-101 - Standards of Disclosure for Mineral Projects ("NI 43-101").
|
TSX, NYSE - HBM 2026 No. 27 |
A copy of the NI 43-101 technical report for the DFS (the "Technical Report") will be filed on Hudbay's SEDAR+ profile at www.sedarplus.ca and on Hudbay's EDGAR profile at www.sec.gov. The Technical Report supports the disclosure in this news release and will be the current technical report in respect of all the mineral properties that form part of the Copper World project and shall supersede and replace the 2023 PFS in its entirety.
Cautionary Note to United States Investors
This news release has been prepared in accordance with the requirements of the securities laws in effect in Canada, which differ from the requirements of United States securities laws. Canadian reporting requirements for disclosure of mineral properties are governed NI 43-101.
For this reason, information contained in this news release in respect of the Copper World project may not be comparable to similar information made public by United States companies subject to the reporting and disclosure requirements under the United States federal securities laws and the rules and regulations thereunder. For further information on the differences between the disclosure requirements for mineral properties under the United States federal securities laws and NI 43-101, please refer to the Company's most recent annual information form, a copy of which has been filed under Hudbay's profile on SEDAR+ at www.sedarplus.ca and the Company's most recent Form 40-F, a copy of which has been filed under Hudbay's profile on EDGAR at www.sec.gov.
Cautionary Note Regarding Forward-Looking Information
This news release contains forward-looking information within the meaning of applicable Canadian and United States securities legislation. All information contained in this news release, other than statements of current and historical fact, is forward-looking information. Often, but not always, forward-looking information can be identified by the use of words such as "plans", "expects", "budget", "guidance", "scheduled", "estimates", "forecasts", "strategy", "target", "intends", "objective", "goal", "understands", "anticipates" and "believes" (and variations of these or similar words) and statements that certain actions, events or results "may", "could", "would", "should", "might" "occur" or "be achieved" or "will be taken" (and variations of these or similar expressions). All of the forward-looking information in this news release is qualified by this cautionary note.
Forward-looking information includes, but is not limited to, the results and findings of the DFS, including the production, operating cost, capital cost and cash cost estimates, the projected valuation metrics and rates of return, the cash flow and EBITDA projections, statements regarding the anticipated permitting requirements and project design, including processing and tailings facilities, metal recoveries, mine life and production rates for the Copper World project, the expected funding requirements for the Copper World project, the potential to further enhance the economics of the Copper World project and optimize the design in the future, including with respect to the potential extension of the mine activities onto federal lands as part of the Extension Case described herein and the potential to advance and possibly implement the Concentrate Leach Facility option, the possibility of extending the life of the mine, and the expected social and environmental benefits of the Copper World project, including with respect to the local communities and stakeholders. Forward-looking information is not, and cannot be, a guarantee of future results or events. Forward-looking information is based on, among other things, opinions, assumptions, estimates and analyses that, while considered reasonable by us at the date the forward-looking information is provided, inherently are subject to significant risks, uncertainties, contingencies and other factors that may cause actual results and events to be materially different from those expressed or implied by the forward-looking information.
The material factors or assumptions that Hudbay identified and were applied by the Company in drawing conclusions or making forecasts or projections set out in the forward-looking information include, but are not limited to:
• the ability to achieve production and cost estimates described in this news release on expected timelines;
• the ability to obtain and maintain all required permits and authorizations to develop and operate the Copper World project in accordance with the Base Case presented in this news release;
• the accuracy of the feasibility and pre-feasibility estimates of costs presented in this news release;
• no capital cost escalation on the growth capital presented in this news release due to inflationary or other factors;
• if a decision is made at a future date to pursue the Extension Case, the ability to obtain and maintain all additional permits and authorizations required to develop and operate the Copper World project in accordance with the Extension Case presented in this news release;
|
TSX, NYSE - HBM 2026 No. 27 |
• the feasibility of aspects of the Base Case and Extension Case that to date have been completed to pre-feasibility levels;
• no delays or disruptions due to litigation challenging the permitting requirements, permits, land or other authorizations for the Copper World project and no significant unanticipated litigation;
• the potential advancement and implementation of the Concentrate Leach Facility;
• the ability to acquire additional small parcels of land within Copper World's property boundary;
• the potential extension of the mine activities onto federal lands;
• the success of exploration and development activities;
• the accuracy of geological, mining and metallurgical estimates;
• anticipated metals prices and the costs of production;
• the supply and demand for metals the Copper World project produces;
• the supply and availability of groundwater and surface water;
• the supply and availability of all forms of energy, fuels and other consumables at reasonable prices;
• no significant unanticipated operational or technical difficulties;
• the availability of additional financing, if needed;
• the stability of the joint venture partnership with Mitsubishi;
• the ability to complete Copper World project targets on time and on budget;
• the availability of personnel for exploration, development and operational projects and ongoing employee relations;
• the ability to maintain working relations with the local communities, including the neighbouring communities and local governments in Arizona;
• no significant unanticipated challenges with Pima County or other stakeholders at Copper World;
• no significant unanticipated events or changes relating to regulatory, environmental, health and safety matters;
• no contests over title to Hudbay's properties, including as a result of rights or claimed rights of Indigenous peoples or challenges to the validity of its unpatented mining claims;
• the ability to receive the upfront stream deposit of $230 million from Wheaton at the commencement of construction in accordance with the amended and restated precious metals purchase agreement;
• no disputes in respect of agreements that were previously entered into by Augusta Resource Corporation ("Augusta") in respect of the former Rosemont Copper project;
• certain tax matters, including, but not limited to the mining tax regime in Arizona; and
• no significant and continuing adverse changes in general economic conditions or conditions in the financial markets (including commodity prices and foreign exchange rates).
The risks, uncertainties, contingencies and other factors that may cause actual results to differ materially from those expressed or implied by the forward-looking information may include, but are not limited to, risks generally associated with the mining industry and the current geopolitical environment, including future commodity prices, currency and interest rate fluctuations, water availability, energy and consumable prices, supply chain constraints and general cost escalation in the current inflationary environment, risks related to project delivery and financing; risks and uncertainties related to obtaining the permit amendments required to implement the expansion projects contemplated in the Base Case; risks and uncertainties related to the pre-feasibility study level of the engineering and cost estimates in respect of the expansion projects included in the Base Case; ongoing and potential litigation processes and other legal challenges that could affect the Copper World project (including in respect of any future authorizations or agreements that may be required), risks related to acquiring additional small parcels of land within Copper World's property boundary, risks related to political or social instability and changes in government and government policy, risks related to changes in law, risks in respect of community relations, risks related to contracts that were entered into by Augusta in respect of the former Rosemont Copper project, uncertainties related to the geology, continuity, grade and estimates of mineral reserves and resources, and the potential for variations in grade and recovery rates, risks related to the timing and implementation of the Concentrate Leach Facility, climate change related risks and uncertainties, as well as the risks discussed elsewhere in the Technical Report, under the heading "Risk Factors" in Hudbay's most recent annual information form and under the heading "Financial Risk Management" in Hudbay's most recent annual management's discussion and analysis.
Should one or more risk, uncertainty, contingency or other factor materialize or should any factor or assumption prove incorrect, actual results could vary materially from those expressed or implied in the forward-looking information. Accordingly, you should not place undue reliance on forward-looking information. The Company does not assume any obligation to update or revise any forward-looking information after the date of this news release or to explain any material difference between subsequent actual events and any forward-looking information, except as required by applicable law.
|
TSX, NYSE - HBM 2026 No. 27 |
About Hudbay
Hudbay (TSX, NYSE: HBM) is a copper-focused critical minerals mining company with three long-life operations and a world-class pipeline of copper growth projects in tier-one mining jurisdictions of Canada, Peru and the United States.
Hudbay's operating portfolio includes the Constancia mine in Cusco (Peru), the Snow Lake operations in Manitoba (Canada) and the Copper Mountain mine in British Columbia (Canada). Copper is the primary metal produced by the Company, which is complemented by meaningful gold production and by-product zinc, silver and molybdenum. Hudbay's growth pipeline includes the Copper World project in Arizona (United States), the Cactus project in Arizona (United States), the Mason project in Nevada (United States), the Llaguen project in La Libertad (Peru) and several expansion and exploration opportunities near its existing operations.
The value Hudbay creates and the impact it has is embodied in its purpose statement: "We care about our people, our communities and our planet. Hudbay provides the metals the world needs. We work sustainably, transform lives and create better futures for communities." Hudbay's mission is to create sustainable value and strong returns by leveraging its core strengths in community relations, focused exploration, mine development and efficient operations.
For further information, please contact:
Candace Brûlé
Senior Vice President, Capital Markets & Corporate Affairs
(416) 362-8181
investor.relations@hudbay.com
____________________
i By-products calculated assuming the following long-term commodity prices: gold stream price of $540 per ounce (representing 15% of market price), silver stream price of $6.75 per ounce (representing 15% of market price), and molybdenum price of $17.50 per pound. By-product credits calculated using amortization of deferred revenue for gold and silver stream sales as per the Company's approach in its quarterly financial reporting. Sustaining cash costs includes sustaining capital expenditures, equipment financing and royalties. Cash costs and sustaining cash costs are non-GAAP financial performance measures with no standardized definition under IFRS. For further details on why Hudbay believes cash costs are a useful performance indicator, please refer to the Company's most recent Management's Discussion and Analysis for the three and six months ended June 30, 2026.
ii Cost comparison based on U.S. open pit copper mines 2025 actual cash costs sourced from public disclosure, compared to the Copper World project Base Case 8-year post-expansion average cash cost.
iii Total initial growth capital expenditures less $127 million of equipment financing. Equipment financing payments are incorporated in sustaining cash costs.
iv EBITDA and net debt to EBITDA are non-GAAP financial performance measures with no standardized definition under IFRS. For further information, please refer to the Company's most recent Management's Discussion and Analysis for the three and six months ended June 30, 2026.
v Peer comparison data of greenfield, open pit, copper porphyry sulphide projects with reserves located in the Americas and LOM average Cu production of +60ktpa. Sourced from public disclosure as of October 2026.
vi Concentrate leach facility after-tax net present value (8%) at time of sanctioning the construction of the facility and assumes a 10% cathode premium in the U.S. in the Extension Case.
|
TSX, NYSE - HBM 2026 No. 27 |
Exhibit 1: Copper World Detailed Cash Flow Model and Key Assumptions - Base Case
A detailed cash flow model containing annual production and cost information is shown below. Overall assumptions for commodity prices, marketing parameters, operating costs and capital costs are also provided.
| BASE CASE - Production |
Unit | LOM | Y-03 | Y-02 | Y-01 | Y01 | Y02 | Y03 | Y04 | Y05 | Y06 | Y07 | Y08 | Y09 | Y10 | Y11 | Y12 | Y13 | Y14 | Y15 |
| Material Moved1 | ||||||||||||||||||||
| Ore mined | Mtonne | 401 | - | 0.9 | 6.1 | 23.8 | 29.5 | 35.7 | 36.5 | 39.4 | 38.4 | 41.0 | 31.0 | 29.3 | 34.3 | 42.1 | 12.5 | - | - | - |
| Waste mined | Mtonne | 589 | - | 3.5 | 22.6 | 28.2 | 54.6 | 64.1 | 63.3 | 60.4 | 61.2 | 58.8 | 68.5 | 61.1 | 38.0 | 4.3 | 0.1 | - | - | - |
| Rehandle | Mtonne | 131 | - | - | - | 3.6 | 4.1 | 6.5 | 4.6 | 5.8 | 1.1 | - | 5.8 | 5.2 | 1.0 | - | 17.0 | 29.5 | 29.7 | 17.6 |
| Total Material Moved | Mtonne | 1,121 | - | 4.4 | 28.8 | 55.6 | 88.2 | 106.3 | 104.4 | 105.5 | 100.7 | 99.8 | 105.3 | 95.6 | 73.2 | 46.4 | 29.6 | 29.5 | 29.7 | 17.6 |
| Strip Ratio | waste:ore | 1.47 | - | 3.80 | 3.69 | 1.18 | 1.85 | 1.79 | 1.73 | 1.53 | 1.59 | 1.43 | 2.21 | 2.09 | 1.11 | 0.10 | 0.01 | - | - | - |
| Ore Milled | ||||||||||||||||||||
| Ore milled | Mtonne | 389 | - | - | - | 15.0 | 19.8 | 19.9 | 19.9 | 29.8 | 29.6 | 29.8 | 29.9 | 29.8 | 29.8 | 29.8 | 29.4 | 29.5 | 29.7 | 17.6 |
| Copper head grade | % | 0.47 | - | - | - | 0.66 | 0.64 | 0.49 | 0.49 | 0.62 | 0.78 | 0.50 | 0.45 | 0.42 | 0.49 | 0.63 | 0.41 | 0.17 | 0.15 | 0.14 |
| Gold head grade | g/tonne | 0.03 | - | - | - | 0.02 | 0.02 | 0.02 | 0.01 | 0.03 | 0.04 | 0.04 | 0.02 | 0.02 | 0.03 | 0.05 | 0.03 | 0.01 | 0.01 | 0.01 |
| Silver head grade | g/tonne | 5.60 | - | - | - | 4.46 | 3.90 | 3.92 | 5.37 | 8.28 | 9.94 | 5.96 | 4.77 | 5.19 | 5.95 | 8.53 | 5.61 | 3.21 | 3.14 | 2.82 |
| Molybdenum head grade | % | 0.01 | - | - | - | 0.02 | 0.01 | 0.01 | 0.01 | 0.01 | 0.01 | 0.01 | 0.01 | 0.01 | 0.01 | 0.01 | 0.01 | 0.01 | 0.01 | 0.01 |
| Recovery | ||||||||||||||||||||
| Copper recovery | % | 73.8 | - | - | - | 56.7 | 65.2 | 72.6 | 76.6 | 73.7 | 78.3 | 76.7 | 71.8 | 74.5 | 77.1 | 80.3 | 76.8 | 70.4 | 67.3 | 66.4 |
| Gold recovery | % | 56.8 | - | - | - | 38.7 | 35.5 | 31.3 | 36.8 | 58.5 | 62.8 | 62.9 | 57.2 | 58.2 | 61.8 | 62.9 | 56.9 | 59.9 | 50.5 | 46.3 |
| Silver recovery | % | 55.3 | - | - | - | 39.0 | 53.0 | 55.5 | 58.2 | 54.8 | 56.0 | 56.1 | 57.2 | 56.5 | 55.9 | 56.1 | 54.1 | 56.6 | 57.1 | 53.1 |
| Molybdenum recovery | % | 35.6 | - | - | - | - | 34.7 | 32.7 | 35.1 | 41.8 | 41.5 | 39.4 | 38.9 | 37.0 | 35.5 | 36.9 | 41.0 | 36.8 | 42.0 | 40.6 |
| Concentrate Production | ||||||||||||||||||||
| Copper concentrate | Ktonne | 5,424 | - | - | - | 224 | 333 | 310 | 308 | 518 | 687 | 450 | 389 | 381 | 467 | 595 | 361 | 185 | 137 | 81 |
| Cu Concentrate grade | % Cu | 24.76 | - | - | - | 24.92 | 24.83 | 23.01 | 24.25 | 26.18 | 26.36 | 25.36 | 25.04 | 24.35 | 24.37 | 25.31 | 25.37 | 19.28 | 21.39 | 20.84 |
| Molybdenum concentrate | Ktonne | 29 | - | - | - | - | 1.9 | 1.9 | 1.5 | 3.0 | 2.6 | 3.2 | 2.3 | 2.3 | 1.9 | 2.3 | 2.4 | 1.2 | 1.4 | 0.8 |
| Mo Concentrate grade | % Mo | 50 | - | - | - | - | 50 | 50 | 50 | 50 | 50 | 50 | 50 | 50 | 50 | 50 | 50 | 50 | 50 | 50 |
| Contained Metal in Concentrate Produced | ||||||||||||||||||||
| Copper | Ktonne | 1,343 | - | - | - | 56 | 83 | 71 | 75 | 136 | 181 | 114 | 97 | 93 | 114 | 150 | 92 | 36 | 29 | 17 |
| Gold | Koz | 179 | - | - | - | 4 | 4 | 3 | 3 | 16 | 22 | 22 | 13 | 14 | 18 | 28 | 17 | 8 | 5 | 3 |
| Silver | Koz | 38,736 | - | - | - | 836 | 1,314 | 1,389 | 1,999 | 4,345 | 5,305 | 3,199 | 2,620 | 2,811 | 3,190 | 4,580 | 2,871 | 1,722 | 1,709 | 847 |
| Molybdenum | Ktonne | 14 | - | - | - | - | 0.9 | 0.9 | 0.8 | 1.5 | 1.3 | 1.6 | 1.1 | 1.2 | 0.9 | 1.2 | 1.2 | 0.6 | 0.7 | 0.4 |
| Copper Eq. Production | Ktonne | 1,609 | - | - | - | 60 | 92 | 81 | 87 | 164 | 215 | 140 | 116 | 113 | 136 | 182 | 113 | 47 | 40 | 23 |
1Material moved includes pre-stripping shown in Y-02 and Y-01
|
TSX, NYSE - HBM 2026 No. 27 |
| BASE CASE - Unit Costs1,3 |
Unit | LOM | Y-03 | Y-02 | Y-01 | Y01 | Y02 | Y03 | Y04 | Y05 | Y06 | Y07 | Y08 | Y09 | Y10 | Y11 | Y12 | Y13 | Y14 | Y15 |
| Mining | ||||||||||||||||||||
| Mining | $/tonne moved | 1.56 | - | - | - | 1.77 | 1.47 | 1.27 | 1.39 | 1.41 | 1.45 | 1.57 | 1.47 | 1.57 | 1.80 | 2.22 | 2.45 | 1.61 | 1.42 | 1.81 |
| Mining (ex. capitalized stripping) | $/tonne moved | 1.37 | - | - | - | 1.46 | 1.08 | 0.91 | 0.84 | 1.41 | 1.44 | 1.57 | 1.20 | 1.33 | 1.80 | 2.22 | 2.45 | 1.61 | 1.42 | 1.81 |
| Processing | ||||||||||||||||||||
| Processing | $/tonne milled | 6.34 | - | - | - | 7.14 | 6.74 | 6.86 | 6.89 | 6.18 | 6.20 | 6.17 | 6.16 | 6.19 | 6.19 | 6.22 | 6.30 | 6.28 | 6.24 | 6.22 |
| Onsite G&A | ||||||||||||||||||||
| Onsite G&A | $/tonne milled | 0.80 | - | - | - | 1.49 | 1.04 | 1.04 | 1.03 | 0.69 | 0.69 | 0.69 | 0.69 | 0.69 | 0.69 | 0.69 | 0.70 | 0.70 | 0.69 | 1.17 |
| Cost per pound of copper produced, net of by-product credits | ||||||||||||||||||||
| Cash cost2 | $/lb | 1.70 | - | - | - | 2.38 | 1.76 | 2.01 | 1.85 | 1.44 | 1.12 | 1.62 | 1.83 | 1.89 | 1.63 | 1.10 | 1.46 | 3.31 | 3.72 | 4.32 |
| Sustaining cash cost2 | $/lb | 2.21 | - | - | - | 3.82 | 2.46 | 2.83 | 2.95 | 1.77 | 1.42 | 1.98 | 2.40 | 2.41 | 2.16 | 1.38 | 1.75 | 3.71 | 4.19 | 4.79 |
1Mining unit exclude pre-stripping costs that are presented as part of initial growth capital
2By-product credits calculated using amortization of deferred revenue for gold and silver stream sales as per the Company's approach in its quarterly financial reporting.
3Cash cost and sustaining cash costs, net of by-product credits, per pound of copper produced are non-GAAP financial performance measures with no standardized definition under IFRS. For further information, please refer to the Company's most recent Management's Discussion and Analysis for the three and six months ended June 30, 2026.
|
TSX, NYSE - HBM 2026 No. 27 |
| BASE CASE - Cash Flow |
Unit | LOM | Y-03 | Y-02 | Y-01 | Y01 | Y02 | Y03 | Y04 | Y05 | Y06 | Y07 | Y08 | Y09 | Y10 | Y11 | Y12 | Y13 | Y14 | Y15 | |||||||||||||||||||||||||||||
| Cash generated from operating activities | |||||||||||||||||||||||||||||||||||||||||||||||||
| Gross Revenue | $M | 15,158 | - | - | - | 654 | 940 | 796 | 830 | 1,529 | 2,014 | 1,300 | 1,098 | 1,048 | 1,267 | 1,680 | 1,044 | 410 | 347 | 199 | |||||||||||||||||||||||||||||
| Treatment & refining costs | $M | (577) | - | - | - | (17) | (29) | (27) | (27) | (80) | (64) | (45) | (43) | (42) | (50) | (65) | (41) | (20) | (16) | (9) | |||||||||||||||||||||||||||||
| Mining operating cost | $M | (1,493) | - | - | - | (81) | (96) | (97) | (88) | (149) | (145) | (157) | (126) | (127) | (132) | (103) | (72) | (47) | (42) | (32) | |||||||||||||||||||||||||||||
| Processing cost | $M | (2,469) | - | - | - | (107) | (133) | (136) | (137) | (184) | (184) | (184) | (184) | (185) | (185) | (185) | (185) | (185) | (185) | (109) | |||||||||||||||||||||||||||||
| Onsite G&A cost | $M | (310) | - | - | - | (22) | (21) | (21) | (21) | (21) | (21) | (21) | (21) | (21) | (21) | (21) | (21) | (21) | (21) | (21) | |||||||||||||||||||||||||||||
| Freight and transportation | $M | (971) | - | - | - | (40) | (60) | (55) | (55) | (93) | (123) | (81) | (70) | (68) | (84) | (106) | (65) | (33) | (25) | (15) | |||||||||||||||||||||||||||||
| Royalties and other | $M | (417) | - | - | - | (20) | (28) | (24) | (26) | (47) | (63) | (42) | (35) | (33) | (40) | (54) | (34) | (14) | (13) | (8) | |||||||||||||||||||||||||||||
| Taxes1 | $M | (1,126) | (57) | - | - | (34) | (32) | (31) | (29) | (49) | (132) | (96) | (77) | (93) | (138) | (230) | (119) | (4) | (2) | (2) | |||||||||||||||||||||||||||||
| Closure cost2 | $M | (138) | - | - | - | - | - | - | - | - | - | - | - | - | - | - | - | - | - | - | |||||||||||||||||||||||||||||
| Change in trade and other receivables and payables | $M | - | 91 | 73 | (48) | (79) | (41) | 57 | 30 | (109) | (16) | 40 | 10 | 6 | (3) | (24) | 16 | 18 | 2 | (6) | |||||||||||||||||||||||||||||
| Change in stream deposit | $M | 300 | 230 | - | - | - | - | - | - | 70 | - | - | - | - | - | - | - | - | - | - | |||||||||||||||||||||||||||||
| Operating Cash Flow | $M | 7,956 | 264 | 73 | (48) | 253 | 500 | 462 | 477 | 867 | 1,266 | 716 | 553 | 485 | 615 | 892 | 523 | 103 | 46 | (2) | |||||||||||||||||||||||||||||
| Cash used in investing activities | |||||||||||||||||||||||||||||||||||||||||||||||||
| Growth capital | $M | (2,907) | (498) | (996) | (704) | (25) | - | (242) | (443) | - | - | - | - | - | - | - | - | - | - | - | |||||||||||||||||||||||||||||
| Sustaining capital | $M | (629) | - | - | - | (197) | (29) | (64) | (49) | (21) | (47) | (29) | (30) | (32) | (68) | (20) | (16) | (10) | (10) | (7) | |||||||||||||||||||||||||||||
| Capitalized stripping | $M | (199) | - | - | - | (17) | (34) | (38) | (58) | - | (1) | - | (29) | (23) | - | - | - | - | - | - | |||||||||||||||||||||||||||||
| Cash from Investing | $M | (3,736) | (498) | (996) | (704) | (239) | (63) | (344) | (550) | (21) | (47) | (29) | (59) | (55) | (68) | (20) | (16) | (10) | (10) | (7) | |||||||||||||||||||||||||||||
| Cash used in financing activities | |||||||||||||||||||||||||||||||||||||||||||||||||
| Equipment financing | $M | 404 | 2 | 77 | 49 | 75 | 0 | 35 | 1 | 37 | 44 | 38 | 1 | 21 | 2 | 3 | 14 | 1 | 0 | 2 | |||||||||||||||||||||||||||||
| Equipment financing payments3 | $M | (486) | - | (1) | (19) | (31) | (49) | (49) | (57) | (38) | (36) | (28) | (37) | (29) | (34) | (25) | (15) | (10) | (10) | (5) | |||||||||||||||||||||||||||||
| Cash from Financing | $M | (81) | 2 | 76 | 30 | 45 | (49) | (14) | (56) | (1) | 9 | 9 | (36) | (8) | (32) | (23) | (1) | (9) | (9) | (3) | |||||||||||||||||||||||||||||
| Net Cash Flow | $M | 4,139 | (231) | (847) | (722) | 59 | 389 | 104 | (128) | 845 | 1,227 | 696 | 458 | 422 | 515 | 850 | 506 | 84 | 26 | (12) | |||||||||||||||||||||||||||||
| Financial Return Metrics | |||||||||||||||||||||||||||||||||||||||||||||||||
| Net Present Value (8%) | $M | 1,241 | |||||||||||||||||||||||||||||||||||||||||||||||
| Net Present Value (10%) | $M | 845 | |||||||||||||||||||||||||||||||||||||||||||||||
| Internal Rate of Return | % | 16.8% | |||||||||||||||||||||||||||||||||||||||||||||||
1Taxes include federal, state and property taxes.
2Post closure costs are reflected in the cash flows starting in year 16.
3Equipment financing payments include principal and interest.
|
TSX, NYSE - HBM 2026 No. 27 |
Exhibit 2: Copper World Detailed Cash Flow Model and Key Assumptions - Extension Case
A detailed cash flow model containing annual production and cost information is shown below. Overall assumptions for commodity prices, marketing parameters, operating costs and capital costs are also provided.
| EXTENSION - Production |
Unit | LOM | Y-03 | Y-02 | Y-01 | Y01 | Y02 | Y03 | Y04 | Y05 | Y06 | Y07 | Y08 | Y09 | Y10 | Y11 | Y12 | Y13 | Y14 | Y15 | Y16 | Y17 | Y18 | Y19 | Y20 | Y21 | Y22 | Y23 | Y24 | Y25 | Y26 | Y27 | Y28 | Y29 | Y30 | Y31 | Y32 | Y33 | Y34 | Y35 | Y36 | Y37 |
| Material Moved1 | ||||||||||||||||||||||||||||||||||||||||||
| Ore Mined | Mtonne | 1,047.6 | - | 1.1 | 6.6 | 25.5 | 38.0 | 39.2 | 36.5 | 40.8 | 38.1 | 38.6 | 37.1 | 30.9 | 32.9 | 37.0 | 34.1 | 38.5 | 35.6 | 24.3 | 25.2 | 35.4 | 43.3 | 43.0 | 36.6 | 37.0 | 34.7 | 27.2 | 38.6 | 41.7 | 37.4 | 38.4 | 33.8 | 31.0 | 9.4 | - | - | - | - | - | - | - |
| Waste Mined | Mtonne | 1,879.5 | - | 3.3 | 19.7 | 26.0 | 61.8 | 60.6 | 54.2 | 59.0 | 55.1 | 58.5 | 61.6 | 56.1 | 94.1 | 90.0 | 92.9 | 86.7 | 91.4 | 102.7 | 101.8 | 91.6 | 83.7 | 84.0 | 90.4 | 90.0 | 81.6 | 86.7 | 40.3 | 19.5 | 12.7 | 8.0 | 5.5 | 7.0 | 3.0 | - | - | - | - | - | - | - |
| Rehandle | Mtonne | 266.9 | - | - | - | - | - | - | 1.9 | 5.5 | 0.3 | 0.6 | 2.5 | 3.6 | 4.9 | - | - | - | - | 11.0 | 10.4 | - | - | - | - | - | - | 7.5 | - | - | - | - | - | - | 20.4 | 29.8 | 29.8 | 29.8 | 29.8 | 29.8 | 29.8 | 19.4 |
| Total Material Moved | Mtonne | 3,194.0 | - | 4.4 | 26.3 | 51.5 | 99.8 | 99.8 | 92.6 | 105.3 | 93.5 | 97.7 | 101.3 | 90.6 | 131.9 | 127.0 | 127.0 | 125.3 | 127.0 | 138.0 | 137.4 | 127.0 | 127.0 | 127.0 | 127.0 | 127.0 | 116.2 | 121.4 | 78.8 | 61.1 | 50.1 | 46.4 | 39.3 | 38.0 | 32.8 | 29.8 | 29.8 | 29.8 | 29.8 | 29.8 | 29.8 | 19.4 |
| Strip ratio | waste: ore | 1.79 | - | 2.98 | 2.99 | 1.02 | 1.63 | 1.55 | 1.49 | 1.45 | 1.45 | 1.52 | 1.66 | 1.81 | 2.86 | 2.44 | 2.73 | 2.25 | 2.57 | 4.22 | 4.04 | 2.59 | 1.93 | 1.95 | 2.47 | 2.43 | 2.35 | 3.18 | 1.04 | 0.47 | 0.34 | 0.21 | 0.16 | 0.23 | 0.32 | - | - | - | - | - | - | - |
| Ore Milled | ||||||||||||||||||||||||||||||||||||||||||
| Ore milled | Mtonne | 1,047.6 | - | - | - | 14.9 | 19.9 | 19.9 | 19.9 | 29.8 | 29.8 | 29.8 | 29.8 | 29.8 | 29.8 | 29.8 | 29.8 | 29.8 | 29.8 | 29.8 | 29.8 | 29.8 | 29.8 | 29.8 | 29.8 | 29.8 | 29.8 | 29.8 | 29.8 | 29.8 | 29.8 | 29.8 | 29.8 | 29.8 | 29.8 | 29.8 | 29.8 | 29.8 | 29.8 | 29.8 | 29.8 | 19.4 |
| Copper head grade | % | 0.42 | - | - | - | 0.59 | 0.68 | 0.50 | 0.48 | 0.60 | 0.78 | 0.47 | 0.50 | 0.44 | 0.45 | 0.58 | 0.64 | 0.63 | 0.56 | 0.34 | 0.32 | 0.42 | 0.57 | 0.56 | 0.57 | 0.50 | 0.46 | 0.37 | 0.42 | 0.38 | 0.32 | 0.34 | 0.34 | 0.30 | 0.28 | 0.20 | 0.20 | 0.19 | 0.14 | 0.14 | 0.17 | 0.17 |
| Gold head grade | g/tonne | 0.02 | - | - | - | 0.02 | 0.02 | 0.01 | 0.01 | 0.03 | 0.03 | 0.03 | 0.02 | 0.03 | 0.02 | 0.04 | 0.04 | 0.03 | 0.02 | 0.02 | 0.01 | 0.02 | 0.02 | 0.02 | 0.03 | 0.03 | 0.03 | 0.02 | 0.02 | 0.02 | 0.02 | 0.03 | 0.03 | 0.02 | 0.02 | 0.01 | 0.01 | 0.01 | 0.01 | 0.01 | 0.01 | 0.01 |
| Silver head grade | g/tonne | 4.34 | - | - | - | 4.39 | 3.58 | 3.95 | 4.55 | 7.14 | 9.23 | 5.31 | 4.74 | 5.36 | 4.49 | 5.96 | 8.14 | 5.31 | 5.42 | 3.00 | 2.59 | 2.95 | 4.12 | 4.62 | 5.54 | 4.79 | 5.16 | 3.29 | 3.22 | 4.41 | 4.02 | 4.09 | 4.66 | 4.71 | 4.48 | 2.32 | 2.29 | 2.27 | 2.02 | 2.10 | 2.75 | 2.75 |
| Molybdenum head grade | % | 0.01 | - | - | - | 0.02 | 0.02 | 0.02 | 0.01 | 0.01 | 0.01 | 0.01 | 0.01 | 0.01 | 0.01 | 0.01 | 0.01 | 0.01 | 0.01 | 0.01 | 0.01 | 0.01 | 0.01 | 0.01 | 0.01 | 0.02 | 0.02 | 0.01 | 0.02 | 0.01 | 0.01 | 0.02 | 0.02 | 0.01 | 0.01 | 0.01 | 0.01 | 0.01 | 0.01 | 0.01 | 0.00 | 0.00 |
| Recovery | ||||||||||||||||||||||||||||||||||||||||||
| Copper recovery | % | 74.9 | - | - | - | 57.1 | 66.3 | 73.4 | 75.2 | 72.9 | 78.6 | 77.5 | 70.1 | 74.5 | 70.0 | 78.4 | 81.3 | 79.0 | 74.0 | 73.6 | 72.6 | 67.7 | 72.8 | 73.3 | 78.0 | 80.7 | 82.3 | 73.3 | 74.7 | 77.4 | 79.0 | 82.3 | 83.7 | 85.3 | 77.8 | 66.4 | 66.4 | 67.2 | 76.4 | 74.5 | 58.5 | 58.5 |
| Gold recovery | % | 60.1 | - | - | - | 40.8 | 32.5 | 32.8 | 37.4 | 58.3 | 62.6 | 62.4 | 61.1 | 60.3 | 58.9 | 62.9 | 62.9 | 62.9 | 61.8 | 57.0 | 56.0 | 62.9 | 62.8 | 62.9 | 62.9 | 62.9 | 62.9 | 62.2 | 62.9 | 62.9 | 62.9 | 62.9 | 62.9 | 62.9 | 61.7 | 56.6 | 56.3 | 56.5 | 58.3 | 58.1 | 56.9 | 56.9 |
| Silver recovery | % | 55.6 | - | - | - | 39.9 | 51.7 | 56.9 | 56.2 | 55.4 | 56.0 | 56.0 | 56.0 | 56.0 | 55.2 | 56.1 | 56.1 | 56.1 | 55.2 | 55.2 | 54.1 | 56.1 | 56.0 | 56.1 | 56.1 | 56.1 | 56.1 | 56.0 | 56.1 | 56.1 | 56.1 | 56.1 | 56.1 | 56.1 | 56.0 | 56.2 | 56.2 | 56.2 | 56.1 | 56.0 | 54.9 | 54.9 |
| Molybdenum recovery | % | 36.2 | - | - | - | - | 33.3 | 33.1 | 35.2 | 41.8 | 41.5 | 39.3 | 38.3 | 38.0 | 36.8 | 34.4 | 39.7 | 34.2 | 36.7 | 40.1 | 38.7 | 37.1 | 35.8 | 34.1 | 32.2 | 34.1 | 36.6 | 33.9 | 32.7 | 34.3 | 33.7 | 36.2 | 39.2 | 46.4 | 38.4 | 38.4 | 38.5 | 38.2 | 36.1 | 36.4 | 43.3 | 43.3 |
| Concentrate Production | ||||||||||||||||||||||||||||||||||||||||||
| Copper concentrate | Ktonne | 13,718 | - | - | - | 201 | 367 | 311 | 297 | 500 | 694 | 434 | 417 | 395 | 388 | 558 | 600 | 599 | 489 | 298 | 320 | 352 | 495 | 508 | 569 | 504 | 466 | 360 | 430 | 395 | 351 | 358 | 351 | 305 | 277 | 185 | 182 | 182 | 184 | 178 | 132 | 86 |
| Cu Concentrate grade | % Cu | 23.95 | - | - | - | 24.99 | 24.55 | 23.60 | 24.19 | 26.16 | 26.34 | 25.26 | 25.12 | 24.78 | 24.40 | 24.52 | 25.69 | 24.63 | 25.14 | 24.68 | 21.86 | 24.29 | 24.91 | 24.25 | 23.47 | 23.75 | 24.40 | 22.45 | 21.69 | 21.99 | 21.53 | 23.09 | 24.27 | 25.39 | 23.56 | 21.61 | 21.55 | 21.26 | 16.88 | 17.46 | 22.44 | 22.44 |
| Molybdenum concentrate | Ktonne | 91.3 | - | - | - | - | 2.0 | 2.1 | 1.4 | 3.1 | 2.5 | 3.0 | 2.1 | 2.3 | 1.7 | 2.3 | 2.3 | 2.8 | 3.2 | 2.9 | 2.0 | 2.0 | 3.0 | 2.5 | 2.7 | 4.4 | 4.0 | 2.5 | 3.0 | 2.9 | 2.6 | 4.7 | 5.2 | 3.5 | 2.6 | 1.7 | 1.7 | 1.6 | 1.5 | 1.4 | 1.2 | 0.8 |
| Mo Concentrate grade | % Mo | 50 | - | - | - | - | 50 | 50 | 50 | 50 | 50 | 50 | 50 | 50 | 50 | 50 | 50 | 50 | 50 | 50 | 50 | 50 | 50 | 50 | 50 | 50 | 50 | 50 | 50 | 50 | 50 | 50 | 50 | 50 | 50 | 50 | 50 | 50 | 50 | 50 | 50 | 50 |
| Contained Metal in Concentrate Produced | ||||||||||||||||||||||||||||||||||||||||||
| Copper | Ktonne | 3,286 | - | - | - | 50 | 90 | 73 | 72 | 131 | 183 | 110 | 105 | 98 | 95 | 137 | 154 | 148 | 123 | 74 | 70 | 85 | 123 | 123 | 133 | 120 | 114 | 81 | 93 | 87 | 75 | 83 | 85 | 77 | 65 | 40 | 39 | 39 | 31 | 31 | 30 | 19 |
| Gold | Koz | 436 | - | - | - | 4 | 3 | 3 | 3 | 15 | 19 | 20 | 14 | 15 | 12 | 21 | 22 | 21 | 14 | 9 | 6 | 9 | 13 | 14 | 16 | 16 | 17 | 10 | 11 | 13 | 14 | 17 | 16 | 13 | 11 | 7 | 7 | 7 | 8 | 7 | 5 | 4 |
| Silver | Koz | 81,257 | - | - | - | 841 | 1,181 | 1,435 | 1,632 | 3,789 | 4,956 | 2,848 | 2,542 | 2,876 | 2,372 | 3,203 | 4,374 | 2,853 | 2,866 | 1,584 | 1,344 | 1,587 | 2,214 | 2,479 | 2,974 | 2,574 | 2,772 | 1,765 | 1,731 | 2,371 | 2,159 | 2,196 | 2,504 | 2,531 | 2,403 | 1,246 | 1,235 | 1,223 | 1,085 | 1,124 | 1,447 | 942 |
| Molybdenum | Ktonne | 45.6 | - | - | - | - | 1.0 | 1.0 | 0.7 | 1.5 | 1.3 | 1.5 | 1.1 | 1.1 | 0.9 | 1.1 | 1.2 | 1.4 | 1.6 | 1.4 | 1.0 | 1.0 | 1.5 | 1.3 | 1.4 | 2.2 | 2.0 | 1.3 | 1.5 | 1.4 | 1.3 | 2.4 | 2.6 | 1.8 | 1.3 | 0.9 | 0.8 | 0.8 | 0.7 | 0.7 | 0.6 | 0.4 |
| Copper Eq. Production | Ktonne | 3,919 | - | - | - | 55 | 99 | 84 | 82 | 157 | 214 | 133 | 123 | 118 | 111 | 161 | 183 | 171 | 145 | 88 | 81 | 98 | 142 | 142 | 156 | 143 | 138 | 96 | 109 | 106 | 93 | 106 | 110 | 98 | 83 | 50 | 49 | 49 | 41 | 41 | 39 | 26 |
1Material moved includes pre-stripping shown in Y-02 and Y-01
|
TSX, NYSE - HBM 2026 No. 27 |
| EXTENSION - Unit Costs1,3 | Unit | LOM | Y-03 | Y-02 | Y-01 | Y01 | Y02 | Y03 | Y04 | Y05 | Y06 | Y07 | Y08 | Y09 | Y10 | Y11 | Y12 | Y13 | Y14 | Y15 | Y16 | Y17 | Y18 | Y19 | Y20 | Y21 | Y22 | Y23 | Y24 | Y25 | Y26 | Y27 | Y28 | Y29 | Y30 | Y31 | Y32 | Y33 | Y34 | Y35 | Y36 | Y37 | |||||||||||||||||||||||||||||||||||||||||||
| Mining1 | |||||||||||||||||||||||||||||||||||||||||||||||||||||||||||||||||||||||||||||||||||||
| Mining | $/tonne moved | 1.41 | - | - | - | 1.92 | 1.42 | 1.31 | 1.40 | 1.34 | 1.44 | 1.39 | 1.37 | 1.47 | 1.29 | 1.26 | 1.32 | 1.26 | 1.23 | 1.15 | 1.23 | 1.33 | 1.24 | 1.21 | 1.25 | 1.30 | 1.37 | 1.35 | 1.75 | 1.93 | 2.13 | 2.21 | 2.47 | 2.50 | 2.08 | 1.53 | 1.37 | 1.34 | 1.31 | 1.30 | 1.20 | 1.48 | |||||||||||||||||||||||||||||||||||||||||||
| Mining (ex. capitalized stripping) | $/tonne moved | 1.21 | - | - | - | 1.59 | 1.11 | 0.88 | 1.01 | 1.34 | 1.44 | 1.39 | 1.37 | 1.47 | 0.88 | 1.08 | 1.05 | 1.14 | 0.91 | 0.61 | 0.53 | 1.09 | 1.24 | 1.21 | 1.06 | 1.11 | 1.21 | 0.98 | 1.75 | 1.93 | 2.13 | 2.21 | 2.47 | 2.50 | 2.08 | 1.53 | 1.37 | 1.34 | 1.31 | 1.30 | 1.20 | 1.48 | |||||||||||||||||||||||||||||||||||||||||||
| Processing | |||||||||||||||||||||||||||||||||||||||||||||||||||||||||||||||||||||||||||||||||||||
| Processing | $/tonne milled | 6.40 | - | - | - | 7.14 | 6.71 | 6.86 | 6.90 | 6.18 | 6.17 | 6.17 | 6.17 | 6.19 | 6.19 | 6.42 | 6.42 | 6.42 | 6.42 | 6.42 | 6.40 | 6.40 | 6.40 | 6.40 | 6.40 | 6.40 | 6.40 | 6.40 | 6.40 | 6.40 | 6.40 | 6.40 | 6.40 | 6.40 | 6.40 | 6.40 | 6.40 | 6.40 | 6.40 | 6.40 | 6.40 | 6.46 | |||||||||||||||||||||||||||||||||||||||||||
| Onsite G&A | |||||||||||||||||||||||||||||||||||||||||||||||||||||||||||||||||||||||||||||||||||||
| Onsite G&A | $/tonne milled | 0.73 | - | - | - | 1.49 | 1.04 | 1.04 | 1.04 | 0.69 | 0.69 | 0.69 | 0.69 | 0.69 | 0.69 | 0.69 | 0.69 | 0.69 | 0.69 | 0.69 | 0.69 | 0.69 | 0.69 | 0.69 | 0.69 | 0.69 | 0.69 | 0.69 | 0.69 | 0.69 | 0.69 | 0.69 | 0.69 | 0.69 | 0.69 | 0.69 | 0.69 | 0.69 | 0.69 | 0.69 | 0.69 | 1.06 | |||||||||||||||||||||||||||||||||||||||||||
| Cost per pound of copper produced, net of by-product credits | |||||||||||||||||||||||||||||||||||||||||||||||||||||||||||||||||||||||||||||||||||||
| Cash cost2 | $/lb | 1.94 | - | - | - | 2.63 | 1.75 | 1.91 | 2.02 | 1.52 | 1.29 | 1.75 | 1.94 | 1.99 | 2.14 | 1.57 | 1.38 | 1.47 | 1.64 | 2.28 | 2.49 | 2.39 | 1.81 | 1.83 | 1.66 | 1.71 | 1.64 | 2.34 | 2.23 | 2.04 | 2.23 | 1.80 | 1.65 | 1.90 | 2.12 | 3.21 | 3.19 | 3.05 | 3.84 | 3.82 | 3.84 | 4.19 | |||||||||||||||||||||||||||||||||||||||||||
| Sustaining cash cost2 | $/lb | 2.38 | - | - | - | 4.22 | 2.39 | 2.73 | 2.88 | 1.87 | 1.55 | 2.06 | 2.29 | 2.37 | 2.86 | 1.96 | 1.77 | 1.78 | 2.09 | 3.08 | 3.52 | 2.91 | 2.09 | 2.10 | 2.02 | 2.09 | 2.05 | 3.00 | 2.57 | 2.38 | 2.55 | 2.10 | 1.95 | 2.22 | 2.45 | 3.60 | 3.54 | 3.39 | 4.21 | 4.19 | 4.22 | 4.60 | |||||||||||||||||||||||||||||||||||||||||||
1Mining unit costs exclude pre-stripping costs that are presented as part of initial growth capital
2By-product credits calculated using amortization of deferred revenue for gold and silver stream sales as per the Company's approach in its quarterly financial reporting.
3 Cash cost and sustaining cash costs, net of by-product credits, per pound of copper produced are non-GAAP financial performance measures with no standardized definition under IFRS. For further information, please refer to the Company's most recent Management's Discussion and Analysis for the three and six months ended June 30, 2026.
|
TSX, NYSE - HBM 2026 No. 27 |
| EXTENSION - Cash Flow |
Unit | LOM | Y-03 | Y-02 | Y-01 | Y01 | Y02 | Y03 | Y04 | Y05 | Y06 | Y07 | Y08 | Y09 | Y10 | Y11 | Y12 | Y13 | Y14 | Y15 | Y16 | Y17 | Y18 | Y19 | Y20 | Y21 | Y22 | Y23 | Y24 | Y25 | Y26 | Y27 | Y28 | Y29 | Y30 | Y31 | Y32 | Y33 | Y34 | Y35 | Y36 | Y37 | Y38 | Y39 | Y40 | ||||||||||||||||||||||||||||||||||||||||||
| Cash generated from operating activities | |||||||||||||||||||||||||||||||||||||||||||||||||||||||||||||||||||||||||||||||||||||||
| Gross Revenue | $M | 37,248 | - | - | - | 589 | 1,023 | 822 | 796 | 1,478 | 2,029 | 1,246 | 1,171 | 1,103 | 1,054 | 1,519 | 1,715 | 1,643 | 1,386 | 847 | 786 | 956 | 1,383 | 1,373 | 1,487 | 1,371 | 1,306 | 915 | 1,056 | 991 | 863 | 985 | 1,023 | 910 | 760 | 464 | 455 | 449 | 361 | 361 | 346 | 225 | - | - | - | ||||||||||||||||||||||||||||||||||||||||||
| Treatment & refining costs | $M | (1,784) | - | - | - | (16) | (32) | (28) | (26) | (76) | (100) | (43) | (45) | (44) | (63) | (59) | (65) | (63) | (80) | (51) | (53) | (55) | (78) | (80) | (90) | (86) | (53) | (58) | (79) | (43) | (38) | (44) | (44) | (38) | (33) | (21) | (20) | (20) | (19) | (19) | (16) | (10) | - | - | - | ||||||||||||||||||||||||||||||||||||||||||
| Mining operating cost | $M | (3,842) | - | - | - | (82) | (111) | (88) | (93) | (142) | (135) | (136) | (139) | (133) | (116) | (138) | (133) | (143) | (116) | (85) | (73) | (139) | (158) | (153) | (135) | (142) | (140) | (119) | (138) | (118) | (106) | (102) | (97) | (95) | (68) | (46) | (41) | (40) | (39) | (39) | (36) | (29) | - | - | - | ||||||||||||||||||||||||||||||||||||||||||
| Processing cost | $M | (6,705) | - | - | - | (107) | (133) | (136) | (137) | (184) | (184) | (184) | (184) | (185) | (185) | (191) | (191) | (191) | (191) | (191) | (191) | (191) | (191) | (191) | (191) | (191) | (191) | (191) | (191) | (191) | (191) | (191) | (191) | (191) | (191) | (191) | (191) | (191) | (191) | (191) | (191) | (125) | - | - | - | ||||||||||||||||||||||||||||||||||||||||||
| Onsite G&A cost | $M | (763) | - | - | - | (22) | (21) | (21) | (21) | (21) | (21) | (21) | (21) | (21) | (21) | (21) | (21) | (21) | (21) | (21) | (21) | (21) | (21) | (21) | (21) | (21) | (21) | (21) | (21) | (21) | (21) | (21) | (21) | (21) | (21) | (21) | (21) | (21) | (21) | (21) | (21) | (21) | - | - | - | ||||||||||||||||||||||||||||||||||||||||||
| Freight and transportation | $M | (2,457) | - | - | - | (36) | (66) | (56) | (53) | (90) | (124) | (78) | (75) | (71) | (69) | (100) | (107) | (107) | (88) | (53) | (57) | (63) | (89) | (91) | (102) | (90) | (84) | (64) | (77) | (71) | (63) | (64) | (63) | (55) | (50) | (33) | (33) | (33) | (33) | (32) | (24) | (15) | - | - | - | ||||||||||||||||||||||||||||||||||||||||||
| Royalties and other | $M | (1,109) | - | - | - | (19) | (31) | (25) | (25) | (46) | (62) | (40) | (37) | (36) | (32) | (48) | (54) | (51) | (42) | (26) | (24) | (29) | (41) | (41) | (44) | (41) | (41) | (28) | (31) | (32) | (28) | (32) | (33) | (30) | (25) | (16) | (16) | (15) | (13) | (13) | (13) | (9) | 58 | - | - | ||||||||||||||||||||||||||||||||||||||||||
| Taxes1 | $M | (3,713) | (57) | - | - | (34) | (33) | (31) | (29) | (48) | (137) | (106) | (113) | (123) | (89) | (186) | (233) | (228) | (176) | (74) | (54) | (95) | (189) | (188) | (204) | (179) | (171) | (87) | (119) | (118) | (97) | (121) | (129) | (107) | (82) | (28) | (27) | (16) | (2) | (2) | (2) | (2) | - | - | - | ||||||||||||||||||||||||||||||||||||||||||
| Closure cost2 | $M | (194) | - | - | - | - | - | - | - | - | - | - | - | - | - | - | - | - | - | - | - | - | - | - | - | - | - | - | - | - | - | - | - | - | - | - | - | - | - | - | - | - | (57) | (57) | (30) | ||||||||||||||||||||||||||||||||||||||||||
| Change in trade & other receivables and payables | $M | 1 | 91 | 74 | (51) | (72) | (48) | 51 | 35 | (103) | (22) | 42 | 7 | 14 | 43 | (42) | (22) | 2 | 7 | 20 | 1 | (5) | (13) | 0 | 3 | 1 | (4) | 14 | (7) | (1) | 2 | (6) | (3) | 3 | 2 | 6 | (0) | (2) | 4 | (1) | (1) | (5) | (7) | - | (9) | ||||||||||||||||||||||||||||||||||||||||||
| Change in stream deposit | $M | 300 | 230 | - | - | - | - | - | - | 70 | - | - | - | - | - | - | - | - | - | - | - | - | - | - | - | - | - | - | - | - | - | - | - | - | - | - | - | - | - | - | - | - | - | - | - | ||||||||||||||||||||||||||||||||||||||||||
| Operating Cash Flow | $M | 16,981 | 264 | 74 | (51) | 201 | 549 | 489 | 448 | 839 | 1,244 | 682 | 566 | 506 | 523 | 735 | 888 | 842 | 681 | 366 | 315 | 359 | 604 | 610 | 703 | 623 | 602 | 362 | 393 | 397 | 322 | 405 | 443 | 378 | 292 | 115 | 107 | 111 | 48 | 45 | 44 | 9 | (6) | (57) | (39) | ||||||||||||||||||||||||||||||||||||||||||
| Cash used in investing activities | |||||||||||||||||||||||||||||||||||||||||||||||||||||||||||||||||||||||||||||||||||||||
| Growth capital | $M | (3,300) | (498) | (1,005) | (692) | (25) | - | (242) | (443) | - | - | - | - | - | (276) | (118) | - | - | - | - | - | - | - | - | - | - | - | - | - | - | - | - | - | - | - | - | - | - | - | - | - | - | - | - | - | ||||||||||||||||||||||||||||||||||||||||||
| Sustaining capital | $M | (1,186) | - | - | - | (197) | (31) | (27) | (34) | (32) | (30) | (24) | (27) | (80) | (35) | (29) | (38) | (37) | (27) | (42) | (27) | (28) | (30) | (31) | (66) | (49) | (27) | (27) | (22) | (27) | (19) | (15) | (16) | (18) | (17) | (13) | (14) | (11) | (12) | (10) | (11) | (8) | - | - | - | ||||||||||||||||||||||||||||||||||||||||||
| Capitalized stripping | $M | (604) | - | - | - | (17) | (31) | (43) | (37) | - | - | - | - | - | (54) | (23) | (35) | (14) | (40) | (74) | (96) | (30) | - | - | (24) | (23) | (19) | (45) | - | - | - | - | - | - | - | - | - | - | - | - | - | - | - | - | - | ||||||||||||||||||||||||||||||||||||||||||
| Cash from Investing | $M | (5,090) | (498) | (1,005) | (692) | (238) | (62) | (311) | (513) | (32) | (30) | (24) | (27) | (80) | (365) | (170) | (73) | (51) | (68) | (116) | (123) | (58) | (30) | (31) | (89) | (71) | (46) | (72) | (22) | (27) | (19) | (15) | (16) | (18) | (17) | (13) | (14) | (11) | (12) | (10) | (11) | (8) | - | - | - | ||||||||||||||||||||||||||||||||||||||||||
| Cash used in financing activities | |||||||||||||||||||||||||||||||||||||||||||||||||||||||||||||||||||||||||||||||||||||||
| Equipment financing | $M | 643 | 2 | 85 | 40 | 74 | 1 | 1 | 1 | 41 | 26 | 36 | 1 | 52 | 0 | 5 | 16 | 14 | 5 | 42 | 2 | 5 | 13 | 15 | 42 | 31 | 4 | 3 | 5 | 13 | 22 | 11 | 3 | 4 | 5 | 6 | 5 | 1 | 2 | 2 | 3 | 1 | 1 | - | - | ||||||||||||||||||||||||||||||||||||||||||
| Equipment financing payments3 | $M | (773) | - | (1) | (21) | (31) | (48) | (49) | (48) | (28) | (29) | (17) | (25) | (25) | (38) | (28) | (23) | (18) | (21) | (10) | (20) | (19) | (16) | (16) | (19) | (18) | (26) | (25) | (23) | (20) | (14) | (11) | (13) | (13) | (13) | (11) | (7) | (5) | (5) | (5) | (4) | (3) | (2) | (2) | (2) | ||||||||||||||||||||||||||||||||||||||||||
| Cash from Financing | $M | (130) | 2 | 85 | 19 | 44 | (47) | (48) | (47) | 13 | (2) | 19 | (24) | 27 | (37) | (23) | (7) | (4) | (16) | 33 | (18) | (14) | (3) | (1) | 23 | 13 | (22) | (22) | (18) | (7) | 9 | (0) | (11) | (9) | (8) | (5) | (2) | (5) | (3) | (3) | (1) | (2) | (1) | (2) | (2) | ||||||||||||||||||||||||||||||||||||||||||
| Net Cash Flow | $M | 11,762 | (231) | (846) | (725) | 7 | 440 | 130 | (113) | 820 | 1,212 | 676 | 515 | 453 | 121 | 542 | 809 | 787 | 598 | 283 | 173 | 288 | 571 | 578 | 637 | 564 | 534 | 268 | 353 | 363 | 311 | 389 | 417 | 351 | 268 | 97 | 91 | 95 | 33 | 32 | 32 | (0) | (6) | (59) | (40) | ||||||||||||||||||||||||||||||||||||||||||
| Financial Return Metrics | |||||||||||||||||||||||||||||||||||||||||||||||||||||||||||||||||||||||||||||||||||||||
| Net Present Value (8%) | $M | 2,510 | |||||||||||||||||||||||||||||||||||||||||||||||||||||||||||||||||||||||||||||||||||||
| Net Present Value (10%) | $M | 1,685 | |||||||||||||||||||||||||||||||||||||||||||||||||||||||||||||||||||||||||||||||||||||
| Internal Rate of Return | % | 18.8 | |||||||||||||||||||||||||||||||||||||||||||||||||||||||||||||||||||||||||||||||||||||
1Taxes include federal, state and property taxes.
2Post closure costs are reflected in the cash flows starting in year 38.
3Equipment financing payments include principal and interest.
|
TSX, NYSE - HBM 2026 No. 27 |
Figure 1: Copper World Base Case Site Plan Layout
Copper World is designed as a conventional open-pit, truck-and-shovel mining operation across four primary pits, East, Broadtop, West, and Peach-Elgin. The overall mine plan integrates essential supporting infrastructure, including waste rock facilities (WRFs), grade-segregated ore stockpiles, a tailings storage facility (TSF), and an in-pit crushing and conveying (IPCC) system.
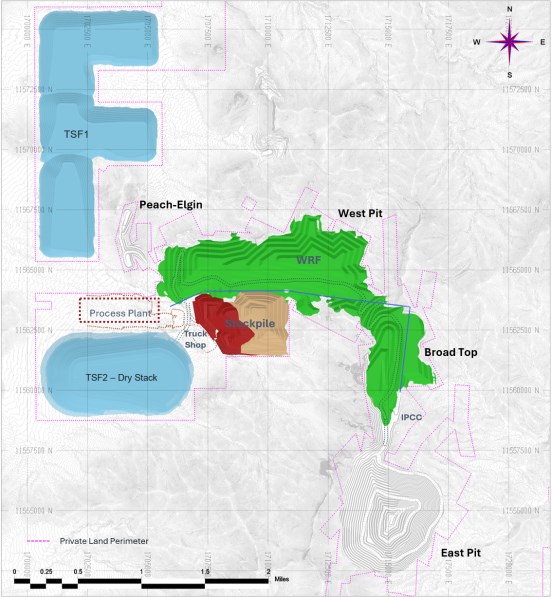
|
TSX, NYSE - HBM 2026 No. 27 |
Figure 2: Copper World Production and Operating Cost Profile
Following the concentrator expansion in year five, annual copper production increases to an average of 122,000 tonnes between year five and year twelve in the Base Case, and that elevated profile further extends to beyond year 20 in the Extension Case.
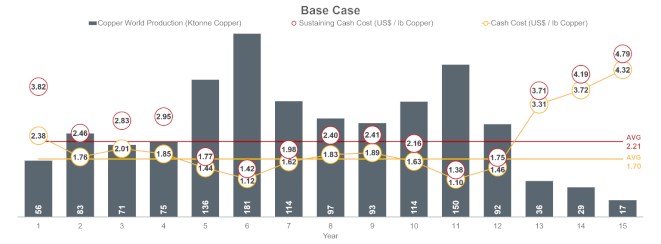
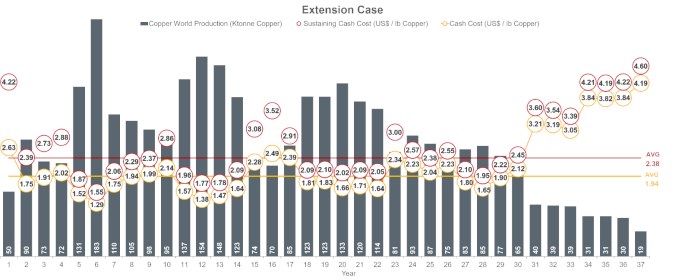
|
TSX, NYSE - HBM 2026 No. 27 |
Figure 3: Copper World Attractive Capital Intensity
Copper World continues to be well-positioned when compared to peer copper projects and recently completed builds.
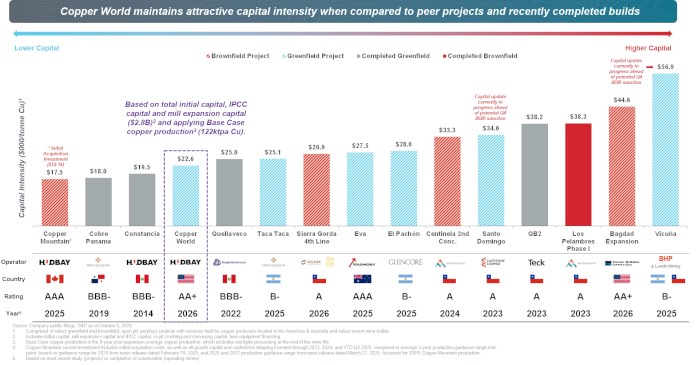
|
TSX, NYSE - HBM 2026 No. 27 |
Figure 4: Hudbay's First Capital Contribution Deferred to 2028
Hudbay has executed a prudent financial strategy for the funding of Copper World, including a minority joint venture transaction with Mitsubishi, a renegotiated precious metals stream agreement with Wheaton and plans to implement low-cost debt financing at the asset level, resulting in Hudbay's first capital contribution not expected until 2028 and an increase in the expected levered IRR to Hudbay to 32% in the Base Case.