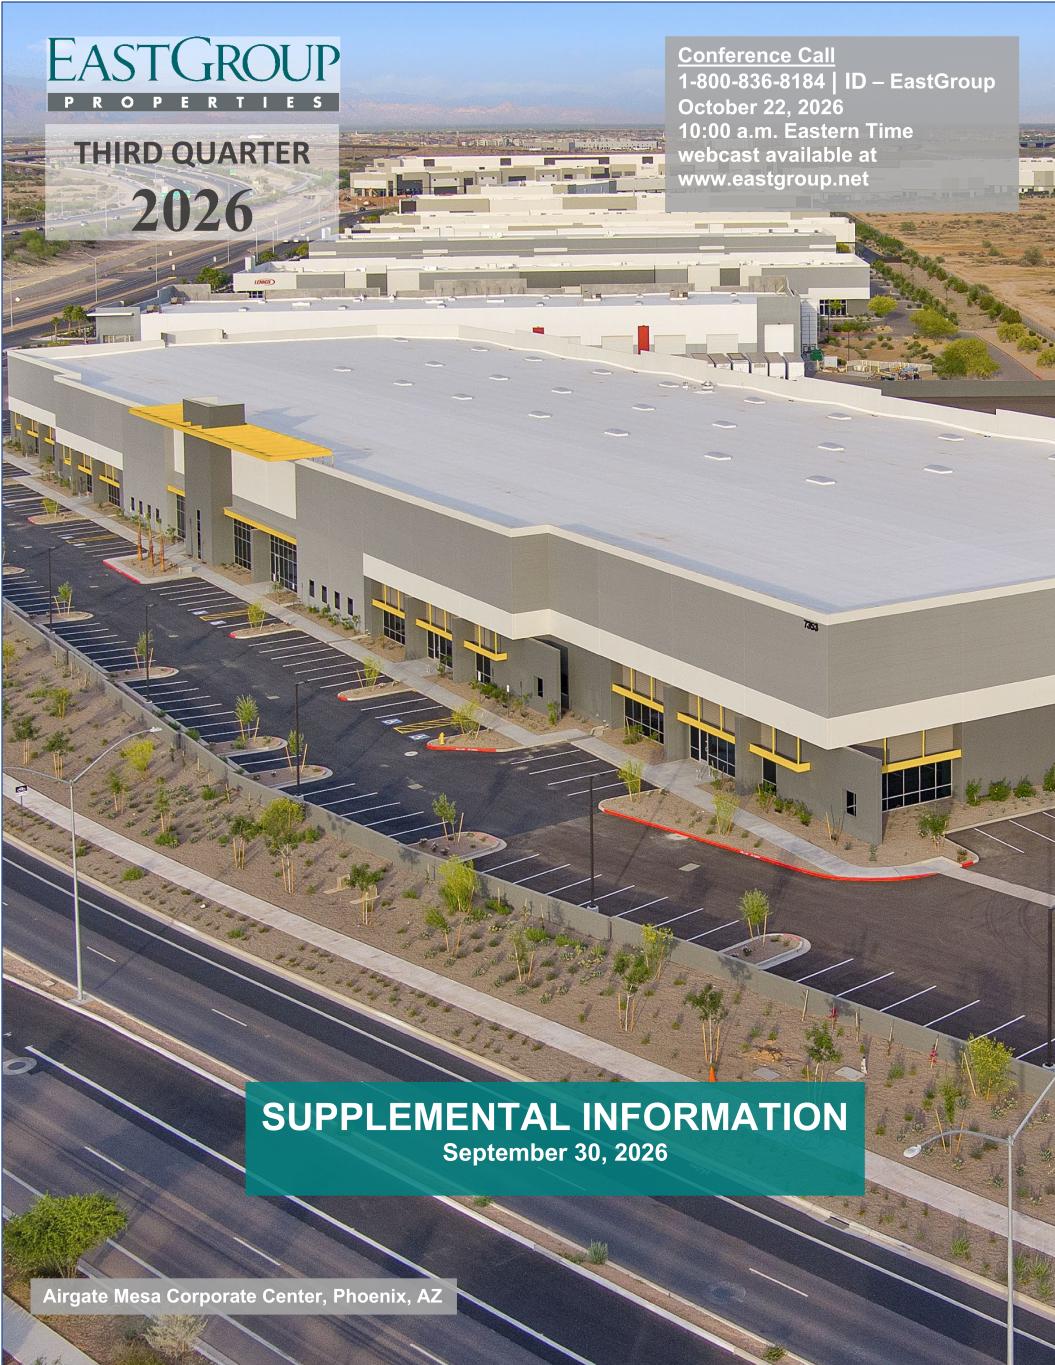
Q3 2026 Supplemental | Page 1 Table of Contents Conference Call 1-800-836-8184 | ID – EastGroup October 22, 2026 10:00 a.m. Eastern Time webcast available at www.eastgroup.net SUPPLEMENTAL INFORMATION September 30, 2026 Airgate Mesa Corporate Center, Phoenix, AZ
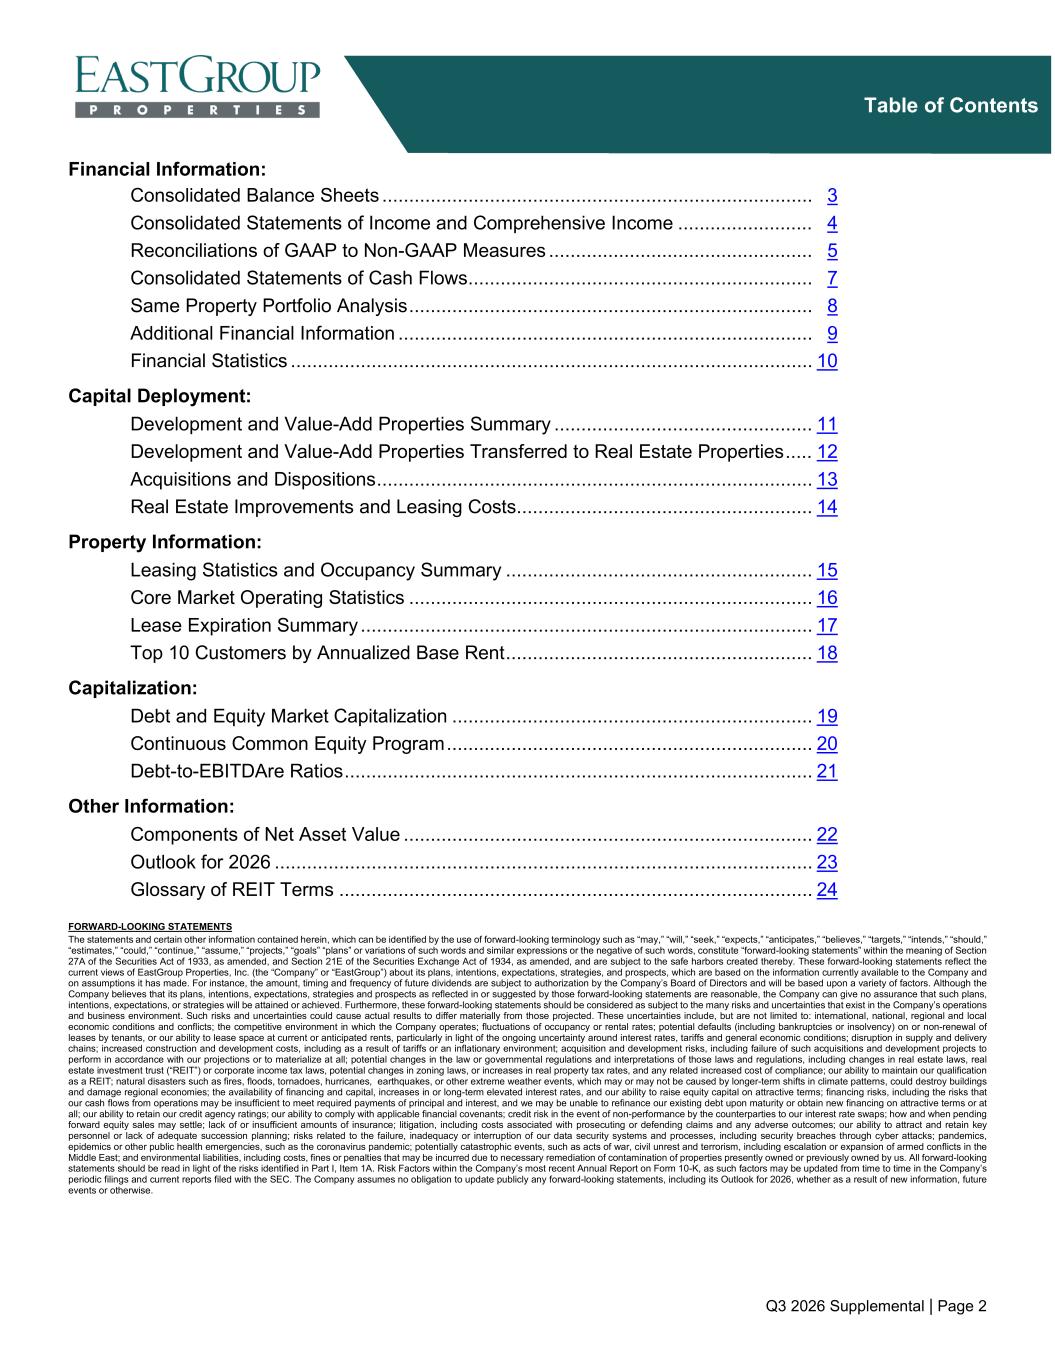
Q3 2026 Supplemental | Page 2 Table of Contents Financial Information: Consolidated Balance Sheets ................................................................................ 3 Consolidated Statements of Income and Comprehensive Income ......................... 4 Reconciliations of GAAP to Non-GAAP Measures ................................................. 5 Consolidated Statements of Cash Flows ................................................................ 7 Same Property Portfolio Analysis ........................................................................... 8 Additional Financial Information ............................................................................. 9 Financial Statistics ................................................................................................. 10 Capital Deployment: Development and Value-Add Properties Summary ................................................ 11 Development and Value-Add Properties Transferred to Real Estate Properties ..... 12 Acquisitions and Dispositions ................................................................................. 13 Real Estate Improvements and Leasing Costs ....................................................... 14 Property Information: Leasing Statistics and Occupancy Summary ......................................................... 15 Core Market Operating Statistics ........................................................................... 16 Lease Expiration Summary .................................................................................... 17 Top 10 Customers by Annualized Base Rent ......................................................... 18 Capitalization: Debt and Equity Market Capitalization ................................................................... 19 Continuous Common Equity Program .................................................................... 20 Debt-to-EBITDAre Ratios ....................................................................................... 21 Other Information: Components of Net Asset Value ............................................................................ 22 Outlook for 2026 .................................................................................................... 23 Glossary of REIT Terms ........................................................................................ 24 FORWARD-LOOKING STATEMENTS The statements and certain other information contained herein, which can be identified by the use of forward-looking terminology such as “may,” “will,” “seek,” “expects,” “anticipates,” “believes,” “targets,” “intends,” “should,” “estimates,” “could,” “continue,” “assume,” “projects,” “goals” “plans” or variations of such words and similar expressions or the negative of such words, constitute “forward-looking statements” within the meaning of Section 27A of the Securities Act of 1933, as amended, and Section 21E of the Securities Exchange Act of 1934, as amended, and are subject to the safe harbors created thereby. These forward-looking statements reflect the current views of EastGroup Properties, Inc. (the “Company” or “EastGroup”) about its plans, intentions, expectations, strategies, and prospects, which are based on the information currently available to the Company and on assumptions it has made. For instance, the amount, timing and frequency of future dividends are subject to authorization by the Company’s Board of Directors and will be based upon a variety of factors. Although the Company believes that its plans, intentions, expectations, strategies and prospects as reflected in or suggested by those forward-looking statements are reasonable, the Company can give no assurance that such plans, intentions, expectations, or strategies will be attained or achieved. Furthermore, these forward-looking statements should be considered as subject to the many risks and uncertainties that exist in the Company’s operations and business environment. Such risks and uncertainties could cause actual results to differ materially from those projected. These uncertainties include, but are not limited to: international, national, regional and local economic conditions and conflicts; the competitive environment in which the Company operates; fluctuations of occupancy or rental rates; potential defaults (including bankruptcies or insolvency) on or non-renewal of leases by tenants, or our ability to lease space at current or anticipated rents, particularly in light of the ongoing uncertainty around interest rates, tariffs and general economic conditions; disruption in supply and delivery chains; increased construction and development costs, including as a result of tariffs or an inflationary environment; acquisition and development risks, including failure of such acquisitions and development projects to perform in accordance with our projections or to materialize at all; potential changes in the law or governmental regulations and interpretations of those laws and regulations, including changes in real estate laws, real estate investment trust (“REIT”) or corporate income tax laws, potential changes in zoning laws, or increases in real property tax rates, and any related increased cost of compliance; our ability to maintain our qualification as a REIT; natural disasters such as fires, floods, tornadoes, hurricanes, earthquakes, or other extreme weather events, which may or may not be caused by longer-term shifts in climate patterns, could destroy buildings and damage regional economies; the availability of financing and capital, increases in or long-term elevated interest rates, and our ability to raise equity capital on attractive terms; financing risks, including the risks that our cash flows from operations may be insufficient to meet required payments of principal and interest, and we may be unable to refinance our existing debt upon maturity or obtain new financing on attractive terms or at all; our ability to retain our credit agency ratings; our ability to comply with applicable financial covenants; credit risk in the event of non-performance by the counterparties to our interest rate swaps; how and when pending forward equity sales may settle; lack of or insufficient amounts of insurance; litigation, including costs associated with prosecuting or defending claims and any adverse outcomes; our ability to attract and retain key personnel or lack of adequate succession planning; risks related to the failure, inadequacy or interruption of our data security systems and processes, including security breaches through cyber attacks; pandemics, epidemics or other public health emergencies, such as the coronavirus pandemic; potentially catastrophic events, such as acts of war, civil unrest and terrorism, including escalation or expansion of armed conflicts in the Middle East; and environmental liabilities, including costs, fines or penalties that may be incurred due to necessary remediation of contamination of properties presently owned or previously owned by us. All forward-looking statements should be read in light of the risks identified in Part I, Item 1A. Risk Factors within the Company’s most recent Annual Report on Form 10-K, as such factors may be updated from time to time in the Company’s periodic filings and current reports filed with the SEC. The Company assumes no obligation to update publicly any forward-looking statements, including its Outlook for 2026, whether as a result of new information, future events or otherwise.
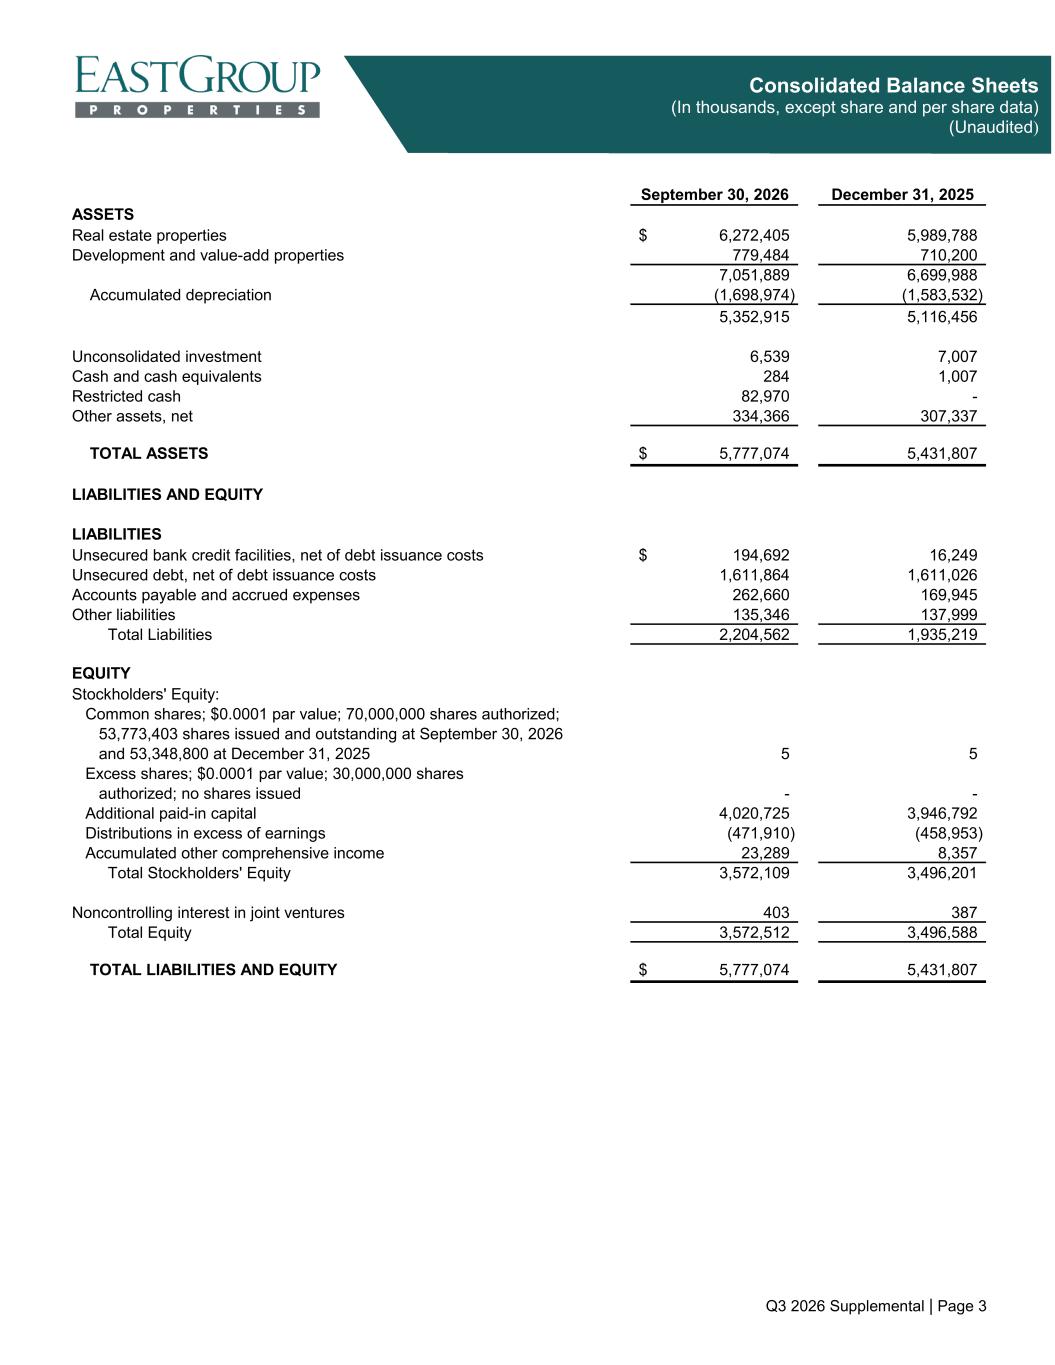
Q3 2026 Supplemental | Page 3 Consolidated Balance Sheets (In thousands, except share and per share data) (Unaudited) September 30, 2026 December 31, 2025 ASSETS Real estate properties 6,272,405$ 5,989,788 Development and value-add properties 779,484 710,200 7,051,889 6,699,988 Accumulated depreciation (1,698,974) (1,583,532) 5,352,915 5,116,456 Unconsolidated investment 6,539 7,007 Cash and cash equivalents 284 1,007 Restricted cash 82,970 - Other assets, net 334,366 307,337 TOTAL ASSETS 5,777,074$ 5,431,807 LIABILITIES AND EQUITY LIABILITIES Unsecured bank credit facilities, net of debt issuance costs 194,692$ 16,249 Unsecured debt, net of debt issuance costs 1,611,864 1,611,026 Accounts payable and accrued expenses 262,660 169,945 Other liabilities 135,346 137,999 Total Liabilities 2,204,562 1,935,219 EQUITY Stockholders' Equity: Common shares; $0.0001 par value; 70,000,000 shares authorized; 53,773,403 shares issued and outstanding at September 30, 2026 and 53,348,800 at December 31, 2025 5 5 Excess shares; $0.0001 par value; 30,000,000 shares authorized; no shares issued - - Additional paid-in capital 4,020,725 3,946,792 Distributions in excess of earnings (471,910) (458,953) Accumulated other comprehensive income 23,289 8,357 Total Stockholders' Equity 3,572,109 3,496,201 Noncontrolling interest in joint ventures 403 387 Total Equity 3,572,512 3,496,588 TOTAL LIABILITIES AND EQUITY 5,777,074$ 5,431,807
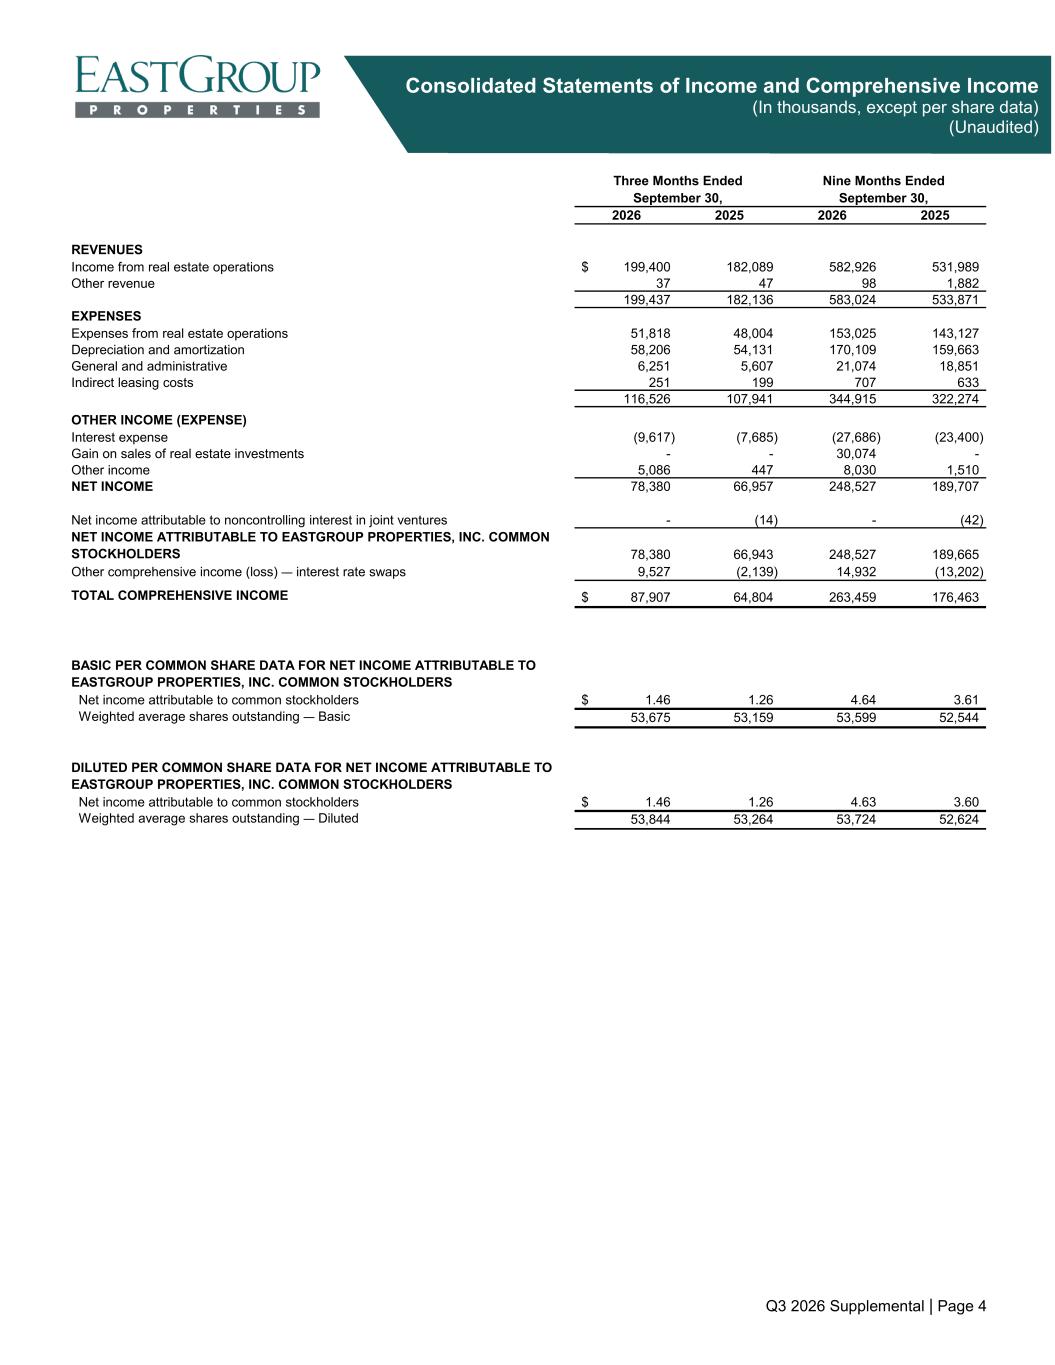
Q3 2026 Supplemental | Page 4 Consolidated Statements of Income and Comprehensive Income (In thousands, except per share data) (Unaudited) 2026 2025 2026 2025 REVENUES Income from real estate operations 199,400$ 182,089 582,926 531,989 Other revenue 37 47 98 1,882 199,437 182,136 583,024 533,871 EXPENSES Expenses from real estate operations 51,818 48,004 153,025 143,127 Depreciation and amortization 58,206 54,131 170,109 159,663 General and administrative 6,251 5,607 21,074 18,851 Indirect leasing costs 251 199 707 633 116,526 107,941 344,915 322,274 OTHER INCOME (EXPENSE) Interest expense (9,617) (7,685) (27,686) (23,400) Gain on sales of real estate investments - - 30,074 - Other income 5,086 447 8,030 1,510 NET INCOME 78,380 66,957 248,527 189,707 Net income attributable to noncontrolling interest in joint ventures - (14) - (42) NET INCOME ATTRIBUTABLE TO EASTGROUP PROPERTIES, INC. COMMON STOCKHOLDERS 78,380 66,943 248,527 189,665 Other comprehensive income (loss) — interest rate swaps 9,527 (2,139) 14,932 (13,202) TOTAL COMPREHENSIVE INCOME 87,907$ 64,804 263,459 176,463 BASIC PER COMMON SHARE DATA FOR NET INCOME ATTRIBUTABLE TO EASTGROUP PROPERTIES, INC. COMMON STOCKHOLDERS Net income attributable to common stockholders 1.46$ 1.26 4.64 3.61 Weighted average shares outstanding — Basic 53,675 53,159 53,599 52,544 DILUTED PER COMMON SHARE DATA FOR NET INCOME ATTRIBUTABLE TO EASTGROUP PROPERTIES, INC. COMMON STOCKHOLDERS Net income attributable to common stockholders 1.46$ 1.26 4.63 3.60 Weighted average shares outstanding — Diluted 53,844 53,264 53,724 52,624 Nine Months Ended September 30,September 30, Three Months Ended
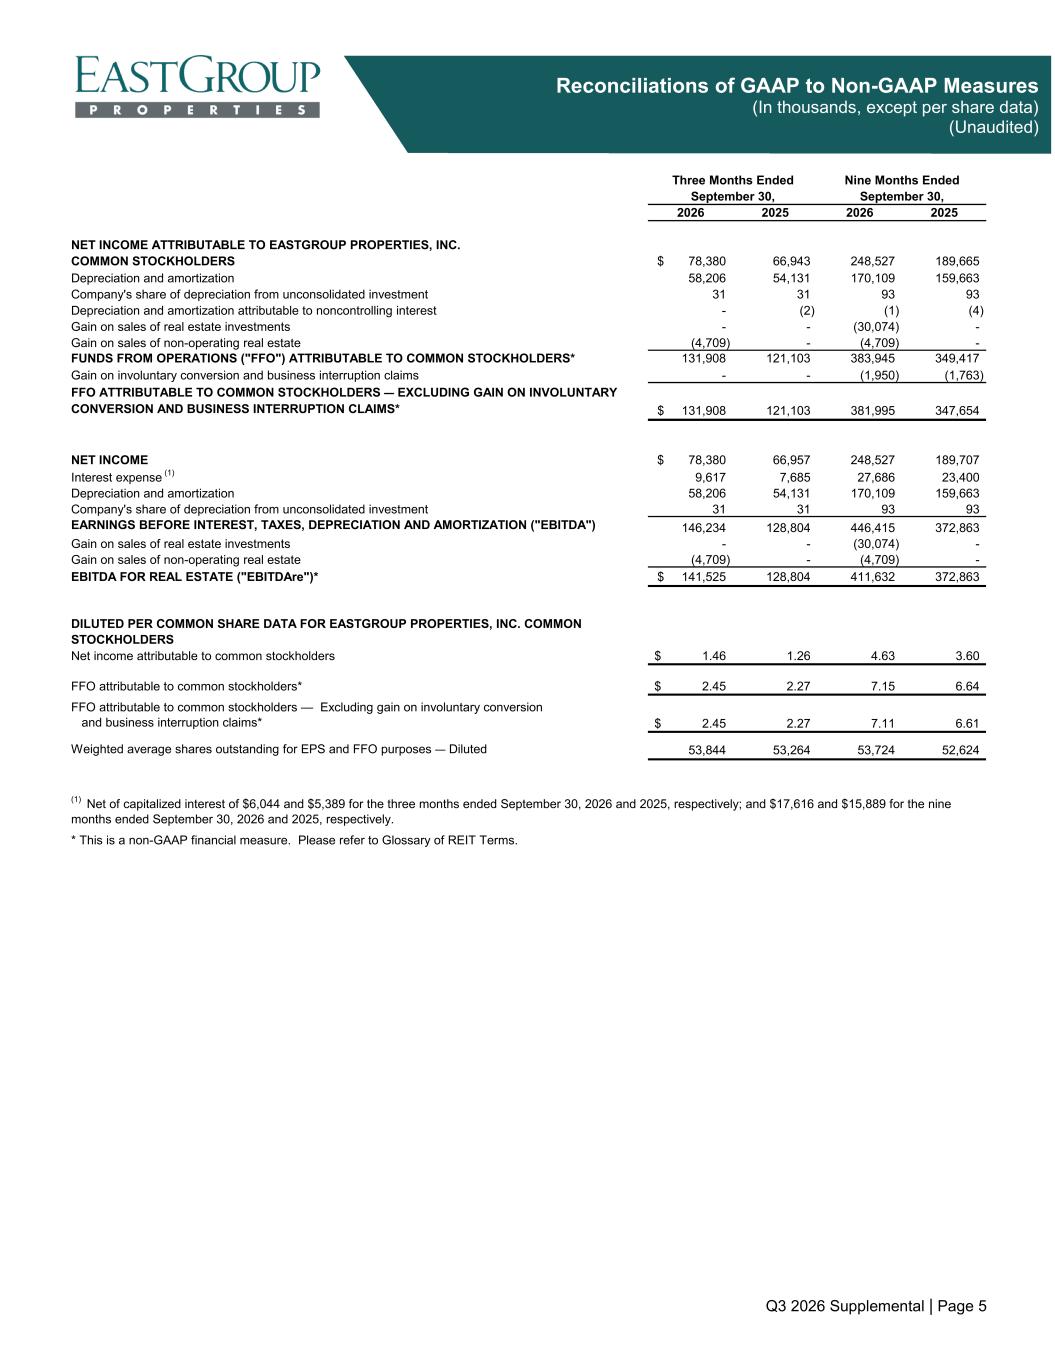
Q3 2026 Supplemental | Page 5 Reconciliations of GAAP to Non-GAAP Measures (In thousands, except per share data) (Unaudited) 2026 2025 2026 2025 NET INCOME ATTRIBUTABLE TO EASTGROUP PROPERTIES, INC. COMMON STOCKHOLDERS 78,380$ 66,943 248,527 189,665 Depreciation and amortization 58,206 54,131 170,109 159,663 Company's share of depreciation from unconsolidated investment 31 31 93 93 Depreciation and amortization attributable to noncontrolling interest - (2) (1) (4) Gain on sales of real estate investments - - (30,074) - Gain on sales of non-operating real estate (4,709) - (4,709) - FUNDS FROM OPERATIONS ("FFO") ATTRIBUTABLE TO COMMON STOCKHOLDERS* 131,908 121,103 383,945 349,417 Gain on involuntary conversion and business interruption claims - - (1,950) (1,763) FFO ATTRIBUTABLE TO COMMON STOCKHOLDERS — EXCLUDING GAIN ON INVOLUNTARY CONVERSION AND BUSINESS INTERRUPTION CLAIMS* 131,908$ 121,103 381,995 347,654 NET INCOME 78,380$ 66,957 248,527 189,707 Interest expense (1) 9,617 7,685 27,686 23,400 Depreciation and amortization 58,206 54,131 170,109 159,663 Company's share of depreciation from unconsolidated investment 31 31 93 93 EARNINGS BEFORE INTEREST, TAXES, DEPRECIATION AND AMORTIZATION ("EBITDA") 146,234 128,804 446,415 372,863 Gain on sales of real estate investments - - (30,074) - Gain on sales of non-operating real estate (4,709) - (4,709) - EBITDA FOR REAL ESTATE ("EBITDAre")* 141,525$ 128,804 411,632 372,863 DILUTED PER COMMON SHARE DATA FOR EASTGROUP PROPERTIES, INC. COMMON STOCKHOLDERS Net income attributable to common stockholders 1.46$ 1.26 4.63 3.60 FFO attributable to common stockholders* 2.45$ 2.27 7.15 6.64 FFO attributable to common stockholders — Excluding gain on involuntary conversion and business interruption claims* 2.45$ 2.27 7.11 6.61 Weighted average shares outstanding for EPS and FFO purposes — Diluted 53,844 53,264 53,724 52,624 (1) Net of capitalized interest of $6,044 and $5,389 for the three months ended September 30, 2026 and 2025, respectively; and $17,616 and $15,889 for the nine months ended September 30, 2026 and 2025, respectively. * This is a non-GAAP financial measure. Please refer to Glossary of REIT Terms. September 30, Three Months Ended September 30, Nine Months Ended
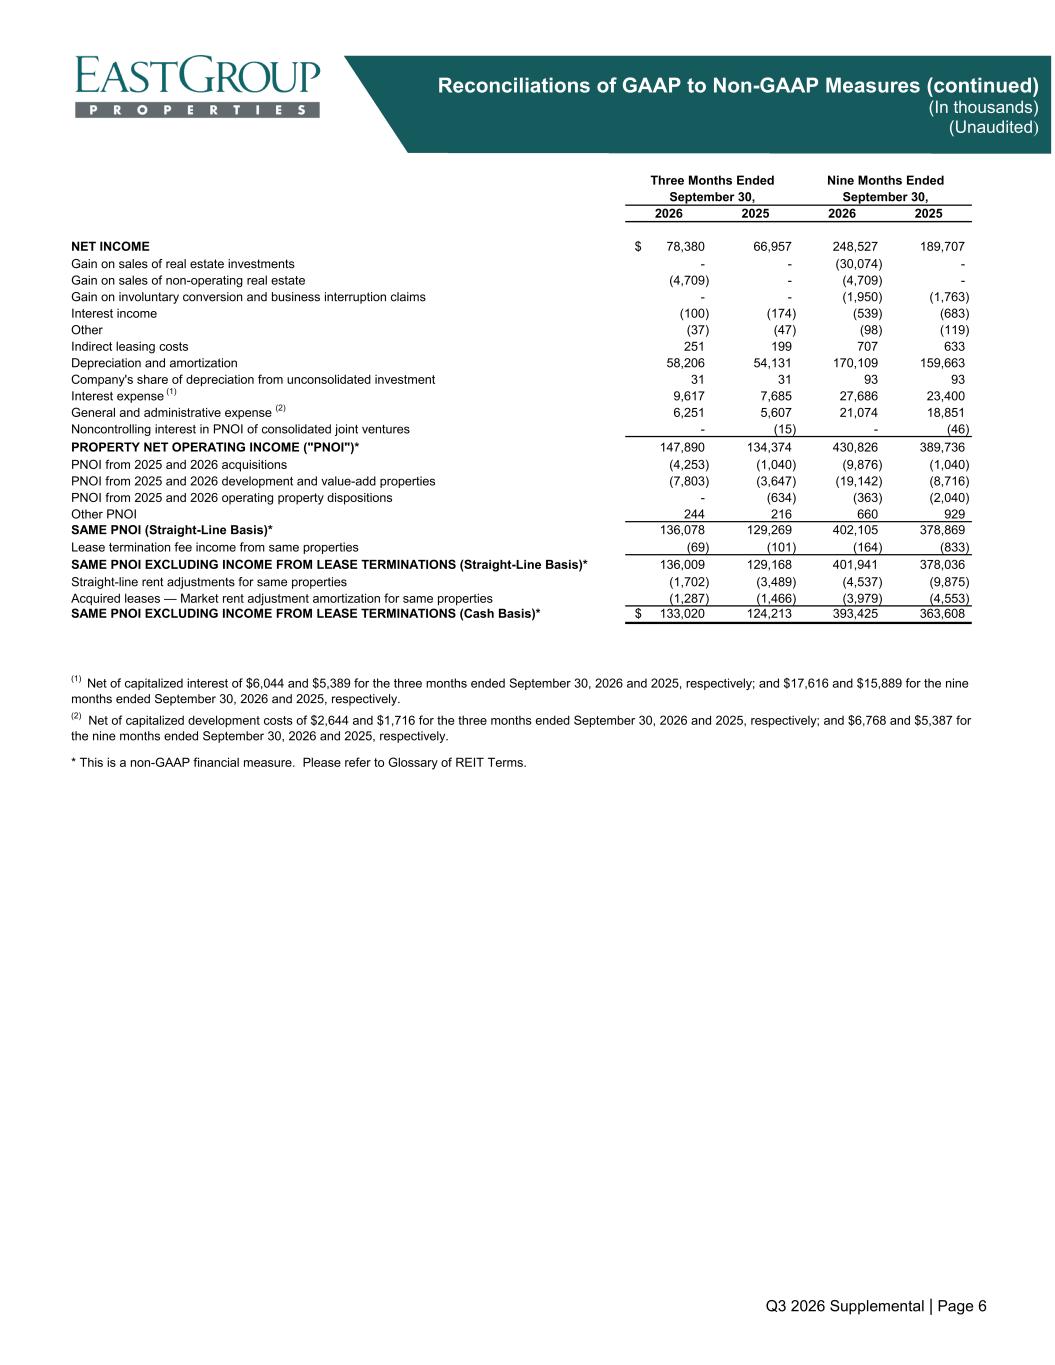
Q3 2026 Supplemental | Page 6 Reconciliations of GAAP to Non-GAAP Measures (continued) (In thousands) (Unaudited) 2026 2025 2026 2025 NET INCOME 78,380$ 66,957 248,527 189,707 Gain on sales of real estate investments - - (30,074) - Gain on sales of non-operating real estate (4,709) - (4,709) - Gain on involuntary conversion and business interruption claims - - (1,950) (1,763) Interest income (100) (174) (539) (683) Other (37) (47) (98) (119) Indirect leasing costs 251 199 707 633 Depreciation and amortization 58,206 54,131 170,109 159,663 Company's share of depreciation from unconsolidated investment 31 31 93 93 Interest expense (1) 9,617 7,685 27,686 23,400 General and administrative expense (2) 6,251 5,607 21,074 18,851 Noncontrolling interest in PNOI of consolidated joint ventures - (15) - (46) PROPERTY NET OPERATING INCOME ("PNOI")* 147,890 134,374 430,826 389,736 PNOI from 2025 and 2026 acquisitions (4,253) (1,040) (9,876) (1,040) PNOI from 2025 and 2026 development and value-add properties (7,803) (3,647) (19,142) (8,716) PNOI from 2025 and 2026 operating property dispositions - (634) (363) (2,040) Other PNOI 244 216 660 929 SAME PNOI (Straight-Line Basis)* 136,078 129,269 402,105 378,869 Lease termination fee income from same properties (69) (101) (164) (833) SAME PNOI EXCLUDING INCOME FROM LEASE TERMINATIONS (Straight-Line Basis)* 136,009 129,168 401,941 378,036 Straight-line rent adjustments for same properties (1,702) (3,489) (4,537) (9,875) Acquired leases — Market rent adjustment amortization for same properties (1,287) (1,466) (3,979) (4,553) SAME PNOI EXCLUDING INCOME FROM LEASE TERMINATIONS (Cash Basis)* 133,020$ 124,213 393,425 363,608 (2) Net of capitalized development costs of $2,644 and $1,716 for the three months ended September 30, 2026 and 2025, respectively; and $6,768 and $5,387 for the nine months ended September 30, 2026 and 2025, respectively. Three Months Ended * This is a non-GAAP financial measure. Please refer to Glossary of REIT Terms. Nine Months Ended September 30, September 30, (1) Net of capitalized interest of $6,044 and $5,389 for the three months ended September 30, 2026 and 2025, respectively; and $17,616 and $15,889 for the nine months ended September 30, 2026 and 2025, respectively.
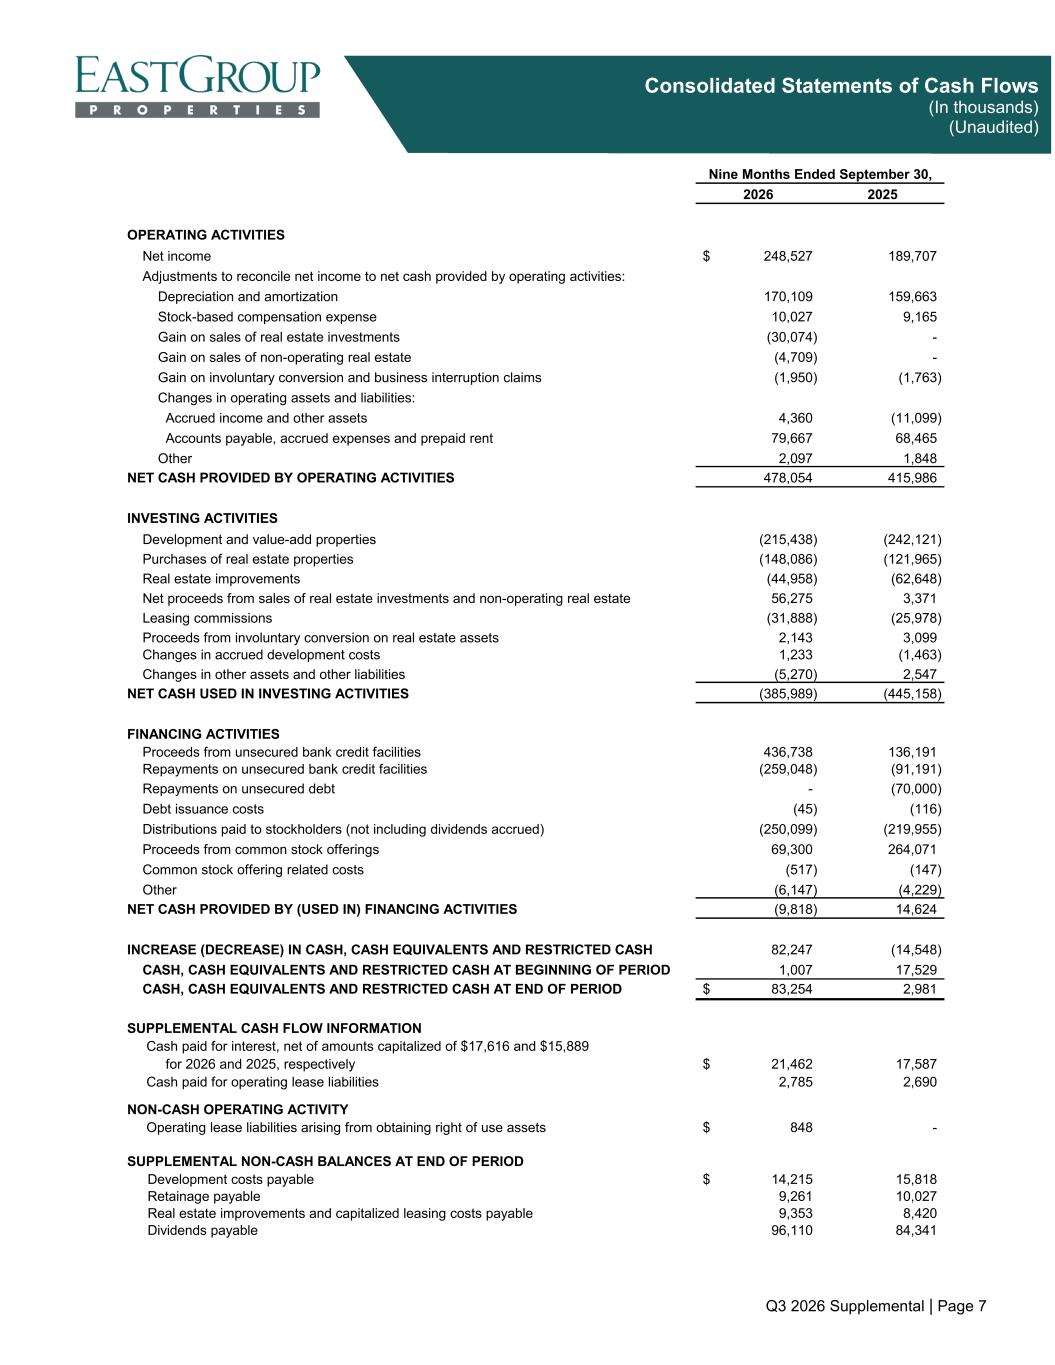
Q3 2026 Supplemental | Page 7 Consolidated Statements of Cash Flows (In thousands) (Unaudited) 2026 2025 OPERATING ACTIVITIES Net income 248,527$ 189,707 Adjustments to reconcile net income to net cash provided by operating activities: Depreciation and amortization 170,109 159,663 Stock-based compensation expense 10,027 9,165 Gain on sales of real estate investments (30,074) - Gain on sales of non-operating real estate (4,709) - Gain on involuntary conversion and business interruption claims (1,950) (1,763) Changes in operating assets and liabilities: Accrued income and other assets 4,360 (11,099) Accounts payable, accrued expenses and prepaid rent 79,667 68,465 Other 2,097 1,848 NET CASH PROVIDED BY OPERATING ACTIVITIES 478,054 415,986 INVESTING ACTIVITIES Development and value-add properties (215,438) (242,121) Purchases of real estate properties (148,086) (121,965) Real estate improvements (44,958) (62,648) Net proceeds from sales of real estate investments and non-operating real estate 56,275 3,371 Leasing commissions (31,888) (25,978) Proceeds from involuntary conversion on real estate assets 2,143 3,099 Changes in accrued development costs 1,233 (1,463) Changes in other assets and other liabilities (5,270) 2,547 NET CASH USED IN INVESTING ACTIVITIES (385,989) (445,158) FINANCING ACTIVITIES Proceeds from unsecured bank credit facilities 436,738 136,191 Repayments on unsecured bank credit facilities (259,048) (91,191) Repayments on unsecured debt - (70,000) Debt issuance costs (45) (116) Distributions paid to stockholders (not including dividends accrued) (250,099) (219,955) Proceeds from common stock offerings 69,300 264,071 Common stock offering related costs (517) (147) Other (6,147) (4,229) NET CASH PROVIDED BY (USED IN) FINANCING ACTIVITIES (9,818) 14,624 INCREASE (DECREASE) IN CASH, CASH EQUIVALENTS AND RESTRICTED CASH 82,247 (14,548) CASH, CASH EQUIVALENTS AND RESTRICTED CASH AT BEGINNING OF PERIOD 1,007 17,529 CASH, CASH EQUIVALENTS AND RESTRICTED CASH AT END OF PERIOD 83,254$ 2,981 SUPPLEMENTAL CASH FLOW INFORMATION Cash paid for interest, net of amounts capitalized of $17,616 and $15,889 for 2026 and 2025, respectively 21,462$ 17,587 Cash paid for operating lease liabilities 2,785 2,690 NON-CASH OPERATING ACTIVITY Operating lease liabilities arising from obtaining right of use assets 848$ - SUPPLEMENTAL NON-CASH BALANCES AT END OF PERIOD Development costs payable 14,215$ 15,818 Retainage payable 9,261 10,027 Real estate improvements and capitalized leasing costs payable 9,353 8,420 Dividends payable 96,110 84,341 Nine Months Ended September 30,
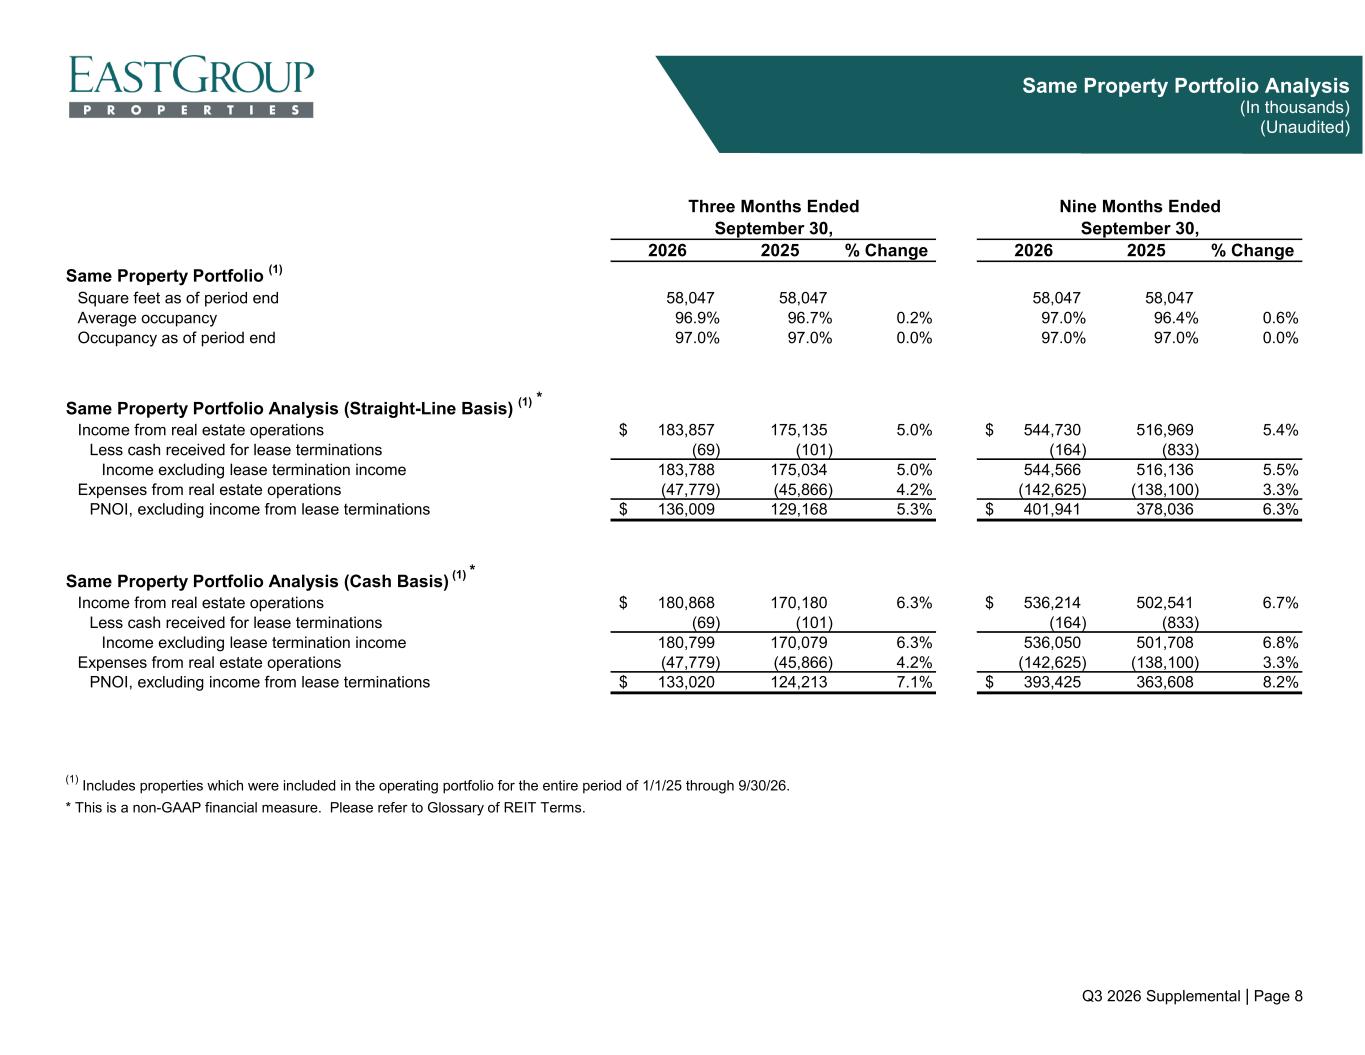
Q3 2026 Supplemental | Page 8 Same Property Portfolio Analysis (In thousands) (Unaudited) 2026 2025 % Change 2026 2025 % Change Same Property Portfolio (1) Square feet as of period end 58,047 58,047 58,047 58,047 Average occupancy 96.9% 96.7% 0.2% 97.0% 96.4% 0.6% Occupancy as of period end 97.0% 97.0% 0.0% 97.0% 97.0% 0.0% Same Property Portfolio Analysis (Straight-Line Basis) (1) * Income from real estate operations 183,857$ 175,135 5.0% 544,730$ 516,969 5.4% Less cash received for lease terminations (69) (101) (164) (833) Income excluding lease termination income 183,788 175,034 5.0% 544,566 516,136 5.5% Expenses from real estate operations (47,779) (45,866) 4.2% (142,625) (138,100) 3.3% PNOI, excluding income from lease terminations 136,009$ 129,168 5.3% 401,941$ 378,036 6.3% Same Property Portfolio Analysis (Cash Basis) (1) * Income from real estate operations 180,868$ 170,180 6.3% 536,214$ 502,541 6.7% Less cash received for lease terminations (69) (101) (164) (833) Income excluding lease termination income 180,799 170,079 6.3% 536,050 501,708 6.8% Expenses from real estate operations (47,779) (45,866) 4.2% (142,625) (138,100) 3.3% PNOI, excluding income from lease terminations 133,020$ 124,213 7.1% 393,425$ 363,608 8.2% (1) Includes properties which were included in the operating portfolio for the entire period of 1/1/25 through 9/30/26. * This is a non-GAAP financial measure. Please refer to Glossary of REIT Terms. September 30, September 30, Three Months Ended Nine Months Ended
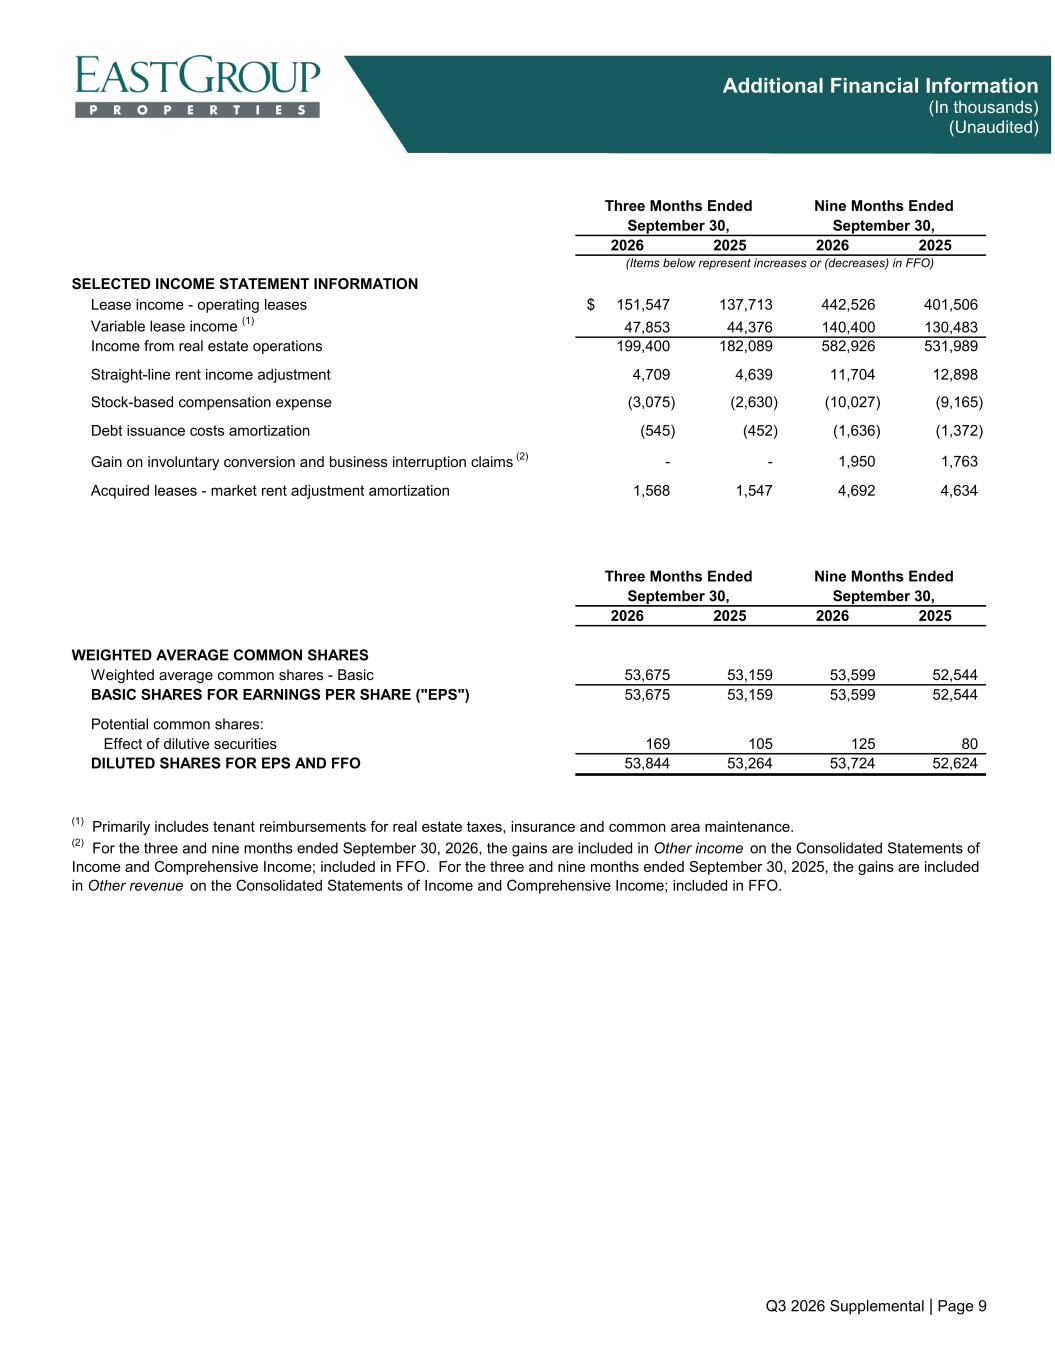
Q3 2026 Supplemental | Page 9 Additional Financial Information (In thousands) (Unaudited) 2026 2025 2026 2025 Lease income - operating leases 151,547$ 137,713 442,526 401,506 Variable lease income (1) 47,853 44,376 140,400 130,483 Income from real estate operations 199,400 182,089 582,926 531,989 Straight-line rent income adjustment 4,709 4,639 11,704 12,898 Stock-based compensation expense (3,075) (2,630) (10,027) (9,165) Debt issuance costs amortization (545) (452) (1,636) (1,372) Gain on involuntary conversion and business interruption claims (2) - - 1,950 1,763 Acquired leases - market rent adjustment amortization 1,568 1,547 4,692 4,634 2026 2025 2026 2025 WEIGHTED AVERAGE COMMON SHARES Weighted average common shares - Basic 53,675 53,159 53,599 52,544 BASIC SHARES FOR EARNINGS PER SHARE ("EPS") 53,675 53,159 53,599 52,544 Potential common shares: Effect of dilutive securities 169 105 125 80 DILUTED SHARES FOR EPS AND FFO 53,844 53,264 53,724 52,624 (1) Primarily includes tenant reimbursements for real estate taxes, insurance and common area maintenance. SELECTED INCOME STATEMENT INFORMATION (Items below represent increases or (decreases) in FFO) (2) For the three and nine months ended September 30, 2026, the gains are included in Other income on the Consolidated Statements of Income and Comprehensive Income; included in FFO. For the three and nine months ended September 30, 2025, the gains are included in Other revenue on the Consolidated Statements of Income and Comprehensive Income; included in FFO. September 30, Three Months Ended Three Months Ended September 30, Nine Months Ended September 30, Nine Months Ended September 30,
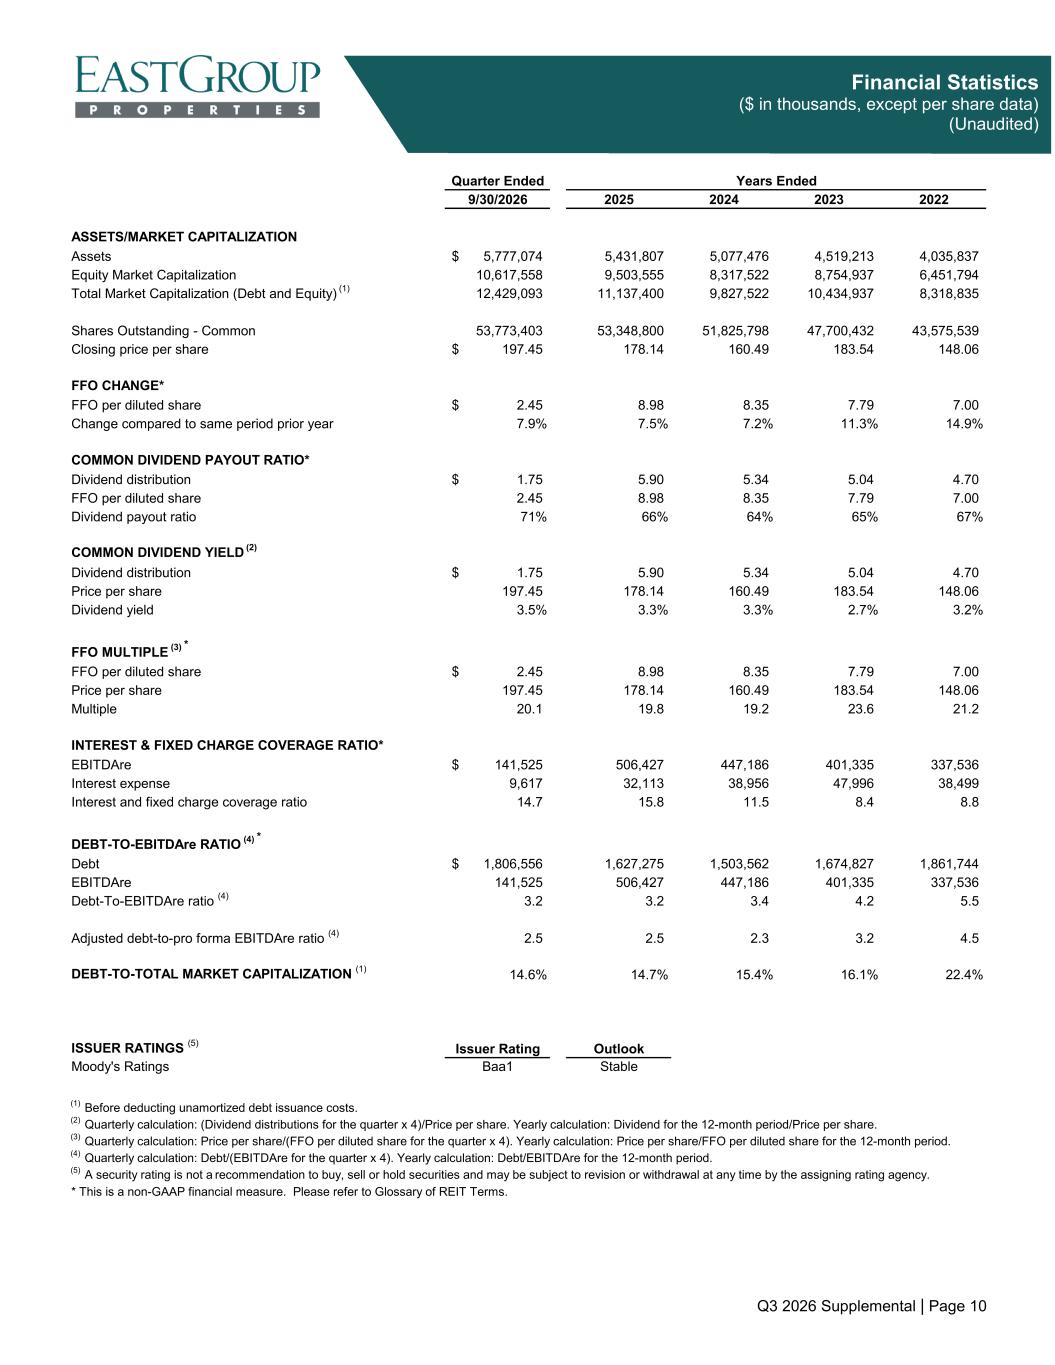
Q3 2026 Supplemental | Page 10 Financial Statistics ($ in thousands, except per share data) (Unaudited) Quarter Ended 9/30/2026 2025 2024 2023 2022 ASSETS/MARKET CAPITALIZATION Assets 5,777,074$ 5,431,807 5,077,476 4,519,213 4,035,837 Equity Market Capitalization 10,617,558 9,503,555 8,317,522 8,754,937 6,451,794 Total Market Capitalization (Debt and Equity) (1) 12,429,093 11,137,400 9,827,522 10,434,937 8,318,835 Shares Outstanding - Common 53,773,403 53,348,800 51,825,798 47,700,432 43,575,539 Closing price per share 197.45$ 178.14 160.49 183.54 148.06 FFO CHANGE* FFO per diluted share 2.45$ 8.98 8.35 7.79 7.00 Change compared to same period prior year 7.9% 7.5% 7.2% 11.3% 14.9% COMMON DIVIDEND PAYOUT RATIO* Dividend distribution 1.75$ 5.90 5.34 5.04 4.70 FFO per diluted share 2.45 8.98 8.35 7.79 7.00 Dividend payout ratio 71% 66% 64% 65% 67% COMMON DIVIDEND YIELD (2) Dividend distribution 1.75$ 5.90 5.34 5.04 4.70 Price per share 197.45 178.14 160.49 183.54 148.06 Dividend yield 3.5% 3.3% 3.3% 2.7% 3.2% FFO MULTIPLE (3) * FFO per diluted share 2.45$ 8.98 8.35 7.79 7.00 Price per share 197.45 178.14 160.49 183.54 148.06 Multiple 20.1 19.8 19.2 23.6 21.2 INTEREST & FIXED CHARGE COVERAGE RATIO* EBITDAre 141,525$ 506,427 447,186 401,335 337,536 Interest expense 9,617 32,113 38,956 47,996 38,499 Interest and fixed charge coverage ratio 14.7 15.8 11.5 8.4 8.8 DEBT-TO-EBITDAre RATIO (4) * Debt 1,806,556$ 1,627,275 1,503,562 1,674,827 1,861,744 EBITDAre 141,525 506,427 447,186 401,335 337,536 Debt-To-EBITDAre ratio (4) 3.2 3.2 3.4 4.2 5.5 Adjusted debt-to-pro forma EBITDAre ratio (4) 2.5 2.5 2.3 3.2 4.5 DEBT-TO-TOTAL MARKET CAPITALIZATION (1) 14.6% 14.7% 15.4% 16.1% 22.4% ISSUER RATINGS (5) Issuer Rating Outlook Moody's Ratings Baa1 Stable (1) Before deducting unamortized debt issuance costs. (2) Quarterly calculation: (Dividend distributions for the quarter x 4)/Price per share. Yearly calculation: Dividend for the 12-month period/Price per share. (3) Quarterly calculation: Price per share/(FFO per diluted share for the quarter x 4). Yearly calculation: Price per share/FFO per diluted share for the 12-month period. (4) Quarterly calculation: Debt/(EBITDAre for the quarter x 4). Yearly calculation: Debt/EBITDAre for the 12-month period. (5) A security rating is not a recommendation to buy, sell or hold securities and may be subject to revision or withdrawal at any time by the assigning rating agency. * This is a non-GAAP financial measure. Please refer to Glossary of REIT Terms. Years Ended
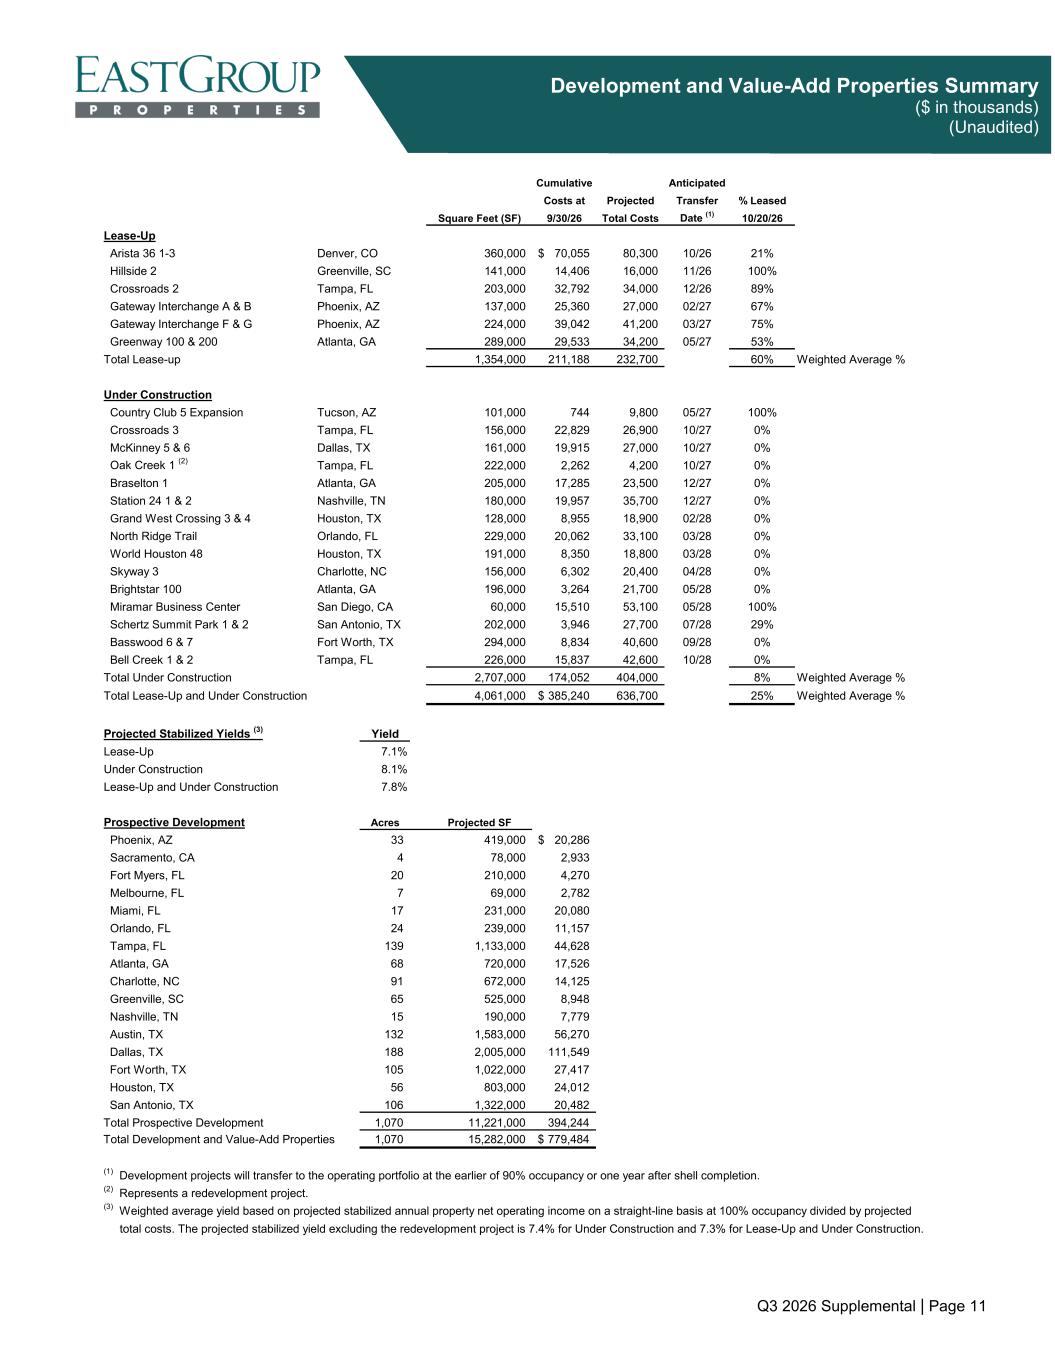
Q3 2026 Supplemental | Page 11 Development and Value-Add Properties Summary ($ in thousands) (Unaudited) Cumulative Anticipated Costs at Projected Transfer % Leased Square Feet (SF) 9/30/26 Total Costs Date (1) 10/20/26 Lease-Up Arista 36 1-3 Denver, CO 360,000 70,055$ 80,300 10/26 21% Hillside 2 Greenville, SC 141,000 14,406 16,000 11/26 100% Crossroads 2 Tampa, FL 203,000 32,792 34,000 12/26 89% Gateway Interchange A & B Phoenix, AZ 137,000 25,360 27,000 02/27 67% Gateway Interchange F & G Phoenix, AZ 224,000 39,042 41,200 03/27 75% Greenway 100 & 200 Atlanta, GA 289,000 29,533 34,200 05/27 53% Total Lease-up 1,354,000 211,188 232,700 60% Weighted Average % Under Construction Country Club 5 Expansion Tucson, AZ 101,000 744 9,800 05/27 100% Crossroads 3 Tampa, FL 156,000 22,829 26,900 10/27 0% McKinney 5 & 6 Dallas, TX 161,000 19,915 27,000 10/27 0% Oak Creek 1 (2) Tampa, FL 222,000 2,262 4,200 10/27 0% Braselton 1 Atlanta, GA 205,000 17,285 23,500 12/27 0% Station 24 1 & 2 Nashville, TN 180,000 19,957 35,700 12/27 0% Grand West Crossing 3 & 4 Houston, TX 128,000 8,955 18,900 02/28 0% North Ridge Trail Orlando, FL 229,000 20,062 33,100 03/28 0% World Houston 48 Houston, TX 191,000 8,350 18,800 03/28 0% Skyway 3 Charlotte, NC 156,000 6,302 20,400 04/28 0% Brightstar 100 Atlanta, GA 196,000 3,264 21,700 05/28 0% Miramar Business Center San Diego, CA 60,000 15,510 53,100 05/28 100% Schertz Summit Park 1 & 2 San Antonio, TX 202,000 3,946 27,700 07/28 29% Basswood 6 & 7 Fort Worth, TX 294,000 8,834 40,600 09/28 0% Bell Creek 1 & 2 Tampa, FL 226,000 15,837 42,600 10/28 0% Total Under Construction 2,707,000 174,052 404,000 8% Weighted Average % Total Lease-Up and Under Construction 4,061,000 385,240$ 636,700 25% Weighted Average % Projected Stabilized Yields (3) Yield Lease-Up 7.1% Under Construction 8.1% Lease-Up and Under Construction 7.8% Prospective Development Acres Projected SF Phoenix, AZ 33 419,000 20,286$ Sacramento, CA 4 78,000 2,933 Fort Myers, FL 20 210,000 4,270 Melbourne, FL 7 69,000 2,782 Miami, FL 17 231,000 20,080 Orlando, FL 24 239,000 11,157 Tampa, FL 139 1,133,000 44,628 Atlanta, GA 68 720,000 17,526 Charlotte, NC 91 672,000 14,125 Greenville, SC 65 525,000 8,948 Nashville, TN 15 190,000 7,779 Austin, TX 132 1,583,000 56,270 Dallas, TX 188 2,005,000 111,549 Fort Worth, TX 105 1,022,000 27,417 Houston, TX 56 803,000 24,012 San Antonio, TX 106 1,322,000 20,482 Total Prospective Development 1,070 11,221,000 394,244 Total Development and Value-Add Properties 1,070 15,282,000 779,484$ (1) Development projects will transfer to the operating portfolio at the earlier of 90% occupancy or one year after shell completion. (2) Represents a redevelopment project. (3) Weighted average yield based on projected stabilized annual property net operating income on a straight-line basis at 100% occupancy divided by projected total costs. The projected stabilized yield excluding the redevelopment project is 7.4% for Under Construction and 7.3% for Lease-Up and Under Construction.
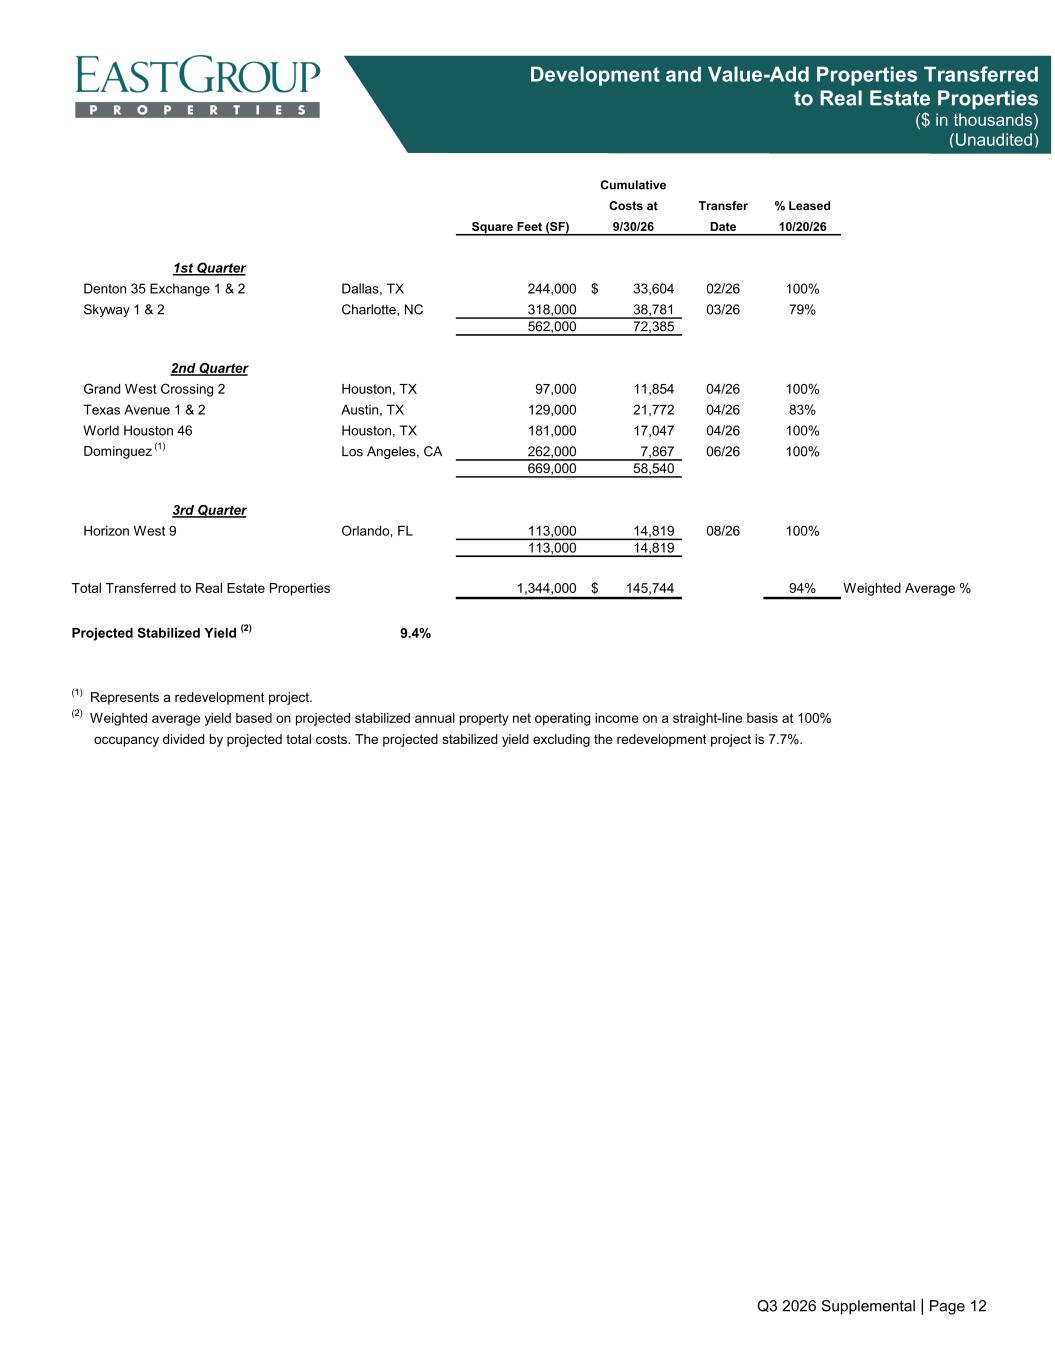
Q3 2026 Supplemental | Page 12 Development and Value-Add Properties Transferred to Real Estate Properties ($ in thousands) (Unaudited) Cumulative Costs at Transfer % Leased Square Feet (SF) 9/30/26 Date 10/20/26 1st Quarter Denton 35 Exchange 1 & 2 Dallas, TX 244,000 33,604$ 02/26 100% Skyway 1 & 2 Charlotte, NC 318,000 38,781 03/26 79% 562,000 72,385 2nd Quarter Grand West Crossing 2 Houston, TX 97,000 11,854 04/26 100% Texas Avenue 1 & 2 Austin, TX 129,000 21,772 04/26 83% World Houston 46 Houston, TX 181,000 17,047 04/26 100% Dominguez (1) Los Angeles, CA 262,000 7,867 06/26 100% 669,000 58,540 3rd Quarter Horizon West 9 Orlando, FL 113,000 14,819 08/26 100% 113,000 14,819 Total Transferred to Real Estate Properties 1,344,000 145,744$ 94% Weighted Average % Projected Stabilized Yield (2) 9.4% (1) Represents a redevelopment project. (2) Weighted average yield based on projected stabilized annual property net operating income on a straight-line basis at 100% occupancy divided by projected total costs. The projected stabilized yield excluding the redevelopment project is 7.7%.
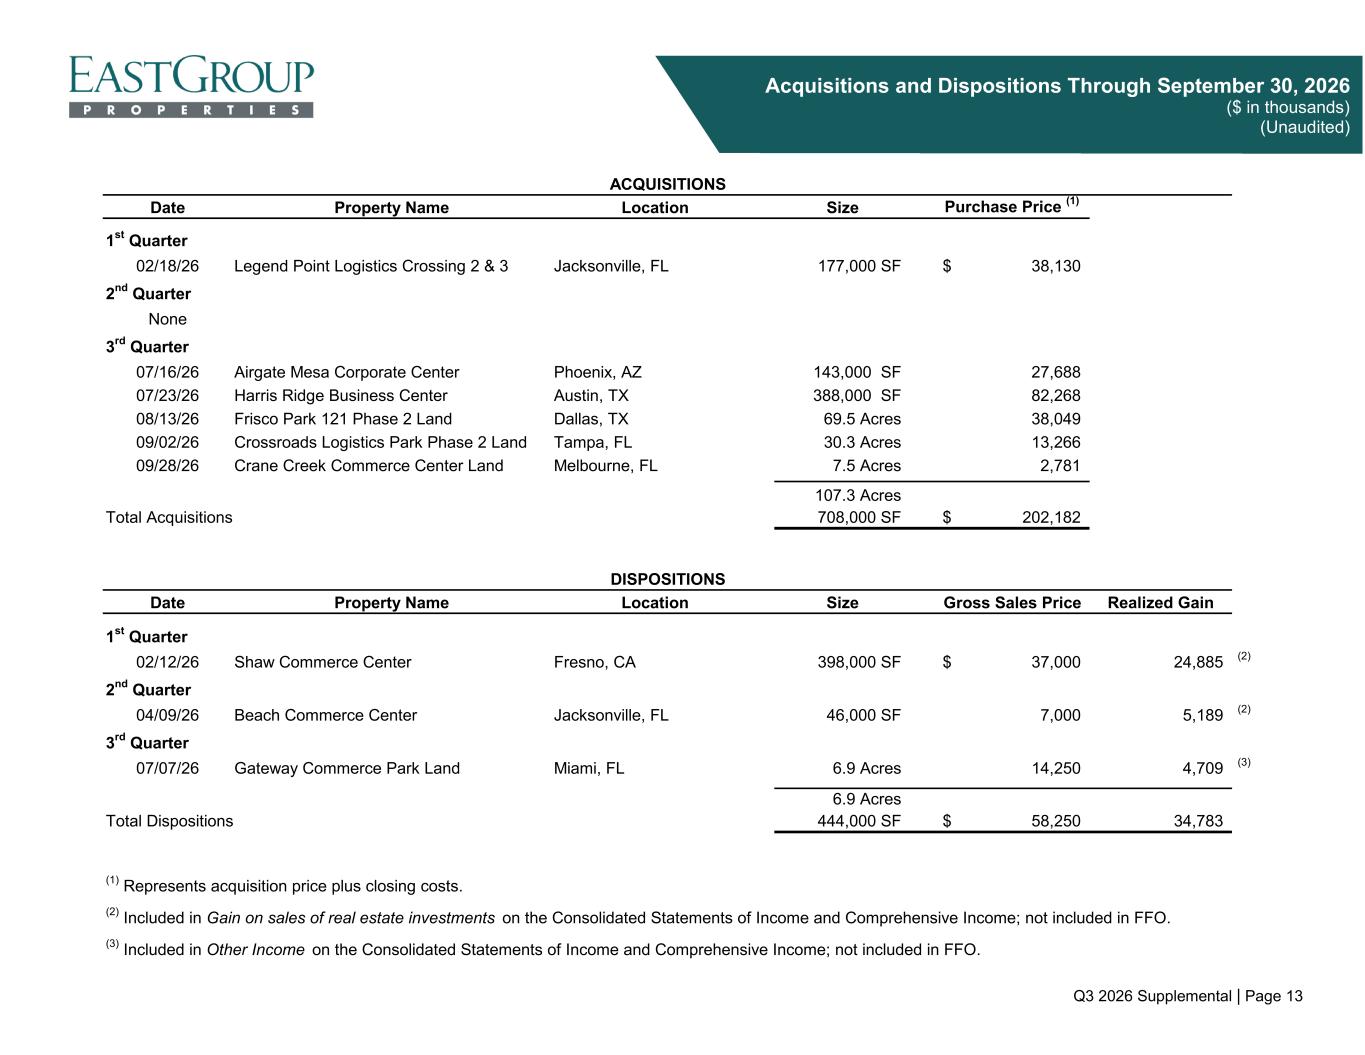
Q3 2026 Supplemental | Page 13 Acquisitions and Dispositions Through September 30, 2026 ($ in thousands) (Unaudited) Date Property Name Location Size Purchase Price (1) 1st Quarter 02/18/26 Legend Point Logistics Crossing 2 & 3 Jacksonville, FL 177,000 SF 38,130$ 2nd Quarter None 3rd Quarter 07/16/26 Airgate Mesa Corporate Center Phoenix, AZ 143,000 SF 27,688 07/23/26 Harris Ridge Business Center Austin, TX 388,000 SF 82,268 08/13/26 Frisco Park 121 Phase 2 Land Dallas, TX 69.5 Acres 38,049 09/02/26 Crossroads Logistics Park Phase 2 Land Tampa, FL 30.3 Acres 13,266 09/28/26 Crane Creek Commerce Center Land Melbourne, FL 7.5 Acres 2,781 107.3 Acres Total Acquisitions 708,000 SF 202,182$ Date Property Name Location Size Gross Sales Price 1st Quarter 02/12/26 Shaw Commerce Center Fresno, CA 398,000 SF 37,000$ 24,885 (2) 2nd Quarter 04/09/26 Beach Commerce Center Jacksonville, FL 46,000 SF 7,000 5,189 (2) 3rd Quarter 07/07/26 Gateway Commerce Park Land Miami, FL 6.9 Acres 14,250 4,709 (3) 6.9 Acres Total Dispositions 444,000 SF 58,250$ 34,783 (3) Included in Other Income on the Consolidated Statements of Income and Comprehensive Income; not included in FFO. (2) Included in Gain on sales of real estate investments on the Consolidated Statements of Income and Comprehensive Income; not included in FFO. DISPOSITIONS ACQUISITIONS (1) Represents acquisition price plus closing costs. Realized Gain
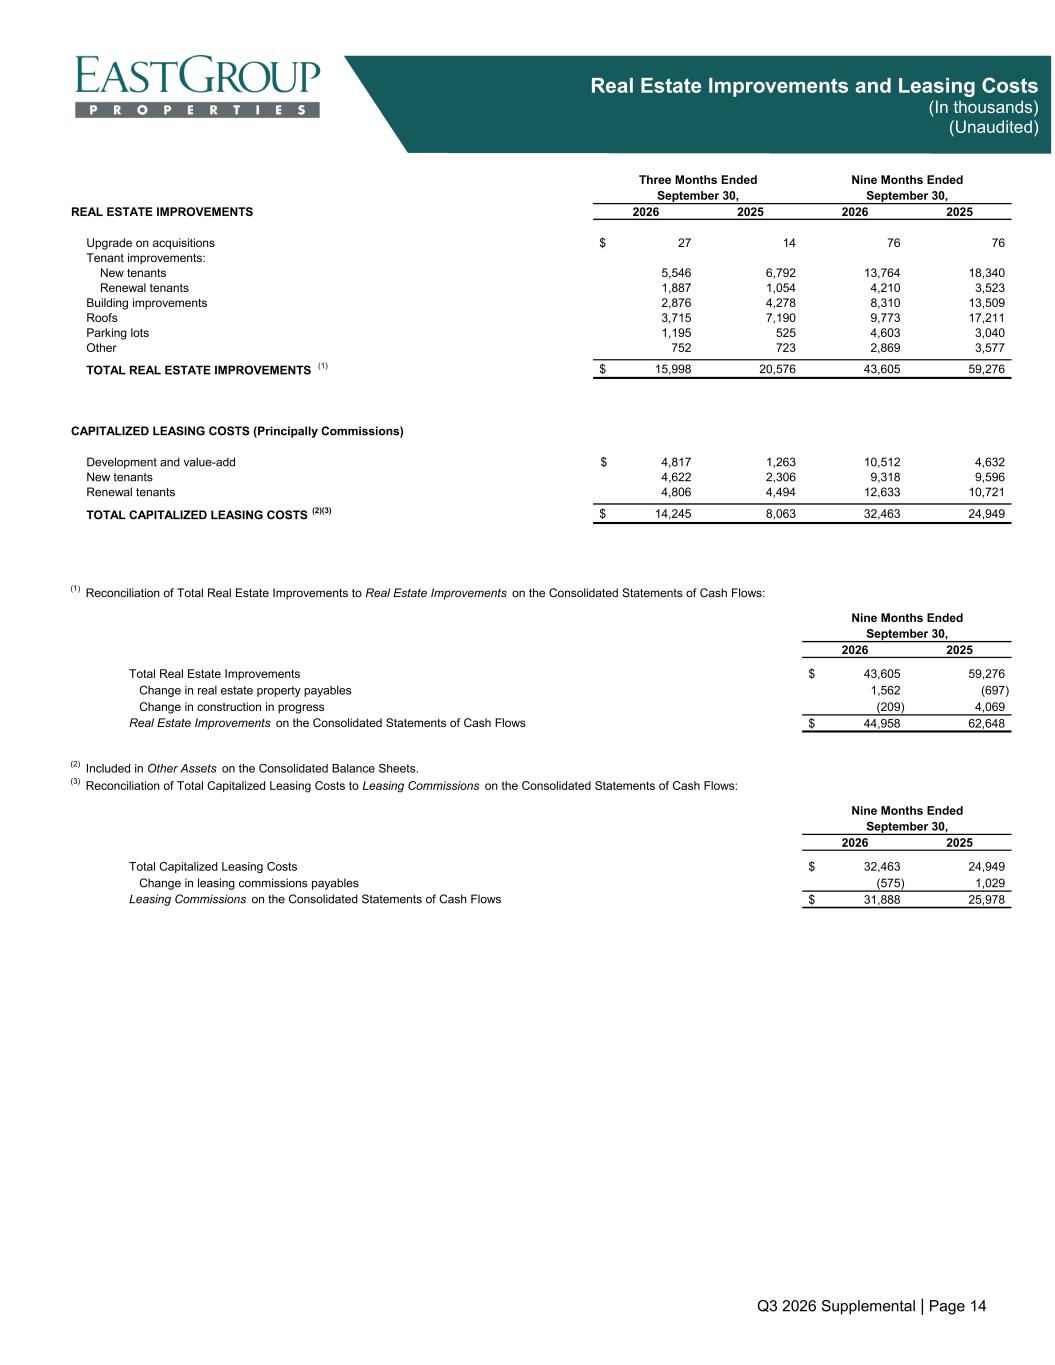
Q3 2026 Supplemental | Page 14 Real Estate Improvements and Leasing Costs (In thousands) (Unaudited) REAL ESTATE IMPROVEMENTS 2026 2025 2026 2025 Upgrade on acquisitions 27$ 14 76 76 Tenant improvements: New tenants 5,546 6,792 13,764 18,340 Renewal tenants 1,887 1,054 4,210 3,523 Building improvements 2,876 4,278 8,310 13,509 Roofs 3,715 7,190 9,773 17,211 Parking lots 1,195 525 4,603 3,040 Other 752 723 2,869 3,577 TOTAL REAL ESTATE IMPROVEMENTS (1) 15,998$ 20,576 43,605 59,276 CAPITALIZED LEASING COSTS (Principally Commissions) Development and value-add 4,817$ 1,263 10,512 4,632 New tenants 4,622 2,306 9,318 9,596 Renewal tenants 4,806 4,494 12,633 10,721 TOTAL CAPITALIZED LEASING COSTS (2)(3) 14,245$ 8,063 32,463 24,949 (1) Reconciliation of Total Real Estate Improvements to Real Estate Improvements on the Consolidated Statements of Cash Flows: 2026 2025 Total Real Estate Improvements 43,605$ 59,276 Change in real estate property payables 1,562 (697) Change in construction in progress (209) 4,069 44,958$ 62,648 (2) Included in Other Assets on the Consolidated Balance Sheets. (3) Reconciliation of Total Capitalized Leasing Costs to Leasing Commissions on the Consolidated Statements of Cash Flows: 2026 2025 Total Capitalized Leasing Costs 32,463$ 24,949 Change in leasing commissions payables (575) 1,029 31,888$ 25,978 Nine Months Ended September 30, Nine Months EndedThree Months Ended September 30, Nine Months Ended September 30, Leasing Commissions on the Consolidated Statements of Cash Flows September 30, Real Estate Improvements on the Consolidated Statements of Cash Flows
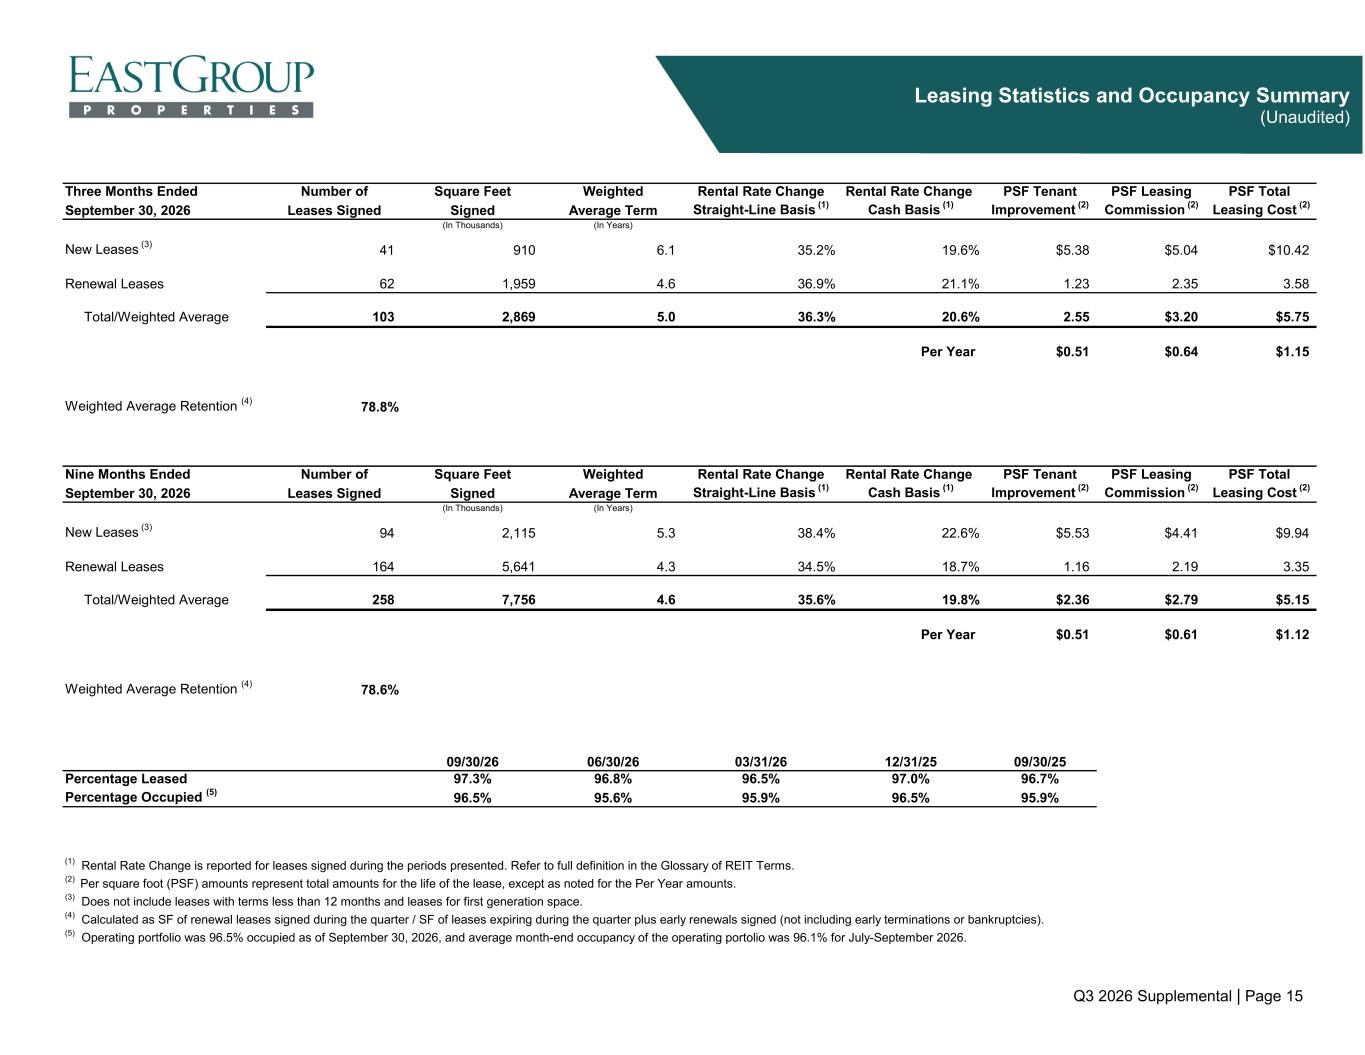
Q3 2026 Supplemental | Page 15 Leasing Statistics and Occupancy Summary (Unaudited) Three Months Ended Number of Square Feet Weighted Rental Rate Change Rental Rate Change PSF Tenant PSF Leasing PSF Total September 30, 2026 Leases Signed Signed Average Term Straight-Line Basis (1) Cash Basis (1) Improvement (2) Commission (2) Leasing Cost (2) (In Thousands) (In Years) New Leases (3) 41 910 6.1 35.2% 19.6% $5.38 $5.04 $10.42 Renewal Leases 62 1,959 4.6 36.9% 21.1% 1.23 2.35 3.58 Total/Weighted Average 103 2,869 5.0 36.3% 20.6% 2.55 $3.20 $5.75 Per Year $0.51 $0.64 $1.15 Weighted Average Retention (4) 78.8% Nine Months Ended Number of Square Feet Weighted Rental Rate Change Rental Rate Change PSF Tenant PSF Leasing PSF Total September 30, 2026 Leases Signed Signed Average Term Straight-Line Basis (1) Cash Basis (1) Improvement (2) Commission (2) Leasing Cost (2) (In Thousands) (In Years) New Leases (3) 94 2,115 5.3 38.4% 22.6% $5.53 $4.41 $9.94 Renewal Leases 164 5,641 4.3 34.5% 18.7% 1.16 2.19 3.35 Total/Weighted Average 258 7,756 4.6 35.6% 19.8% $2.36 $2.79 $5.15 Per Year $0.51 $0.61 $1.12 Weighted Average Retention (4) 78.6% 09/30/26 06/30/26 03/31/26 12/31/25 09/30/25 Percentage Leased 97.3% 96.8% 96.5% 97.0% 96.7% Percentage Occupied (5) 96.5% 95.6% 95.9% 96.5% 95.9% (1) Rental Rate Change is reported for leases signed during the periods presented. Refer to full definition in the Glossary of REIT Terms. (2) Per square foot (PSF) amounts represent total amounts for the life of the lease, except as noted for the Per Year amounts. (3) Does not include leases with terms less than 12 months and leases for first generation space. (4) Calculated as SF of renewal leases signed during the quarter / SF of leases expiring during the quarter plus early renewals signed (not including early terminations or bankruptcies). (5) Operating portfolio was 96.5% occupied as of September 30, 2026, and average month-end occupancy of the operating portolio was 96.1% for July-September 2026.
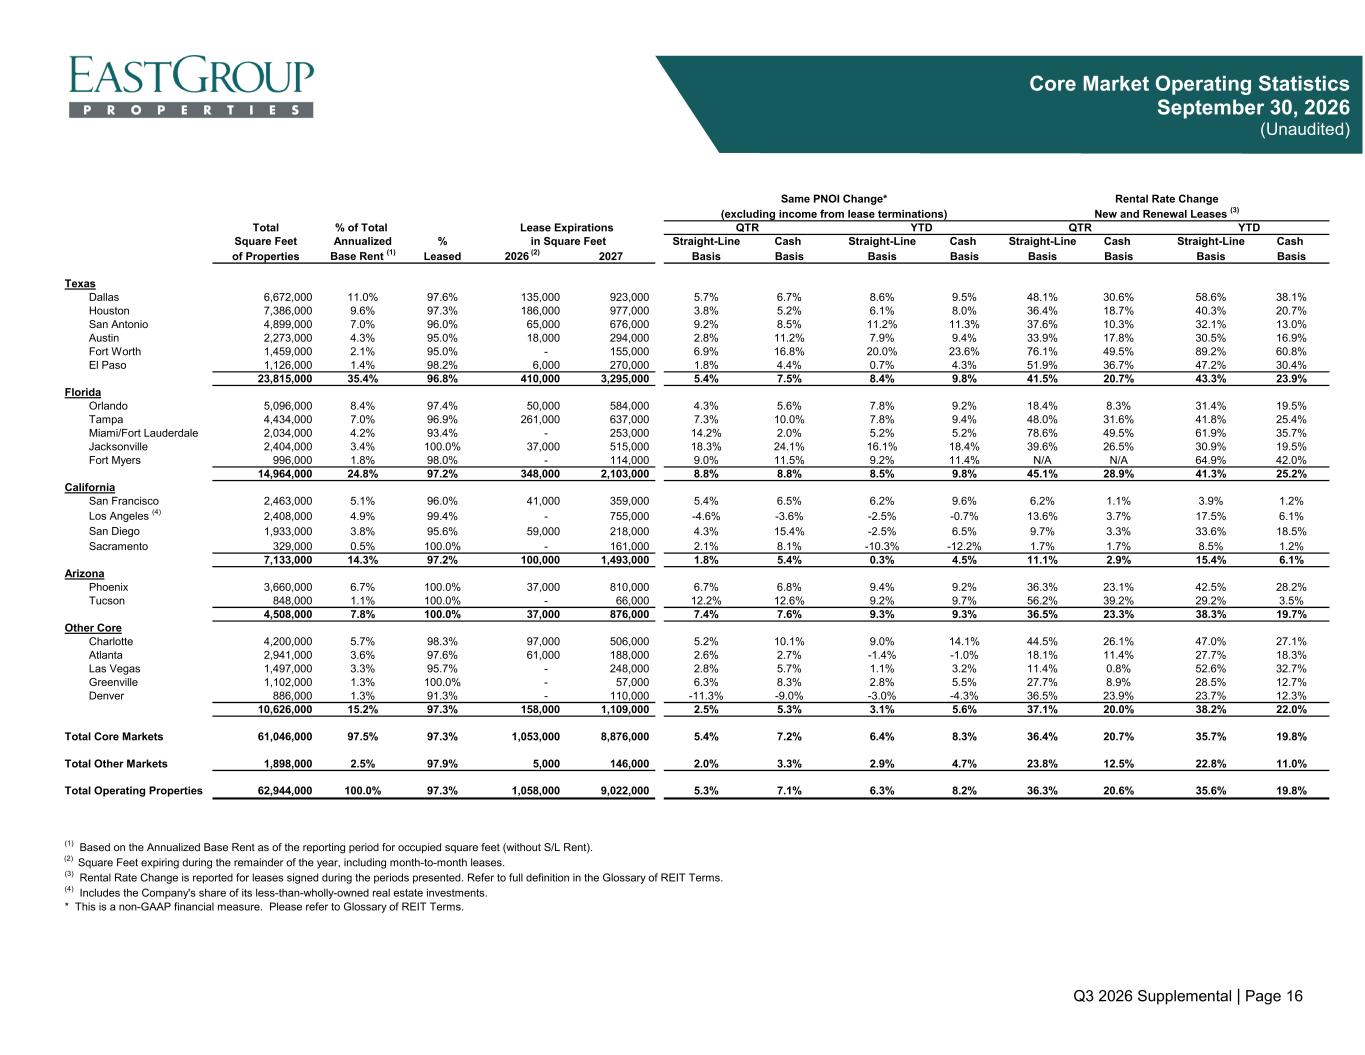
Q3 2026 Supplemental | Page 16 Core Market Operating Statistics September 30, 2026 (Unaudited) Total % of Total Square Feet Annualized % Straight-Line Cash Straight-Line Cash Straight-Line Cash Straight-Line Cash of Properties Base Rent (1) Leased 2026 (2) 2027 Basis Basis Basis Basis Basis Basis Basis Basis Texas Dallas 6,672,000 11.0% 97.6% 135,000 923,000 5.7% 6.7% 8.6% 9.5% 48.1% 30.6% 58.6% 38.1% Houston 7,386,000 9.6% 97.3% 186,000 977,000 3.8% 5.2% 6.1% 8.0% 36.4% 18.7% 40.3% 20.7% San Antonio 4,899,000 7.0% 96.0% 65,000 676,000 9.2% 8.5% 11.2% 11.3% 37.6% 10.3% 32.1% 13.0% Austin 2,273,000 4.3% 95.0% 18,000 294,000 2.8% 11.2% 7.9% 9.4% 33.9% 17.8% 30.5% 16.9% Fort Worth 1,459,000 2.1% 95.0% - 155,000 6.9% 16.8% 20.0% 23.6% 76.1% 49.5% 89.2% 60.8% El Paso 1,126,000 1.4% 98.2% 6,000 270,000 1.8% 4.4% 0.7% 4.3% 51.9% 36.7% 47.2% 30.4% 23,815,000 35.4% 96.8% 410,000 3,295,000 5.4% 7.5% 8.4% 9.8% 41.5% 20.7% 43.3% 23.9% Florida Orlando 5,096,000 8.4% 97.4% 50,000 584,000 4.3% 5.6% 7.8% 9.2% 18.4% 8.3% 31.4% 19.5% Tampa 4,434,000 7.0% 96.9% 261,000 637,000 7.3% 10.0% 7.8% 9.4% 48.0% 31.6% 41.8% 25.4% Miami/Fort Lauderdale 2,034,000 4.2% 93.4% - 253,000 14.2% 2.0% 5.2% 5.2% 78.6% 49.5% 61.9% 35.7% Jacksonville 2,404,000 3.4% 100.0% 37,000 515,000 18.3% 24.1% 16.1% 18.4% 39.6% 26.5% 30.9% 19.5% Fort Myers 996,000 1.8% 98.0% - 114,000 9.0% 11.5% 9.2% 11.4% N/A N/A 64.9% 42.0% 14,964,000 24.8% 97.2% 348,000 2,103,000 8.8% 8.8% 8.5% 9.8% 45.1% 28.9% 41.3% 25.2% California San Francisco 2,463,000 5.1% 96.0% 41,000 359,000 5.4% 6.5% 6.2% 9.6% 6.2% 1.1% 3.9% 1.2% Los Angeles (4) 2,408,000 4.9% 99.4% - 755,000 -4.6% -3.6% -2.5% -0.7% 13.6% 3.7% 17.5% 6.1% San Diego 1,933,000 3.8% 95.6% 59,000 218,000 4.3% 15.4% -2.5% 6.5% 9.7% 3.3% 33.6% 18.5% Sacramento 329,000 0.5% 100.0% - 161,000 2.1% 8.1% -10.3% -12.2% 1.7% 1.7% 8.5% 1.2% 7,133,000 14.3% 97.2% 100,000 1,493,000 1.8% 5.4% 0.3% 4.5% 11.1% 2.9% 15.4% 6.1% Arizona Phoenix 3,660,000 6.7% 100.0% 37,000 810,000 6.7% 6.8% 9.4% 9.2% 36.3% 23.1% 42.5% 28.2% Tucson 848,000 1.1% 100.0% - 66,000 12.2% 12.6% 9.2% 9.7% 56.2% 39.2% 29.2% 3.5% 4,508,000 7.8% 100.0% 37,000 876,000 7.4% 7.6% 9.3% 9.3% 36.5% 23.3% 38.3% 19.7% Other Core Charlotte 4,200,000 5.7% 98.3% 97,000 506,000 5.2% 10.1% 9.0% 14.1% 44.5% 26.1% 47.0% 27.1% Atlanta 2,941,000 3.6% 97.6% 61,000 188,000 2.6% 2.7% -1.4% -1.0% 18.1% 11.4% 27.7% 18.3% Las Vegas 1,497,000 3.3% 95.7% - 248,000 2.8% 5.7% 1.1% 3.2% 11.4% 0.8% 52.6% 32.7% Greenville 1,102,000 1.3% 100.0% - 57,000 6.3% 8.3% 2.8% 5.5% 27.7% 8.9% 28.5% 12.7% Denver 886,000 1.3% 91.3% - 110,000 -11.3% -9.0% -3.0% -4.3% 36.5% 23.9% 23.7% 12.3% 10,626,000 15.2% 97.3% 158,000 1,109,000 2.5% 5.3% 3.1% 5.6% 37.1% 20.0% 38.2% 22.0% Total Core Markets 61,046,000 97.5% 97.3% 1,053,000 8,876,000 5.4% 7.2% 6.4% 8.3% 36.4% 20.7% 35.7% 19.8% Total Other Markets 1,898,000 2.5% 97.9% 5,000 146,000 2.0% 3.3% 2.9% 4.7% 23.8% 12.5% 22.8% 11.0% Total Operating Properties 62,944,000 100.0% 97.3% 1,058,000 9,022,000 5.3% 7.1% 6.3% 8.2% 36.3% 20.6% 35.6% 19.8% (1) Based on the Annualized Base Rent as of the reporting period for occupied square feet (without S/L Rent). (2) Square Feet expiring during the remainder of the year, including month-to-month leases. (3) Rental Rate Change is reported for leases signed during the periods presented. Refer to full definition in the Glossary of REIT Terms. (4) Includes the Company's share of its less-than-wholly-owned real estate investments. * This is a non-GAAP financial measure. Please refer to Glossary of REIT Terms. in Square Feet Same PNOI Change* Rental Rate Change (excluding income from lease terminations) New and Renewal Leases (3) Lease Expirations QTR YTD QTR YTD
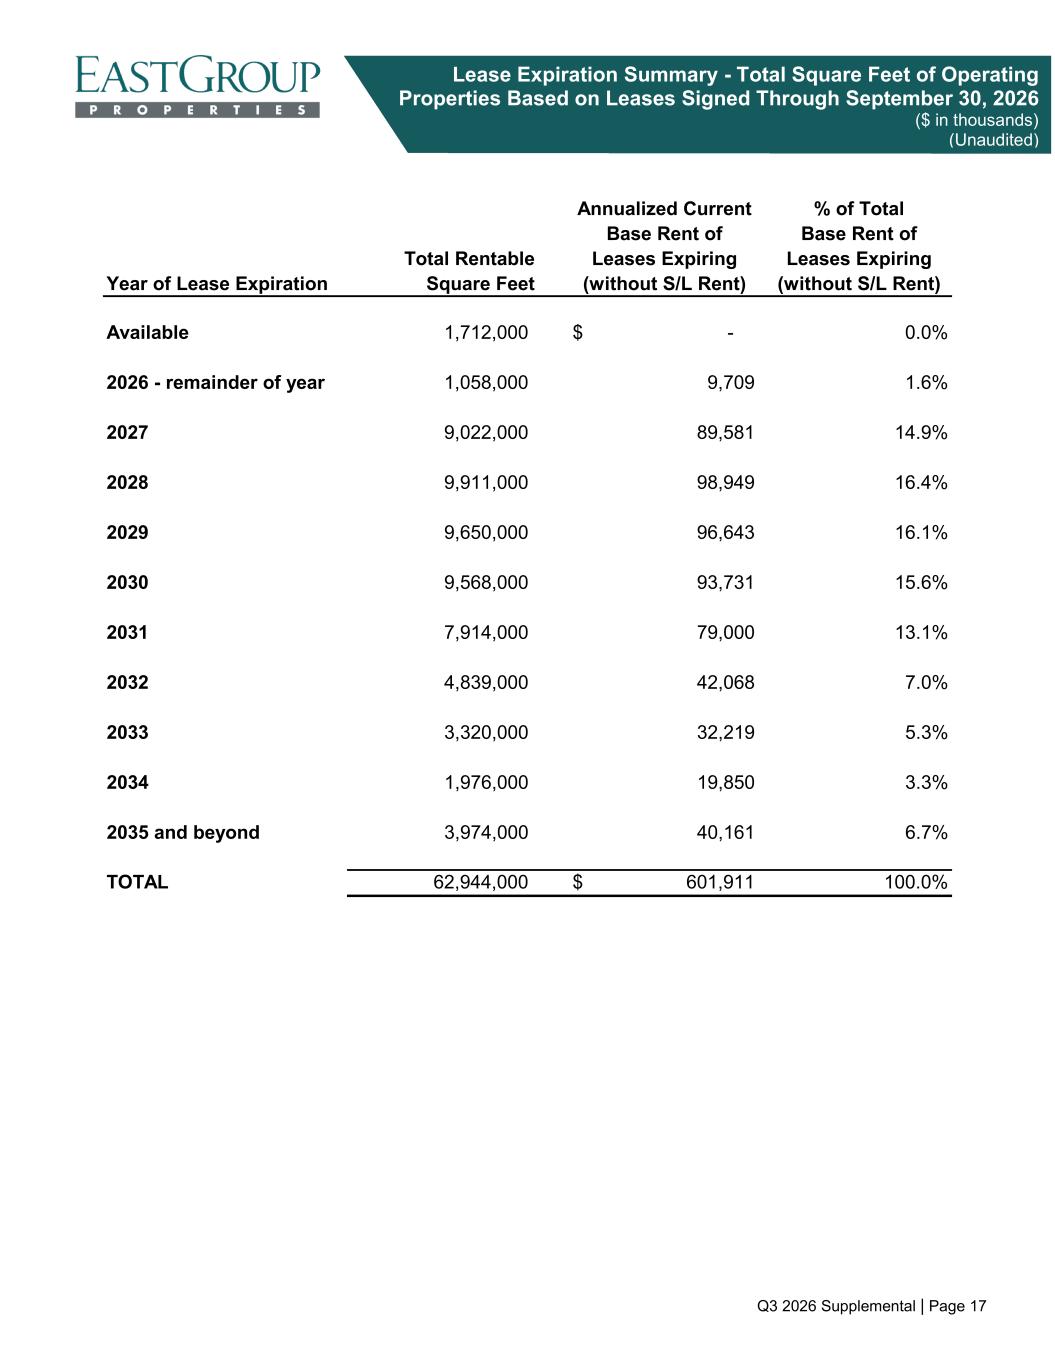
Q3 2026 Supplemental | Page 17 Lease Expiration Summary - Total Square Feet of Operating Properties Based on Leases Signed Through September 30, 2026 ($ in thousands) (Unaudited) Annualized Current % of Total Base Rent of Base Rent of Total Rentable Leases Expiring Leases Expiring Year of Lease Expiration Square Feet (without S/L Rent) (without S/L Rent) Available 1,712,000 -$ 0.0% 2026 - remainder of year 1,058,000 9,709 1.6% 2027 9,022,000 89,581 14.9% 2028 9,911,000 98,949 16.4% 2029 9,650,000 96,643 16.1% 2030 9,568,000 93,731 15.6% 2031 7,914,000 79,000 13.1% 2032 4,839,000 42,068 7.0% 2033 3,320,000 32,219 5.3% 2034 1,976,000 19,850 3.3% 2035 and beyond 3,974,000 40,161 6.7% TOTAL 62,944,000 601,911$ 100.0%
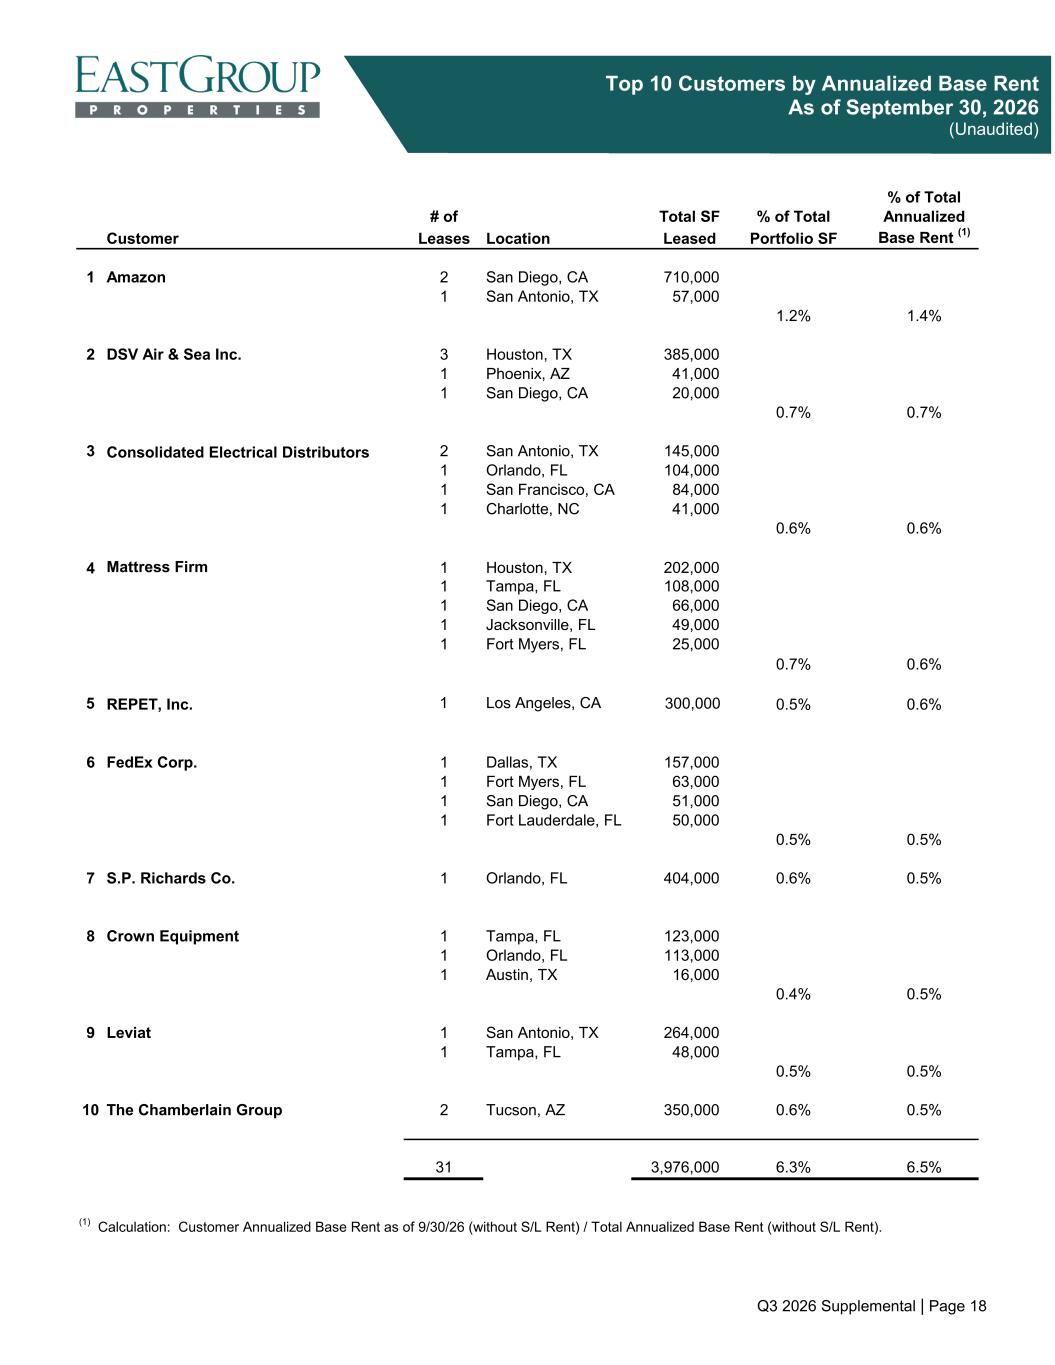
Q3 2026 Supplemental | Page 18 Top 10 Customers by Annualized Base Rent As of September 30, 2026 (Unaudited) % of Total # of % of Total Annualized Customer Leases Location Portfolio SF Base Rent (1) 1 Amazon 2 San Diego, CA 710,000 1 San Antonio, TX 57,000 1.2% 1.4% 2 DSV Air & Sea Inc. 3 Houston, TX 385,000 1 Phoenix, AZ 41,000 1 San Diego, CA 20,000 0.7% 0.7% 3 Consolidated Electrical Distributors 2 San Antonio, TX 145,000 1 Orlando, FL 104,000 1 San Francisco, CA 84,000 1 Charlotte, NC 41,000 0.6% 0.6% 4 Mattress Firm 1 Houston, TX 202,000 1 Tampa, FL 108,000 1 San Diego, CA 66,000 1 Jacksonville, FL 49,000 1 Fort Myers, FL 25,000 0.7% 0.6% 5 REPET, Inc. 1 Los Angeles, CA 300,000 0.5% 0.6% 6 FedEx Corp. 1 Dallas, TX 157,000 1 Fort Myers, FL 63,000 1 San Diego, CA 51,000 1 Fort Lauderdale, FL 50,000 0.5% 0.5% 7 S.P. Richards Co. 1 Orlando, FL 404,000 0.6% 0.5% 8 Crown Equipment 1 Tampa, FL 123,000 1 Orlando, FL 113,000 1 Austin, TX 16,000 0.4% 0.5% 9 Leviat 1 San Antonio, TX 264,000 1 Tampa, FL 48,000 0.5% 0.5% 10 The Chamberlain Group 2 Tucson, AZ 350,000 0.6% 0.5% 31 3,976,000 6.3% 6.5% (1) Calculation: Customer Annualized Base Rent as of 9/30/26 (without S/L Rent) / Total Annualized Base Rent (without S/L Rent). Leased Total SF
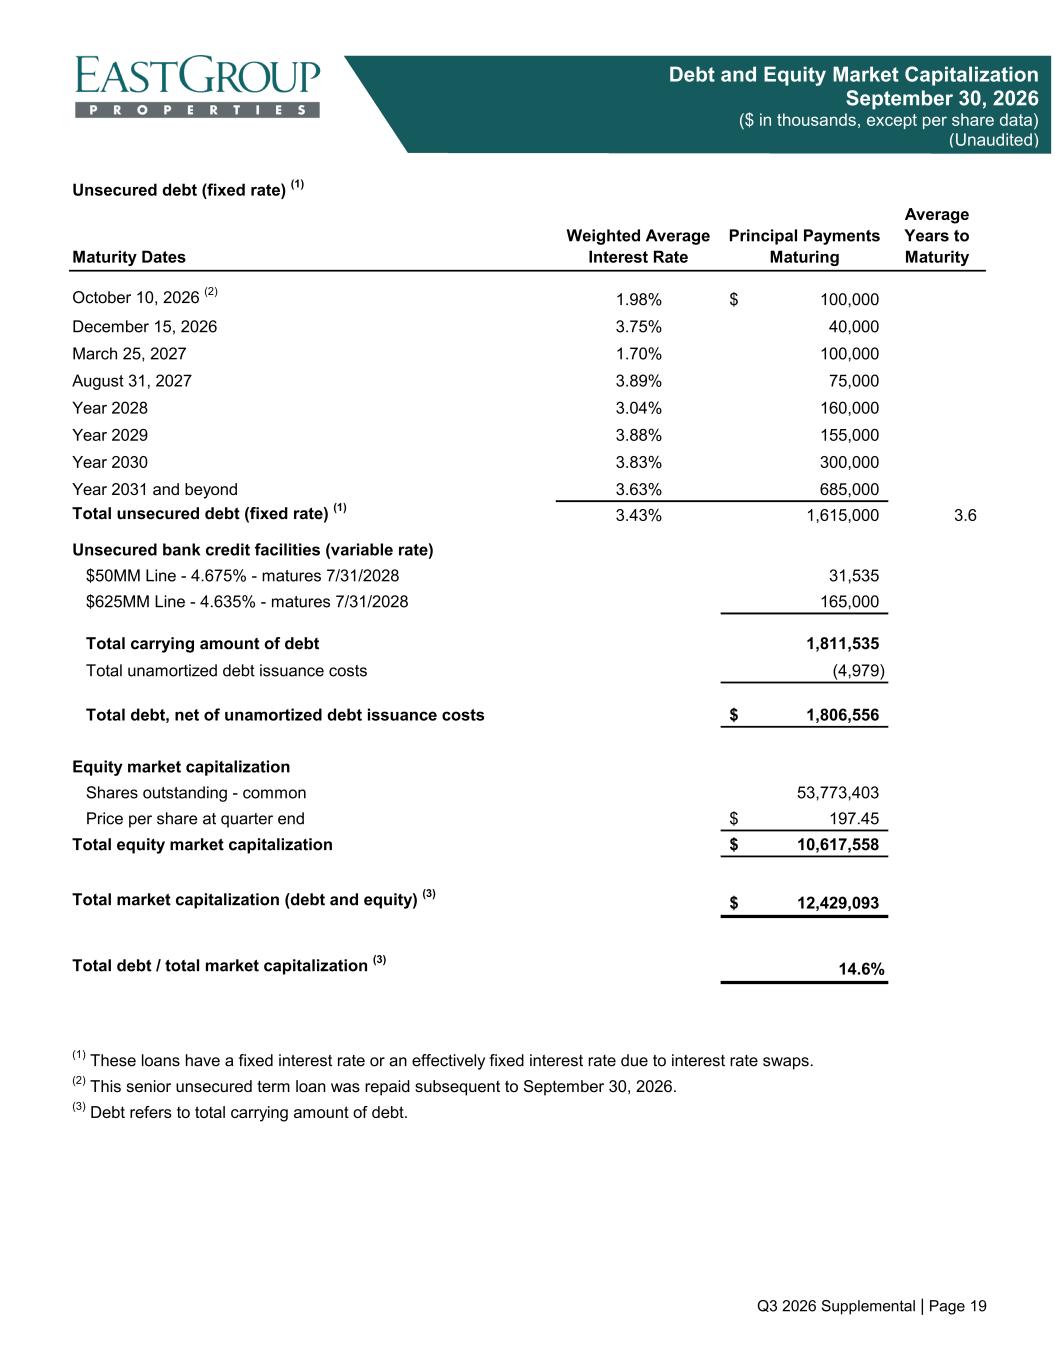
Q3 2026 Supplemental | Page 19 Debt and Equity Market Capitalization September 30, 2026 ($ in thousands, except per share data) (Unaudited) Unsecured debt (fixed rate) (1) Maturity Dates Weighted Average Interest Rate Principal Payments Maturing Average Years to Maturity October 10, 2026 (2) 1.98% 100,000$ December 15, 2026 3.75% 40,000 March 25, 2027 1.70% 100,000 August 31, 2027 3.89% 75,000 Year 2028 3.04% 160,000 Year 2029 3.88% 155,000 Year 2030 3.83% 300,000 Year 2031 and beyond 3.63% 685,000 Total unsecured debt (fixed rate) (1) 3.43% 1,615,000 3.6 Unsecured bank credit facilities (variable rate) $50MM Line - 4.675% - matures 7/31/2028 31,535 $625MM Line - 4.635% - matures 7/31/2028 165,000 Total carrying amount of debt 1,811,535 Total unamortized debt issuance costs (4,979) Total debt, net of unamortized debt issuance costs 1,806,556$ Equity market capitalization Shares outstanding - common 53,773,403 Price per share at quarter end 197.45$ Total equity market capitalization 10,617,558$ Total market capitalization (debt and equity) (3) 12,429,093$ Total debt / total market capitalization (3) 14.6% (1) These loans have a fixed interest rate or an effectively fixed interest rate due to interest rate swaps. (2) This senior unsecured term loan was repaid subsequent to September 30, 2026. (3) Debt refers to total carrying amount of debt.
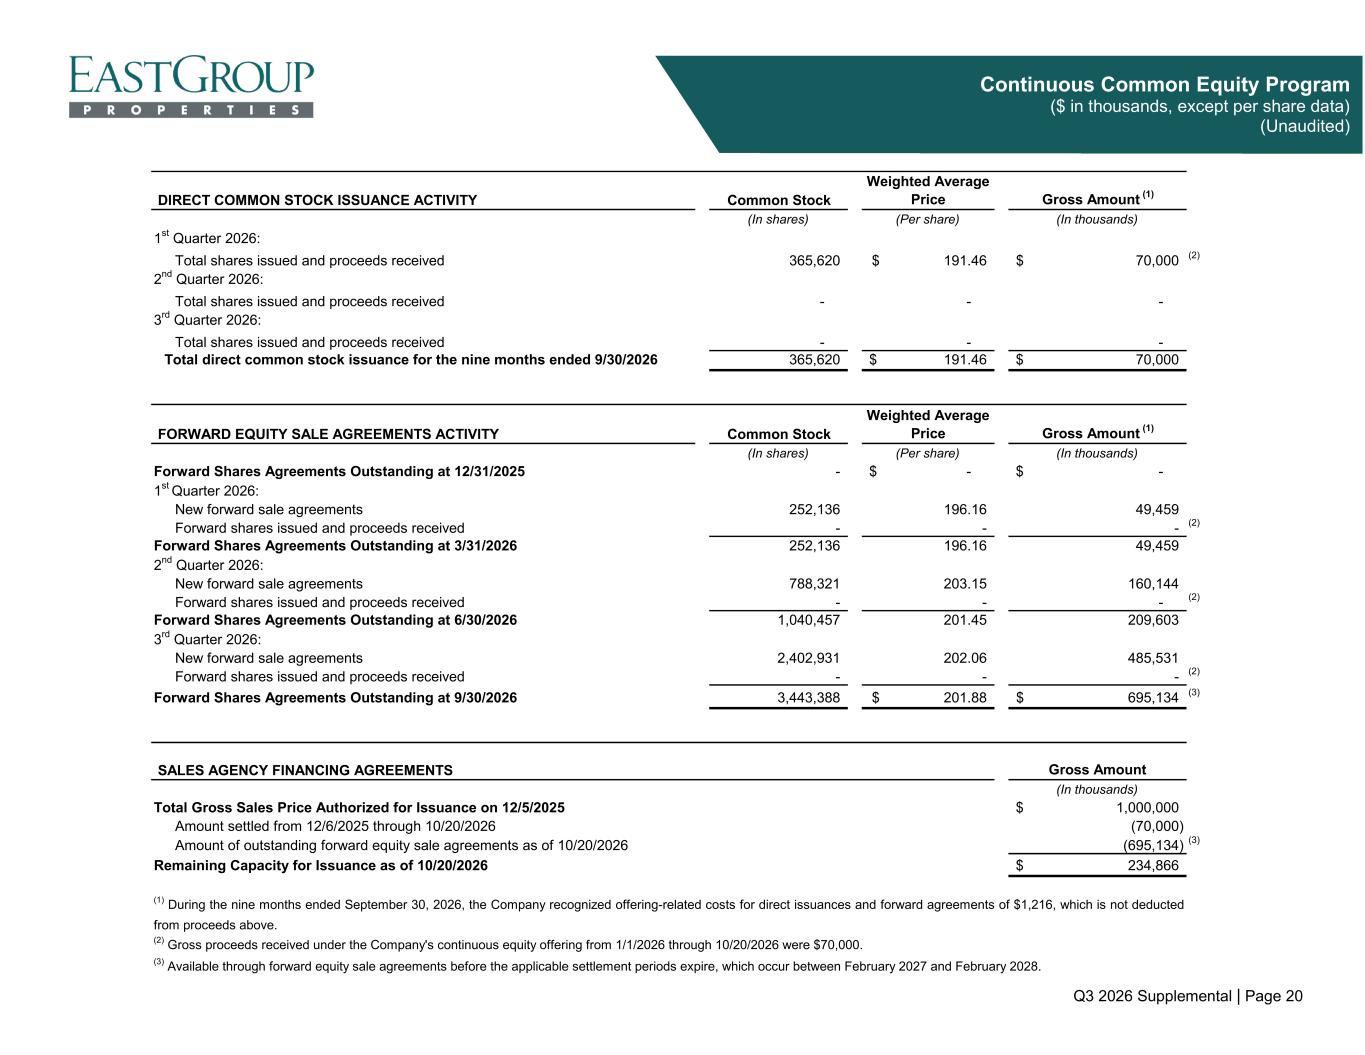
Q3 2026 Supplemental | Page 20 Continuous Common Equity Program ($ in thousands, except per share data) (Unaudited) Common Stock Weighted Average Price Gross Amount (1) (In shares) (Per share) (In thousands) 1st Quarter 2026: Total shares issued and proceeds received 365,620 191.46$ 70,000$ (2) 2nd Quarter 2026: Total shares issued and proceeds received - - - 3rd Quarter 2026: Total shares issued and proceeds received - - - Total direct common stock issuance for the nine months ended 9/30/2026 365,620 191.46$ 70,000$ Common Stock Weighted Average Price Gross Amount (1) (In shares) (Per share) (In thousands) Forward Shares Agreements Outstanding at 12/31/2025 - -$ -$ 1st Quarter 2026: New forward sale agreements 252,136 196.16 49,459 Forward shares issued and proceeds received - - - (2) Forward Shares Agreements Outstanding at 3/31/2026 252,136 196.16 49,459 2nd Quarter 2026: New forward sale agreements 788,321 203.15 160,144 Forward shares issued and proceeds received - - - (2) Forward Shares Agreements Outstanding at 6/30/2026 1,040,457 201.45 209,603 3rd Quarter 2026: New forward sale agreements 2,402,931 202.06 485,531 Forward shares issued and proceeds received - - - (2) Forward Shares Agreements Outstanding at 9/30/2026 3,443,388 201.88$ 695,134$ (3) Gross Amount (In thousands) Total Gross Sales Price Authorized for Issuance on 12/5/2025 1,000,000$ Amount settled from 12/6/2025 through 10/20/2026 (70,000) Amount of outstanding forward equity sale agreements as of 10/20/2026 (695,134) (3) Remaining Capacity for Issuance as of 10/20/2026 234,866$ DIRECT COMMON STOCK ISSUANCE ACTIVITY (3) Available through forward equity sale agreements before the applicable settlement periods expire, which occur between February 2027 and February 2028. FORWARD EQUITY SALE AGREEMENTS ACTIVITY (2) Gross proceeds received under the Company's continuous equity offering from 1/1/2026 through 10/20/2026 were $70,000. (1) During the nine months ended September 30, 2026, the Company recognized offering-related costs for direct issuances and forward agreements of $1,216, which is not deducted from proceeds above. SALES AGENCY FINANCING AGREEMENTS
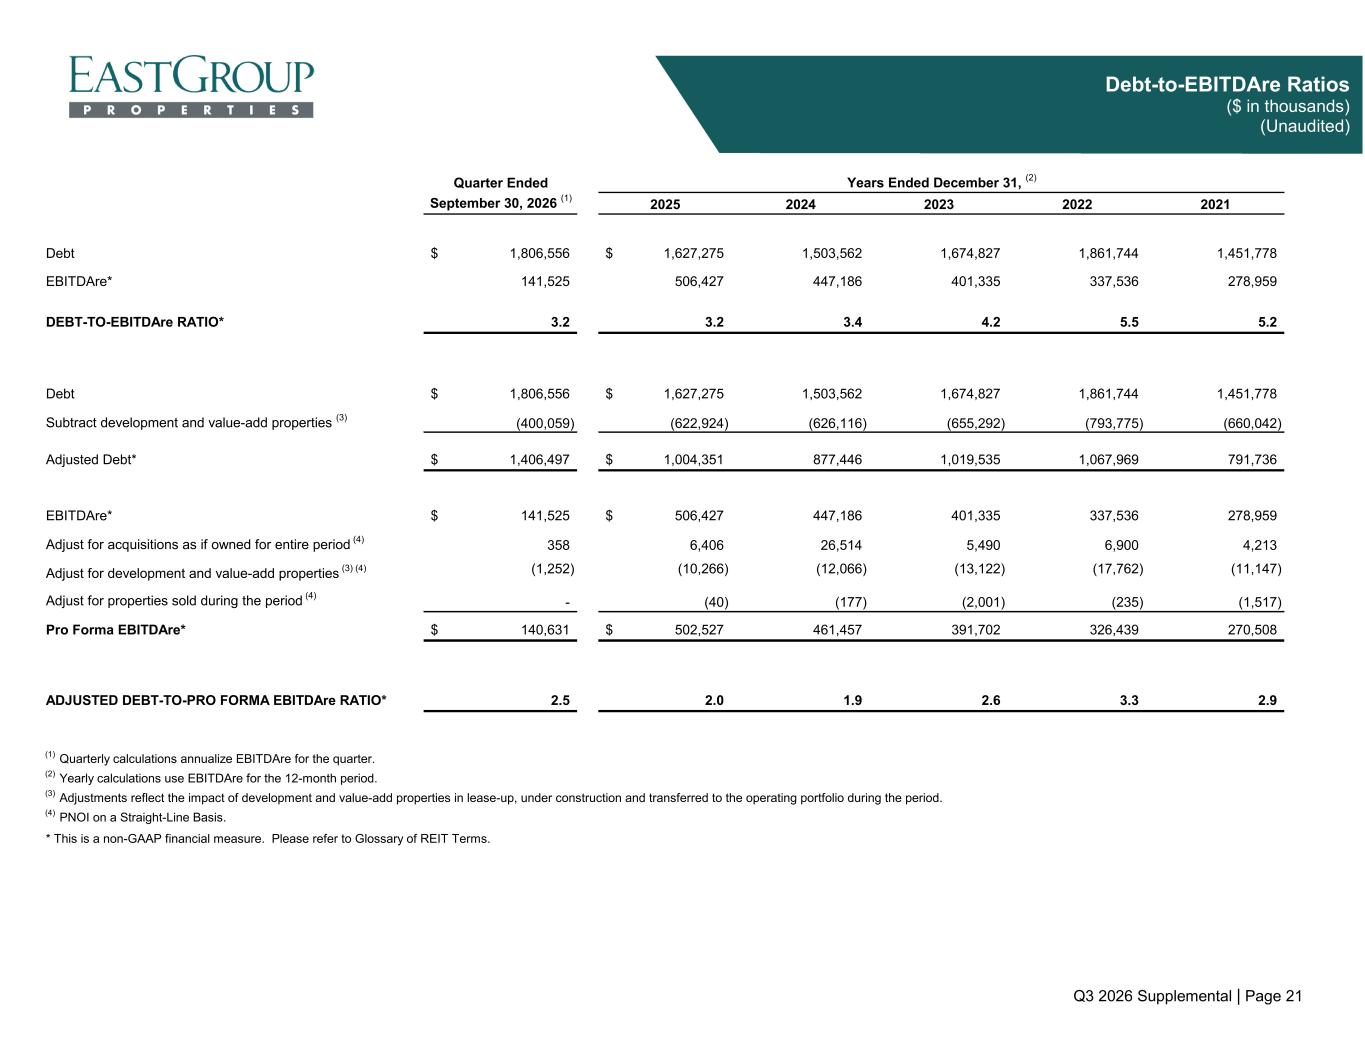
Q3 2026 Supplemental | Page 21 Debt-to-EBITDAre Ratios ($ in thousands) (Unaudited) Quarter Ended September 30, 2026 (1) 2025 2024 2023 2022 2021 Debt 1,806,556$ 1,627,275$ 1,503,562 1,674,827 1,861,744 1,451,778 EBITDAre* 141,525 506,427 447,186 401,335 337,536 278,959 DEBT-TO-EBITDAre RATIO* 3.2 3.2 3.4 4.2 5.5 5.2 Debt 1,806,556$ 1,627,275$ 1,503,562 1,674,827 1,861,744 1,451,778 Subtract development and value-add properties (3) (400,059) (622,924) (626,116) (655,292) (793,775) (660,042) Adjusted Debt* 1,406,497$ 1,004,351$ 877,446 1,019,535 1,067,969 791,736 EBITDAre* 141,525$ 506,427$ 447,186 401,335 337,536 278,959 Adjust for acquisitions as if owned for entire period (4) 358 6,406 26,514 5,490 6,900 4,213 Adjust for development and value-add properties (3) (4) (1,252) (10,266) (12,066) (13,122) (17,762) (11,147) Adjust for properties sold during the period (4) - (40) (177) (2,001) (235) (1,517) Pro Forma EBITDAre* 140,631$ 502,527$ 461,457 391,702 326,439 270,508 ADJUSTED DEBT-TO-PRO FORMA EBITDAre RATIO* 2.5 2.0 1.9 2.6 3.3 2.9 (1) Quarterly calculations annualize EBITDAre for the quarter. (2) Yearly calculations use EBITDAre for the 12-month period. (3) Adjustments reflect the impact of development and value-add properties in lease-up, under construction and transferred to the operating portfolio during the period. (4) PNOI on a Straight-Line Basis. * This is a non-GAAP financial measure. Please refer to Glossary of REIT Terms. Years Ended December 31, (2)
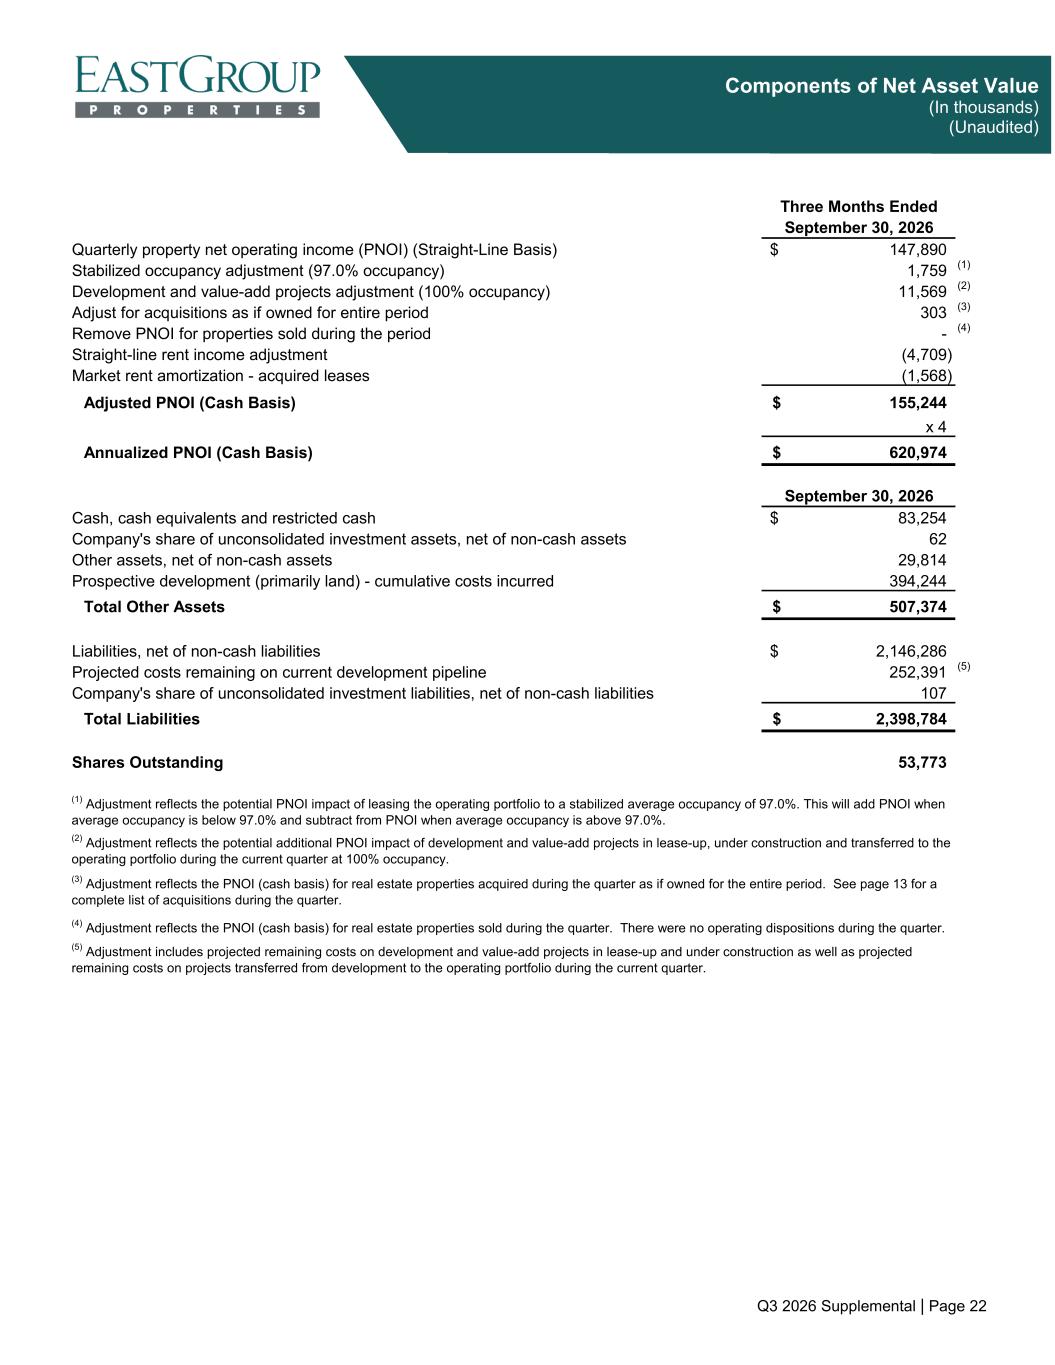
Q3 2026 Supplemental | Page 22 Components of Net Asset Value (In thousands) (Unaudited) Three Months Ended September 30, 2026 Quarterly property net operating income (PNOI) (Straight-Line Basis) 147,890$ Stabilized occupancy adjustment (97.0% occupancy) 1,759 (1) Development and value-add projects adjustment (100% occupancy) 11,569 (2) Adjust for acquisitions as if owned for entire period 303 (3) Remove PNOI for properties sold during the period - (4) Straight-line rent income adjustment (4,709) Market rent amortization - acquired leases (1,568) Adjusted PNOI (Cash Basis) 155,244$ x 4 Annualized PNOI (Cash Basis) 620,974$ September 30, 2026 Cash, cash equivalents and restricted cash 83,254$ Company's share of unconsolidated investment assets, net of non-cash assets 62 Other assets, net of non-cash assets 29,814 Prospective development (primarily land) - cumulative costs incurred 394,244 Total Other Assets 507,374$ Liabilities, net of non-cash liabilities 2,146,286$ Projected costs remaining on current development pipeline 252,391 (5) Company's share of unconsolidated investment liabilities, net of non-cash liabilities 107 Total Liabilities 2,398,784$ Shares Outstanding 53,773 (1) Adjustment reflects the potential PNOI impact of leasing the operating portfolio to a stabilized average occupancy of 97.0%. This will add PNOI when average occupancy is below 97.0% and subtract from PNOI when average occupancy is above 97.0%. (2) Adjustment reflects the potential additional PNOI impact of development and value-add projects in lease-up, under construction and transferred to the operating portfolio during the current quarter at 100% occupancy. (5) Adjustment includes projected remaining costs on development and value-add projects in lease-up and under construction as well as projected remaining costs on projects transferred from development to the operating portfolio during the current quarter. (3) Adjustment reflects the PNOI (cash basis) for real estate properties acquired during the quarter as if owned for the entire period. See page 13 for a complete list of acquisitions during the quarter. (4) Adjustment reflects the PNOI (cash basis) for real estate properties sold during the quarter. There were no operating dispositions during the quarter.
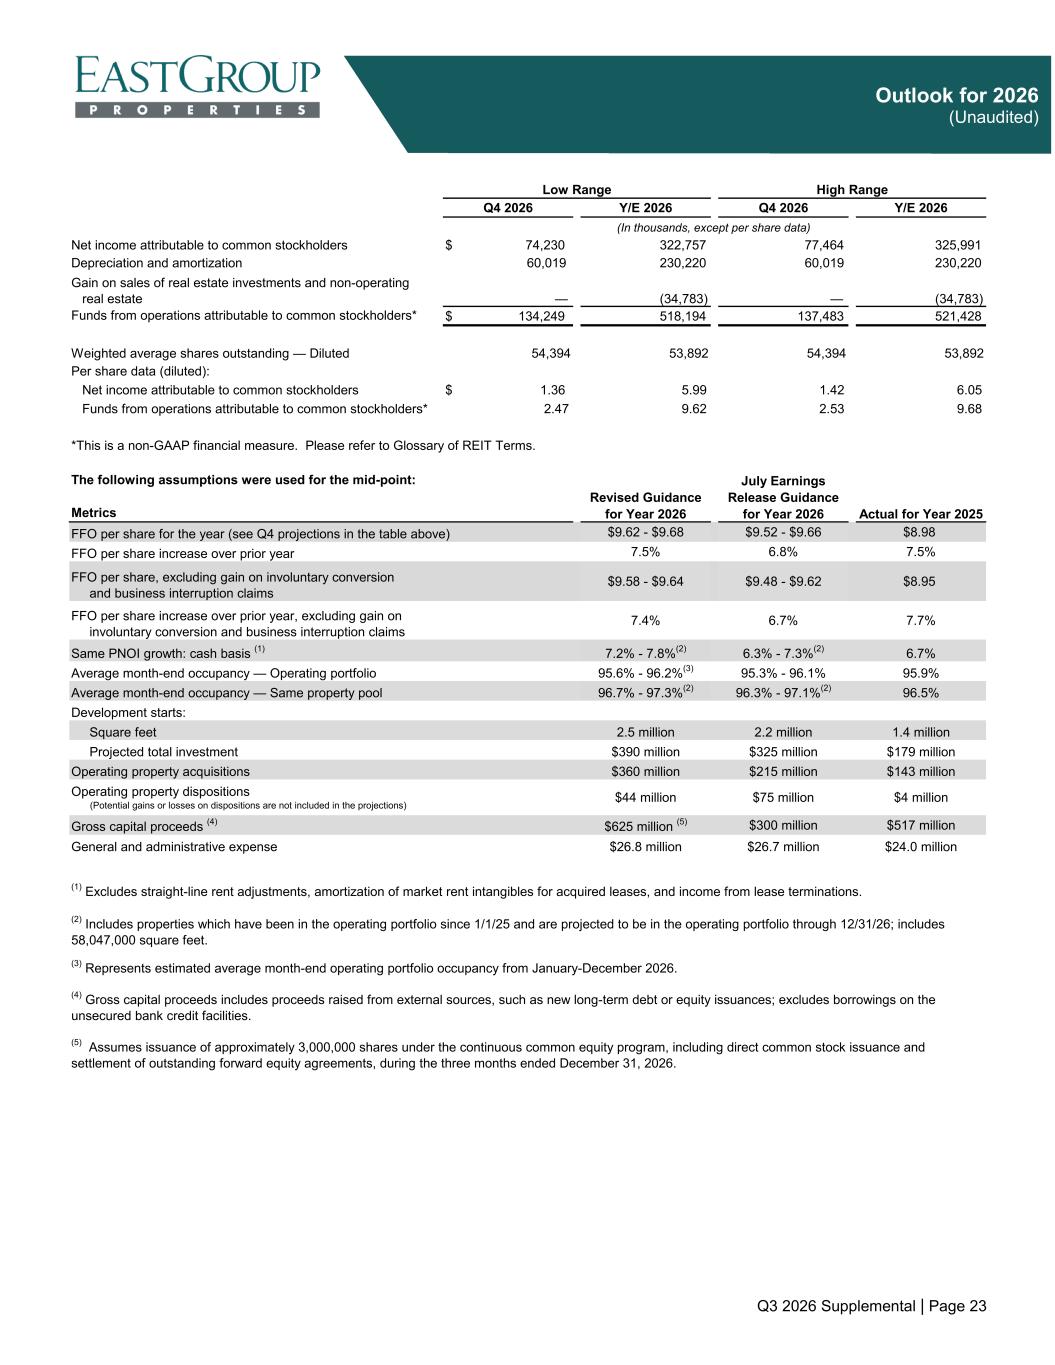
Q3 2026 Supplemental | Page 23 Outlook for 2026 (Unaudited) Q4 2026 Y/E 2026 Q4 2026 Y/E 2026 Net income attributable to common stockholders $ 74,230 322,757 77,464 325,991 Depreciation and amortization 60,019 230,220 60,019 230,220 Gain on sales of real estate investments and non-operating real estate — (34,783) — (34,783) Funds from operations attributable to common stockholders* $ 134,249 518,194 137,483 521,428 Weighted average shares outstanding — Diluted 54,394 53,892 54,394 53,892 Per share data (diluted): Net income attributable to common stockholders $ 1.36 5.99 1.42 6.05 Funds from operations attributable to common stockholders* 2.47 9.62 2.53 9.68 Metrics FFO per share for the year (see Q4 projections in the table above) $9.62 - $9.68 $9.52 - $9.66 $8.98 FFO per share increase over prior year 7.5% 6.8% 7.5% FFO per share, excluding gain on involuntary conversion and business interruption claims $9.58 - $9.64 $9.48 - $9.62 $8.95 FFO per share increase over prior year, excluding gain on involuntary conversion and business interruption claims 7.4% 6.7% 7.7% Same PNOI growth: cash basis (1) 7.2% - 7.8%(2) 6.3% - 7.3%(2) 6.7% Average month-end occupancy — Operating portfolio 95.6% - 96.2%(3) 95.3% - 96.1% 95.9% Average month-end occupancy — Same property pool 96.7% - 97.3%(2) 96.3% - 97.1%(2) 96.5% Development starts: Square feet 2.5 million 2.2 million 1.4 million Projected total investment $390 million $325 million $179 million Operating property acquisitions $360 million $215 million $143 million Operating property dispositions (Potential gains or losses on dispositions are not included in the projections) $44 million $75 million $4 million Gross capital proceeds (4) $625 million (5) $300 million $517 million General and administrative expense $26.8 million $26.7 million $24.0 million (5) Assumes issuance of approximately 3,000,000 shares under the continuous common equity program, including direct common stock issuance and settlement of outstanding forward equity agreements, during the three months ended December 31, 2026. (1) Excludes straight-line rent adjustments, amortization of market rent intangibles for acquired leases, and income from lease terminations. (2) Includes properties which have been in the operating portfolio since 1/1/25 and are projected to be in the operating portfolio through 12/31/26; includes 58,047,000 square feet. (3) Represents estimated average month-end operating portfolio occupancy from January-December 2026. (4) Gross capital proceeds includes proceeds raised from external sources, such as new long-term debt or equity issuances; excludes borrowings on the unsecured bank credit facilities. Low Range High Range (In thousands, except per share data) *This is a non-GAAP financial measure. Please refer to Glossary of REIT Terms. Revised Guidance for Year 2026 July Earnings Release Guidance for Year 2026 Actual for Year 2025 The following assumptions were used for the mid-point:
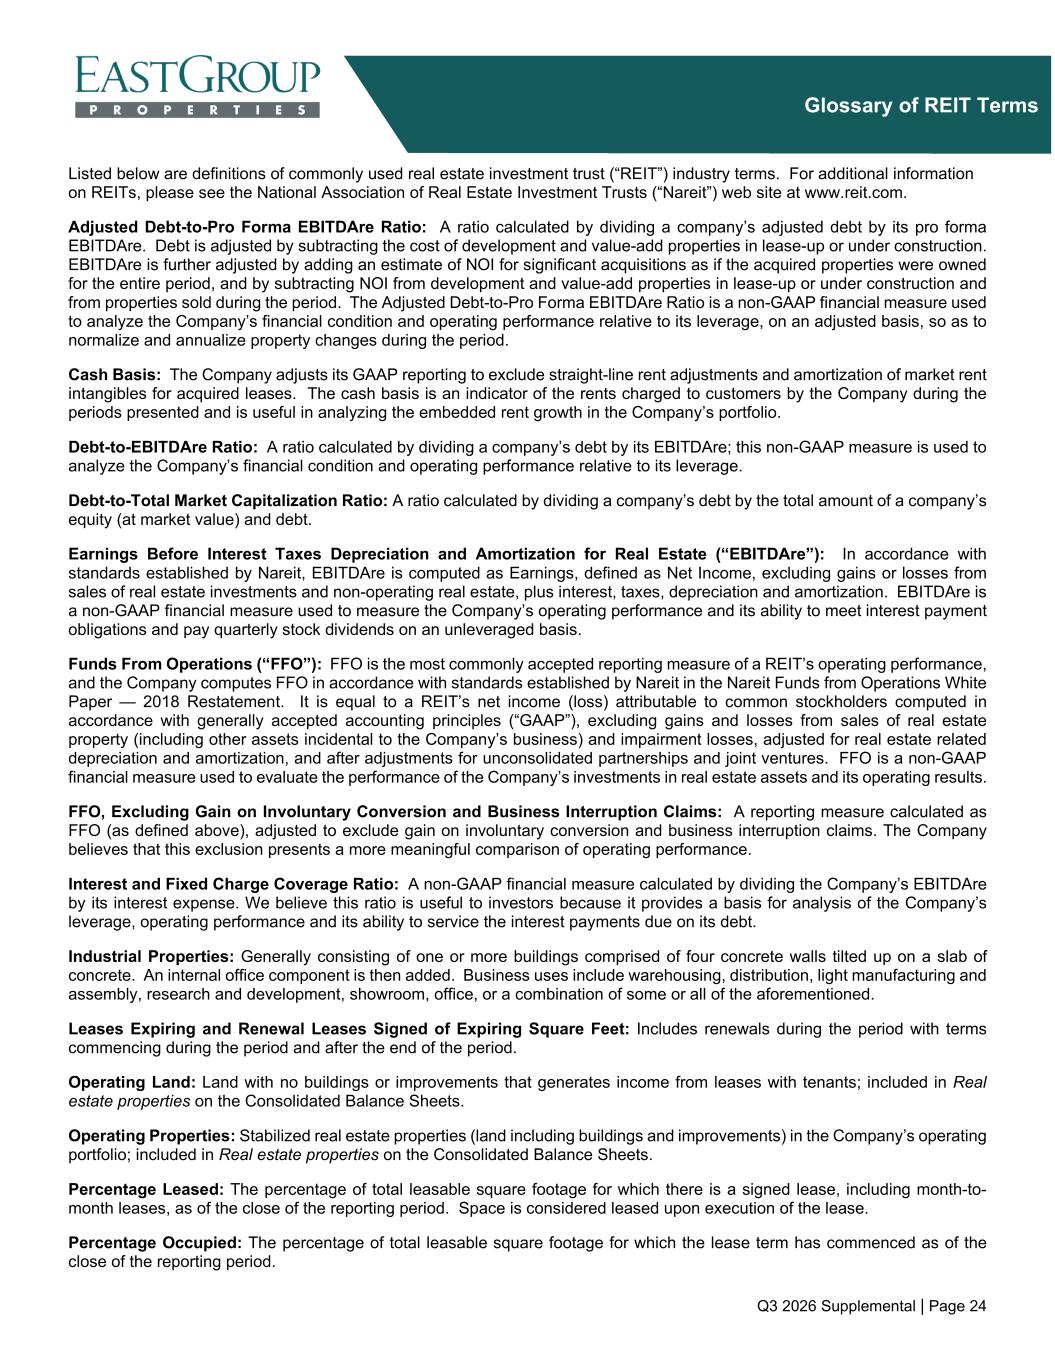
Q3 2026 Supplemental | Page 24 Glossary of REIT Terms Listed below are definitions of commonly used real estate investment trust (“REIT”) industry terms. For additional information on REITs, please see the National Association of Real Estate Investment Trusts (“Nareit”) web site at www.reit.com. Adjusted Debt-to-Pro Forma EBITDAre Ratio: A ratio calculated by dividing a company’s adjusted debt by its pro forma EBITDAre. Debt is adjusted by subtracting the cost of development and value-add properties in lease-up or under construction. EBITDAre is further adjusted by adding an estimate of NOI for significant acquisitions as if the acquired properties were owned for the entire period, and by subtracting NOI from development and value-add properties in lease-up or under construction and from properties sold during the period. The Adjusted Debt-to-Pro Forma EBITDAre Ratio is a non-GAAP financial measure used to analyze the Company’s financial condition and operating performance relative to its leverage, on an adjusted basis, so as to normalize and annualize property changes during the period. Cash Basis: The Company adjusts its GAAP reporting to exclude straight-line rent adjustments and amortization of market rent intangibles for acquired leases. The cash basis is an indicator of the rents charged to customers by the Company during the periods presented and is useful in analyzing the embedded rent growth in the Company’s portfolio. Debt-to-EBITDAre Ratio: A ratio calculated by dividing a company’s debt by its EBITDAre; this non-GAAP measure is used to analyze the Company’s financial condition and operating performance relative to its leverage. Debt-to-Total Market Capitalization Ratio: A ratio calculated by dividing a company’s debt by the total amount of a company’s equity (at market value) and debt. Earnings Before Interest Taxes Depreciation and Amortization for Real Estate (“EBITDAre”): In accordance with standards established by Nareit, EBITDAre is computed as Earnings, defined as Net Income, excluding gains or losses from sales of real estate investments and non-operating real estate, plus interest, taxes, depreciation and amortization. EBITDAre is a non-GAAP financial measure used to measure the Company’s operating performance and its ability to meet interest payment obligations and pay quarterly stock dividends on an unleveraged basis. Funds From Operations (“FFO”): FFO is the most commonly accepted reporting measure of a REIT’s operating performance, and the Company computes FFO in accordance with standards established by Nareit in the Nareit Funds from Operations White Paper — 2018 Restatement. It is equal to a REIT’s net income (loss) attributable to common stockholders computed in accordance with generally accepted accounting principles (“GAAP”), excluding gains and losses from sales of real estate property (including other assets incidental to the Company’s business) and impairment losses, adjusted for real estate related depreciation and amortization, and after adjustments for unconsolidated partnerships and joint ventures. FFO is a non-GAAP financial measure used to evaluate the performance of the Company’s investments in real estate assets and its operating results. FFO, Excluding Gain on Involuntary Conversion and Business Interruption Claims: A reporting measure calculated as FFO (as defined above), adjusted to exclude gain on involuntary conversion and business interruption claims. The Company believes that this exclusion presents a more meaningful comparison of operating performance. Interest and Fixed Charge Coverage Ratio: A non-GAAP financial measure calculated by dividing the Company’s EBITDAre by its interest expense. We believe this ratio is useful to investors because it provides a basis for analysis of the Company’s leverage, operating performance and its ability to service the interest payments due on its debt. Industrial Properties: Generally consisting of one or more buildings comprised of four concrete walls tilted up on a slab of concrete. An internal office component is then added. Business uses include warehousing, distribution, light manufacturing and assembly, research and development, showroom, office, or a combination of some or all of the aforementioned. Leases Expiring and Renewal Leases Signed of Expiring Square Feet: Includes renewals during the period with terms commencing during the period and after the end of the period. Operating Land: Land with no buildings or improvements that generates income from leases with tenants; included in Real estate properties on the Consolidated Balance Sheets. Operating Properties: Stabilized real estate properties (land including buildings and improvements) in the Company’s operating portfolio; included in Real estate properties on the Consolidated Balance Sheets. Percentage Leased: The percentage of total leasable square footage for which there is a signed lease, including month-to- month leases, as of the close of the reporting period. Space is considered leased upon execution of the lease. Percentage Occupied: The percentage of total leasable square footage for which the lease term has commenced as of the close of the reporting period.
Q3 2026 Supplemental | Page 25 Glossary of REIT Terms Property Net Operating Income (“PNOI”): Income from real estate operations less Expenses from real estate operations (including market-based internal management fee expense) plus the Company’s share of income and property operating expenses from its less-than-wholly-owned real estate investments. PNOI is a non-GAAP, property-level supplemental measure of performance used to evaluate the performance of the Company’s investments in real estate assets and its operating results. Real Estate Investment Trust (“REIT”): A company that owns and, in most cases, operates income-producing real estate such as apartments, shopping centers, offices, hotels and warehouses. Some REITs also engage in financing real estate. The shares of most REITs are freely traded, usually on a major stock exchange. To qualify as a REIT, a company must distribute at least 90 percent of its taxable income to its stockholders annually. A company that qualifies as a REIT is permitted to deduct dividends paid to its stockholders from its corporate taxable income. As a result, most REITs remit at least 100 percent of their taxable income to their stockholders and therefore owe no corporate federal income tax. Taxes are paid by stockholders on the dividends received. Most states honor this federal treatment and also do not require REITs to pay state income tax. Rental rate changes on new and renewal leases: • Cash Basis - Rental rate changes are calculated as the difference, weighted by square feet, of the annualized base rent due the first month of the new lease’s term and the annualized base rent of the rent due the last month of the former lease’s term, for leases signed during the reporting period. If free rent, discounts, or premiums are in the lease terms, then the first full rent value is used. • Straight-Line Basis - Rental rate changes are calculated as the difference, weighted by square feet, of the average rent over the life of the new lease and the average rent over the life of the former lease, for leases signed during the reporting period. • Rent amounts exclude amortization of market rent intangibles for acquired leases, additional rent charged when a tenant remains in occupancy after lease expiration, and amounts paid by tenants for operating expenses above the levels established in their leases. These calculations exclude leases with terms of less than 12 months and leases for first generation space on properties acquired or developed by EastGroup. Same Properties: Operating properties owned during the entire current and prior year reporting periods. Properties developed or acquired are excluded until held in the operating portfolio for both the current and prior year reporting periods. Properties sold during the current or prior year reporting periods are excluded. The Same Property Pool includes properties which were included in the operating portfolio for the entire period from January 1, 2025 through September 30, 2026. Same Property Net Operating Income (“Same PNOI”): Income from real estate operations less Expenses from real estate operations (including market-based internal management fee expense), plus the Company’s share of income and property operating expenses from its less-than-wholly-owned real estate investments, for the same properties owned by the Company during the entire current and prior year reporting periods. Same PNOI is a non-GAAP, property-level supplemental measure of performance used to evaluate the performance of the Company’s investments in real estate assets and its operating results on a same property basis. Same PNOI, Excluding Income from Lease Terminations: Same PNOI (as defined above), adjusted to exclude income from lease terminations. The Company believes it is useful to evaluate Same PNOI, Excluding Income from Lease Terminations, on both a straight-line and cash basis. The straight-line basis is calculated by averaging the customers’ rent payments over the lives of the leases; GAAP requires the recognition of rental income on the straight-line basis. The cash basis excludes adjustments for straight-line rent and amortization of market rent intangibles for acquired leases; the cash basis is an indicator of the rents charged to customers by the Company during the periods presented and is useful in analyzing the embedded rent growth in the Company’s portfolio. Straight-Lining: The process of averaging the customer’s rent payments over the life of the lease. GAAP requires real estate companies to “straight-line” rents. Total Return: A stock’s dividend income plus capital appreciation/depreciation over a specified period as a percentage of the stock price at the beginning of the period. Value-Add Properties: Properties that are either acquired but not stabilized or can be converted to a higher and better use. Properties meeting either of the following two conditions are considered value-add properties: (1) Less than 75% leased as of the acquisition date (or will be less than 75% leased within one year of acquisition date based on near term lease roll), or (2) 20% or greater of the cumulative gross cost will be spent to redevelop the property. Properties qualifying under these conditions are placed into Value-Add Properties in the quarter in which (1) they are acquired, if condition 1 above is met, or (2) when construction to redevelop begins. Value-Add Properties are moved into the operating portfolio upon stabilization, meaning the earlier of achieving 90% or greater occupancy or 12 months from the acquisition date or completion of the redevelopment, as applicable.