© 2026 Texas Capital Bank Member FDIC October 21, 2026 Q3-2026 Earnings
2 Forward-Looking Statements This communication contains “forward-looking statements” within the meaning of and pursuant to the Private Securities Litigation Reform Act of 1995 regarding, among other things, TCBI’s financial condition, results of operations, business plans and future performance. These statements are not historical in nature and may often be identified by the use of words such as “believes,” “projects,” “expects,” “may,” “estimates,” “should,” “plans,” “targets,” “intends,” “could,” “would,” “anticipates,” “potential,” “confident,” “optimistic” or the negative thereof, or other variations thereon, or comparable terminology, or by discussions of strategy, objectives, estimates, trends, guidance, expectations and future plans. Because forward-looking statements relate to future results and occurrences, they are subject to inherent and various uncertainties, risks, and changes in circumstances that are difficult to predict, may change over time, are based on management’s expectations and assumptions at the time the statements are made and are not guarantees of future results. Numerous risks and other factors, many of which are beyond management’s control, could cause actual results to differ materially from future results expressed or implied by such forward-looking statements. While there can be no assurance that any list of risks is complete, important risks and other factors that could cause actual results to differ materially from those contemplated by forward- looking statements include, but are not limited to: economic or business conditions in Texas, the United States or globally that impact TCBI or its customers; negative credit quality developments arising from the foregoing or other factors, including trade policies, geopolitical conflicts, inflation, including increased energy costs, unemployment rates and interest rates; TCBI’s ability to innovate, to anticipate the needs of our current and future customers and to manage increased or expanded competition from banks and other financial service providers in TCBI’s markets; TCBI’s ability to effectively manage its liquidity and maintain adequate regulatory capital to support its businesses; TCBI’s ability to pursue and execute upon growth plans, whether as a function of capital, liquidity or other limitations; TCBI’s ability to successfully execute its business strategy, including its strategic plan and developing and executing new lines of business, products and services; risks related to potential strategic acquisitions, including the risk that TCBI may not be able to consummate acquisitions on favorable terms, if at all, and the risk that TCBI may not realize the anticipated benefits from acquisitions; the extensive regulations to which TCBI is subject and its ability to comply with applicable governmental regulations, including legislative and regulatory changes; TCBI’s ability to effectively manage information technology systems, including third-party vendors, cyber or data privacy incidents or other failures, outages, disruptions or security breaches; TCBI’s ability to use technology to provide products and services to its customers; risks related to the development and use of artificial intelligence; changes in interest rates, including the impact of interest rates on TCBI’s securities portfolio and funding costs, as well as related balance sheet implications stemming from the fair value of our assets and liabilities; the effectiveness of TCBI’s risk management processes, strategies and monitoring; fluctuations in commercial and residential real estate values, especially as they relate to the value of collateral supporting TCBI’s loans; TCBI’s ability to manage any unexpected outflows of uninsured deposits and avoid selling investment securities or other assets at an unfavorable time or at a loss; adverse developments in the banking industry and the potential impact of such developments on customer confidence, liquidity and regulatory responses to these developments, including in the context of regulatory examinations and related findings and actions; negative press and social media attention with respect to the banking industry or TCBI, in particular; claims, litigation or regulatory investigations and actions that TCBI may become subject to; the failure to identify, attract and retain key personnel and other employees and to engage in adequate succession planning; the transfer of the listing of TCBI’s securities to TXSE, a newly operational exchange, and its effect on the trading market, liquidity and price of TCBI’s securities; severe weather, natural disasters, climate change, acts of war, terrorism, global or other geopolitical conflicts, or other external events, as well as related legislative and regulatory initiatives; and the risks and factors more fully described in TCBI’s most recent Annual Report on Form 10-K, Quarterly Reports on Form 10-Q and other documents and filings with the Securities and Exchange Commission. The information contained in this communication speaks only as of its date. Except to the extent required by applicable law or regulation, we disclaim any obligation to update such factors or to publicly announce the results of any revisions to any of the forward-looking statements included herein to reflect future events or developments.
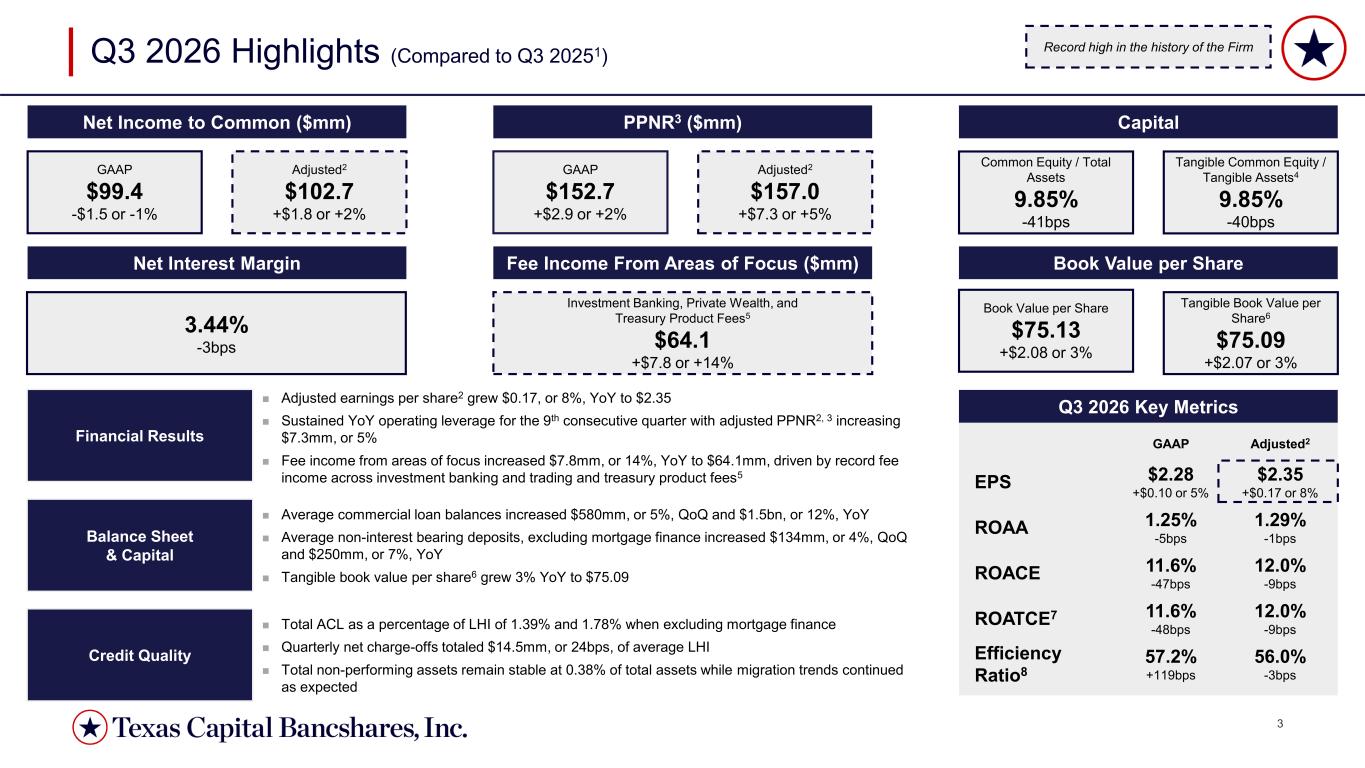
3 Q3 2026 Highlights (Compared to Q3 20251) GAAP $99.4 -$1.5 or -1% Adjusted2 $102.7 +$1.8 or +2% GAAP $152.7 +$2.9 or +2% Adjusted2 $157.0 +$7.3 or +5% Investment Banking, Private Wealth, and Treasury Product Fees5 $64.1 +$7.8 or +14% Book Value per Share $75.13 +$2.08 or 3% Tangible Book Value per Share6 $75.09 +$2.07 or 3% Credit Quality Balance Sheet & Capital Financial Results 3.44% -3bps ◼ Adjusted earnings per share2 grew $0.17, or 8%, YoY to $2.35 ◼ Sustained YoY operating leverage for the 9th consecutive quarter with adjusted PPNR2, 3 increasing $7.3mm, or 5% ◼ Fee income from areas of focus increased $7.8mm, or 14%, YoY to $64.1mm, driven by record fee income across investment banking and trading and treasury product fees5 ◼ Average commercial loan balances increased $580mm, or 5%, QoQ and $1.5bn, or 12%, YoY ◼ Average non-interest bearing deposits, excluding mortgage finance increased $134mm, or 4%, QoQ and $250mm, or 7%, YoY ◼ Tangible book value per share6 grew 3% YoY to $75.09 ◼ Total ACL as a percentage of LHI of 1.39% and 1.78% when excluding mortgage finance ◼ Quarterly net charge-offs totaled $14.5mm, or 24bps, of average LHI ◼ Total non-performing assets remain stable at 0.38% of total assets while migration trends continued as expected Net Income to Common ($mm) Net Interest Margin Capital Fee Income From Areas of Focus ($mm) Book Value per Share Common Equity / Total Assets 9.85% -41bps Tangible Common Equity / Tangible Assets4 9.85% -40bps PPNR3 ($mm) $2.28 +$0.10 or 5% 1.25% -5bps 11.6% -47bps 57.2% +119bps $2.35 +$0.17 or 8% 1.29% -1bps 12.0% -9bps 56.0% -3bps EPS ROAA ROACE Efficiency Ratio8 Q3 2026 Key Metrics GAAP Adjusted2 11.6% -48bps 12.0% -9bps ROATCE7 Record high in the history of the Firm
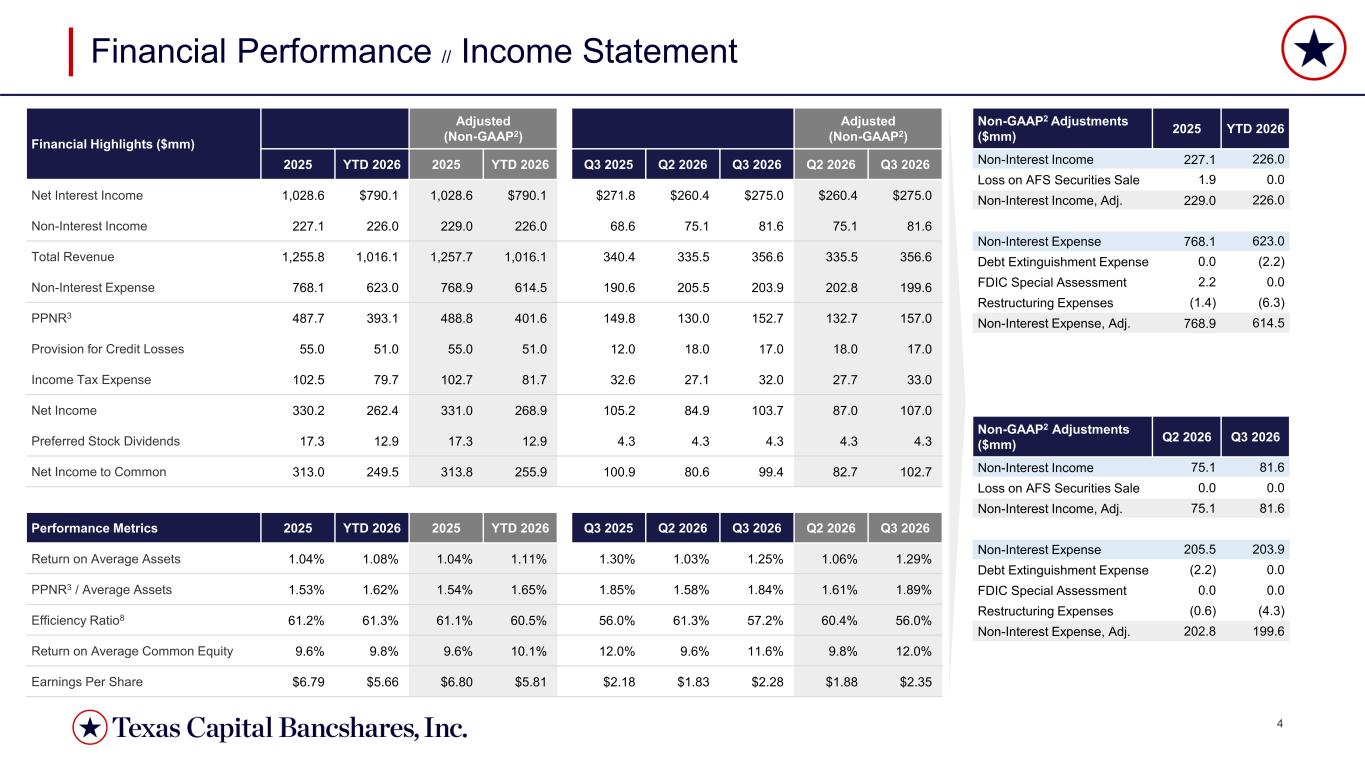
4 Non-GAAP2 Adjustments ($mm) 2025 YTD 2026 Non-Interest Income 227.1 226.0 Loss on AFS Securities Sale 1.9 0.0 Non-Interest Income, Adj. 229.0 226.0 Non-Interest Expense 768.1 623.0 Debt Extinguishment Expense 0.0 (2.2) FDIC Special Assessment 2.2 0.0 Restructuring Expenses (1.4) (6.3) Non-Interest Expense, Adj. 768.9 614.5 Financial Performance // Income Statement Financial Highlights ($mm) Adjusted (Non-GAAP2) Adjusted (Non-GAAP2) 2025 YTD 2026 2025 YTD 2026 Q3 2025 Q2 2026 Q3 2026 Q2 2026 Q3 2026 Net Interest Income 1,028.6 $790.1 1,028.6 $790.1 $271.8 $260.4 $275.0 $260.4 $275.0 Non-Interest Income 227.1 226.0 229.0 226.0 68.6 75.1 81.6 75.1 81.6 Total Revenue 1,255.8 1,016.1 1,257.7 1,016.1 340.4 335.5 356.6 335.5 356.6 Non-Interest Expense 768.1 623.0 768.9 614.5 190.6 205.5 203.9 202.8 199.6 PPNR3 487.7 393.1 488.8 401.6 149.8 130.0 152.7 132.7 157.0 Provision for Credit Losses 55.0 51.0 55.0 51.0 12.0 18.0 17.0 18.0 17.0 Income Tax Expense 102.5 79.7 102.7 81.7 32.6 27.1 32.0 27.7 33.0 Net Income 330.2 262.4 331.0 268.9 105.2 84.9 103.7 87.0 107.0 Preferred Stock Dividends 17.3 12.9 17.3 12.9 4.3 4.3 4.3 4.3 4.3 Net Income to Common 313.0 249.5 313.8 255.9 100.9 80.6 99.4 82.7 102.7 Performance Metrics 2025 YTD 2026 2025 YTD 2026 Q3 2025 Q2 2026 Q3 2026 Q2 2026 Q3 2026 Return on Average Assets 1.04% 1.08% 1.04% 1.11% 1.30% 1.03% 1.25% 1.06% 1.29% PPNR3 / Average Assets 1.53% 1.62% 1.54% 1.65% 1.85% 1.58% 1.84% 1.61% 1.89% Efficiency Ratio8 61.2% 61.3% 61.1% 60.5% 56.0% 61.3% 57.2% 60.4% 56.0% Return on Average Common Equity 9.6% 9.8% 9.6% 10.1% 12.0% 9.6% 11.6% 9.8% 12.0% Earnings Per Share $6.79 $5.66 $6.80 $5.81 $2.18 $1.83 $2.28 $1.88 $2.35 Non-GAAP2 Adjustments ($mm) Q2 2026 Q3 2026 Non-Interest Income 75.1 81.6 Loss on AFS Securities Sale 0.0 0.0 Non-Interest Income, Adj. 75.1 81.6 Non-Interest Expense 205.5 203.9 Debt Extinguishment Expense (2.2) 0.0 FDIC Special Assessment 0.0 0.0 Restructuring Expenses (0.6) (4.3) Non-Interest Expense, Adj. 202.8 199.6
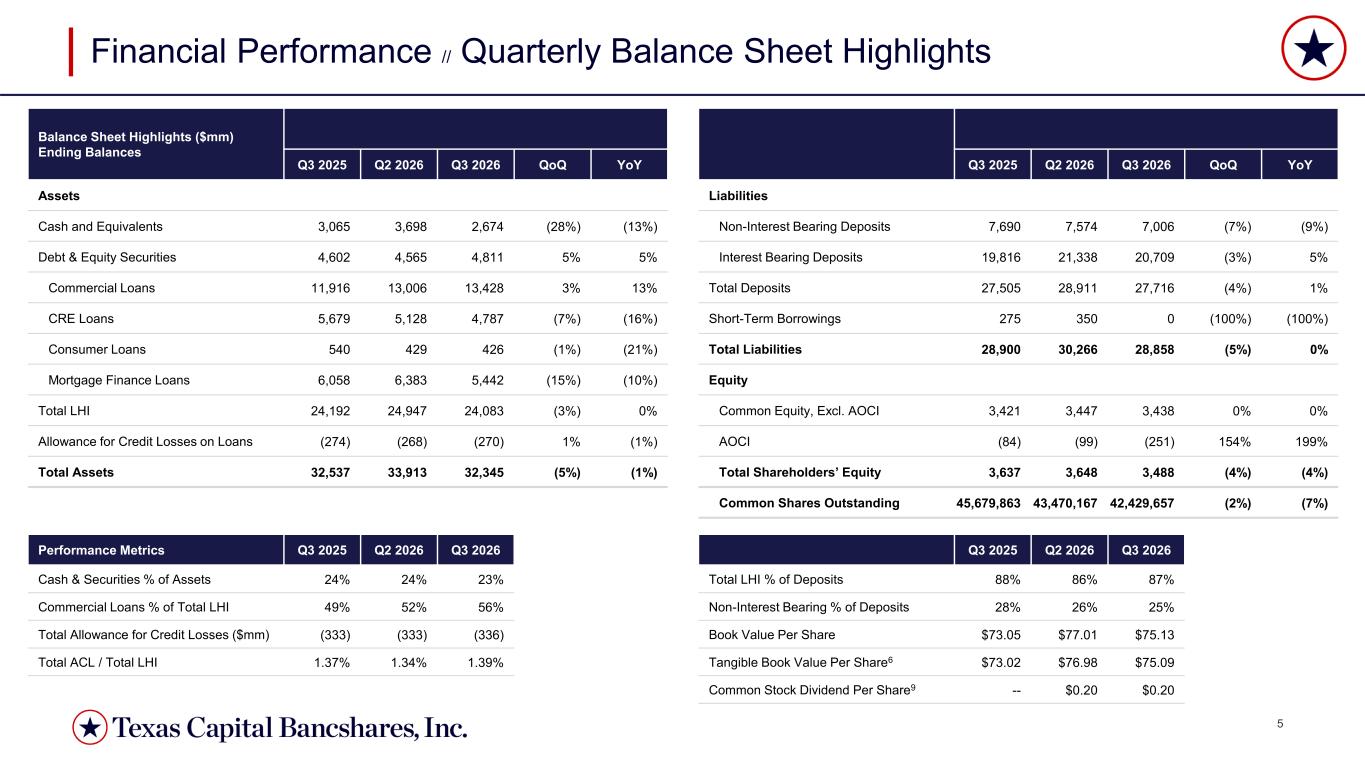
5 Balance Sheet Highlights ($mm) Ending Balances Q3 2025 Q2 2026 Q3 2026 QoQ YoY Assets Cash and Equivalents 3,065 3,698 2,674 (28%) (13%) Debt & Equity Securities 4,602 4,565 4,811 5% 5% Commercial Loans 11,916 13,006 13,428 3% 13% CRE Loans 5,679 5,128 4,787 (7%) (16%) Consumer Loans 540 429 426 (1%) (21%) Mortgage Finance Loans 6,058 6,383 5,442 (15%) (10%) Total LHI 24,192 24,947 24,083 (3%) 0% Allowance for Credit Losses on Loans (274) (268) (270) 1% (1%) Total Assets 32,537 33,913 32,345 (5%) (1%) Financial Performance // Quarterly Balance Sheet Highlights Performance Metrics Q3 2025 Q2 2026 Q3 2026 Cash & Securities % of Assets 24% 24% 23% Commercial Loans % of Total LHI 49% 52% 56% Total Allowance for Credit Losses ($mm) (333) (333) (336) Total ACL / Total LHI 1.37% 1.34% 1.39% Q3 2025 Q2 2026 Q3 2026 QoQ YoY Liabilities Non-Interest Bearing Deposits 7,690 7,574 7,006 (7%) (9%) Interest Bearing Deposits 19,816 21,338 20,709 (3%) 5% Total Deposits 27,505 28,911 27,716 (4%) 1% Short-Term Borrowings 275 350 0 (100%) (100%) Total Liabilities 28,900 30,266 28,858 (5%) 0% Equity Common Equity, Excl. AOCI 3,421 3,447 3,438 0% 0% AOCI (84) (99) (251) 154% 199% Total Shareholders’ Equity 3,637 3,648 3,488 (4%) (4%) Common Shares Outstanding 45,679,863 43,470,167 42,429,657 (2%) (7%) Q3 2025 Q2 2026 Q3 2026 Total LHI % of Deposits 88% 86% 87% Non-Interest Bearing % of Deposits 28% 26% 25% Book Value Per Share $73.05 $77.01 $75.13 Tangible Book Value Per Share6 $73.02 $76.98 $75.09 Common Stock Dividend Per Share9 -- $0.20 $0.20
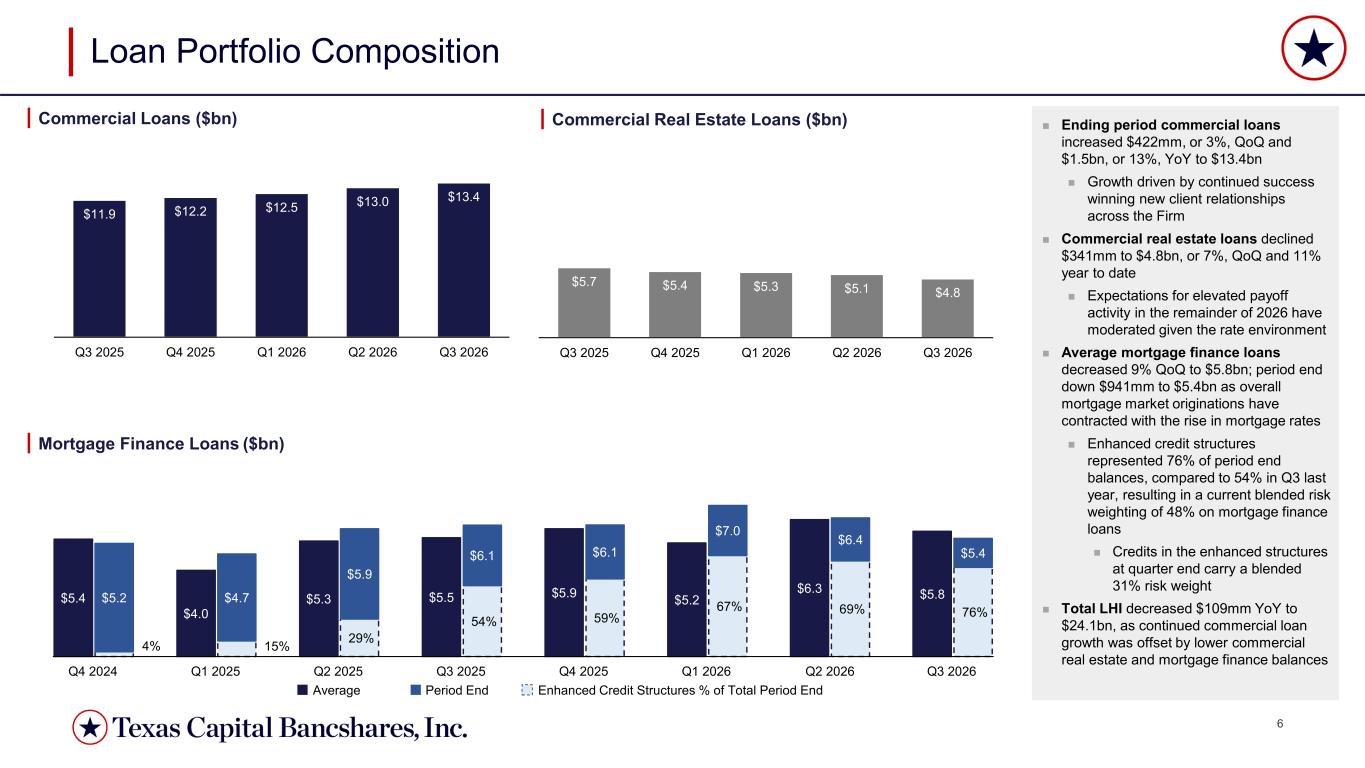
6 $5.4 $4.0 $5.3 $5.5 $5.9 $5.2 $6.3 $5.8 4% 15% 29% 54% 59% 67% 69% 76% $5.2 $4.7 $5.9 $6.1 $6.1 $7.0 $6.4 $5.4 $5.7 $5.4 $5.3 $5.1 $4.8 Q3 2025 Q4 2025 Q1 2026 Q2 2026 Q3 2026 $11.9 $12.2 $12.5 $13.0 $13.4 Q3 2025 Q4 2025 Q1 2026 Q2 2026 Q3 2026 ◼ Ending period commercial loans increased $422mm, or 3%, QoQ and $1.5bn, or 13%, YoY to $13.4bn ◼ Growth driven by continued success winning new client relationships across the Firm ◼ Commercial real estate loans declined $341mm to $4.8bn, or 7%, QoQ and 11% year to date ◼ Expectations for elevated payoff activity in the remainder of 2026 have moderated given the rate environment ◼ Average mortgage finance loans decreased 9% QoQ to $5.8bn; period end down $941mm to $5.4bn as overall mortgage market originations have contracted with the rise in mortgage rates ◼ Enhanced credit structures represented 76% of period end balances, compared to 54% in Q3 last year, resulting in a current blended risk weighting of 48% on mortgage finance loans ◼ Credits in the enhanced structures at quarter end carry a blended 31% risk weight ◼ Total LHI decreased $109mm YoY to $24.1bn, as continued commercial loan growth was offset by lower commercial real estate and mortgage finance balances Loan Portfolio Composition Mortgage Finance Loans ($bn) Commercial Loans ($bn) Commercial Real Estate Loans ($bn) Q4 2024 Q1 2025 Q2 2025 Q3 2025 Q4 2025 Q1 2026 Q2 2026 Q3 2026 Average Period End Enhanced Credit Structures % of Total Period End
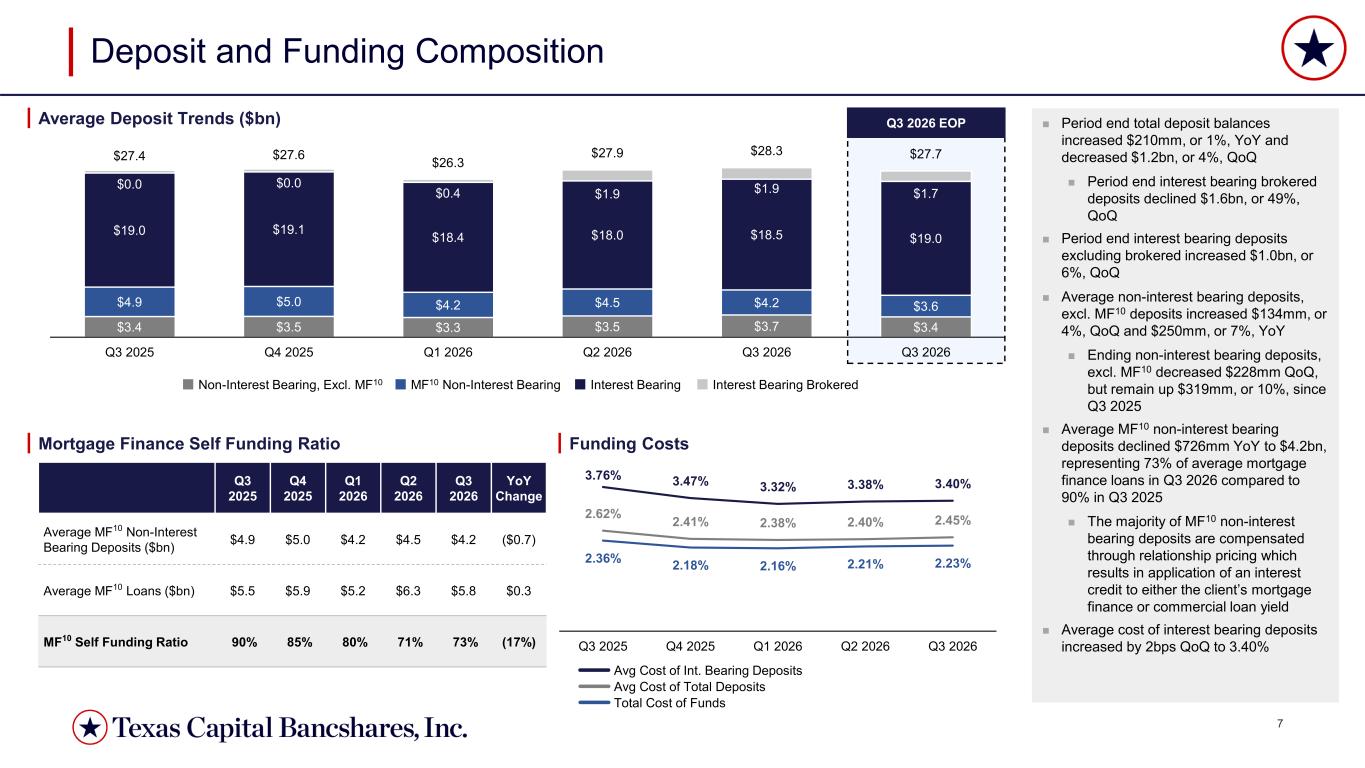
7 2.62% 2.41% 2.38% 2.40% 2.45% 2.36% 2.18% 2.16% 2.21% 2.23% 3.76% 3.47% 3.32% 3.38% 3.40% Q3 2025 Q4 2025 Q1 2026 Q2 2026 Q3 2026 $3.4 $3.5 $3.3 $3.5 $3.7 $3.4 $4.9 $5.0 $4.2 $4.5 $4.2 $3.6 $19.0 $19.1 $18.4 $18.0 $18.5 $19.0 $0.0 $0.0 $0.4 $1.9 $1.9 $1.7 $27.4 $27.6 $26.3 $27.9 $28.3 $27.7 Q3 2025 Q4 2025 Q1 2026 Q2 2026 Q3 2026 Q3 2026 Q3 2026 EOP Deposit and Funding Composition ◼ Period end total deposit balances increased $210mm, or 1%, YoY and decreased $1.2bn, or 4%, QoQ ◼ Period end interest bearing brokered deposits declined $1.6bn, or 49%, QoQ ◼ Period end interest bearing deposits excluding brokered increased $1.0bn, or 6%, QoQ ◼ Average non-interest bearing deposits, excl. MF10 deposits increased $134mm, or 4%, QoQ and $250mm, or 7%, YoY ◼ Ending non-interest bearing deposits, excl. MF10 decreased $228mm QoQ, but remain up $319mm, or 10%, since Q3 2025 ◼ Average MF10 non-interest bearing deposits declined $726mm YoY to $4.2bn, representing 73% of average mortgage finance loans in Q3 2026 compared to 90% in Q3 2025 ◼ The majority of MF10 non-interest bearing deposits are compensated through relationship pricing which results in application of an interest credit to either the client’s mortgage finance or commercial loan yield ◼ Average cost of interest bearing deposits increased by 2bps QoQ to 3.40% Average Deposit Trends ($bn) Mortgage Finance Self Funding Ratio Funding Costs Avg Cost of Total Deposits Total Cost of Funds Avg Cost of Int. Bearing Deposits Non-Interest Bearing, Excl. MF10 MF10 Non-Interest Bearing Interest Bearing Interest Bearing Brokered Q3 2025 Q4 2025 Q1 2026 Q2 2026 Q3 2026 YoY Change Average MF10 Non-Interest Bearing Deposits ($bn) $4.9 $5.0 $4.2 $4.5 $4.2 ($0.7) Average MF10 Loans ($bn) $5.5 $5.9 $5.2 $6.3 $5.8 $0.3 MF10 Self Funding Ratio 90% 85% 80% 71% 73% (17%)
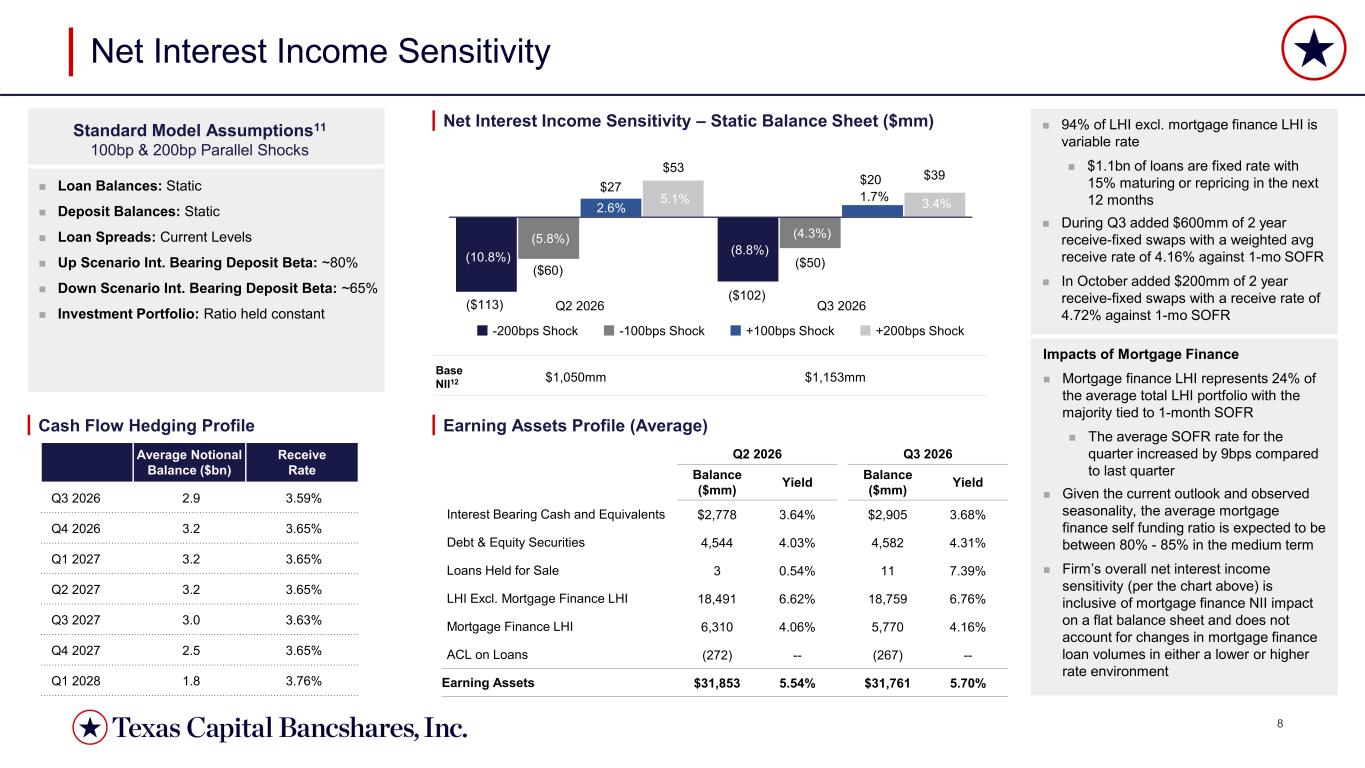
8 (10.8%) (8.8%) (5.8%) (4.3%) 2.6% 1.7% 5.1% 3.4% (10.0%) (8.0%) (6.0%) (4.0%) (2.0%) 0.0% 2.0% 4.0% 6.0% 8.0% 10.0% Q2 2026 Q3 2026 -200bps Shock -100bps Shock +100bps Shock +200bps Shock Net Interest Income Sensitivity Standard Model Assumptions11 100bp & 200bp Parallel Shocks ◼ Loan Balances: Static ◼ Deposit Balances: Static ◼ Loan Spreads: Current Levels ◼ Up Scenario Int. Bearing Deposit Beta: ~80% ◼ Down Scenario Int. Bearing Deposit Beta: ~65% ◼ Investment Portfolio: Ratio held constant Net Interest Income Sensitivity – Static Balance Sheet ($mm) Base NII12 $1,050mm $1,153mm Q2 2026 Q3 2026 Balance ($mm) Yield Balance ($mm) Yield Interest Bearing Cash and Equivalents $2,778 3.64% $2,905 3.68% Debt & Equity Securities 4,544 4.03% 4,582 4.31% Loans Held for Sale 3 0.54% 11 7.39% LHI Excl. Mortgage Finance LHI 18,491 6.62% 18,759 6.76% Mortgage Finance LHI 6,310 4.06% 5,770 4.16% ACL on Loans (272) -- (267) -- Earning Assets $31,853 5.54% $31,761 5.70% ◼ 94% of LHI excl. mortgage finance LHI is variable rate ◼ $1.1bn of loans are fixed rate with 15% maturing or repricing in the next 12 months ◼ During Q3 added $600mm of 2 year receive-fixed swaps with a weighted avg receive rate of 4.16% against 1-mo SOFR ◼ In October added $200mm of 2 year receive-fixed swaps with a receive rate of 4.72% against 1-mo SOFR Impacts of Mortgage Finance ◼ Mortgage finance LHI represents 24% of the average total LHI portfolio with the majority tied to 1-month SOFR ◼ The average SOFR rate for the quarter increased by 9bps compared to last quarter ◼ Given the current outlook and observed seasonality, the average mortgage finance self funding ratio is expected to be between 80% - 85% in the medium term ◼ Firm’s overall net interest income sensitivity (per the chart above) is inclusive of mortgage finance NII impact on a flat balance sheet and does not account for changes in mortgage finance loan volumes in either a lower or higher rate environment $53 $27 ($60) ($113) $39$20 ($50) ($102) Average Notional Balance ($bn) Receive Rate Q3 2026 2.9 3.59% Q4 2026 3.2 3.65% Q1 2027 3.2 3.65% Q2 2027 3.2 3.65% Q3 2027 3.0 3.63% Q4 2027 2.5 3.65% Q1 2028 1.8 3.76% Cash Flow Hedging Profile Earning Assets Profile (Average)
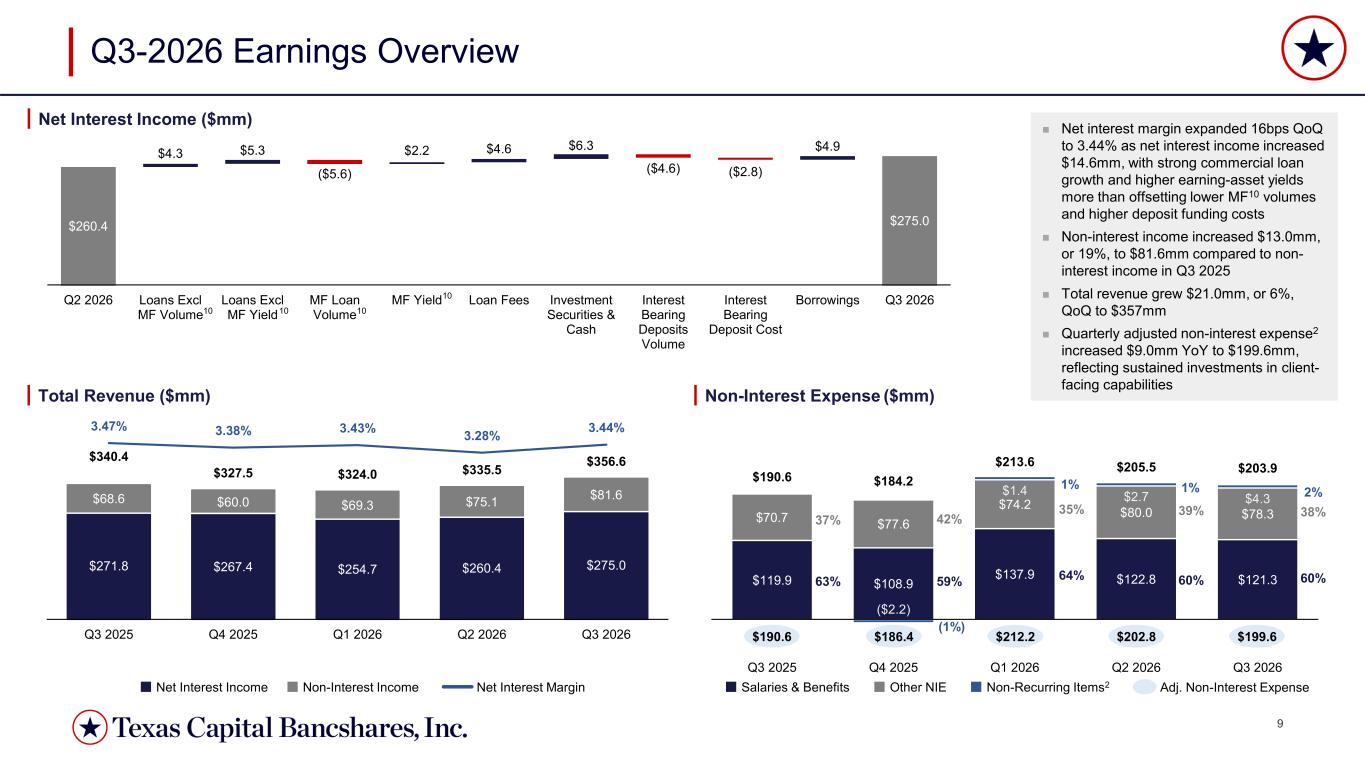
9 $260.4 $4.3 $5.3 ($5.6) $2.2 $4.6 $6.3 ($4.6) ($2.8) $4.9 $275.0 Q2 2026 Loans Excl MF Volume Loans Excl MF Yield MF Loan Volume MF Yield Loan Fees Investment Securities & Cash Interest Bearing Deposits Volume Interest Bearing Deposit Cost Borrowings Q3 2026 $119.9 $108.9 $137.9 $122.8 $121.3 $70.7 $77.6 $74.2 $80.0 $78.3 ($2.2) $1.4 $2.7 $4.3 $190.6 $184.2 $213.6 $205.5 $203.9 Q3 2025 Q4 2025 Q1 2026 Q2 2026 Q3 2026 $271.8 $267.4 $254.7 $260.4 $275.0 $68.6 $60.0 $69.3 $75.1 $81.6 $340.4 $327.5 $324.0 $335.5 $356.6 3.47% 3.38% 3.43% 3.28% 3.44% Q3 2025 Q4 2025 Q1 2026 Q2 2026 Q3 2026 63% 59% 64% 60% Q3-2026 Earnings Overview Net Interest Income ($mm) Total Revenue ($mm) Non-Interest Expense ($mm) 60% 10 10 10 10 38% 42% 35% Salaries & Benefits Other NIE Non-Recurring Items2Net Interest Income 37% 39% 1% 1% Non-Interest Income Net Interest Margin ◼ Net interest margin expanded 16bps QoQ to 3.44% as net interest income increased $14.6mm, with strong commercial loan growth and higher earning-asset yields more than offsetting lower MF10 volumes and higher deposit funding costs ◼ Non-interest income increased $13.0mm, or 19%, to $81.6mm compared to non- interest income in Q3 2025 ◼ Total revenue grew $21.0mm, or 6%, QoQ to $357mm ◼ Quarterly adjusted non-interest expense2 increased $9.0mm YoY to $199.6mm, reflecting sustained investments in client- facing capabilities (1%) 2% $190.6 $186.4 $212.2 $202.8 $199.6 Adj. Non-Interest Expense
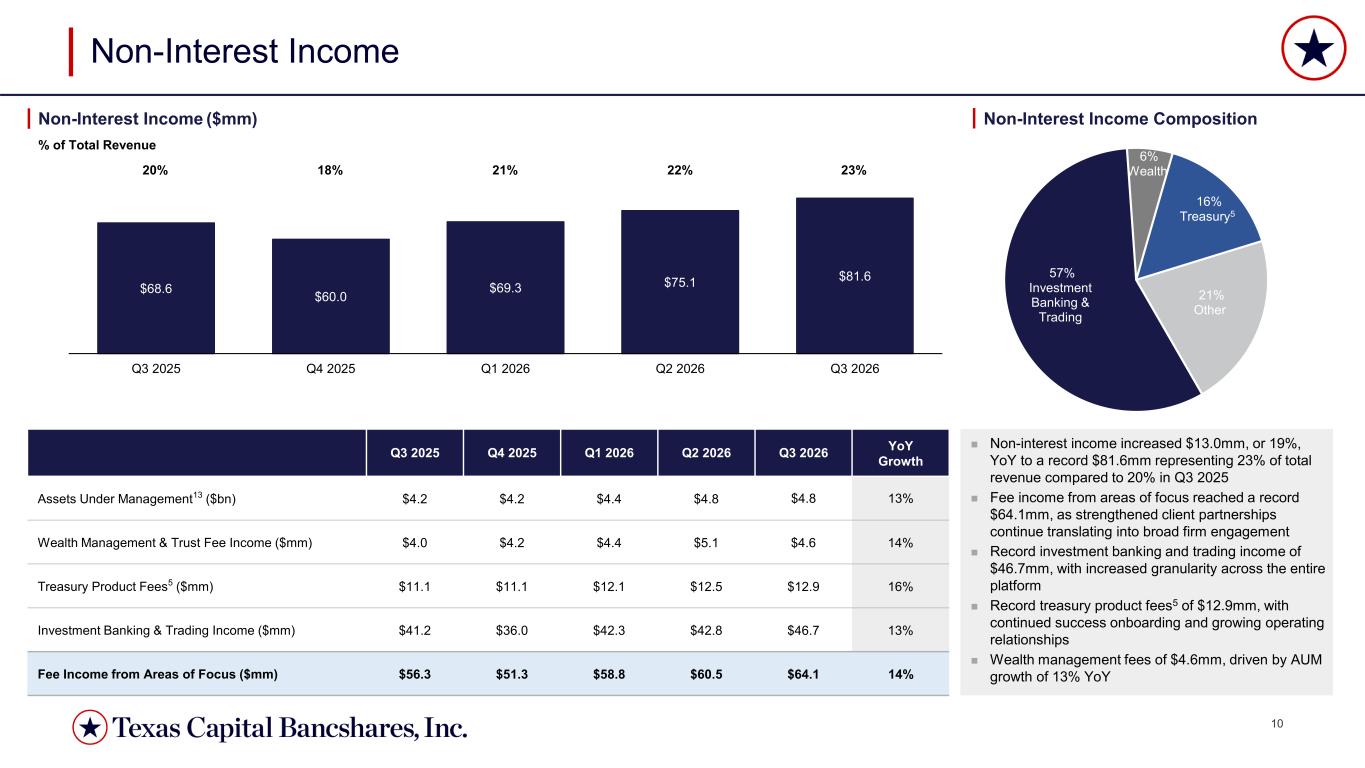
10 $68.6 $60.0 $69.3 $75.1 $81.6 Q3 2025 Q4 2025 Q1 2026 Q2 2026 Q3 2026 57% Investment Banking & Trading 6% Wealth 16% Treasury5 21% Other ◼ Non-interest income increased $13.0mm, or 19%, YoY to a record $81.6mm representing 23% of total revenue compared to 20% in Q3 2025 ◼ Fee income from areas of focus reached a record $64.1mm, as strengthened client partnerships continue translating into broad firm engagement ◼ Record investment banking and trading income of $46.7mm, with increased granularity across the entire platform ◼ Record treasury product fees5 of $12.9mm, with continued success onboarding and growing operating relationships ◼ Wealth management fees of $4.6mm, driven by AUM growth of 13% YoY Non-Interest Income Q3 2025 Q4 2025 Q1 2026 Q2 2026 Q3 2026 YoY Growth Assets Under Management13 ($bn) $4.2 $4.2 $4.4 $4.8 $4.8 13% Wealth Management & Trust Fee Income ($mm) $4.0 $4.2 $4.4 $5.1 $4.6 14% Treasury Product Fees5 ($mm) $11.1 $11.1 $12.1 $12.5 $12.9 16% Investment Banking & Trading Income ($mm) $41.2 $36.0 $42.3 $42.8 $46.7 13% Fee Income from Areas of Focus ($mm) $56.3 $51.3 $58.8 $60.5 $64.1 14% Non-Interest Income ($mm) % of Total Revenue 20% 18% 21% 22% 23% Non-Interest Income Composition
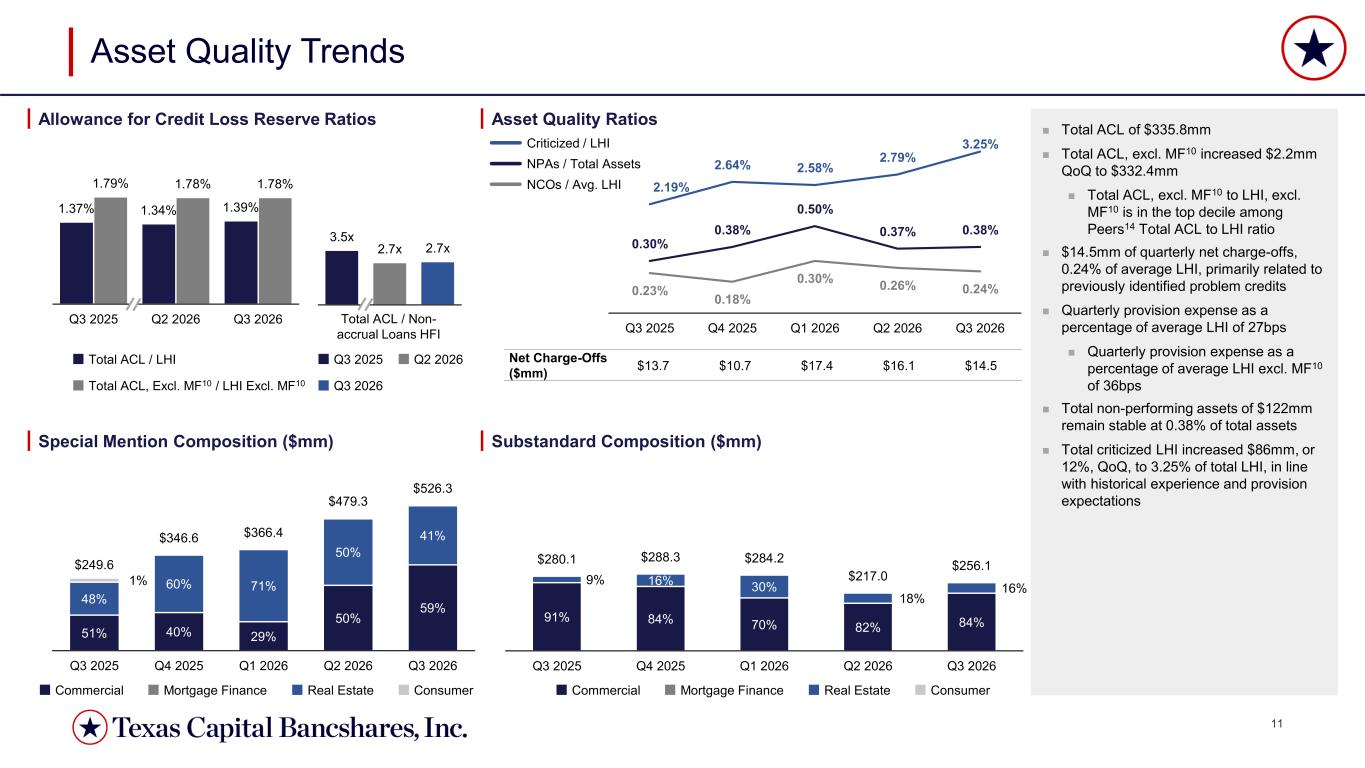
11 3.5x 2.7x 2.7x 1.37% 1.34% 1.39% 1.79% 1.78% 1.78% Q3 2025 Q2 2026 Q3 2026 0.30% 0.38% 0.50% 0.37% 0.38% 0.23% 0.18% 0.30% 0.26% 0.24% 2.19% 2.64% 2.58% 2.79% 3.25% Q3 2025 Q4 2025 Q1 2026 Q2 2026 Q3 2026 91% 84% 70% 82% 84% 9% 16% 30% 18% 16% $280.1 $288.3 $284.2 $217.0 $256.1 Q3 2025 Q4 2025 Q1 2026 Q2 2026 Q3 2026 51% 40% 29% 50% 59% 48% 60% 71% 50% 41% 1% $249.6 $346.6 $366.4 $479.3 $526.3 Q3 2025 Q4 2025 Q1 2026 Q2 2026 Q3 2026 Asset Quality Trends Allowance for Credit Loss Reserve Ratios Asset Quality Ratios Special Mention Composition ($mm) Substandard Composition ($mm) Net Charge-Offs ($mm) $13.7 $10.7 $17.4 $16.1 $14.5 Total ACL / Non- accrual Loans HFI ◼ Total ACL of $335.8mm ◼ Total ACL, excl. MF10 increased $2.2mm QoQ to $332.4mm ◼ Total ACL, excl. MF10 to LHI, excl. MF10 is in the top decile among Peers14 Total ACL to LHI ratio ◼ $14.5mm of quarterly net charge-offs, 0.24% of average LHI, primarily related to previously identified problem credits ◼ Quarterly provision expense as a percentage of average LHI of 27bps ◼ Quarterly provision expense as a percentage of average LHI excl. MF10 of 36bps ◼ Total non-performing assets of $122mm remain stable at 0.38% of total assets ◼ Total criticized LHI increased $86mm, or 12%, QoQ, to 3.25% of total LHI, in line with historical experience and provision expectations Commercial Mortgage Finance Real Estate ConsumerCommercial Mortgage Finance Real Estate Consumer Total ACL / LHI Total ACL, Excl. MF10 / LHI Excl. MF10 Q3 2025 Q2 2026 Q3 2026 Criticized / LHI NPAs / Total Assets NCOs / Avg. LHI
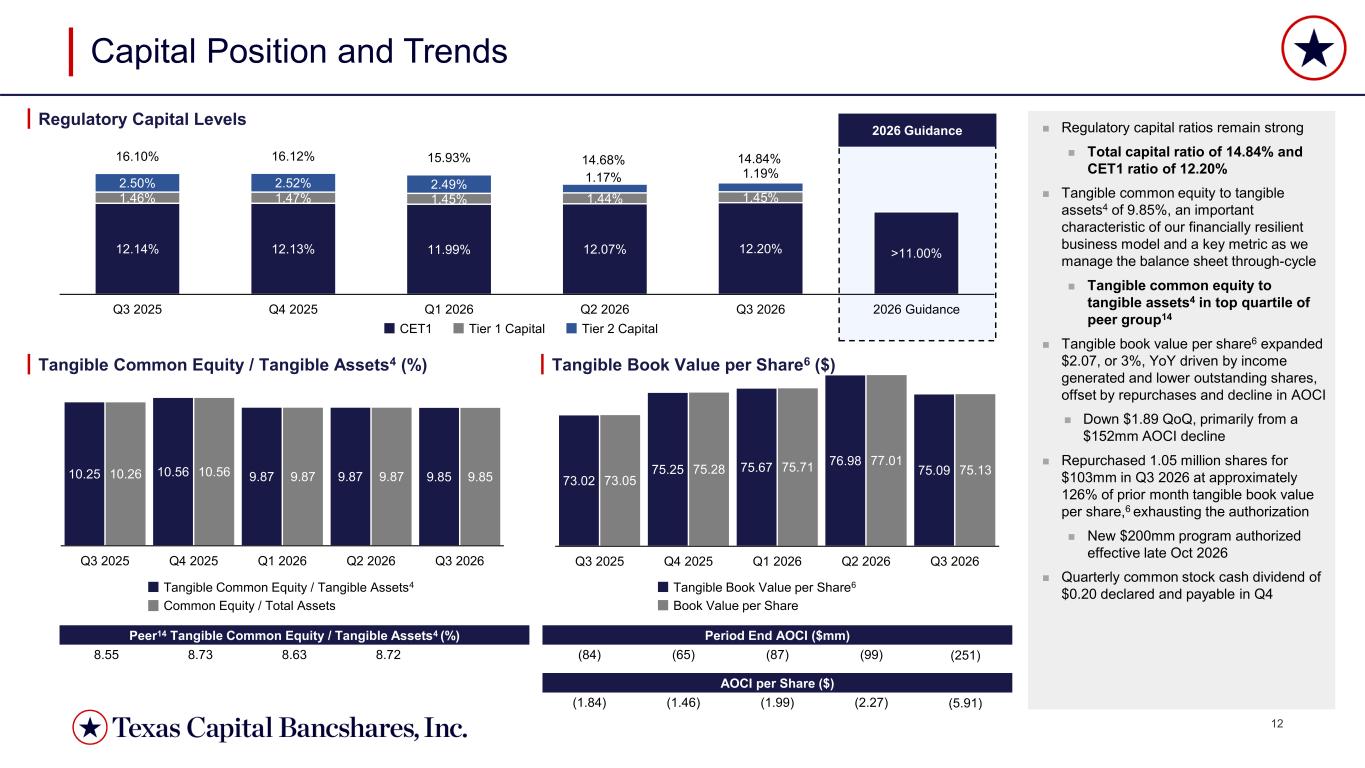
12 12.14% 12.13% 11.99% 12.07% 12.20% >11.00% 1.46% 1.47% 1.45% 1.44% 1.45% 2.50% 2.52% 2.49% 1.17% 1.19% 16.10% 16.12% 15.93% 14.68% 14.84% Q3 2025 Q4 2025 Q1 2026 Q2 2026 Q3 2026 2026 Guidance 73.02 75.25 75.67 76.98 75.09 73.05 75.28 75.71 77.01 75.13 Q3 2025 Q4 2025 Q1 2026 Q2 2026 Q3 2026 10.25 10.56 9.87 9.87 9.8510.26 10.56 9.87 9.87 9.85 Q3 2025 Q4 2025 Q1 2026 Q2 2026 Q3 2026 Tangible Common Equity / Tangible Assets4 Common Equity / Total Assets 2026 Guidance Capital Position and Trends ◼ Regulatory capital ratios remain strong ◼ Total capital ratio of 14.84% and CET1 ratio of 12.20% ◼ Tangible common equity to tangible assets4 of 9.85%, an important characteristic of our financially resilient business model and a key metric as we manage the balance sheet through-cycle ◼ Tangible common equity to tangible assets4 in top quartile of peer group14 ◼ Tangible book value per share6 expanded $2.07, or 3%, YoY driven by income generated and lower outstanding shares, offset by repurchases and decline in AOCI ◼ Down $1.89 QoQ, primarily from a $152mm AOCI decline ◼ Repurchased 1.05 million shares for $103mm in Q3 2026 at approximately 126% of prior month tangible book value per share,6 exhausting the authorization ◼ New $200mm program authorized effective late Oct 2026 ◼ Quarterly common stock cash dividend of $0.20 declared and payable in Q4 Regulatory Capital Levels Tangible Common Equity / Tangible Assets4 (%) Period End AOCI ($mm) (84) (65) (87) (99) (251) AOCI per Share ($) (1.84) (1.46) (1.99) (2.27) (5.91) Peer14 Tangible Common Equity / Tangible Assets4 (%) 8.55 8.73 8.63 8.72 CET1 Tier 1 Capital Tier 2 Capital Tangible Book Value per Share6 Book Value per Share Tangible Book Value per Share6 ($)
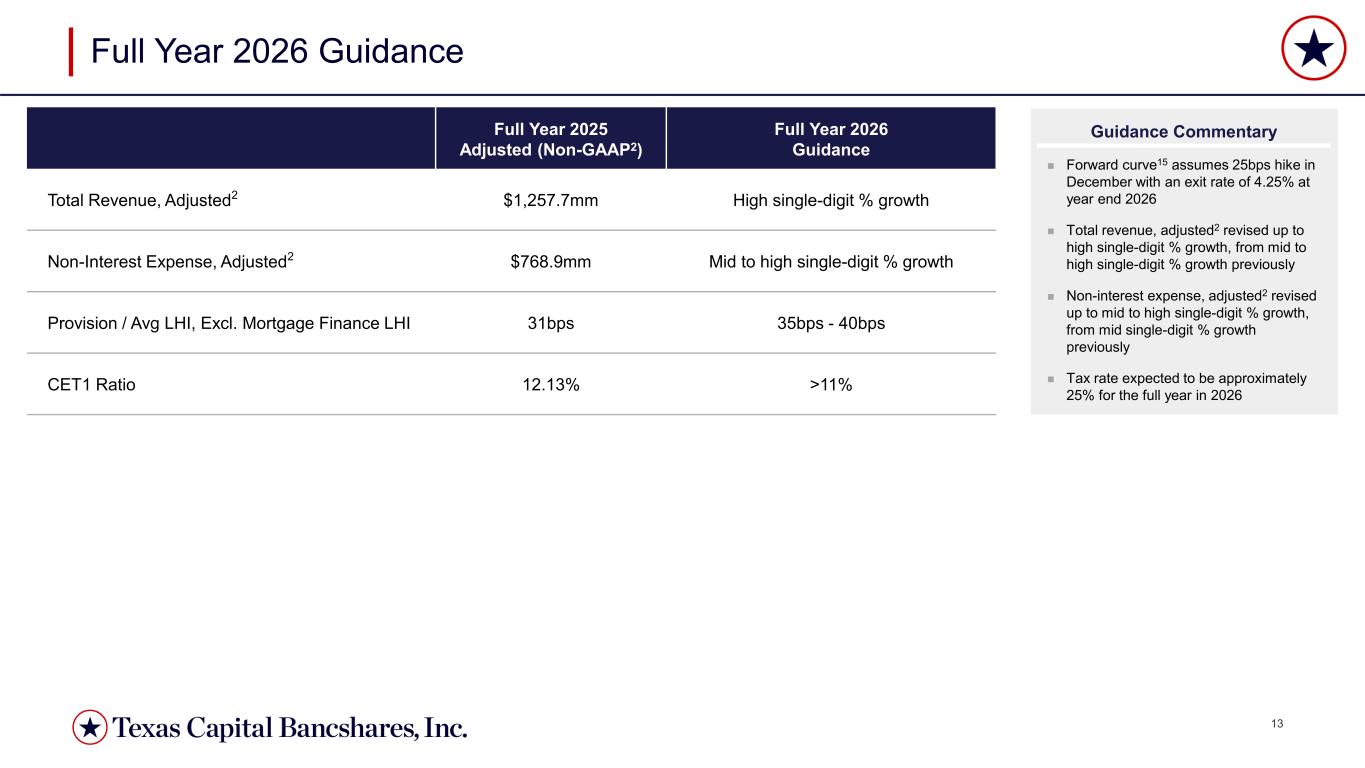
13 Full Year 2025 Adjusted (Non-GAAP2) Full Year 2026 Guidance Total Revenue, Adjusted2 $1,257.7mm High single-digit % growth Non-Interest Expense, Adjusted2 $768.9mm Mid to high single-digit % growth Provision / Avg LHI, Excl. Mortgage Finance LHI 31bps 35bps - 40bps CET1 Ratio 12.13% >11% Full Year 2026 Guidance ◼ Forward curve15 assumes 25bps hike in December with an exit rate of 4.25% at year end 2026 ◼ Total revenue, adjusted2 revised up to high single-digit % growth, from mid to high single-digit % growth previously ◼ Non-interest expense, adjusted2 revised up to mid to high single-digit % growth, from mid single-digit % growth previously ◼ Tax rate expected to be approximately 25% for the full year in 2026 Guidance Commentary
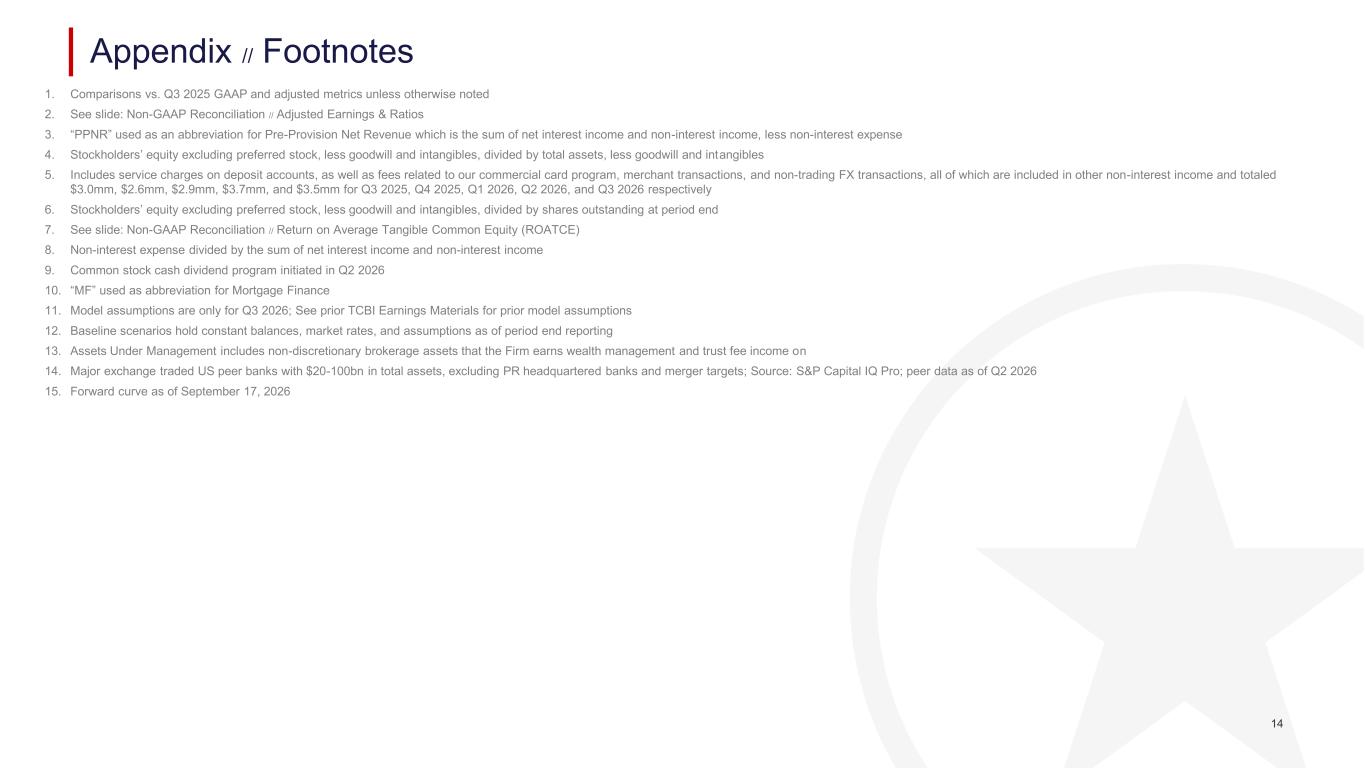
14 1. Comparisons vs. Q3 2025 GAAP and adjusted metrics unless otherwise noted 2. See slide: Non-GAAP Reconciliation // Adjusted Earnings & Ratios 3. “PPNR” used as an abbreviation for Pre-Provision Net Revenue which is the sum of net interest income and non-interest income, less non-interest expense 4. Stockholders’ equity excluding preferred stock, less goodwill and intangibles, divided by total assets, less goodwill and intangibles 5. Includes service charges on deposit accounts, as well as fees related to our commercial card program, merchant transactions, and non-trading FX transactions, all of which are included in other non-interest income and totaled $3.0mm, $2.6mm, $2.9mm, $3.7mm, and $3.5mm for Q3 2025, Q4 2025, Q1 2026, Q2 2026, and Q3 2026 respectively 6. Stockholders’ equity excluding preferred stock, less goodwill and intangibles, divided by shares outstanding at period end 7. See slide: Non-GAAP Reconciliation // Return on Average Tangible Common Equity (ROATCE) 8. Non-interest expense divided by the sum of net interest income and non-interest income 9. Common stock cash dividend program initiated in Q2 2026 10. “MF” used as abbreviation for Mortgage Finance 11. Model assumptions are only for Q3 2026; See prior TCBI Earnings Materials for prior model assumptions 12. Baseline scenarios hold constant balances, market rates, and assumptions as of period end reporting 13. Assets Under Management includes non-discretionary brokerage assets that the Firm earns wealth management and trust fee income on 14. Major exchange traded US peer banks with $20-100bn in total assets, excluding PR headquartered banks and merger targets; Source: S&P Capital IQ Pro; peer data as of Q2 2026 15. Forward curve as of September 17, 2026 Appendix // Footnotes
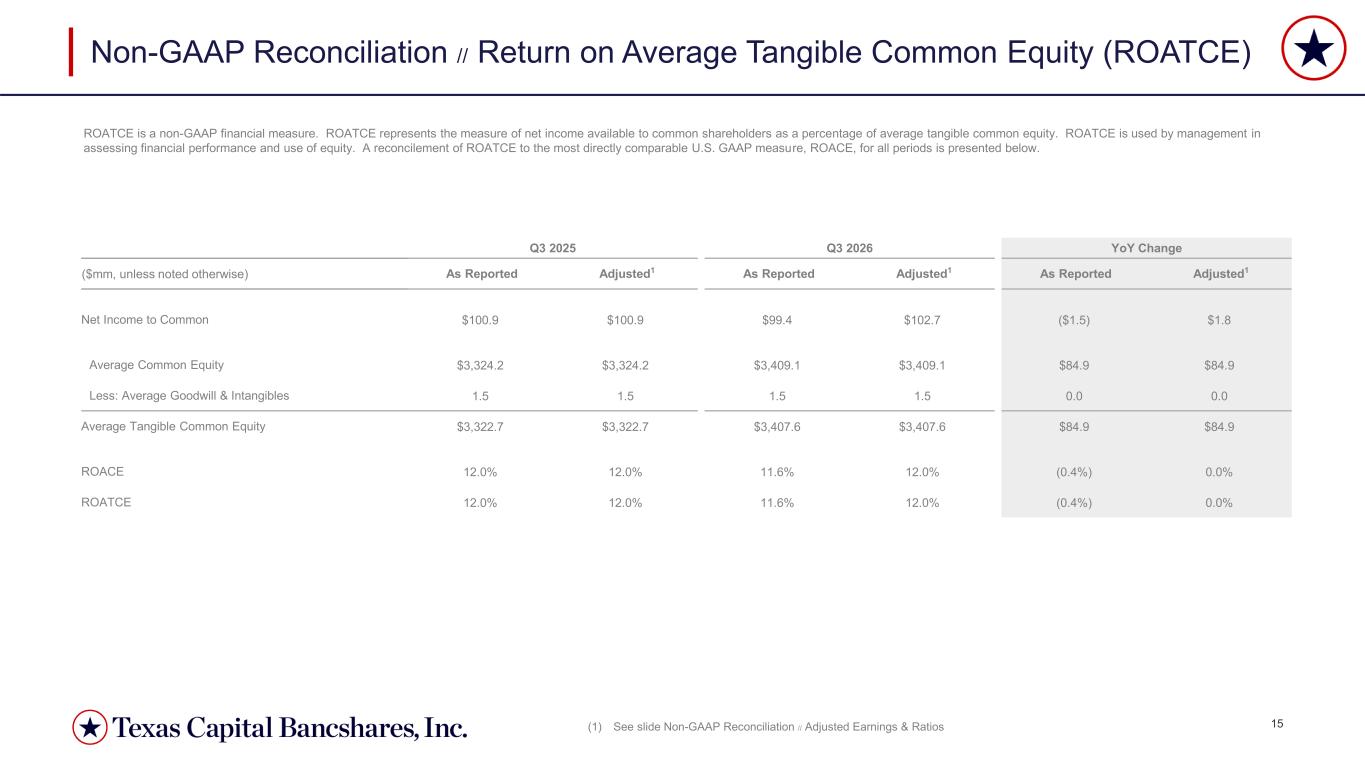
15 Non-GAAP Reconciliation // Return on Average Tangible Common Equity (ROATCE) ROATCE is a non-GAAP financial measure. ROATCE represents the measure of net income available to common shareholders as a percentage of average tangible common equity. ROATCE is used by management in assessing financial performance and use of equity. A reconcilement of ROATCE to the most directly comparable U.S. GAAP measure, ROACE, for all periods is presented below. (1) See slide Non-GAAP Reconciliation // Adjusted Earnings & Ratios Q3 2025 Q3 2026 YoY Change ($mm, unless noted otherwise) As Reported Adjusted1 As Reported Adjusted1 As Reported Adjusted1 Net Income to Common $100.9 $100.9 $99.4 $102.7 ($1.5) $1.8 Average Common Equity $3,324.2 $3,324.2 $3,409.1 $3,409.1 $84.9 $84.9 Less: Average Goodwill & Intangibles 1.5 1.5 1.5 1.5 0.0 0.0 Average Tangible Common Equity $3,322.7 $3,322.7 $3,407.6 $3,407.6 $84.9 $84.9 ROACE 12.0% 12.0% 11.6% 12.0% (0.4%) 0.0% ROATCE 12.0% 12.0% 11.6% 12.0% (0.4%) 0.0%
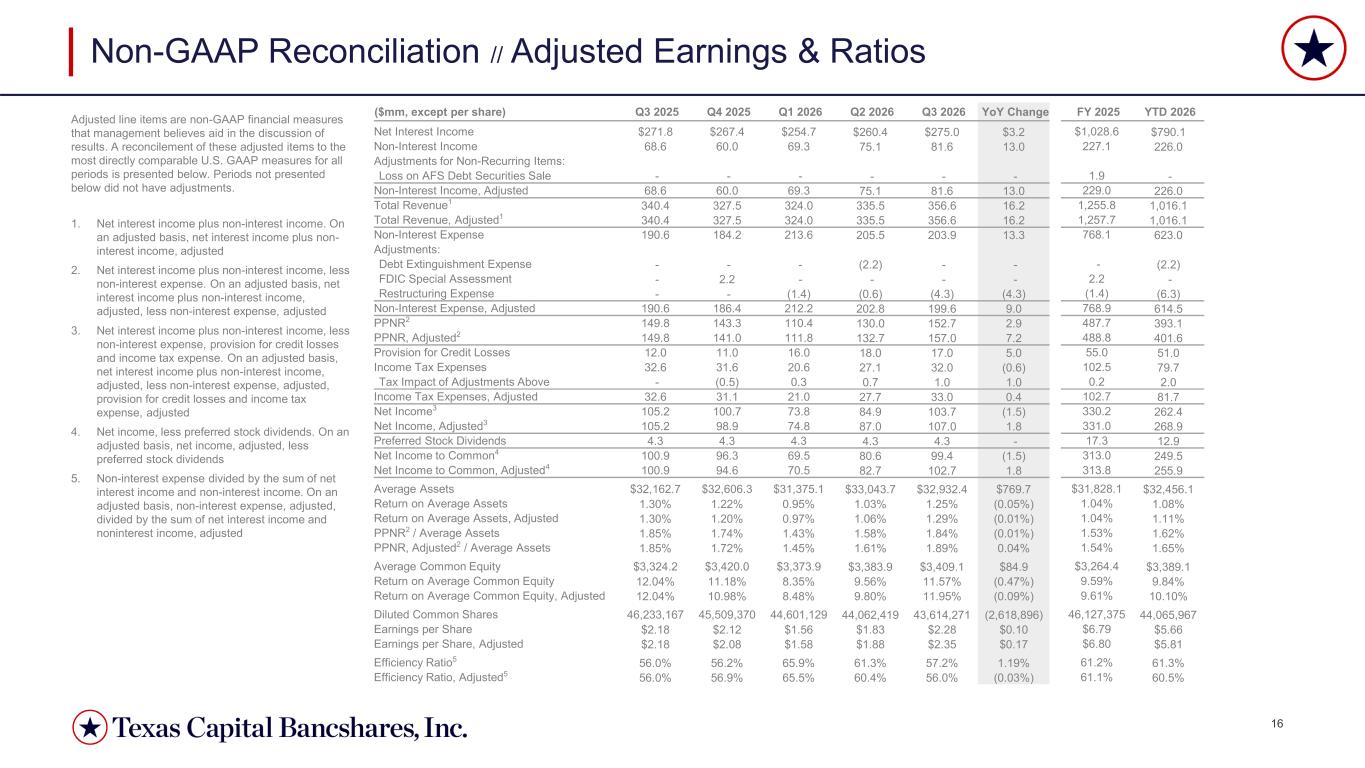
16 Non-GAAP Reconciliation // Adjusted Earnings & Ratios ($mm, except per share) Q3 2025 Q4 2025 Q1 2026 Q2 2026 Q3 2026 YoY Change FY 2025 YTD 2026 Net Interest Income $271.8 $267.4 $254.7 $260.4 $275.0 $3.2 $1,028.6 $790.1 Non-Interest Income 68.6 60.0 69.3 75.1 81.6 13.0 227.1 226.0 Adjustments for Non-Recurring Items: Loss on AFS Debt Securities Sale - - - - - - 1.9 - Non-Interest Income, Adjusted 68.6 60.0 69.3 75.1 81.6 13.0 229.0 226.0 Total Revenue1 340.4 327.5 324.0 335.5 356.6 16.2 1,255.8 1,016.1 Total Revenue, Adjusted1 340.4 327.5 324.0 335.5 356.6 16.2 1,257.7 1,016.1 Non-Interest Expense 190.6 184.2 213.6 205.5 203.9 13.3 768.1 623.0 Adjustments: Debt Extinguishment Expense - - - (2.2) - - - (2.2) FDIC Special Assessment - 2.2 - - - - 2.2 - Restructuring Expense - - (1.4) (0.6) (4.3) (4.3) (1.4) (6.3) Non-Interest Expense, Adjusted 190.6 186.4 212.2 202.8 199.6 9.0 768.9 614.5 PPNR2 149.8 143.3 110.4 130.0 152.7 2.9 487.7 393.1 PPNR, Adjusted2 149.8 141.0 111.8 132.7 157.0 7.2 488.8 401.6 Provision for Credit Losses 12.0 11.0 16.0 18.0 17.0 5.0 55.0 51.0 Income Tax Expenses 32.6 31.6 20.6 27.1 32.0 (0.6) 102.5 79.7 Tax Impact of Adjustments Above - (0.5) 0.3 0.7 1.0 1.0 0.2 2.0 Income Tax Expenses, Adjusted 32.6 31.1 21.0 27.7 33.0 0.4 102.7 81.7 Net Income3 105.2 100.7 73.8 84.9 103.7 (1.5) 330.2 262.4 Net Income, Adjusted3 105.2 98.9 74.8 87.0 107.0 1.8 331.0 268.9 Preferred Stock Dividends 4.3 4.3 4.3 4.3 4.3 - 17.3 12.9 Net Income to Common4 100.9 96.3 69.5 80.6 99.4 (1.5) 313.0 249.5 Net Income to Common, Adjusted4 100.9 94.6 70.5 82.7 102.7 1.8 313.8 255.9 Average Assets $32,162.7 $32,606.3 $31,375.1 $33,043.7 $32,932.4 $769.7 $31,828.1 $32,456.1 Return on Average Assets 1.30% 1.22% 0.95% 1.03% 1.25% (0.05%) 1.04% 1.08% Return on Average Assets, Adjusted 1.30% 1.20% 0.97% 1.06% 1.29% (0.01%) 1.04% 1.11% PPNR2 / Average Assets 1.85% 1.74% 1.43% 1.58% 1.84% (0.01%) 1.53% 1.62% PPNR, Adjusted2 / Average Assets 1.85% 1.72% 1.45% 1.61% 1.89% 0.04% 1.54% 1.65% Average Common Equity $3,324.2 $3,420.0 $3,373.9 $3,383.9 $3,409.1 $84.9 $3,264.4 $3,389.1 Return on Average Common Equity 12.04% 11.18% 8.35% 9.56% 11.57% (0.47%) 9.59% 9.84% Return on Average Common Equity, Adjusted 12.04% 10.98% 8.48% 9.80% 11.95% (0.09%) 9.61% 10.10% Diluted Common Shares 46,233,167 45,509,370 44,601,129 44,062,419 43,614,271 (2,618,896) 46,127,375 44,065,967 Earnings per Share $2.18 $2.12 $1.56 $1.83 $2.28 $0.10 $6.79 $5.66 Earnings per Share, Adjusted $2.18 $2.08 $1.58 $1.88 $2.35 $0.17 $6.80 $5.81 Efficiency Ratio5 56.0% 56.2% 65.9% 61.3% 57.2% 1.19% 61.2% 61.3% Efficiency Ratio, Adjusted5 56.0% 56.9% 65.5% 60.4% 56.0% (0.03%) 61.1% 60.5% Adjusted line items are non-GAAP financial measures that management believes aid in the discussion of results. A reconcilement of these adjusted items to the most directly comparable U.S. GAAP measures for all periods is presented below. Periods not presented below did not have adjustments. 1. Net interest income plus non-interest income. On an adjusted basis, net interest income plus non- interest income, adjusted 2. Net interest income plus non-interest income, less non-interest expense. On an adjusted basis, net interest income plus non-interest income, adjusted, less non-interest expense, adjusted 3. Net interest income plus non-interest income, less non-interest expense, provision for credit losses and income tax expense. On an adjusted basis, net interest income plus non-interest income, adjusted, less non-interest expense, adjusted, provision for credit losses and income tax expense, adjusted 4. Net income, less preferred stock dividends. On an adjusted basis, net income, adjusted, less preferred stock dividends 5. Non-interest expense divided by the sum of net interest income and non-interest income. On an adjusted basis, non-interest expense, adjusted, divided by the sum of net interest income and noninterest income, adjusted