v3.26.3
Pay vs Performance Disclosure - USD ($)
12 Months Ended
Jul. 31, 2026
Jul. 31, 2025
Jul. 31, 2024
Jul. 31, 2023
Jul. 31, 2022
Pay vs Performance Disclosure          
Pay vs Performance Disclosure, Table

Pay Versus Performance

In accordance with Item 402(v) of Regulation S-K, below is a comparison of compensation actually paid (“CAP”) and certain measures of financial performance. For further information concerning our compensation philosophy and how we align executive compensation with performance, refer to the “Executive Compensation – Compensation Discussion and Analysis” section.


Value of Initial Fixed $100
Investment Based On:


Fiscal
Year
(a)

SCT Total
for
PEO
(1)
(b)($)


CAP for
PEO
(2,6)
(c)($)


Avg. SCT
Total for
Non-PEO
NEOs
(1)
(d)($)


Avg.
CAP for
Non-PEO
NEOs
(6)
(e)($)


Total
Shareholder
Return
(3)
(f)($)


Peer Group
Total
Shareholder
Return
(3)
(g)($)


Net Income
(Loss)
(4)
(in thousands)
(h)($)


Company
Selected
Measure:
Annual
Recurring
Revenue
(5)
(in thousands)
(i)($)


 2026


29,485,213


(21,689,934

)


8,467,595


3,046,819


164


243


1,506,837


2,548,797


 2025


22,569,085


73,382,443


4,564,564


4,685,324


209


187


188,366


2,223,197


 2024


51,143,711


97,948,820


4,810,466


8,792,715


140


151


(124,775

)


1,907,982


 2023


14,845,940


38,679,011


5,475,467


11,092,941


84


112


(254,560

)


1,561,981


 2022


12,928,676


3,241,068


4,990,357


(2,699,520

)


42


88


(798,946

)


1,202,438


(1)
Total compensation as set forth in the “Executive Compensation – Executive Compensation Tables – Fiscal Year 2026 Summary Compensation Table” (“SCT”) above. The individuals comprising the PEO and Non-PEO NEOs for each year are listed in the table below.


Name

2022

2023

2024

2025

2026


PEO


Rajiv Ramaswami


Non-PEO NEOs


Rukmini Sivaraman


Brian Martin


Tarkan Maner


David Sangster


Tyler Wall


Duston Williams


(2)
For each covered year, the values included in column (c) for the CAP to our PEO and in column (e) for the average CAP to our non-PEO NEOs reflect the adjustments set forth below. CAP does not mean these amounts were earned or paid during the year. CAP is an amount derived from the starting point of total compensation as presented in the SCT under the methodology prescribed under the SEC’s rules, which is solely based on adjustments to equity award values. Nutanix does not maintain a pension plan and has not paid dividends on its common stock, so no adjustments for these factors were necessary. There are no material differences between the assumptions used to compute the valuation of the equity awards for calculating the CAP from the assumptions used to compute the valuation of the equity awards as of the grant date.
(3)
Cumulative TSR represents the value of an initial fixed investment of $100 on July 31, 2021 in our company (column (f)) and the Nasdaq Computer Index (column (g)) for the fiscal years ended July 31, 2022 through 2026.
(4)
The dollar amounts reported represent the amount of net income (loss) reflected in our audited financial statements for the applicable year in accordance with accounting principles generally accepted in the United States.
(5)
ARR is defined as the sum of ACV for all subscription contracts from all customers in effect as of a specific period, assuming any subscription contract that expires is renewed on its existing terms. ARR excludes the value of professional services, non-portable software and support contracts and hardware sales. For the purposes of this calculation, we generally assume that the contract term begins on the date when the software is made available to the customer. ACV is defined as the total annualized value of a contract. The total annualized value for a contract is calculated by dividing the total value of the contract by the number of years in the term of such contract. Beginning in fiscal year 2026, our methodology for calculating ARR was updated to align more closely with the timing of when licenses are made available to customers. We have not updated ARR for any prior periods.
(6)
The table below shows the adjustments made to the SCT totals (columns (b) and (d) above) for our PEO and average for non-PEO NEOs to determine CAP for fiscal year 2026 (columns (c) and (e) above).


PEO
($)


Average for
Non-PEO
NEOs
($)


Summary Compensation Table - Total Compensation (columns (b) and (d))


29,485,213


8,467,595


-


Grant Date Fair Value of Stock Awards and Option Awards Granted in Fiscal Year


(27,883,613

)


(7,578,558

)


+


Fair Value at Fiscal Year-End of Outstanding and Unvested Stock Awards and Option Awards Granted in Fiscal Year


19,628,756


5,334,957


+


Change in Fair Value of Outstanding and Unvested Stock Awards and Option Awards Granted in Prior Fiscal Years


(41,413,046

)


(2,810,819

)


+


Fair Value at Vesting of Stock Awards and Option Awards Granted in Fiscal Year That Vested During Fiscal Year


1,204,854


327,448


+


Change in Fair Value as of Vesting Date of Stock Awards and Option Awards Granted in Prior Fiscal Years For Which Applicable Vesting Conditions Were Satisfied During Fiscal Year


(2,712,097

)


(693,803

)


-


Fair Value as of Prior Fiscal Year-End of Stock Awards and Option Awards Granted in Prior Fiscal Years That Failed to Meet Applicable Vesting Conditions During Fiscal Year


—


—


=


Compensation Actually Paid (columns (c) and (e))


(21,689,934

)


3,046,819


Company Selected Measure Name AnnualRecurringRevenue        
Named Executive Officers, Footnote
(1)
Total compensation as set forth in the “Executive Compensation – Executive Compensation Tables – Fiscal Year 2026 Summary Compensation Table” (“SCT”) above. The individuals comprising the PEO and Non-PEO NEOs for each year are listed in the table below.


Name

2022

2023

2024

2025

2026


PEO


Rajiv Ramaswami


Non-PEO NEOs


Rukmini Sivaraman


Brian Martin


Tarkan Maner


David Sangster


Tyler Wall


Duston Williams


PEO Total Compensation Amount $ 29,485,213 $ 22,569,085 $ 51,143,711 $ 14,845,940 $ 12,928,676
PEO Actually Paid Compensation Amount $ (21,689,934) 73,382,443 97,948,820 38,679,011 3,241,068
Adjustment To PEO Compensation, Footnote
(6)
The table below shows the adjustments made to the SCT totals (columns (b) and (d) above) for our PEO and average for non-PEO NEOs to determine CAP for fiscal year 2026 (columns (c) and (e) above).


PEO
($)


Average for
Non-PEO
NEOs
($)


Summary Compensation Table - Total Compensation (columns (b) and (d))


29,485,213


8,467,595


-


Grant Date Fair Value of Stock Awards and Option Awards Granted in Fiscal Year


(27,883,613

)


(7,578,558

)


+


Fair Value at Fiscal Year-End of Outstanding and Unvested Stock Awards and Option Awards Granted in Fiscal Year


19,628,756


5,334,957


+


Change in Fair Value of Outstanding and Unvested Stock Awards and Option Awards Granted in Prior Fiscal Years


(41,413,046

)


(2,810,819

)


+


Fair Value at Vesting of Stock Awards and Option Awards Granted in Fiscal Year That Vested During Fiscal Year


1,204,854


327,448


+


Change in Fair Value as of Vesting Date of Stock Awards and Option Awards Granted in Prior Fiscal Years For Which Applicable Vesting Conditions Were Satisfied During Fiscal Year


(2,712,097

)


(693,803

)


-


Fair Value as of Prior Fiscal Year-End of Stock Awards and Option Awards Granted in Prior Fiscal Years That Failed to Meet Applicable Vesting Conditions During Fiscal Year


—


—


=


Compensation Actually Paid (columns (c) and (e))


(21,689,934

)


3,046,819


Non-PEO NEO Average Total Compensation Amount $ 8,467,595 4,564,564 4,810,466 5,475,467 4,990,357
Non-PEO NEO Average Compensation Actually Paid Amount $ 3,046,819 4,685,324 8,792,715 11,092,941 (2,699,520)
Adjustment to Non-PEO NEO Compensation Footnote
(6)
The table below shows the adjustments made to the SCT totals (columns (b) and (d) above) for our PEO and average for non-PEO NEOs to determine CAP for fiscal year 2026 (columns (c) and (e) above).


PEO
($)


Average for
Non-PEO
NEOs
($)


Summary Compensation Table - Total Compensation (columns (b) and (d))


29,485,213


8,467,595


-


Grant Date Fair Value of Stock Awards and Option Awards Granted in Fiscal Year


(27,883,613

)


(7,578,558

)


+


Fair Value at Fiscal Year-End of Outstanding and Unvested Stock Awards and Option Awards Granted in Fiscal Year


19,628,756


5,334,957


+


Change in Fair Value of Outstanding and Unvested Stock Awards and Option Awards Granted in Prior Fiscal Years


(41,413,046

)


(2,810,819

)


+


Fair Value at Vesting of Stock Awards and Option Awards Granted in Fiscal Year That Vested During Fiscal Year


1,204,854


327,448


+


Change in Fair Value as of Vesting Date of Stock Awards and Option Awards Granted in Prior Fiscal Years For Which Applicable Vesting Conditions Were Satisfied During Fiscal Year


(2,712,097

)


(693,803

)


-


Fair Value as of Prior Fiscal Year-End of Stock Awards and Option Awards Granted in Prior Fiscal Years That Failed to Meet Applicable Vesting Conditions During Fiscal Year


—


—


=


Compensation Actually Paid (columns (c) and (e))


(21,689,934

)


3,046,819


Compensation Actually Paid vs. Total Shareholder Return

Relationship Between CAP and TSR

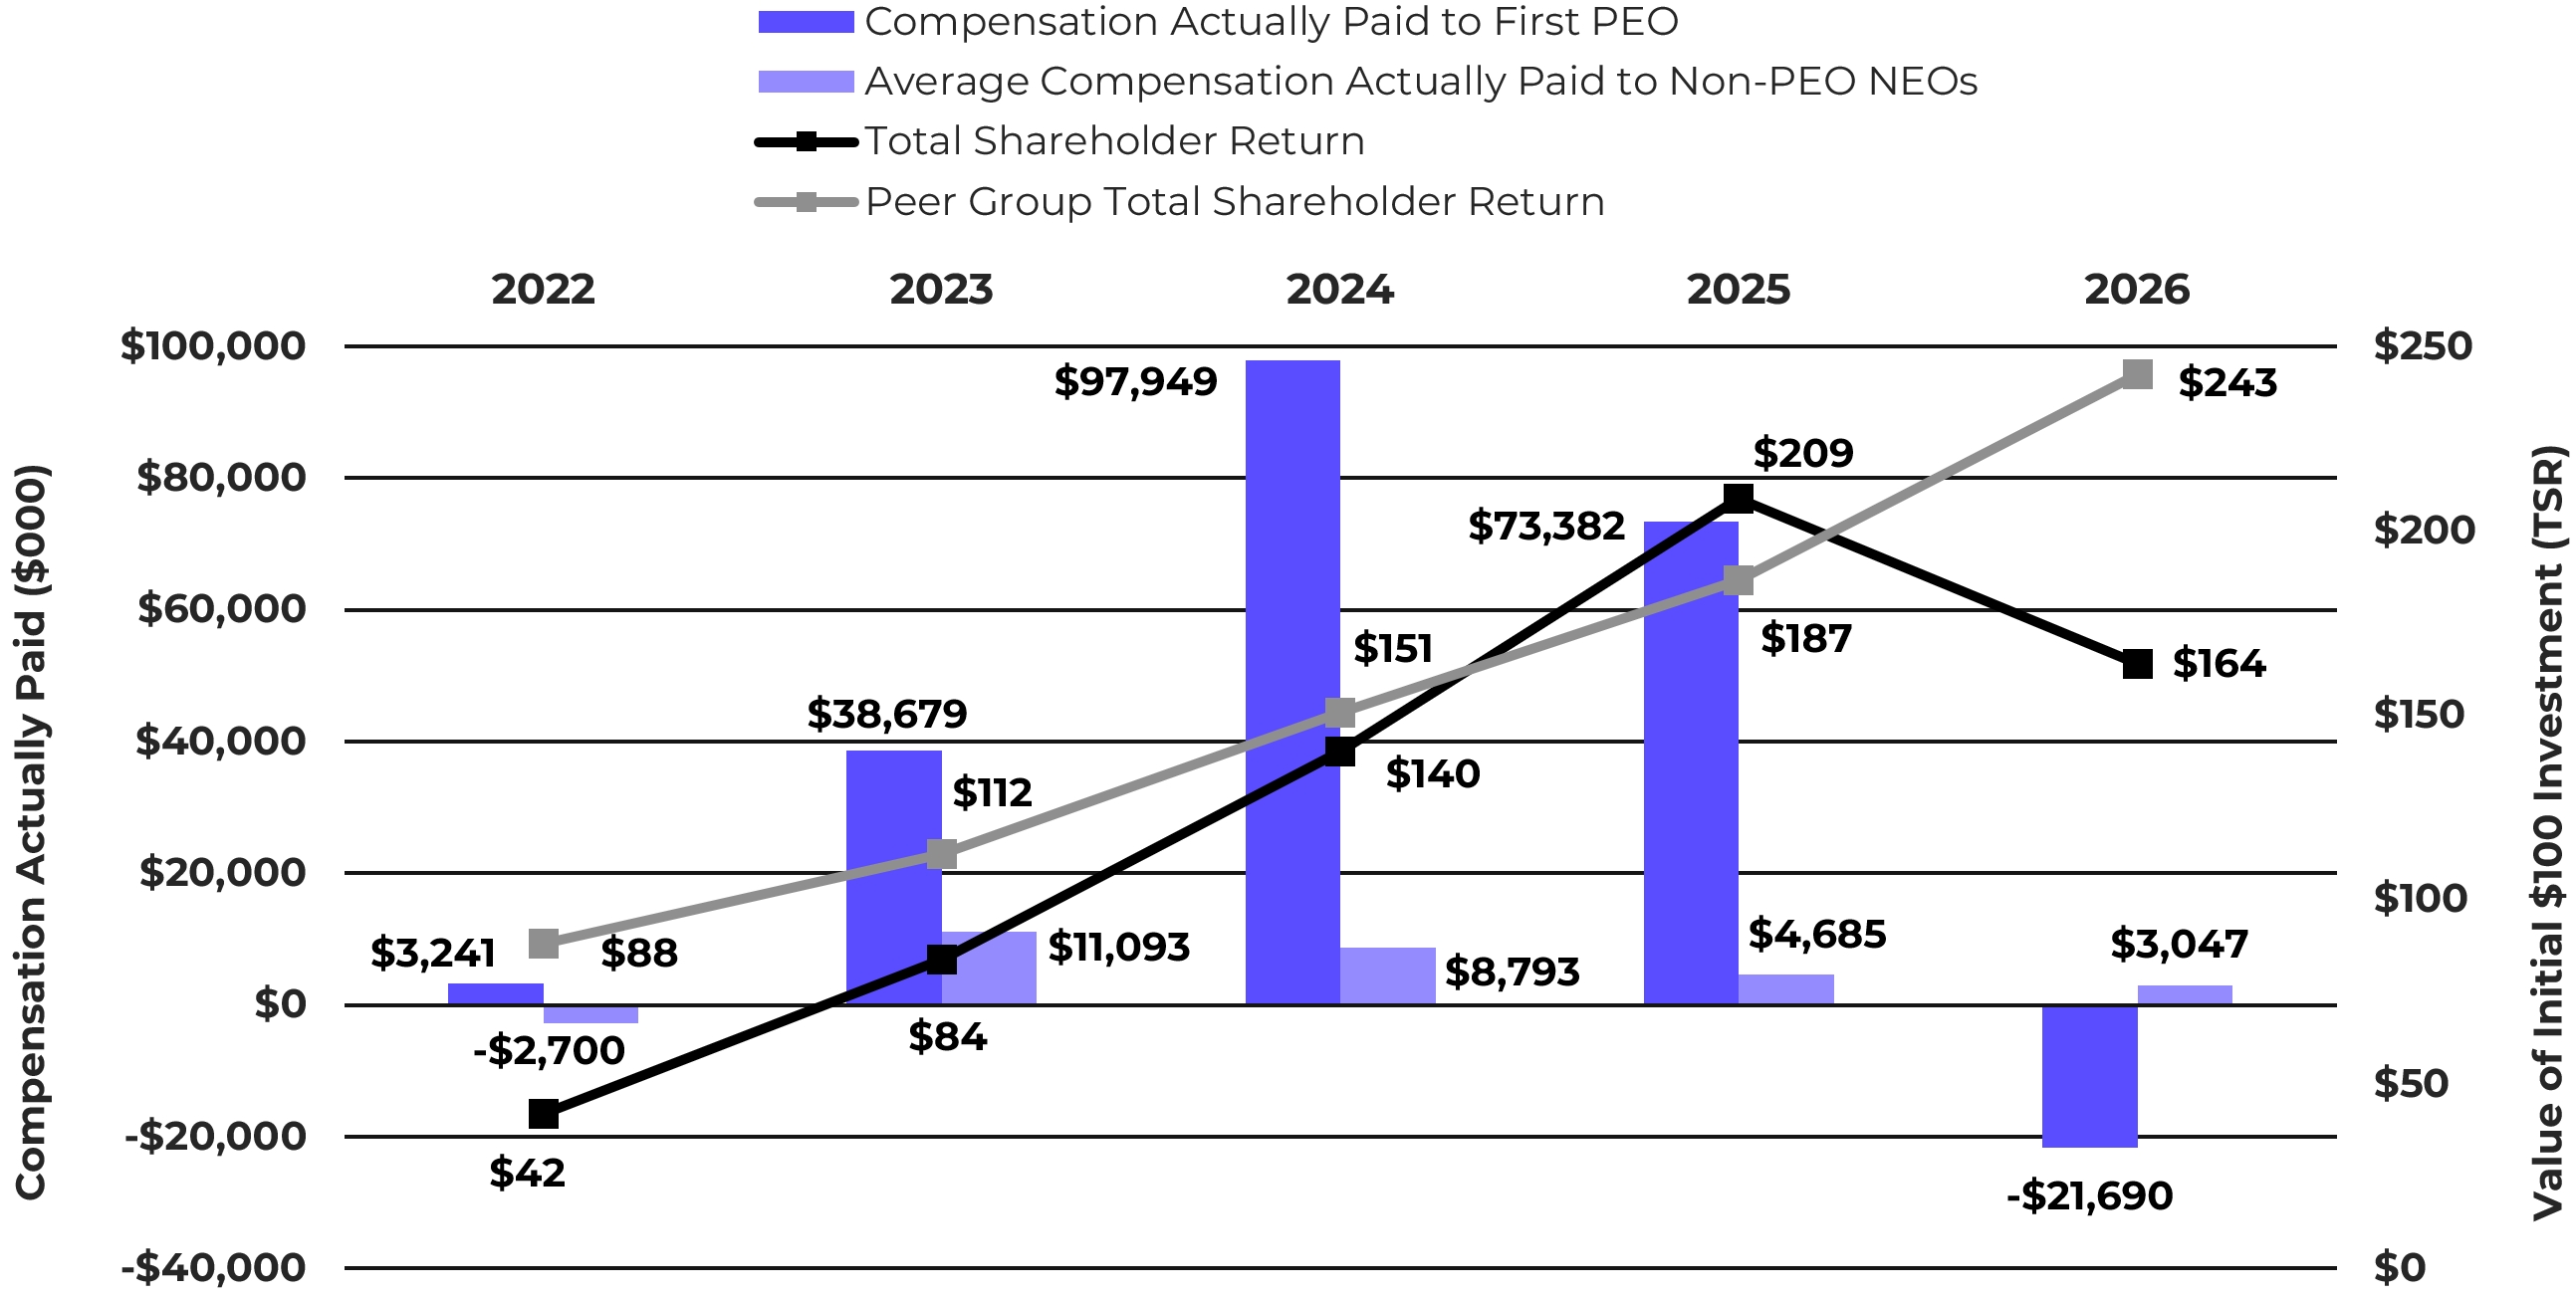
The chart below (i) illustrates the relationship between the amount of CAP to our PEO, the average amount of CAP to our non-PEO NEOs, and our company’s cumulative TSR over the five most recently completed fiscal years; and (ii) compares our cumulative TSR over the five most recently completed fiscal years to that of the Nasdaq Computer Index.

Compensation Actually Paid vs. TSR
 

img101283759_103.jpg

       
Compensation Actually Paid vs. Net Income

Relationship Between CAP and Net Income

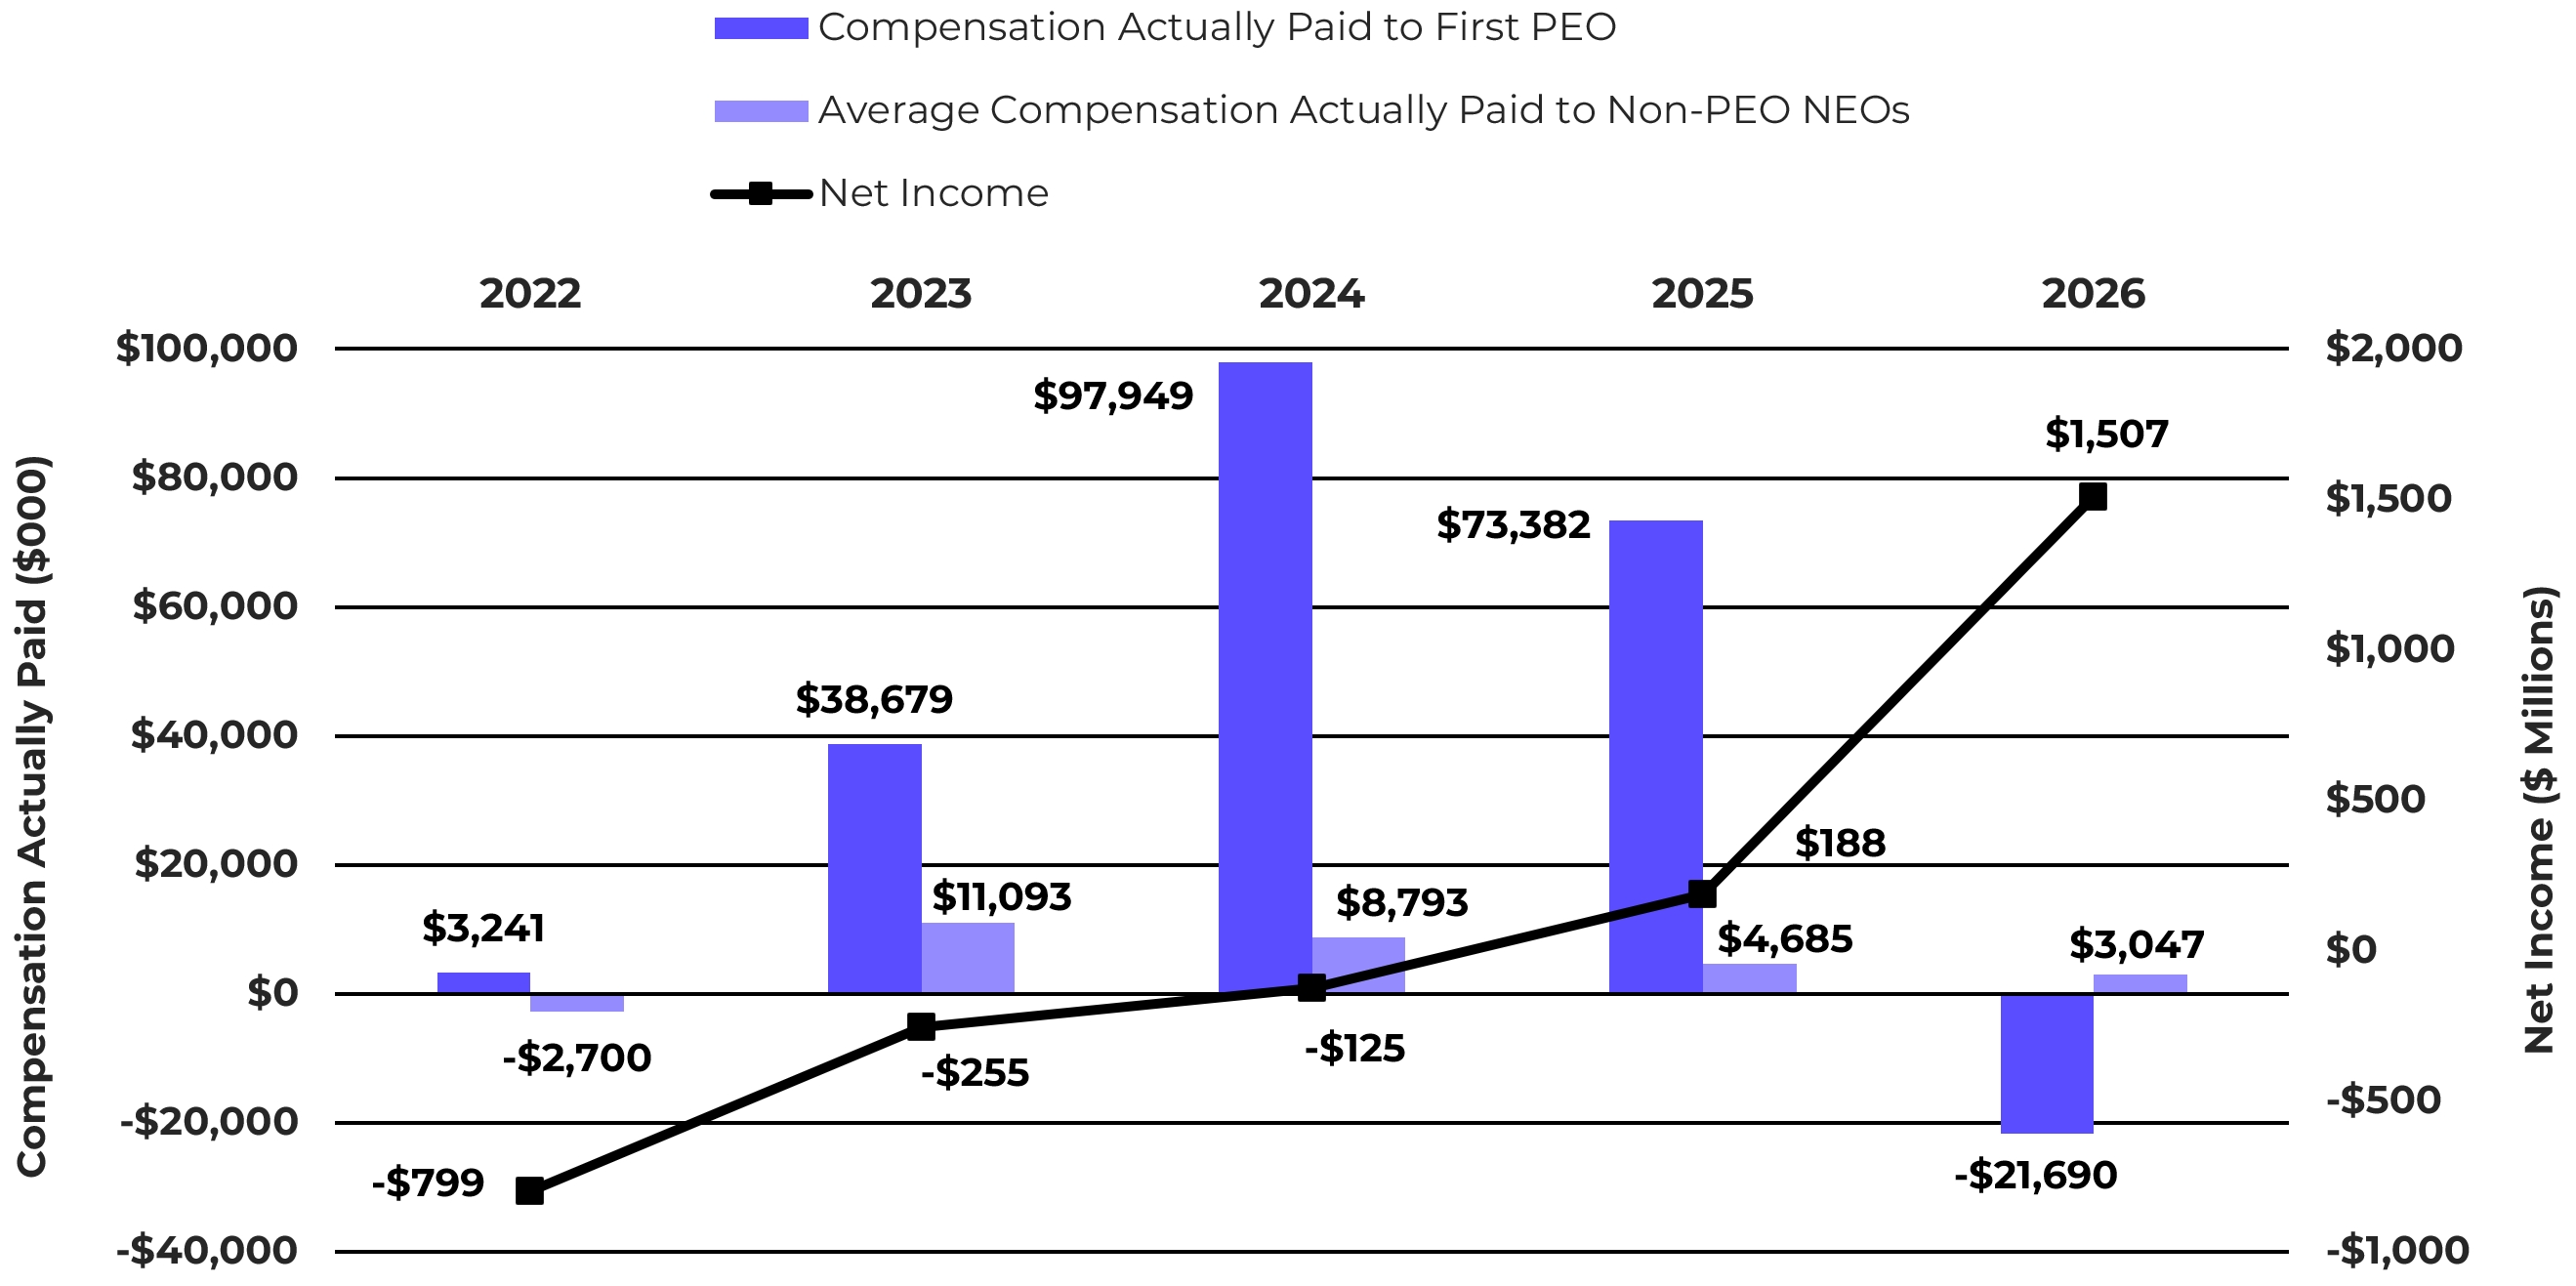
The chart below illustrates the CAP to our PEO, the average CAP to our non-PEO NEOs, and our reported GAAP net income for each of the five most recently completed fiscal years.

Compensation Actually Paid vs. Net Income
 

img101283759_104.jpg

       
Compensation Actually Paid vs. Company Selected Measure

Relationship Between CAP and ARR

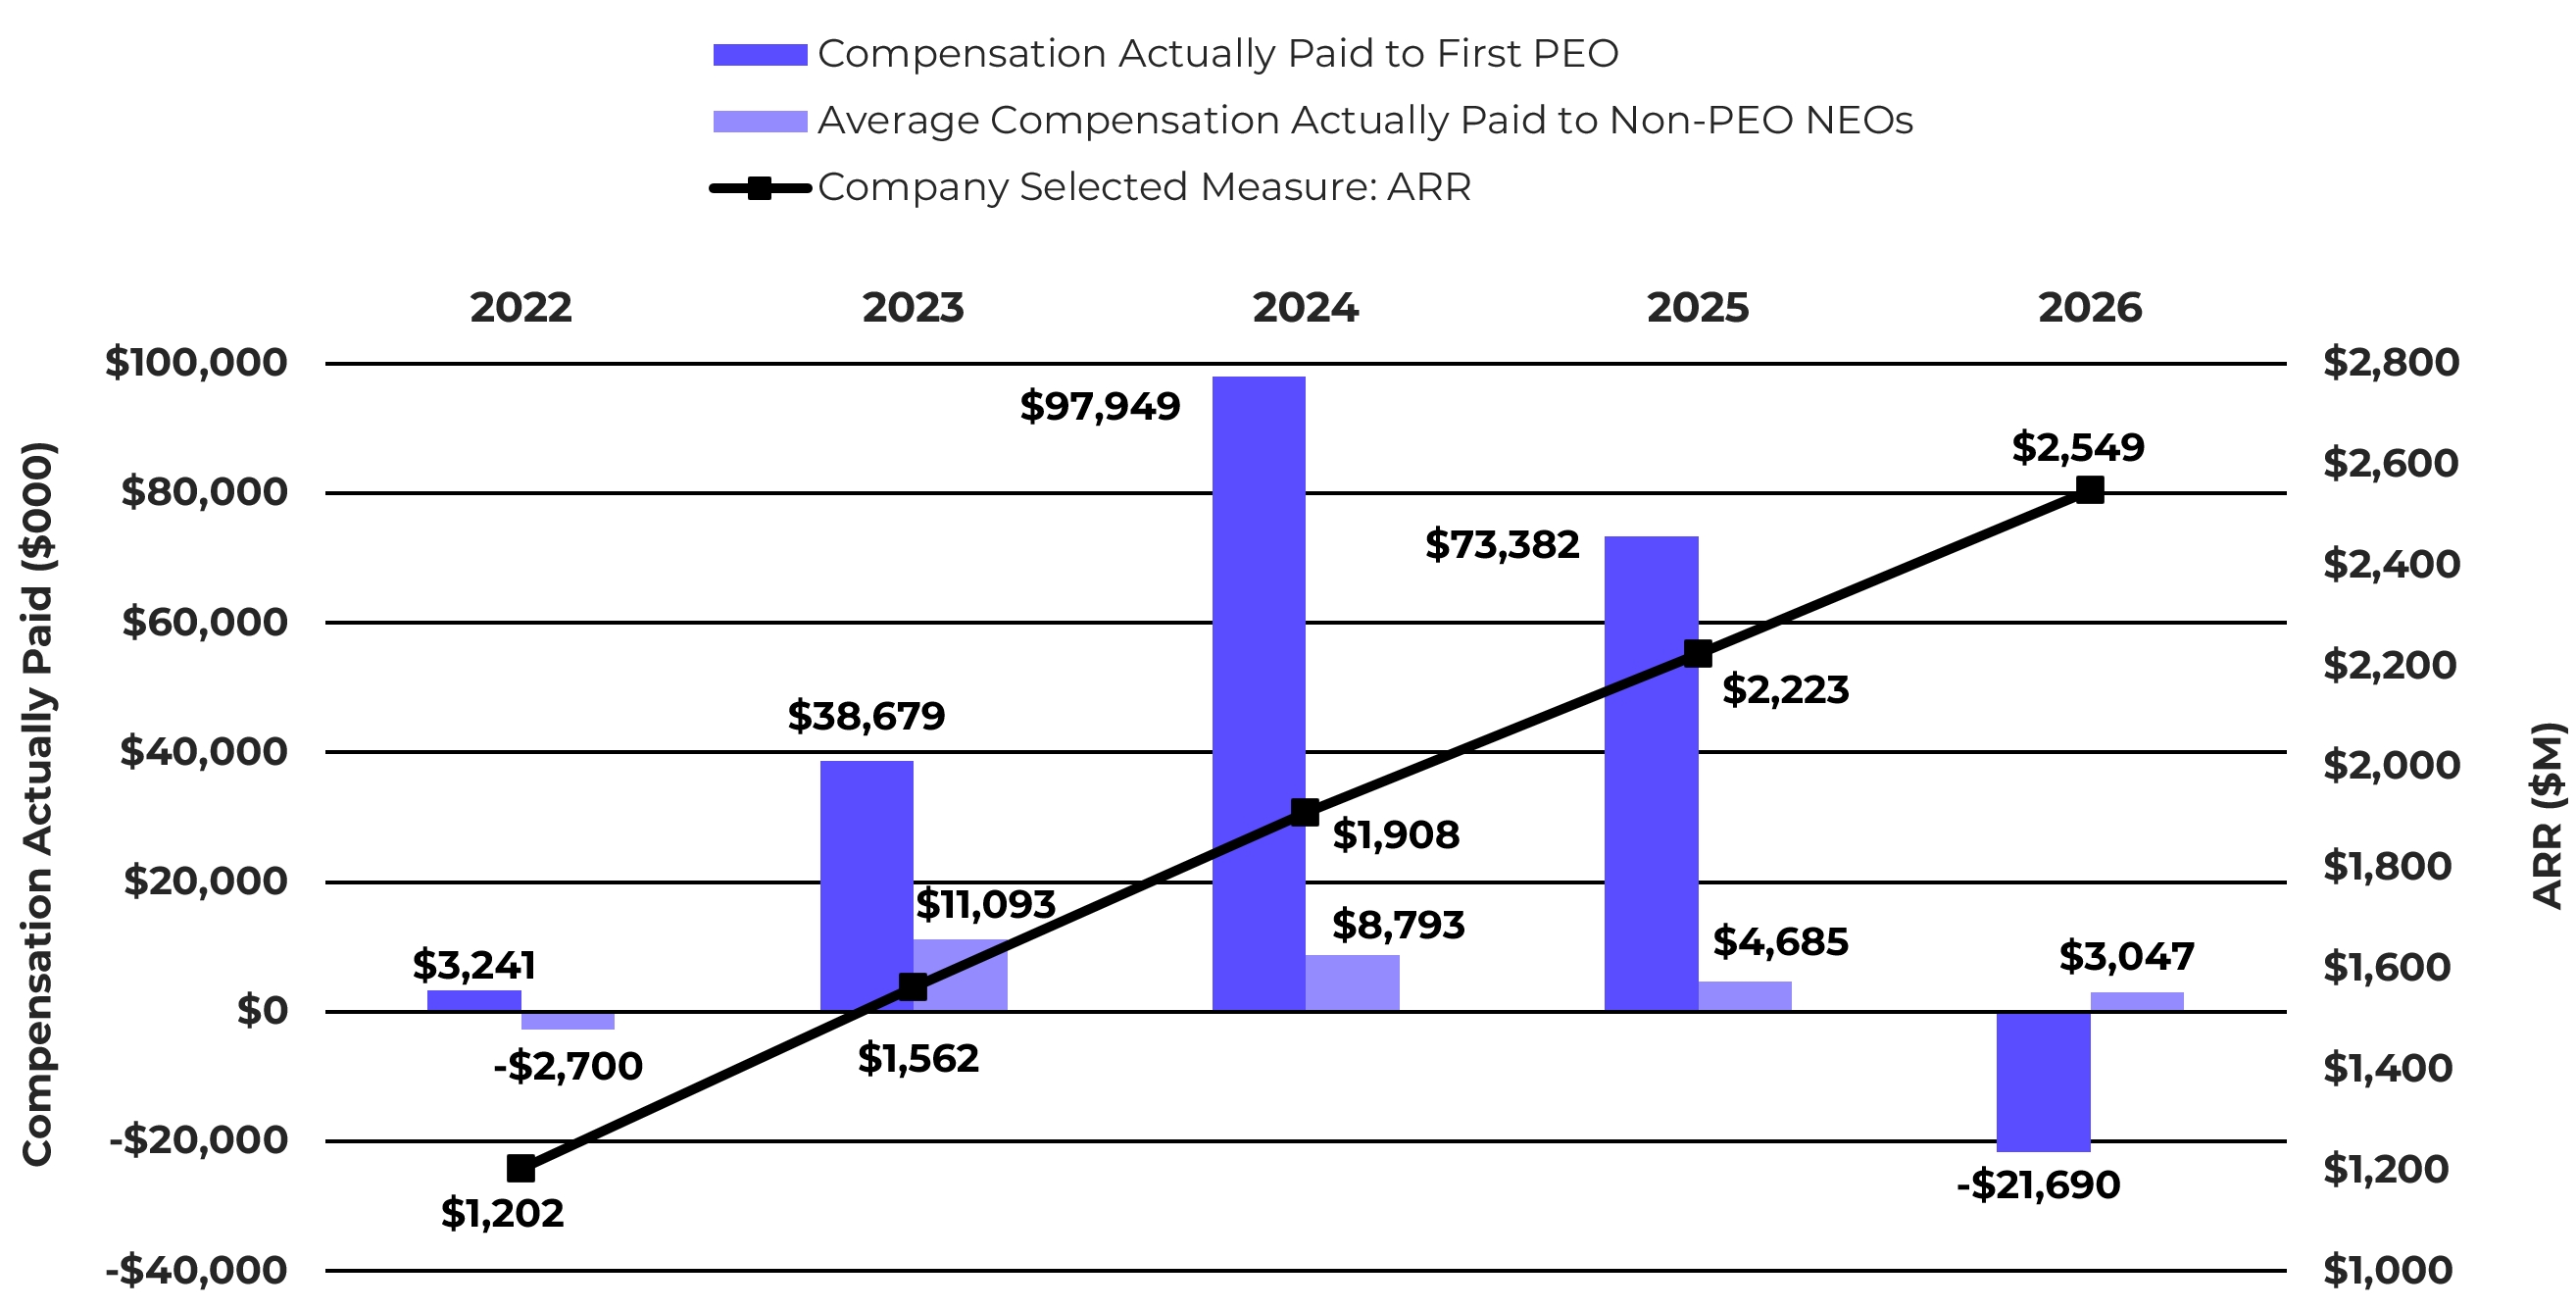
The chart below illustrates the CAP to our PEO, the average CAP to our non-PEO NEOs, and our reported ARR for each of the five most recently completed fiscal years.

Compensation Actually Paid vs. ARR
 

img101283759_105.jpg

       
Tabular List, Table

Tabular List of Most Important Performance Measures

ARR

Non-GAAP Operating Income

Relative Total Shareholder Return

       
Total Shareholder Return Amount $ 164 209 140 84 42
Peer Group Total Shareholder Return Amount 243 187 151 112 88
Net Income (Loss) $ 1,506,837,000 $ 188,366,000 $ (124,775,000) $ (254,560,000) $ (798,946,000)
Company Selected Measure Amount 2,548,797,000 2,223,197,000 1,907,982,000 1,561,981,000 1,202,438,000
PEO Name Rajiv Ramaswami Rajiv Ramaswami Rajiv Ramaswami Rajiv Ramaswami Rajiv Ramaswami
Measure:: 1          
Pay vs Performance Disclosure          
Name ARR        
Non-GAAP Measure Description
(5)
ARR is defined as the sum of ACV for all subscription contracts from all customers in effect as of a specific period, assuming any subscription contract that expires is renewed on its existing terms. ARR excludes the value of professional services, non-portable software and support contracts and hardware sales. For the purposes of this calculation, we generally assume that the contract term begins on the date when the software is made available to the customer. ACV is defined as the total annualized value of a contract. The total annualized value for a contract is calculated by dividing the total value of the contract by the number of years in the term of such contract. Beginning in fiscal year 2026, our methodology for calculating ARR was updated to align more closely with the timing of when licenses are made available to customers. We have not updated ARR for any prior periods.
       
Measure:: 2          
Pay vs Performance Disclosure          
Name Non-GAAP Operating Income        
Measure:: 3          
Pay vs Performance Disclosure          
Name Relative Total Shareholder Return        
PEO | Aggregate Grant Date Fair Value of Equity Award Amounts Reported in Summary Compensation Table          
Pay vs Performance Disclosure          
Adjustment to Compensation, Amount $ (27,883,613)        
PEO | Year-end Fair Value of Equity Awards Granted in Covered Year that are Outstanding and Unvested          
Pay vs Performance Disclosure          
Adjustment to Compensation, Amount 19,628,756        
PEO | Year-over-Year Change in Fair Value of Equity Awards Granted in Prior Years That are Outstanding and Unvested          
Pay vs Performance Disclosure          
Adjustment to Compensation, Amount (41,413,046)        
PEO | Vesting Date Fair Value of Equity Awards Granted and Vested in Covered Year          
Pay vs Performance Disclosure          
Adjustment to Compensation, Amount 1,204,854        
PEO | Change in Fair Value as of Vesting Date of Prior Year Equity Awards Vested in Covered Year          
Pay vs Performance Disclosure          
Adjustment to Compensation, Amount (2,712,097)        
Non-PEO NEO | Aggregate Grant Date Fair Value of Equity Award Amounts Reported in Summary Compensation Table          
Pay vs Performance Disclosure          
Adjustment to Compensation, Amount (7,578,558)        
Non-PEO NEO | Year-end Fair Value of Equity Awards Granted in Covered Year that are Outstanding and Unvested          
Pay vs Performance Disclosure          
Adjustment to Compensation, Amount 5,334,957        
Non-PEO NEO | Year-over-Year Change in Fair Value of Equity Awards Granted in Prior Years That are Outstanding and Unvested          
Pay vs Performance Disclosure          
Adjustment to Compensation, Amount (2,810,819)        
Non-PEO NEO | Vesting Date Fair Value of Equity Awards Granted and Vested in Covered Year          
Pay vs Performance Disclosure          
Adjustment to Compensation, Amount 327,448        
Non-PEO NEO | Change in Fair Value as of Vesting Date of Prior Year Equity Awards Vested in Covered Year          
Pay vs Performance Disclosure          
Adjustment to Compensation, Amount $ (693,803)