Pay vs Performance Disclosure - USD ($)
Jun. 26, 2026
Jun. 27, 2025
Jun. 28, 2024
Jun. 30, 2023
Jun. 24, 2022
Pay Versus Performance
As required by Section 952(a) of the Dodd-Frank Wall Street Reform and Consumer Protection Act and Item 402(v) of Regulation S-K under the Securities Exchange Act of 1934, as amended, we are providing the following information about the relationship between executive “compensation actually paid” and certain measures of company performance for each of the last three completed fiscal years. The material that follows is provided in compliance with these rules. For information on how the Compensation Committee seeks to align pay with performance when making compensation decisions,
please review “Executive Compensation—Compensation Discussion and Analysis” above.
In determining the “compensation actually paid” (CAP) to our Named Officers (NEOs), we are required to make various adjustments to amounts that have been previously reported in the Summary Compensation Table as the SEC’s rules for this disclosure differ from those required in the Summary Compensation Table. For our NEOs other than our principal executive officer (PEO), amounts disclosed are reported as an average.
Pay Versus Performance Table
Fiscal Year(1) | Summary Compensation Table Total for PEO ($)(2) | Compensation Actually Paid to PEO ($)(3) | Average Summary Compensation Table Total for Non-PEO NEOs ($)(4) | Average Compensation Actually Paid to Non-PEO NEOs ($)(5) | Value of Initial Fixed $100 Investment Based On: | Net Income ($)(8) | Company Selected Measure (Revenue) ($)(9) | |||||||||||||||||||
Total Shareholder Return($)(6) | Peer Group Total Shareholder Return($)(7) | |||||||||||||||||||||||||
2026 | 13,602,449 | 31,426,383 | 6,018,919 | 13,312,881 | 550.73 | 104.63 | 473,027,000 | 4,641,097,000 | ||||||||||||||||||
2025 | 11,944,135 | 14,317,231 | 6,060,873 | 7,075,117 | 310.23 | 95.17 | 332,527,000 | 3,419,327,000 | ||||||||||||||||||
2024 | 11,082,191 | 22,024,695 | 5,460,058 | 10,114,716 | 256.89 | 74.29 | 296,181,000 | 2,882,967,000 | ||||||||||||||||||
2023 | 10,527,608 | 16,428,208 | 5,203,532 | 7,754,768 | 136.30 | 75.34 | 247,913,000 | 2,645,237,000 | ||||||||||||||||||
2022 | 9,936,955 | 7,818,062 | 4,798,154 | 3,840,220 | 87.32 | 74.55 | 200,380,000 | 2,262,224,000 | ||||||||||||||||||
(1) | The following table shows our PEO and non-PEO NEOs for each of the reported fiscal years. |
Fiscal 2026 | Fiscal 2025 | Fiscal 2024 | Fiscal 2023 | Fiscal 2022 | |||||||||||||
PEO | Seamus Grady | Seamus Grady | Seamus Grady | Seamus Grady | Seamus Grady | ||||||||||||
Non-PEO NEOs | Dr. Harpal Gill | Dr. Harpal Gill | Dr. Harpal Gill | Dr. Harpal Gill | Dr. Harpal Gill | ||||||||||||
Csaba Sverha | Csaba Sverha | Csaba Sverha | Csaba Sverha | Csaba Sverha | |||||||||||||
Edward T. Archer | Edward T. Archer | Edward T. Archer | Edward T. Archer | Edward T. Archer | |||||||||||||
(2) | The dollar amounts reported in this column are the amounts of total compensation reported for our PEO in the “Total” column of the Summary Compensation Table for the applicable fiscal year. |
(3) | CAP does not mean that our PEO was actually paid the amounts reported in this column, but is a dollar amount derived from the starting point of total compensation reported for our PEO in the “Total” column of the Summary Compensation Table for the applicable fiscal year, as adjusted in accordance with SEC rules. For purposes of calculating CAP, the fair value of equity awards is calculated in accordance with Financial Accounting Standards Board Accounting Standards Codification Topic 718 (FASB ASC Topic 718) using the same assumption methodologies used to calculate the grant date fair value of awards for purposes of the Summary Compensation Table. In accordance with SEC rules, the following adjustments were made to determine CAP to our PEO for fiscal 2026, which consisted solely of adjustments to equity awards: |
Adjustment Table for PEO | Fiscal 2026 | ||||
Summary Compensation Table Total for PEO | $13,602,449 | ||||
Subtract grant date fair value of equity awards reported in Summary Compensation Table | (9,450,666) | ||||
Add the fair value as of the end of the covered fiscal year of equity awards granted in the covered fiscal year that are outstanding and unvested as of the end of the covered fiscal year | 17,902,161 | ||||
Adjust for the change in fair value as of the end of covered fiscal year (from the end of the prior fiscal year) of equity awards granted in prior fiscal years that are outstanding and unvested as of the end of covered fiscal year | 7,435,191 | ||||
Add, for equity awards that are granted and vest in the same covered fiscal year, the fair value as of the vesting date | — | ||||
Adjust for the change in fair value as of vesting date (from the end of the prior fiscal year) of equity awards granted in prior fiscal years for which all applicable vesting conditions were satisfied at the end of or during the covered fiscal year | 1,937,248 | ||||
Subtract, for equity awards granted in any prior fiscal year that fail to meet the applicable vesting conditions during the covered fiscal year, the fair value as of the end of prior fiscal year | — | ||||
Total Equity Adjustments (subtotal) | 17,823,934 | ||||
Compensation Actually Paid to PEO | $31,426,383 | ||||
(4) | The dollar amounts reported in this column are the average of the amounts of total compensation reported for our non-PEO NEOs in the “Total” column of the Summary Compensation Table for the applicable fiscal year. |
(5) | CAP does not mean that our non-PEO NEOs were actually paid the amounts reported in this column, but is a dollar amount derived from the starting point of the average total compensation reported for our non-PEO NEOs in the “Total” column of the Summary Compensation Table for the applicable fiscal year, as adjusted in accordance with SEC rules. For purposes of calculating CAP, the fair value of equity awards is calculated in accordance with Financial Accounting Standards Board Accounting Standards Codification Topic 718 (FASB ASC Topic 718) using the same assumption methodologies used to calculate the grant date fair value of awards for purposes of the Summary Compensation Table. In accordance with SEC rules, the following adjustments were made to determine the average CAP to our non-PEO NEOs during fiscal 2026, which consisted solely of adjustments to equity awards: |
Adjustment Table for non-PEO NEOs | Fiscal 2026 | ||||
Average Summary Compensation Table Total for non-PEO NEOS | $6,018,919 | ||||
Subtract grant date fair value of equity awards reported in Summary Compensation Table | (3,610,385) | ||||
Add the fair value as of the end of the covered fiscal year of equity awards granted in the covered fiscal year that are outstanding and unvested as of the end of the covered fiscal year | 6,839,063 | ||||
Adjust for the change in fair value as of the end of covered fiscal year (from the end of the prior fiscal year) of equity awards granted in prior fiscal years that are outstanding and unvested as of the end of covered fiscal year | 3,248,256 | ||||
Add, for equity awards that are granted and vest in the same covered fiscal year, the fair value as of the vesting date | — | ||||
Adjust for the change in fair value as of vesting date (from the end of the prior fiscal year) of equity awards granted in prior fiscal years for which all applicable vesting conditions were satisfied at the end of or during the covered fiscal year | 817,028 | ||||
Subtract, for equity awards granted in any prior fiscal year that fail to meet the applicable vesting conditions during the covered fiscal year, the fair value as of the end of prior fiscal year | — | ||||
Total Equity Adjustments (subtotal) | 7,293,962 | ||||
Average Compensation Actually Paid to non-PEO NEOs | $13,312,881 | ||||
(6) | Total shareholder return is calculated by assuming that a $100 investment was made on the day prior to the first fiscal year reported and reinvesting all dividends until the last day of each reported fiscal year. |
(7) | The peer group used is the NASDAQ Telecommunications Index, which we also use in the stock performance graph required by Item 201(e) of Regulation S-K under the Securities Exchange Act of 1934, as amended, and included in our Annual Report on Form 10-K for the fiscal year ended June 26, 2026. Peer group total shareholder return is calculated by assuming that a $100 investment was made on the day prior to the first fiscal year reported and reinvesting all dividends until the last day of each reported fiscal year. |
(8) | The dollar amounts reported in this column are the amounts of net income reflected in our audited financial statements for the reported fiscal year. |
(9) | In our assessment, revenue is the most important financial performance measure used by Fabrinet in fiscal 2026 to link CAP to performance. The dollar amounts reported in this column are the amounts of revenue reflected in our audited financial statements for the reported fiscal year. |
(1) | The following table shows our PEO and non-PEO NEOs for each of the reported fiscal years. |
Fiscal 2026 | Fiscal 2025 | Fiscal 2024 | Fiscal 2023 | Fiscal 2022 | |||||||||||||
PEO | Seamus Grady | Seamus Grady | Seamus Grady | Seamus Grady | Seamus Grady | ||||||||||||
Non-PEO NEOs | Dr. Harpal Gill | Dr. Harpal Gill | Dr. Harpal Gill | Dr. Harpal Gill | Dr. Harpal Gill | ||||||||||||
Csaba Sverha | Csaba Sverha | Csaba Sverha | Csaba Sverha | Csaba Sverha | |||||||||||||
Edward T. Archer | Edward T. Archer | Edward T. Archer | Edward T. Archer | Edward T. Archer | |||||||||||||
(7) | The peer group used is the NASDAQ Telecommunications Index, which we also use in the stock performance graph required by Item 201(e) of Regulation S-K under the Securities Exchange Act of 1934, as amended, and included in our Annual Report on Form 10-K for the fiscal year ended June 26, 2026. Peer group total shareholder return is calculated by assuming that a $100 investment was made on the day prior to the first fiscal year reported and reinvesting all dividends until the last day of each reported fiscal year. |
(3) | CAP does not mean that our PEO was actually paid the amounts reported in this column, but is a dollar amount derived from the starting point of total compensation reported for our PEO in the “Total” column of the Summary Compensation Table for the applicable fiscal year, as adjusted in accordance with SEC rules. For purposes of calculating CAP, the fair value of equity awards is calculated in accordance with Financial Accounting Standards Board Accounting Standards Codification Topic 718 (FASB ASC Topic 718) using the same assumption methodologies used to calculate the grant date fair value of awards for purposes of the Summary Compensation Table. In accordance with SEC rules, the following adjustments were made to determine CAP to our PEO for fiscal 2026, which consisted solely of adjustments to equity awards: |
Adjustment Table for PEO | Fiscal 2026 | ||||
Summary Compensation Table Total for PEO | $13,602,449 | ||||
Subtract grant date fair value of equity awards reported in Summary Compensation Table | (9,450,666) | ||||
Add the fair value as of the end of the covered fiscal year of equity awards granted in the covered fiscal year that are outstanding and unvested as of the end of the covered fiscal year | 17,902,161 | ||||
Adjust for the change in fair value as of the end of covered fiscal year (from the end of the prior fiscal year) of equity awards granted in prior fiscal years that are outstanding and unvested as of the end of covered fiscal year | 7,435,191 | ||||
Add, for equity awards that are granted and vest in the same covered fiscal year, the fair value as of the vesting date | — | ||||
Adjust for the change in fair value as of vesting date (from the end of the prior fiscal year) of equity awards granted in prior fiscal years for which all applicable vesting conditions were satisfied at the end of or during the covered fiscal year | 1,937,248 | ||||
Subtract, for equity awards granted in any prior fiscal year that fail to meet the applicable vesting conditions during the covered fiscal year, the fair value as of the end of prior fiscal year | — | ||||
Total Equity Adjustments (subtotal) | 17,823,934 | ||||
Compensation Actually Paid to PEO | $31,426,383 | ||||
(5) | CAP does not mean that our non-PEO NEOs were actually paid the amounts reported in this column, but is a dollar amount derived from the starting point of the average total compensation reported for our non-PEO NEOs in the “Total” column of the Summary Compensation Table for the applicable fiscal year, as adjusted in accordance with SEC rules. For purposes of calculating CAP, the fair value of equity awards is calculated in accordance with Financial Accounting Standards Board Accounting Standards Codification Topic 718 (FASB ASC Topic 718) using the same assumption methodologies used to calculate the grant date fair value of awards for purposes of the Summary Compensation Table. In accordance with SEC rules, the following adjustments were made to determine the average CAP to our non-PEO NEOs during fiscal 2026, which consisted solely of adjustments to equity awards: |
Adjustment Table for non-PEO NEOs | Fiscal 2026 | ||||
Average Summary Compensation Table Total for non-PEO NEOS | $6,018,919 | ||||
Subtract grant date fair value of equity awards reported in Summary Compensation Table | (3,610,385) | ||||
Add the fair value as of the end of the covered fiscal year of equity awards granted in the covered fiscal year that are outstanding and unvested as of the end of the covered fiscal year | 6,839,063 | ||||
Adjust for the change in fair value as of the end of covered fiscal year (from the end of the prior fiscal year) of equity awards granted in prior fiscal years that are outstanding and unvested as of the end of covered fiscal year | 3,248,256 | ||||
Add, for equity awards that are granted and vest in the same covered fiscal year, the fair value as of the vesting date | — | ||||
Adjust for the change in fair value as of vesting date (from the end of the prior fiscal year) of equity awards granted in prior fiscal years for which all applicable vesting conditions were satisfied at the end of or during the covered fiscal year | 817,028 | ||||
Subtract, for equity awards granted in any prior fiscal year that fail to meet the applicable vesting conditions during the covered fiscal year, the fair value as of the end of prior fiscal year | — | ||||
Total Equity Adjustments (subtotal) | 7,293,962 | ||||
Average Compensation Actually Paid to non-PEO NEOs | $13,312,881 | ||||
CAP Versus Total Shareholder Return
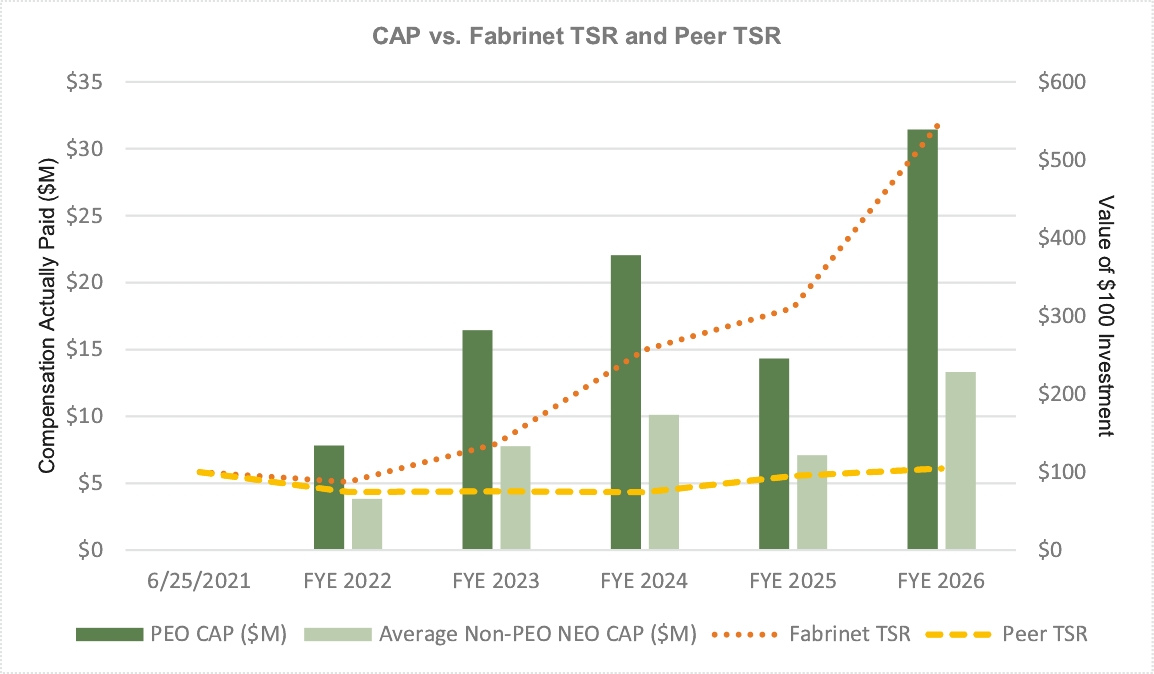
The following graph reflects the relationship between CAP, our cumulative Total Shareholder Return (“TSR”) and the TSR of the NASDAQ Telecommunications Index (“Peer TSR”), assuming an initial fixed investment on June 25, 2021 of $100.
CAP Versus Net Income and Revenue
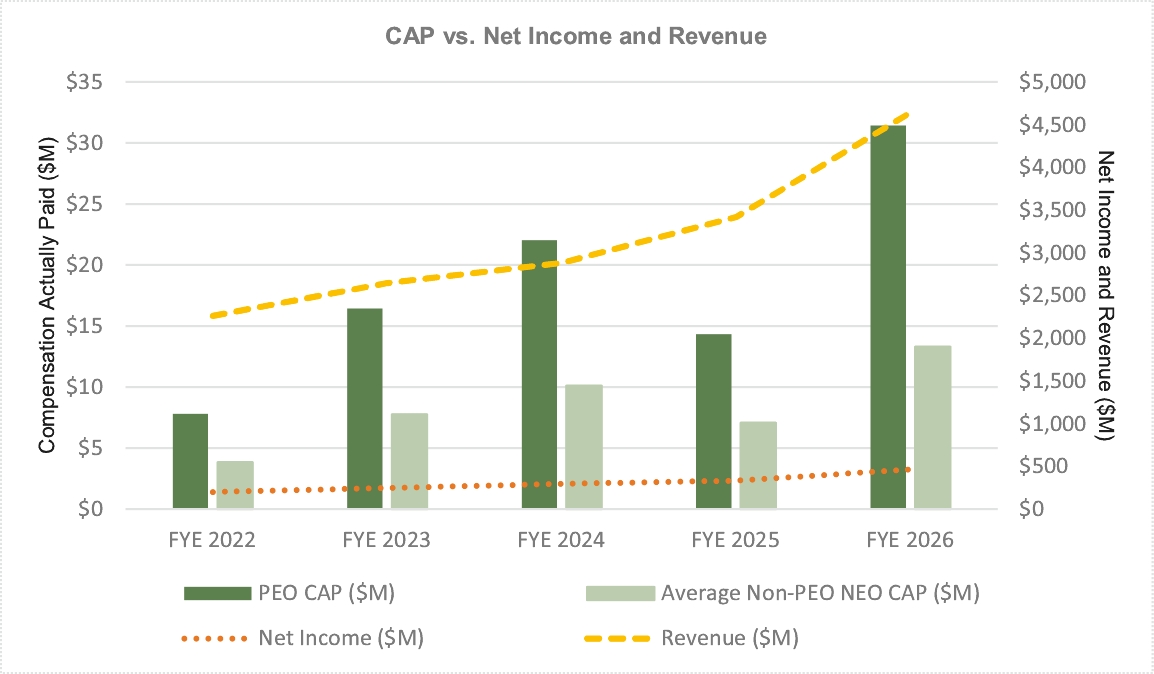
The following graph reflects the relationship between CAP, our net income and our revenue.
CAP Versus Net Income and Revenue
The following graph reflects the relationship between CAP, our net income and our revenue.
CAP Versus Total Shareholder Return
The following graph reflects the relationship between CAP, our cumulative Total Shareholder Return (“TSR”) and the TSR of the NASDAQ Telecommunications Index (“Peer TSR”), assuming an initial fixed investment on June 25, 2021 of $100.
Fiscal 2026 Performance Measures
In accordance with SEC rules, the financial performance measures listed below represent, in our assessment, the most important financial performance measures used in fiscal 2026 to link CAP to company performance.
• | Revenue |
• | Gross margin percentage (non-GAAP) |
• | Operating margin percentage (non-GAAP) |
• | Earnings per diluted share (non-GAAP) |