Exhibit 99.1
October 20, 2026
Fellow shareholders,
•We delivered our Q3 forecast and expect to deliver on our full year 2026 guidance.
◦Q3 revenue grew 12% year over year (11% on a F/X neutral basis1) to $12.9B, consistent with our forecast. Operating margin was 34.6%, up from 28.2% in Q3’25 and ahead of our forecast primarily due to the timing of expenses.
◦For 2026, we expect revenue of $51.1B (+13% year over year) and an operating margin of 31.5%.
•The core of our service is delivering differentiated, exclusive, professionally produced series, films and live events. Q3 highlights include The Last House, Facing El Chapo, Death of the Pastor’s Wife, our NFL Game from Melbourne, and a very successful slate in India.
•We’ll continue to expand our entertainment offering through licensing and new ways to bring more third-party content to our service, like our TF1 partnership in France. Our audience, which is approaching one billion people, and our best-in-class product capabilities, make us great partners for studios, networks and creative talent.
•Member response to our 2026 price changes is consistent with prior adjustments and our expectations, an indicator that our engagement - which encompasses quantity, quality and variety of viewing - remains healthy and that we continue to deliver strong value to members.
•We’ll close out 2026 with an exciting slate including The Further Mis-Adventures of Cliff Booth, limited series The Murder of JonBenét Ramsey, starring Melissa McCarthy and Clive Owen, new seasons of The Diplomat, Nobody Wants This and Lupin, the series finale of Emily in Paris, three NFL games on Thanksgiving Eve and Christmas Day, and the Tyson Fury vs. Anthony Joshua fight.
Our summary results, and forecast for Q4, are below.
| | | | | | | | | | | | | | | | | | | | |
| (in millions except per share data) | Q3'25 | Q4'25 | Q1'26 | Q2'26 | Q3'26 | Q4'26 Forecast |
| Revenue | $ | 11,510 | | $ | 12,051 | | $ | 12,250 | | $ | 12,560 | | $ | 12,874 | | $ | 13,442 | |
| Y/Y % Growth | 17.2 | % | 17.6 | % | 16.2 | % | 13.4 | % | 11.8 | % | 11.5 | % |
| Operating Income | $ | 3,248 | | $ | 2,957 | | $ | 3,957 | | $ | 4,193 | | $ | 4,459 | | $ | 3,500 | |
| Operating Margin | 28.2 | % | 24.5 | % | 32.3 | % | 33.4 | % | 34.6 | % | 26.0 | % |
| Net Income | $ | 2,547 | | $ | 2,419 | | $ | 5,283 | | $ | 3,401 | | $ | 3,664 | | $ | 2,787 | |
| Diluted EPS | $ | 0.59 | | $ | 0.56 | | $ | 1.23 | | $ | 0.80 | | $ | 0.87 | | $ | 0.67 | |
| | | | | | |
| Net cash provided by operating activities | $ | 2,825 | | $ | 2,112 | | $ | 5,290 | | $ | 1,744 | | $ | 3,162 | | |
| Free Cash Flow | $ | 2,660 | | $ | 1,872 | | $ | 5,094 | | $ | 1,525 | | $ | 2,884 | | |
| Shares (FD) | 4,340 | | 4,317 | | 4,298 | | 4,261 | | 4,195 | | |
| | | | | | |
|
__________________________________
1 Excluding the year over year effect of foreign exchange rate movements and the impact of hedging gains/losses realized as revenues. Assumes foreign exchange rates remained constant with foreign exchange rates from each of the corresponding months of the prior-year period.
Q3 Results and Forecast
Revenue in Q3 grew 12% year over year (+11% on a foreign exchange (F/X) neutral basis), and was in-line with our forecast. In Q3, revenue growth was driven primarily by subscription revenue, reflecting increases in memberships and pricing, growth in advertising revenue and a favorable impact from F/X rates, net of hedging. Membership growth benefited from continued, healthy retention in every region; globally and in the US, churn improved year-over-year and was better than forecast.
Q3’26 operating income totaled $4.5B (+37% year over year) and operating margin of 34.6% was up versus 28.2% in Q3’25. Both Q3 operating income and margin were ahead of forecast due primarily to the timing of expenses and the slight upside in revenue. As a result, diluted EPS for the quarter amounted to $0.87 vs. $0.59 in Q3’25 (+49% year over year).
As a reminder, the guidance we provide is our actual internal forecast at the time we report and we strive for accuracy. Our primary financial metrics are revenue for growth and operating margin for profitability. Our goal is to sustain healthy revenue growth, expand operating profit and margin, and deliver growing free cash flow.
In Q4, we expect revenue of $13.4 billion, which represents year over year growth of 12% (or 11% F/X neutral) driven by growth in memberships, pricing, and ad revenue. We project a Q4 operating margin of 26.0% which includes ~120 basis points negative impact associated with our recently announced headcount reductions, and compares with 24.5% in the year ago quarter. These organizational changes enable us to continue to aggressively invest in high impact areas to improve our service, and drive growth and innovation.
Our guidance for Q4 means that for the full year 2026 we expect revenue of $51.1B, or growth of 13% (+12% on a F/X neutral basis). This is 0.2% below the mid-point of our prior 2026 revenue forecast range - while subscription revenue growth has outperformed our expectations, we currently expect 2026 ad revenue of ~$2.7B vs. approximately $3B previously (due to slightly slower than expected rollout of some ad product capabilities). We anticipate an operating margin of 31.5% for 2026 (31.4% based on F/X rates as of January 1, 2026) vs. 29.5% in 2025. Our updated 2026 margin guidance includes ~30 basis points negative impact associated with our Q4 headcount reductions. Our forecast implies annual operating income growth of 20%+ for 2026.
Our Focus
Our mission is to entertain the world while building a wildly successful business. Our strategy is simple: invest in differentiated, exclusive, professionally-produced entertainment like Netflix originals that spark conversation, bring in more members, and make us a “must-have” service. We pair these originals, which anchor our service, with a broad, complementary selection of third-party programming, a great discovery experience, and leading global distribution. Together, this fuels engagement (quality, quantity, and variety of viewing) and, in turn, revenue and profit. The core of our service is streaming TV, film and live events, monetized via subscription and advertising. It represents the vast majority of our spending and nearly all of our revenue, and is the engine of our business for which we see a long runway of growth.
To successfully execute this strategy, we focus on three priorities: 1) delivering more entertainment value to our members, 2) leveraging technology to improve all aspects of our service, and 3) improving our monetization. These priorities work in concert to drive acquisition and retention, create member value that lets us occasionally raise prices, and increase advertiser demand. We reinvest returns in our business so we can win more moments of truth and fund the next wave of entertainment. Done well,
this makes our service the one where members go first to look for entertainment and the last service they would cancel, with industry-leading retention and continued member and ARM2 growth.
With intense competition and an explosion of content competing for consumer attention, strategic clarity and excellent execution are critical. In Q3, we delivered well across all three priorities, but we see room to do even better with focused, continuous improvement.
In Q3, we had a variety of hits from around the world that members loved. Plastic Beauty* (12M views3) is on track to be our most-viewed series ever in Japan; The Secret Woman* (47M) is trending to be our most-viewed Danish title ever; Facing El Chapo* (58M) is pacing to be our second most-viewed Mexican title globally; and The Perfect Lie* (17M) is on track to become our most-viewed series out of the Netherlands. Non-English viewing has grown from under 10% of total viewing a decade ago to more than a third today. These hits reflect our decade-long commitment to creating content around the world that resonates locally, and has the potential to travel globally.
Other successful Q3 titles include:
•UCAN: Death of the Pastor's Wife* (45M), The Idaho Murders: College Nightmare* (38M), My Life With The Walter Boys S3* (29M), Little House on the Prairie (29M), The Last House* (91M) and Why Did I Get Married Again* (36M)
•EMEA: The Gentlemen S2* (33M) and A Toxic Love Story* (43M) from the UK, Elite Force* (25M) from France, Blood Sacrifice* (23M) from Sweden
•LATAM: My Daughter's Father* (23M) from Mexico and Nando Between Two Worlds - A Sintonia Film* (18M) from Brazil
•APAC: The East Palace (21M) and Our Sticky Love* (22M) from Korea
Complementing our Netflix originals, we continue to expand our entertainment offering through licensing and bringing more third-party content to our service in new ways. Our broad distribution (we’re serving an audience approaching one billion people) and industry leading monetization make us great partners for studios, networks and creative talent. For example, we partnered with Take-Two to unveil a sneak peek of the highly anticipated Grand Theft Auto VI5 in August. And we recently secured a new licensing deal with Disney6 which brings a variety of current and library series and films to our service for our members to enjoy, including all five Ice Age films which reached our global weekly Top 10 list and are building consumer awareness in advance of Disney’s theatrical release of Ice Age: Boiling Point in February 2027.
__________________________________
2 Average revenue per membership.
3 A view is defined as hours viewed divided by runtime for each title. Views for a title are based on the first 91 days since the release of each episode (less than 91 days denoted with an asterisk and data is from launch date through October 18, 2026). We publish our top titles based on views each week at Netflix Top 104.
4 https://www.netflix.com/tudum/top10
5 https://www.ign.com/articles/gta-6-just-blew-me-away-im-so-glad-i-avoided-the-leaks
6 https://variety.com/2026/tv/news/disney-licenses-titles-netflix-ice-age-movies-will-trent-percy-jackson-and-the-olympians-felicity-1236897256/
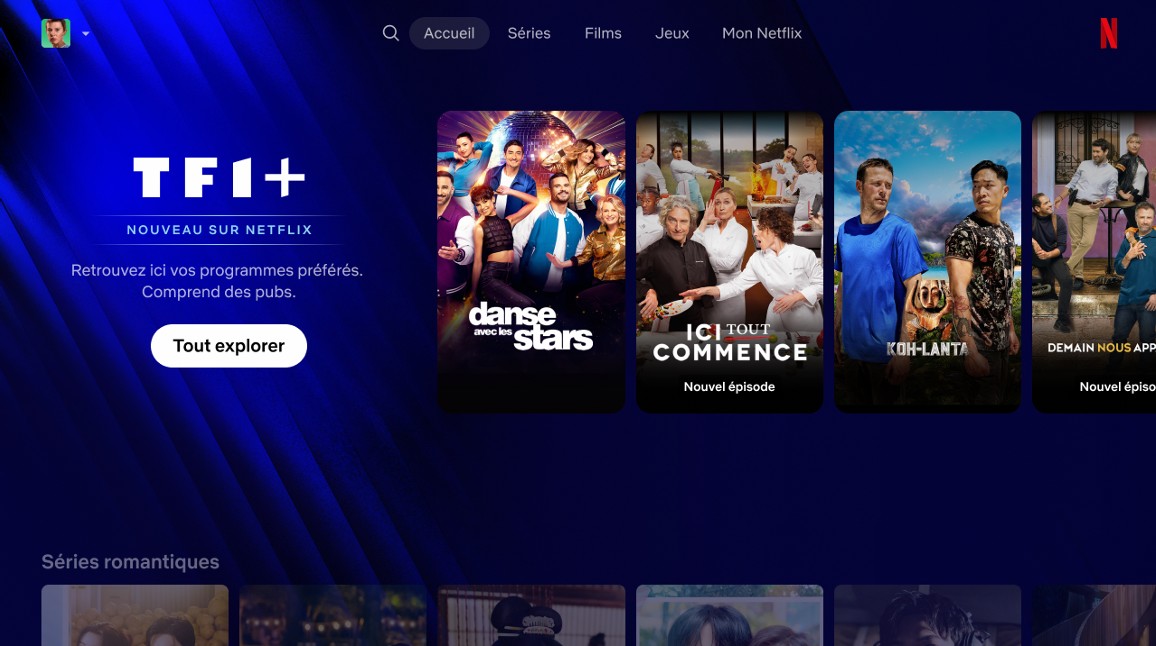
Our investment in our product capabilities, including our new TV UI, enables us to seamlessly integrate and merchandise more third party content to Netflix members. This summer we launched our partnership with TF1, a leading French broadcaster. This partnership enables us to provide our French members with even more highly local series, film, news and sports programming, all within a frictionless choosing and viewing experience that complements our French slate and global programming. We’re pleased with the TF1 partnership and the early metrics indicate that it’s generating incremental viewing in France.
We also continue to invest in our ad tech stack (Netflix Ads Suite). In Q3, we extended programmatic access through globally-available CTV marketplace deals, and secured new partnerships with MercadoLibre in LATAM and AdForm in EMEA. We are also expanding capabilities to in-DSP measurement including reach, frequency, and attribution. Also, we will introduce our advertising tier to 15 new countries in 2027. The first tranche of new market launches will happen in March 2027: nine countries in EMEA7, Colombia, Peru and New Zealand (a new addition from our previous announcement).
We know there’s some investor concern about our view hours growth. Member response to our 2026 price increases is consistent with prior price changes and our expectations, an indicator that our engagement - which encompasses quantity, quality and variety of viewing - remains healthy and that we continue to deliver strong value to members. But we do seek to accelerate growth in view hours as well, and we’re confident we’ll do that by relentlessly focusing and executing against the aforementioned strategy.
__________________________________
7 https://about.netflix.com/en/news/netflix-hosts-first-uk-upfront
That confidence comes from seeing strong results when we execute well on our core strategy – our business in India in Q3 is an example. We delivered a great slate led by Lock Upp, our first daily reality series, which drove the most viewing of any title on Netflix in India ever8, the new scripted series Musafir Cafe* (9M) and the hit series Operation Safed Sagar* (11M). As a result, view hours in India grew 24% year over year, while view hours per member grew low-to-mid single digits in the quarter. Combined with our first transaction-based loyalty bundle with Flipkart, we achieved our largest quarter ever of paid net additions in India and grew Q3 revenue in India ~18% year over year on a F/X neutral basis.
To close out the year, our Q4 slate builds on the strategy outlined above:
•We’ll have new series including, from the US, the critically acclaimed East of Eden and The Diplomat S4, The Body, The Murder of JonBenét Ramsey, The Hunting Wives S2, and the sixth and final season of Emily in Paris, as well as Below from Canada, Pride and Prejudice from the UK, Lupin: Part 4 from France, and The Empress S3 from Germany.
•Our film releases feature The Further Mis-Adventures of Cliff Booth, starring Brad Pitt, directed by David Fincher, and written by Quentin Tarantino; Animals, starring Ben Affleck and Kerry Washington; Bad Day, starring Cameron Diaz; Steps, our new animated film featuring Ali Wong, Stephanie Hsu, and Amanda Seyfried; animated film Ray Gunn, starring Scarlett Johansson and Sam Rockwell and directed by Brad Bird; and Spain’s La Bola Negra and South Korea’s Possible Love, both of which have secured official selections as their countries’ submissions for Best International Feature Film category at the Academy Awards.
•And we have our biggest quarterly live slate to date with the NFL’s inaugural Thanksgiving Eve game (with a halftime performance by U2) and a Christmas Day doubleheader, plus the Tyson Fury vs. Anthony Joshua boxing match.
Cash Flow and Capital Structure
Net cash generated from operating activities was $3.2B vs. $2.8B in the prior year period. Free cash flow (FCF)9 in Q3’26 totaled $2.9B vs. $2.7B in Q3’25. We have adjusted our expected 2026 FCF forecast to approximately $12.0B (vs. our prior projection of $12.5B) due primarily to the expected closing of a real estate transaction in Q4. We continue to expect an annual cash content spend to amortization ratio of ~1.1x.
Our capital allocation approach is unchanged. We prioritize reinvestment in the business, both organically and through selective M&A, while maintaining a healthy balance sheet and ample liquidity, then returning excess cash to shareholders via repurchases. In Q3, we bought back 63.9 million shares for $4.8B, our largest quarter ever of stock repurchases, and we currently have $22.3B of capacity left in our remaining authorizations. We ended Q3 with gross debt of $15.3B and cash and cash equivalents of $8.2B. Gross debt was ~$1B higher than the end of Q2, reflecting a $1B bond deal we completed during the quarter in order to fund our upcoming $1B debt maturity in Q4.
Reference
For quick reference, our past investor letters can be found here10.
__________________________________
8 Based on view hours in the first 91 days.
9 Defined as cash provided by (used in) operating activities less purchases of property and equipment.
10 https://ir.netflix.net/financials/quarterly-earnings/default.aspx
Regional Breakdown
| | | | | | | | | | | | | | | | | |
| (in millions) | Q3'25 | Q4'25 | Q1'26 | Q2'26 | Q3'26 |
| UCAN: | | | | | |
| Revenue | $ | 5,072 | | $ | 5,339 | | $ | 5,245 | | $ | 5,432 | | $ | 5,628 | |
| Y/Y % Growth | 17 | % | 18 | % | 14 | % | 10 | % | 11 | % |
| F/X Neutral Y/Y % Growth | 17 | % | 18 | % | 14 | % | 10 | % | 11 | % |
| | | | | |
| EMEA: | | | | | |
| Revenue | $ | 3,699 | | $ | 3,873 | | $ | 3,998 | | $ | 4,034 | | $ | 4,107 | |
| Y/Y % Growth | 18 | % | 18 | % | 17 | % | 14 | % | 11 | % |
| F/X Neutral Y/Y % Growth | 15 | % | 15 | % | 12 | % | 11 | % | 9 | % |
| | | | | |
| LATAM: | | | | | |
| Revenue | $ | 1,371 | | $ | 1,418 | | $ | 1,497 | | $ | 1,584 | | $ | 1,603 | |
| Y/Y % Growth | 10 | % | 15 | % | 19 | % | 21 | % | 17 | % |
| F/X Neutral Y/Y % Growth | 20 | % | 20 | % | 18 | % | 16 | % | 12 | % |
| | | | | |
| APAC: | | | | | |
| Revenue | $ | 1,369 | | $ | 1,421 | | $ | 1,509 | | $ | 1,510 | | $ | 1,537 | |
| Y/Y % Growth | 21 | % | 17 | % | 20 | % | 16 | % | 12 | % |
| F/X Neutral Y/Y % Growth | 20 | % | 19 | % | 19 | % | 18 | % | 15 | % |
F/X Neutral revenue growth excludes the year over year effect of foreign exchange rate movements and the impact of hedging gains/losses realized as revenues. Assumes foreign exchange rates remained constant with foreign exchange rates from each of the corresponding months of the prior-year period.
October 20, 2026 Earnings Interview, 1:45pm PT
Our live video interview will be on youtube/netflixir11 at 1:45pm PT today. Co-CEOs Greg Peters and Ted Sarandos, CFO Spence Neumann and VP of Finance & Capital Markets Spencer Wang, will all be on the video to answer questions submitted by sellside analysts.
| | | | | |
IR Contact: | Corporate Communications Contact: |
| Lowell Singer | Kelly Pakula |
| VP, Investor Relations | VP, Global Corporate Communications |
| 818 434-2141 | 415 254-4462 |
__________________________________
11 https://www.youtube.com/netflixir
Use of Non-GAAP Measures
This shareholder letter and its attachments include reference to the non-GAAP financial measures of F/X neutral revenue and adjusted operating profit and margin, free cash flow and net debt. Management believes that free cash flow is an important liquidity metric because it measures, during a given period, the amount of cash generated that is available to repay debt obligations, make strategic acquisitions and investments and for certain other activities like stock repurchases. Management believes that F/X neutral revenue and adjusted operating profit and margin allow investors to compare our projected results to our actual results absent year-over-year and intra-year currency fluctuations. Management believes net debt is a useful measure of the company's liquidity, capital structure, and leverage. However, these non-GAAP financial measures should be considered in addition to, not as a substitute for or superior to, net income, operating income (profit), operating margin, diluted earnings per share and net cash provided by (used in) operating activities, or other financial measures prepared in accordance with GAAP. Reconciliation to the GAAP equivalent of these non-GAAP measures are contained in tabular form on the attached unaudited financial statements. We are not able to reconcile forward-looking non-GAAP financial measures because we are unable to predict without unreasonable effort the exact amount or timing of the reconciling items, including property and equipment, and the impact of changes in currency exchange rates. The variability of these items could have a significant impact on our future GAAP financial results.
Forward-Looking Statements
This shareholder letter contains certain forward-looking statements within the meaning of the federal securities laws, including statements regarding our expected results for the fiscal quarter and fiscal year ending December 31, 2026; priorities for 2026; adoption and growth of streaming entertainment; growth strategy and outlook; market opportunity; competitive landscape and position; expectations regarding series, films, games, live programming and video podcasts and title performance; partnerships, licensing and third-party content; engagement and view hours; slate strength; pricing and plans strategy; ad-supported tier and its prospects, including new market launches; advertising, including our ad-tech platform; product strategy; impact of organizational changes, including headcount reductions; impact of foreign exchange rates and hedging activities; stock repurchases; advertising revenue; revenue and revenue growth; membership growth, retention and ARM growth; operating income, operating margin, net income, earnings per share, capital allocation, debt repayment, closing of a real estate transaction, free cash flow, content spend and content amortization. The forward-looking statements in this letter are subject to risks and uncertainties that could cause actual results and events to differ, including, without limitation: our ability to attract new members and engage and retain existing members; our ability to compete effectively, including for consumer engagement with different modes of entertainment; failing to improve the variety and quality of entertainment offerings; adoption of the ads plan and paid sharing; maintenance and expansion of device platforms for streaming; fluctuations in consumer usage of our service; service disruptions; production risks; macroeconomic conditions; content slate and timing of content releases. A detailed discussion of these and other risks and uncertainties that could cause actual results and events to differ materially from such forward-looking statements is included in our filings with the Securities and Exchange Commission (“SEC”), including our Annual Report on Form 10-K, filed with the SEC on January 23, 2026. The Company provides internal forecast numbers. Investors should anticipate that actual performance will vary from these forecast numbers based on risks and uncertainties discussed above and in our Annual Report on Form 10-K. We undertake no obligation to update forward-looking statements to reflect events or circumstances occurring after the date of this shareholder letter.
Netflix, Inc.
Consolidated Statements of Operations
(unaudited)
(in thousands, except per share data)
| | | | | | | | | | | | | | | | | | | | | | | | | | | | | |
| Three Months Ended | | Nine Months Ended |
| September 30,
2026 | | June 30,
2026 | | September 30,
2025 | | September 30,
2026 | | September 30,
2025 |
| Revenues | $ | 12,874,176 | | | $ | 12,559,938 | | | $ | 11,510,307 | | | $ | 37,683,871 | | | $ | 33,132,274 | |
Cost of revenues | 6,079,016 | | | 6,036,965 | | | 6,164,250 | | | 18,004,219 | | | 16,752,708 | |
| Sales and marketing | 837,051 | | | 823,838 | | | 786,295 | | | 2,503,106 | | | 2,187,930 | |
Technology and development | 1,033,142 | | | 1,007,675 | | | 853,584 | | | 3,000,513 | | | 2,501,090 | |
General and administrative | 466,367 | | | 498,850 | | | 457,931 | | | 1,567,826 | | | 1,320,606 | |
| Operating income | 4,458,600 | | | 4,192,610 | | | 3,248,247 | | | 12,608,207 | | | 10,369,940 | |
| Other income (expense): | | | | | | | | | |
| Interest expense | (184,701) | | | (175,685) | | | (175,294) | | | (622,463) | | | (542,115) | |
| Interest and other income (expense) | 43,006 | | | 51,661 | | | 36,457 | | | 2,946,833 | | | 126,986 | |
| Income before income taxes | 4,316,905 | | | 4,068,586 | | | 3,109,410 | | | 14,932,577 | | | 9,954,811 | |
| Provision for income taxes | (652,978) | | | (667,172) | | | (562,494) | | | (2,584,445) | | | (1,392,131) | |
| Net income | $ | 3,663,927 | | | $ | 3,401,414 | | | $ | 2,546,916 | | | $ | 12,348,132 | | | $ | 8,562,680 | |
| Earnings per share*: | | | | | | | | | |
| Basic | $ | 0.89 | | | $ | 0.81 | | | $ | 0.60 | | | $ | 2.95 | | | $ | 2.01 | |
| Diluted | $ | 0.87 | | | $ | 0.80 | | | $ | 0.59 | | | $ | 2.90 | | | $ | 1.97 | |
| Weighted-average shares of common stock outstanding*: | | | | | | | | | |
| Basic | 4,134,463 | | | 4,189,303 | | | 4,244,553 | | | 4,181,861 | | | 4,256,350 | |
| Diluted | 4,195,127 | | | 4,261,300 | | | 4,340,392 | | | 4,251,298 | | | 4,352,844 | |
* Share and per share amounts have been retroactively adjusted to reflect the ten-for-one forward stock split which was effected on November 14, 2025.
Netflix, Inc.
Consolidated Balance Sheets
(in thousands)
| | | | | | | | | | | | |
| | As of |
| | September 30,
2026 | | December 31,
2025 |
| | (unaudited) | | |
| Assets | | | | |
| Current assets: | | | | |
| Cash and cash equivalents | | $ | 8,194,275 | | | $ | 9,033,681 | |
| Short-term investments | | 28,678 | | | 28,678 | |
| Other current assets | | 4,999,384 | | | 3,957,832 | |
| Total current assets | | 13,222,337 | | | 13,020,191 | |
| Content assets, net | | 34,605,477 | | | 32,778,392 | |
| Property and equipment, net | | 2,560,619 | | | 2,004,350 | |
| Other non-current assets | | 8,293,521 | | | 7,794,060 | |
| Total assets | | $ | 58,681,954 | | | $ | 55,596,993 | |
| Liabilities and Stockholders' Equity | | | | |
| Current liabilities: | | | | |
| Current content liabilities | | $ | 3,885,069 | | | $ | 4,084,854 | |
| Accounts payable | | 860,098 | | | 900,612 | |
| Accrued expenses and other liabilities | | 3,301,264 | | | 3,220,869 | |
| Deferred revenue | | 1,779,633 | | | 1,775,730 | |
| Short-term debt | | 2,474,796 | | | 998,865 | |
| Total current liabilities | | 12,300,860 | | | 10,980,930 | |
| Non-current content liabilities | | 1,723,034 | | | 1,579,476 | |
| Long-term debt | | 12,657,598 | | | 13,463,971 | |
| Other non-current liabilities | | 2,714,209 | | | 2,957,128 | |
| Total liabilities | | 29,395,701 | | | 28,981,505 | |
| Stockholders' equity: | | | | |
| Common stock | | 7,898,264 | | | 7,286,410 | |
| Treasury stock at cost | | (33,232,809) | | | (22,372,658) | |
| Accumulated other comprehensive loss | | (9,452) | | | (580,382) | |
| Retained earnings | | 54,630,250 | | | 42,282,118 | |
| Total stockholders' equity | | 29,286,253 | | | 26,615,488 | |
| Total liabilities and stockholders' equity | | $ | 58,681,954 | | | $ | 55,596,993 | |
| | | | |
| Supplemental Information | | | | |
| Total streaming content obligations* | | $ | 25,222,800 | | | $ | 24,039,228 | |
* Total streaming content obligations are comprised of content liabilities included in "Current content liabilities" and "Non-current content liabilities" on the Consolidated Balance Sheets and obligations that are not reflected on the Consolidated Balance Sheets as they did not yet meet the criteria for recognition.
Netflix, Inc.
Consolidated Statements of Cash Flows
(unaudited)
(in thousands) | | | | | | | | | | | | | | | | | | | | | | | | | | | | | |
| Three Months Ended | | Nine Months Ended |
| September 30,
2026 | | June 30,
2026 | | September 30,
2025 | | September 30,
2026 | | September 30,
2025 |
| Cash flows from operating activities: | | | | | | | | | |
| Net income | $ | 3,663,927 | | | $ | 3,401,414 | | | $ | 2,546,916 | | | $ | 12,348,132 | | | $ | 8,562,680 | |
| Adjustments to reconcile net income to net cash provided by operating activities: | | | | | | | | | |
| Additions to content assets | (5,159,790) | | | (4,927,523) | | | (4,653,935) | | | (14,934,230) | | | (12,039,405) | |
| Change in content liabilities | 93,508 | | | (181,794) | | | 24,262 | | | (43,070) | | | (601,043) | |
| Amortization of content assets | 4,235,454 | | | 4,311,309 | | | 4,002,744 | | | 12,764,663 | | | 11,657,930 | |
| Depreciation and amortization of property, equipment and intangibles | 107,100 | | | 100,530 | | | 87,326 | | | 306,205 | | | 247,406 | |
| Stock-based compensation expense | 133,723 | | | 131,312 | | | 80,986 | | | 405,440 | | | 233,825 | |
| Foreign currency remeasurement loss (gain) on debt | (9,162) | | | (8,813) | | | (1,707) | | | (28,085) | | | 82,078 | |
| Other non-cash items | 119,748 | | | 141,356 | | | 142,293 | | | 459,331 | | | 377,162 | |
| Deferred income taxes | 182,054 | | | 81,260 | | | 20,539 | | | 322,133 | | | (279,144) | |
| Changes in operating assets and liabilities: | | | | | | | | | |
| Other current assets | (136,415) | | | 111,713 | | | (169,597) | | | (729,342) | | | (477,647) | |
| Accounts payable | 46,211 | | | (157,397) | | | 139,451 | | | (111,032) | | | (125,929) | |
| Accrued expenses and other liabilities | 85,509 | | | (1,249,793) | | | 707,151 | | | 131,620 | | | 746,329 | |
| Deferred revenue | (17,823) | | | 54,008 | | | (3,686) | | | 3,903 | | | 203,862 | |
| Other non-current assets and liabilities | (181,765) | | | (63,770) | | | (97,569) | | | (699,372) | | | (550,473) | |
| Net cash provided by operating activities | 3,162,279 | | | 1,743,812 | | | 2,825,174 | | | 10,196,296 | | | 8,037,631 | |
| Cash flows from investing activities: | | | | | | | | | |
| Purchases of property and equipment | (278,766) | | | (218,644) | | | (164,719) | | | (693,540) | | | (448,885) | |
| | | | | | | | | |
| Acquisitions | — | | | — | | | — | | | (585,744) | | | — | |
| | | | | | | | | |
| | | | | | | | | |
| Purchases of investments | (52,545) | | | — | | | (3,850) | | | (52,545) | | | (161,515) | |
| Proceeds from maturities and sales of investments | — | | | — | | | 176,250 | | | — | | | 1,908,617 | |
| Other investing activities | — | | | — | | | 36,190 | | | — | | | — | |
| Net cash provided by (used in) investing activities | (331,311) | | | (218,644) | | | 43,871 | | | (1,331,829) | | | 1,298,217 | |
| Cash flows from financing activities: | | | | | | | | | |
| Proceeds from issuance of debt | 992,550 | | | — | | | — | | | 992,550 | | | — | |
| Repayments of debt | — | | | — | | | — | | | — | | | (1,833,450) | |
| Proceeds from issuance of common stock | 74,674 | | | 59,980 | | | 70,215 | | | 183,964 | | | 590,883 | |
| Repurchases of common stock | (4,796,725) | | | (4,714,403) | | | (1,856,885) | | | (10,781,716) | | | (7,047,608) | |
| Taxes paid related to net share settlement of equity awards | (5,165) | | | (6,631) | | | (6,196) | | | (41,026) | | | (40,180) | |
| | | | | | | | | |
| Other financing activities | (20,306) | | | (8,573) | | | 55,837 | | | (9,185) | | | 62,142 | |
| Net cash used in financing activities | (3,754,972) | | | (4,669,627) | | | (1,737,029) | | | (9,655,413) | | | (8,268,213) | |
| Effect of exchange rate changes on cash, cash equivalents, and restricted cash | 18,995 | | | (19,628) | | | (21,721) | | | (50,471) | | | 415,896 | |
| Net increase (decrease) in cash, cash equivalents, and restricted cash | (905,009) | | | (3,164,087) | | | 1,110,295 | | | (841,417) | | | 1,483,531 | |
| Cash, cash equivalents and restricted cash at beginning of period | 9,102,786 | | | 12,266,873 | | | 8,180,573 | | | 9,039,194 | | | 7,807,337 | |
| Cash, cash equivalents and restricted cash at end of period | $ | 8,197,777 | | | $ | 9,102,786 | | | $ | 9,290,868 | | | $ | 8,197,777 | | | $ | 9,290,868 | |
|
Netflix, Inc.
Non-GAAP Information
(unaudited)
(in thousands, except percentages)
Non-GAAP Free Cash Flow
| | | | | | | | | | | | | | | | | | | | | | | | | | | | | |
| Three Months Ended | | Nine Months Ended |
| September 30,
2026 | | June 30,
2026 | | September 30,
2025 | | September 30,
2026 | | September 30,
2025 |
| Non-GAAP free cash flow reconciliation: | | | | | | | | | |
| Net cash provided by operating activities | $ | 3,162,279 | | | $ | 1,743,812 | | | $ | 2,825,174 | | | $ | 10,196,296 | | | $ | 8,037,631 | |
| Purchases of property and equipment | (278,766) | | | (218,644) | | | (164,719) | | | (693,540) | | | (448,885) | |
| | | | | | | | | |
| Non-GAAP free cash flow | $ | 2,883,513 | | | $ | 1,525,168 | | | $ | 2,660,455 | | | $ | 9,502,756 | | | $ | 7,588,746 | |
Non-GAAP Constant Currency Information
The tables below provide a non-GAAP reconciliation of reported and constant currency revenue growth by region for the quarters ended September 30, 2025, December 31, 2025, March 31, 2026, June 30, 2026 and September 30, 2026. The regions presented in the tables below include United States and Canada ("UCAN"), Europe, Middle East, and Africa ("EMEA"), Latin America ("LATAM"), and Asia-Pacific ("APAC").
| | | | | | | | | | | | | | | | | | | | | | | | | | | | | | | | | | | | | | | | | | | | | | | | | | | | | | | | |
| | Three Months Ended | | Three Months Ended | | Change |
| | September 30,
2025 | | September 30,
2024 | | Q3'25 vs. Q3'24 |
| | As Reported | | Constant Currency Adjustment | | Hedging (Gains) Losses Included in Revenues | | Constant Currency Revenues | | As Reported | | Hedging (Gains) Losses Included in Revenues | | Revenues
Less Hedging Impact | | Reported Change | | Constant Currency Change |
| UCAN | | $ | 5,071,781 | | | $ | 1,816 | | | $ | (2,196) | | | $ | 5,071,401 | | | $ | 4,322,476 | | | $ | (3,265) | | | $ | 4,319,211 | | | 17 | % | | 17 | % |
| EMEA | | 3,699,052 | | | (199,597) | | | 113,580 | | | 3,613,035 | | | 3,133,466 | | | (1,857) | | | 3,131,609 | | | 18 | % | | 15 | % |
| LATAM | | 1,370,913 | | | 53,678 | | | 26,300 | | | 1,450,891 | | | 1,240,892 | | | (34,654) | | | 1,206,238 | | | 10 | % | | 20 | % |
| APAC | | 1,368,561 | | | (14,750) | | | (8,319) | | | 1,345,492 | | | 1,127,869 | | | (8,408) | | | 1,119,461 | | | 21 | % | | 20 | % |
| | | | | | | | | | | | | | | | | | |
| | | | | | | | | | | | | | | | | | |
| | | | | | | | | | | | | | | | | | | | | | | | | | | | | | | | | | | | | | | | | | | | | | | | | | | | | | | | |
| | Three Months Ended | | Three Months Ended | | Change |
| | December 31,
2025 | | December 31,
2024 | | Q4'25 vs. Q4'24 |
| | As Reported | | Constant Currency Adjustment | | Hedging (Gains) Losses Included in Revenues | | Constant Currency Revenues | | As Reported | | Hedging (Gains) Losses Included in Revenues | | Revenues
Less Hedging Impact | | Reported Change | | Constant Currency Change |
| UCAN | | $ | 5,339,270 | | | $ | 3,801 | | | $ | (6,612) | | | $ | 5,336,459 | | | $ | 4,517,018 | | | $ | (5,564) | | | $ | 4,511,454 | | | 18 | % | | 18 | % |
| EMEA | | 3,872,743 | | | (198,888) | | | 87,364 | | | 3,761,219 | | | 3,287,604 | | | (12,789) | | | 3,274,815 | | | 18 | % | | 15 | % |
| LATAM | | 1,417,939 | | | (1,052) | | | 27,711 | | | 1,444,598 | | | 1,229,771 | | | (28,307) | | | 1,201,464 | | | 15 | % | | 20 | % |
| APAC | | 1,420,810 | | | 28,413 | | | (19,274) | | | 1,429,949 | | | 1,212,120 | | | (7,107) | | | 1,205,013 | | | 17 | % | | 19 | % |
| | | | | | | | | | | | | | | | | | |
| | | | | | | | | | | | | | | | | | |
| | | | | | | | | | | | | | | | | | | | | | | | | | | | | | | | | | | | | | | | | | | | | | | | | | | | | | | | |
| | Three Months Ended | | Three Months Ended | | Change |
| | March 31,
2026 | | March 31,
2025 | | Q1'26 vs. Q1'25 |
| | As Reported | | Constant Currency Adjustment | | Hedging (Gains) Losses Included in Revenues | | Constant Currency Revenues | | As Reported | | Hedging (Gains) Losses Included in Revenues | | Revenues
Less Hedging Impact | | Reported Change | | Constant Currency Change |
| UCAN | | $ | 5,245,298 | | | $ | (20,306) | | | $ | (463) | | | $ | 5,224,529 | | | $ | 4,617,098 | | | $ | (14,552) | | | $ | 4,602,546 | | | 14 | % | | 14 | % |
| EMEA | | 3,998,419 | | | (418,871) | | | 113,651 | | | 3,693,199 | | | 3,404,676 | | | (105,225) | | | 3,299,451 | | | 17 | % | | 12 | % |
| LATAM | | 1,497,058 | | | (60,512) | | | 31,286 | | | 1,467,832 | | | 1,261,934 | | | (13,936) | | | 1,247,998 | | | 19 | % | | 18 | % |
| APAC | | 1,508,982 | | | (40,823) | | | (11,957) | | | 1,456,202 | | | 1,259,093 | | | (31,083) | | | 1,228,010 | | | 20 | % | | 19 | % |
| | | | | | | | | | | | | | | | | | | | | | | | | | | | | | | | | | | | | | | | | | | | | | | | | | | | | | | | |
| | Three Months Ended | | Three Months Ended | | Change |
| | June 30,
2026 | | June 30,
2025 | | Q2'26 vs. Q2'25 |
| | As Reported | | Constant Currency Adjustment | | Hedging (Gains) Losses Included in Revenues | | Constant Currency Revenues | | As Reported | | Hedging (Gains) Losses Included in Revenues | | Revenues
Less Hedging Impact | | Reported Change | | Constant Currency Change |
| UCAN | | $ | 5,431,667 | | | $ | (4,883) | | | $ | (3,284) | | | $ | 5,423,500 | | | $ | 4,929,003 | | | $ | (6,431) | | | $ | 4,922,572 | | | 10 | % | | 10 | % |
| EMEA | | 4,033,515 | | | (130,725) | | | 58,490 | | | 3,961,280 | | | 3,538,175 | | | 42,049 | | | 3,580,224 | | | 14 | % | | 11 | % |
| LATAM | | 1,584,290 | | | (67,459) | | | 11,494 | | | 1,528,325 | | | 1,306,735 | | | 14,033 | | | 1,320,768 | | | 21 | % | | 16 | % |
| APAC | | 1,510,466 | | | 28,880 | | | (19,070) | | | 1,520,276 | | | 1,305,253 | | | (12,266) | | | 1,292,987 | | | 16 | % | | 18 | % |
| | | | | | | | | | | | | | | | | | | | | | | | | | | | | | | | | | | | | | | | | | | | | | | | | | | | | | | | |
| | Three Months Ended | | Three Months Ended | | Change |
| | September 30,
2026 | | September 30,
2025 | | Q3'26 vs. Q3'25 |
| | As Reported | | Constant Currency Adjustment | | Hedging (Gains) Losses Included in Revenues | | Constant Currency Revenues | | As Reported | | Hedging (Gains) Losses Included in Revenues | | Revenues
Less Hedging Impact | | Reported Change | | Constant Currency Change |
| UCAN | | $ | 5,628,215 | | | $ | 7,492 | | | $ | (7,928) | | | $ | 5,627,779 | | | $ | 5,071,781 | | | $ | (2,196) | | | $ | 5,069,585 | | | 11 | % | | 11 | % |
| EMEA | | 4,106,572 | | | 22,863 | | | 17,038 | | | 4,146,473 | | | 3,699,052 | | | 113,580 | | | 3,812,632 | | | 11 | % | | 9 | % |
| LATAM | | 1,602,603 | | | (53,448) | | | 12,849 | | | 1,562,004 | | | 1,370,913 | | | 26,300 | | | 1,397,213 | | | 17 | % | | 12 | % |
| APAC | | 1,536,786 | | | 50,803 | | | (21,246) | | | 1,566,343 | | | 1,368,561 | | | (8,319) | | | 1,360,242 | | | 12 | % | | 15 | % |
| Total Revenues | | $ | 12,874,176 | | | $ | 27,710 | | | $ | 713 | | | $ | 12,902,599 | | | $ | 11,510,307 | | | $ | 129,365 | | | $ | 11,639,672 | | | 12 | % | | 11 | % |
| | | | | | | | | | | | | | | | | | |
| | | | | | | | | | | | | | | | | | |
Non-GAAP F/X Neutral Operating Margin
To provide additional transparency around our operating margin, we disclose each quarter our year-to-date (YTD) operating margin based on F/X rates at the beginning of each year. This will allow investors to see how our operating margin is tracking against our target (which was set in January of 2026 based on F/X rates at that time), absent intra-year fluctuations in F/X.
| | | | | | | | |
| | YTD 2026 |
| As Reported | | |
| Revenue | | $ | 37,683,871 | |
| Operating Expenses | | 25,075,664 | |
| Operating Profit | | $ | 12,608,207 | |
| Operating Margin | | 33.5 | % |
| | |
| FX Impact | | |
| Revenue | | $ | 113,354 | |
| Operating Expenses | | 17,790 | |
| Operating Profit | | $ | 95,564 | |
| | |
| Adjusted* | | |
| Revenue | | $ | 37,570,517 | |
| Operating Expenses | | 25,057,874 | |
| Operating Profit | | $ | 12,512,643 | |
| Operating Margin | | 33.3 | % |
* Based on F/X rates at the beginning of each year including our F/X hedges at that time. Note: Excludes F/X impact on content amortization, as titles are amortized at a historical blended rate based on timing of spend. YTD 2026 through September 30, 2026.
Non-GAAP Net Debt
| | | | | | | | | | |
| | As of |
| | September 30,
2026 | | |
| Non-GAAP Net Debt reconciliation: | | | | |
| Total debt | | $ | 15,132,394 | | | |
| Add: Debt issuance costs and original issue discount | | 59,251 | | | |
| Add: Fair value hedging adjustment | | 145,158 | | | |
| Less: Cash and cash equivalents | | (8,194,275) | | | |
| Less: Short-term investments | | (28,678) | | | |
| Net debt | | $ | 7,113,850 | | | |