What were the Fund costs for the past year?
(based on a hypothetical $10,000 investment)
|
Fund Name
|
Costs of a $10,000 investment
|
Costs paid as a percentage of a $10,000 investment
|
|---|---|---|
|
Thornburg Core Plus Bond ETF
|
$46.00
|
0.45%
|
How did the Fund perform during the period and what affected its performance?
The Fund outperformed the Bloomberg U.S. Aggregate Total Return Index Value USD (the “Index”) during the 12-month period ended August 31, 2026.
Fixed income markets navigated a sharp shift in expectations issued by the Federal Reserve, from anticipated interest rate cuts in late 2025 to a more hawkish policy stance by mid-2026, as Treasury bond yields rose amid persistent fiscal and inflation concerns. Credit spreads remained tight throughout the period, while a record municipal bond issuance influenced the broader credit market environment.
Active yield curve positioning within U.S. Treasury securities and broad-based security selection within the Fund contributed positively to performance relative to the Index. However, the Fund’s allocation effect and duration positioning detracted from relative performance.
Cumulative Performance
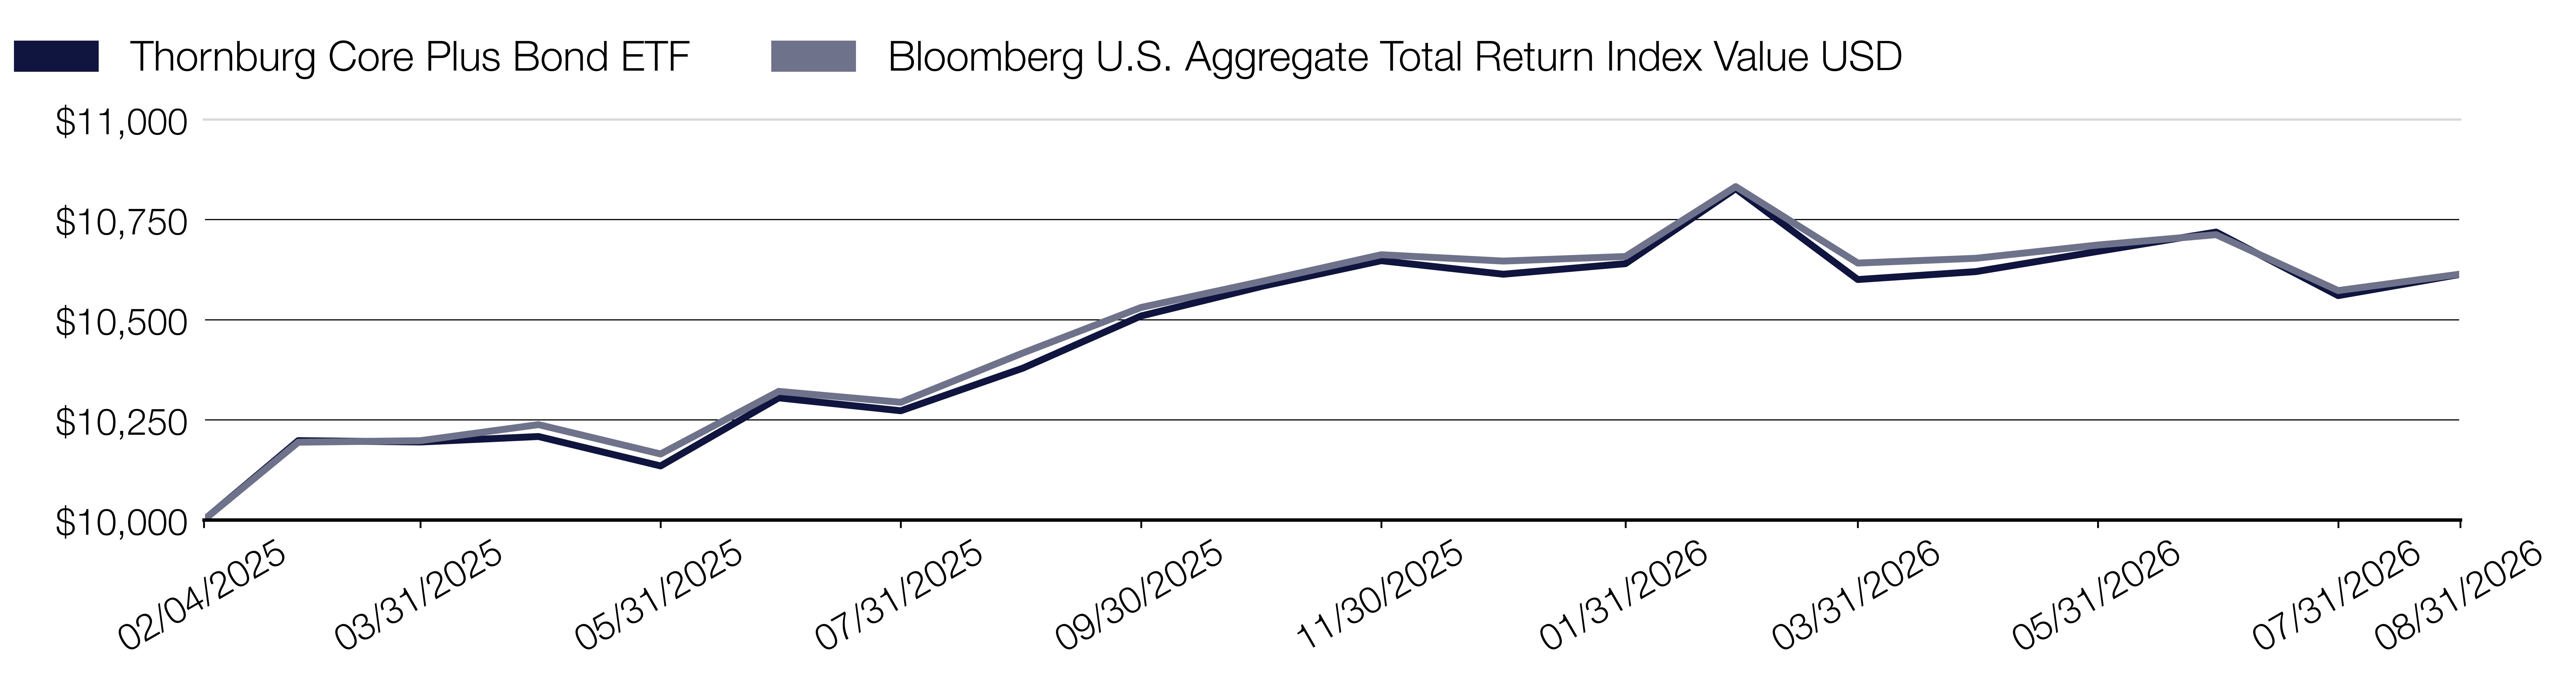
|
Annual Performance
|
1 Year
|
|---|---|
|
Core Plus Bond ETF
|
2.26%
|
|
Bloomberg U.S. Aggregate Total Return Index Value USD
|
1.89%
|
Key Fund Statistics
(as of August 31, 2026 )
|
Fund Size (Millions)
|
$14.8M
|
|
Number of Holdings
|
345
|
|
Portfolio Turnover
|
68.33%
|
|
Total Advisory Fee
|
$0.1M
|
What did the Fund invest in?
(as of August 31, 2026 )
|
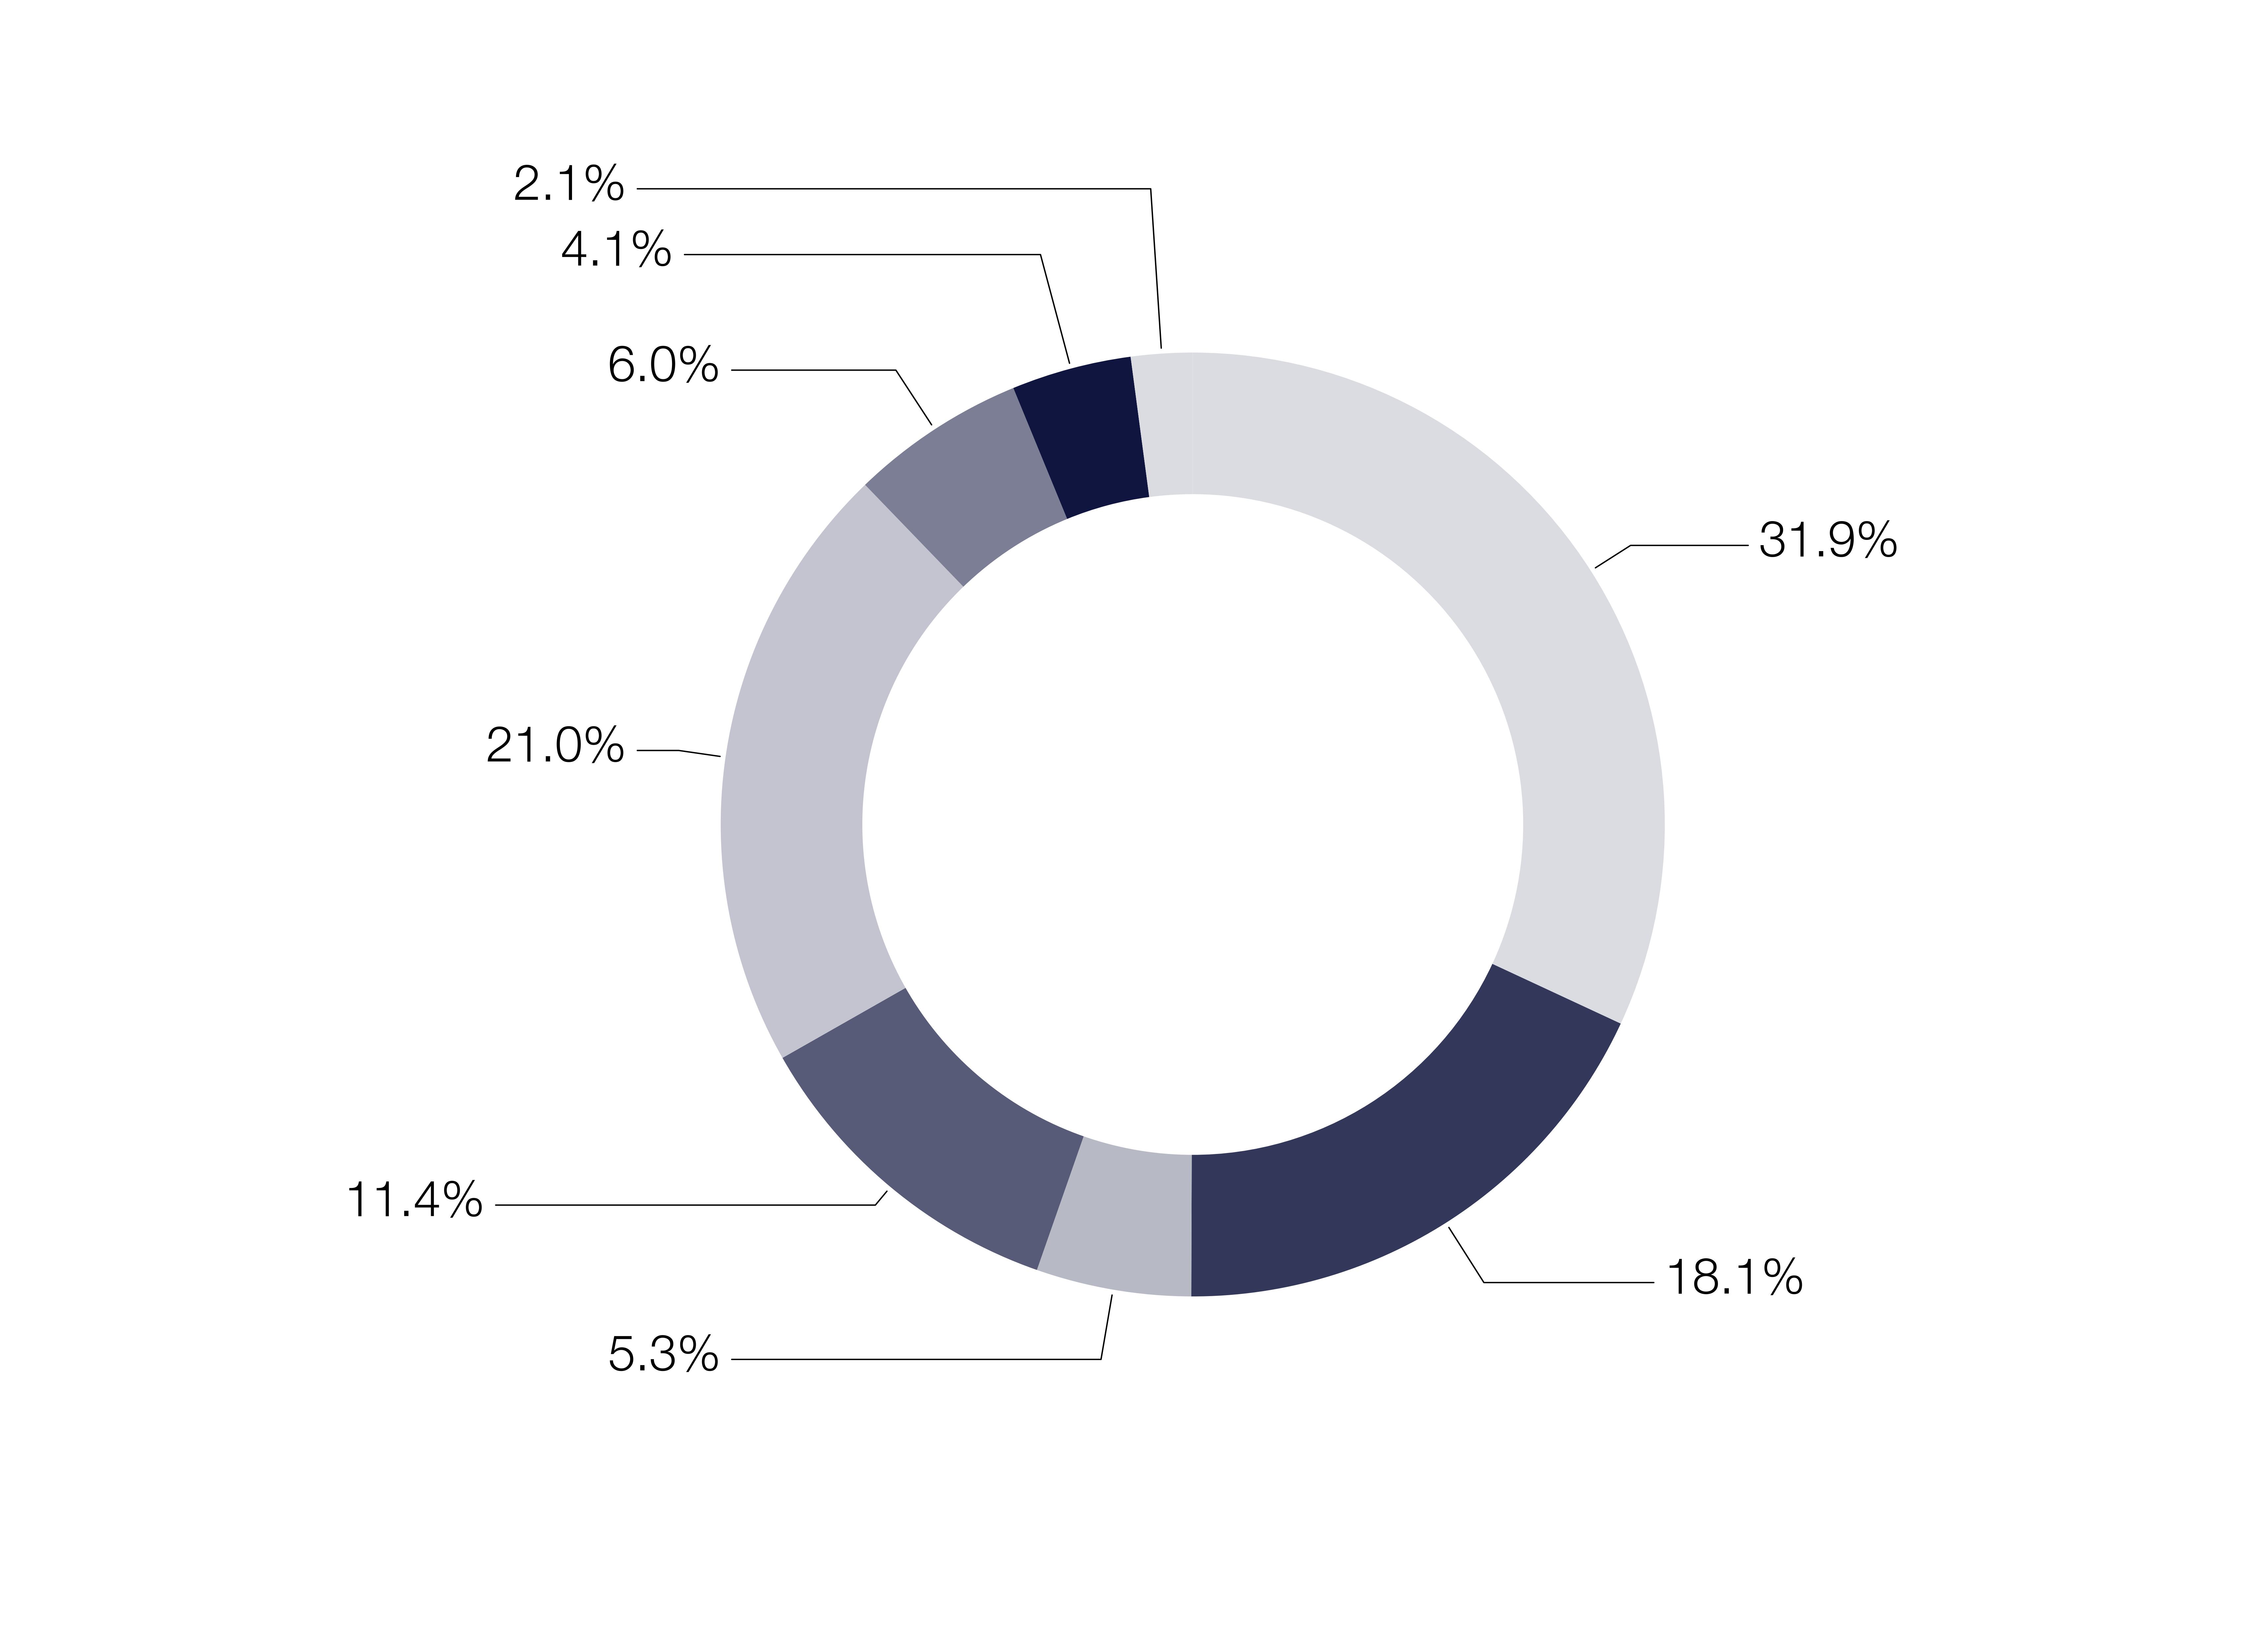
Credit Quality Ratings*
|
(%)
|
|
|---|---|---|
|
U.S. Government
|
||
|
AAA
|
||
|
AA
|
||
|
A
|
||
|
BBB
|
||
|
Below Invest. Grade
|
||
|
NR
|
||
|
Cash Equivalents & Other
|
||
Expressed as a percentage of the Fund’s net assets.
| * | Credit quality ratings shown above reflect the highest rating assigned by either S&P Global Ratings or Moody’s Investors Services, both of which are independent, nationally recognized statistical rating organizations. If a credit rating for an investment is not available from either S&P or Moody’s, then the Fund’s investment advisor will determine the credit quality of the investment. Investments are considered to be investment grade if they are rated within the four highest grades by S&P or Moody’s (BBB/Baa or higher) or, if no credit rating is available, have been judged to be of comparable quality by the Fund’s investment advisor. (NR = Not Rated) |
How has the Fund changed?
This is a summary of certain changes to the Fund since September 1, 2025. For more complete information, you may review the Fund’s next prospectus, which we expect to be available by December 30, 2026 at https://www.thornburg.com/download or upon request by calling 1‑800-847‑0200.
Changes In and Disagreements with Accountants
No changes and/or disagreements occurred in the current reporting period.
What were the Fund costs for the past year?
(based on a hypothetical $10,000 investment)
|
Fund Name
|
Costs of a $10,000 investment
|
Costs paid as a percentage of a $10,000 investment
|
|---|---|---|
|
Thornburg International Equity ETF
|
$73.00
|
0.65%
|
How did the Fund perform during the period and what affected its performance?
The Fund outperformed the MSCI EAFE Net Total Return USD Index (the “Index”) during the 12-month period ended August 31, 2026.
Despite markets navigating shifts in inflation and monetary policy expectations, global growth remained resilient but uneven. Regional equity security performance exhibited wide dispersion and changing market leadership amid heightened geopolitical risk and currency volatility.
The Fund’s sector allocations in health care and consumer staples contributed to performance relative to the Index, while allocations to financials and information technology sectors were detriments to relative performance. From a stock selection perspective, financials and communication services were the leading contributors to performance relative to the Index, while information technology and consumer discretionary were the primary detractors to relative performance.
By geography, stock selection in the United Kingdom and France contributed most to performance relative to the Index, while stock selection and an underweight allocation to Japan were the leading detractors to relative performance. An overweight allocation to Emerging Asia (an economic classification encompassing countries like China, India, Vietnam, Malaysia, Indonesia, Thailand, and the Philippines) also contributed positively to relative performance.
Cumulative Performance
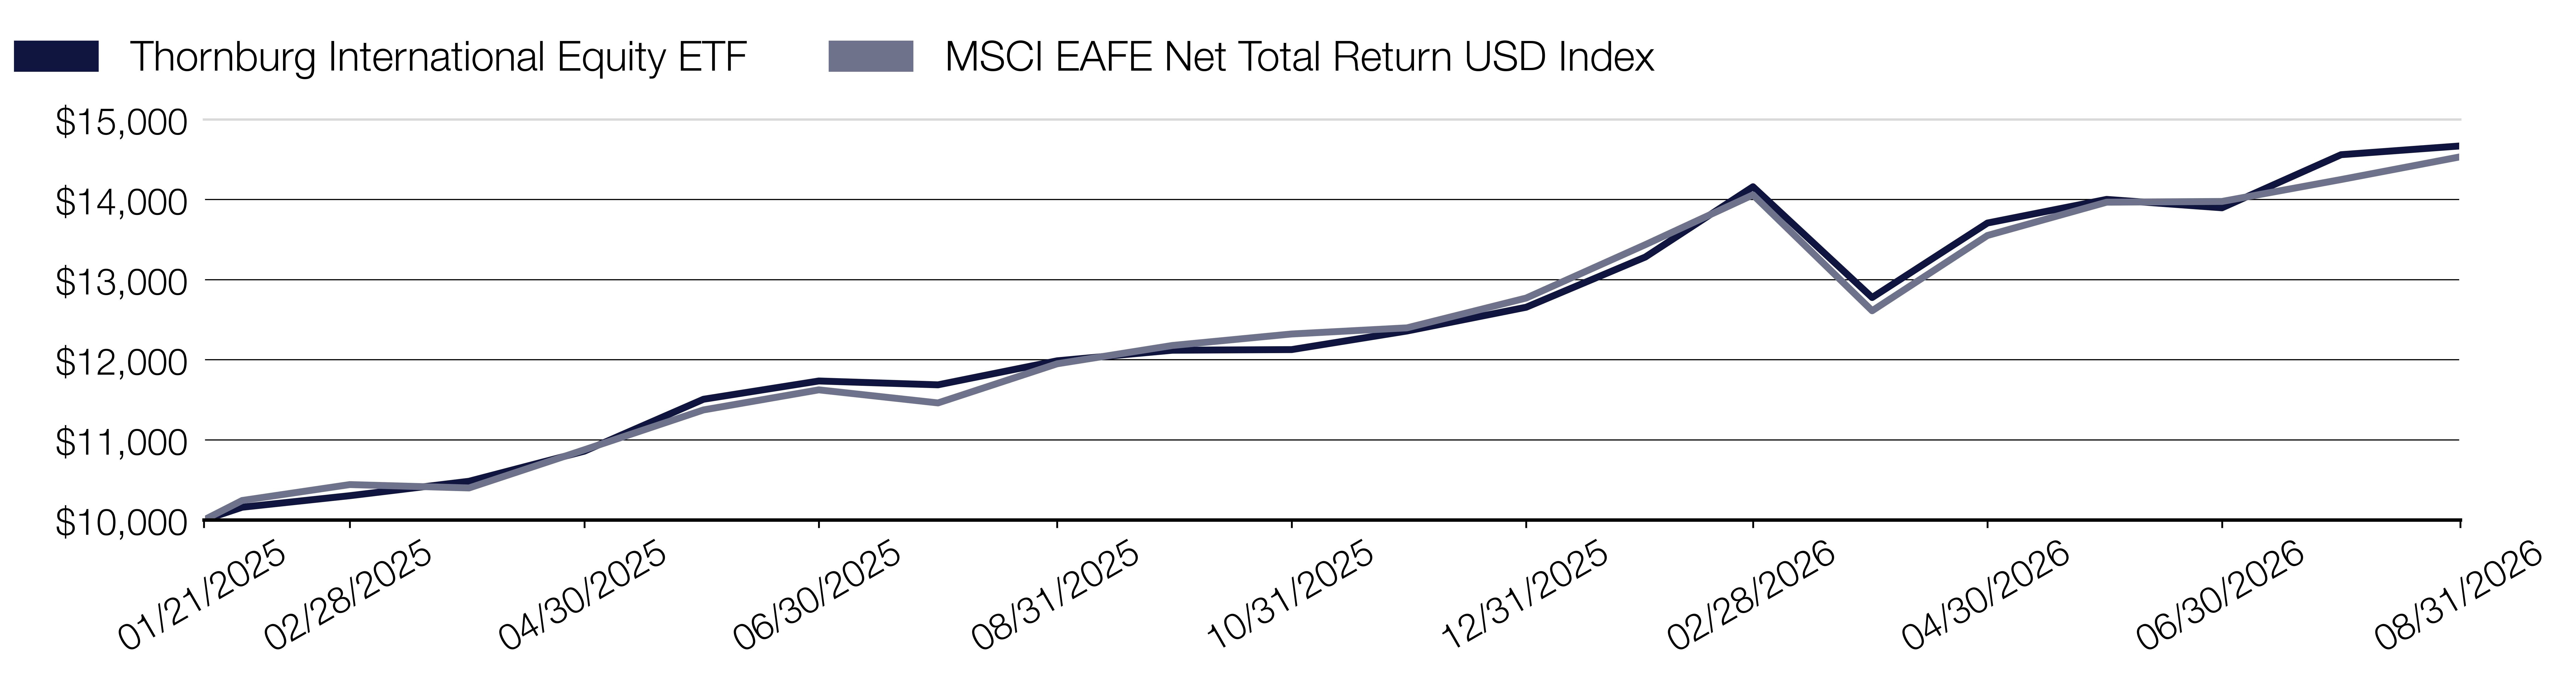
|
Annual Performance
|
1 Year
|
|---|---|
|
International Equity ETF
|
22.38%
|
|
MSCI EAFE Net Total Return USD Index
|
21.62%
|
Key Fund Statistics
(as of August 31, 2026 )
|
Fund Size (Millions)
|
$558.0M
|
|
Number of Holdings
|
50
|
|
Portfolio Turnover
|
10.04%
|
|
Total Advisory Fee
|
$2.5M
|
What did the Fund invest in?
(as of August 31, 2026 )
|
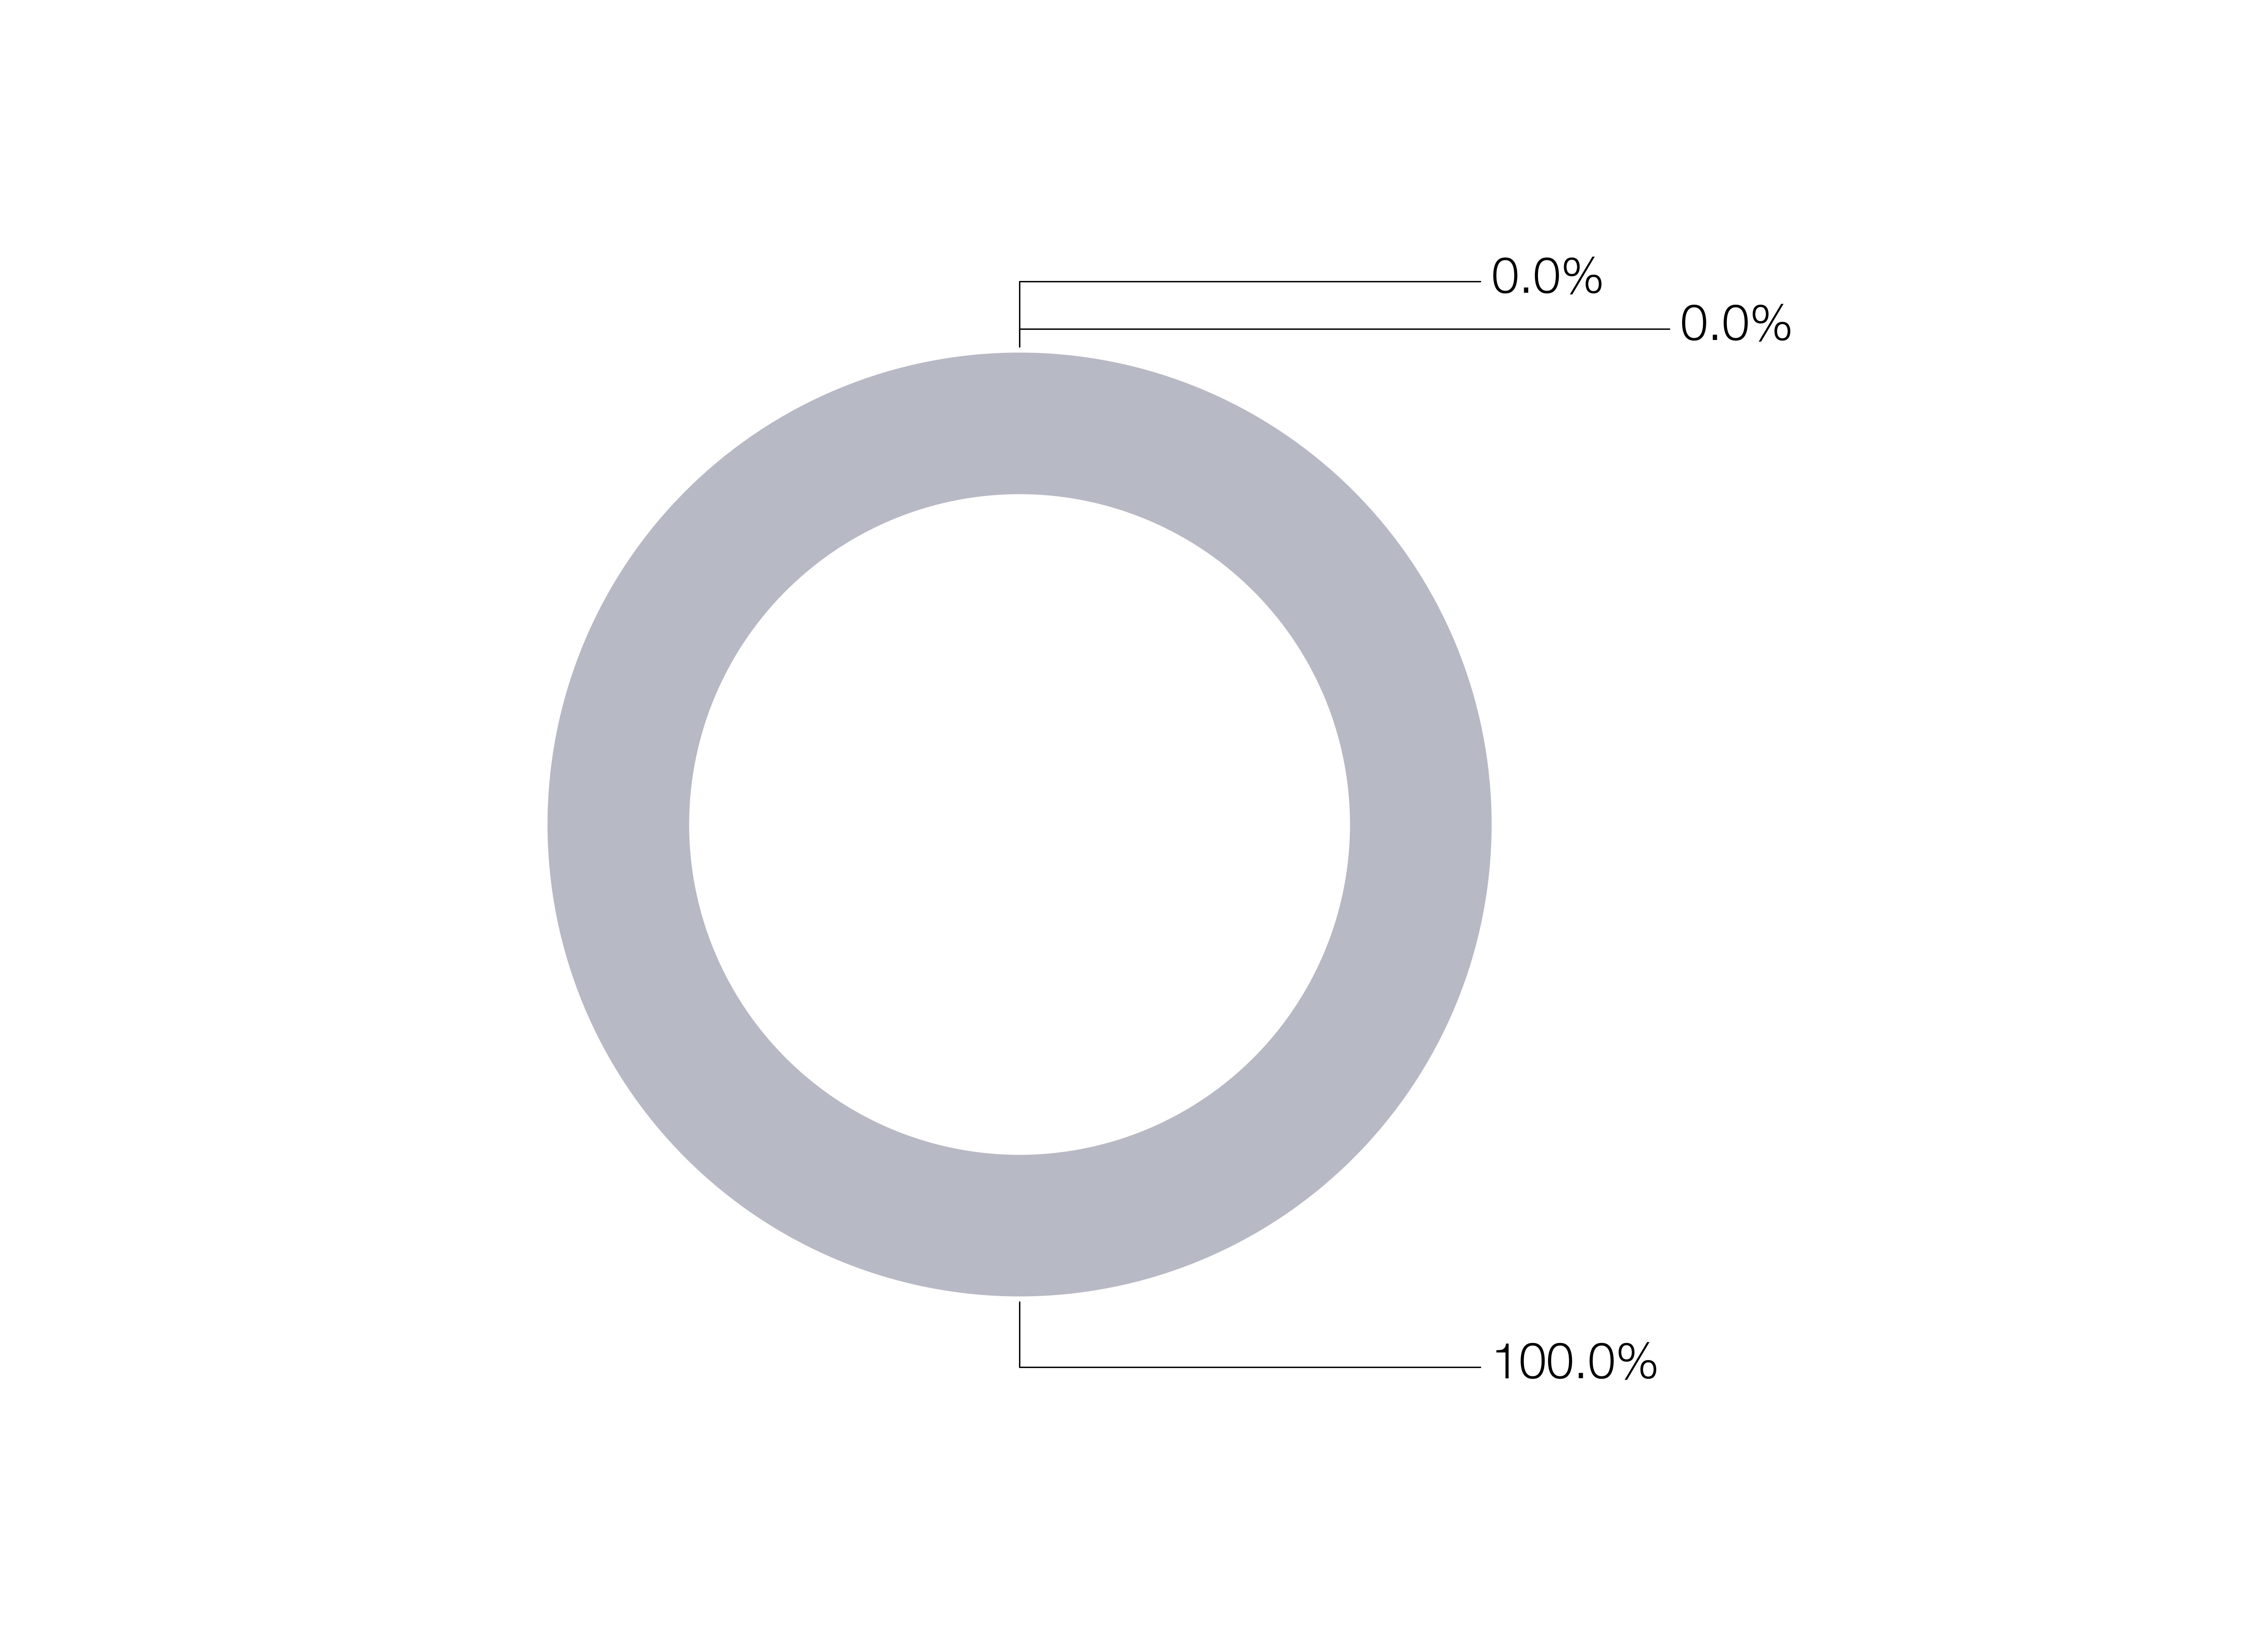
Market Capitalization Exposure
|
(%)
|
|
|---|---|---|
|
Small Cap (<$2.5 B)
|
||
|
Mid Cap ($2.5-12 B)
|
||
|
Large Cap (>$12 B)
|
||
Expressed as a percentage of the Fund’s net assets.
How has the Fund changed?
This is a summary of certain changes to the Fund since September 1, 2025. For more complete information, you may review the Fund’s next prospectus, which we expect to be available by December 30, 2026 at https://www.thornburg.com/download or upon request by calling 1‑800-847‑0200.
Changes In and Disagreements with Accountants
No changes and/or disagreements occurred in the current reporting period.
What were the Fund costs for the past year?
(based on a hypothetical $10,000 investment)
|
Fund Name
|
Costs of a $10,000 investment
|
Costs paid as a percentage of a $10,000 investment
|
|---|---|---|
|
Thornburg International Growth ETF
|
$73.00
|
0.70%
|
How did the Fund perform during the period and what affected its performance?
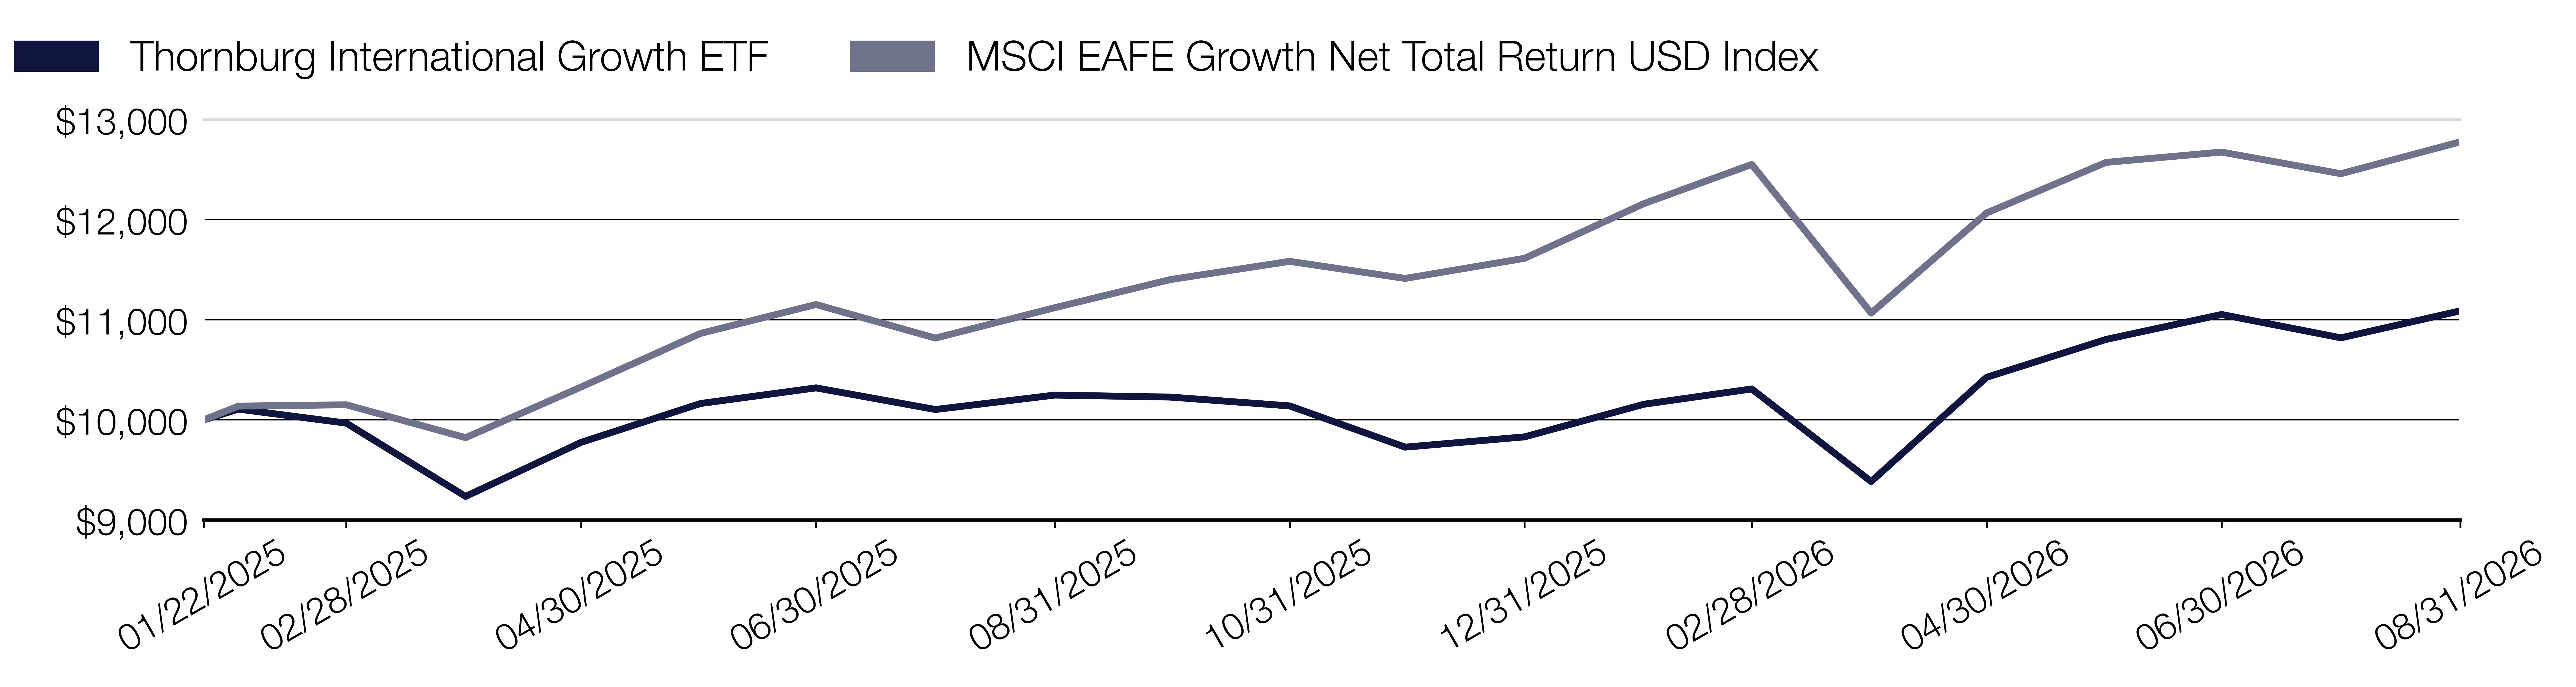
The Fund underperformed the MSCI EAFE Growth Net Total Return USD Index (the “Index”) during the 12-month period ended August 31, 2026.
Despite markets navigating shifts in inflation and monetary policy expectations, global growth remained resilient but uneven. Regional equity security performance exhibited wide dispersion and changing market leadership amid heightened geopolitical risk and currency volatility.
The Fund’s sector allocations in information technology and consumer staples contributed to performance relative to the Index, while allocations to industrials and communication services were detriments to relative performance. From a stock selection perspective, financials and utilities were the leading contributors to performance relative to the Index, while consumer discretionary and communication services were the primary detractors to relative performance.
By geography, allocation effects in Taiwan and the Netherlands contributed most to performance relative to the Index, while allocations to Brazil and Japan were the leading detractors to relative performance. From a stock selection perspective, the United Kingdom and the Netherlands were the top contributors to performance relative to the Index, while Switzerland and Japan were the most significant detractors to relative performance.
Cumulative Performance
|
Annual Performance
|
1 Year
|
|---|---|
|
International Growth ETF
|
8.21%
|
|
MSCI EAFE Growth Net Total Return USD Index
|
14.89%
|
Key Fund Statistics
(as of August 31, 2026 )
|
Fund Size (Millions)
|
$4.4M
|
|
Number of Holdings
|
44
|
|
Portfolio Turnover
|
40.62%
|
|
Total Advisory Fee
|
$33,961
|
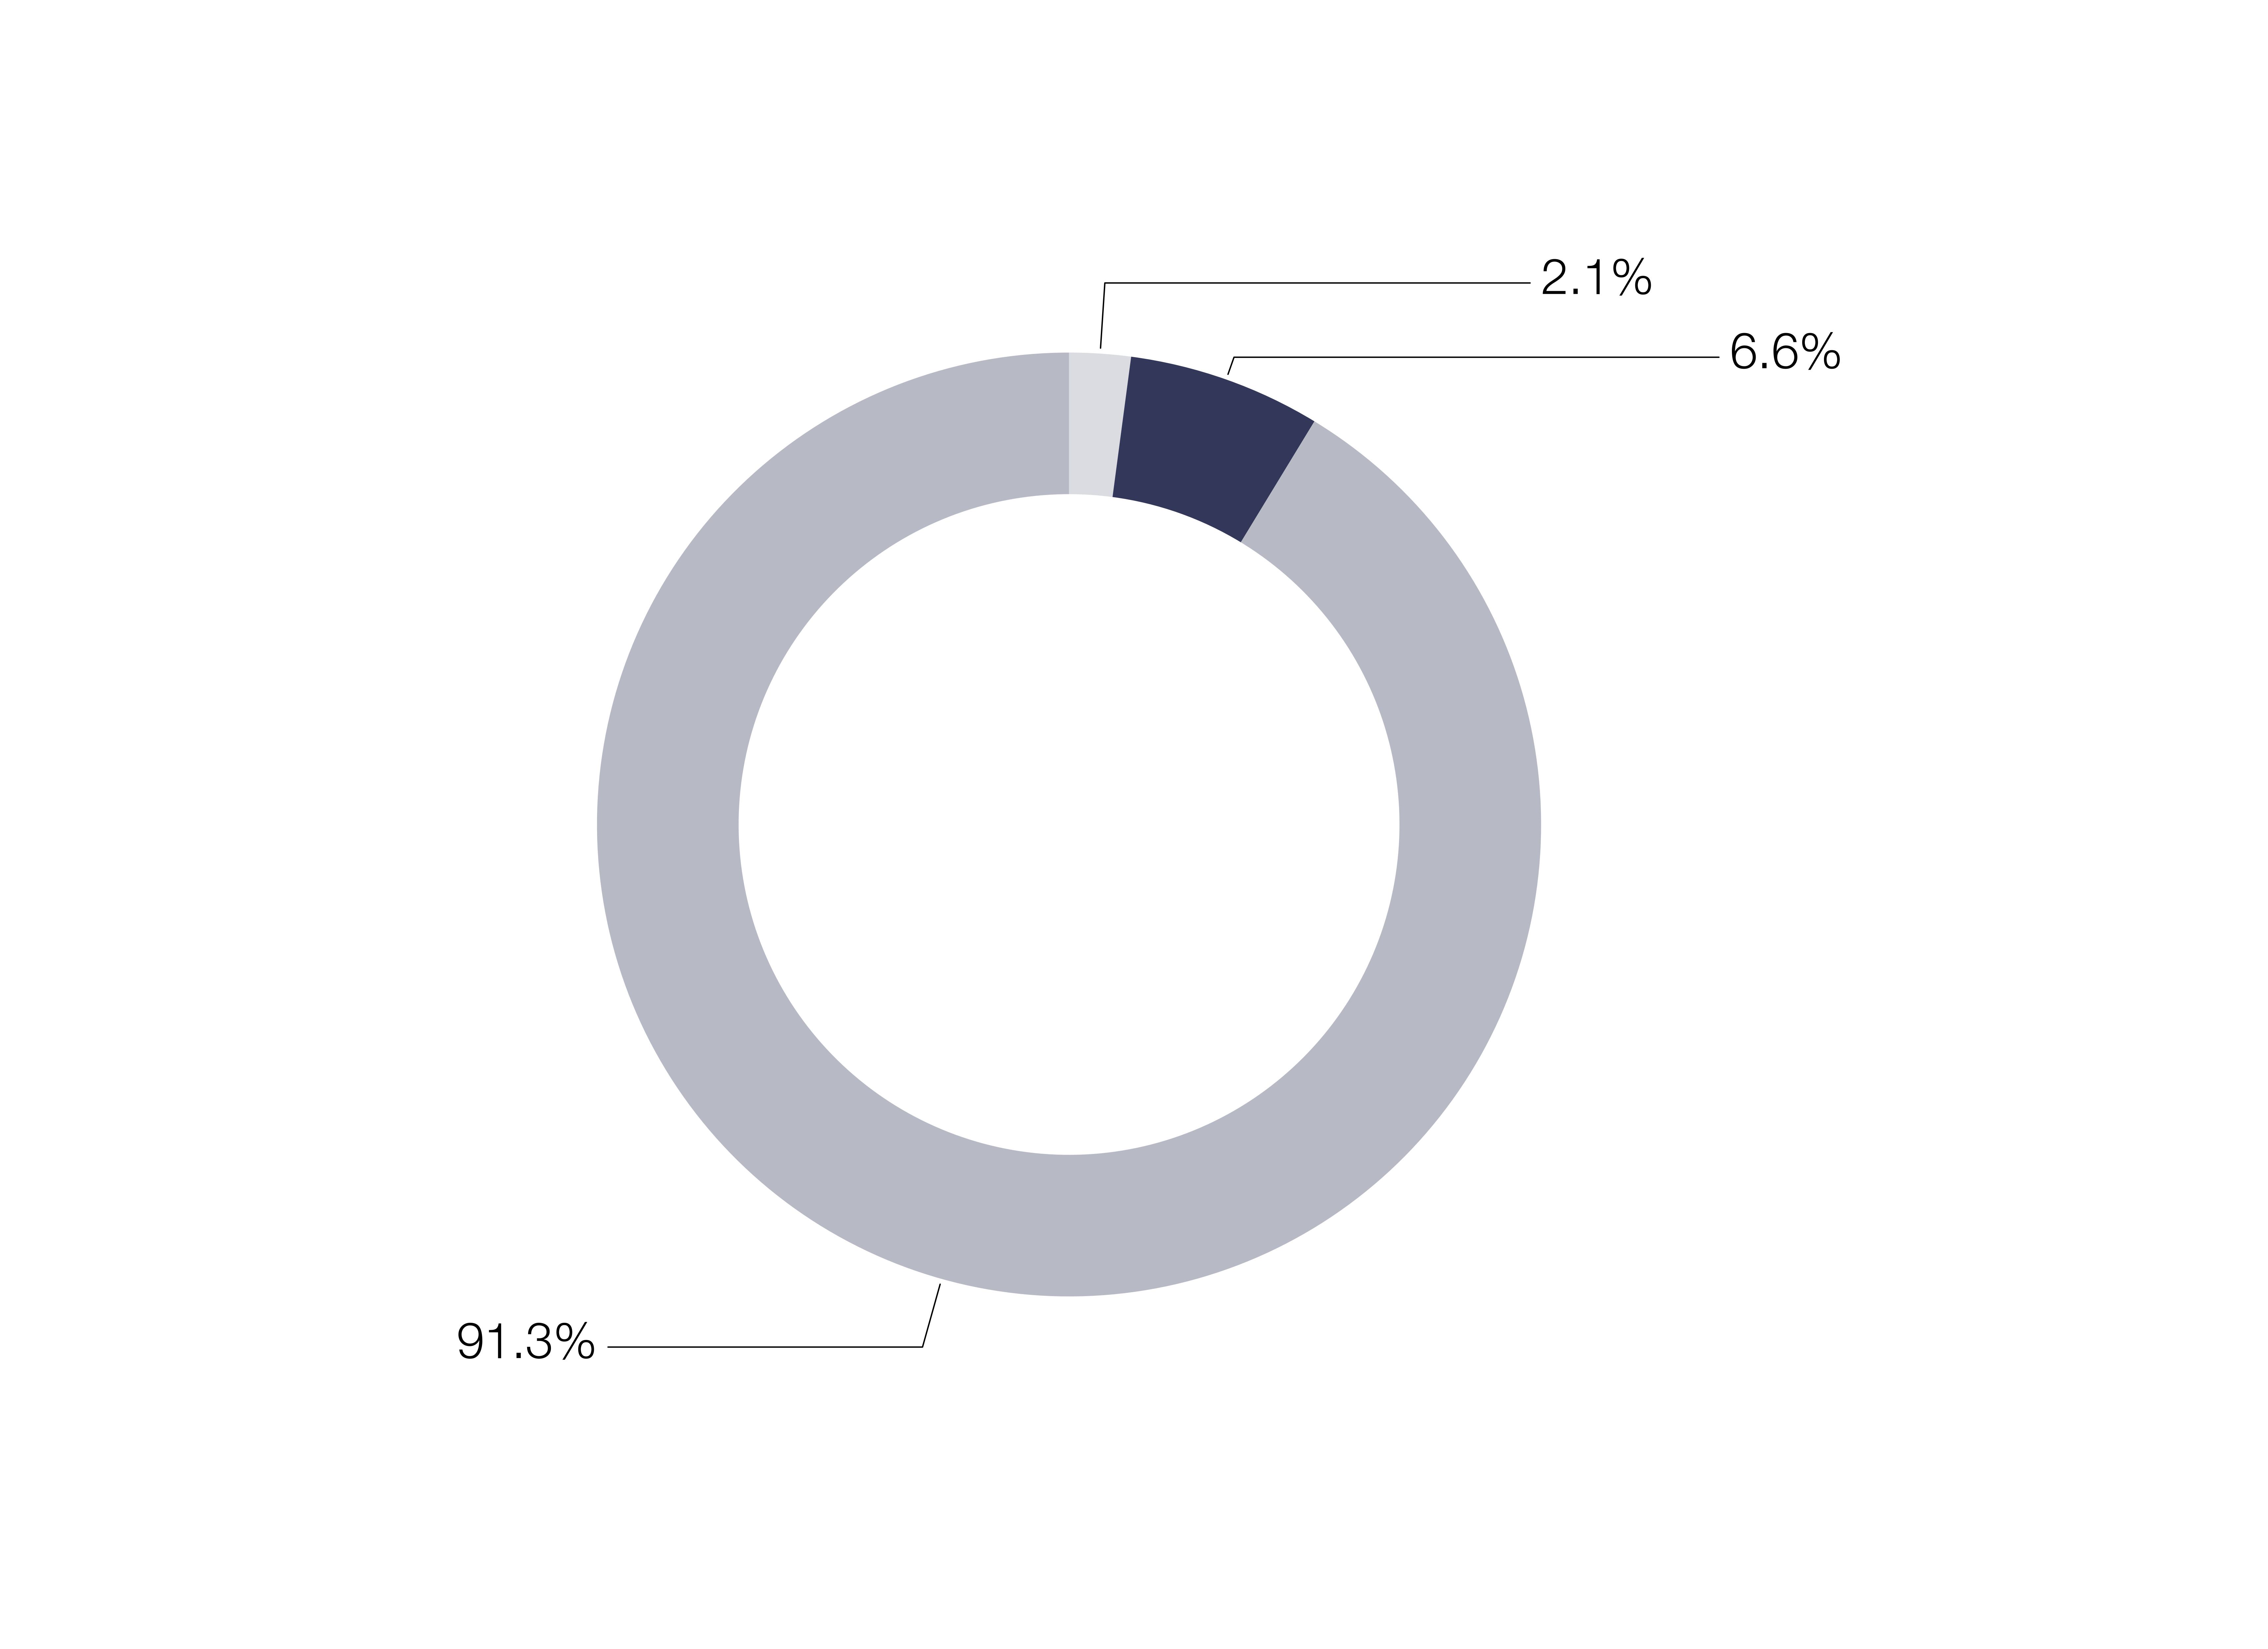
What did the Fund invest in?
(as of August 31, 2026 )
|
Market Capitalization Exposure
|
(%)
|
|
|---|---|---|
|
Small Cap (<$2.5 B)
|
||
|
Mid Cap ($2.5-12 B)
|
||
|
Large Cap (>$12 B)
|
||
Expressed as a percentage of the Fund’s net assets.
How has the Fund changed?
This is a summary of certain changes to the Fund since September 1, 2025. For more complete information, you may review the Fund’s next prospectus, which we expect to be available by December 30, 2026 at https://www.thornburg.com/download or upon request by calling 1‑800-847‑0200.
Changes In and Disagreements with Accountants
No changes and/or disagreements occurred in the current reporting period.
What were the Fund costs for the past year?
(based on a hypothetical $10,000 investment)
|
Fund Name
|
Costs of a $10,000 investment
|
Costs paid as a percentage of a $10,000 investment
|
|---|---|---|
|
Thornburg Multi Sector Bond ETF
|
$56.00
|
0.55%
|
How did the Fund perform during the period and what affected its performance?
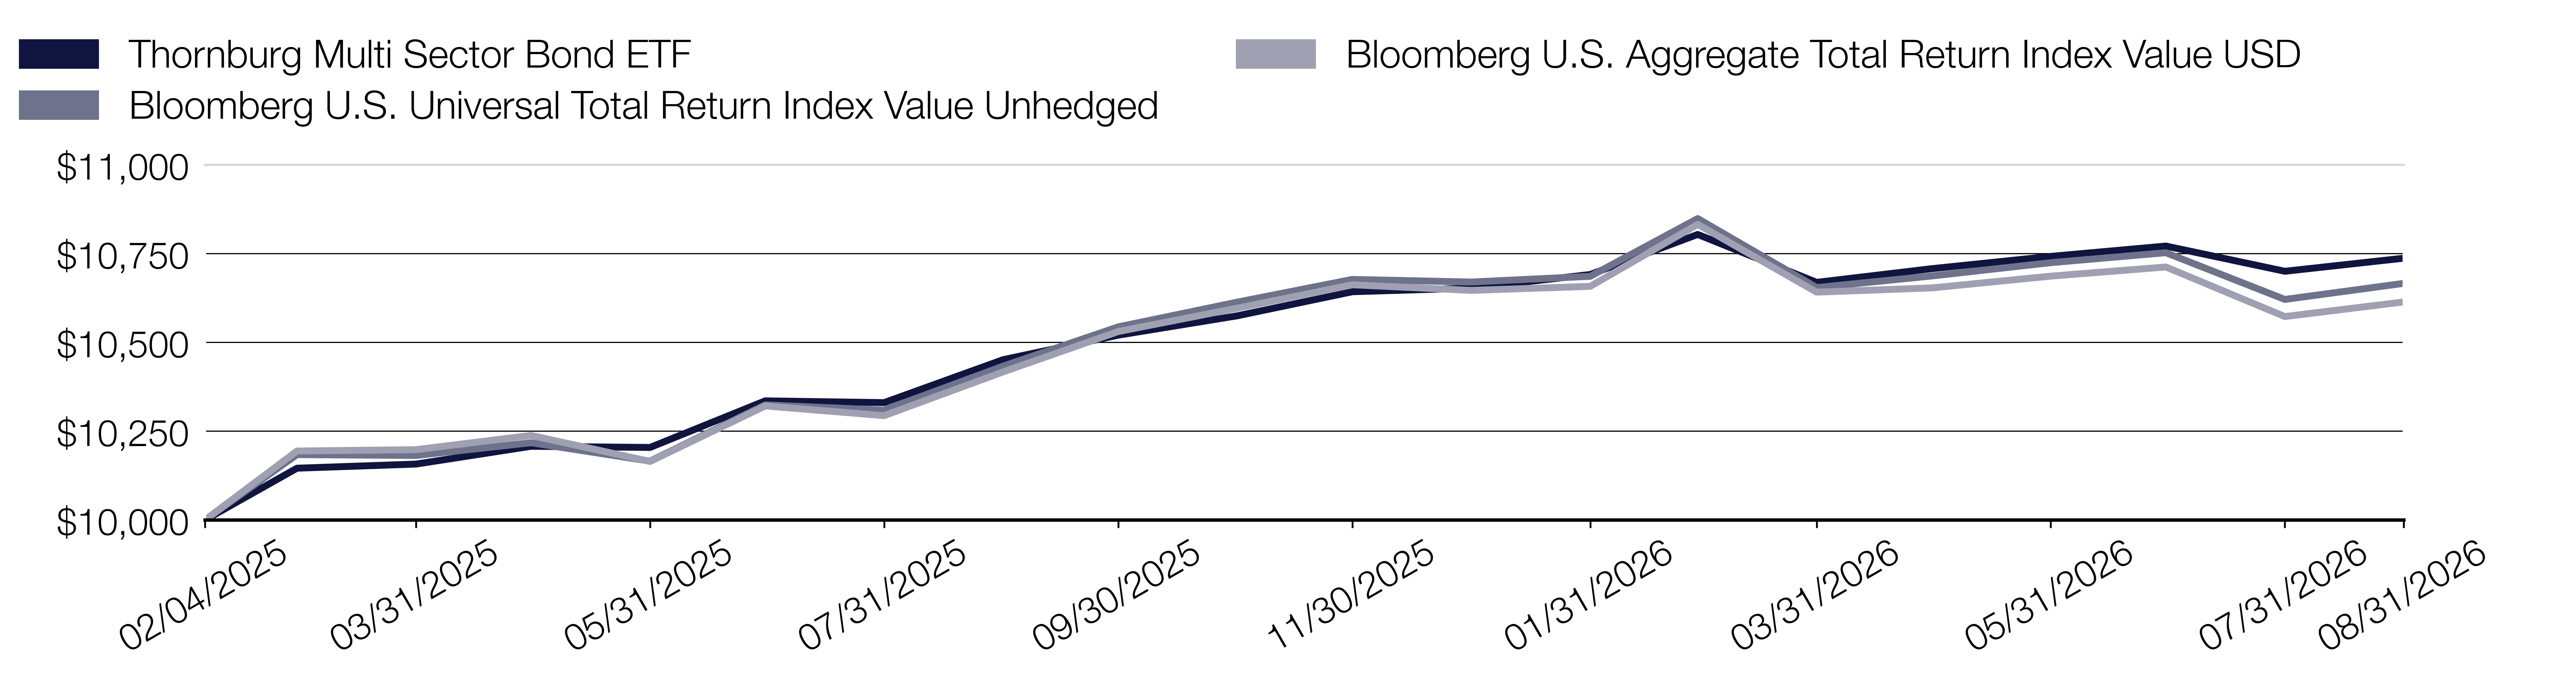
The Fund outperformed the Bloomberg U.S. Universal Total Return Index Value Unhedged (the “Index”) during the 12-month period ended August 31, 2026.
Fixed income markets navigated a sharp shift in expectations issued by the Federal Reserve, from anticipated interest rate cuts in late 2025 to a more hawkish policy stance by mid-2026, as Treasury bond yields rose amid persistent fiscal and inflation concerns. Credit spreads remained tight throughout the period, while a record municipal bond issuance influenced the broader credit market environment.
Security selection within corporate bonds and duration positioning were the primary contributors to performance relative to the Index. However, the Fund’s yield curve positioning detracted from relative performance.
Cumulative Performance
|
Annual Performance
|
1 Year
|
|---|---|
|
Multi Sector Bond ETF
|
2.73%
|
|
Bloomberg U.S. Aggregate Total Return Index Value USD
|
1.89%
|
|
Bloomberg U.S. Universal Total Return Index Value Unhedged
|
2.23%
|
Key Fund Statistics
(as of August 31, 2026 )
|
Fund Size (Millions)
|
$259.4M
|
|
Number of Holdings
|
635
|
|
Portfolio Turnover
|
93.82%
|
|
Total Advisory Fee
|
$0.7M
|
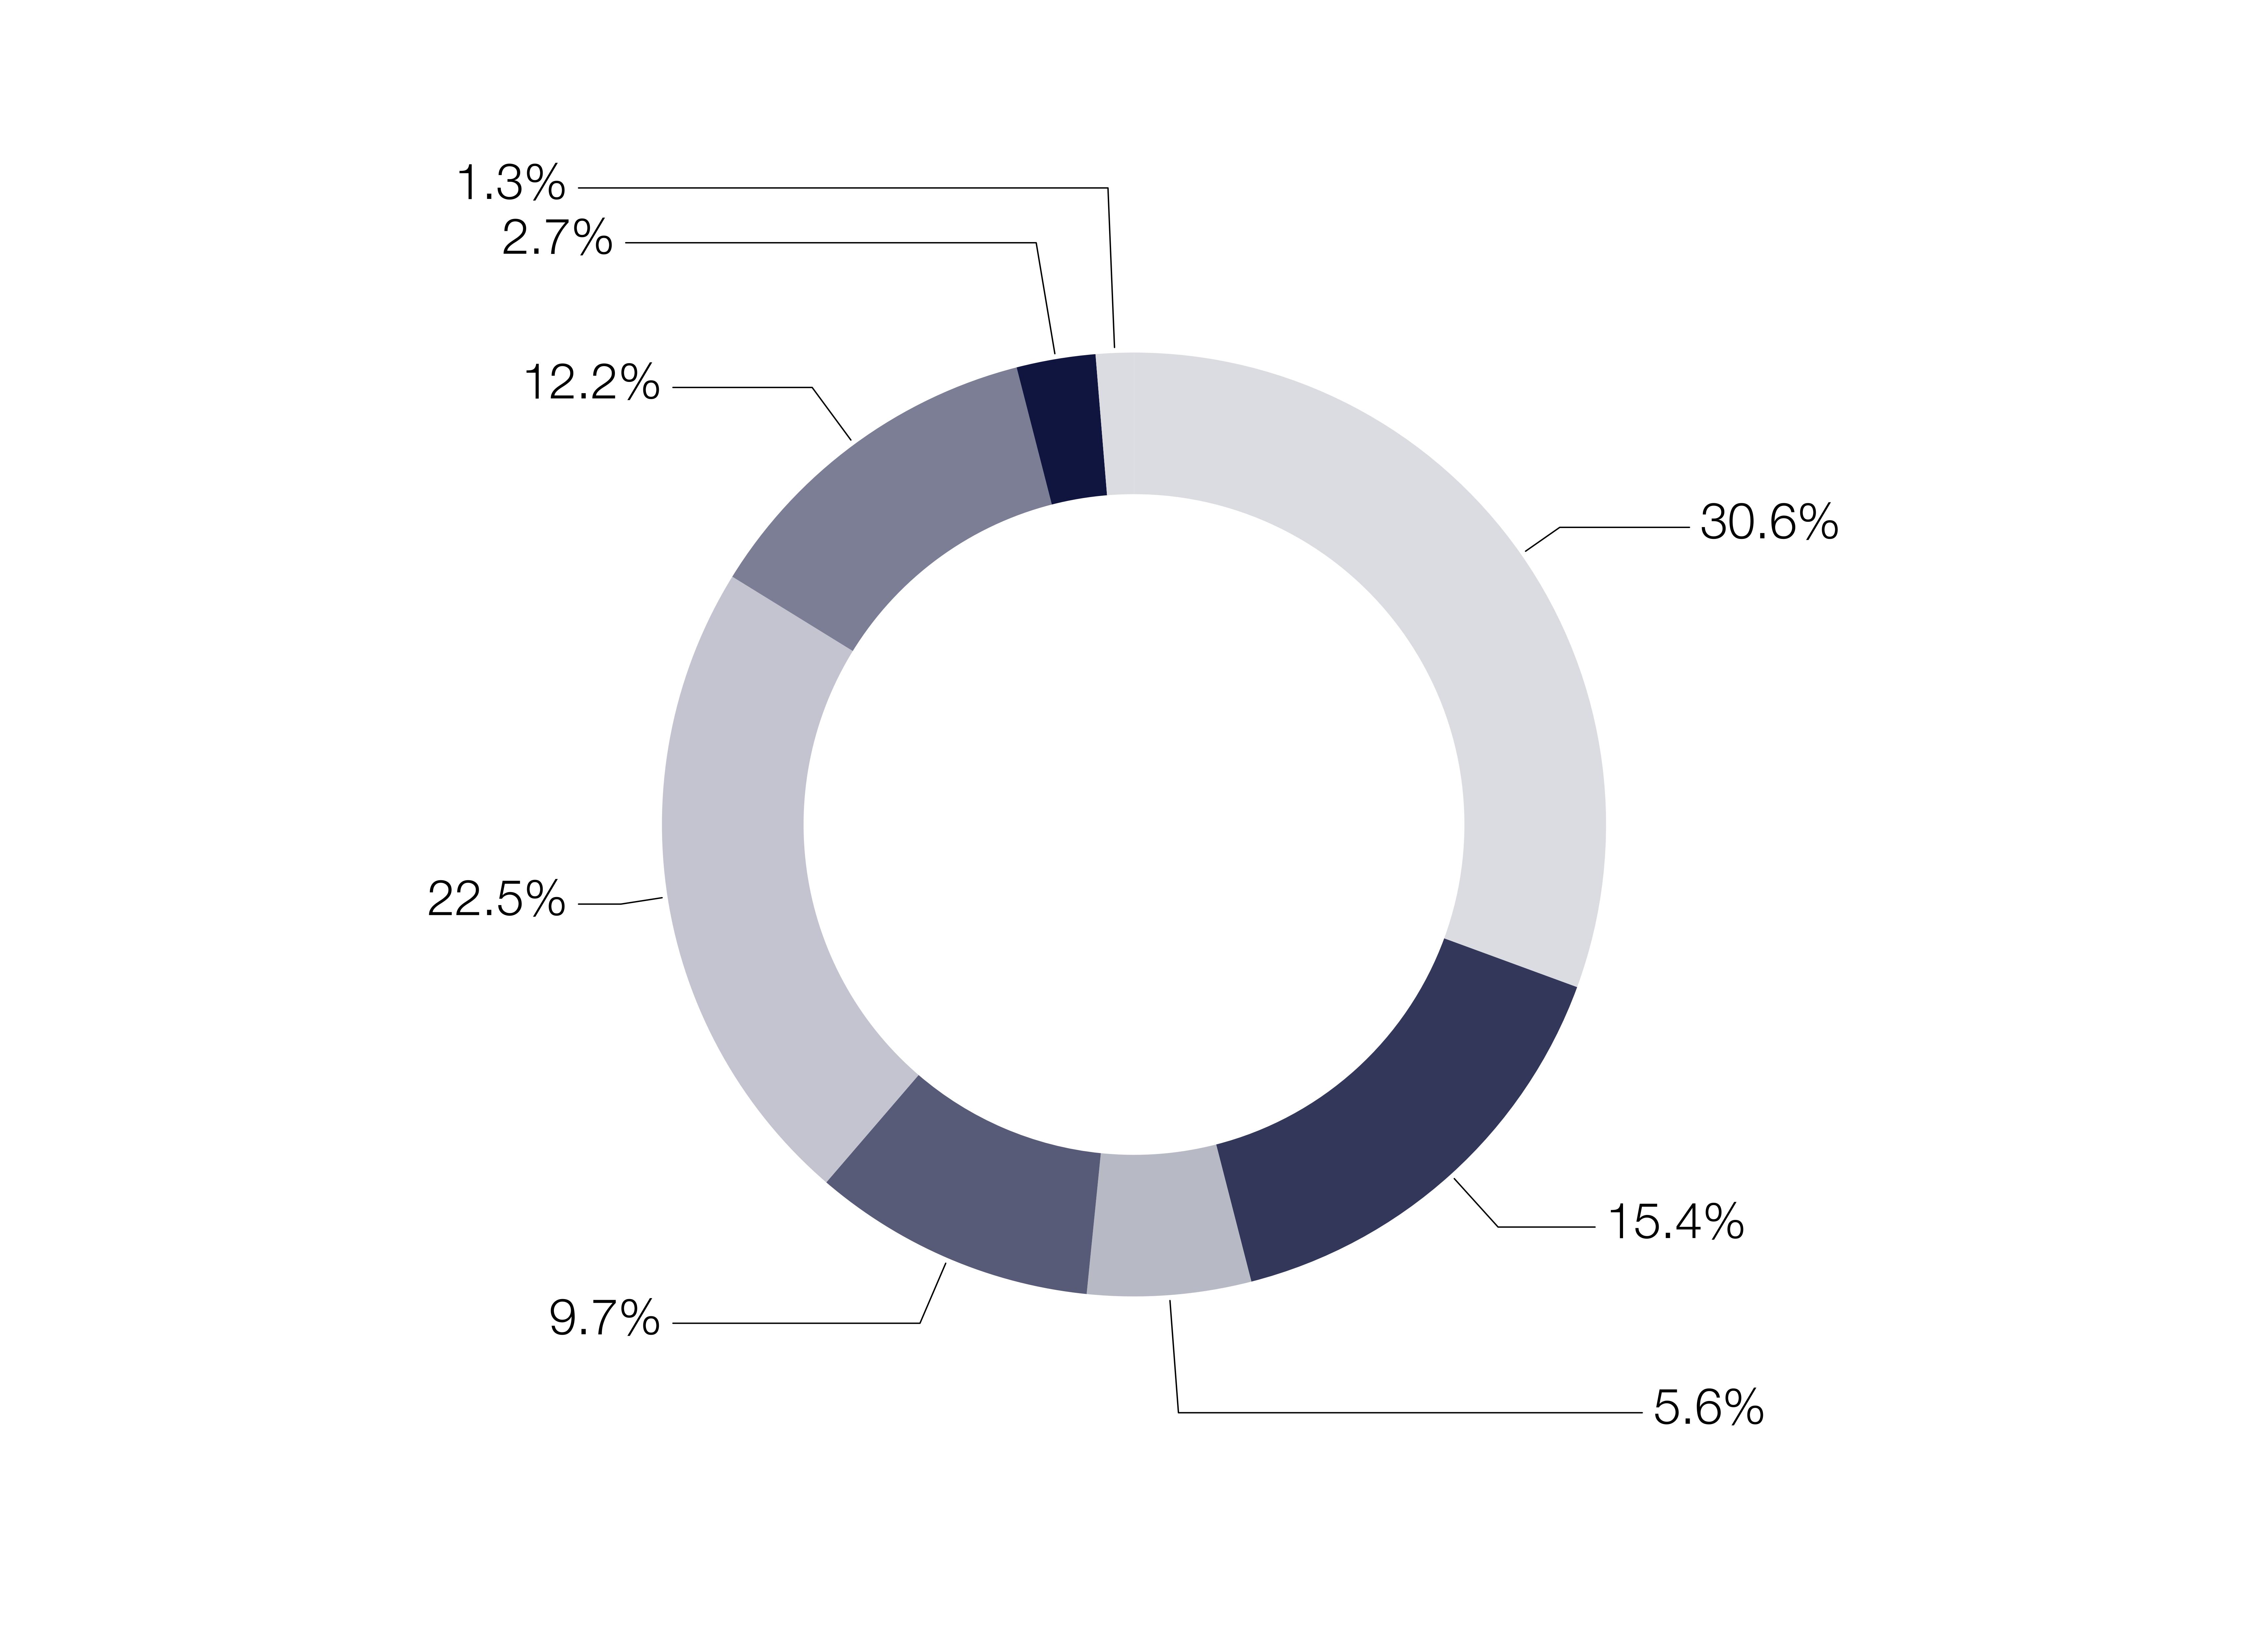
What did the Fund invest in?
(as of August 31, 2026 )
|
Fixed Income Credit Quality*
|
(%)
|
|
|---|---|---|
|
U.S. Government
|
||
|
AAA
|
||
|
AA
|
||
|
A
|
||
|
BBB
|
||
|
Below Invest. Grade
|
||
|
NR
|
||
|
Cash Equivalents & Other
|
||
Expressed as a percentage of the Fund’s net assets.
| * | Credit quality ratings shown above reflect the highest rating assigned by either S&P Global Ratings or Moody’s Investors Services, both of which are independent, nationally recognized statistical rating organizations. If a credit rating for an investment is not available from either S&P or Moody’s, then the Fund’s investment advisor will determine the credit quality of the investment. Investments are considered to be investment grade if they are rated within the four highest grades by S&P or Moody’s (BBB/Baa or higher) or, if no credit rating is available, have been judged to be of comparable quality by the Fund’s investment advisor. (NR = Not Rated) |
How has the Fund changed?
This is a summary of certain changes to the Fund since September 1, 2025. For more complete information, you may review the Fund’s next prospectus, which we expect to be available by December 30, 2026 at https://www.thornburg.com/download or upon request by calling 1‑800-847‑0200.
Changes In and Disagreements with Accountants
No changes and/or disagreements occurred in the current reporting period.
What were the Fund costs since inception?
(based on a hypothetical $10,000 investment)
|
Fund Name
|
Costs of a $10,000 investment
|
Costs paid as a percentage of a $10,000 investment
|
|---|---|---|
|
Thornburg Premium Income Builder ETF
|
$16.00
|
0.79%
|
Fund costs may be higher for a full one-year period.
How did the Fund perform during the period and what affected its performance?
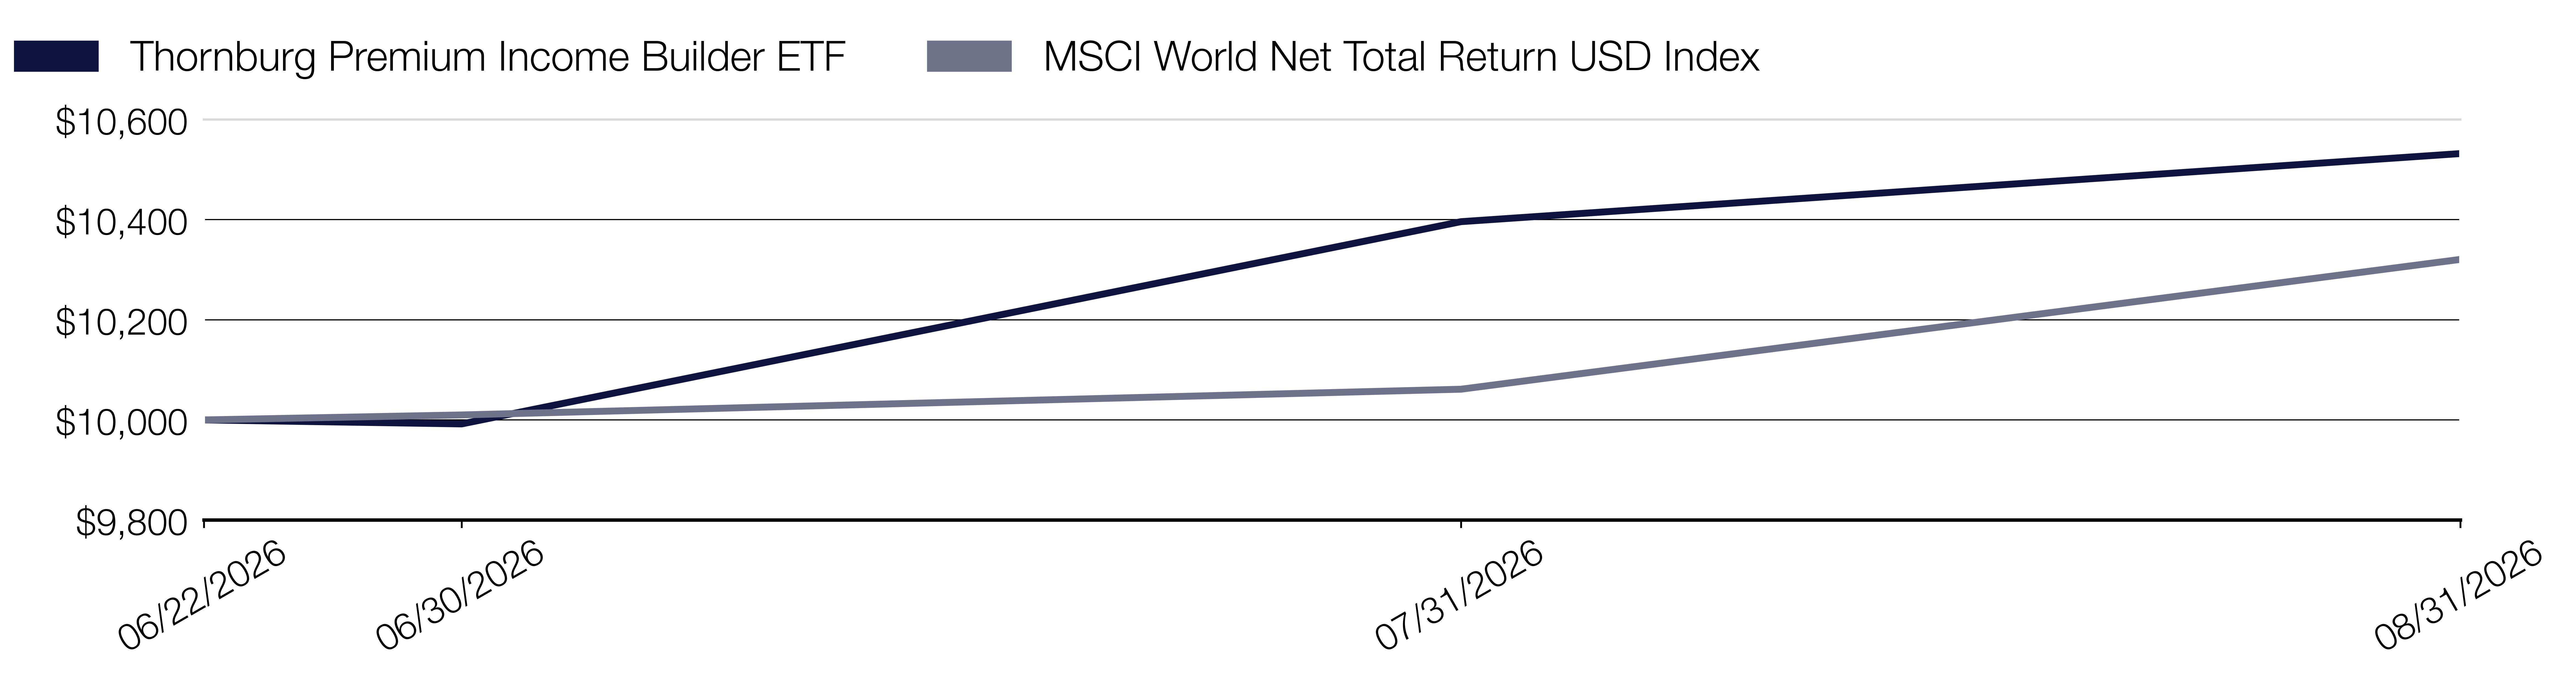
The Fund outperformed the MSCI World Net Total Return USD Index (the “Index”) during the period from the Fund’s inception on June 22, 2026 to August 31, 2026.
Despite markets navigating shifts in inflation and monetary policy expectations, global growth remained resilient but uneven. Regional equity security performance exhibited wide dispersion and changing market leadership amid heightened geopolitical risk and currency volatility.
The Fund’s sector allocations in energy and financials contributed positively to performance relative to the Index, while allocations to communication services and utilities detracted from relative performance. From a stock selection perspective, communication services and industrials were the leading contributors to performance relative to the Index, while energy and information technology were the primary detractors to relative performance.
By geography, stock selections in the United States and the Netherlands were the strongest contributors to performance relative to the Index while selections in Italy and Canada were the leading detractors to relative performance. Allocation effects in the Netherlands and South Korea also contributed positively to performance relative to the Index, while allocations to the United Kingdom and the United States detracted from relative performance.
Cumulative Performance
|
Annual Performance
|
Since Inception (06/22/2026)
|
|---|---|
|
Premium Income Builder ETF
|
5.32%
|
|
MSCI World Net Total Return USD Index
|
3.21%
|
Key Fund Statistics
(as of August 31, 2026 )
|
Fund Size (Millions)
|
$23.7M
|
|
Number of Holdings
|
58
|
|
Portfolio Turnover
|
2.43%
|
|
Total Advisory Fee
|
$23,955
|
What did the Fund invest in?
(as of August 31, 2026 )
|
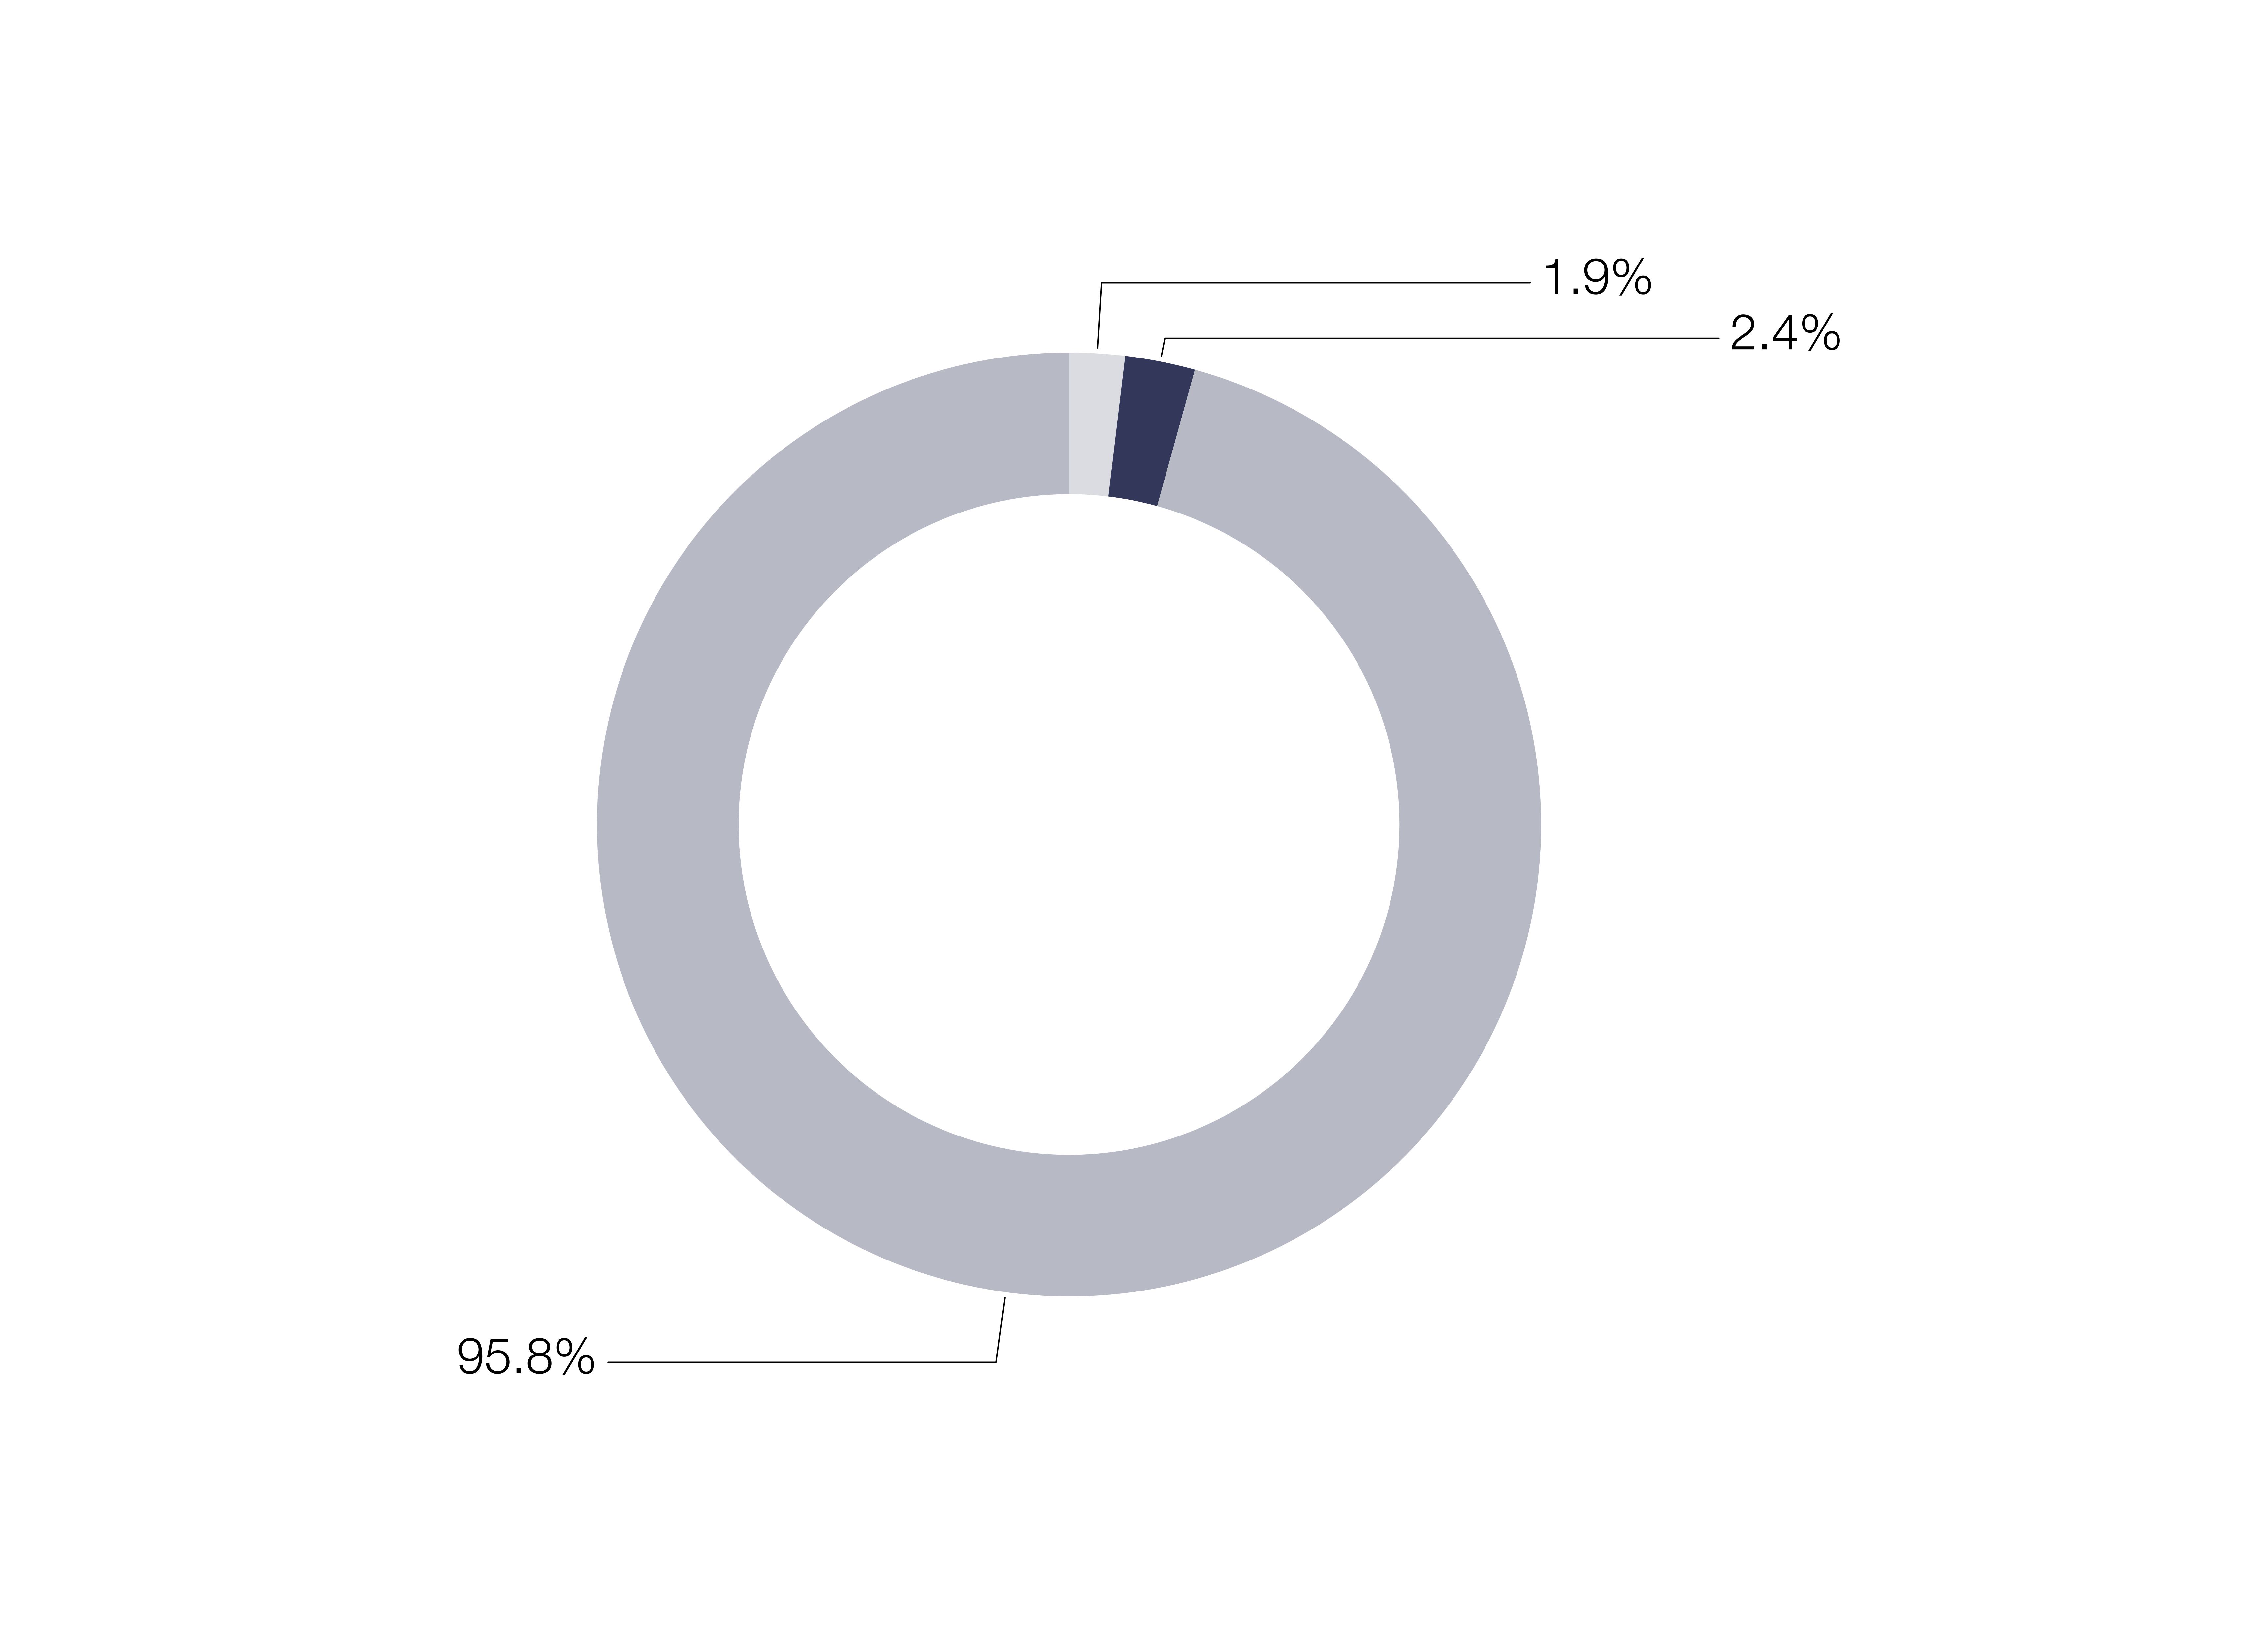
Market Capitalization Exposure
|
(%)
|
|
|---|---|---|
|
Small Cap (<$2.5 B)
|
||
|
Mid Cap ($2.5-12 B)
|
||
|
Large Cap (>$12 B)
|
||
Expressed as a percentage of the Fund’s net assets.
How has the Fund changed?
This is a summary of certain changes to the Fund since June 22, 2026. For more complete information, you may review the Fund’s next prospectus, which we expect to be available by December 30, 2026 at https://www.thornburg.com/download or upon request by calling 1‑800-847‑0200.
Changes In and Disagreements with Accountants
No changes and/or disagreements occurred in the current reporting period.