
3Q 26 EWBC NasdaqListed East West Bancorp, Inc. 3Q Earnings Presentation October 20, 2026
2 Forward-Looking Statements and Additional Information In this presentation, “we”, “our”, “us”, “East West” and the “Company” refer to East West Bancorp, Inc., and its consolidated subsidiaries unless the context indicates otherwise. Forward-Looking Statements This presentation contains forward-looking statements that are intended to be covered by the safe harbor for such statements provided by the Private Securities Litigation Reform Act of 1995. These statements are based on the current assumptions, beliefs, estimates, and projections, many of which, by their nature, are inherently uncertain and beyond our control. You should not place undue reliance on these statements. There are various important factors that could cause the Company’s future results to differ materially from historical performance and any forward-looking statements, including the factors described in the Company’s filings with the Securities and Exchange Commission, including the “Risk Factors” section of the Company’s Annual Report on Form 10-K for the year ended December 31, 2025 and in its subsequent Quarterly Reports on Form 10-Q. When considering these forward-looking statements, you should keep in mind these risks and uncertainties, as well as any cautionary statements the Company may make. These statements speak only as of the date they are made and are based only on information then actually known to the Company. The Company does not undertake, and specifically disclaims, any obligation to update or revise any forward-looking statements, whether written or oral, except as required by law. Basis of Presentation The preparation of the Company’s consolidated financial statements in conformity with U.S. generally accepted accounting principles (“GAAP”) requires management to make estimates and assumptions that affect the reported amounts of assets and liabilities as of the date of the consolidated financial statements, income and expenses during the reporting periods, and the related disclosures. Although our estimates consider current conditions and how we expect them to change in the future, it is reasonably possible that actual results could be materially different from those estimates. Hence, the current period’s results of operations are not necessarily indicative of results that may be expected for any future interim period or for the year as a whole. Certain prior period information has been reclassified to conform to the current presentation. Industry Information This presentation includes statistical and other industry and market data that we obtained from government reports and other third-party sources. Although we believe that this information is accurate and reliable, we have not independently verified such information. Forward-looking information that we have obtained from these sources is subject to the same uncertainties and qualifications as other forward-looking statements contained herein. Non-GAAP Financial Measures Certain financial information in this presentation has not been prepared in accordance with GAAP and is presented on a non-GAAP basis. Investors should refer to the reconciliations included in the appendix to this presentation and should consider the Company’s non-GAAP measures in addition to, not as a substitute for or superior to, measures prepared in accordance with GAAP. These measures may not be comparable to similarly titled measures used by other companies.
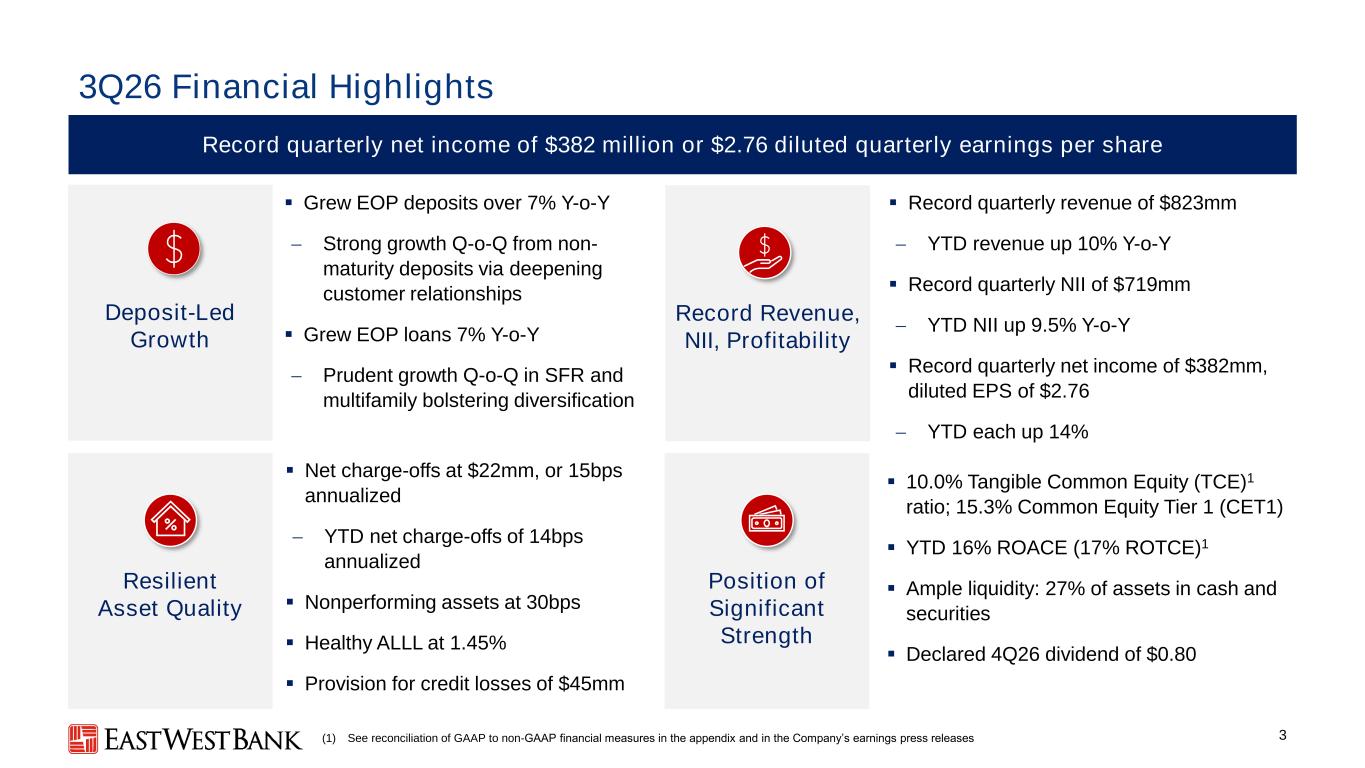
3 3Q26 Financial Highlights Record quarterly net income of $382 million or $2.76 diluted quarterly earnings per share ▪ Grew EOP deposits over 7% Y-o-Y − Strong growth Q-o-Q from non- maturity deposits via deepening customer relationships ▪ Grew EOP loans 7% Y-o-Y − Prudent growth Q-o-Q in SFR and multifamily bolstering diversification ▪ Record quarterly revenue of $823mm − YTD revenue up 10% Y-o-Y ▪ Record quarterly NII of $719mm − YTD NII up 9.5% Y-o-Y ▪ Record quarterly net income of $382mm, diluted EPS of $2.76 − YTD each up 14% ▪ Net charge-offs at $22mm, or 15bps annualized − YTD net charge-offs of 14bps annualized ▪ Nonperforming assets at 30bps ▪ Healthy ALLL at 1.45% ▪ Provision for credit losses of $45mm Deposit-Led Growth Record Revenue, NII, Profitability Resilient Asset Quality Position of Significant Strength (1) See reconciliation of GAAP to non-GAAP financial measures in the appendix and in the Company’s earnings press releases ▪ 10.0% Tangible Common Equity (TCE)1 ratio; 15.3% Common Equity Tier 1 (CET1) ▪ YTD 16% ROACE (17% ROTCE)1 ▪ Ample liquidity: 27% of assets in cash and securities ▪ Declared 4Q26 dividend of $0.80
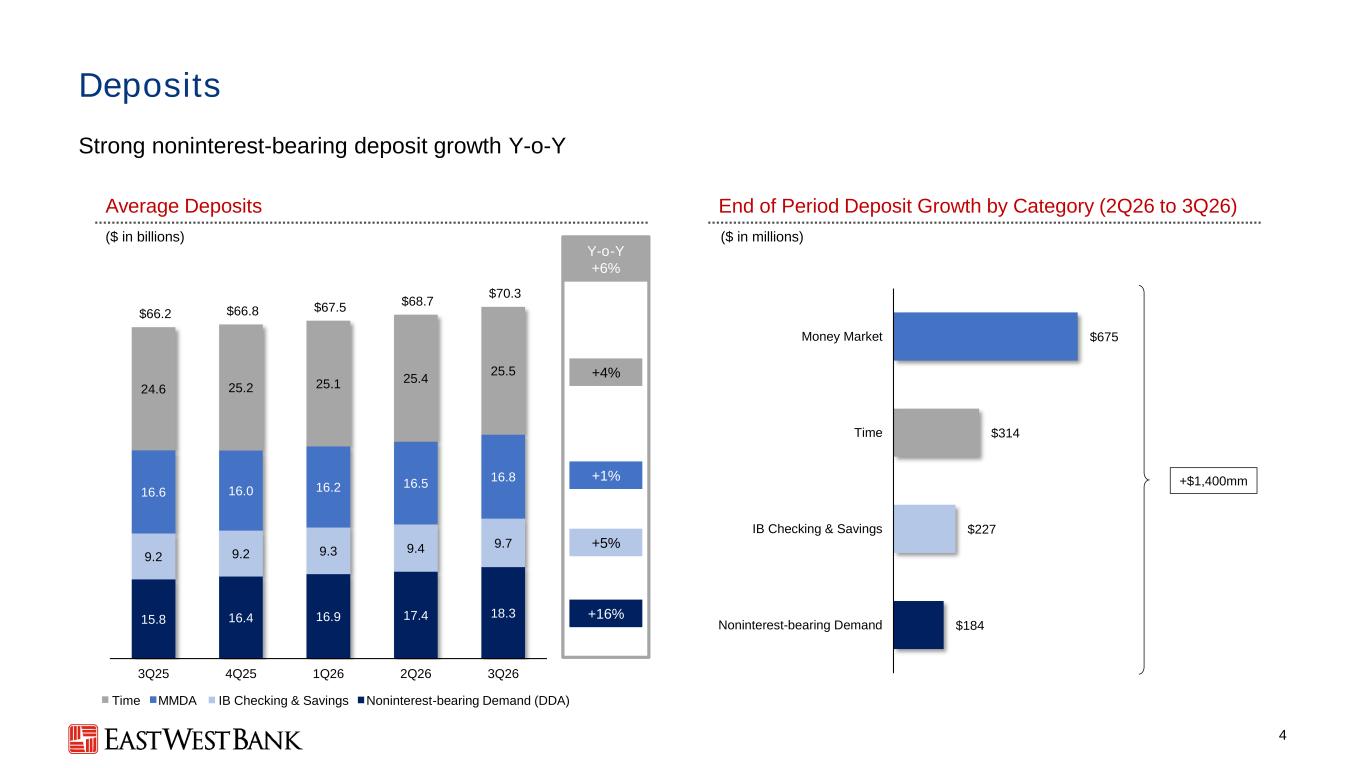
15.8 16.4 16.9 17.4 18.3 9.2 9.2 9.3 9.4 9.7 16.6 16.0 16.2 16.5 16.8 24.6 25.2 25.1 25.4 25.5 $66.2 $66.8 $67.5 $68.7 $70.3 3Q25 4Q25 1Q26 2Q26 3Q26 4 4 Year CAGRs +11% Deposits Strong noninterest-bearing deposit growth Y-o-Y ($ in billions) Average Deposits End of Period Deposit Growth by Category (2Q26 to 3Q26) ($ in millions) +1% +5% +16% +4% Y-o-Y +6% Time MMDA IB Checking & Savings Noninterest-bearing Demand (DDA) +$1,400mm $184 $227 $314 $675 Noninterest-bearing Demand IB Checking & Savings Time Money Market
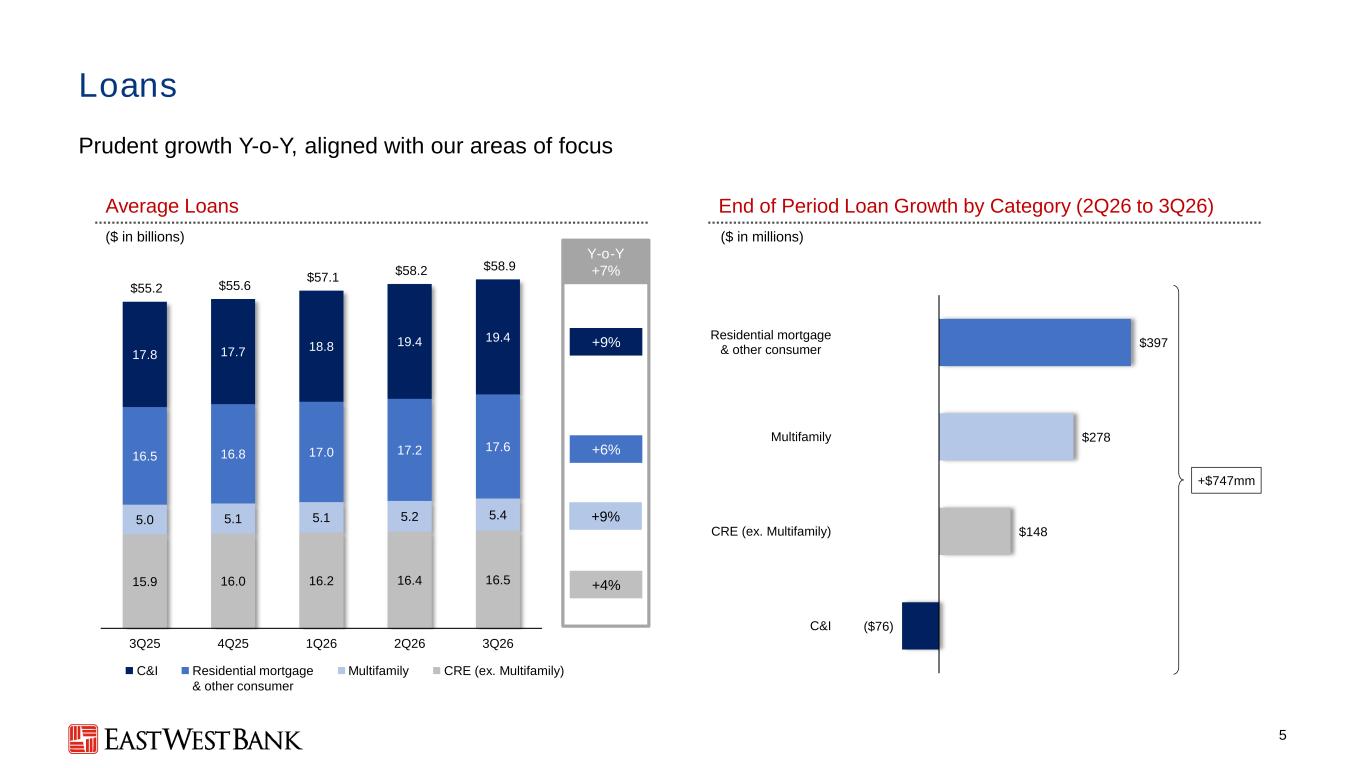
($76) $148 $278 $397 C&I CRE (ex. Multifamily) Multifamily Residential mortgage & other consumer 5 4 Year CAGRs +11% Loans Prudent growth Y-o-Y, aligned with our areas of focus ($ in billions) Average Loans End of Period Loan Growth by Category (2Q26 to 3Q26) ($ in millions) +6% +4% +9% +9% C&I CRE (ex. Multifamily)Residential mortgage & other consumer Multifamily Y-o-Y +7% 15.9 16.0 16.2 16.4 16.5 5.0 5.1 5.1 5.2 5.4 16.5 16.8 17.0 17.2 17.6 17.8 17.7 18.8 19.4 19.4 $55.2 $55.6 $57.1 $58.2 $58.9 3Q25 4Q25 1Q26 2Q26 3Q26 +$747mm
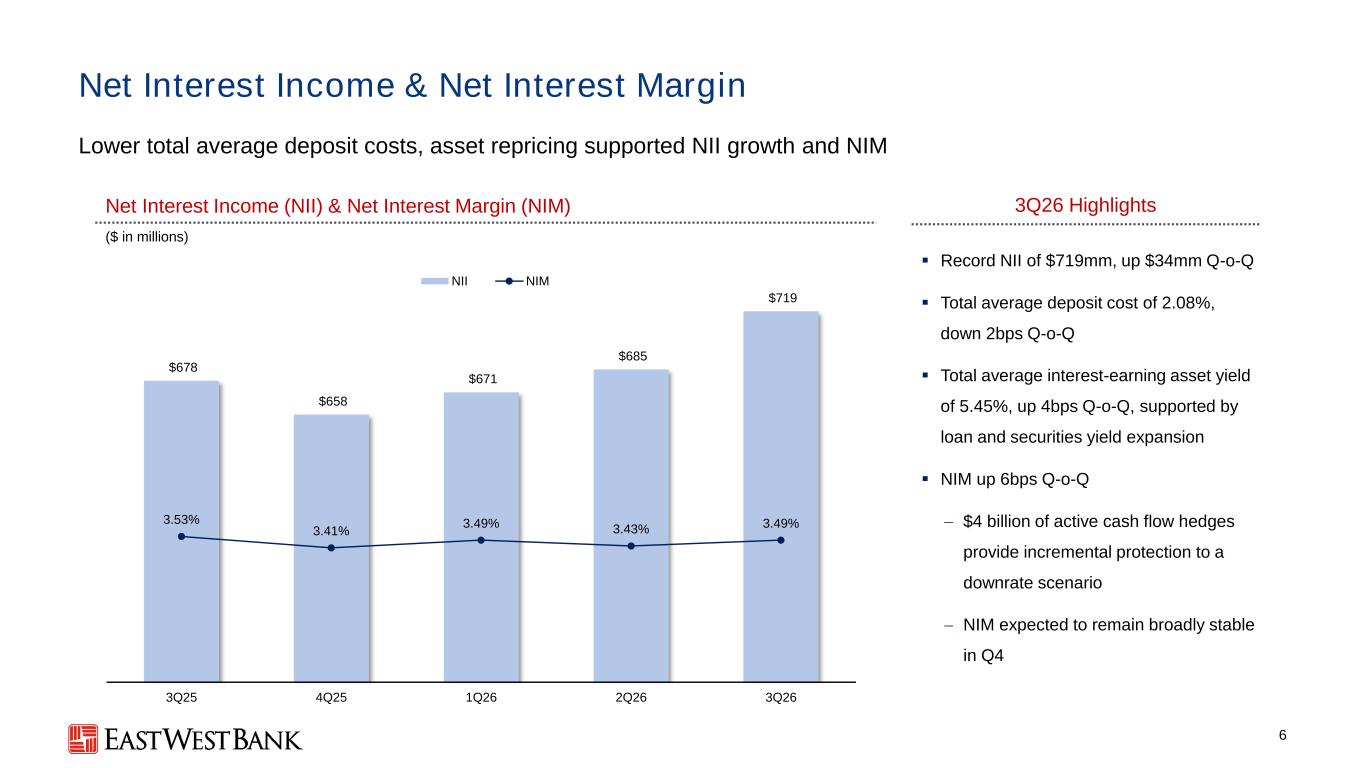
$678 $658 $671 $685 $719 3.53% 3.41% 3.49% 3.43% 3.49% 3Q25 4Q25 1Q26 2Q26 3Q26 NII NIM 6 Net Interest Income & Net Interest Margin Lower total average deposit costs, asset repricing supported NII growth and NIM ($ in millions) Net Interest Income (NII) & Net Interest Margin (NIM) 3Q26 Highlights ▪ Record NII of $719mm, up $34mm Q-o-Q ▪ Total average deposit cost of 2.08%, down 2bps Q-o-Q ▪ Total average interest-earning asset yield of 5.45%, up 4bps Q-o-Q, supported by loan and securities yield expansion ▪ NIM up 6bps Q-o-Q − $4 billion of active cash flow hedges provide incremental protection to a downrate scenario − NIM expected to remain broadly stable in Q4
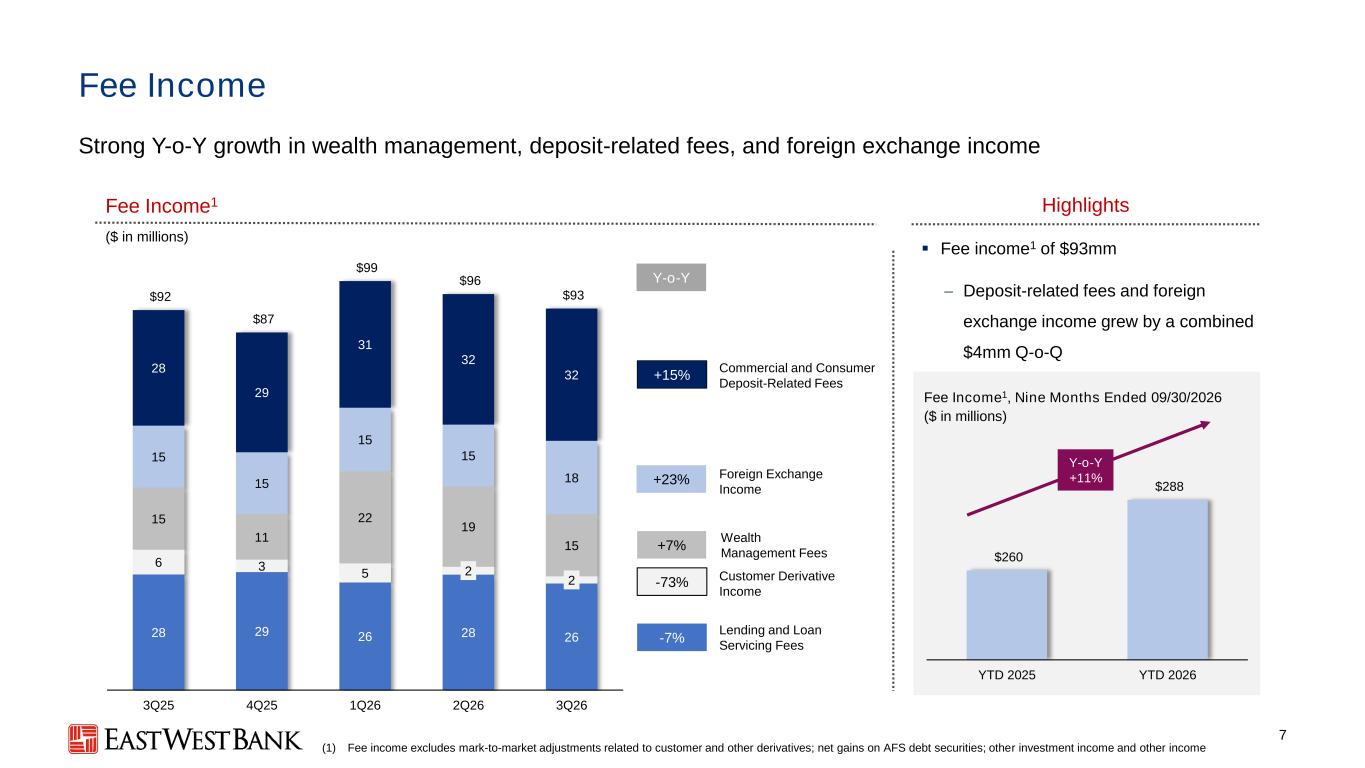
7 Fee Income1 Fee Income Strong Y-o-Y growth in wealth management, deposit-related fees, and foreign exchange income ($ in millions) (1) Fee income excludes mark-to-market adjustments related to customer and other derivatives; net gains on AFS debt securities; other investment income and other income Highlights Wealth Management Fees Customer Derivative Income -7% +7% -73% +15% +23% Commercial and Consumer Deposit-Related Fees Lending and Loan Servicing Fees Foreign Exchange Income ▪ Fee income1 of $93mm − Deposit-related fees and foreign exchange income grew by a combined $4mm Q-o-Q Y-o-Y 28 29 26 28 26 6 3 5 2 2 15 11 22 19 15 15 15 15 15 18 28 29 31 32 32 $92 $87 $99 $96 $93 3Q25 4Q25 1Q26 2Q26 3Q26 $260 $288 YTD 2025 YTD 2026 Y-o-Y +11% Fee Income1, Nine Months Ended 09/30/2026 ($ in millions)
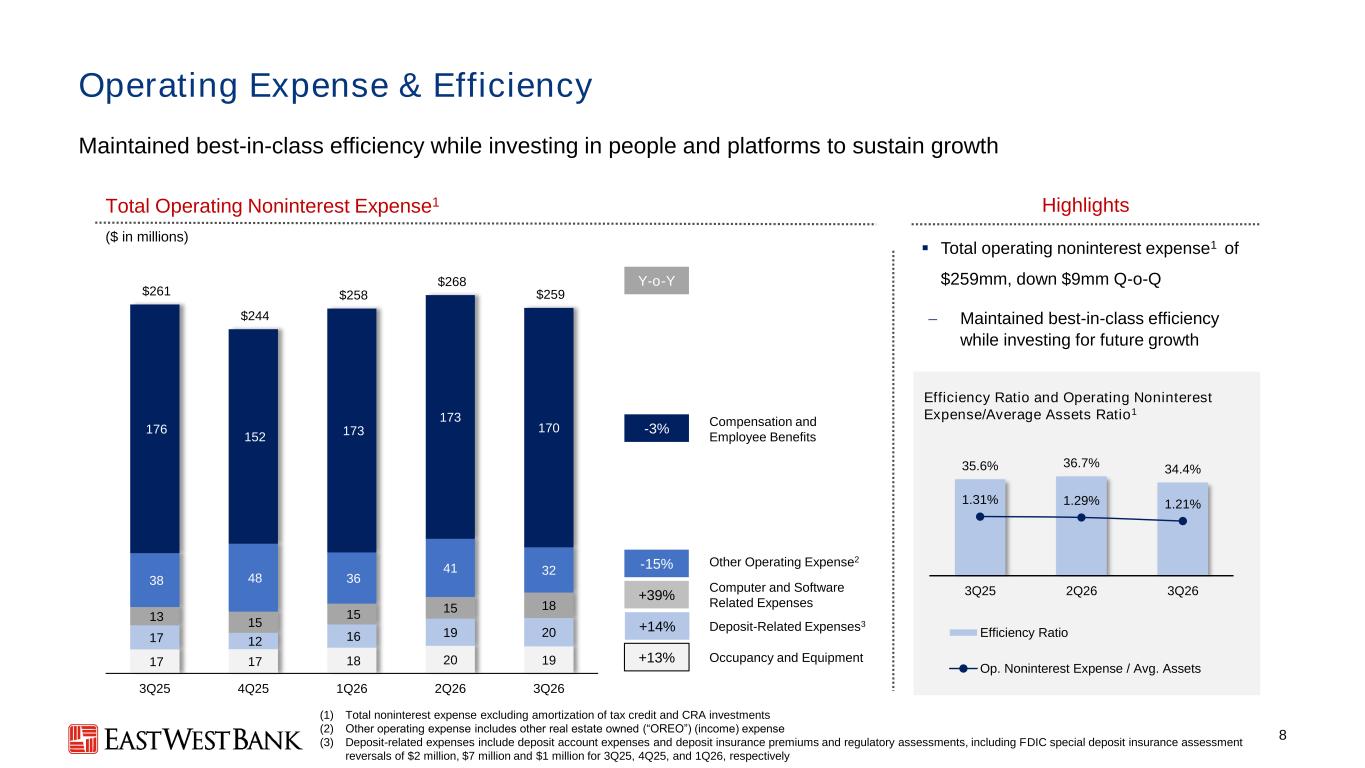
17 17 18 20 19 17 12 16 19 20 13 15 15 15 18 38 48 36 41 32 176 152 173 173 170 $261 $244 $258 $268 $259 3Q25 4Q25 1Q26 2Q26 3Q26 8 Total Operating Noninterest Expense1 Operating Expense & Efficiency Maintained best-in-class efficiency while investing in people and platforms to sustain growth ($ in millions) (1) Total noninterest expense excluding amortization of tax credit and CRA investments (2) Other operating expense includes other real estate owned (“OREO”) (income) expense (3) Deposit-related expenses include deposit account expenses and deposit insurance premiums and regulatory assessments, including FDIC special deposit insurance assessment reversals of $2 million, $7 million and $1 million for 3Q25, 4Q25, and 1Q26, respectively Highlights Efficiency Ratio and Operating Noninterest Expense/Average Assets Ratio1 Compensation and Employee Benefits Other Operating Expense2 Occupancy and Equipment Deposit-Related Expenses3 +13% -15% -3% +14% ▪ Total operating noninterest expense1 of $259mm, down $9mm Q-o-Q − Maintained best-in-class efficiency while investing for future growth Computer and Software Related Expenses +39% 35.6% 36.7% 34.4% 1.31% 1.29% 1.21% 3Q25 2Q26 3Q26 Efficiency Ratio Op. Noninterest Expense / Avg. Assets Y-o-Y
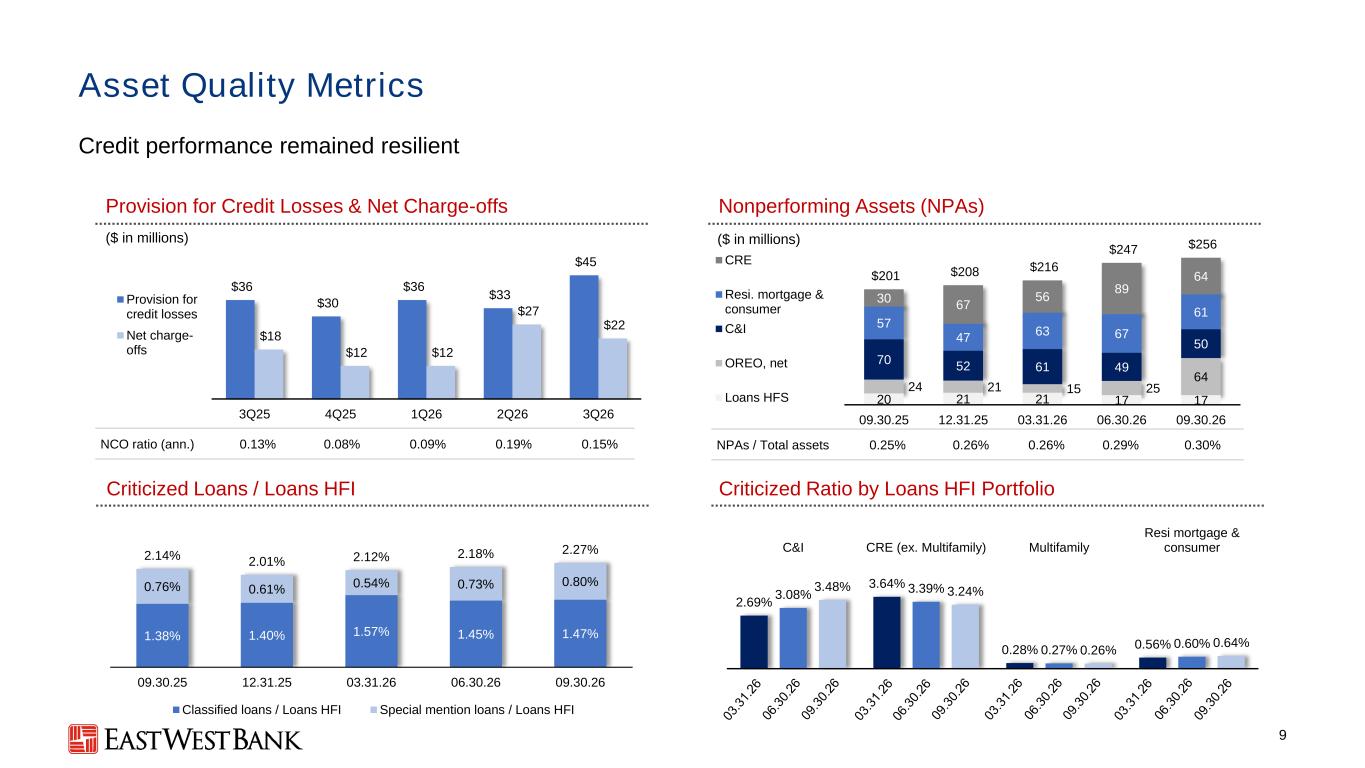
2.69% 3.64% 0.28% 0.56% 3.08% 3.39% 0.27% 0.60% 3.48% 3.24% 0.26% 0.64% C&I CRE (ex. Multifamily) Multifamily Resi mortgage & consumer $36 $30 $36 $33 $45 $18 $12 $12 $27 $22 $- $5 $10 $15 $20 $25 $30 $35 $40 $45 $50 3Q25 4Q25 1Q26 2Q26 3Q26 Provision for credit losses Net charge- offs 1.38% 1.40% 1.57% 1.45% 1.47% 0.76% 0.61% 0.54% 0.73% 0.80% 2.14% 2.01% 2.12% 2.18% 2.27% 09.30.25 12.31.25 03.31.26 06.30.26 09.30.26 Classified loans / Loans HFI Special mention loans / Loans HFI 9 Asset Quality Metrics Credit performance remained resilient Provision for Credit Losses & Net Charge-offs ($ in millions) Nonperforming Assets (NPAs) Criticized Loans / Loans HFI Criticized Ratio by Loans HFI Portfolio ($ in millions) NPAs / Total assets 0.25% 0.26% 0.26% 0.29% 0.30%NCO ratio (ann.) 0.13% 0.08% 0.09% 0.19% 0.15% 20 21 21 17 17 24 21 15 25 64 70 52 61 49 50 57 47 63 67 61 30 67 56 89 64$201 $208 $216 $247 $256 09.30.25 12.31.25 03.31.26 06.30.26 09.30.26 CRE Resi. mortgage & consumer C&I OREO, net Loans HFS
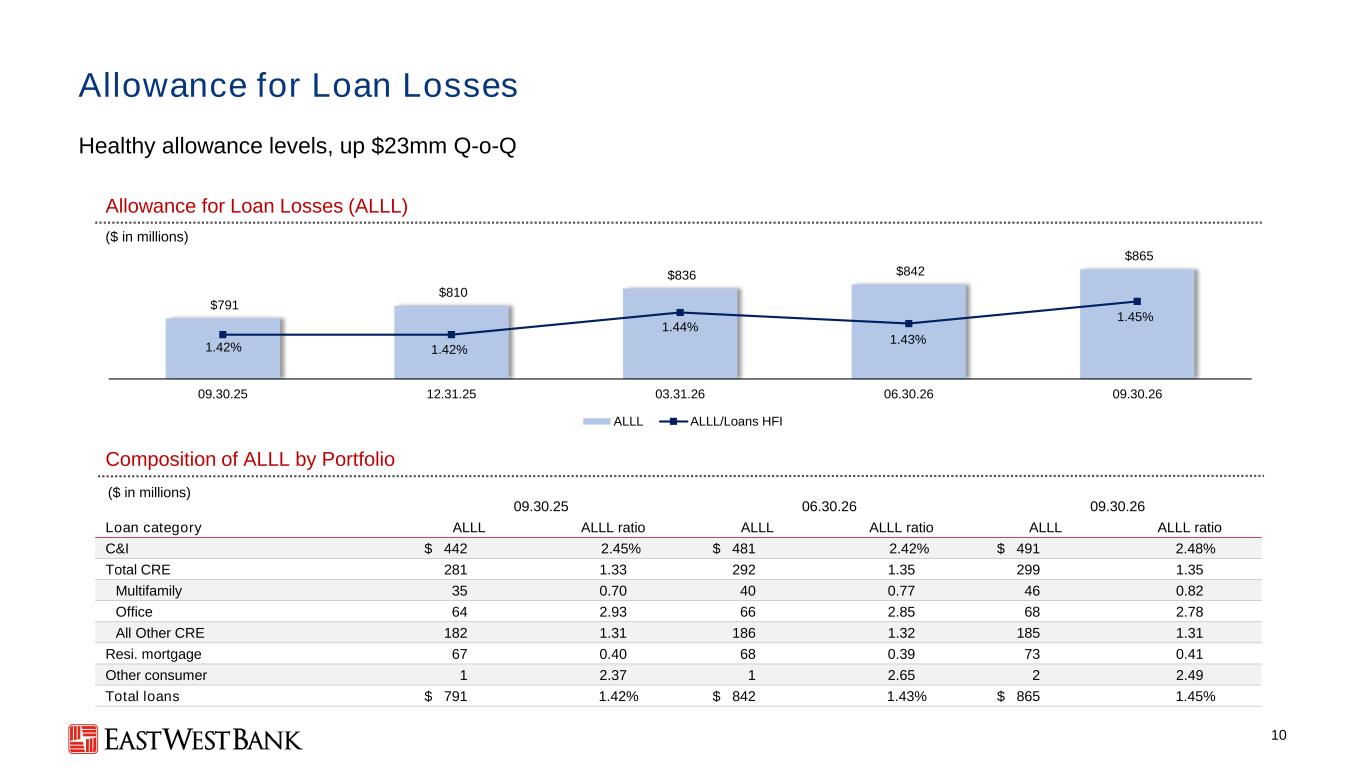
10 Allowance for Loan Losses Healthy allowance levels, up $23mm Q-o-Q Allowance for Loan Losses (ALLL) ($ in millions) Composition of ALLL by Portfolio ($ in millions) 09.30.25 06.30.26 09.30.26 Loan category ALLL ALLL ratio ALLL ALLL ratio ALLL ALLL ratio C&I $ 442 2.45% $ 481 2.42% $ 491 2.48% Total CRE 281 1.33 292 1.35 299 1.35 Multifamily 35 0.70 40 0.77 46 0.82 Office 64 2.93 66 2.85 68 2.78 All Other CRE 182 1.31 186 1.32 185 1.31 Resi. mortgage 67 0.40 68 0.39 73 0.41 Other consumer 1 2.37 1 2.65 2 2.49 Total loans $ 791 1.42% $ 842 1.43% $ 865 1.45% $791 $810 $836 $842 $865 1.42% 1.42% 1.44% 1.43% 1.45% 1.38% 1.40% 1.42% 1.44% 1.46% 1.48% 1.50% $700 $750 $800 $850 $900 09.30.25 12.31.25 03.31.26 06.30.26 09.30.26 ALLL ALLL/Loans HFI
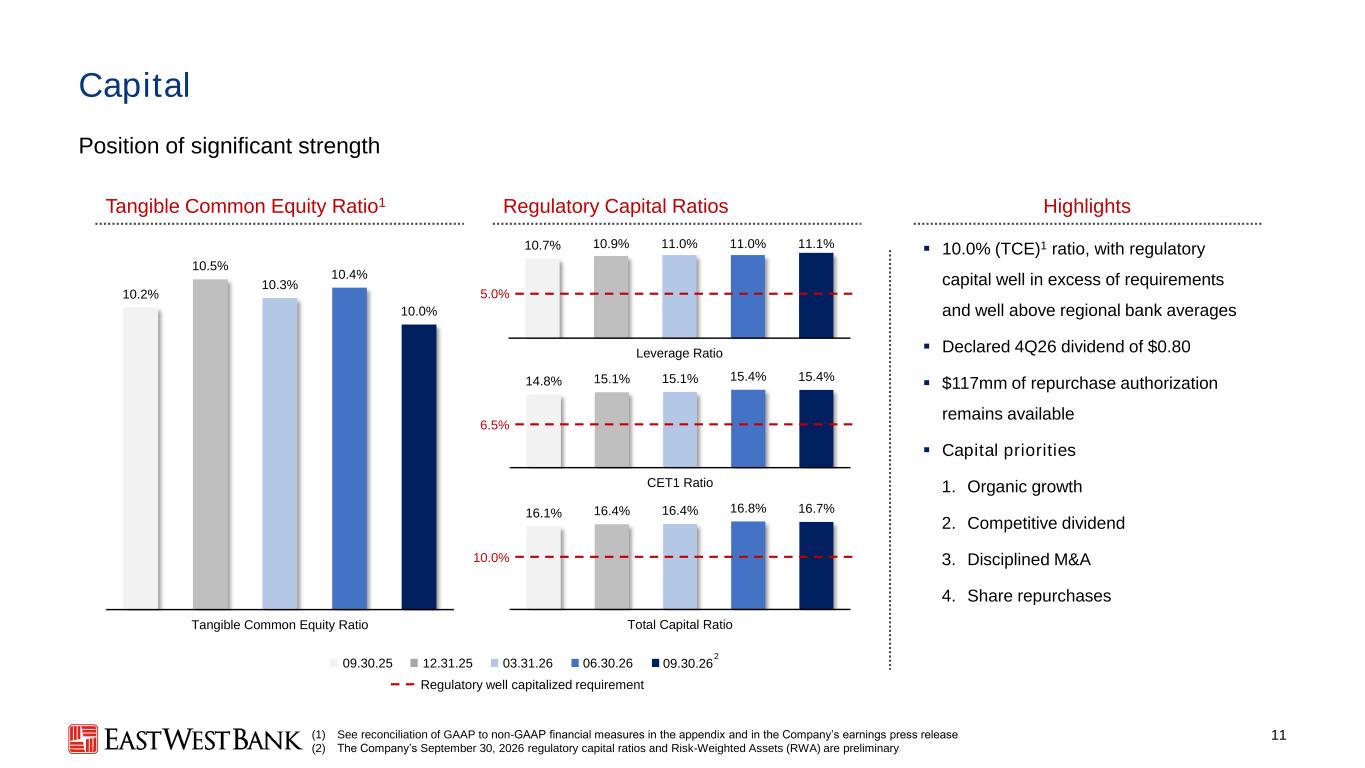
16.1% 16.4% 16.4% 16.8% 16.7% Total Capital Ratio 14.8% 15.1% 15.1% 15.4% 15.4% CET1 Ratio 10.7% 10.9% 11.0% 11.0% 11.1% Leverage Ratio 10.2% 10.5% 10.3% 10.4% 10.0% Tangible Common Equity Ratio 11 12.31.25 Capital Position of significant strength Highlights 09.30.25 06.30.2603.31.26 ▪ 10.0% (TCE)1 ratio, with regulatory capital well in excess of requirements and well above regional bank averages ▪ Declared 4Q26 dividend of $0.80 ▪ $117mm of repurchase authorization remains available ▪ Capital priorities 1. Organic growth 2. Competitive dividend 3. Disciplined M&A 4. Share repurchases Regulatory well capitalized requirement Tangible Common Equity Ratio1 Regulatory Capital Ratios 6.5% 5.0% 10.0% 09.30.26 (1) See reconciliation of GAAP to non-GAAP financial measures in the appendix and in the Company’s earnings press release (2) The Company’s September 30, 2026 regulatory capital ratios and Risk-Weighted Assets (RWA) are preliminary 2
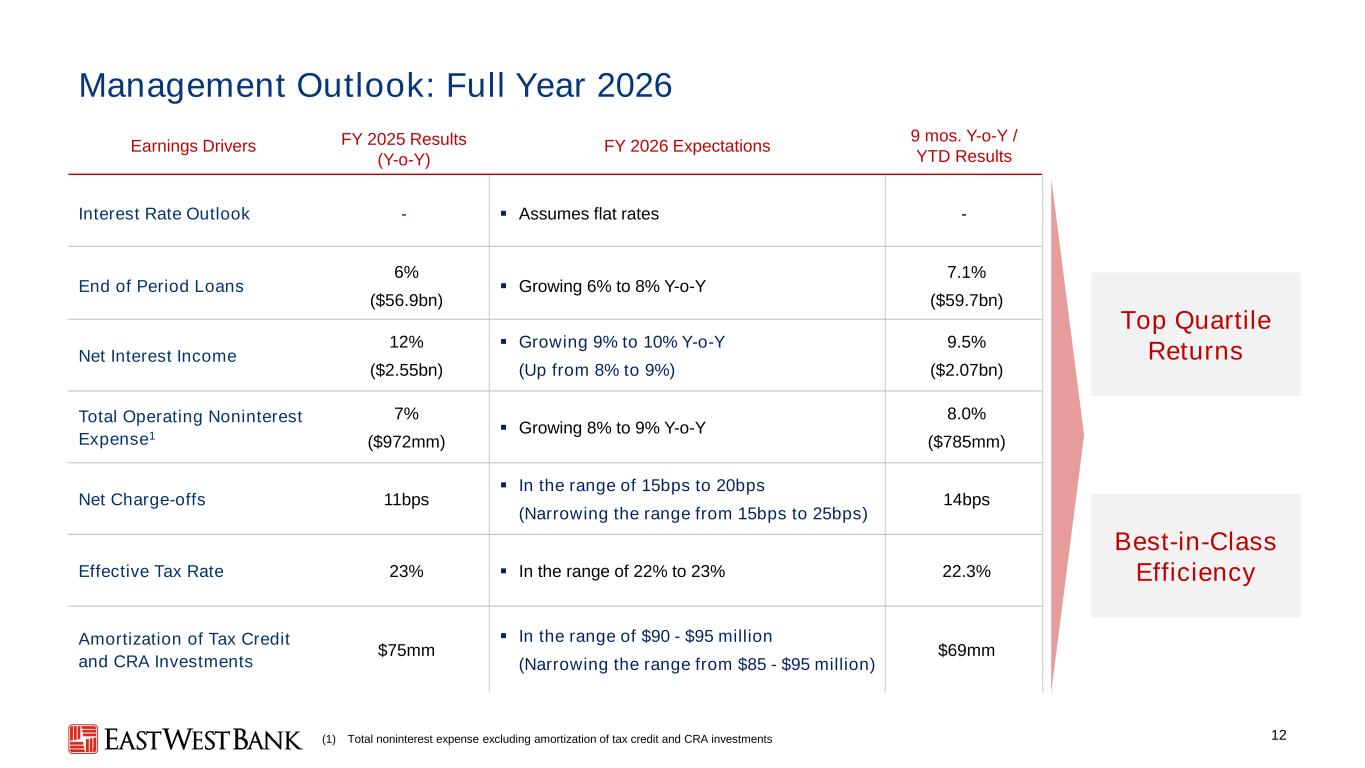
12 Management Outlook: Full Year 2026 (1) Total noninterest expense excluding amortization of tax credit and CRA investments Earnings Drivers FY 2025 Results (Y-o-Y) FY 2026 Expectations 9 mos. Y-o-Y / YTD Results Interest Rate Outlook - ▪ Assumes flat rates - End of Period Loans 6% ($56.9bn) ▪ Growing 6% to 8% Y-o-Y 7.1% ($59.7bn) Net Interest Income 12% ($2.55bn) ▪ Growing 9% to 10% Y-o-Y (Up from 8% to 9%) 9.5% ($2.07bn) Total Operating Noninterest Expense1 7% ($972mm) ▪ Growing 8% to 9% Y-o-Y 8.0% ($785mm) Net Charge-offs 11bps ▪ In the range of 15bps to 20bps (Narrowing the range from 15bps to 25bps) 14bps Effective Tax Rate 23% ▪ In the range of 22% to 23% 22.3% Amortization of Tax Credit and CRA Investments $75mm ▪ In the range of $90 - $95 million (Narrowing the range from $85 - $95 million) $69mm Best-in-Class Efficiency Top Quartile Returns

Appendix
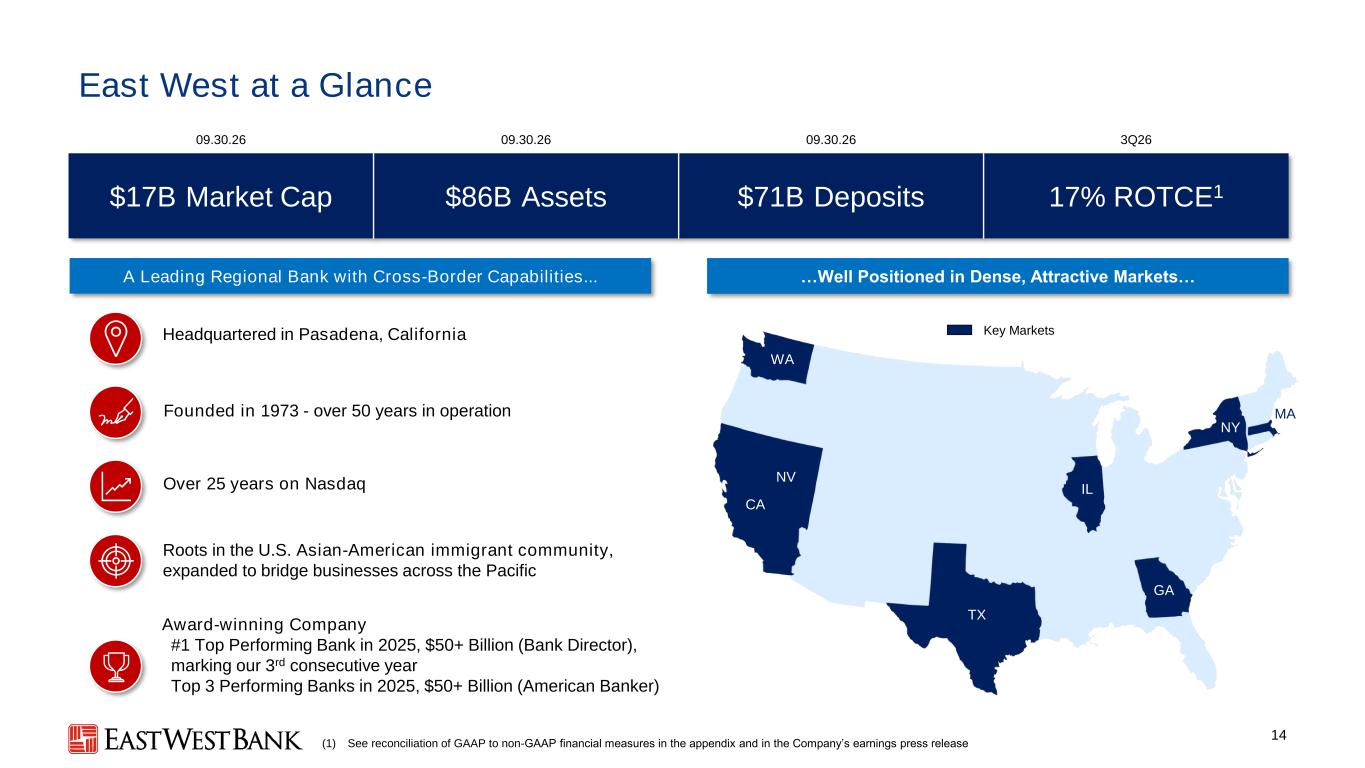
14 East West at a Glance (1) See reconciliation of GAAP to non-GAAP financial measures in the appendix and in the Company’s earnings press release $17B Market Cap $86B Assets $71B Deposits 17% ROTCE1 09.30.26 09.30.26 09.30.26 3Q26 ▪ Headquartered in Pasadena, California ▪ Over 25 years on Nasdaq ▪ Founded in 1973 - over 50 years in operation Roots in the U.S. Asian-American immigrant community, expanded to bridge businesses across the Pacific Award-winning Company #1 Top Performing Bank in 2025, $50+ Billion (Bank Director), marking our 3rd consecutive year Top 3 Performing Banks in 2025, $50+ Billion (American Banker) A Leading Regional Bank with Cross-Border Capabilities... …Well Positioned in Dense, Attractive Markets… TX NY NV CA WA MA GA Key Markets IL
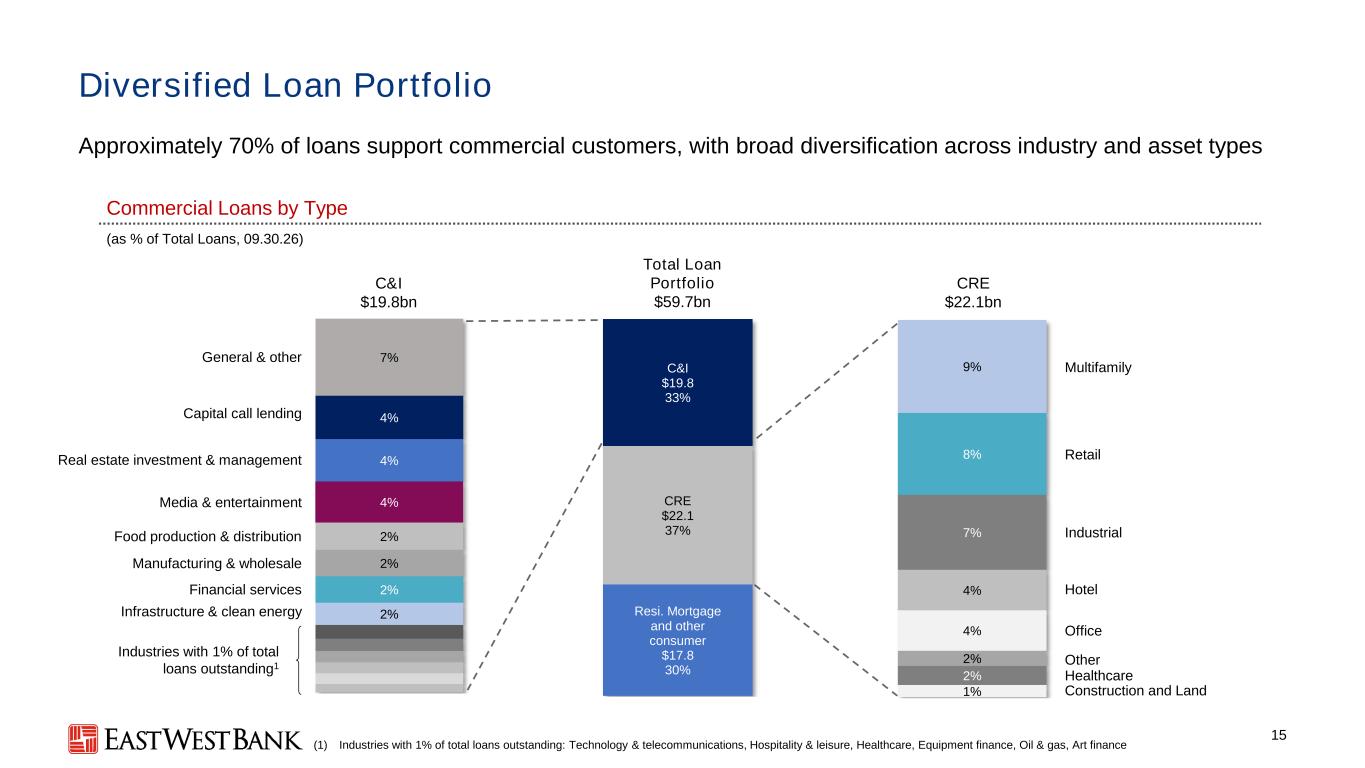
2% 2% 2% 2% 4% 4% 4% 7% 15 1% 2% 2% 4% 4% 7% 8% 9% (as % of Total Loans, 09.30.26) Commercial Loans by Type Diversified Loan Portfolio Approximately 70% of loans support commercial customers, with broad diversification across industry and asset types (1) Industries with 1% of total loans outstanding: Technology & telecommunications, Hospitality & leisure, Healthcare, Equipment finance, Oil & gas, Art finance Industries with 1% of total loans outstanding1 CRE $22.1bn C&I $19.8bn Total Loan Portfolio $59.7bn Media & entertainment Capital call lending Real estate investment & management Infrastructure & clean energy General & other Industrial Multifamily Retail Hotel Office Other Healthcare Construction and Land Manufacturing & wholesale Financial services Food production & distribution Resi. Mortgage and other consumer $17.8 30% CRE $22.1 37% C&I $19.8 33%
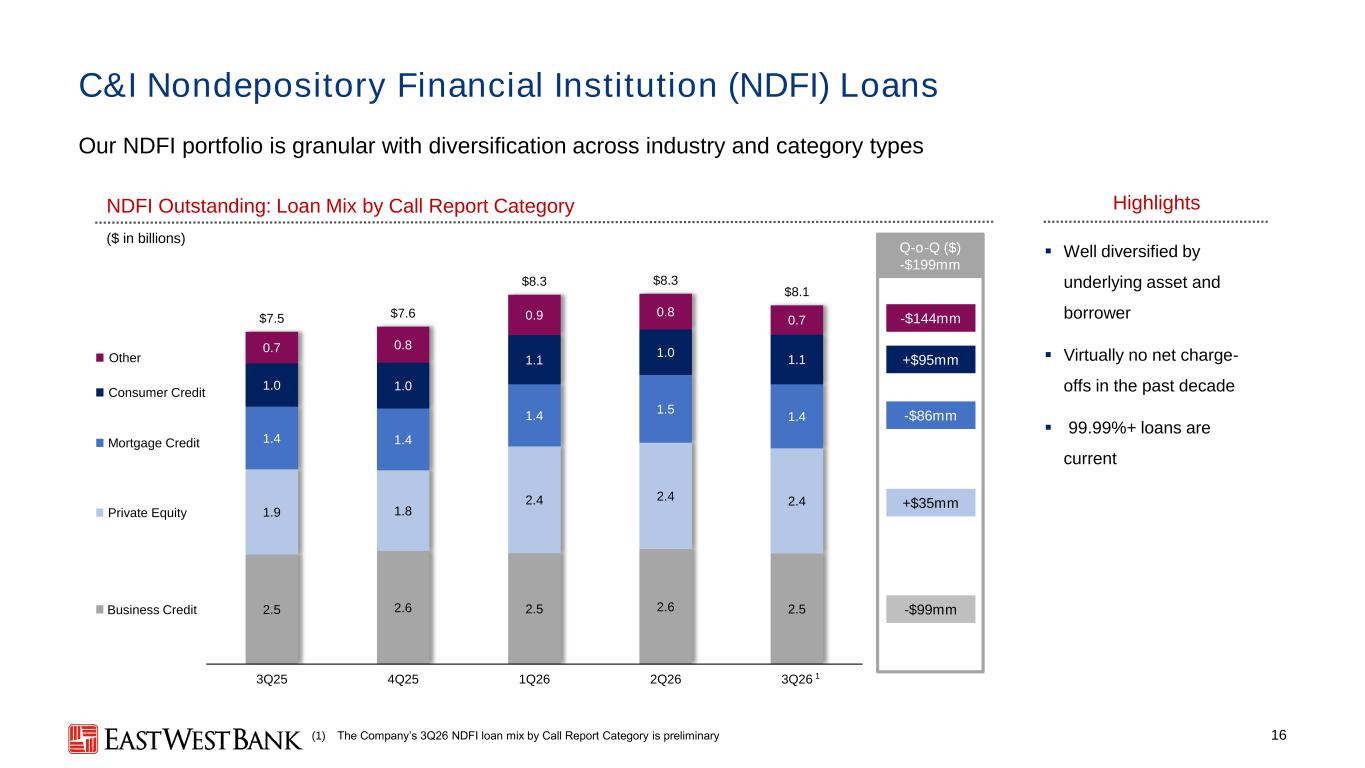
2.5 2.6 2.5 2.6 2.5 1.9 1.8 2.4 2.4 2.4 1.4 1.4 1.4 1.5 1.4 1.0 1.0 1.1 1.0 1.1 0.7 0.8 0.9 0.8 0.7$7.5 $7.6 $8.3 $8.3 $8.1 3Q25 4Q25 1Q26 2Q26 3Q26 C&I Nondepository Financial Institution (NDFI) Loans 16 Our NDFI portfolio is granular with diversification across industry and category types ($ in billions) Other Private Equity Mortgage Credit Consumer Credit Business Credit (1) The Company’s 3Q26 NDFI loan mix by Call Report Category is preliminary 4 Year CAGRs x -$86mm -$99mm +$95mm +$35mm Q-o-Q ($) -$199mm -$144mm 1 Highlights ▪ Well diversified by underlying asset and borrower ▪ Virtually no net charge- offs in the past decade ▪ 99.99%+ loans are current NDFI Outstanding: Loan Mix by Call Report Category
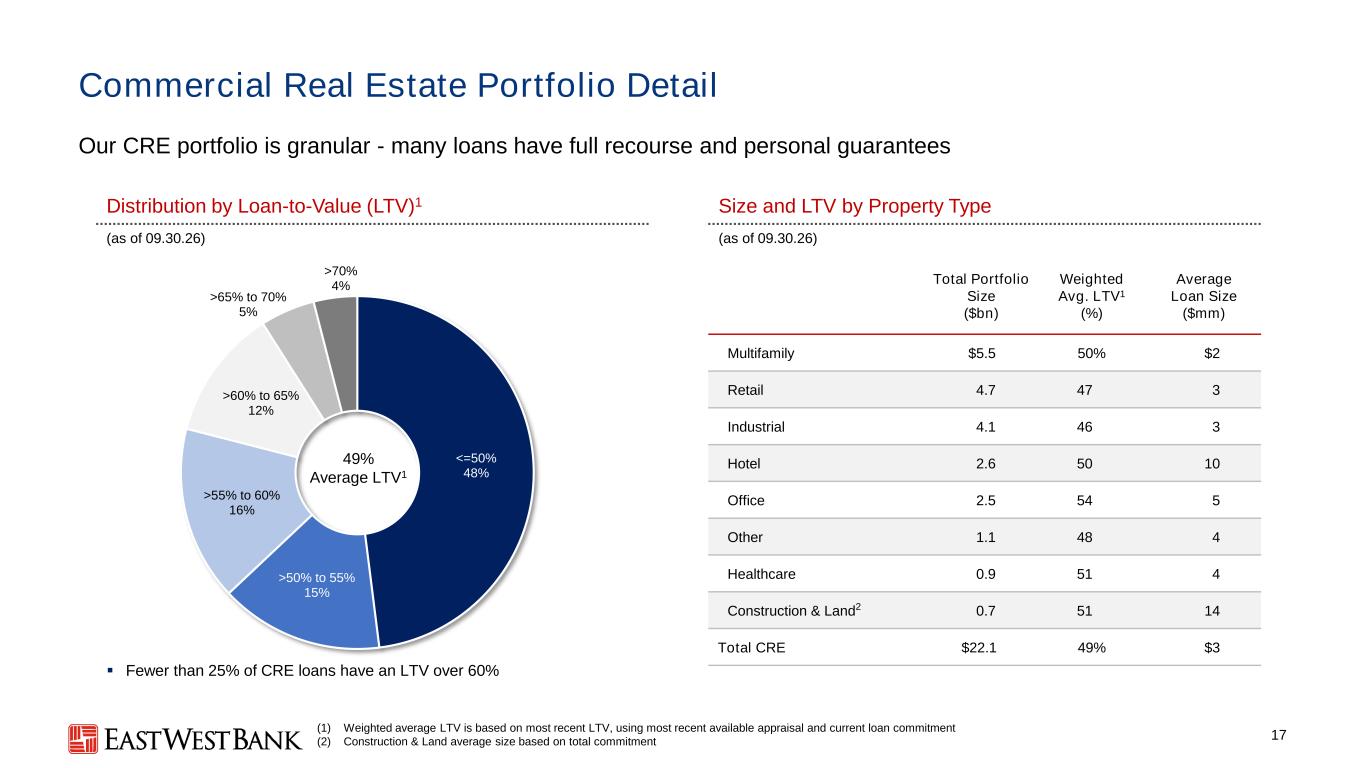
<=50% 48% >50% to 55% 15% >55% to 60% 16% >60% to 65% 12% >65% to 70% 5% >70% 4% 17 Commercial Real Estate Portfolio Detail Our CRE portfolio is granular - many loans have full recourse and personal guarantees 49% Average LTV1 Distribution by Loan-to-Value (LTV)1 Size and LTV by Property Type (as of 09.30.26) (as of 09.30.26) ▪ Fewer than 25% of CRE loans have an LTV over 60% Total Portfolio Size ($bn) Weighted Avg. LTV1 (%) Average Loan Size ($mm) Multifamily $5.5 50% $2 Retail 4.7 47 3 Industrial 4.1 46 3 Hotel 2.6 50 10 Office 2.5 54 5 Other 1.1 48 4 Healthcare 0.9 51 4 Construction & Land2 0.7 51 14 Total CRE $22.1 49% $3 (1) Weighted average LTV is based on most recent LTV, using most recent available appraisal and current loan commitment (2) Construction & Land average size based on total commitment
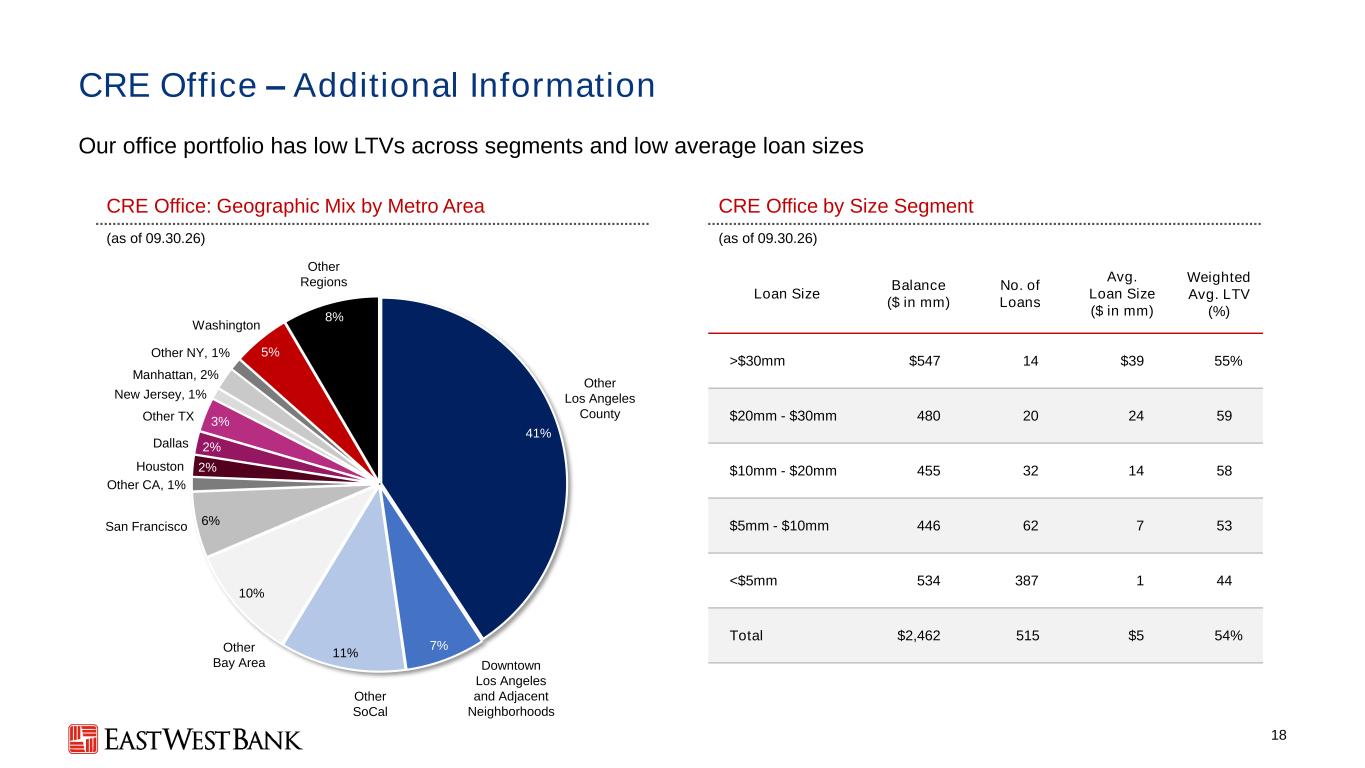
41% 7% 11% 10% 6% 2% 2% 3% 5% 8% 18 CRE Office – Additional Information Our office portfolio has low LTVs across segments and low average loan sizes CRE Office: Geographic Mix by Metro Area CRE Office by Size Segment (as of 09.30.26) (as of 09.30.26) Loan Size Balance ($ in mm) No. of Loans Avg. Loan Size ($ in mm) Weighted Avg. LTV (%) >$30mm $547 14 $39 55% $20mm - $30mm 480 20 24 59 $10mm - $20mm 455 32 14 58 $5mm - $10mm 446 62 7 53 <$5mm 534 387 1 44 Total $2,462 515 $5 54% Other Los Angeles County Other SoCal Other Bay Area San Francisco Other CA, 1% Houston Dallas Manhattan, 2% Other TX Washington Other Regions New Jersey, 1% Other NY, 1% Downtown Los Angeles and Adjacent Neighborhoods
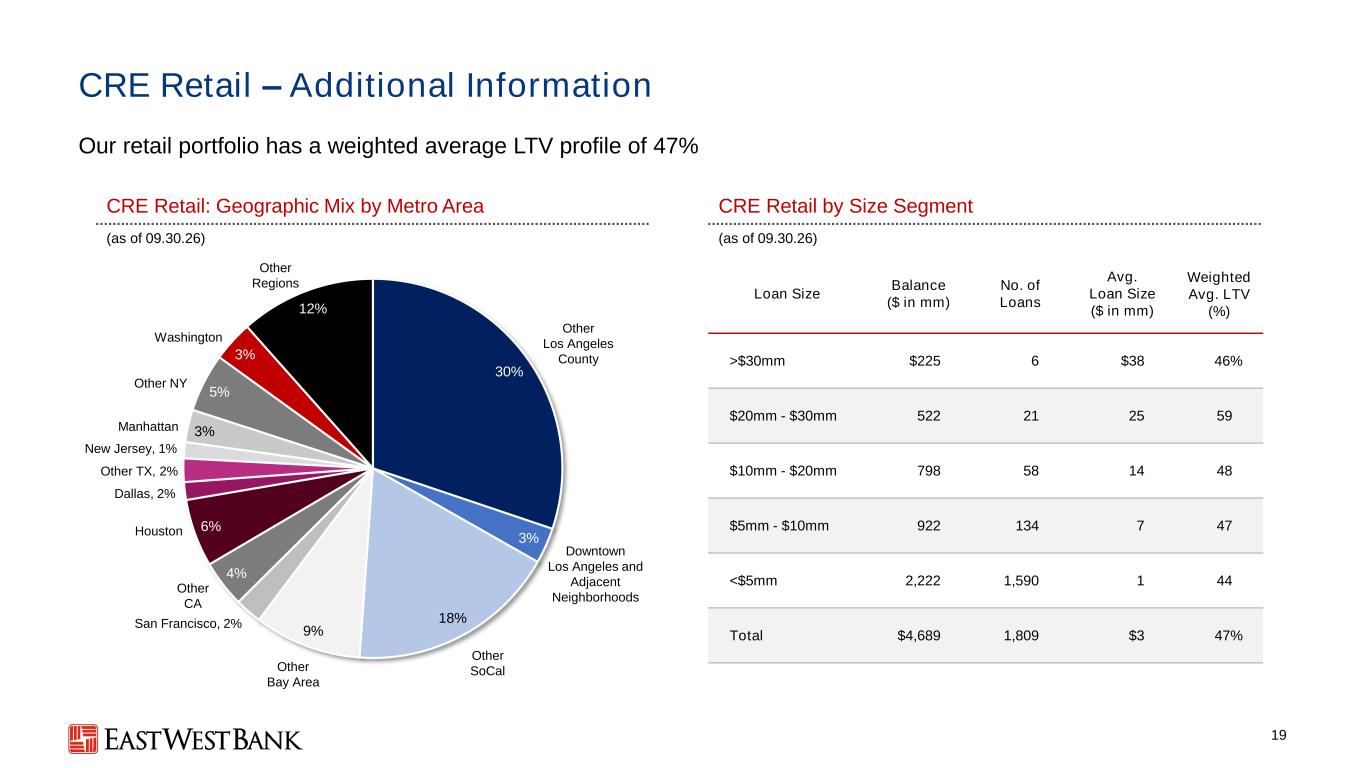
30% 3% 18% 9% 4% 6% 3% 5% 3% 12% 19 CRE Retail – Additional Information Our retail portfolio has a weighted average LTV profile of 47% CRE Retail: Geographic Mix by Metro Area CRE Retail by Size Segment (as of 09.30.26) (as of 09.30.26) Loan Size Balance ($ in mm) No. of Loans Avg. Loan Size ($ in mm) Weighted Avg. LTV (%) >$30mm $225 6 $38 46% $20mm - $30mm 522 21 25 59 $10mm - $20mm 798 58 14 48 $5mm - $10mm 922 134 7 47 <$5mm 2,222 1,590 1 44 Total $4,689 1,809 $3 47% Other Los Angeles County Downtown Los Angeles and Adjacent Neighborhoods Other SoCalOther Bay Area San Francisco, 2% Other CA Houston Dallas, 2% Manhattan Other TX, 2% Washington Other Regions Other NY New Jersey, 1% Other NY
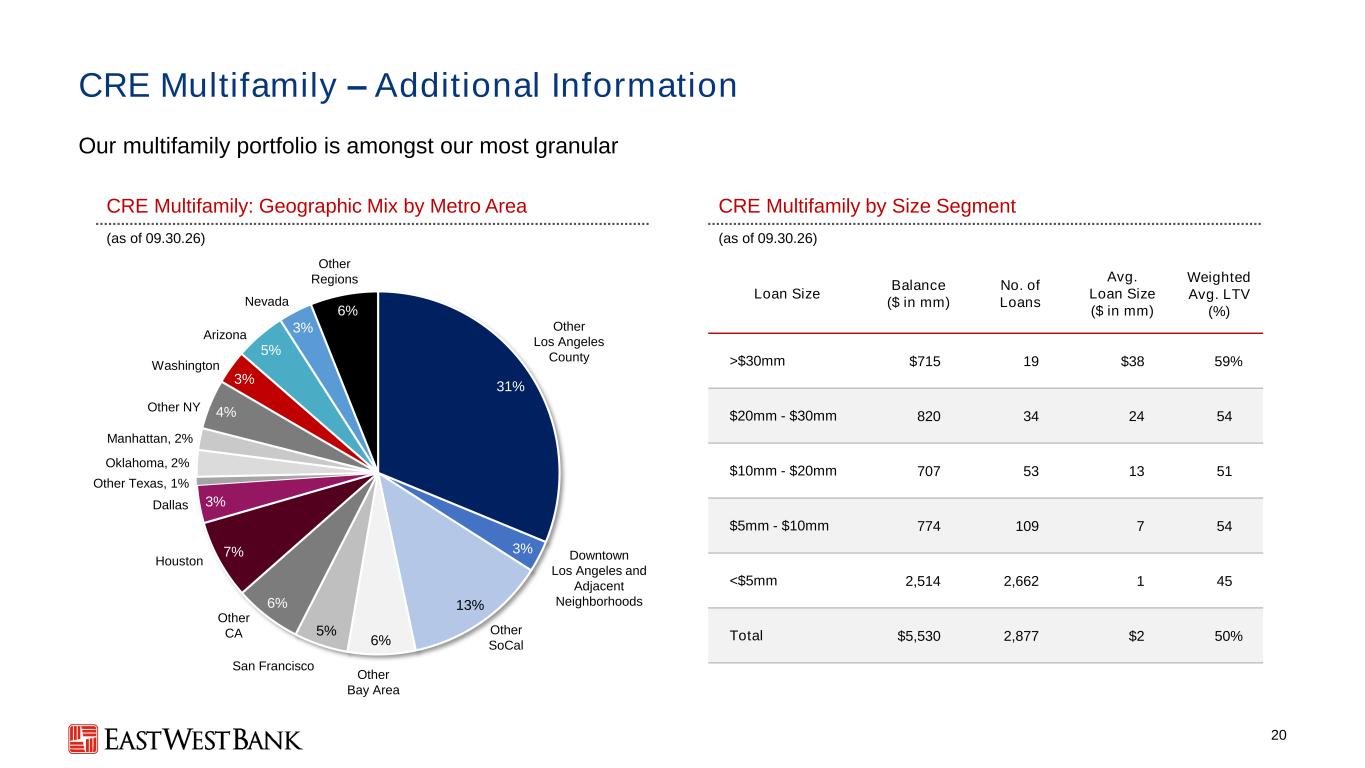
31% 3% 13% 6% 5% 6% 7% 3% 4% 3% 5% 3% 6% 20 Oklahoma, 2% CRE Multifamily – Additional Information Our multifamily portfolio is amongst our most granular CRE Multifamily: Geographic Mix by Metro Area CRE Multifamily by Size Segment (as of 09.30.26) (as of 09.30.26) Loan Size Balance ($ in mm) No. of Loans Avg. Loan Size ($ in mm) Weighted Avg. LTV (%) >$30mm $715 19 $38 59% $20mm - $30mm 820 34 24 54 $10mm - $20mm 707 53 13 51 $5mm - $10mm 774 109 7 54 <$5mm 2,514 2,662 1 45 Total $5,530 2,877 $2 50% Other Los Angeles County Downtown Los Angeles and Adjacent Neighborhoods Other SoCal Other Bay Area San Francisco Other CA Houston Dallas Arizona Nevada Other Regions Washington Manhattan, 2% Other NY Other Texas, 1%
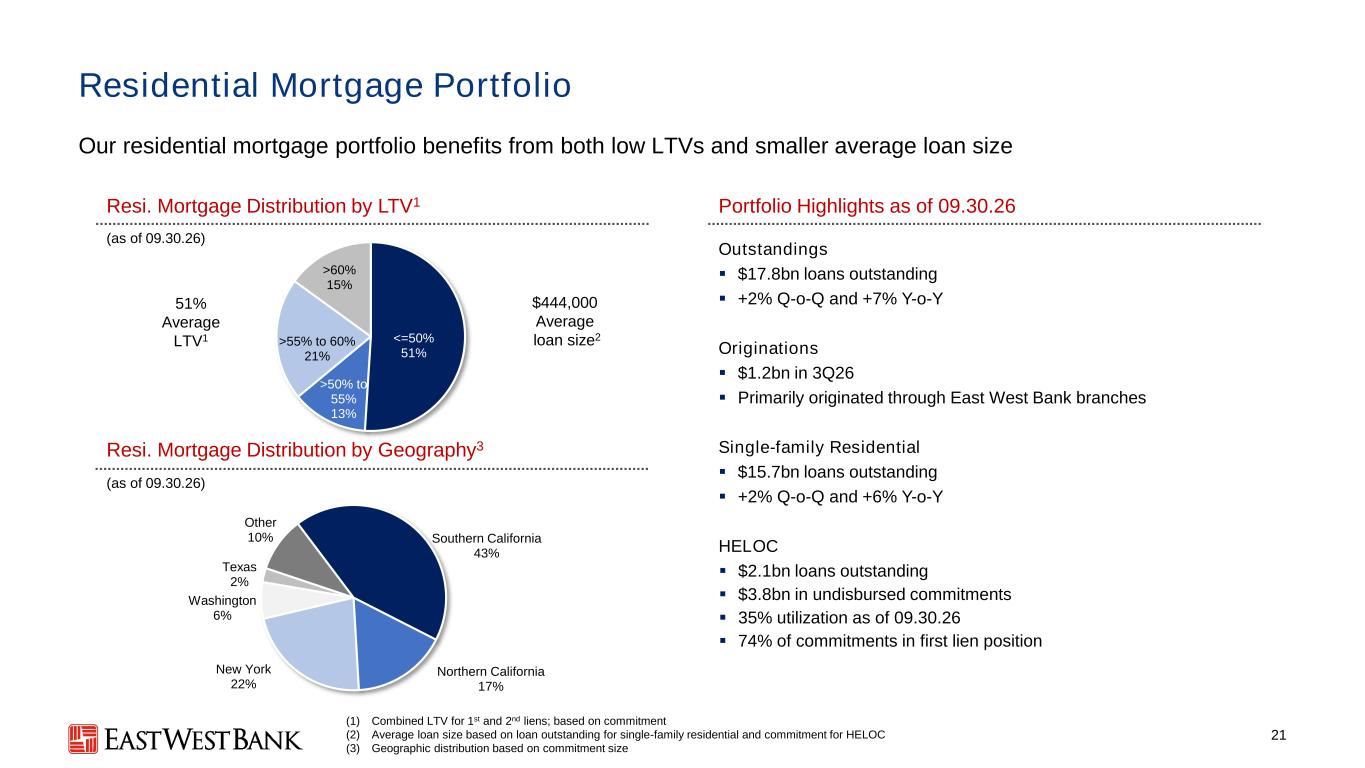
Southern California 43% Northern California 17% New York 22% Washington 6% Texas 2% Other 10% <=50% 51% >50% to 55% 13% >55% to 60% 21% >60% 15% 21 Residential Mortgage Portfolio Our residential mortgage portfolio benefits from both low LTVs and smaller average loan size Resi. Mortgage Distribution by LTV1 Portfolio Highlights as of 09.30.26 (as of 09.30.26) Outstandings ▪ $17.8bn loans outstanding ▪ +2% Q-o-Q and +7% Y-o-Y Originations ▪ $1.2bn in 3Q26 ▪ Primarily originated through East West Bank branches Single-family Residential ▪ $15.7bn loans outstanding ▪ +2% Q-o-Q and +6% Y-o-Y HELOC ▪ $2.1bn loans outstanding ▪ $3.8bn in undisbursed commitments ▪ 35% utilization as of 09.30.26 ▪ 74% of commitments in first lien position Resi. Mortgage Distribution by Geography3 51% Average LTV1 $444,000 Average loan size2 (as of 09.30.26) (1) Combined LTV for 1st and 2nd liens; based on commitment (2) Average loan size based on loan outstanding for single-family residential and commitment for HELOC (3) Geographic distribution based on commitment size
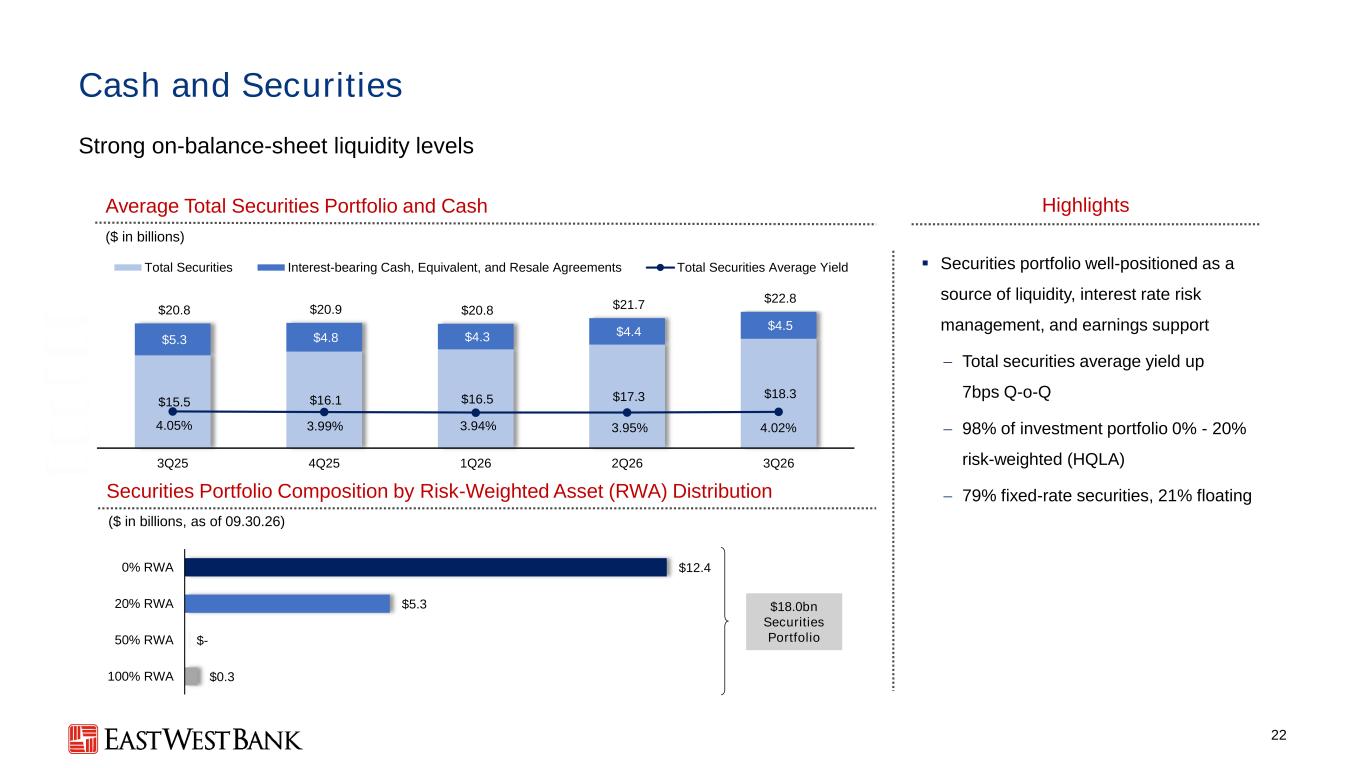
$0.3 $- $5.3 $12.4 100% RWA 50% RWA 20% RWA 0% RWA 22 Average Total Securities Portfolio and Cash Cash and Securities Strong on-balance-sheet liquidity levels ($ in billions) ▪ Securities portfolio well-positioned as a source of liquidity, interest rate risk management, and earnings support − Total securities average yield up 7bps Q-o-Q − 98% of investment portfolio 0% - 20% risk-weighted (HQLA) − 79% fixed-rate securities, 21% floating Highlights Securities Portfolio Composition by Risk-Weighted Asset (RWA) Distribution ($ in billions, as of 09.30.26) $18.0bn Securities Portfolio $15.5 $16.1 $16.5 $17.3 $18.3 $5.3 $4.8 $4.3 $4.4 $4.5 $20.8 $20.9 $20.8 $21.7 $22.8 4.05% 3.99% 3.94% 3.95% 4.02% 3Q25 4Q25 1Q26 2Q26 3Q26 Total Securities Interest-bearing Cash, Equivalent, and Resale Agreements Total Securities Average Yield
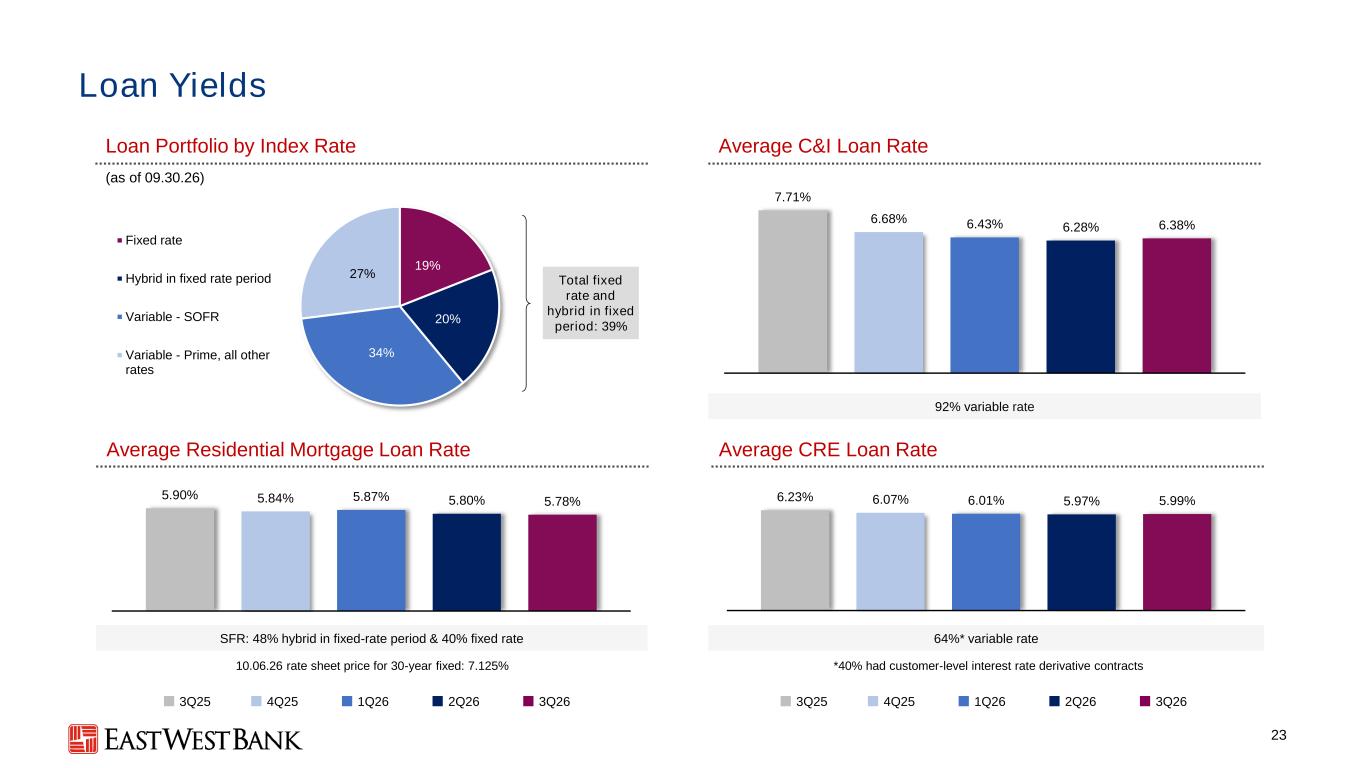
5.90% 5.84% 5.87% 5.80% 5.78% 6.23% 6.07% 6.01% 5.97% 5.99% 7.71% 6.68% 6.43% 6.28% 6.38% 19% 20% 34% 27% Fixed rate Hybrid in fixed rate period Variable - SOFR Variable - Prime, all other rates 23 Loan Yields Loan Portfolio by Index Rate (as of 09.30.26) Average C&I Loan Rate Average Residential Mortgage Loan Rate Average CRE Loan Rate 92% variable rate 64%* variable rate *40% had customer-level interest rate derivative contracts SFR: 48% hybrid in fixed-rate period & 40% fixed rate 10.06.26 rate sheet price for 30-year fixed: 7.125% Total fixed rate and hybrid in fixed period: 39% 3Q25 4Q25 1Q26 2Q26 3Q26 3Q25 4Q25 1Q26 2Q26 3Q26
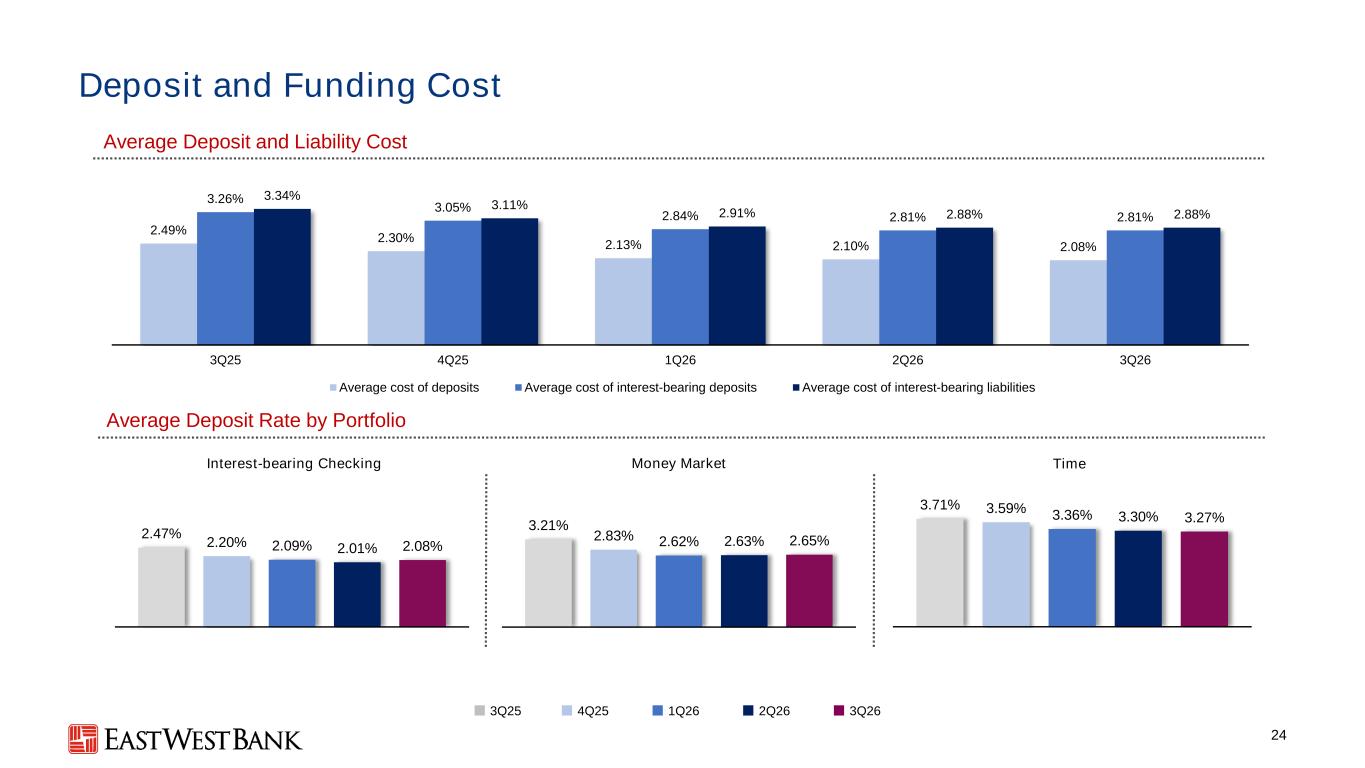
3.71% 3.59% 3.36% 3.30% 3.27% Time 3.21% 2.83% 2.62% 2.63% 2.65% Money Market 2.47% 2.20% 2.09% 2.01% 2.08% Interest-bearing Checking 2.49% 2.30% 2.13% 2.10% 2.08% 3.26% 3.05% 2.84% 2.81% 2.81% 3.34% 3.11% 2.91% 2.88% 2.88% 3Q25 4Q25 1Q26 2Q26 3Q26 Average cost of deposits Average cost of interest-bearing deposits Average cost of interest-bearing liabilities 24 Average Deposit and Liability Cost Deposit and Funding Cost Average Deposit Rate by Portfolio 3Q25 4Q25 1Q26 2Q26 3Q26
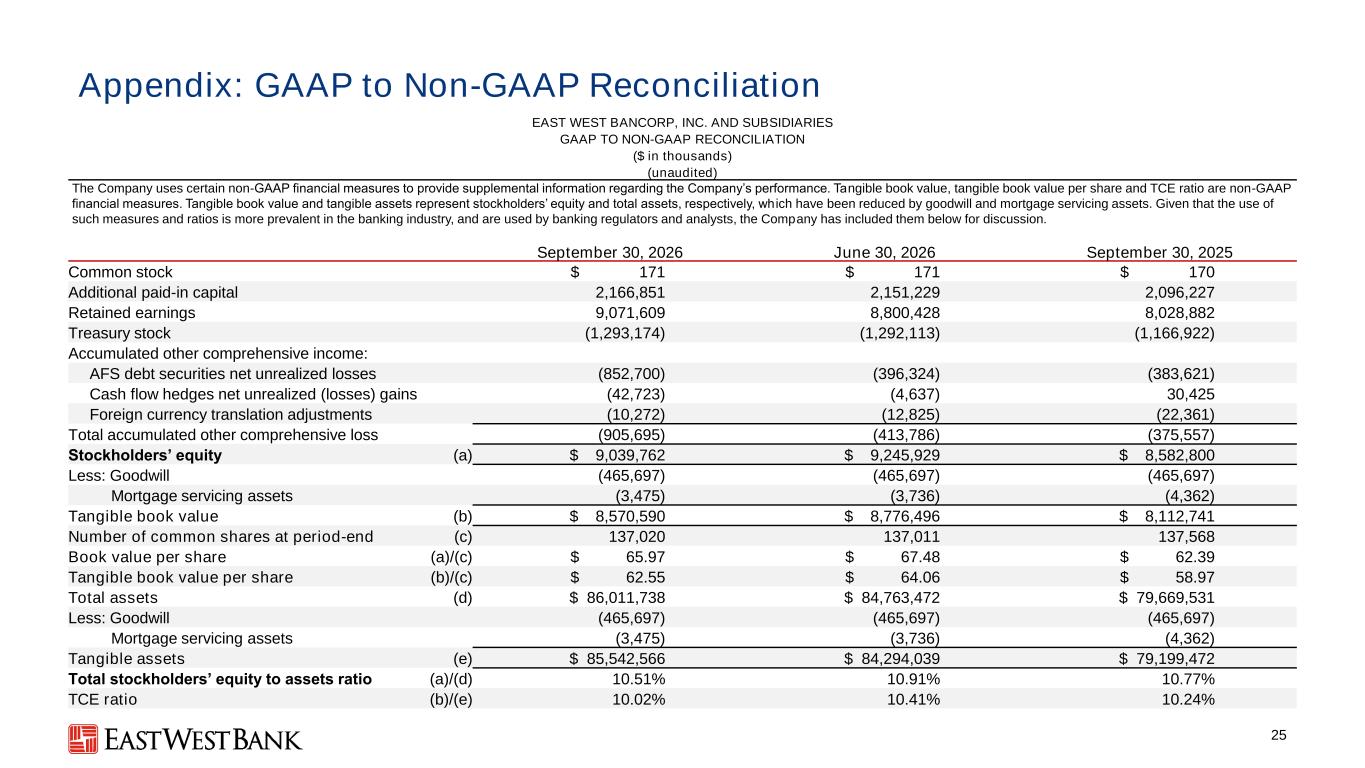
25 Appendix: GAAP to Non-GAAP Reconciliation EAST WEST BANCORP, INC. AND SUBSIDIARIES GAAP TO NON-GAAP RECONCILIATION ($ in thousands) (unaudited) The Company uses certain non-GAAP financial measures to provide supplemental information regarding the Company’s performance. Tangible book value, tangible book value per share and TCE ratio are non-GAAP financial measures. Tangible book value and tangible assets represent stockholders’ equity and total assets, respectively, wh ich have been reduced by goodwill and mortgage servicing assets. Given that the use of such measures and ratios is more prevalent in the banking industry, and are used by banking regulators and analysts, the Company has included them below for discussion. September 30, 2026 June 30, 2026 September 30, 2025 Common stock $ 171 $ 171 $ 170 Additional paid-in capital 2,166,851 2,151,229 2,096,227 Retained earnings 9,071,609 8,800,428 8,028,882 Treasury stock (1,293,174) (1,292,113) (1,166,922) Accumulated other comprehensive income: AFS debt securities net unrealized losses (852,700) (396,324) (383,621) Cash flow hedges net unrealized (losses) gains (42,723) (4,637) 30,425 Foreign currency translation adjustments (10,272) (12,825) (22,361) Total accumulated other comprehensive loss (905,695) (413,786) (375,557) Stockholders’ equity (a) $ 9,039,762 $ 9,245,929 $ 8,582,800 Less: Goodwill (465,697) (465,697) (465,697) Mortgage servicing assets (3,475) (3,736) (4,362) Tangible book value (b) $ 8,570,590 $ 8,776,496 $ 8,112,741 Number of common shares at period-end (c) 137,020 137,011 137,568 Book value per share (a)/(c) $ 65.97 $ 67.48 $ 62.39 Tangible book value per share (b)/(c) $ 62.55 $ 64.06 $ 58.97 Total assets (d) $ 86,011,738 $ 84,763,472 $ 79,669,531 Less: Goodwill (465,697) (465,697) (465,697) Mortgage servicing assets (3,475) (3,736) (4,362) Tangible assets (e) $ 85,542,566 $ 84,294,039 $ 79,199,472 Total stockholders’ equity to assets ratio (a)/(d) 10.51% 10.91% 10.77% TCE ratio (b)/(e) 10.02% 10.41% 10.24%
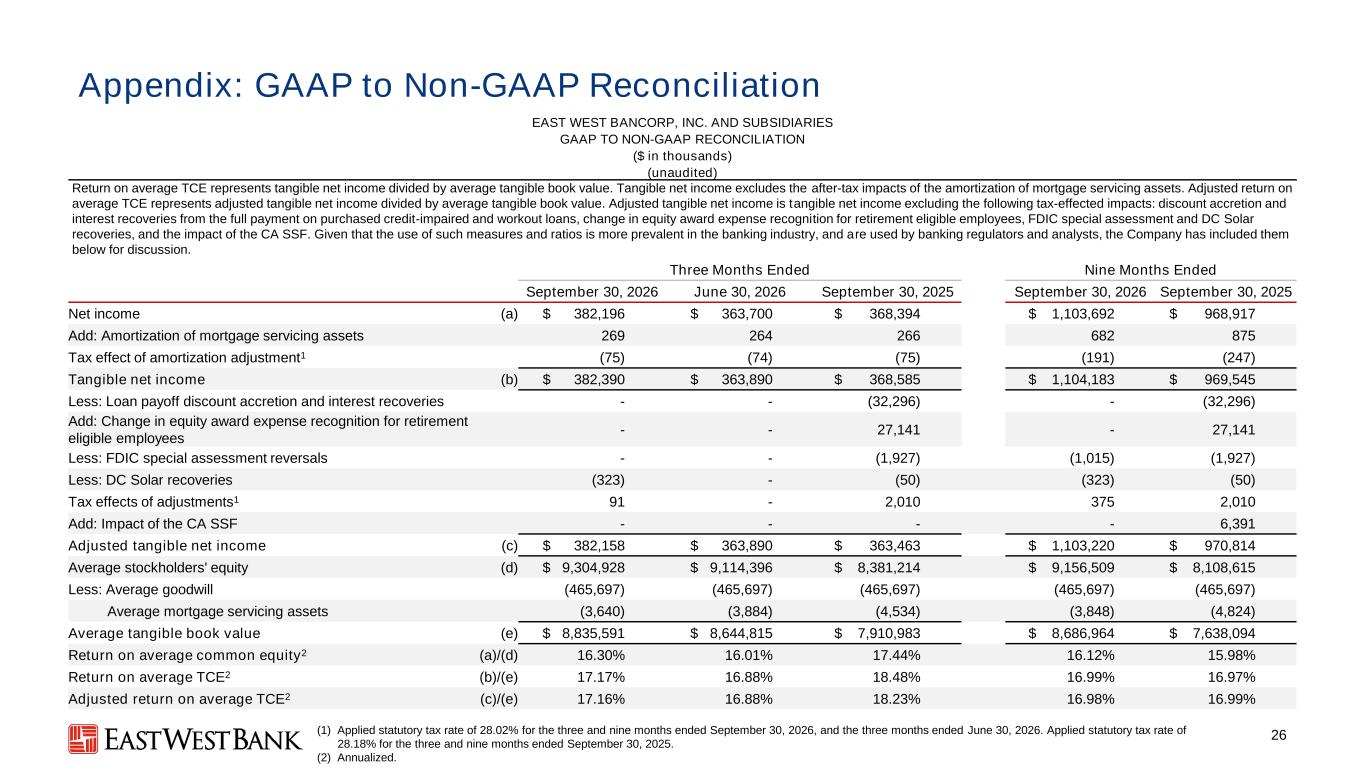
26 Appendix: GAAP to Non-GAAP Reconciliation EAST WEST BANCORP, INC. AND SUBSIDIARIES GAAP TO NON-GAAP RECONCILIATION ($ in thousands) (unaudited) Return on average TCE represents tangible net income divided by average tangible book value. Tangible net income excludes the after-tax impacts of the amortization of mortgage servicing assets. Adjusted return on average TCE represents adjusted tangible net income divided by average tangible book value. Adjusted tangible net income is tangible net income excluding the following tax-effected impacts: discount accretion and interest recoveries from the full payment on purchased credit-impaired and workout loans, change in equity award expense recognition for retirement eligible employees, FDIC special assessment and DC Solar recoveries, and the impact of the CA SSF. Given that the use of such measures and ratios is more prevalent in the banking industry, and are used by banking regulators and analysts, the Company has included them below for discussion. (1) Applied statutory tax rate of 28.02% for the three and nine months ended September 30, 2026, and the three months ended June 30, 2026. Applied statutory tax rate of iiiiiiii28.18% for the three and nine months ended September 30, 2025. (2) Annualized. Three Months Ended Nine Months Ended September 30, 2026 June 30, 2026 September 30, 2025 September 30, 2026 September 30, 2025 Net income (a) $ 382,196 $ 363,700 $ 368,394 $ 1,103,692 $ 968,917 Add: Amortization of mortgage servicing assets 269 264 266 682 875 Tax effect of amortization adjustment1 (75) (74) (75) (191) (247) Tangible net income (b) $ 382,390 $ 363,890 $ 368,585 $ 1,104,183 $ 969,545 Less: Loan payoff discount accretion and interest recoveries - - (32,296) - (32,296) Add: Change in equity award expense recognition for retirement eligible employees - - 27,141 - 27,141 Less: FDIC special assessment reversals - - (1,927) (1,015) (1,927) Less: DC Solar recoveries (323) - (50) (323) (50) Tax effects of adjustments1 91 - 2,010 375 2,010 Add: Impact of the CA SSF - - - - 6,391 Adjusted tangible net income (c) $ 382,158 $ 363,890 $ 363,463 $ 1,103,220 $ 970,814 Average stockholders' equity (d) $ 9,304,928 $ 9,114,396 $ 8,381,214 $ 9,156,509 $ 8,108,615 Less: Average goodwill (465,697) (465,697) (465,697) (465,697) (465,697) Average mortgage servicing assets (3,640) (3,884) (4,534) (3,848) (4,824) Average tangible book value (e) $ 8,835,591 $ 8,644,815 $ 7,910,983 $ 8,686,964 $ 7,638,094 Return on average common equity2 (a)/(d) 16.30% 16.01% 17.44% 16.12% 15.98% Return on average TCE2 (b)/(e) 17.17% 16.88% 18.48% 16.99% 16.97% Adjusted return on average TCE2 (c)/(e) 17.16% 16.88% 18.23% 16.98% 16.99%