Exhibit 99.1
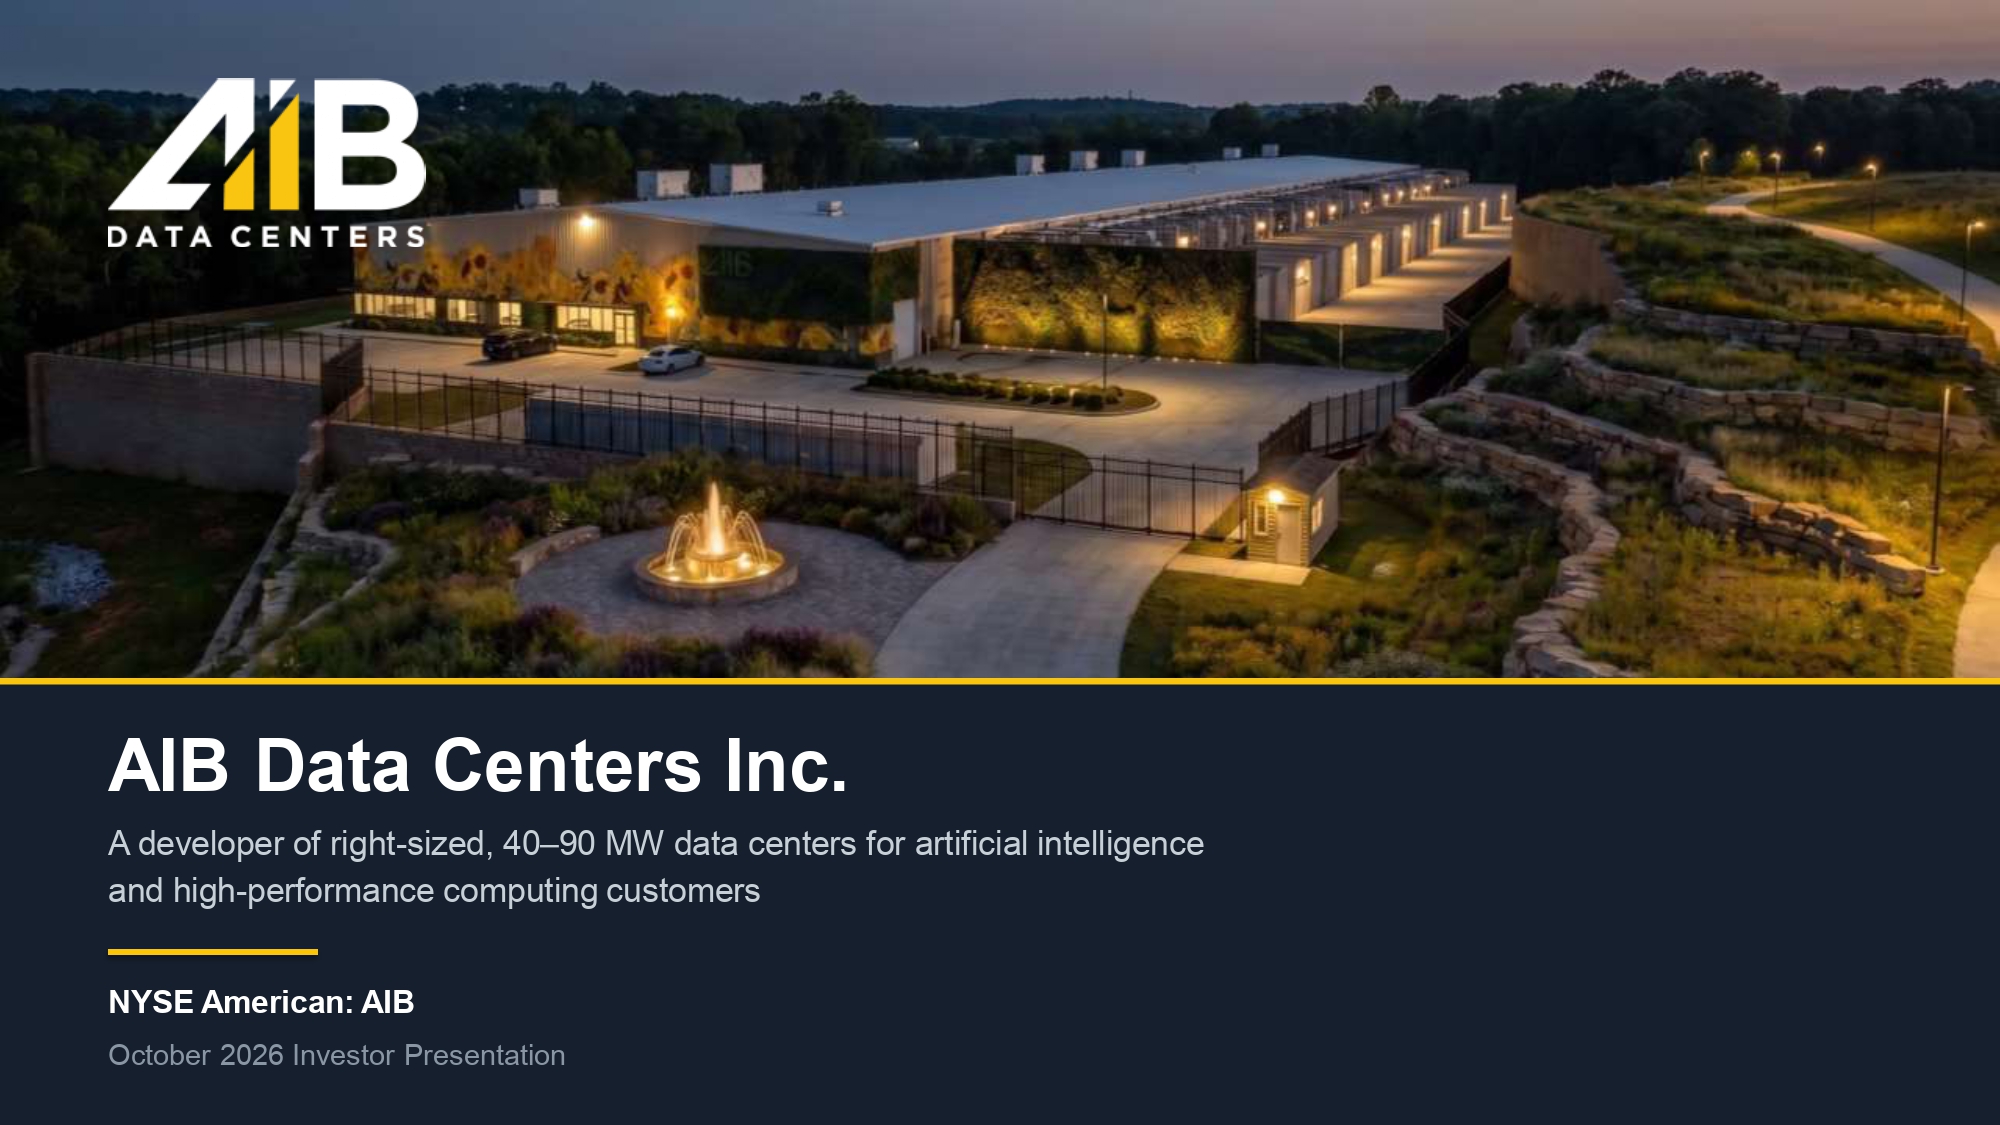
AIB Data Centers Inc. A developer of right - sized, 40 – 90 MW data centers for artificial intelligence and high - performance computing customers NYSE American: AIB October 2026 Investor Presentation
Disclosure Forward - Looking Statements Forward - looking statements This presentation contains forward - looking statements within the meaning of the Private Securities Litigation Reform Act of 1995, including statements regarding the expectations, plans and prospects of AIB Data Centers Inc. (AIB), such as anticipated financial performance, growth strategy, data center development, power capacity, and potential commercial opportunities. These statements are based on current assumptions and are subject to risk and uncertainties that could cause actual results to differ materially, including AIB’s ability to execute its business plan, secure and develop infrastructure and power resources, enter into definitive agreements, and general economic, market, regulatory and business conditions as well as the risks described in AIB’s filings with the U.S. Securities and Exchange Commission. Words such as “anticipate,” “expect,” “plan,” “believe,” “estimate,” “intend,” “project,” “target,” “may,” “will,” “should,” “could,” “would,” “seek,” and similar expressions, or the negative of such terms, are intended to identify forward - looking statements Nebius Agreement Forward - looking statements in this presentation also include statements regarding the anticipated completion of the data center, the expected commencement of colocation services, the timing and conditions of escrow fund releases, the exercise of renewal options under the Master Colocation Services Agreement, and the expected sources of development capital. Factors that could cause actual results to differ include risks relating to the timely completion and commissioning of the data center; the ability to achieve and maintain required service - level standards; the ability of the parties to satisfy the conditions for release of escrowed funds; the financial condition and creditworthiness of Nebius Inc. and its parent, Nebius Group N.V.; changes in the demand for data center and colocation services; construction, permitting and regulatory approvals; and the availability of project - level financing. No offer or solicitation This presentation and any oral statements made in connection with this presentation shall neither constitute an offer to sell nor the solicitation of an offer to buy any securities, nor shall there be any sale of securities in any jurisdiction in which the offer, solicitation or sale would be unlawful prior to the registration or qualification under the securities laws of any such jurisdiction. This communication is restricted by law; it is not intended for distribution to, or use by any person in, any jurisdiction where such distribution or use would be contrary to local law or regulation. No Representations and Warranties This presentation is for informational purposes only and does not purport to contain all of the information that may be required to evaluate a possible investment decision with respect AIB or any of its subsidiaries. The recipient agrees and acknowledges that this presentation is not intended to form the basis of any investment decision by the recipient and does not constitute financial investment, tax or legal advice. No representation or warranty, express or implied, is or will be given by AIB or any of its respective affiliates, directors, officers, employees or advisers or any other person as to the accuracy or completeness of the information (including as to the accuracy, completeness or reasonableness of statements, estimates, targets, projections, assumptions or judgments) in this presentation or in any other written, oral or other communications transmitted or otherwise made available to any party in the course of its evaluation of a possible investment and no responsibility or liability whatsoever is accepted for the accuracy or sufficiency thereof or for any errors, omissions or misstatements, negligent or otherwise, relating thereto. The recipient also acknowledges and agrees that the information contained in this presentation is preliminary in nature and is subject to change, and any such changes may be material. AIB disclaims any duty to update the information contained in this presentation. AIB Data Centers Inc. 2
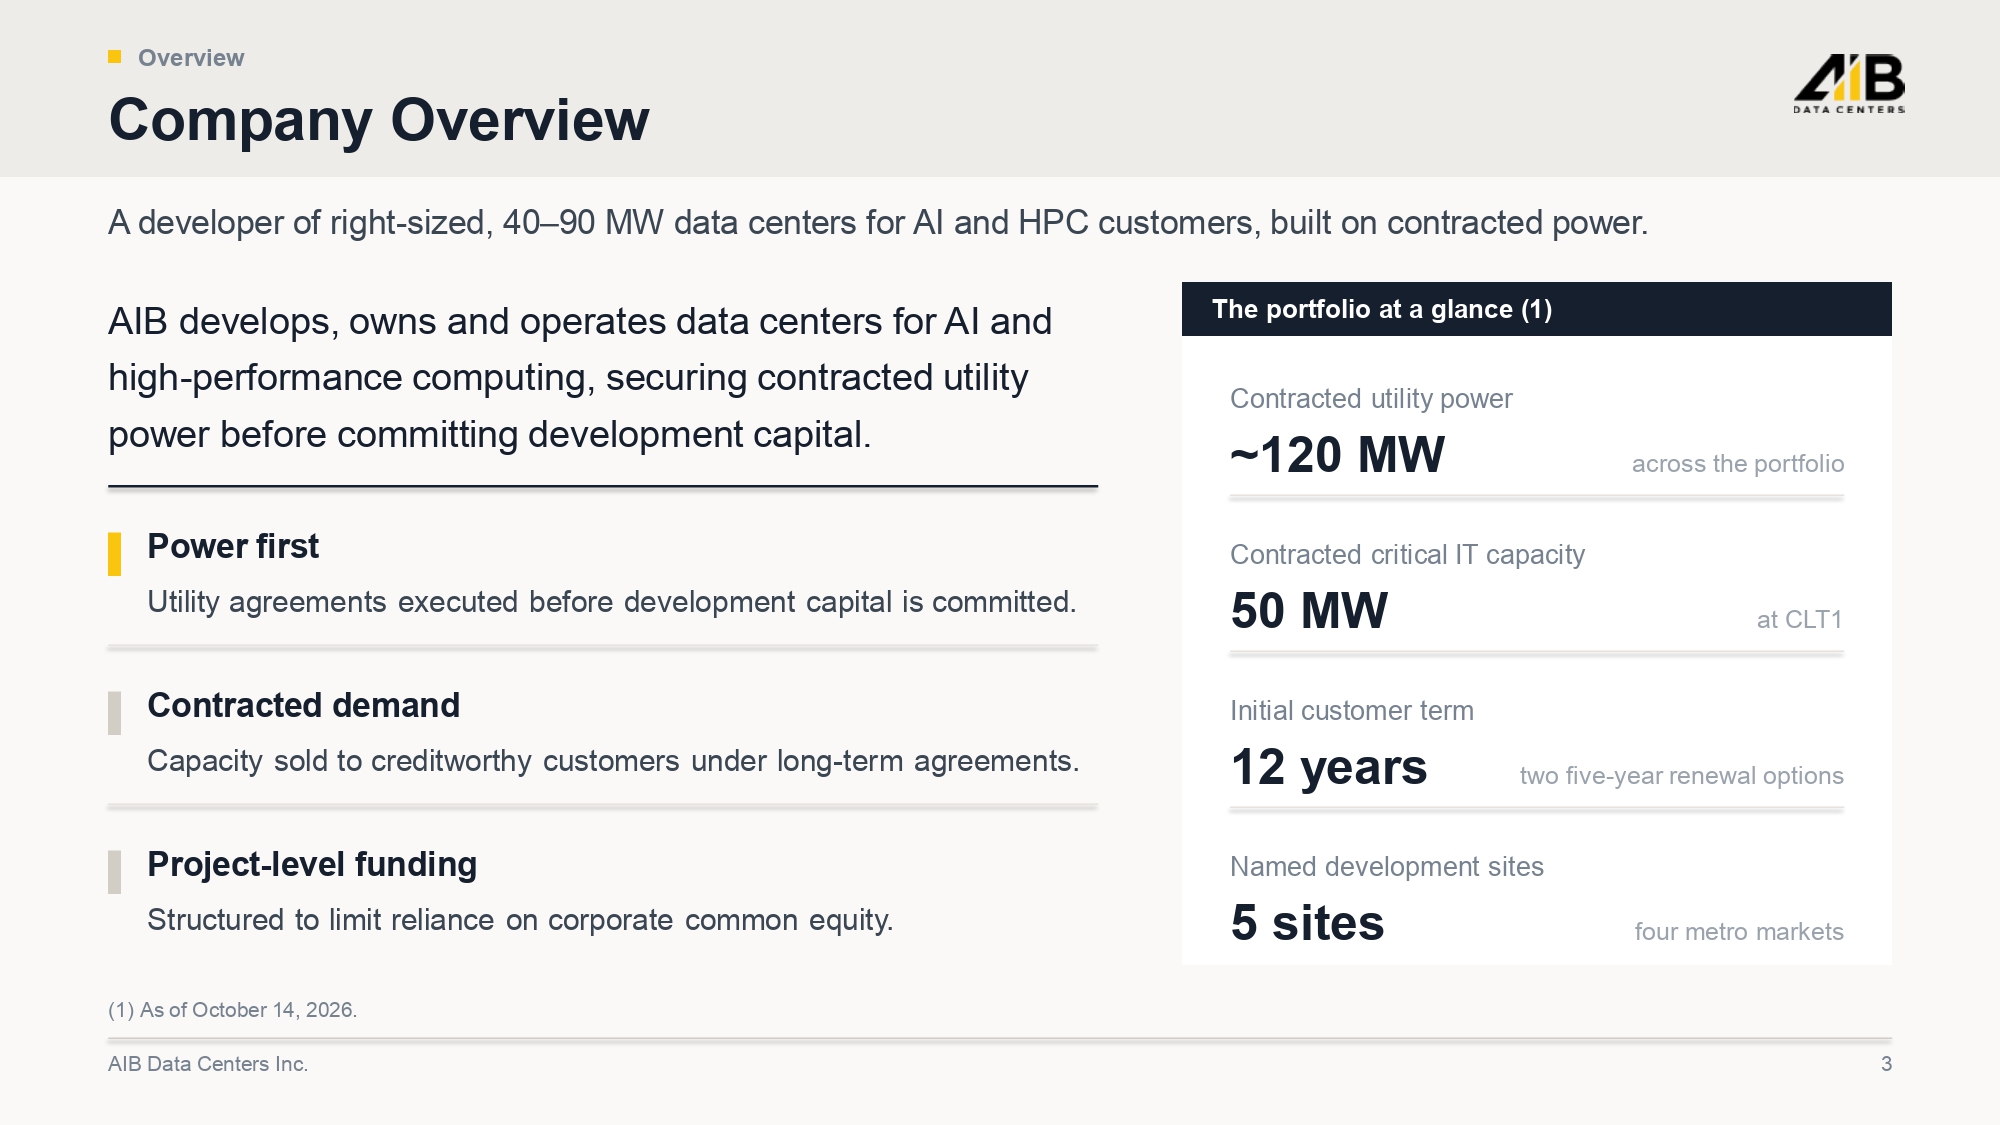
Overview Company Overview A developer of right - sized, 40 – 90 MW data centers for AI and HPC customers, built on contracted power. AIB develops, owns and operates data centers for AI and high - performance computing, securing contracted utility power before committing development capital. Power first Utility agreements executed before development capital is committed. Contracted demand Capacity sold to creditworthy customers under long - term agreements. Project - level funding Structured to limit reliance on corporate common equity. The portfolio at a glance (1) Contracted utility power ~120 MW across the portfolio Contracted critical IT capacity 50 MW at CLT1 Initial customer term 12 years two five - year renewal options Named development sites 5 sites four metro markets (1) As of October 14, 2026. AIB Data Centers Inc. 3
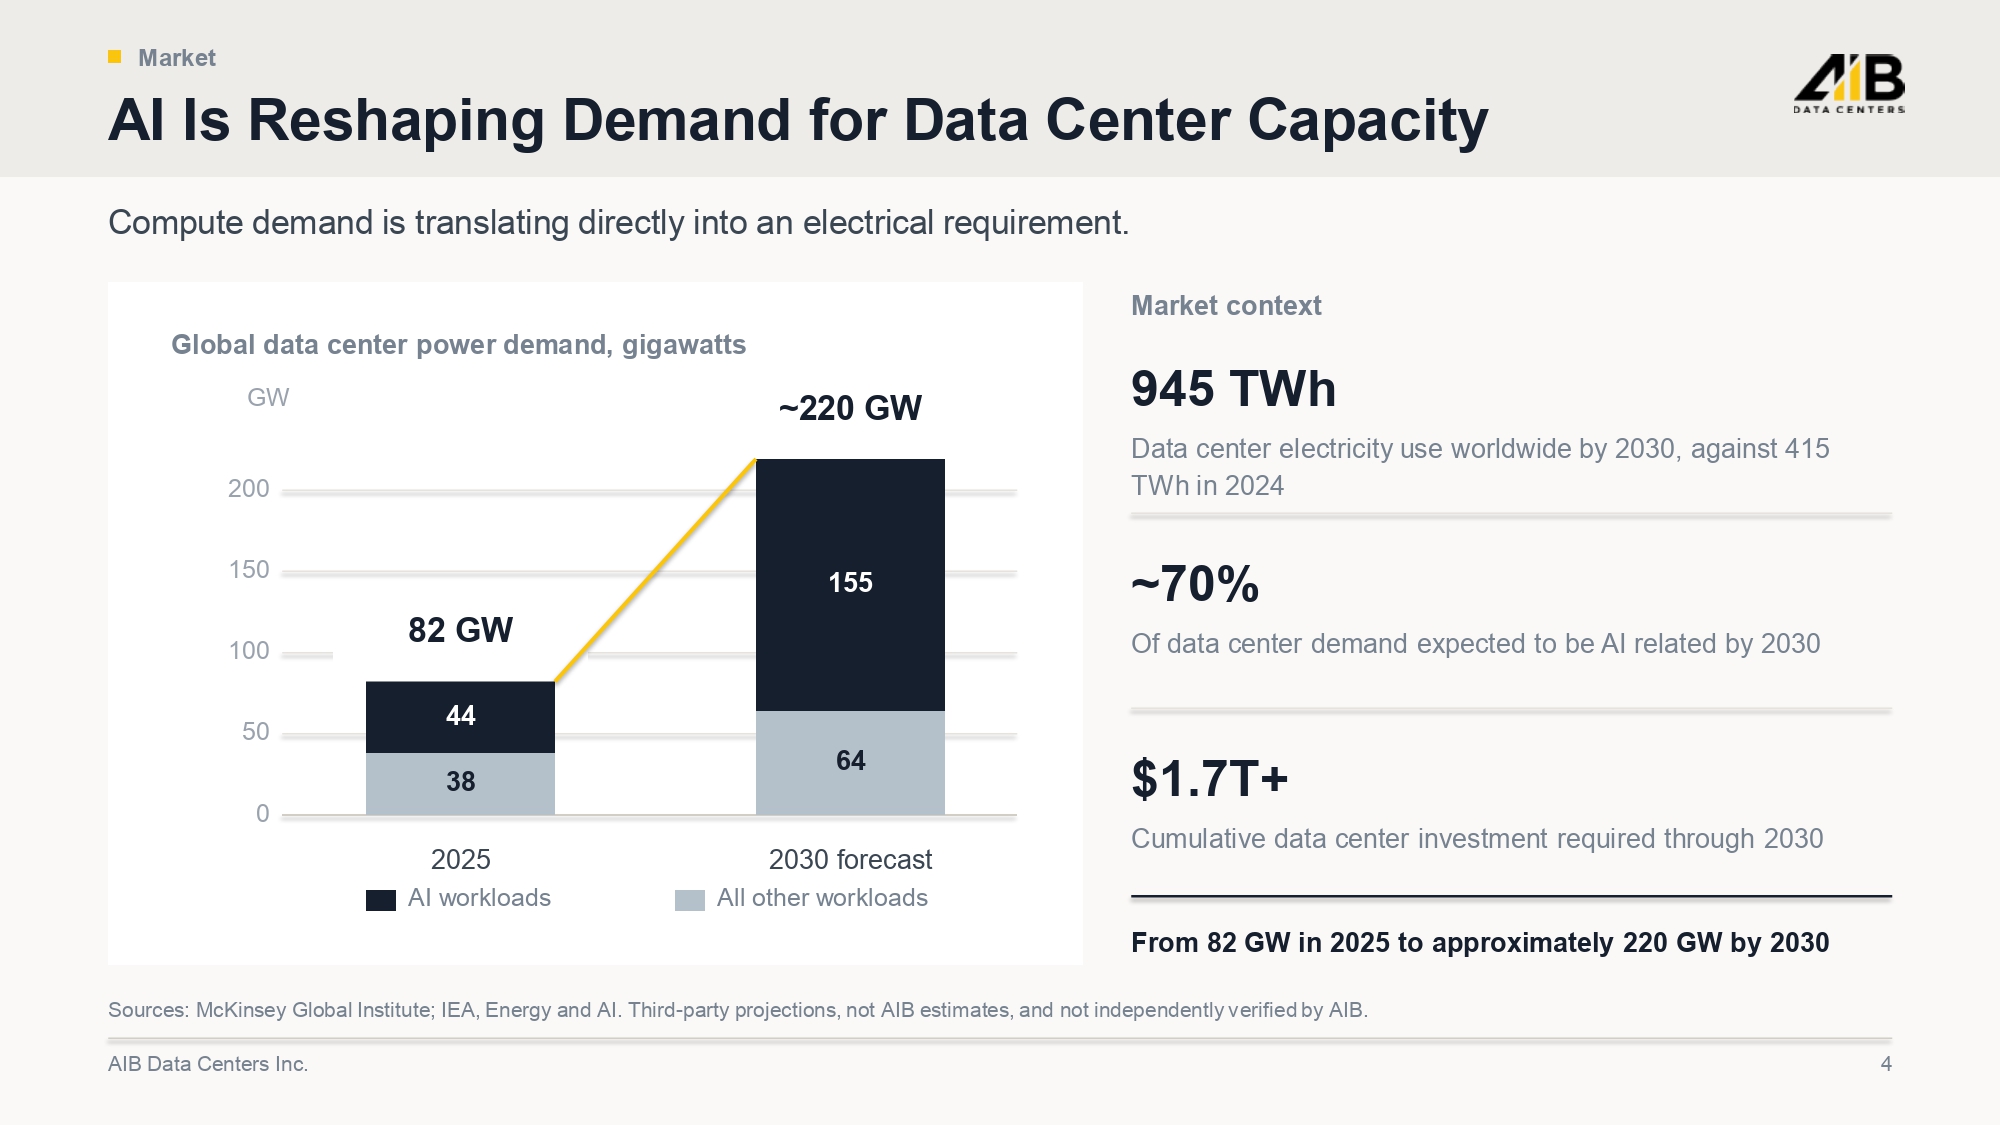
Market AI Is Reshaping Demand for Data Center Capacity Compute demand is translating directly into an electrical requirement. Global data center power demand, gigawatts 0 50 100 150 200 GW 82 GW 44 38 2025 ~220 GW 155 64 2030 forecast AI workloads All other workloads Market context 945 TWh Data center electricity use worldwide by 2030, against 415 TWh in 2024 ~70% Of data center demand expected to be AI related by 2030 $1.7T+ Cumulative data center investment required through 2030 From 82 GW in 2025 to approximately 220 GW by 2030 Sources: McKinsey Global Institute; IEA, Energy and AI. Third - party projections, not AIB estimates, and not independently verifi ed by AIB. AIB Data Centers Inc. 4
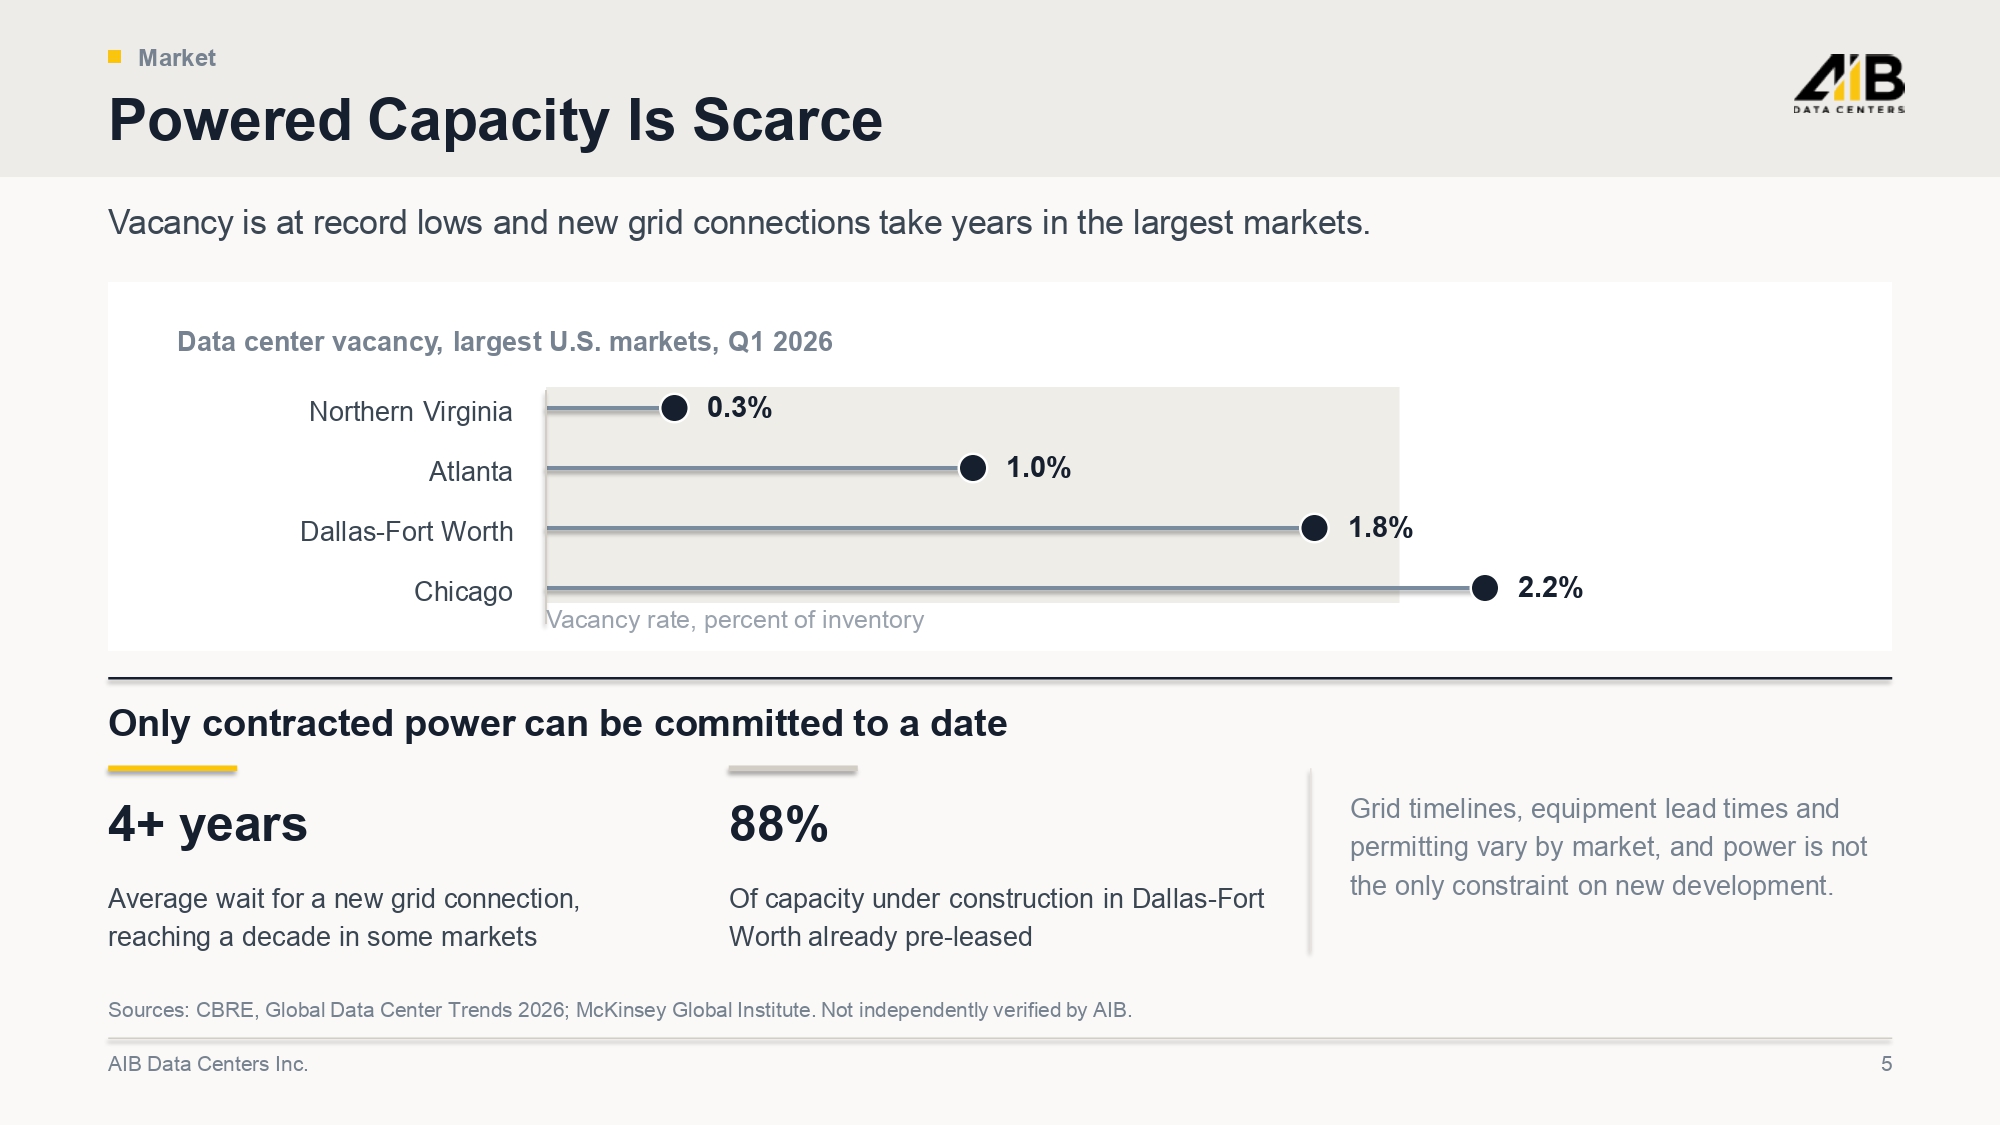
Market Powered Capacity Is Scarce Vacancy is at record lows and new grid connections take years in the largest markets. Data center vacancy, largest U.S. markets, Q1 2026 Northern Virginia 0.3% Atlanta 1.0% Dallas - Fort Worth 1.8% Chicago 2.2% Vacancy rate, percent of inventory Only contracted power can be committed to a date 4+ years Average wait for a new grid connection, reaching a decade in some markets 88% Of capacity under construction in Dallas - Fort Worth already pre - leased Grid timelines, equipment lead times and permitting vary by market, and power is not the only constraint on new development. Sources: CBRE, Global Data Center Trends 2026; McKinsey Global Institute. Not independently verified by AIB. AIB Data Centers Inc. 5
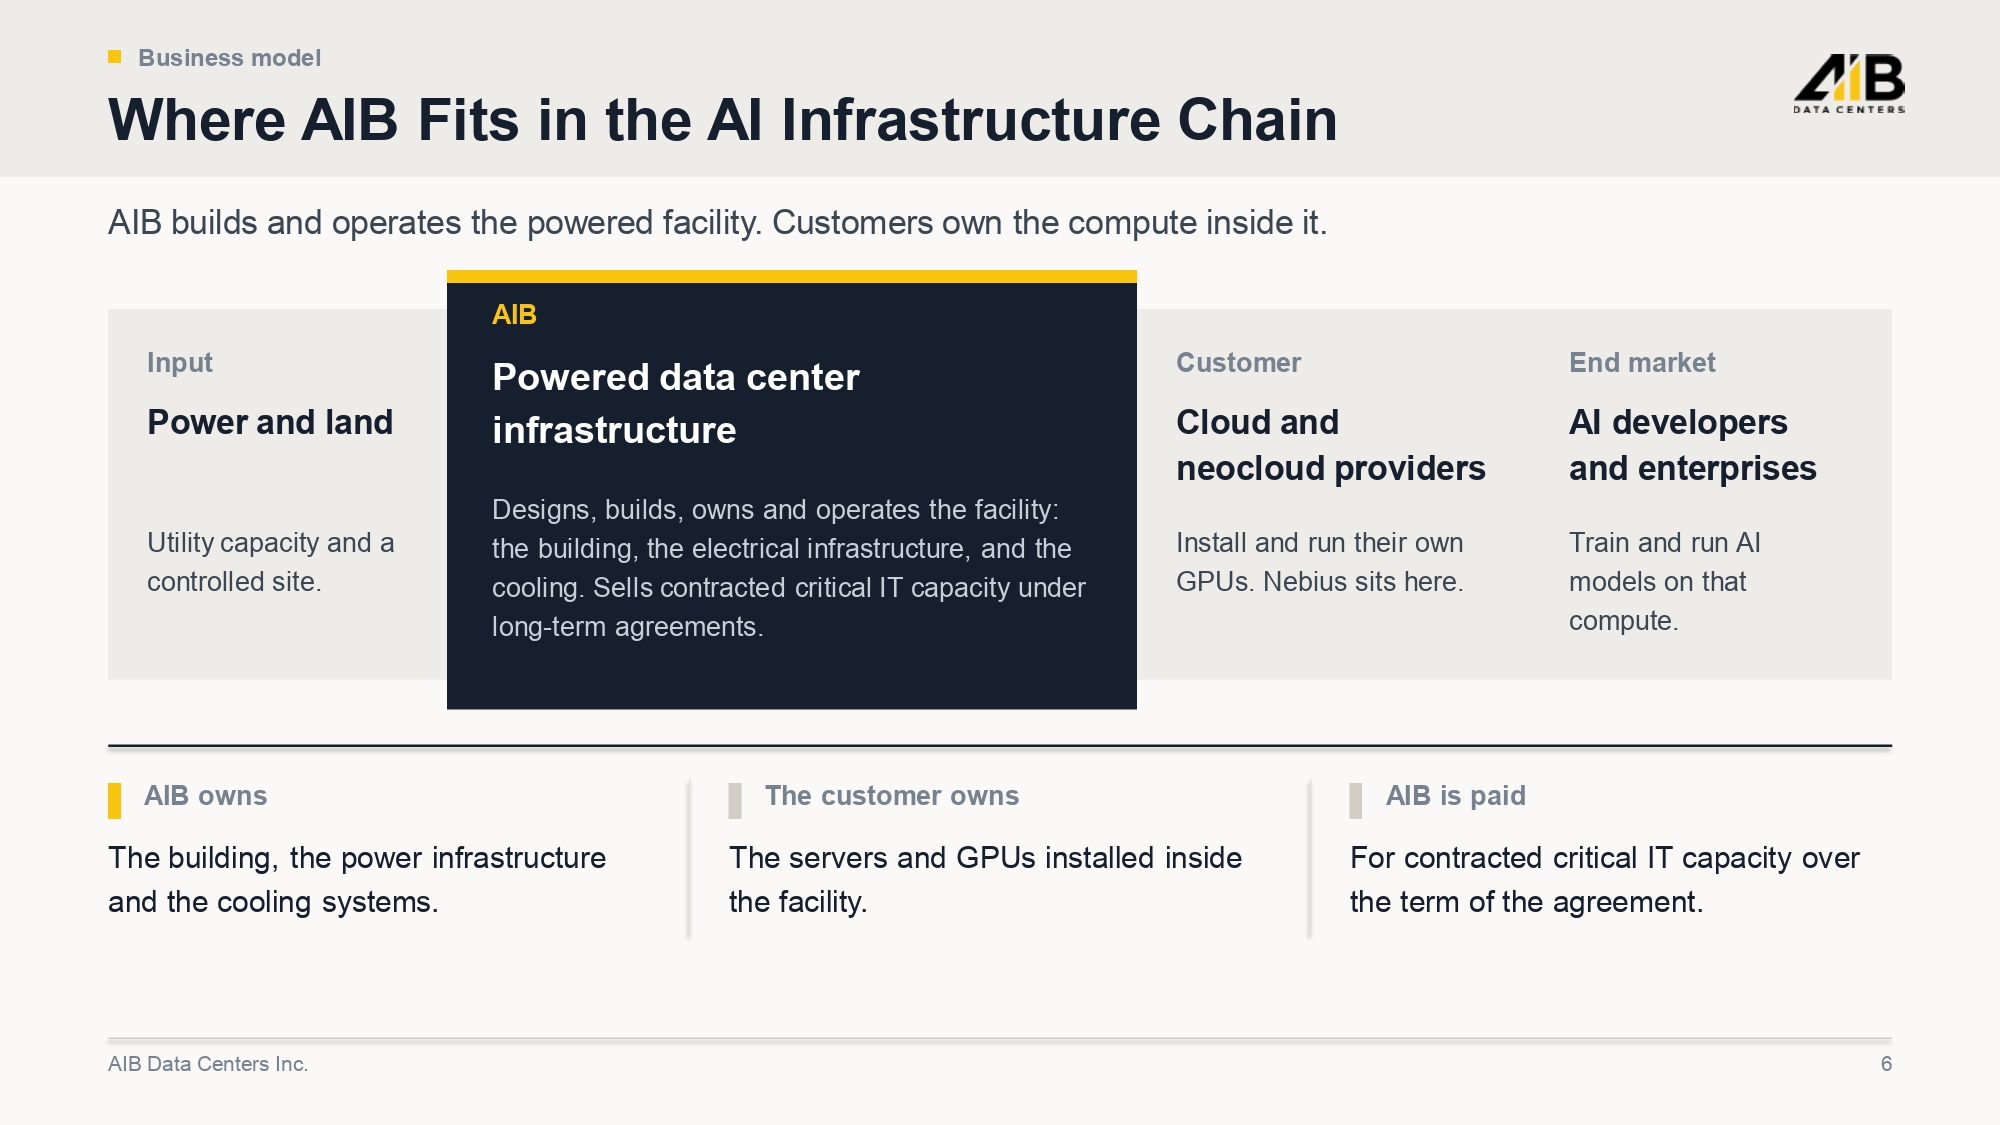
Business model Where AIB Fits in the AI Infrastructure Chain AIB builds and operates the powered facility. Customers own the compute inside it. Input Power and land Utility capacity and a controlled site. AIB Powered data center infrastructure Designs, builds, owns and operates the facility: the building, the electrical infrastructure, and the cooling. Sells contracted critical IT capacity under long - term agreements. Customer Cloud and neocloud providers Install and run their own GPUs. Nebius sits here. End market AI developers and enterprises Train and run AI models on that compute. AIB owns The building, the power infrastructure and the cooling systems. The customer owns The servers and GPUs installed inside the facility. AIB is paid For contracted critical IT capacity over the term of the agreement. AIB Data Centers Inc. 6
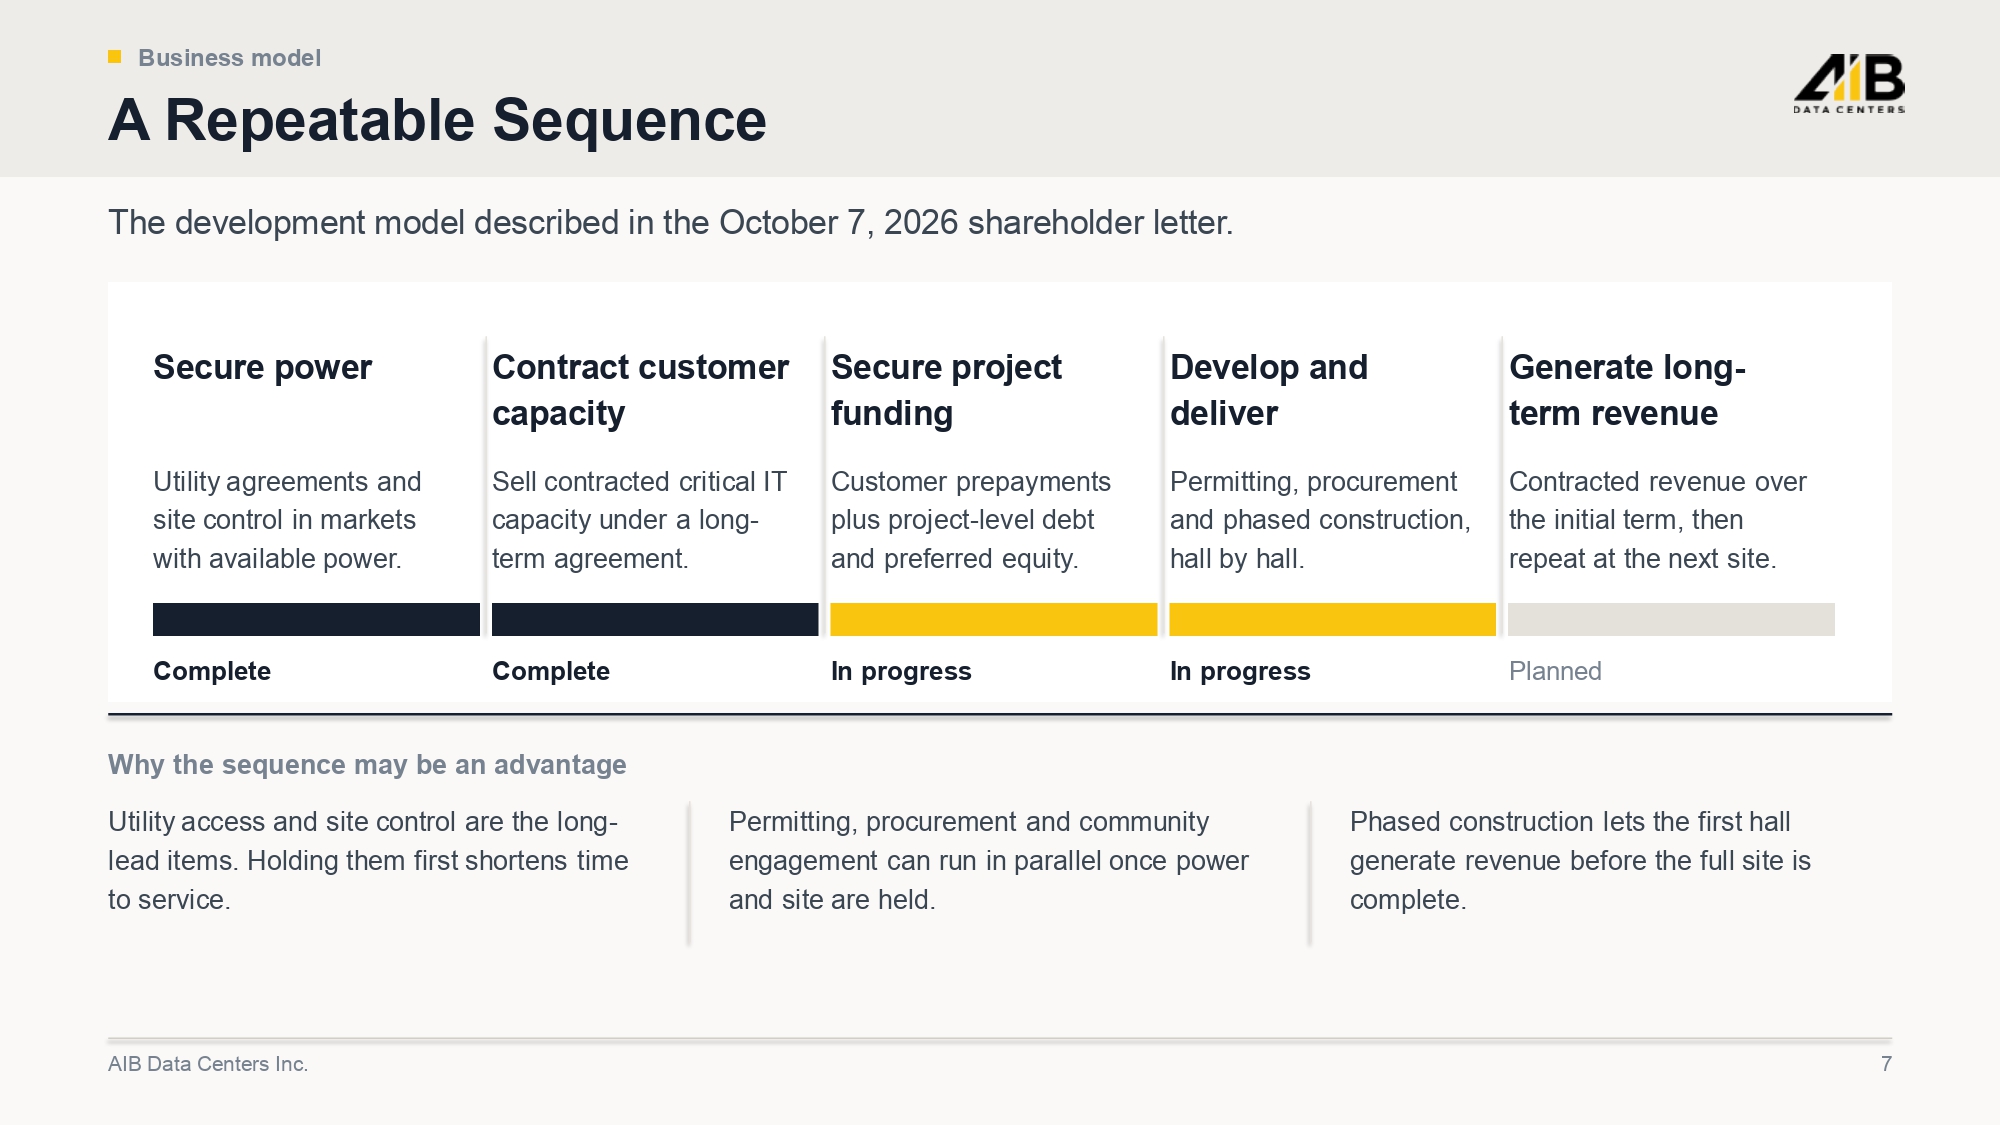
Business model A Repeatable Sequence The development model described in the October 7, 2026 shareholder letter. Secure power Utility agreements and site control in markets with available power. Complete Contract customer capacity Sell contracted critical IT capacity under a long - term agreement. Complete Secure project funding Customer prepayments plus project - level debt and preferred equity. In progress Develop and deliver Permitting, procurement and phased construction, hall by hall. In progress Generate long - term revenue Contracted revenue over the initial term, then repeat at the next site. Planned Why the sequence may be an advantage Utility access and site control are the long - lead items. Holding them first shortens time to service. Permitting, procurement and community engagement can run in parallel once power and site are held. Phased construction lets the first hall generate revenue before the full site is complete. AIB Data Centers Inc. 7
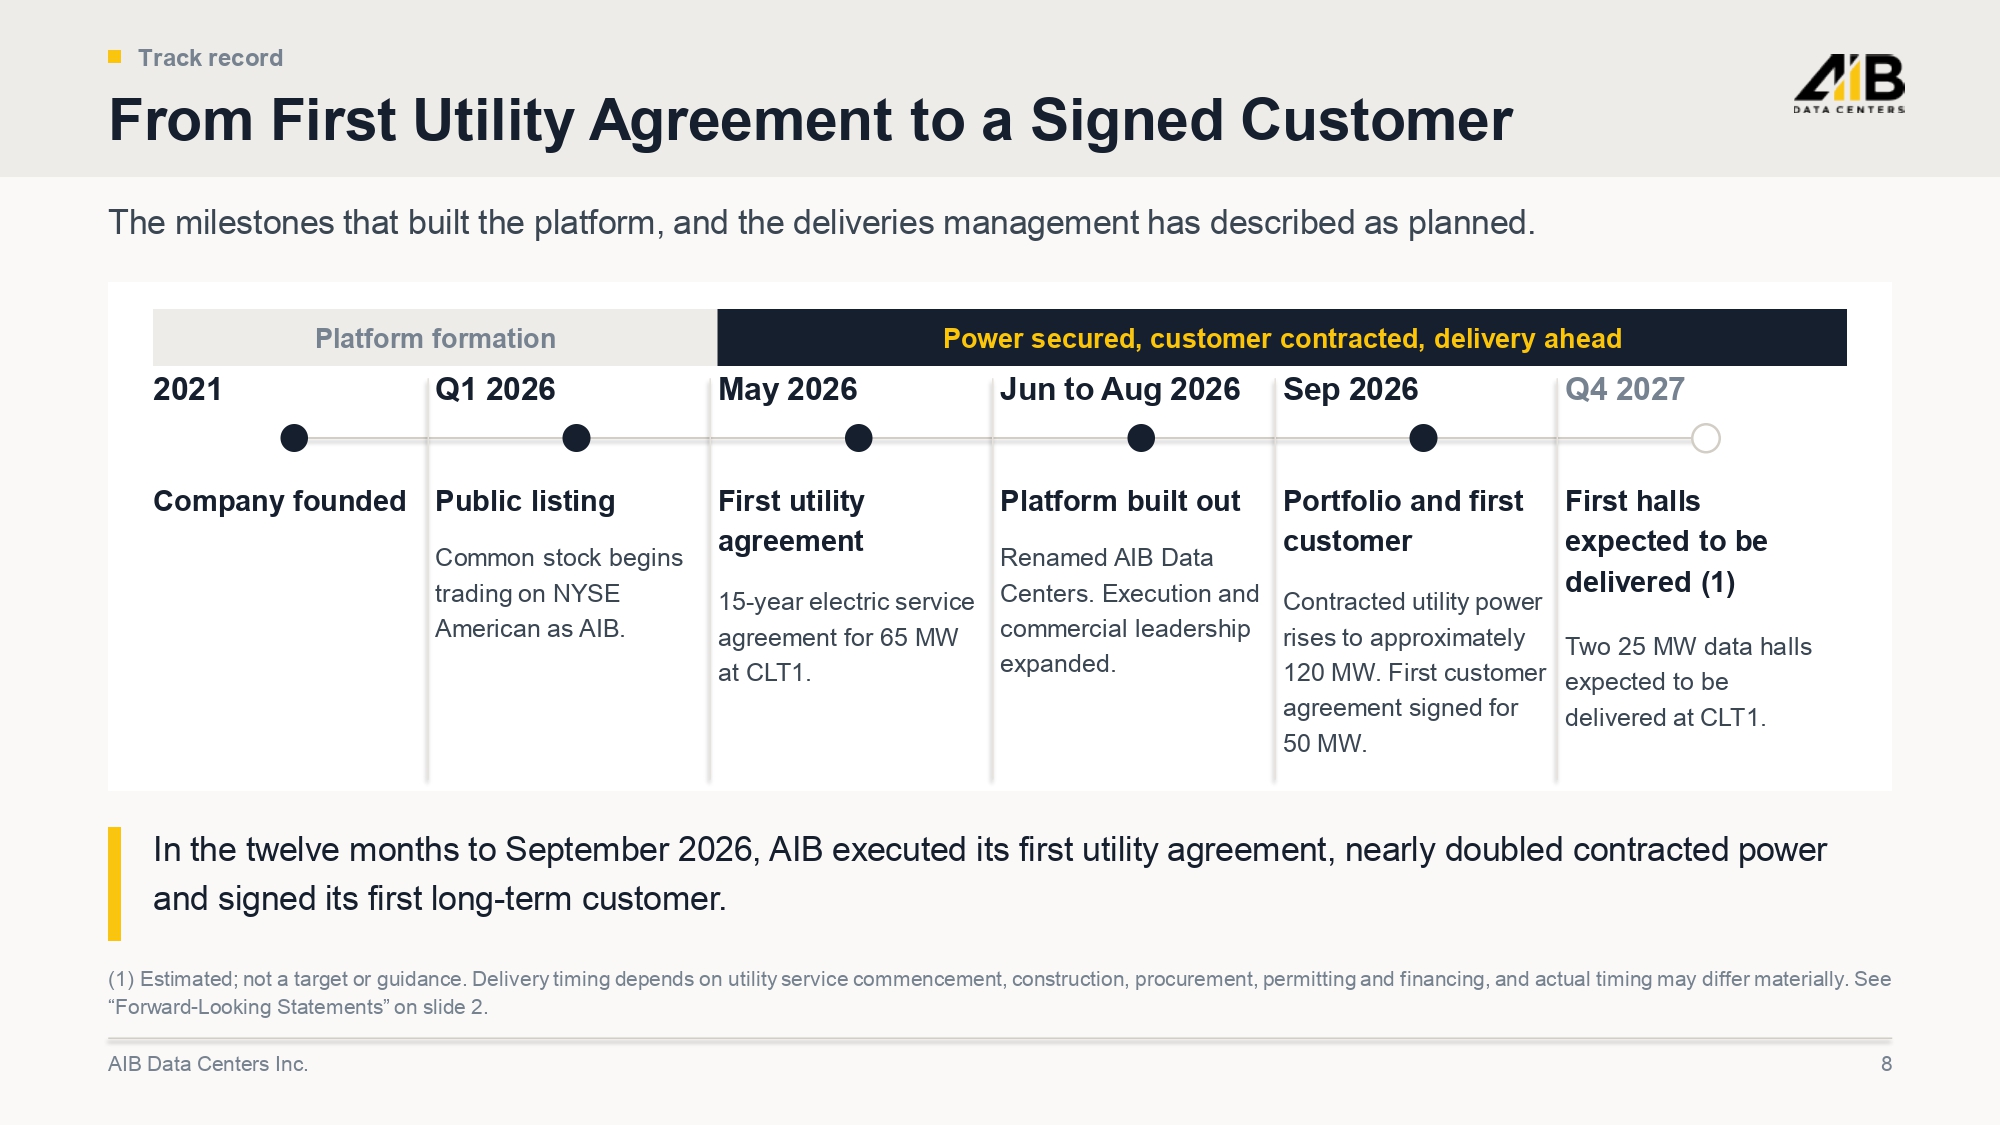
Track record From First Utility Agreement to a Signed Customer The milestones that built the platform, and the deliveries management has described as planned. Platform formation Power secured, customer contracted, delivery ahead 2021 Company founded Q1 2026 Public listing Common stock begins trading on NYSE American as AIB. May 2026 First utility agreement 15 - year electric service agreement for 65 MW at CLT1. Jun to Aug 2026 Platform built out Renamed AIB Data Centers. Execution and commercial leadership expanded. Sep 2026 Portfolio and first customer Contracted utility power rises to approximately 120 MW. First customer agreement signed for 50 MW. Q4 2027 First halls expected to be delivered (1) Two 25 MW data halls expected to be delivered at CLT1. In the twelve months to September 2026, AIB executed its first utility agreement, nearly doubled contracted power and signed its first long - term customer. (1) Estimated; not a target or guidance. Delivery timing depends on utility service commencement, construction, procurement, per mitting and financing, and actual timing may differ materially. See “Forward - Looking Statements” on slide 2. AIB Data Centers Inc. 8
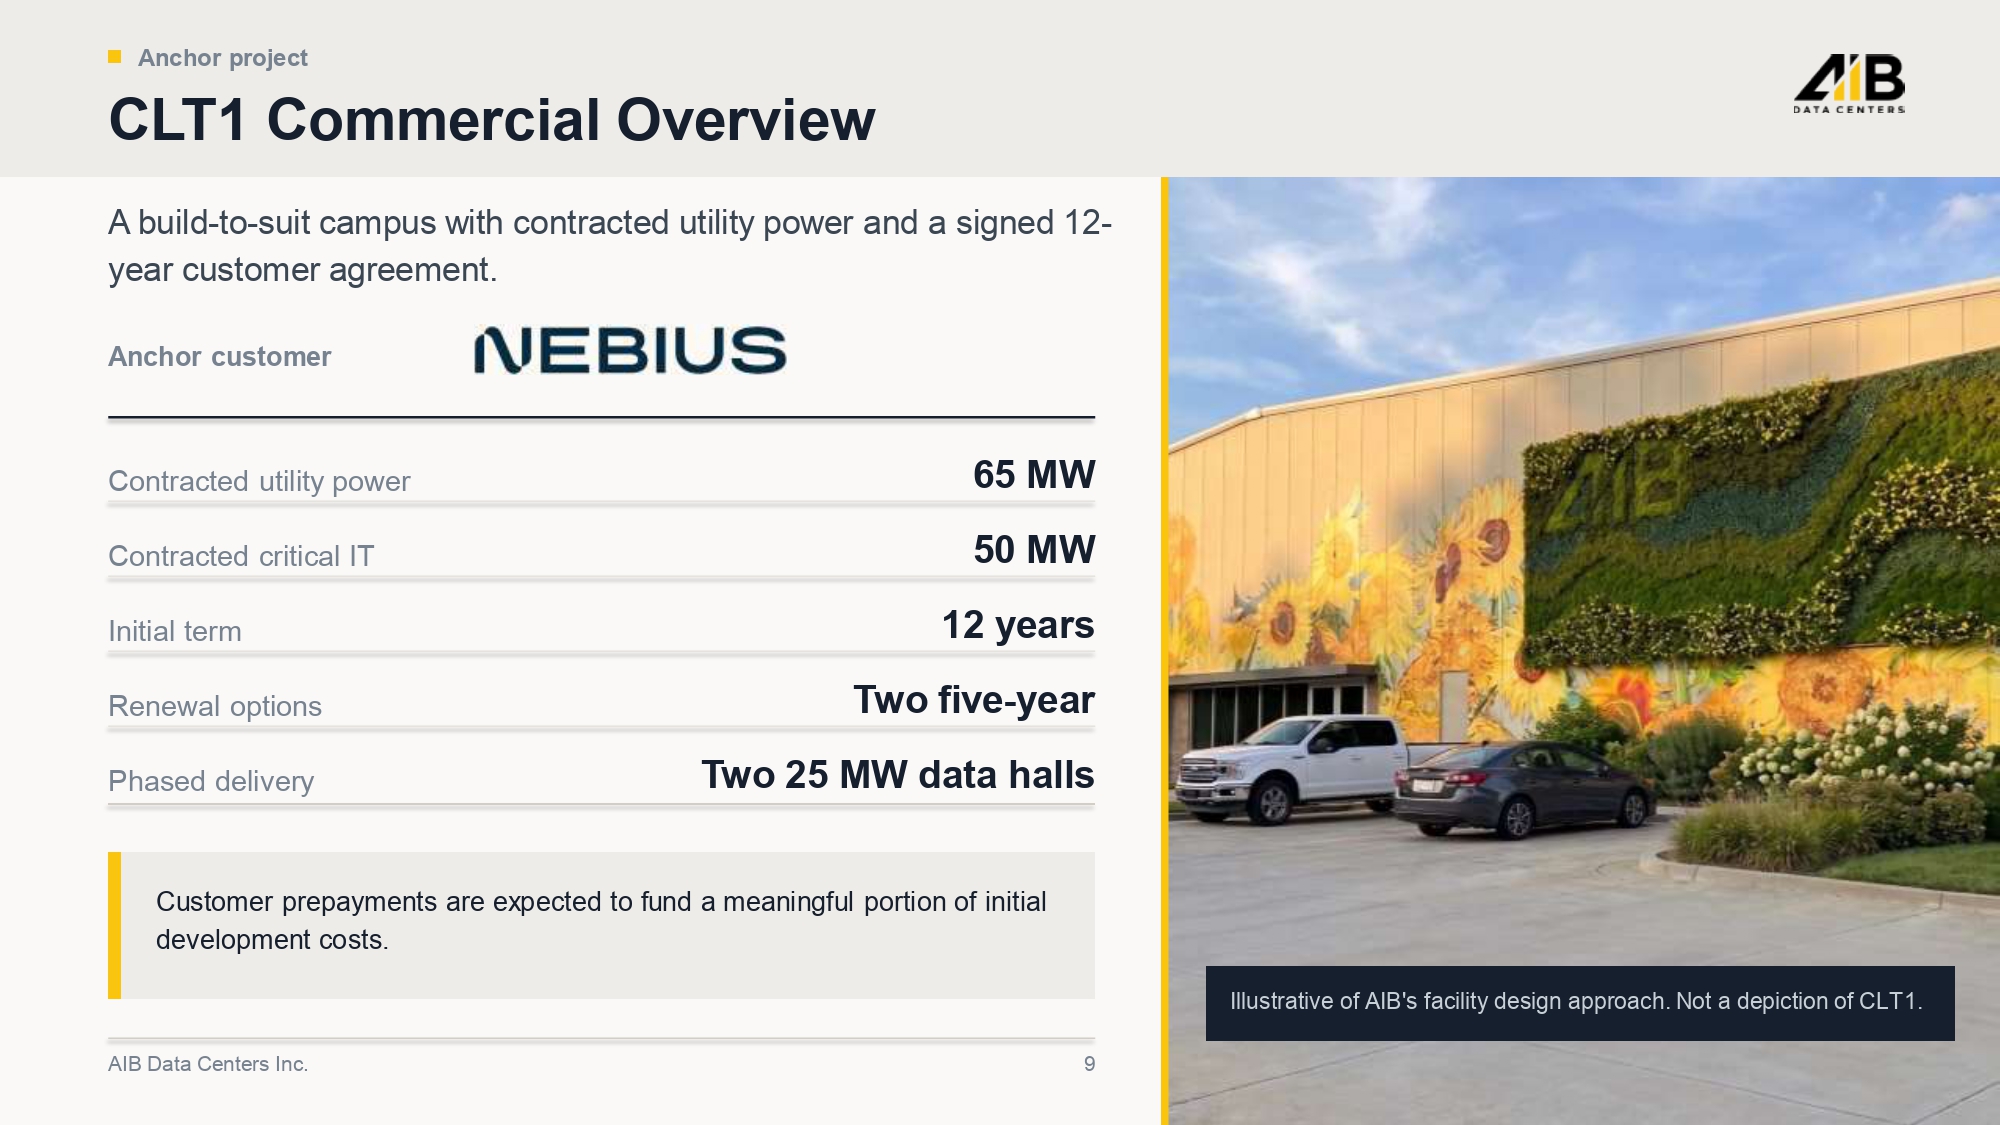
Anchor project CLT1 Commercial Overview A build - to - suit campus with contracted utility power and a signed 12 - year customer agreement. Illustrative of AIB's facility design approach. Not a depiction of CLT1. Anchor customer Contracted utility power 65 MW Contracted critical IT 50 MW Initial term 12 years Renewal options Two five - year Phased delivery Two 25 MW data halls Customer prepayments are expected to fund a meaningful portion of initial development costs. AIB Data Centers Inc. 9
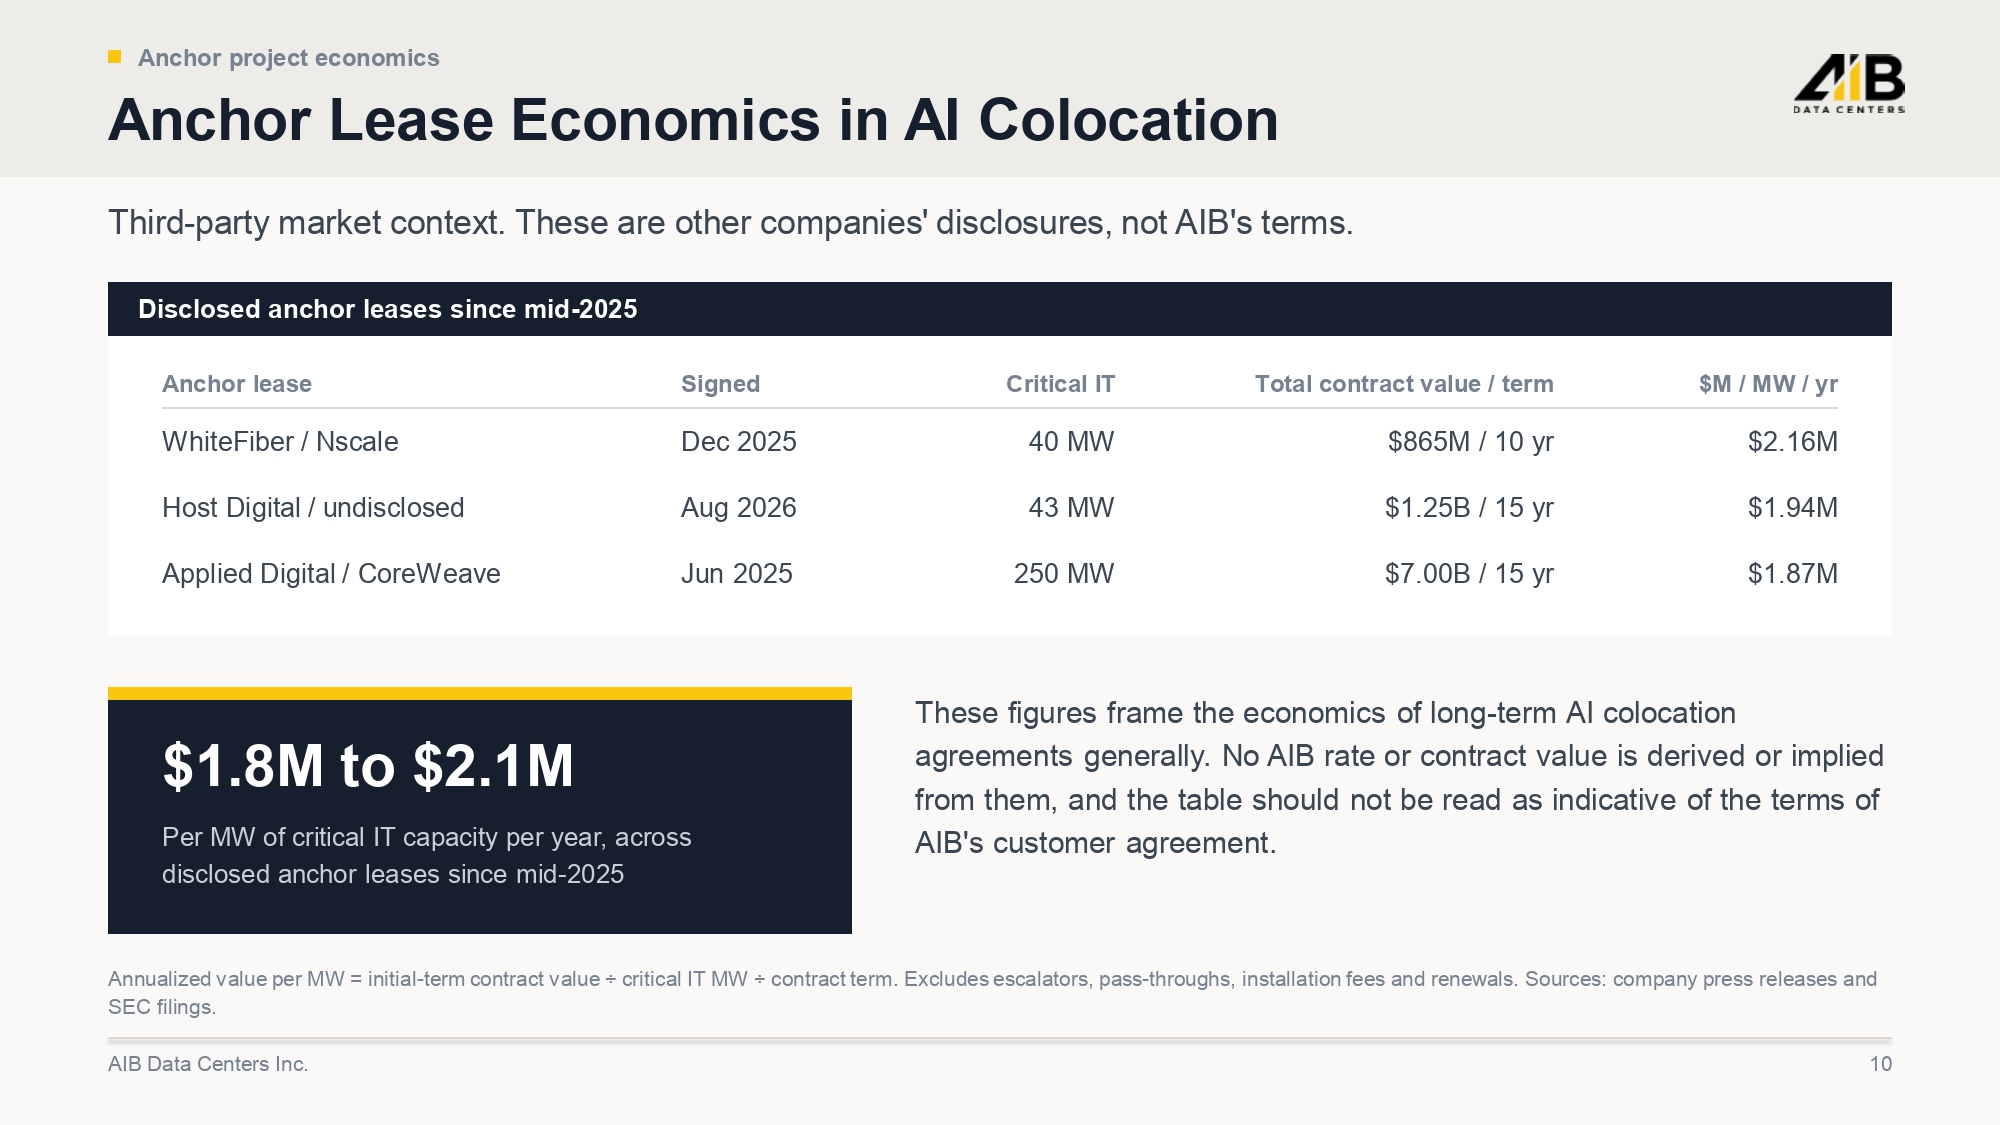
Anchor project economics Anchor Lease Economics in AI Colocation Third - party market context. These are other companies' disclosures, not AIB's terms. Disclosed anchor leases since mid - 2025 $M / MW / yr Total contract value / term Critical IT Signed Anchor lease $2.16M $865M / 10 yr 40 MW Dec 2025 WhiteFiber / Nscale $1.94M $1.25B / 15 yr 43 MW Aug 2026 Host Digital / undisclosed $1.87M $7.00B / 15 yr 250 MW Jun 2025 Applied Digital / CoreWeave $1.8M to $2.1M Per MW of critical IT capacity per year, across disclosed anchor leases since mid - 2025 These figures frame the economics of long - term AI colocation agreements generally. No AIB rate or contract value is derived or implied from them, and the table should not be read as indicative of the terms of AIB's customer agreement. Annualized value per MW = initial - term contract value ÷ critical IT MW ÷ contract term. Excludes escalators, pass - throughs, installation fees and renewals. Sources: company press releases and SEC filings. AIB Data Centers Inc. 10
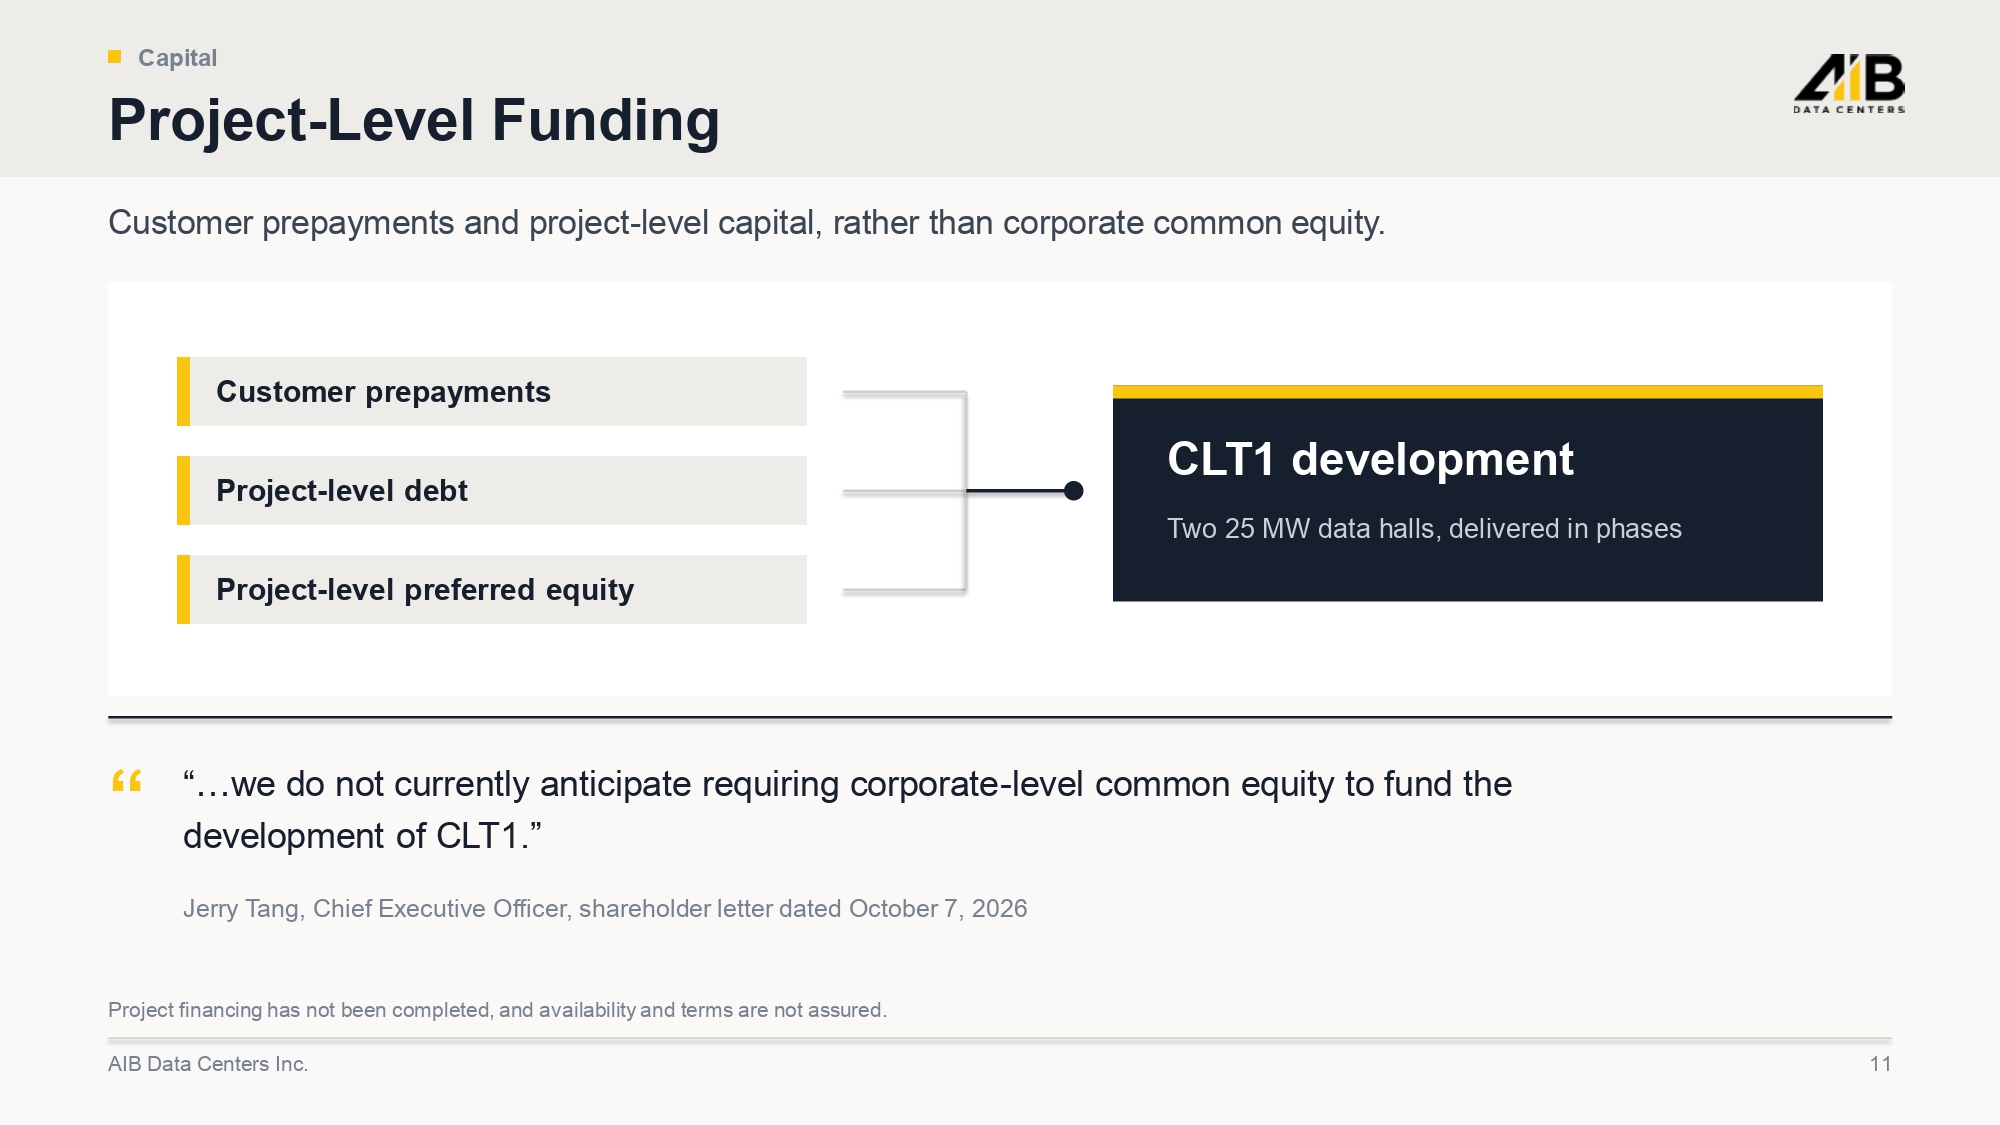
Capital Project - Level Funding Customer prepayments and project - level capital, rather than corporate common equity. Customer prepayments Project - level debt Project - level preferred equity CLT1 development Two 25 MW data halls, delivered in phases “ “…we do not currently anticipate requiring corporate - level common equity to fund the development of CLT1.” Jerry Tang, Chief Executive Officer, shareholder letter dated October 7, 2026 Project financing has not been completed, and availability and terms are not assured. AIB Data Centers Inc. 11
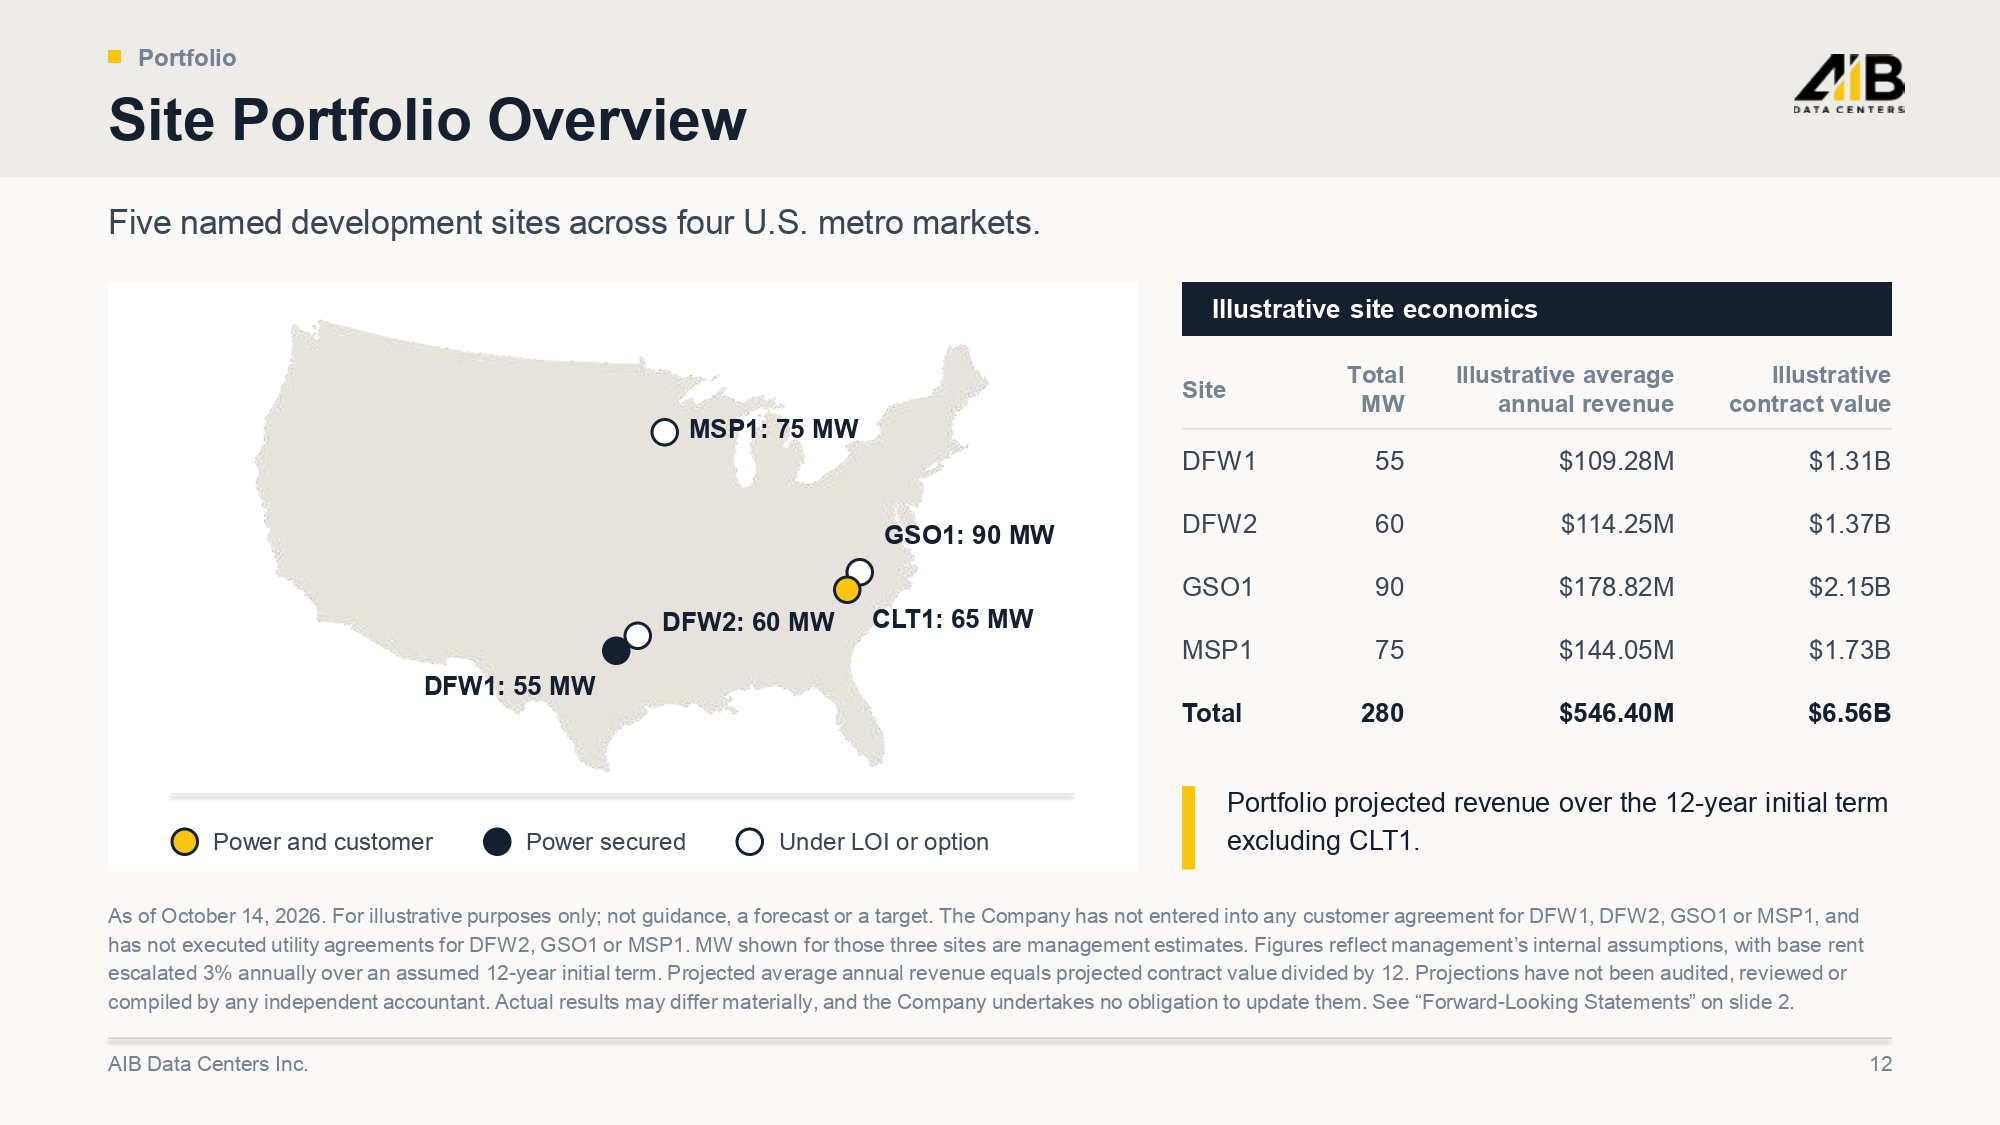
Portfolio Site Portfolio Overview Five named development sites across four U.S. metro markets. MSP1: 75 MW DFW1: 55 MW DFW2: 60 MW GSO1: 90 MW CLT1: 65 MW Power and customer Power secured Under LOI or option Illustrative site economics Illustrative contract value Illustrative average annual revenue Total MW Site $1.31B $109.28M 55 DFW1 $1.37B $114.25M 60 DFW2 $2.15B $178.82M 90 GSO1 $1.73B $144.05M 75 MSP1 $6.56B $546.40M 280 Total Portfolio projected revenue over the 12 - year initial term excluding CLT1. As of October 14, 2026. For illustrative purposes only; not guidance, a forecast or a target. The Company has not entered int o a ny customer agreement for DFW1, DFW2, GSO1 or MSP1, and has not executed utility agreements for DFW2, GSO1 or MSP1. MW shown for those three sites are management estimates. Figures ref lect management’s internal assumptions, with base rent escalated 3% annually over an assumed 12 - year initial term. Projected average annual revenue equals projected contract value div ided by 12. Projections have not been audited, reviewed or compiled by any independent accountant. Actual results may differ materially, and the Company undertakes no obligation to upd ate them. See “Forward - Looking Statements” on slide 2. AIB Data Centers Inc. 12
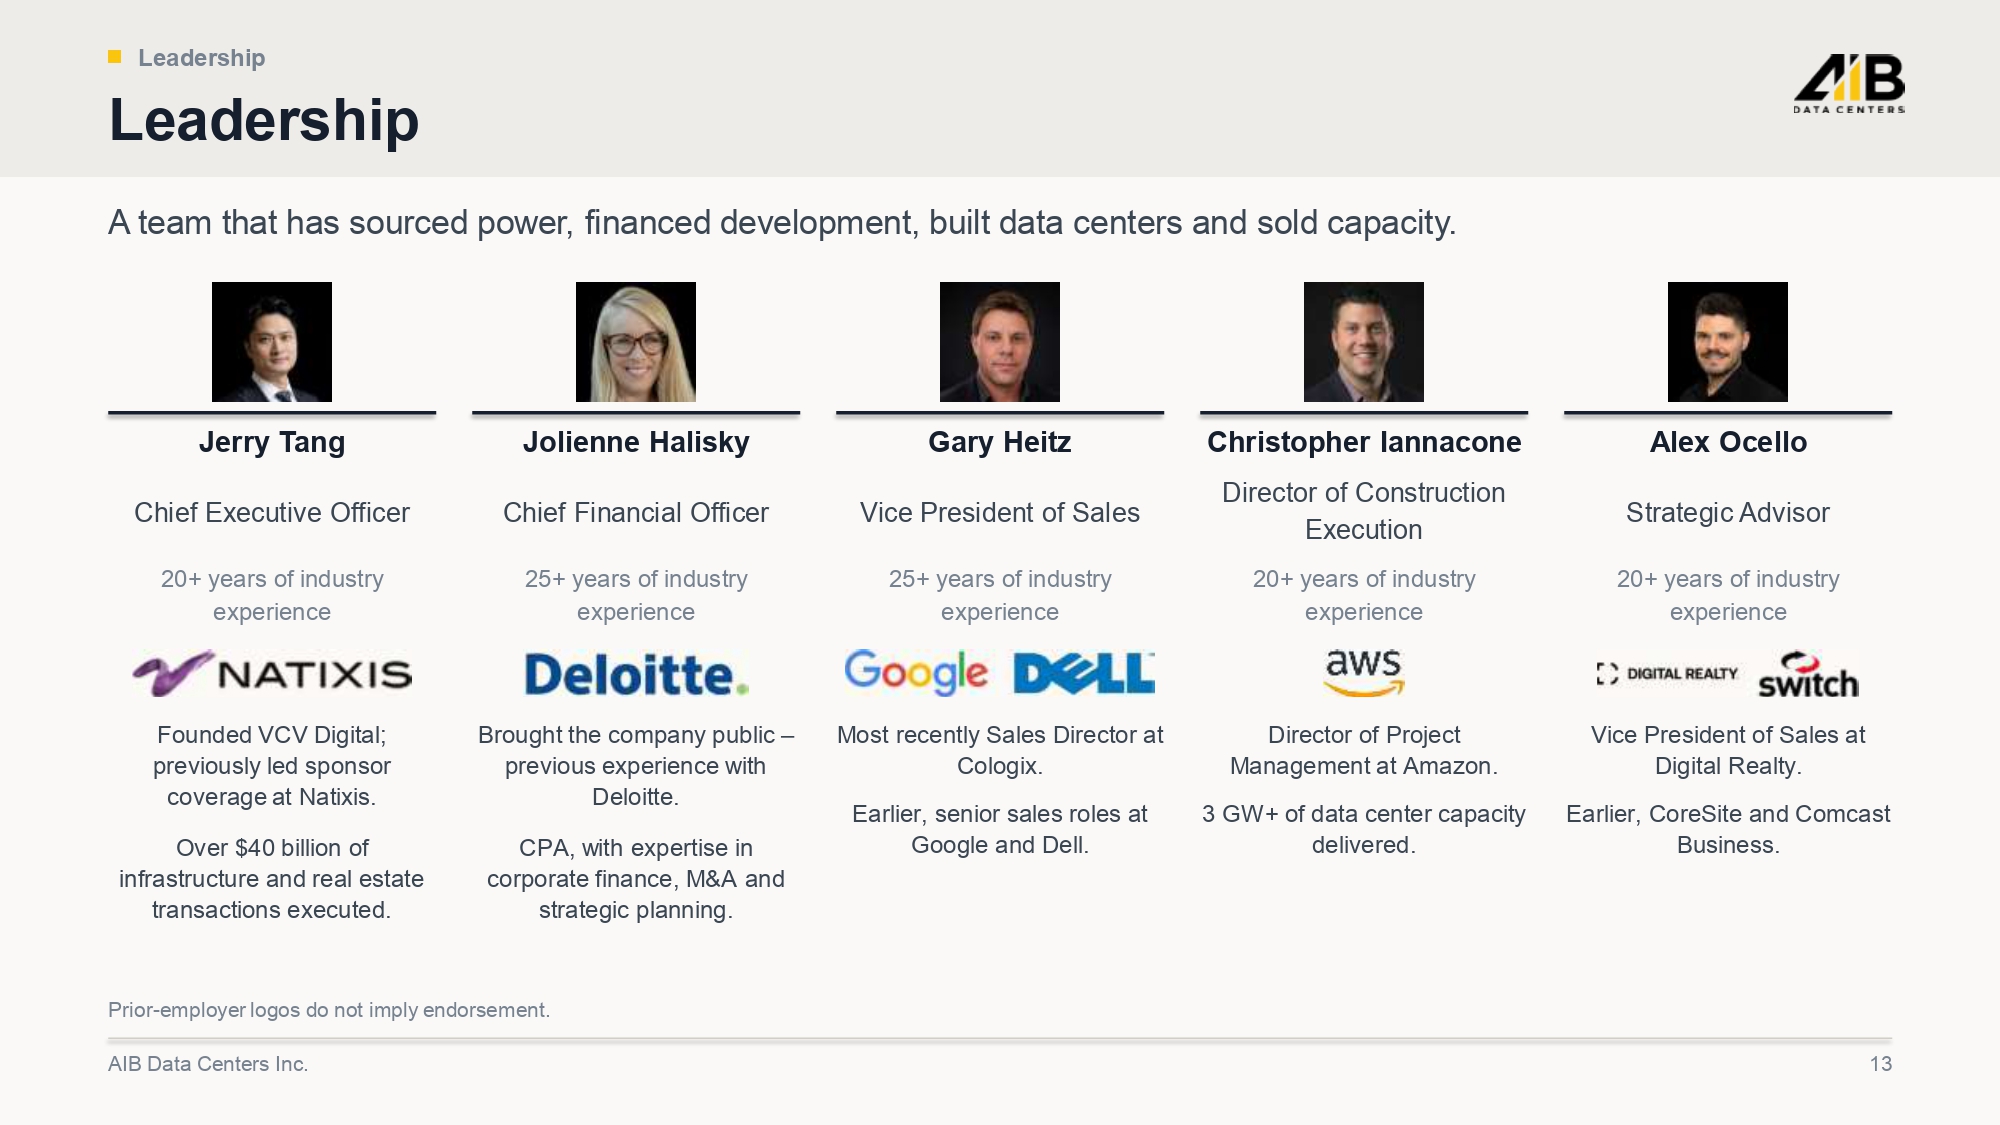
Leadership Leadership A team that has sourced power, financed development, built data centers and sold capacity. Jerry Tang Chief Executive Officer 20+ years of industry experience Founded VCV Digital; previously led sponsor coverage at Natixis. Over $40 billion of infrastructure and real estate transactions executed. Jolienne Halisky Chief Financial Officer 25+ years of industry experience Brought the company public – previous experience with Deloitte. CPA, with expertise in corporate finance, M&A and strategic planning. Gary Heitz Vice President of Sales 25+ years of industry experience Most recently Sales Director at Cologix. Earlier, senior sales roles at Google and Dell. Christopher Iannacone Director of Construction Execution 20+ years of industry experience Director of Project Management at Amazon. 3 GW+ of data center capacity delivered. Alex Ocello Strategic Advisor 20+ years of industry experience Vice President of Sales at Digital Realty. Earlier, CoreSite and Comcast Business. Prior - employer logos do not imply endorsement. AIB Data Centers Inc. 13
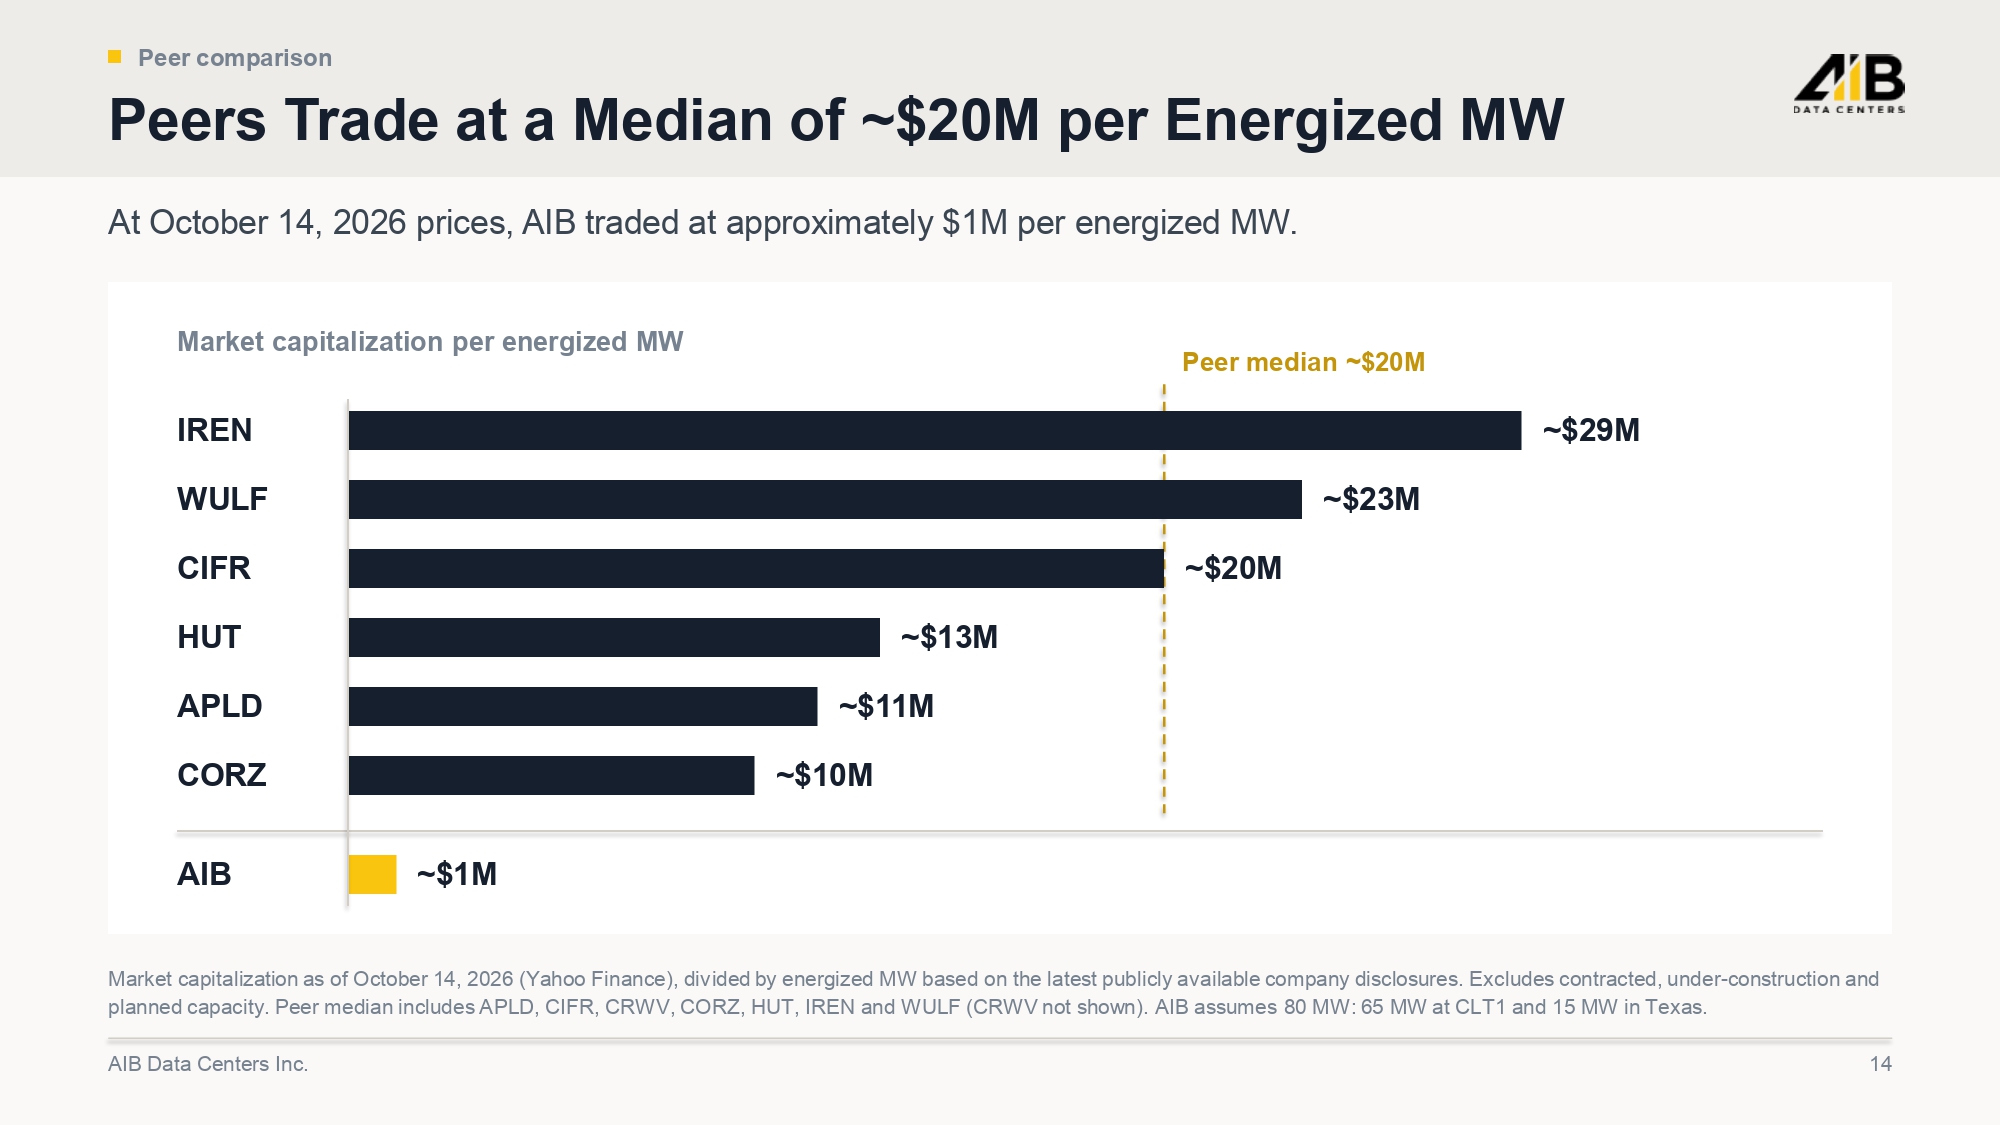
Peer comparison Peers Trade at a Median of ~$20M per Energized MW At October 14, 2026 prices, AIB traded at approximately $1M per energized MW. Market capitalization per energized MW Peer median ~$20M IREN ~$29M WULF ~$23M CIFR ~$20M HUT ~$13M APLD ~$11M CORZ ~$10M AIB ~$1M Market capitalization as of October 14, 2026 (Yahoo Finance), divided by energized MW based on the latest publicly available com pany disclosures. Excludes contracted, under - construction and planned capacity. Peer median includes APLD, CIFR, CRWV, CORZ, HUT, IREN and WULF (CRWV not shown). AIB assumes 80 MW: 65 MW at CLT1 and 15 MW in Texas. AIB Data Centers Inc. 14
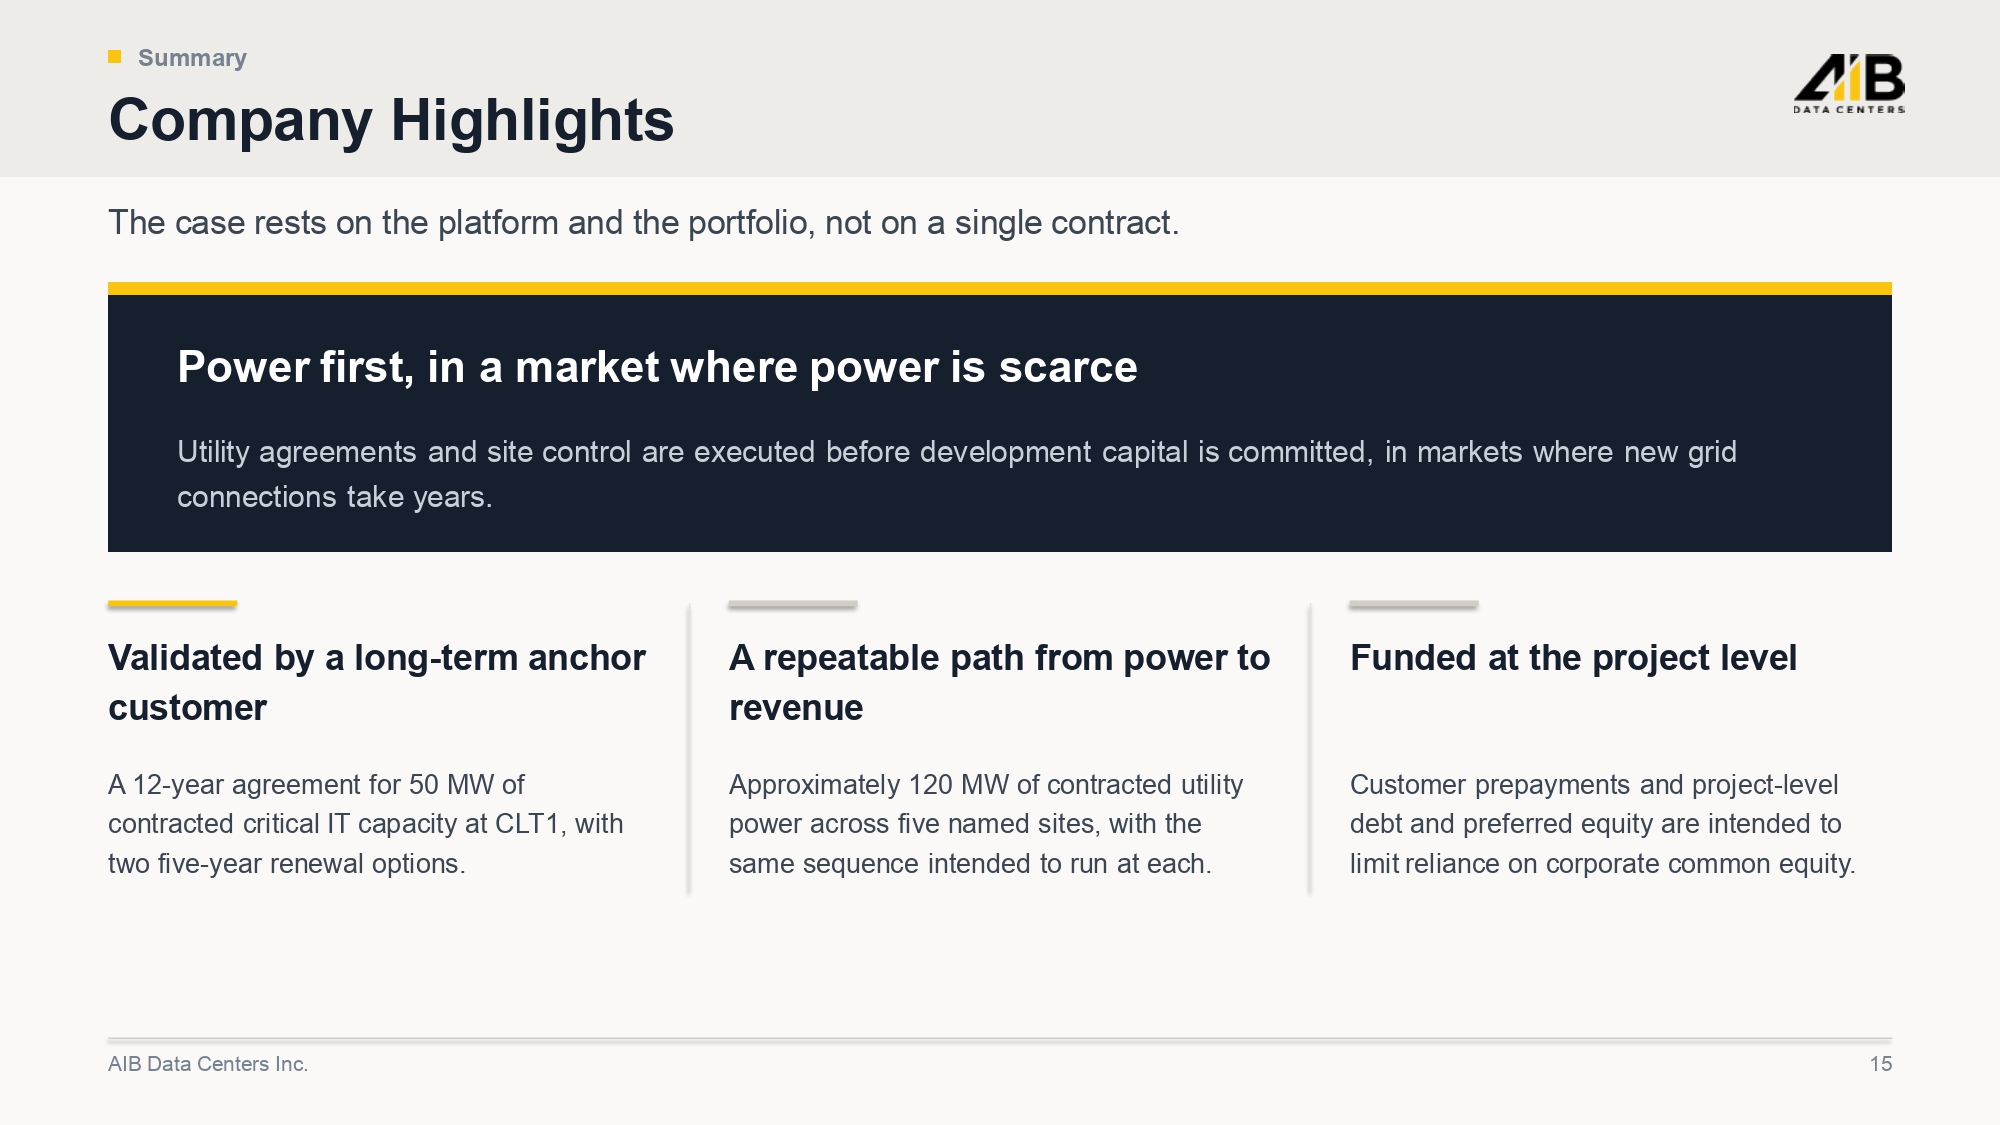
Summary Company Highlights The case rests on the platform and the portfolio, not on a single contract. Power first, in a market where power is scarce Utility agreements and site control are executed before development capital is committed, in markets where new grid connections take years. Validated by a long - term anchor customer A 12 - year agreement for 50 MW of contracted critical IT capacity at CLT1, with two five - year renewal options. A repeatable path from power to revenue Approximately 120 MW of contracted utility power across five named sites, with the same sequence intended to run at each. Funded at the project level Customer prepayments and project - level debt and preferred equity are intended to limit reliance on corporate common equity. AIB Data Centers Inc. 15
AIB Data Centers Inc. Right - sized data center developer NYSE American: AIB October 2026 Investor Presentation Investor Relations Chris Tyson Executive Vice President MZ Group, MZ North America 949 - 491 - 8235 AIB@mzgroup.us Corporate Headquarters AIB Data Centers Inc. 1540 Broadway, Suite 1010 New York, NY 10036 (646) 493 - 2993 www.aib.us AIB Data Centers Inc. 16
Supplemental information Appendix Supplemental financials and capacity definitions Q2 2026 statement of operations and Adjusted EBITDA 18 Balance sheet and capitalization 19 How AIB labels capacity 20 AIB Data Centers Inc. 17
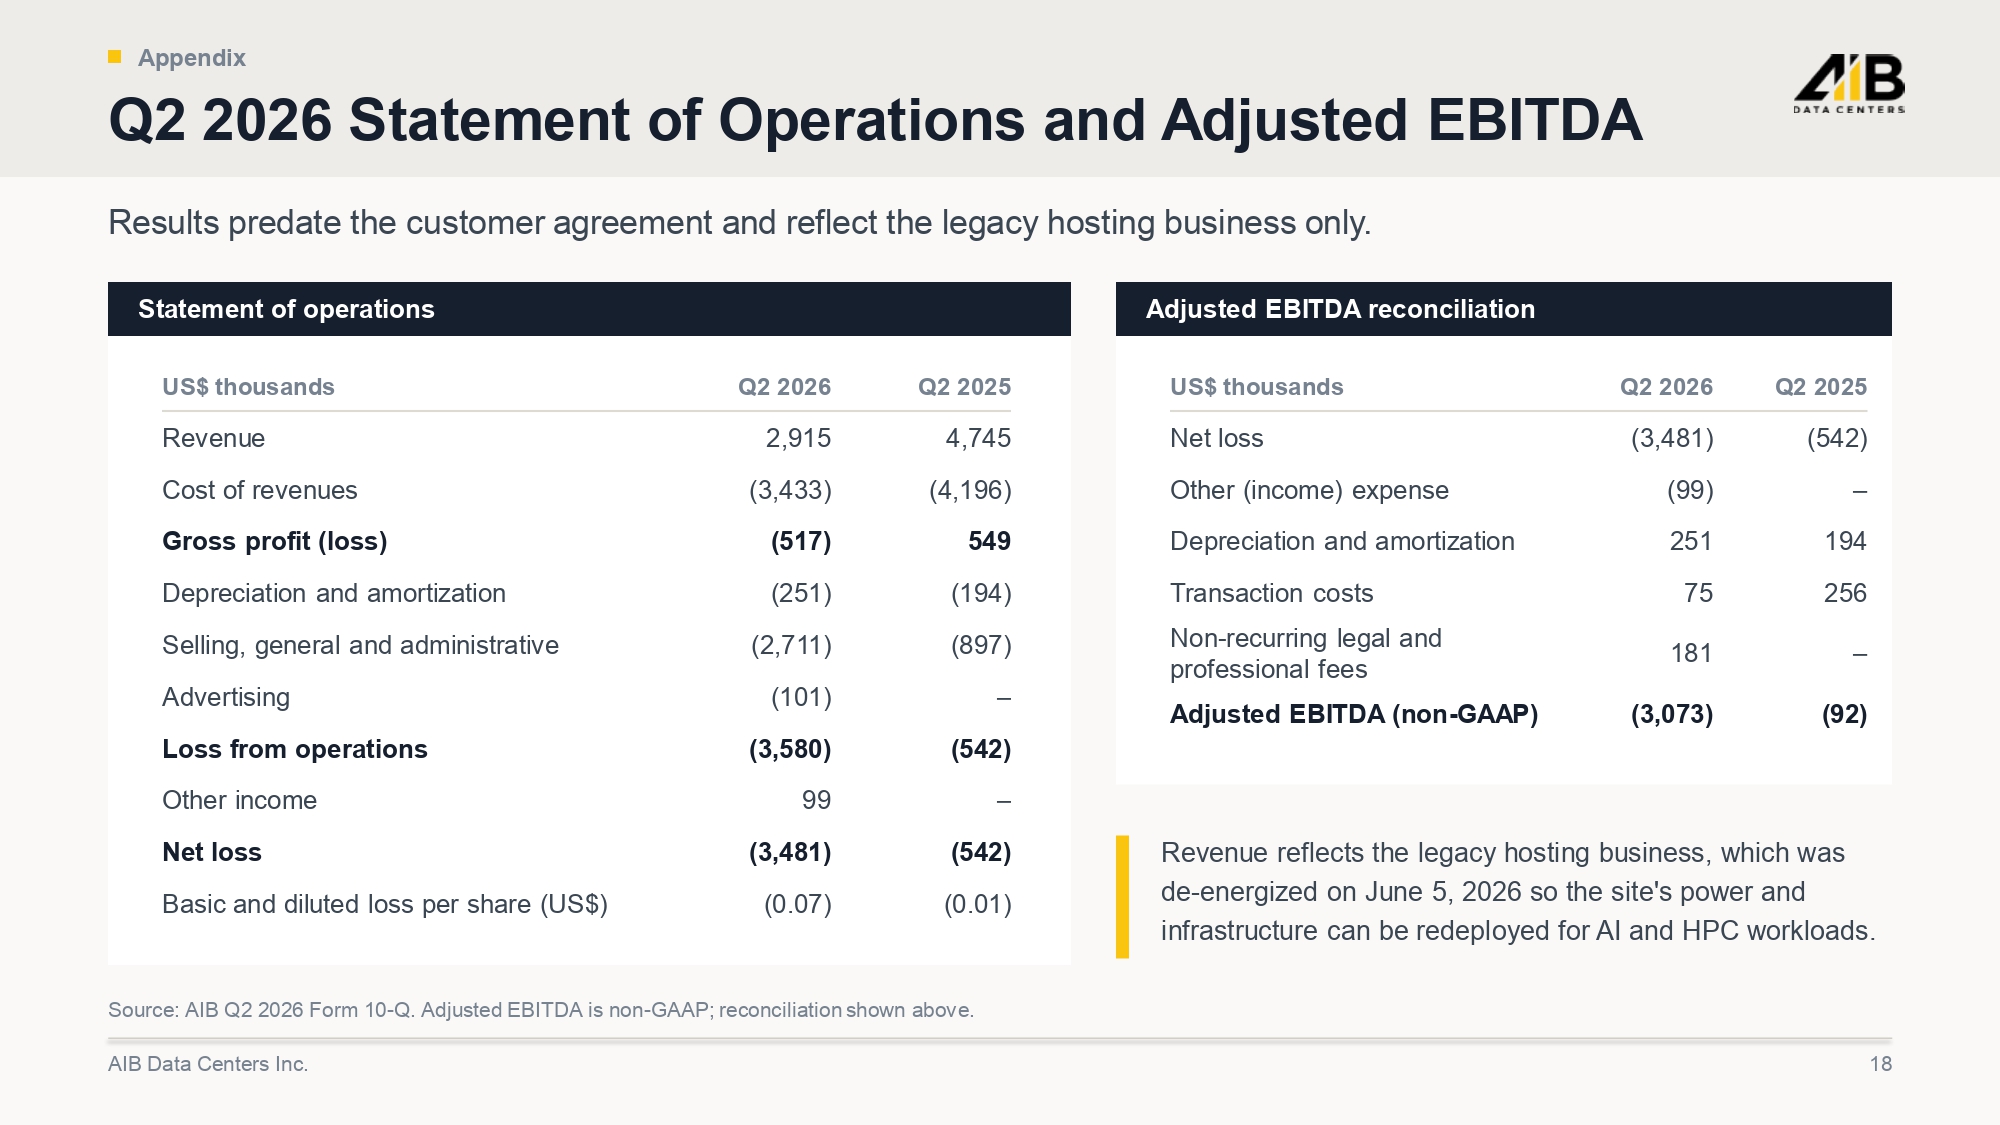
Appendix Q2 2026 Statement of Operations and Adjusted EBITDA Results predate the customer agreement and reflect the legacy hosting business only. Statement of operations Q2 2025 Q2 2026 US$ thousands 4,745 2,915 Revenue (4,196) (3,433) Cost of revenues 549 (517) Gross profit (loss) (194) (251) Depreciation and amortization (897) (2,711) Selling, general and administrative – (101) Advertising (542) (3,580) Loss from operations – 99 Other income (542) (3,481) Net loss (0.01) (0.07) Basic and diluted loss per share (US$) Adjusted EBITDA reconciliation Q2 2025 Q2 2026 US$ thousands (542) (3,481) Net loss – (99) Other (income) expense 194 251 Depreciation and amortization 256 75 Transaction costs – 181 Non - recurring legal and professional fees (92) (3,073) Adjusted EBITDA (non - GAAP) Revenue reflects the legacy hosting business, which was de - energized on June 5, 2026 so the site's power and infrastructure can be redeployed for AI and HPC workloads. Source: AIB Q2 2026 Form 10 - Q. Adjusted EBITDA is non - GAAP; reconciliation shown above. AIB Data Centers Inc. 18
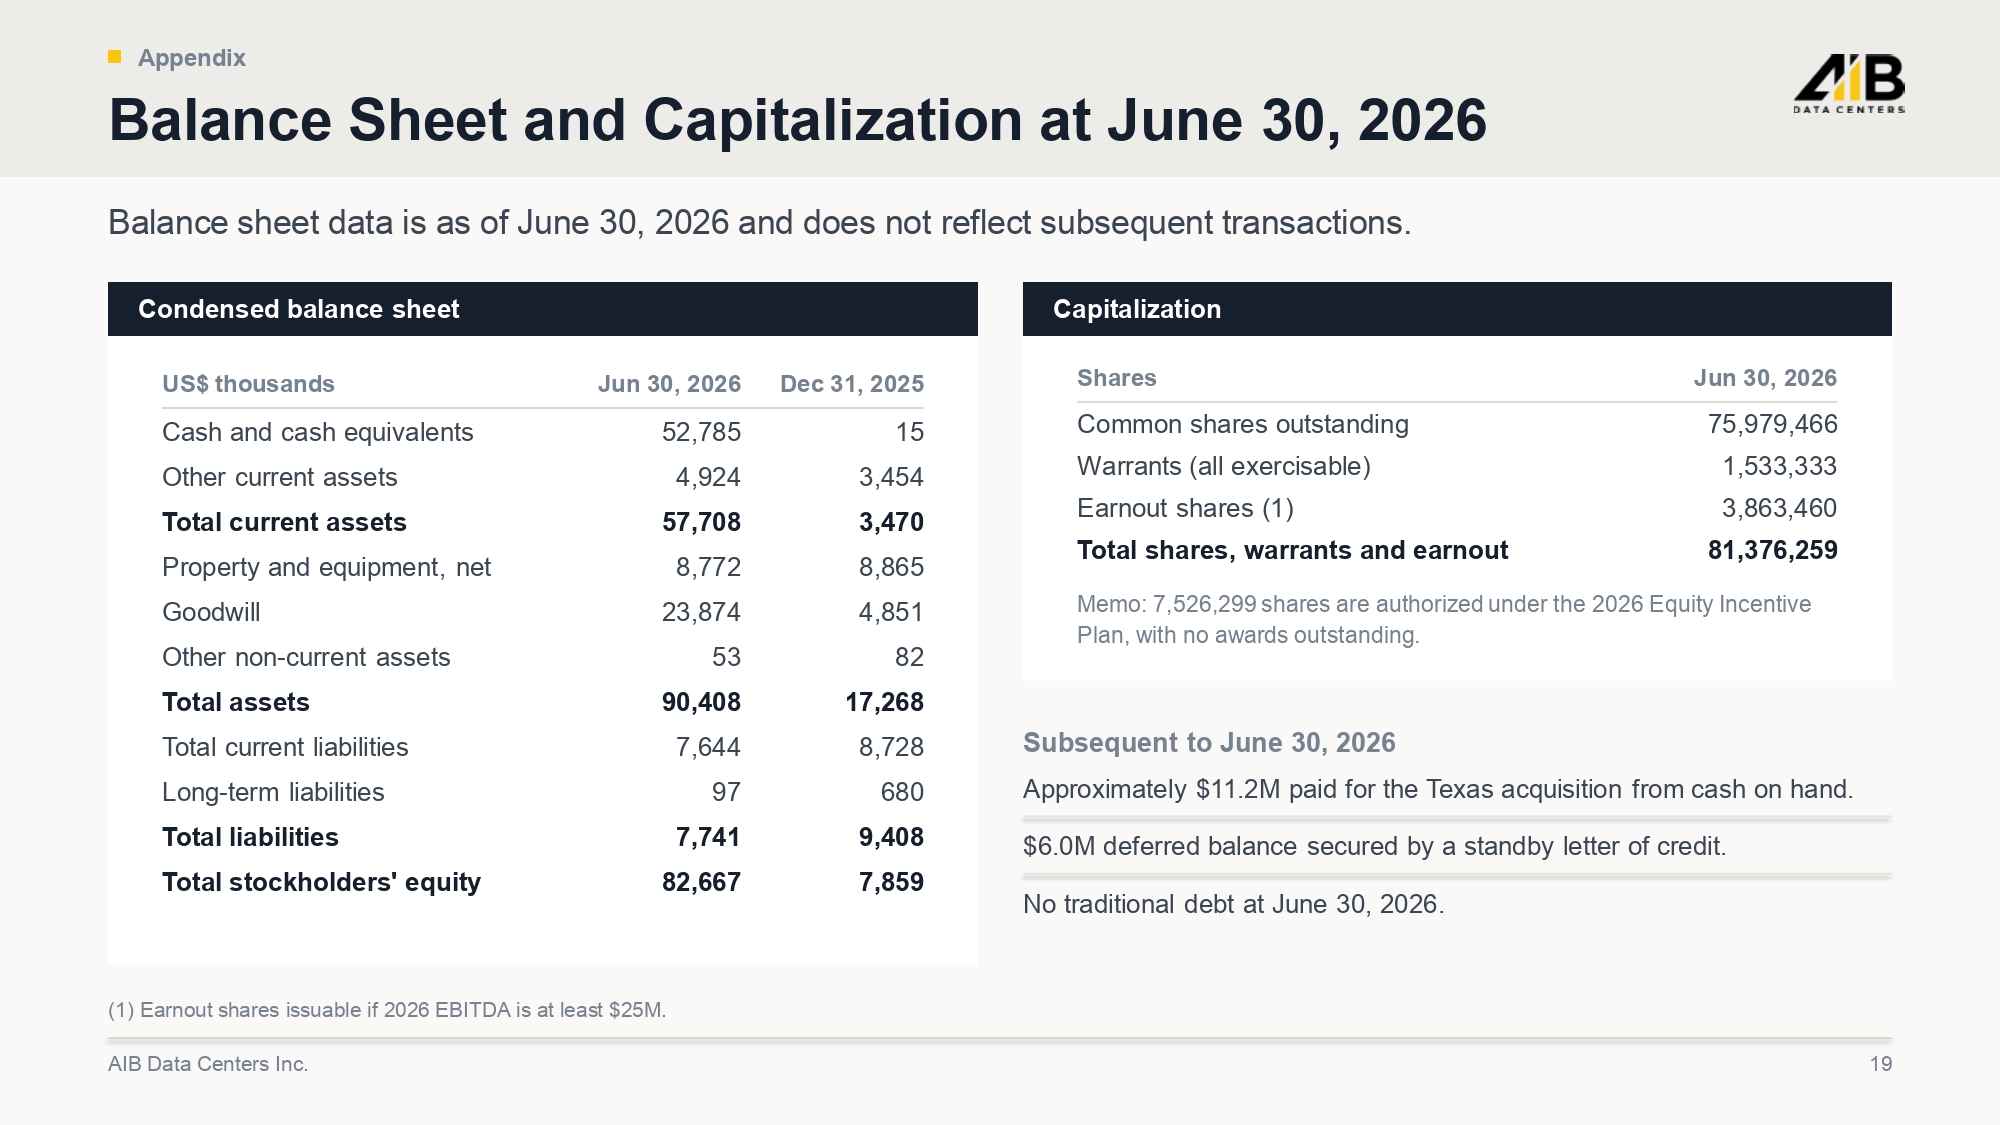
Appendix Balance Sheet and Capitalization at June 30, 2026 Balance sheet data is as of June 30, 2026 and does not reflect subsequent transactions. Condensed balance sheet Dec 31, 2025 Jun 30, 2026 US$ thousands 15 52,785 Cash and cash equivalents 3,454 4,924 Other current assets 3,470 57,708 Total current assets 8,865 8,772 Property and equipment, net 4,851 23,874 Goodwill 82 53 Other non - current assets 17,268 90,408 Total assets 8,728 7,644 Total current liabilities 680 97 Long - term liabilities 9,408 7,741 Total liabilities 7,859 82,667 Total stockholders' equity Capitalization Jun 30, 2026 Shares 75,979,466 Common shares outstanding 1,533,333 Warrants (all exercisable) 3,863,460 Earnout shares (1) 81,376,259 Total shares, warrants and earnout Memo: 7,526,299 shares are authorized under the 2026 Equity Incentive Plan, with no awards outstanding. Subsequent to June 30, 2026 Approximately $11.2M paid for the Texas acquisition from cash on hand. $6.0M deferred balance secured by a standby letter of credit. No traditional debt at June 30, 2026. (1) Earnout shares issuable if 2026 EBITDA is at least $25M. AIB Data Centers Inc. 19
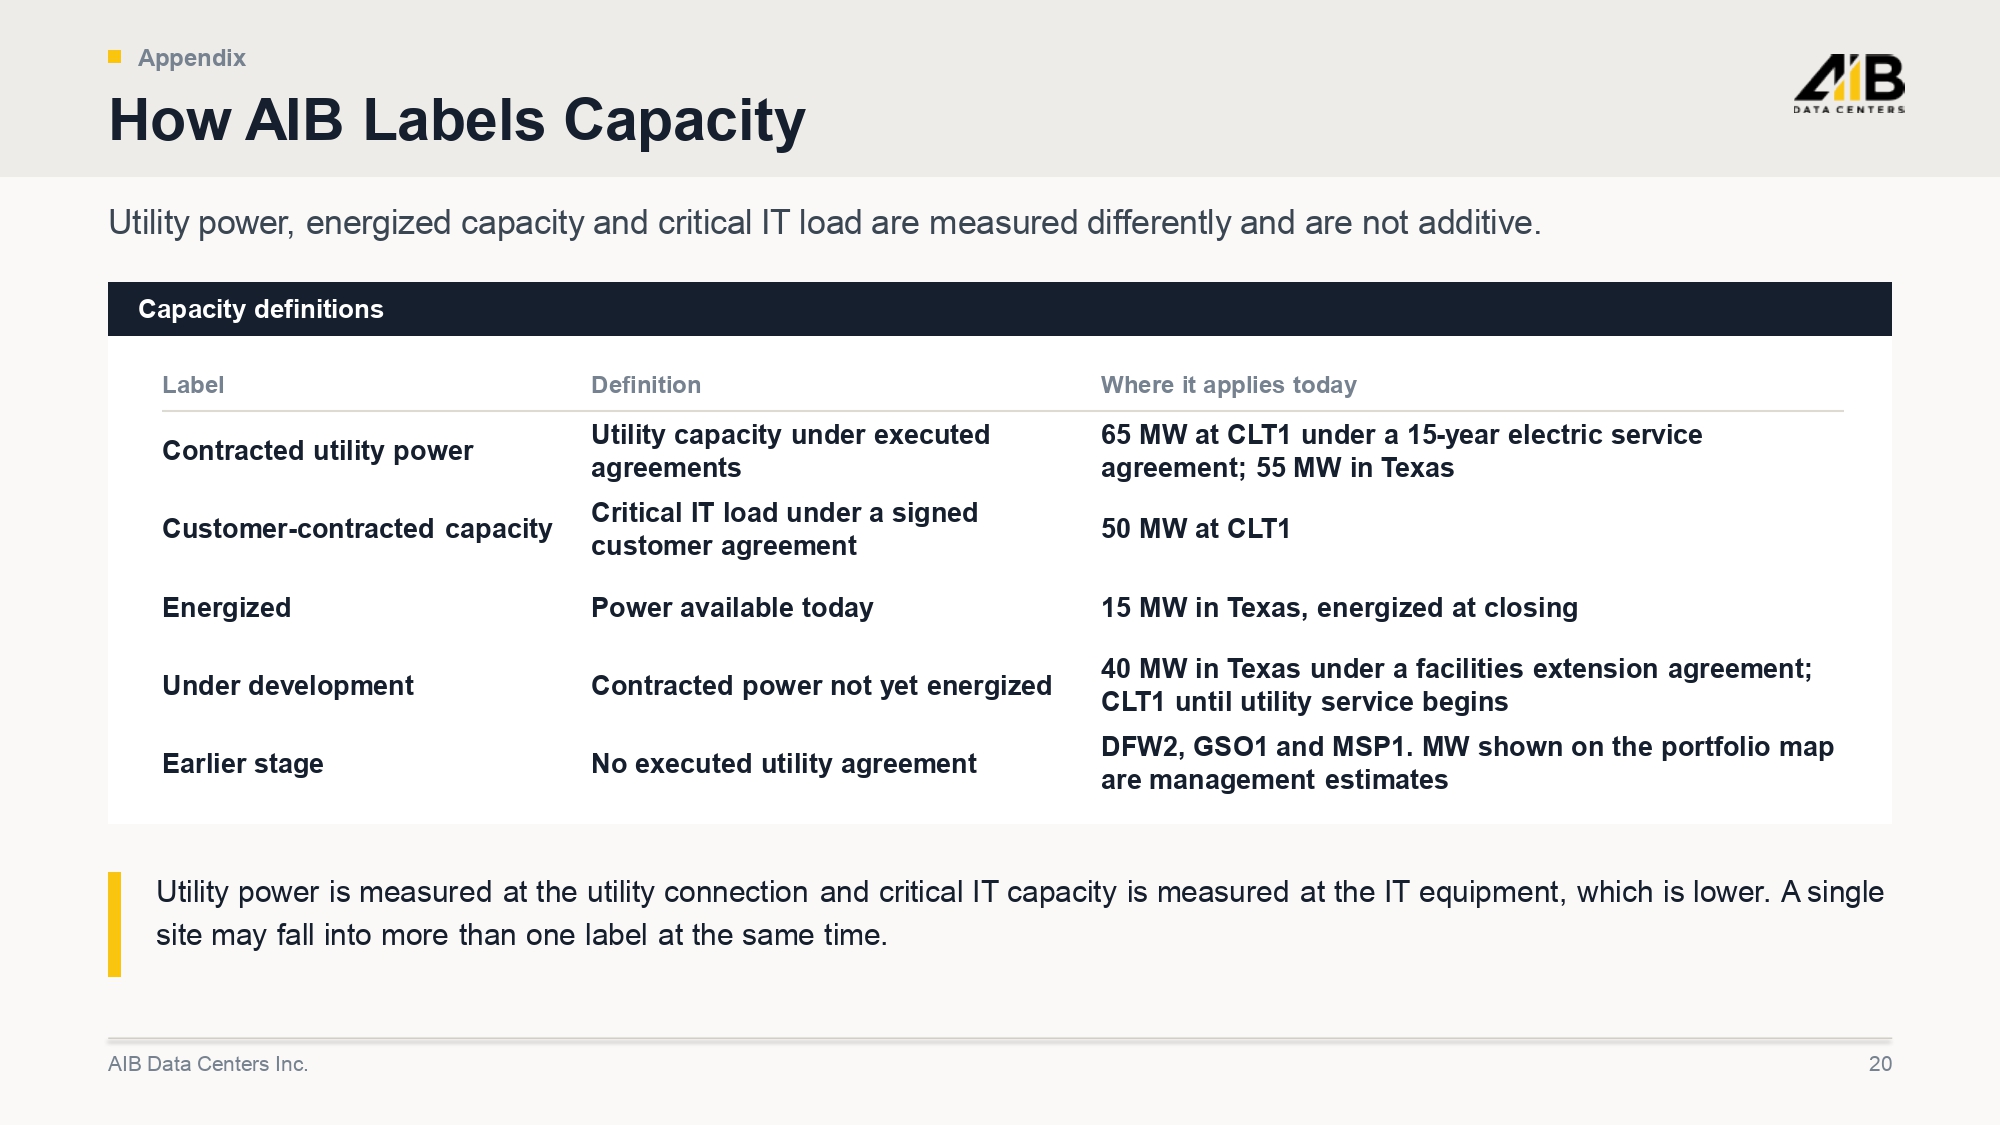
Appendix How AIB Labels Capacity Utility power, energized capacity and critical IT load are measured differently and are not additive. Capacity definitions Where it applies today Definition Label 65 MW at CLT1 under a 15 - year electric service agreement; 55 MW in Texas Utility capacity under executed agreements Contracted utility power 50 MW at CLT1 Critical IT load under a signed customer agreement Customer - contracted capacity 15 MW in Texas, energized at closing Power available today Energized 40 MW in Texas under a facilities extension agreement; CLT1 until utility service begins Contracted power not yet energized Under development DFW2, GSO1 and MSP1. MW shown on the portfolio map are management estimates No executed utility agreement Earlier stage Utility power is measured at the utility connection and critical IT capacity is measured at the IT equipment, which is lower. A single site may fall into more than one label at the same time. AIB Data Centers Inc. 20