
Exhibit 99.2 THIRD QUARTER INVESTOR PRESENTATION October 20, 2026
FORWARD - LOOKING STATEMENTS During the course of this presentation, management may make projections and forward - looking statements regarding events or the future financial performance of Southern First Bancshares, Inc. We wish to caution you that these forward - looking statements involve certain risks and uncertainties, including a variety of factors (including a downturn i e n e n t s h b e leigh economy, greater than expected interest and non - interest expenses, increased competition, h fluctuations in interest rates, regulatory actions, excessive loan losses and other factors) a t r h a l i t n may cause Southern First’s actual results to differ materially from the anticipated results expressed or implied in these forward - looking statements. Therefore, we can give S n o o u h assurance that the results contemplated in the forward - looking statements will b C e r e l a i n l i a ze d. Investors are cautioned not to place undue reliance on these forward - looki n g m s e tatements and are advised to review the risk factors that may affect Southern First’s operating r e s s t o u lt s in documents filed by Southern First Bancshares, Inc. with the Securities and Exchange Commission, including the annual report on Form 10 - K and other required filings. Southern First assumes no duty to update the forward - looking statements made in this presentation. 2
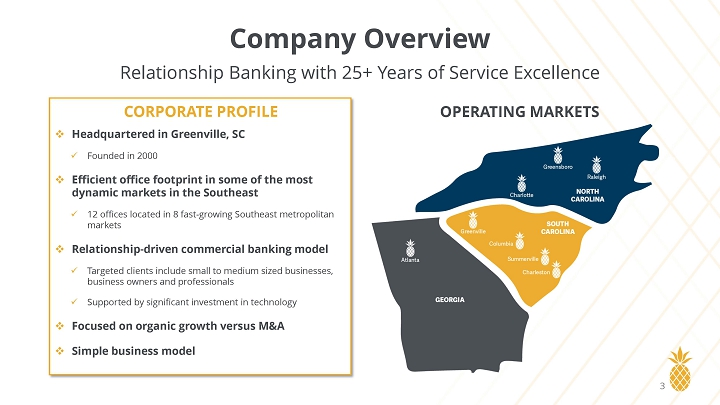
Company Overview Relationship Banking with 25+ Years of Service Excellence CORPORATE PROFILE □ Headquartered in Greenville, SC x Founded in 2000 □ Efficient office footprint in some of the most dynamic markets in the Southeast x 12 offices located in 8 fast - growing Southeast metropolitan markets □ Relationship - driven commercial banking model x Targeted clients include small to medium sized businesses, business owners and professionals x Supported by significant investment in technology □ Focused on organic growth versus M&A □ Simple business model OPERATING MARKETS eensb ar Sou h C lina me leigh h lin sto 3
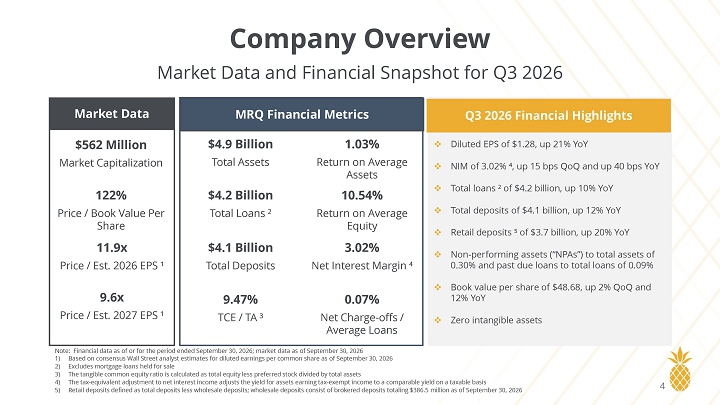
Company Overview Market Data and Financial Snapshot for Q3 2026 Market Data h eensb leig h ar lin Sou h C lina me sto MRQ Financial Metrics Q3 2026 Financial Highlights $562 Million Market Capitalization 122% Price / Book Value Per Share 11.9x Price / Est. 2026 EPS ¹ 9.6x Price / Est. 2027 EPS ¹ $4.9 Billion Total Assets $4.2 Billion Total Loans ² $4.1 Billion Total Deposits 1.03% Return on Average Assets 10.54% Return on Average Equity 3.02% Net Interest Margin ⁴ 9.47% TCE / TA ³ 0.07% Net Charge - offs / Average Loans □ Diluted EPS of $1.28, up 21% YoY □ NIM of 3.02% ⁴, up 15 bps QoQ and up 40 bps YoY □ Total loans ² of $4.2 billion, up 10% YoY □ Total deposits of $4.1 billion, up 12% YoY □ Retail deposits ⁵ of $3.7 billion, up 20% YoY □ Non - performing assets (“NPAs”) to total assets of 0.30% and past due loans to total loans of 0.09% □ Book value per share of $48.68, up 2% QoQ and 12% YoY □ Zero intangible assets Note: Financial data as of or for the period ended September 30, 2026; market data as of September 30, 2026 1) Based on consensus Wall Street analyst estimates for diluted earnings per common share as of September 30, 2026 2) Excludes mortgage loans held for sale 3) The tangible common equity ratio is calculated as total equity less preferred stock divided by total assets 4) The tax - equivalent adjustment to net interest income adjusts the yield for assets earning tax - exempt income to a comparable yield on a taxable basis 5) Retail deposits defined as total deposits less wholesale deposits; wholesale deposits consist of brokered deposits totaling $386.5 million as of September 30, 2026 4
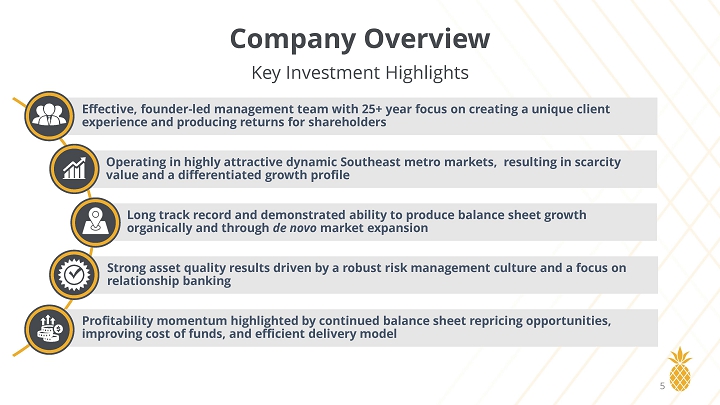
Company Overview Key Investment Highlights Effective, founder - led management team with 25+ year focus on creating a unique client experience and producing returns for shareholders Operating in highly attractive dynamic Southeast metro markets, resulting in scarcity value and a differentiated growth profile Long track record and demonstrated ability to produce balance sheet growth organically and through de novo market expansion Strong asset quality results driven by a robust risk management culture and a focus on relationship banking Profitability momentum highlighted by continued balance sheet repricing opportunities, improving cost of funds, and efficient delivery model 5
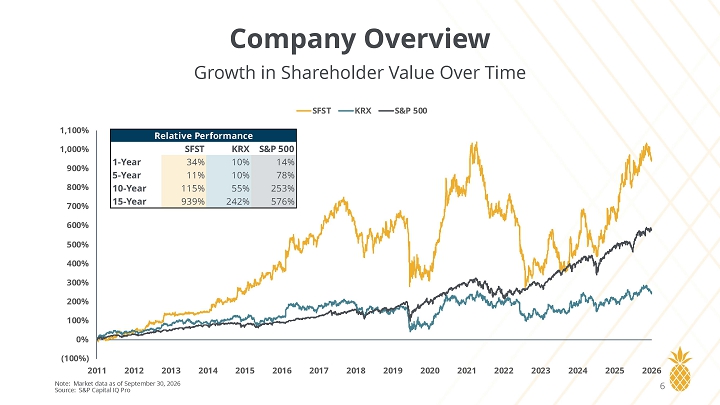
Company Overview Growth in Shareholder Value Over Time SFST KRX S&P 500 1,100% 1,000% 900% 800% 700% 600% 500% 400% 300% 200% 100% 0% (100%) 2011 2012 2013 2014 2015 2016 2017 2018 2019 2020 2021 2022 2023 2024 2025 2026 6 Relative Performance S&P 500 KRX SFST 14% 10% 34% 1 - Year 78% 10% 11% 5 - Year 253% 55% 115% 10 - Year 576% 242% 939% 15 - Year Note: Market data as of September 30, 2026 Source: S&P Capital IQ Pro
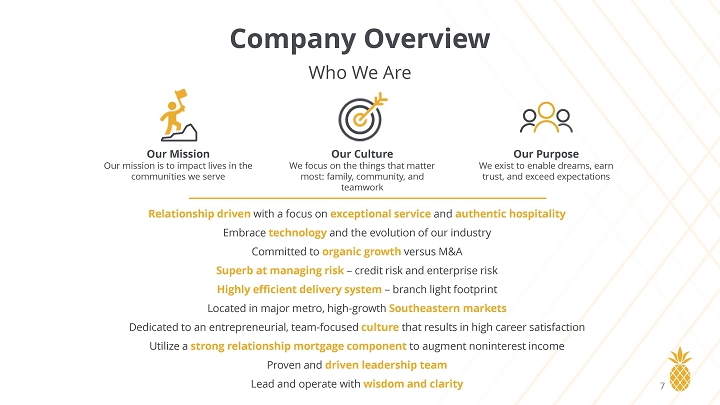
Company Overview Who We Are Our Mission Our mission is to impact lives in the communities we serve Our Culture We focus on the things that matter most: family, community, and teamwork Our Purpose We exist to enable dreams, earn trust, and exceed expectations Relationship driven with a focus on exceptional service and authentic hospitality Embrace technology and the evolution of our industry Committed to organic growth versus M&A Superb at managing risk – credit risk and enterprise risk Highly efficient delivery system – branch light footprint Located in major metro, high - growth Southeastern markets Dedicated to an entrepreneurial, team - focused culture that results in high career satisfaction Utilize a strong relationship mortgage component to augment noninterest income Proven and driven leadership team Lead and operate with wisdom and clarity 7
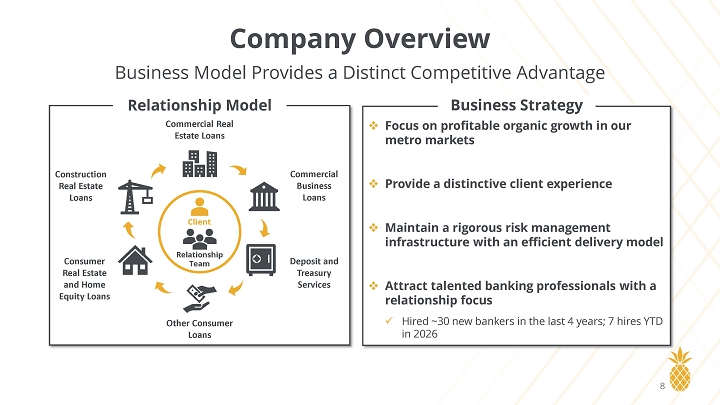
Company Overview Commercial Real Estate Loans Construction Real Estate Loans Commercial Business Loans Consumer Real Estate and Home Equity Loans Relationship Team Client Deposit and Treasury Services Other Consumer Loans Business Model Provides a Distinct Competitive Advantage Relationship Model Business Strategy □ Focus on profitable organic growth in our metro markets □ Provide a distinctive client experience □ Maintain a rigorous risk management infrastructure with an efficient delivery model □ Attract talented banking professionals with a relationship focus x Hired ~30 new bankers in the last 4 years; 7 hires YTD in 2026 8
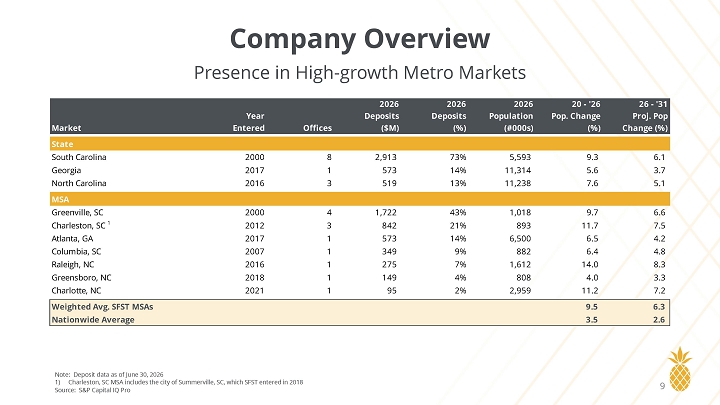
Company Overview Presence in High - growth Metro Markets 26 - '31 Proj. Pop Change (%) 20 - '26 Pop. Change (%) 2026 Population (#000s) 2026 Deposits (%) 2026 Deposits ($M) Offices Year Entered Market State 6.1 9.3 5,593 73% 2,913 8 2000 South Carolina 3.7 5.6 11,314 14% 573 1 2017 Georgia 5.1 7.6 11,238 13% 519 3 2016 North Carolina MSA 6.6 9.7 1,018 43% 1,722 4 2000 Greenville, SC 7.5 11.7 893 21% 842 3 2012 Charleston, SC 1 4.2 6.5 6,500 14% 573 1 2017 Atlanta, GA 4.8 6.4 882 9% 349 1 2007 Columbia, SC 8.3 14.0 1,612 7% 275 1 2016 Raleigh, NC 3.3 4.0 808 4% 149 1 2018 Greensboro, NC 7.2 11.2 2,959 2% 95 1 2021 Charlotte, NC 6.3 9.5 Weighted Avg. SFST MSAs 2.6 3.5 Nationwide Average Note: Deposit data as of June 30, 2026 1) Charleston, SC MSA includes the city of Summerville, SC, which SFST entered in 2018 Source: S&P Capital IQ Pro 9
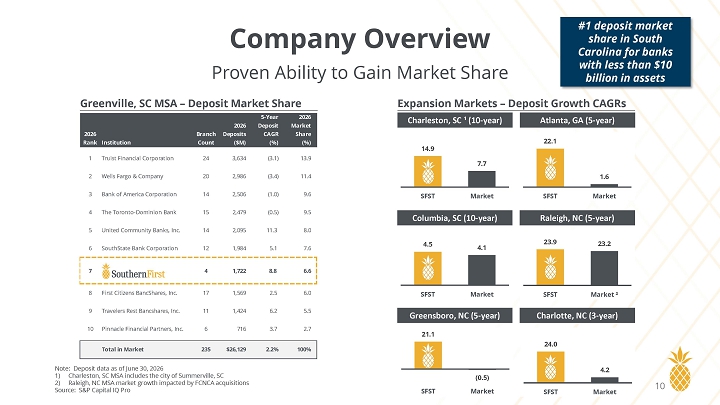
Company Overview Proven Ability to Gain Market Share Greenville, SC MSA – Deposit Market Share Expansion Markets – Deposit Growth CAGRs 2026 Market Share (%) 5 - Year Deposit CAGR (%) 2026 Deposits ($M) Branch Count Institution 2026 Rank 13.9 (3.1) 3,634 24 Truist Financial Corporation 1 11.4 (3.4) 2,986 20 Wells Fargo & Company 2 9.6 (1.0) 2,506 14 Bank of America Corporation 3 9.5 (0.5) 2,479 15 The Toronto - Dominion Bank 4 8.0 11.3 2,095 14 United Community Banks, Inc. 5 7.6 5.1 1,984 12 SouthState Bank Corporation 6 6.6 8.8 1,722 4 7 6.0 2.5 1,569 17 First Citizens BancShares, Inc. 8 5.5 6.2 1,424 11 Travelers Rest Bancshares, Inc. 9 2.7 3.7 716 6 Pinnacle Financial Partners, Inc. 10 100% 2.2% $26,129 235 Total in Market Charleston, SC ¹ (10 - year) Atlanta, GA (5 - year) 14.9 7.7 SFST Market 22.1 1.6 SFST Market Columbia, SC (10 - year) Raleigh, NC (5 - year) 4.5 4.1 SFST Market 23.9 23.2 SFST Market ² Greensboro, NC (5 - year) Charlotte, NC (3 - year) Note: Deposit data as of June 30, 2026 1) Charleston, SC MSA includes the city of Summerville, SC 2) Raleigh, NC MSA market growth impacted by FCNCA acquisitions Source: S&P Capital IQ Pro 21.1 10 SFST (0.5) Market 24.0 4.2 #1 deposit market share in South Carolina for banks with less than $10 billion in assets SFST Market
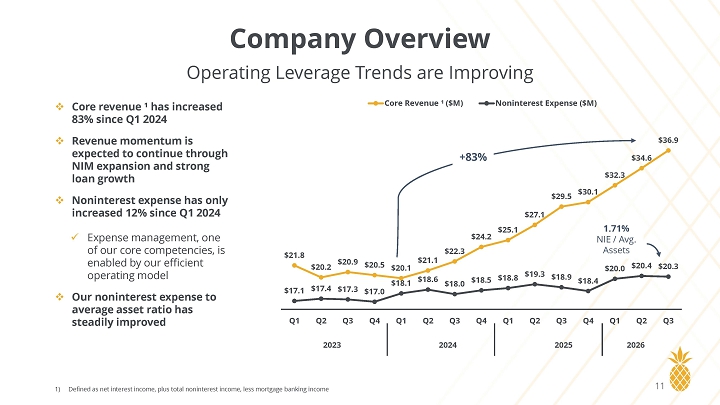
Company Overview Operating Leverage Trends are Improving □ Core revenue ¹ has increased 83% since Q1 2024 □ Revenue momentum is expected to continue through NIM expansion and strong loan growth □ Noninterest expense has only increased 12% since Q1 2024 x Expense management, one of our core competencies, is enabled by our efficient operating model □ Our noninterest expense to average asset ratio has steadily improved Core Revenue ¹ ($M) Noninterest Expense ($M) $36.9 $34.6 $32.3 $30.1 $29.5 $27.1 $25.1 $24.2 $21.8 $22.3 $20.9 $20.2 $20.5 $20.1 $18.1 $21.1 $18.6 $20.0 $20.4 $20.3 $18.0 $18.5 $18.8 $19.3 $18.9 $18.4 $17.1 $17.4 $17.3 $17.0 Q1 Q2 Q3 Q4 Q1 Q2 Q3 Q4 Q1 Q2 Q3 Q4 Q1 Q2 Q3 2023 2024 2025 2026 1.71% NIE / Avg. Assets +83% 1) Defined as net interest income, plus total noninterest income, less mortgage banking income 11
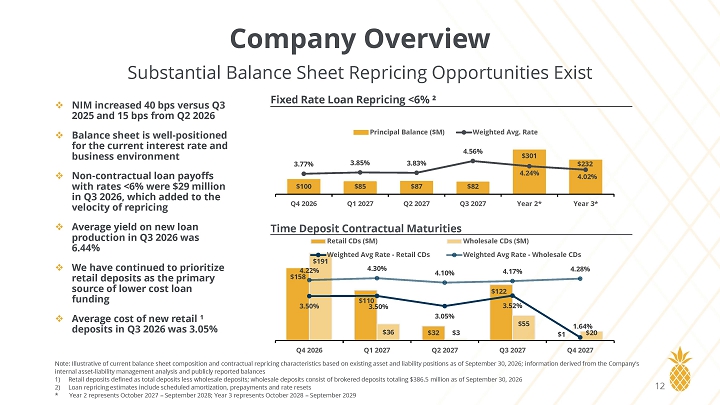
Company Overview Substantial Balance Sheet Repricing Opportunities Exist Fixed Rate Loan Repricing <6% ² □ NIM increased 40 bps versus Q 3 2025 and 15 bps from Q 2 2026 □ Balance sheet is well - positioned for the current interest rate and business environment □ Non - contractual loan payoffs with rates <6% were $29 million in Q3 2026, which added to the velocity of repricing □ Average yield on new loan production in Q 3 2026 was 6 . 44 % □ We have continued to prioritize retail deposits as the primary source of lower cost loan funding □ Average cost of new retail ¹ deposits in Q3 2026 was 3.05% Principal Balance ($M) Weighted Avg. Rate 4.56% 3.77% 3.85% 3.83% $301 4.24% $232 4.02% $100 $85 $87 $82 Q4 2026 Q1 2027 Q2 2027 Q3 2027 Year 2* Year 3* Time Deposit Contractual Maturities $191 Retail CDs ($M) Weighted Avg Rate - Retail CDs Wholesale CDs ($M) Weighted Avg Rate - Wholesale CDs $158 4.22% 4.30% 4.10% 4.17% 4.28% $122 $110 3.50% 3.50% 3.52% $55 $36 $1 1.64% $20 Q4 2026 Q1 2027 3.05% $32 $3 Q2 2027 Q3 2027 Q4 2027 Note: Illustrative of current balance sheet composition and contractual repricing characteristics based on existing asset and liability positions as of September 30, 2026; information derived from the Company’s internal asset - liability management analysis and publicly reported balances 1) Retail deposits defined as total deposits less wholesale deposits; wholesale deposits consist of brokered deposits totaling $386.5 million as of September 30, 2026 2) Loan repricing estimates include scheduled amortization, prepayments and rate resets * Year 2 represents October 2027 – September 2028; Year 3 represents October 2028 – September 2029 12
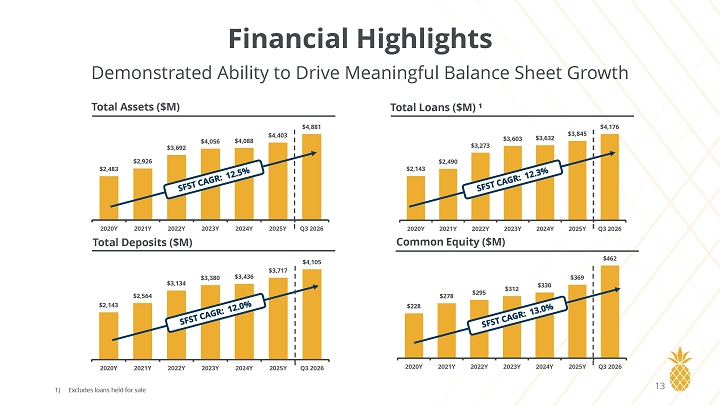
Financial Highlights Demonstrated Ability to Drive Meaningful Balance Sheet Growth Total Assets ($M) Total Loans ($M) ¹ $4,403 $4,056 $4,088 $3,692 $2,926 $2,483 $3,845 $4,881 $4,176 $3,603 $3,632 $3,273 $2,490 $2,143 2020Y 2021Y 2022Y Total Deposits ($M) 2023Y 2024Y 2025Y Q3 2026 2020Y 2021Y 2022Y 2023Y Common Equity ($M) 2024Y 2025Y Q3 2026 $462 $4,105 $3,717 $3,380 $3,436 $3,134 $2,564 $2,143 $369 $330 $312 $278 $295 $228 2020Y 2021Y 2022Y 2023Y 2024Y 2025Y Q3 2026 2020Y 2021Y 2022Y 2023Y 2024Y 2025Y Q3 2026 1) Excludes loans held for sale 13
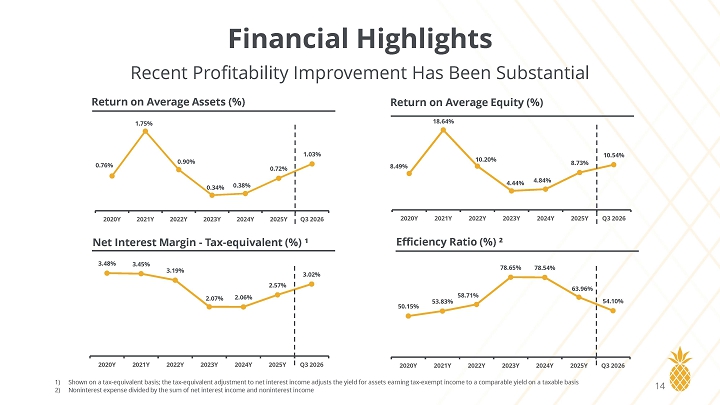
Financial Highlights Recent Profitability Improvement Has Been Substantial Return on Average Assets (%) Return on Average Equity (%) 1.75% 18.64% 1.03% 10.54% 0.90% 10.20% 0.76% 8.49% 8.73% 0.72% 4.44% 4.84% 0.34% 0.38% 2020Y 2021Y 2022Y 2023Y 2024Y 2025Y Q3 2026 2020Y 2021Y 2022Y 2023Y 2024Y 2025Y Q3 2026 Net Interest Margin - Tax - equivalent (%) ¹ Efficiency Ratio (%) ² 3.48% 3.45% 78.65% 78.54% 3.19% 3.02% 2.57% 63.96% 2.07% 2.06% 58.71% 53.83% 54.10% 50.15% 2020Y 2021Y 2022Y 2023Y 2024Y 2025Y Q3 2026 2020Y 2021Y 2022Y 2023Y 2024Y 2025Y Q3 2026 1) Shown on a tax - equivalent basis; the tax - equivalent adjustment to net interest income adjusts the yield for assets earning tax - exempt income to a comparable yield on a taxable basis 2) Noninterest expense divided by the sum of net interest income and noninterest income 14
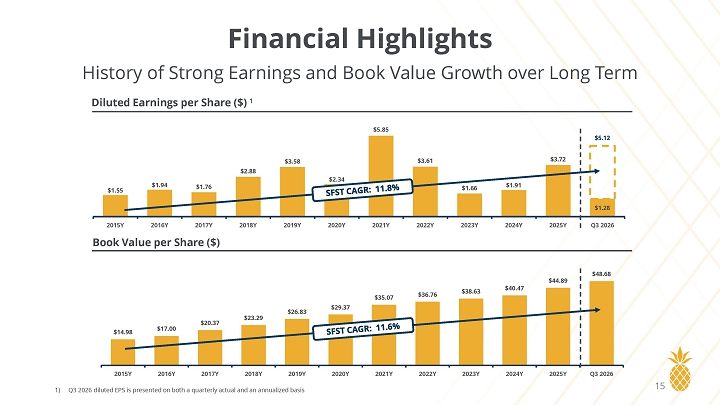
Financial Highlights History of Strong Earnings and Book Value Growth over Long Term Diluted Earnings per Share ($) ¹ $5.85 $5.12 $3.58 $3.61 $3.72 $2.88 $2.34 $1.94 $1.76 $1.55 $1.66 $1.91 $1.28 2015Y 2016Y 2017Y Book Value per Share ($) 2018Y 2019Y 2020Y 2021Y 2022Y 2023Y 2024Y 2025Y Q3 2026 $48.68 $44.89 $35.07 $36.76 $38.63 $40.47 $29.37 $26.83 $23.29 $20.37 $14.98 $17.00 2015Y 2016Y 2017Y 2018Y 2019Y 1) Q3 2026 diluted EPS is presented on both a quarterly actual and an annualized basis 2020Y 2021Y 2022Y 2023Y 2024Y 2025Y Q3 2026 15
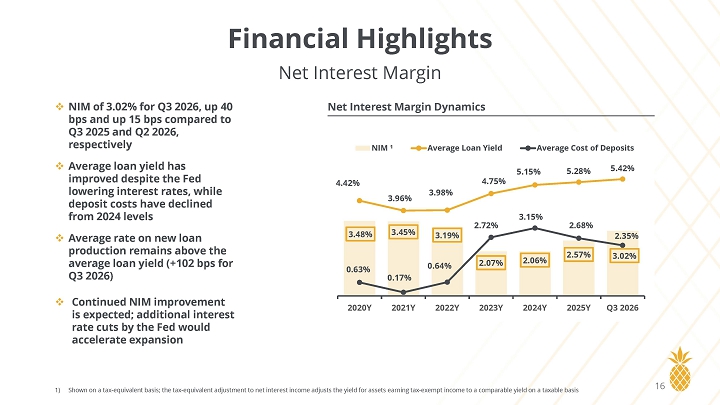
Financial Highlights Net Interest Margin □ NIM of 3 . 02 % for Q 3 2026 , up 40 bps and up 15 bps compared to Q 3 2025 and Q 2 2026 , respectively □ Average loan yield has improved despite the Fed lowering interest rates, while deposit costs have declined from 2024 levels □ Average rate on new loan production remains above the average loan yield (+102 bps for Q3 2026) □ Continued NIM improvement is expected; additional interest rate cuts by the Fed would accelerate expansion Net Interest Margin Dynamics NIM ¹ Average Loan Yield Average Cost of Deposits 5.15% 5.28% 5.42% 4.42% 4.75% 3.98% 3.96% 3.15% 2.72% 2.68% 3.48% 3.45% 3.19% 2.35% 2.57% 2.07% 2.06% 3.02% 0.63% 0.64% 0.17% 2020Y 2021Y 2022Y 2023Y 2024Y 2025Y Q3 2026 1) Shown on a tax - equivalent basis; the tax - equivalent adjustment to net interest income adjusts the yield for assets earning tax - exempt income to a comparable yield on a taxable basis 16
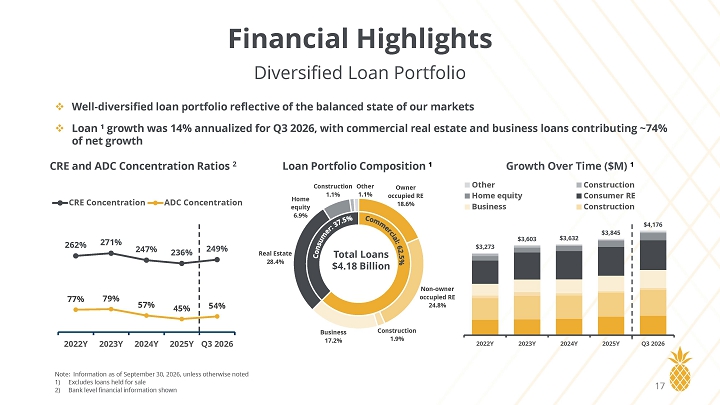
Financial Highlights Diversified Loan Portfolio □ Well - diversified loan portfolio reflective of the balanced state of our markets □ Loan ¹ growth was 14% annualized for Q3 2026, with commercial real estate and business loans contributing ~74% of net growth CRE and ADC Concentration Ratios 2 Loan Portfolio Composition ¹ Other CRE Concentration ADC Concentration Home equity Business Consumer RE Construction Growth Over Time ($M) ¹ Construction 262% 271% 247% 236% 249% 77% 79% 57% 45% 54% Construction Other 1.1% 1.1% Owner occupied RE 18.6% Home equity 6 . 9 % $4,176 $3,845 $3,603 $3,632 $3,273 Real Estate 28.4% Total Loans $4.18 Billion Non - owner occupied RE 24.8% Business 17.2% Construction 1.9% 2022Y 2023Y 2024Y 2025Y Q3 2026 2022Y 2023Y 2024Y 2025Y Q3 2026 Note: Information as of September 30, 2026, unless otherwise noted 1) Excludes loans held for sale 2) Bank level financial information shown 17
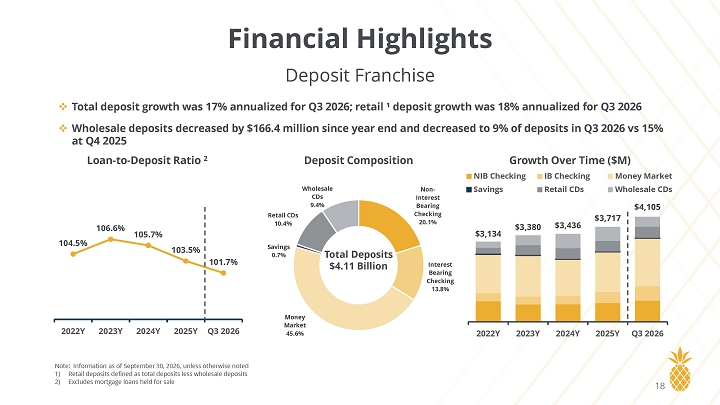
Financial Highlights NIB Checking Savings IB Checking Retail CDs $3,717 Money Market Wholesale CDs $4,105 Deposit Franchise □ Total deposit growth was 17% annualized for Q3 2026; retail ¹ deposit growth was 18% annualized for Q3 2026 □ Wholesale deposits decreased by $166.4 million since year end and decreased to 9% of deposits in Q3 2026 vs 15% at Q4 2025 Loan - to - Deposit Ratio 2 Deposit Composition Growth Over Time ($M) Wholesale CDs 9.4% Retail CDs 10.4% Non - Interest Bearing Checking 20.1% 106.6% $3,380 $3,436 $3,134 105.7% 104.5% 103.5% Savings 0.7% 101.7% Total Deposits $4.11 Billion Interest Bearing Checking 13.8% 2022Y 2023Y 2024Y 2025Y Q3 2026 Money Market 45 . 6 % 2022Y 2023Y 2024Y 2025Y Q3 2026 Note: Information as of September 30, 2026, unless otherwise noted 1) Retail deposits defined as total deposits less wholesale deposits 2) Excludes mortgage loans held for sale 18
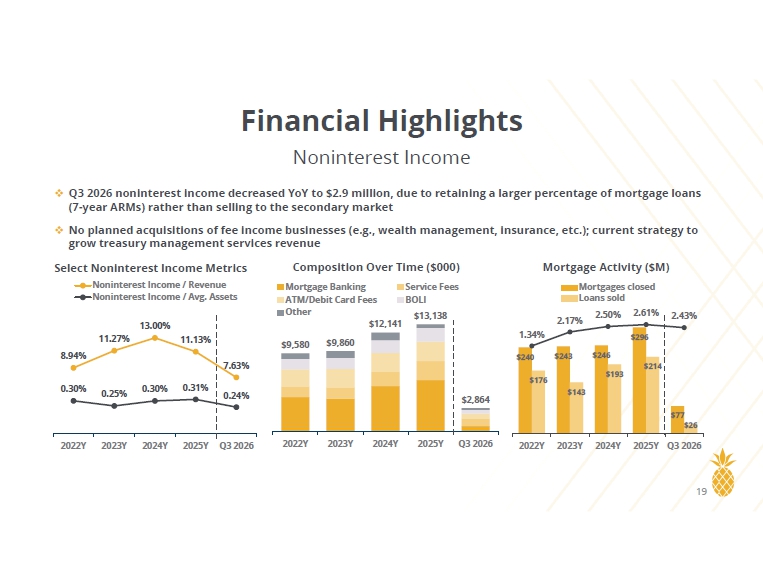
Financial Highlights Noninterest Income □ Q3 2026 noninterest decreased YoY to $2.9 million, due to retaining a larger percentage of mortgage loans (7 - year ARMs) rather than selling to the secondary market □ No planned acquisitions of fee income businesses (e.g., wealth management, insurance, etc.); current strategy to grow treasury management services revenue $12,141 Mortgage Banking ATM/Debit Card Fees Other Service Fees BOLI $13,138 Select Noninterest Income Metrics Noninterest Income / Revenue Noninterest Income / Avg. Assets Composition Over Time ($000) Mortgage Activity ($M) Mortgages closed Loans sold 2.50% 2.61% $9,580 $9,860 $2,864 2.17% 2.43% 13.00% 1.34% 11.27% 11.13% $296 8.94% $240 $243 $246 7.63% $214 $193 $176 0.30% 0.30% 0.31% 0.25% 0.24% $143 $77 $26 2022Y 2023Y 2024Y 2025Y Q3 2026 2022Y 2023Y 2024Y 2025Y Q3 2026 2022Y 2023Y 2024Y 2025Y Q3 2026 19
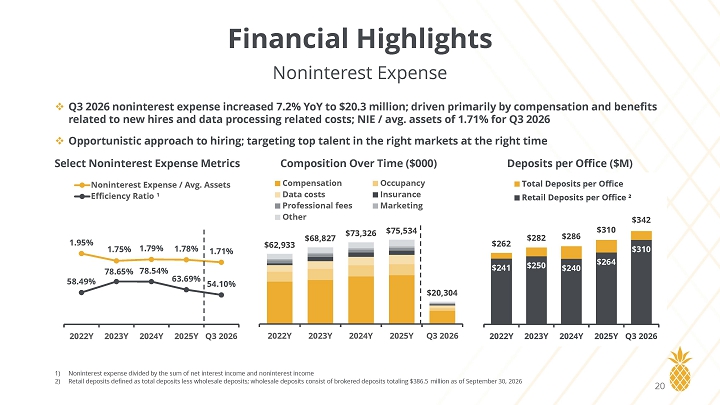
Financial Highlights Noninterest Expense □ Q3 2026 noninterest expense increased 7.2% YoY to $20.3 million; driven primarily by compensation and benefits related to new hires and data processing related costs; NIE / avg. assets of 1.71% for Q3 2026 □ Opportunistic approach to hiring; targeting top talent in the right markets at the right time Compensation Data costs Professional fees Other Select Noninterest Expense Metrics Noninterest Expense / Avg. Assets Efficiency Ratio ¹ Composition Over Time ($000) Deposits per Office ($M) Occupancy Insurance Marketing $73,326 $75,534 1.95% $68,827 $62,933 1.75% 1.79% 1.78% 1.71% 78.65% 78.54% 58.49% 63.69% 54.10% $20,304 2022Y 2023Y 2024Y 2025Y Q3 2026 2022Y 2023Y 2024Y 2025Y Q3 2026 Total Deposits per Office Retail Deposits per Office ² $342 $310 $282 $286 $262 $310 $241 $250 $264 $240 2022Y 2023Y 2024Y 2025Y Q3 2026 1) Noninterest expense divided by the sum of net interest income and noninterest income 2) Retail deposits defined as total deposits less wholesale deposits; wholesale deposits consist of brokered deposits totaling $386.5 million as of September 30, 2026 20
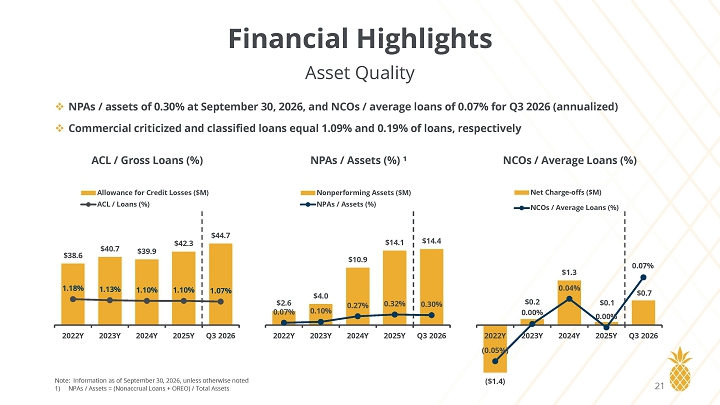
Financial Highlights Asset Quality □ NPAs / assets of 0.30% at September 30, 2026, and NCOs / average loans of 0.07% for Q3 2026 (annualized) □ Commercial criticized and classified loans equal 1.09% and 0.19% of loans, respectively ACL / Gross Loans (%) NPAs / Assets (%) ¹ NCOs / Average Loans (%) Allowance for Credit Losses ($M) ACL / Loans (%) Nonperforming Assets ($M) NPAs / Assets (%) $44.7 $42.3 $40.7 $38.6 $39.9 1.18% 1.13% 1.10% 1.10% 1.07% . 0 Net Charge - offs ($M) NCOs / Average Loans (%) $14.1 $14.4 $10.9 0.07% $4.0 $2.6 0.07% 0.27% 0.32% 0.30% 0.10% 2022Y 2023Y 2024Y 2025Y Q3 2026 2022Y 2023Y 2024Y 2025Y Q3 2026 $1.3 $0.7 $0.2 0.00% 0.04% $0.1 0.00% 0 2022Y 2023Y 2024Y 2025Y Q3 2026 (0.05%) ( Note: Information as of September 30, 2026, unless otherwise noted 1) NPAs / Assets = (Nonaccrual Loans + OREO) / Total Assets ($1.4) 21
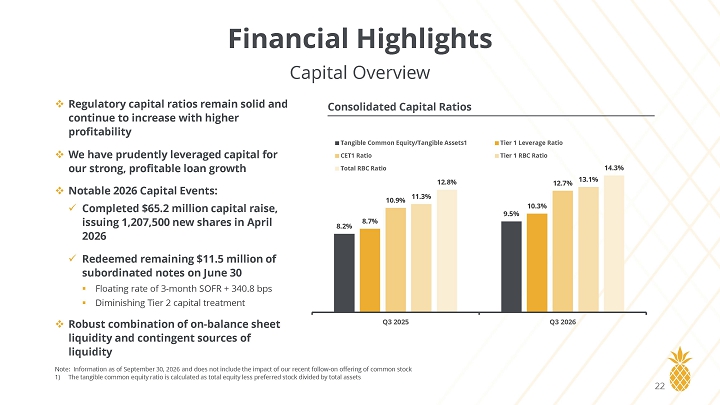
Financial Highlights Capital Overview □ Regulatory capital ratios remain solid and continue to increase with higher profitability □ We have prudently leveraged capital for our strong, profitable loan growth □ Notable 2026 Capital Events: x Completed $65.2 million capital raise, issuing 1,207,500 new shares in April 2026 x Redeemed remaining $11.5 million of subordinated notes on June 30 ▪ Floating rate of 3 - month SOFR + 340.8 bps ▪ Diminishing Tier 2 capital treatment □ Robust combination of on - balance sheet liquidity and contingent sources of liquidity Consolidated Capital Ratios Tier 1 Leverage Ratio Tier 1 RBC Ratio Tangible Common Equity/Tangible Assets1 CET1 Ratio Total RBC Ratio 14.3% 12.8% 12.7% 13.1% 10.9% 11.3% 10.3% 9.5% 8.7% 8.2% Q3 2025 Q3 2026 Note: Information as of September 30, 2026 and does not include the impact of our recent follow - on offering of common stock 1) The tangible common equity ratio is calculated as total equity less preferred stock divided by total assets 22