
Corporate Presentation October 2026
Forward-looking statements and third-party information This presentation contains forward-looking statements within the meaning of the “safe harbor” provisions of the Private Securities Litigation Reform Act of 1995. All statements other than statements of historical facts are forward-looking statements, including, but not limited to, statements regarding our business strategy; the future clinical development, efficacy, safety, and therapeutic potential of our product candidates; expectations regarding the initiation, design, and reporting of data from our preclinical studies and clinical trials; future financial results; anticipated manufacturing plans; expectations regarding regulatory approval of any of our product candidates; and plans for future operations or other characterizations of future events. In some cases, you can identify forward-looking statements through the use of words such as “may,” “will,” “should,” “expects,” “plans,” “anticipates,” “could,” “intends,” “target,” “projects,” “contemplates,” “believes,” “estimates,” “predicts,” “potential,” or “continue,” or the negatives of these words or other similar terms or expressions that concern our expectations, strategy, plans, or intentions. These statements are not guarantees of future performance and involve risks and uncertainties, some of which are beyond our control, and you are cautioned not to place undue reliance on any forward-looking statements. Among the factors that could cause actual results to differ materially from those suggested by forward-looking statements are: our current and future research and development activities and expenses; sufficiency of our capital resources; our anticipated regulatory activities and our ability to obtain regulatory approval for any of our product candidates; our ability to commercialize future products, if approved; our ability to enroll patients in clinical trials; possible safety and efficacy concerns; the timing and results of our preclinical studies and clinical trials; and risks facing our operations and intellectual property. Although the Company believes the information contained in this presentation related to the Company is accurate in all material respects, neither the Company nor any other person assumes responsibility for the accuracy and completeness of the information contained in this presentation except to the extent required by law. The information contained in this presentation is provided for discussion purposes only as of the date hereof, and the Company undertakes no obligation to update or revise such information, including any forward-looking statements, whether as a result of new information, future events or circumstances, or otherwise, except to the extent required by law. Certain information contained in this presentation and statements made orally during this presentation may relate to or be based on studies, publications, estimates, projections, and other data obtained from third-party sources as well as our own internal estimates and research. While we believe these third-party sources to be reliable as of the date of this presentation, we have not independently verified, and make no representation as to the adequacy, fairness, accuracy, or completeness of any information obtained from third-party sources. Intellectual property This presentation contains references to our trademarks and service marks and to those belonging to other entities. Solely for convenience, trademarks and trade names referred to in this presentation, including logos, artwork, and other visual displays, may appear without the ® or TM symbols, but such references are not intended to indicate in any way that we will not assert, to the fullest extent under applicable law, our rights or the rights of the applicable licensor to these trademarks and trade names. This presentation may also contain trademarks, service marks, and trade names of third parties, which are the property of their respective owners. We do not intend our use or display of other entities’ trade names, trademarks, or service marks to imply a relationship with, or endorsement or sponsorship of us by, any other entity. Disclaimers
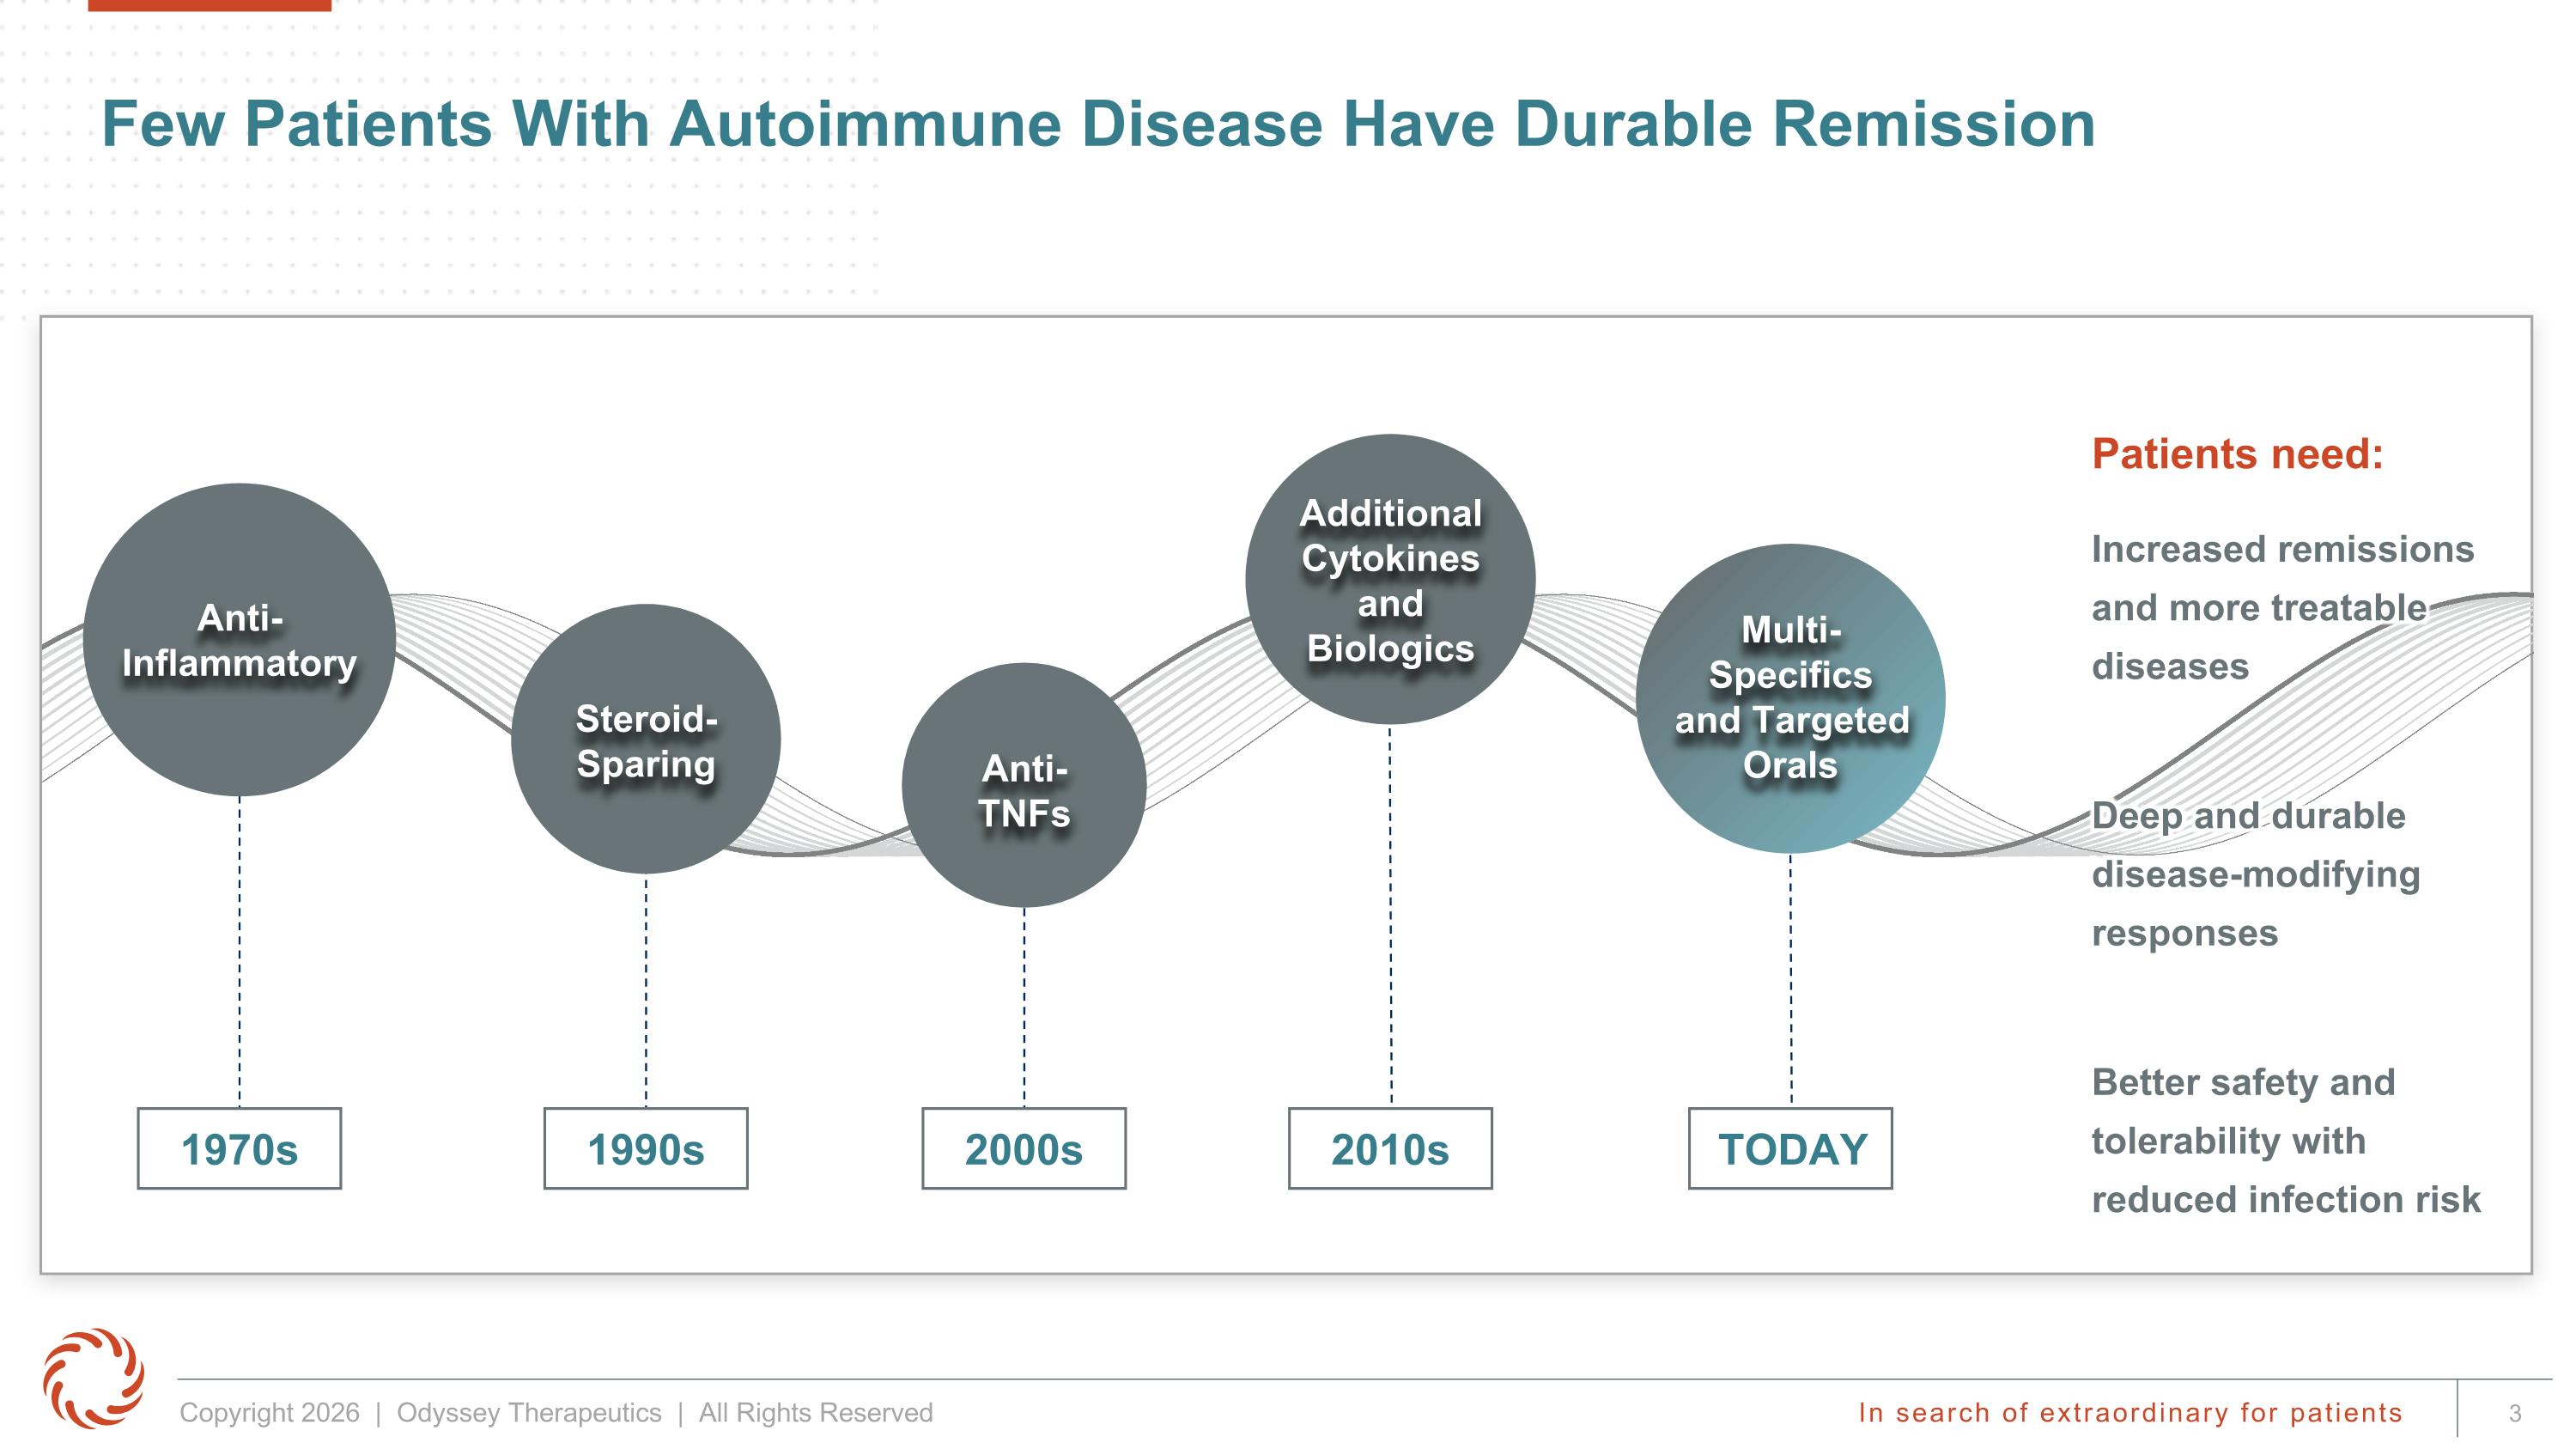
Few Patients With Autoimmune Disease Have Durable Remission Patients need: Increased remissions and more treatable diseases Deep and durable disease-modifying responses Better safety and tolerability with reduced infection risk Anti-Inflammatory 1970s Steroid-Sparing 1990s Anti-TNFs 2000s Additional Cytokines and Biologics 2010s Multi-Specifics and Targeted Orals TODAY
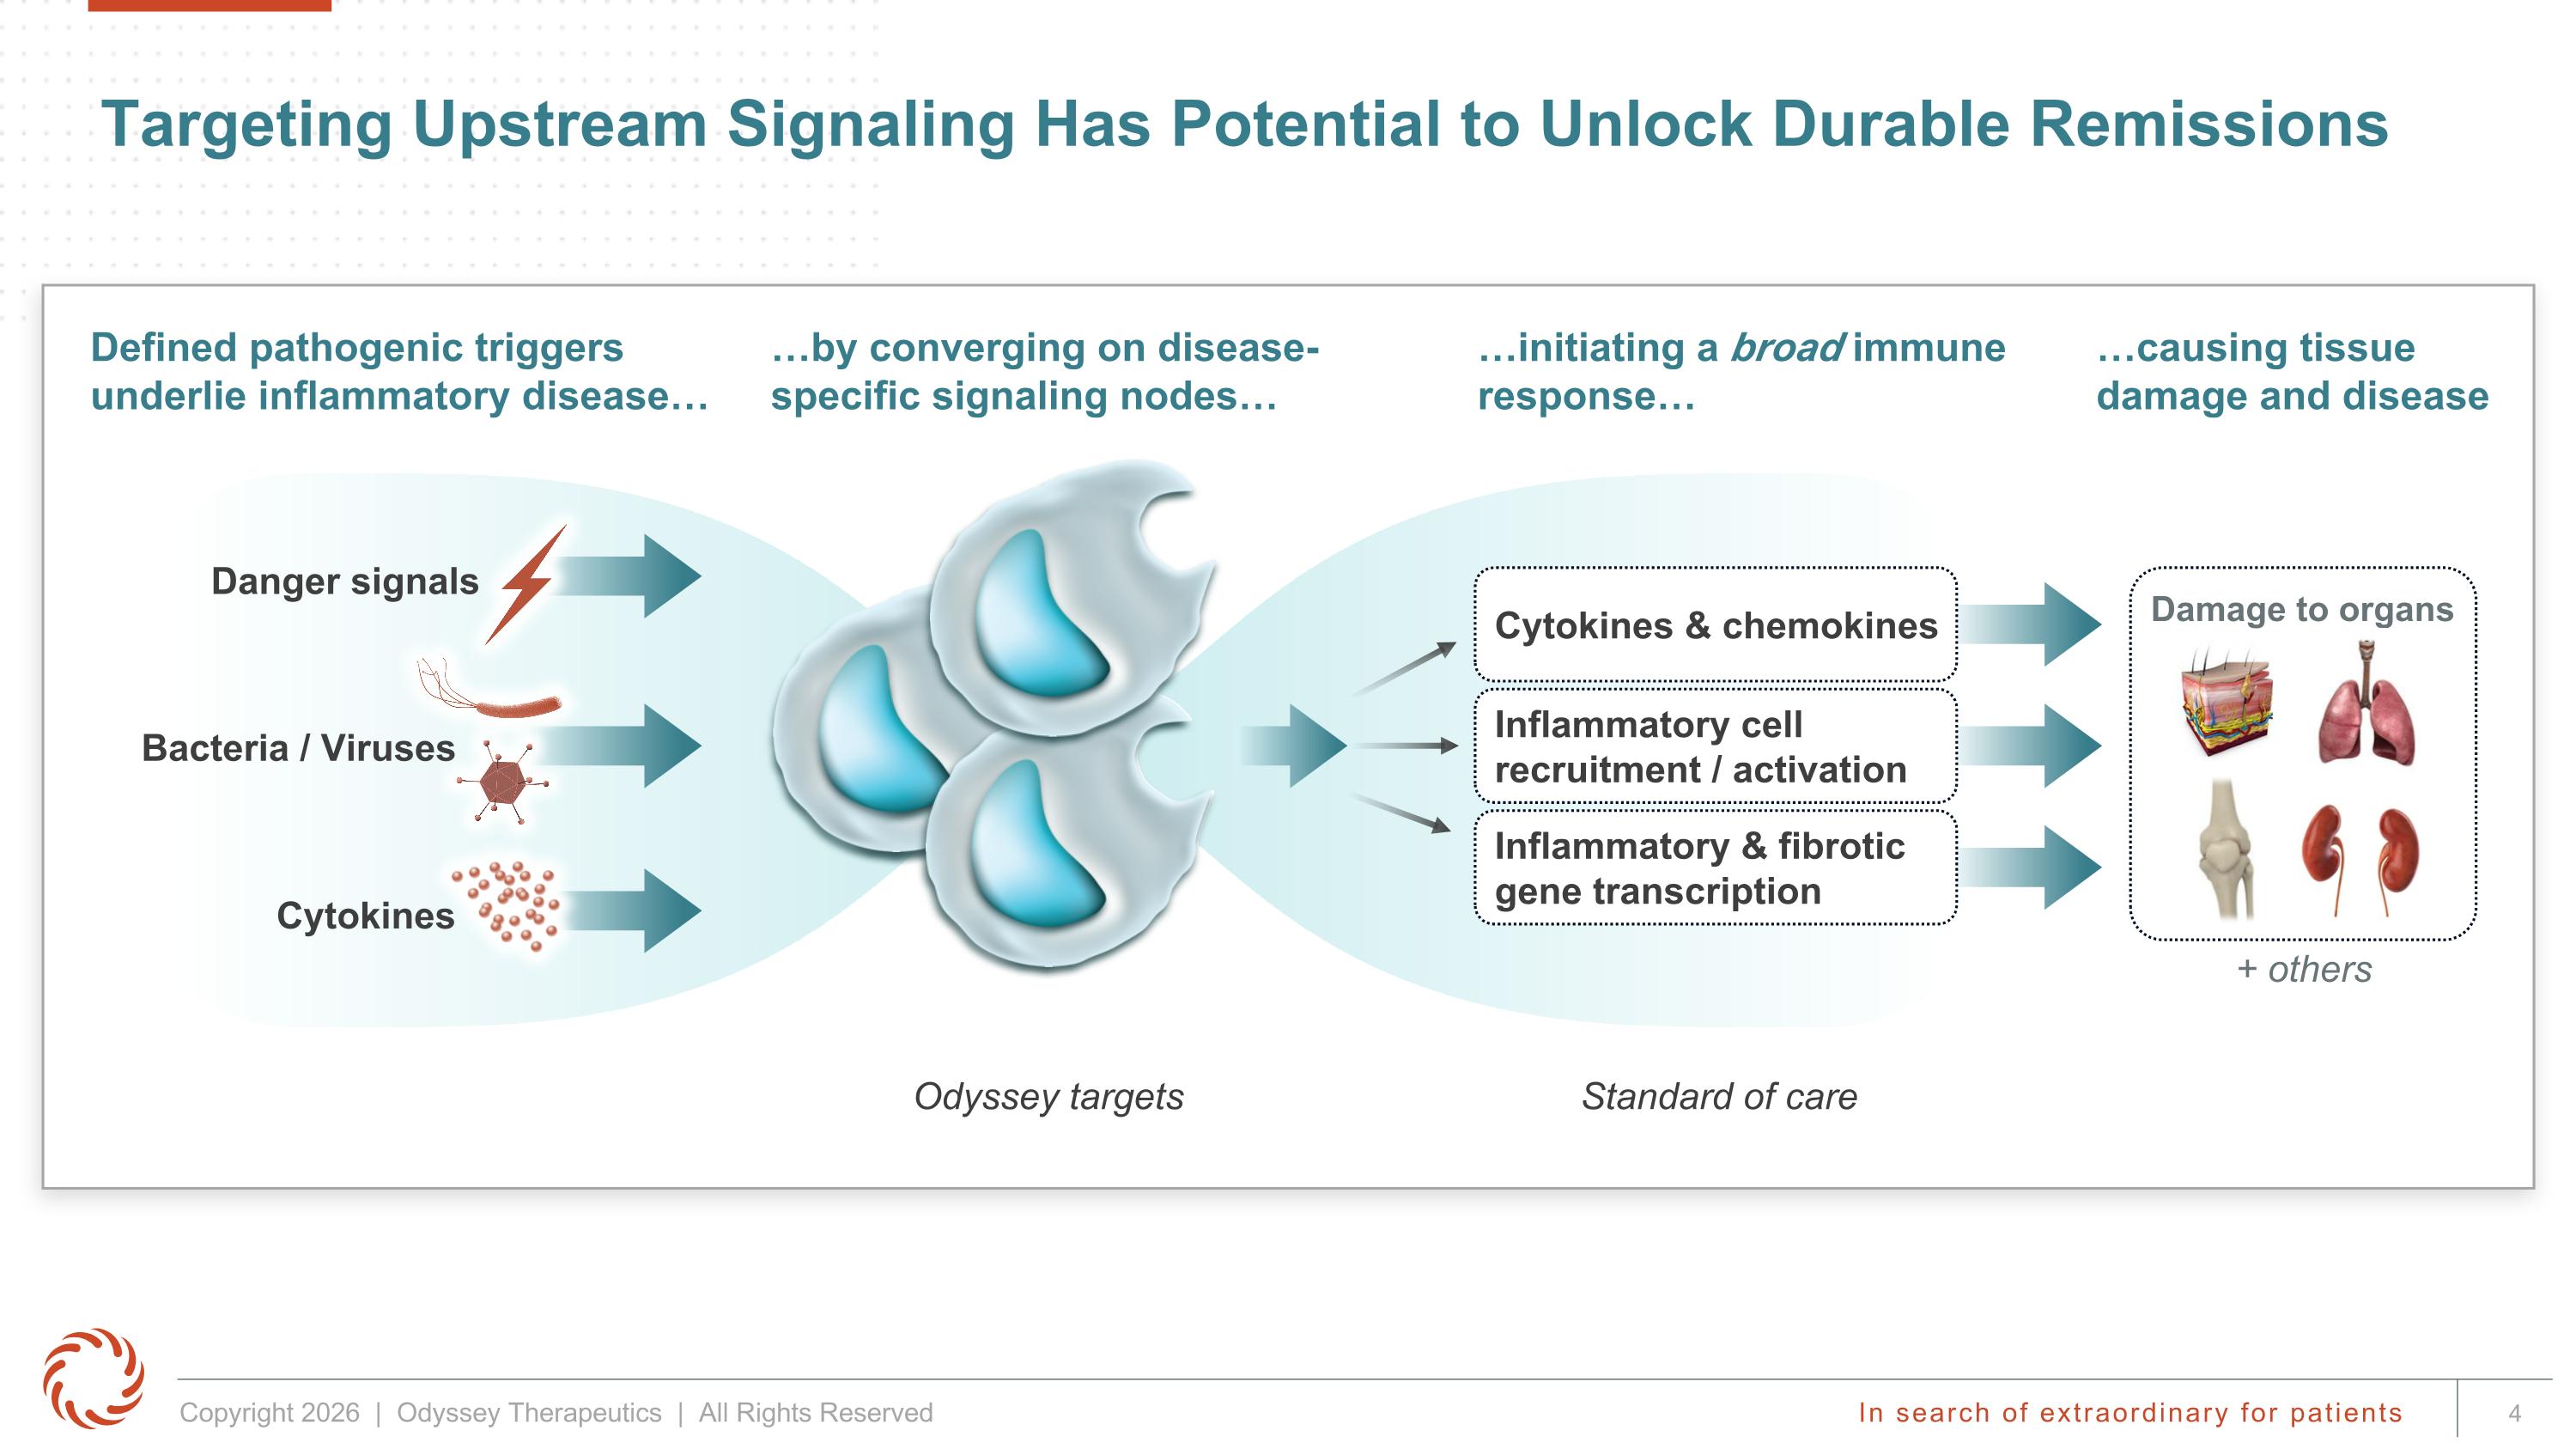
Targeting Upstream Signaling Has Potential to Unlock Durable Remissions Defined pathogenic triggers underlie inflammatory disease… …by converging on disease-specific signaling nodes… …initiating a broad immune response… …causing tissue damage and disease Cytokines & chemokines Inflammatory cell recruitment / activation Inflammatory & fibrotic gene transcription Odyssey targets Bacteria / Viruses Danger signals Cytokines Damage to organs + others Standard of care
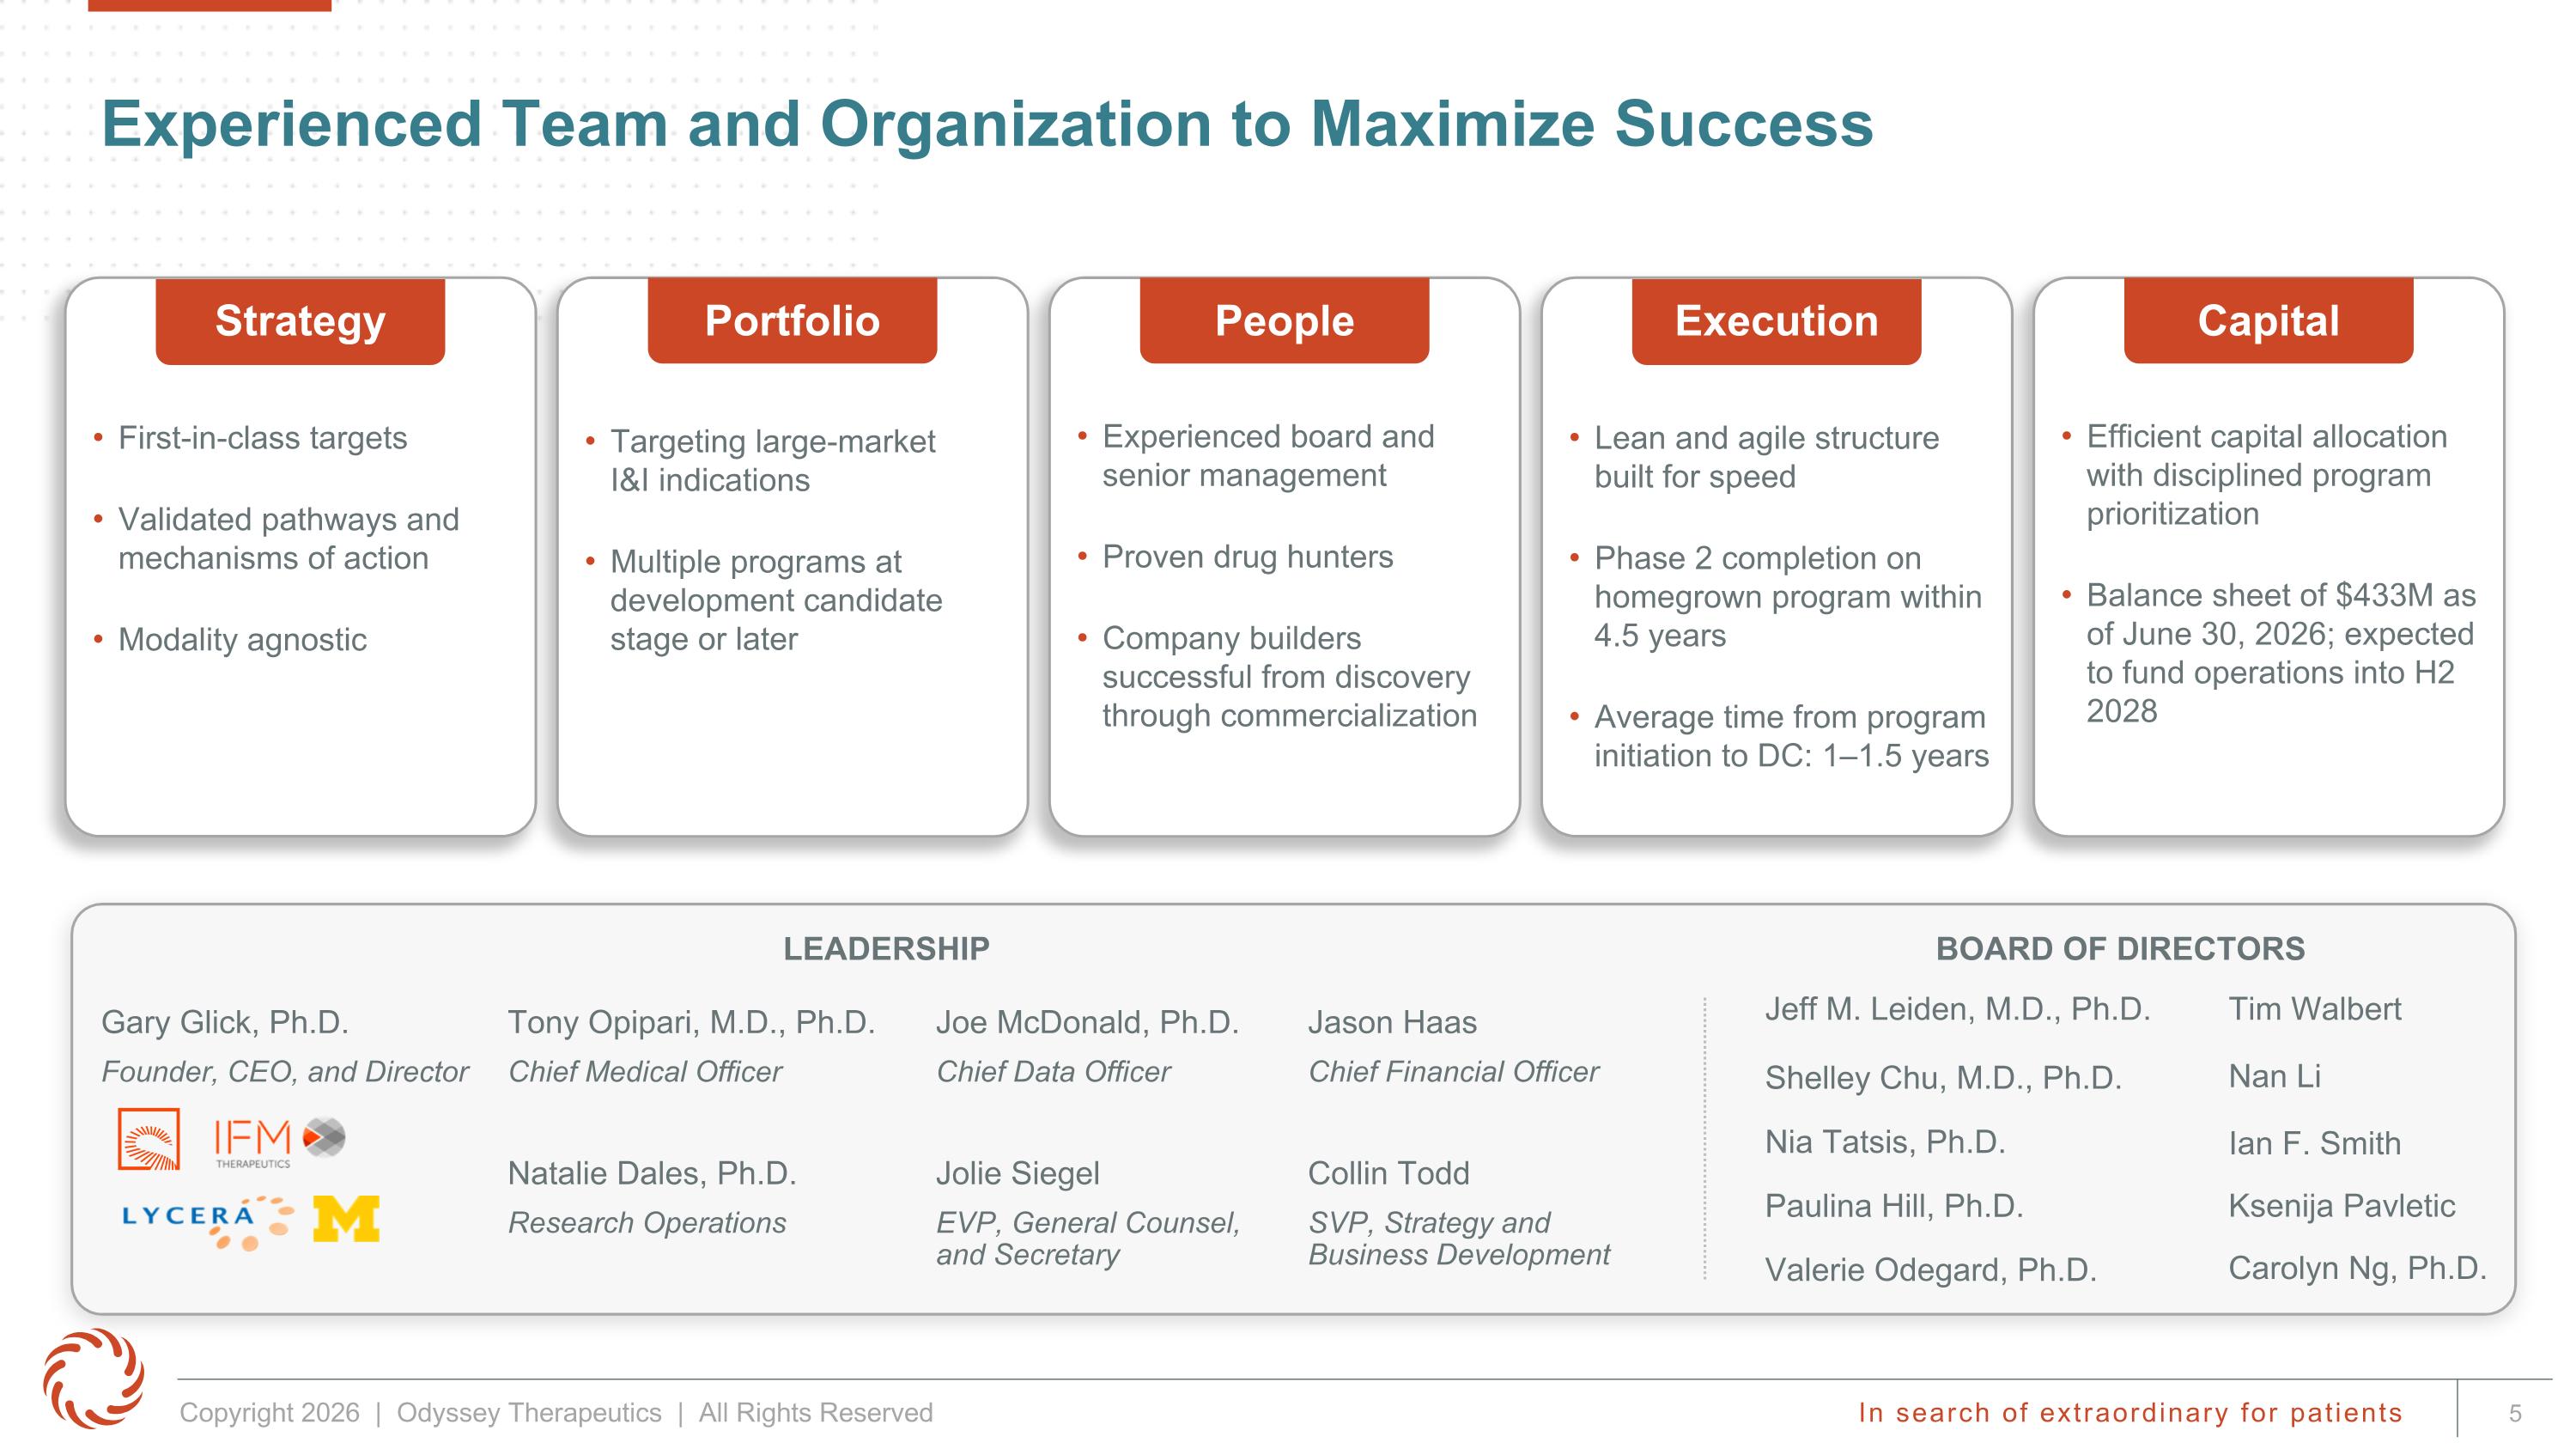
BOARD OF DIRECTORS Experienced Team and Organization to Maximize Success Gary Glick, Ph.D. Founder, CEO, and Director Tony Opipari, M.D., Ph.D. Chief Medical Officer Joe McDonald, Ph.D. Chief Data Officer Jason Haas Chief Financial Officer Valerie Odegard, Ph.D. Tim Walbert Nia Tatsis, Ph.D. Jeff M. Leiden, M.D., Ph.D. Ian F. Smith LEADERSHIP First-in-class targets Validated pathways and mechanisms of action Modality agnostic Strategy Experienced board and senior management Proven drug hunters Company builders successful from discovery through commercialization People Targeting large-market I&I indications Multiple programs at development candidate stage or later Portfolio Lean and agile structure built for speed Phase 2 completion on homegrown program within 4.5 years Average time from program initiation to DC: 1–1.5 years Execution Efficient capital allocation with disciplined program prioritization Balance sheet of $433M as of June 30, 2026; expected to fund operations into H2 2028 Capital Nan Li Paulina Hill, Ph.D. Ksenija Pavletic Shelley Chu, M.D., Ph.D. Carolyn Ng, Ph.D. Natalie Dales, Ph.D. Research Operations Jolie Siegel EVP, General Counsel, and Secretary Collin Todd SVP, Strategy and Business Development
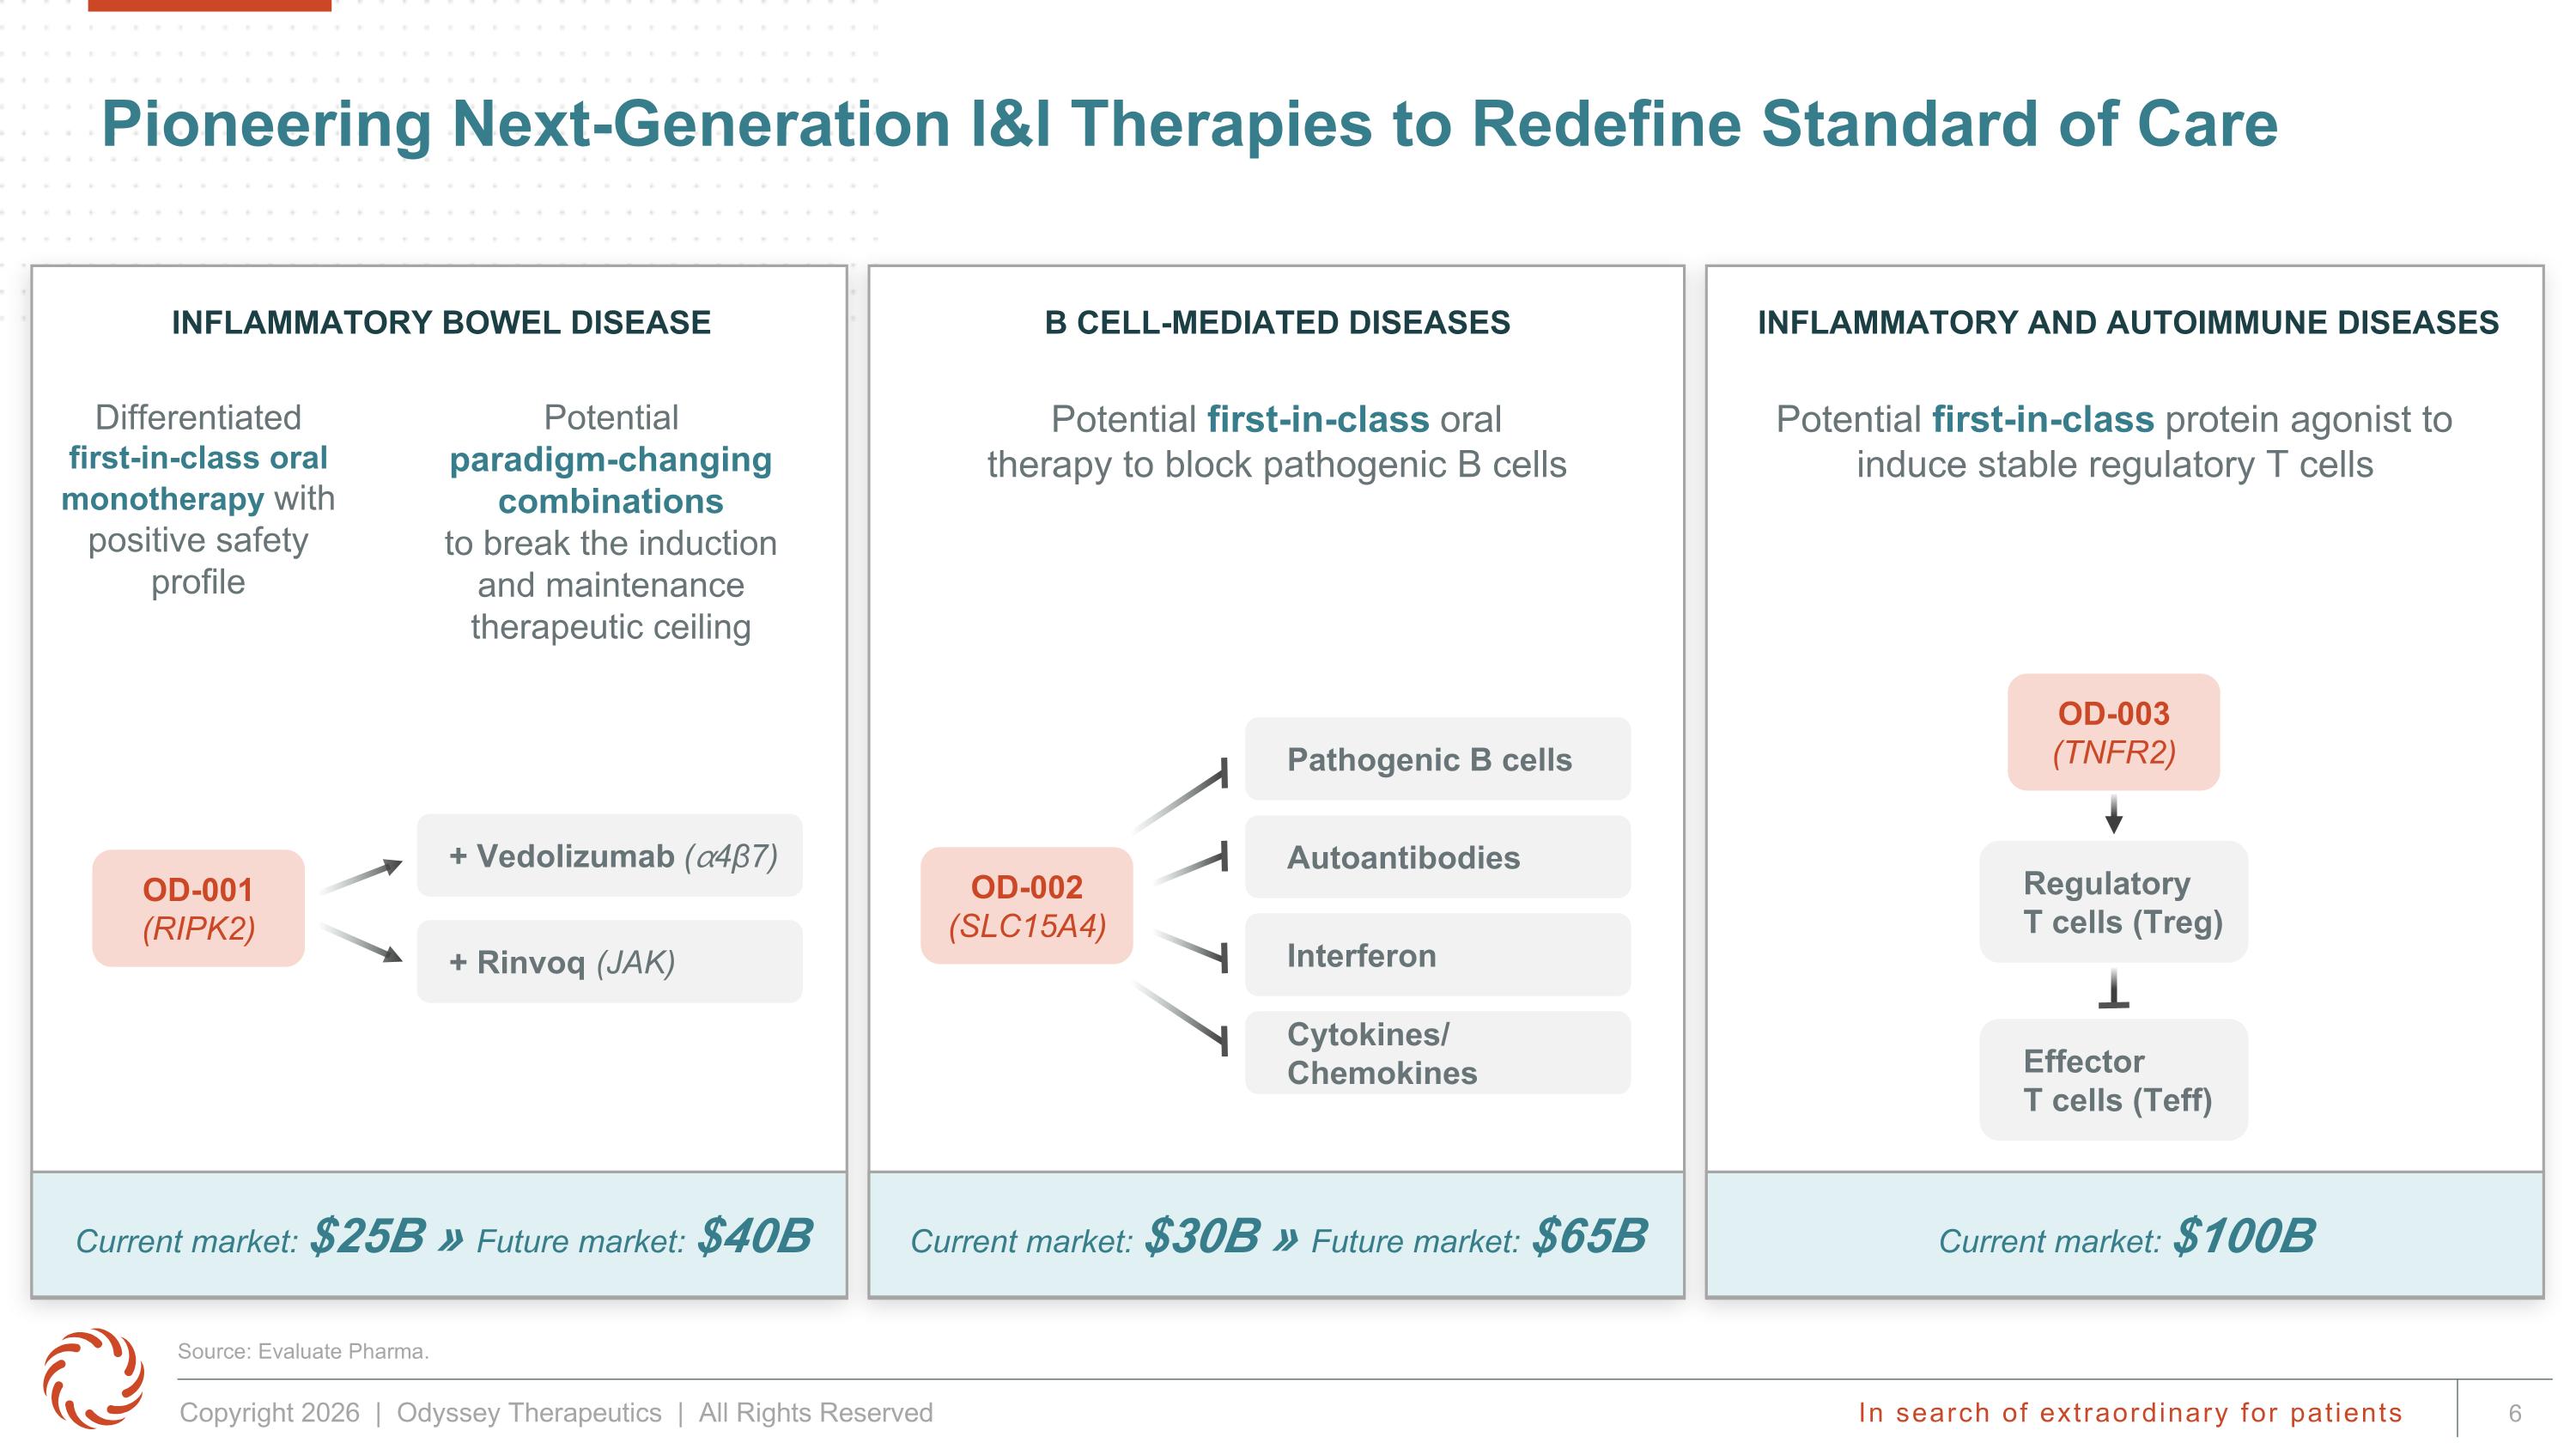
Pioneering Next-Generation I&I Therapies to Redefine Standard of Care Current market: $100B INFLAMMATORY BOWEL DISEASE B CELL-MEDIATED DISEASES INFLAMMATORY AND AUTOIMMUNE DISEASES Differentiated first-in-class oral monotherapy with positive safety profile Potential first-in-class oral therapy to block pathogenic B cells Potential first-in-class protein agonist to induce stable regulatory T cells Potential paradigm-changing combinations to break the induction and maintenance therapeutic ceiling OD-001 (RIPK2) + Vedolizumab (⍺4β7) + Rinvoq (JAK) OD-002 (SLC15A4) Pathogenic B cells Autoantibodies Interferon Cytokines/ Chemokines Current market: $30B » Future market: $65B Current market: $25B » Future market: $40B OD-003 (TNFR2) Regulatory T cells (Treg) Effector T cells (Teff) Source: Evaluate Pharma.
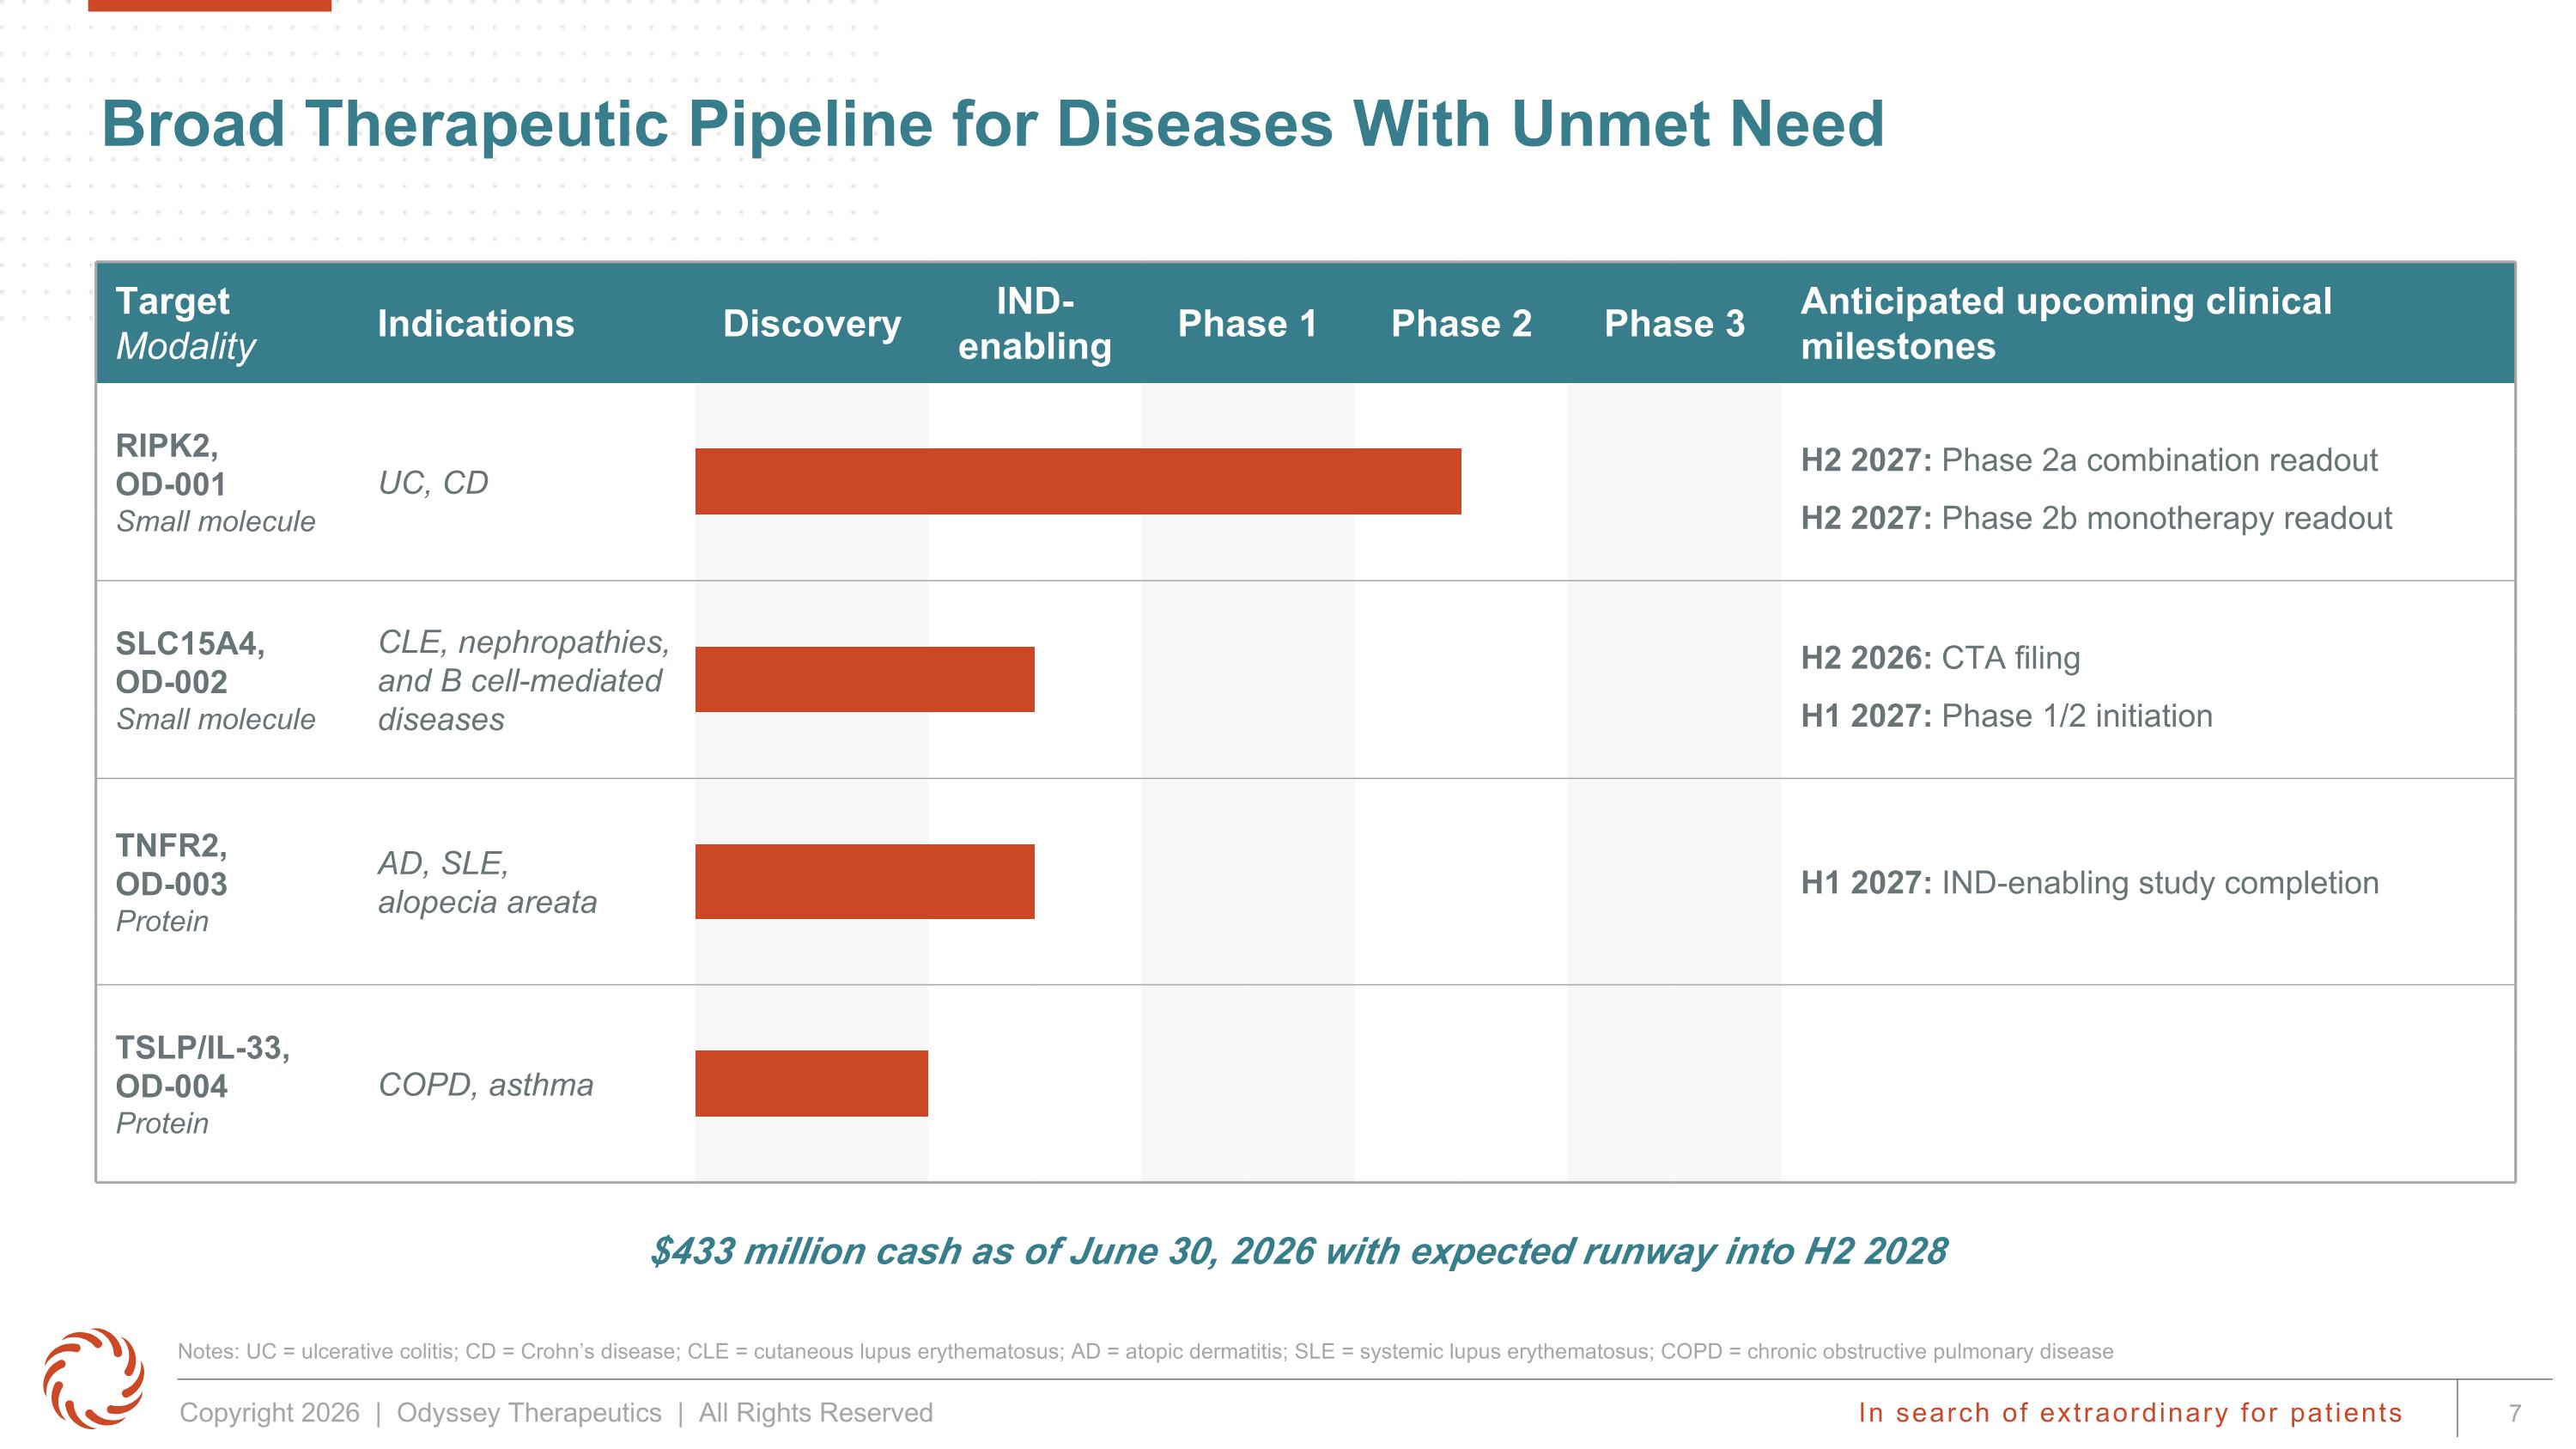
Broad Therapeutic Pipeline for Diseases With Unmet Need Notes: UC = ulcerative colitis; CD = Crohn’s disease; CLE = cutaneous lupus erythematosus; AD = atopic dermatitis; SLE = systemic lupus erythematosus; COPD = chronic obstructive pulmonary disease Target Modality Indications Discovery IND-enabling Phase 1 Phase 2 Phase 3 Anticipated upcoming clinical milestones RIPK2, OD-001 Small molecule UC, CD H2 2027: Phase 2a combination readout H2 2027: Phase 2b monotherapy readout SLC15A4, OD-002 Small molecule CLE, nephropathies, and B cell-mediated diseases H2 2026: CTA filing H1 2027: Phase 1/2 initiation TNFR2, OD-003 Protein AD, SLE, alopecia areata H1 2027: IND-enabling study completion TSLP/IL-33, OD-004 Protein COPD, asthma $433 million cash as of June 30, 2026 with expected runway into H2 2028
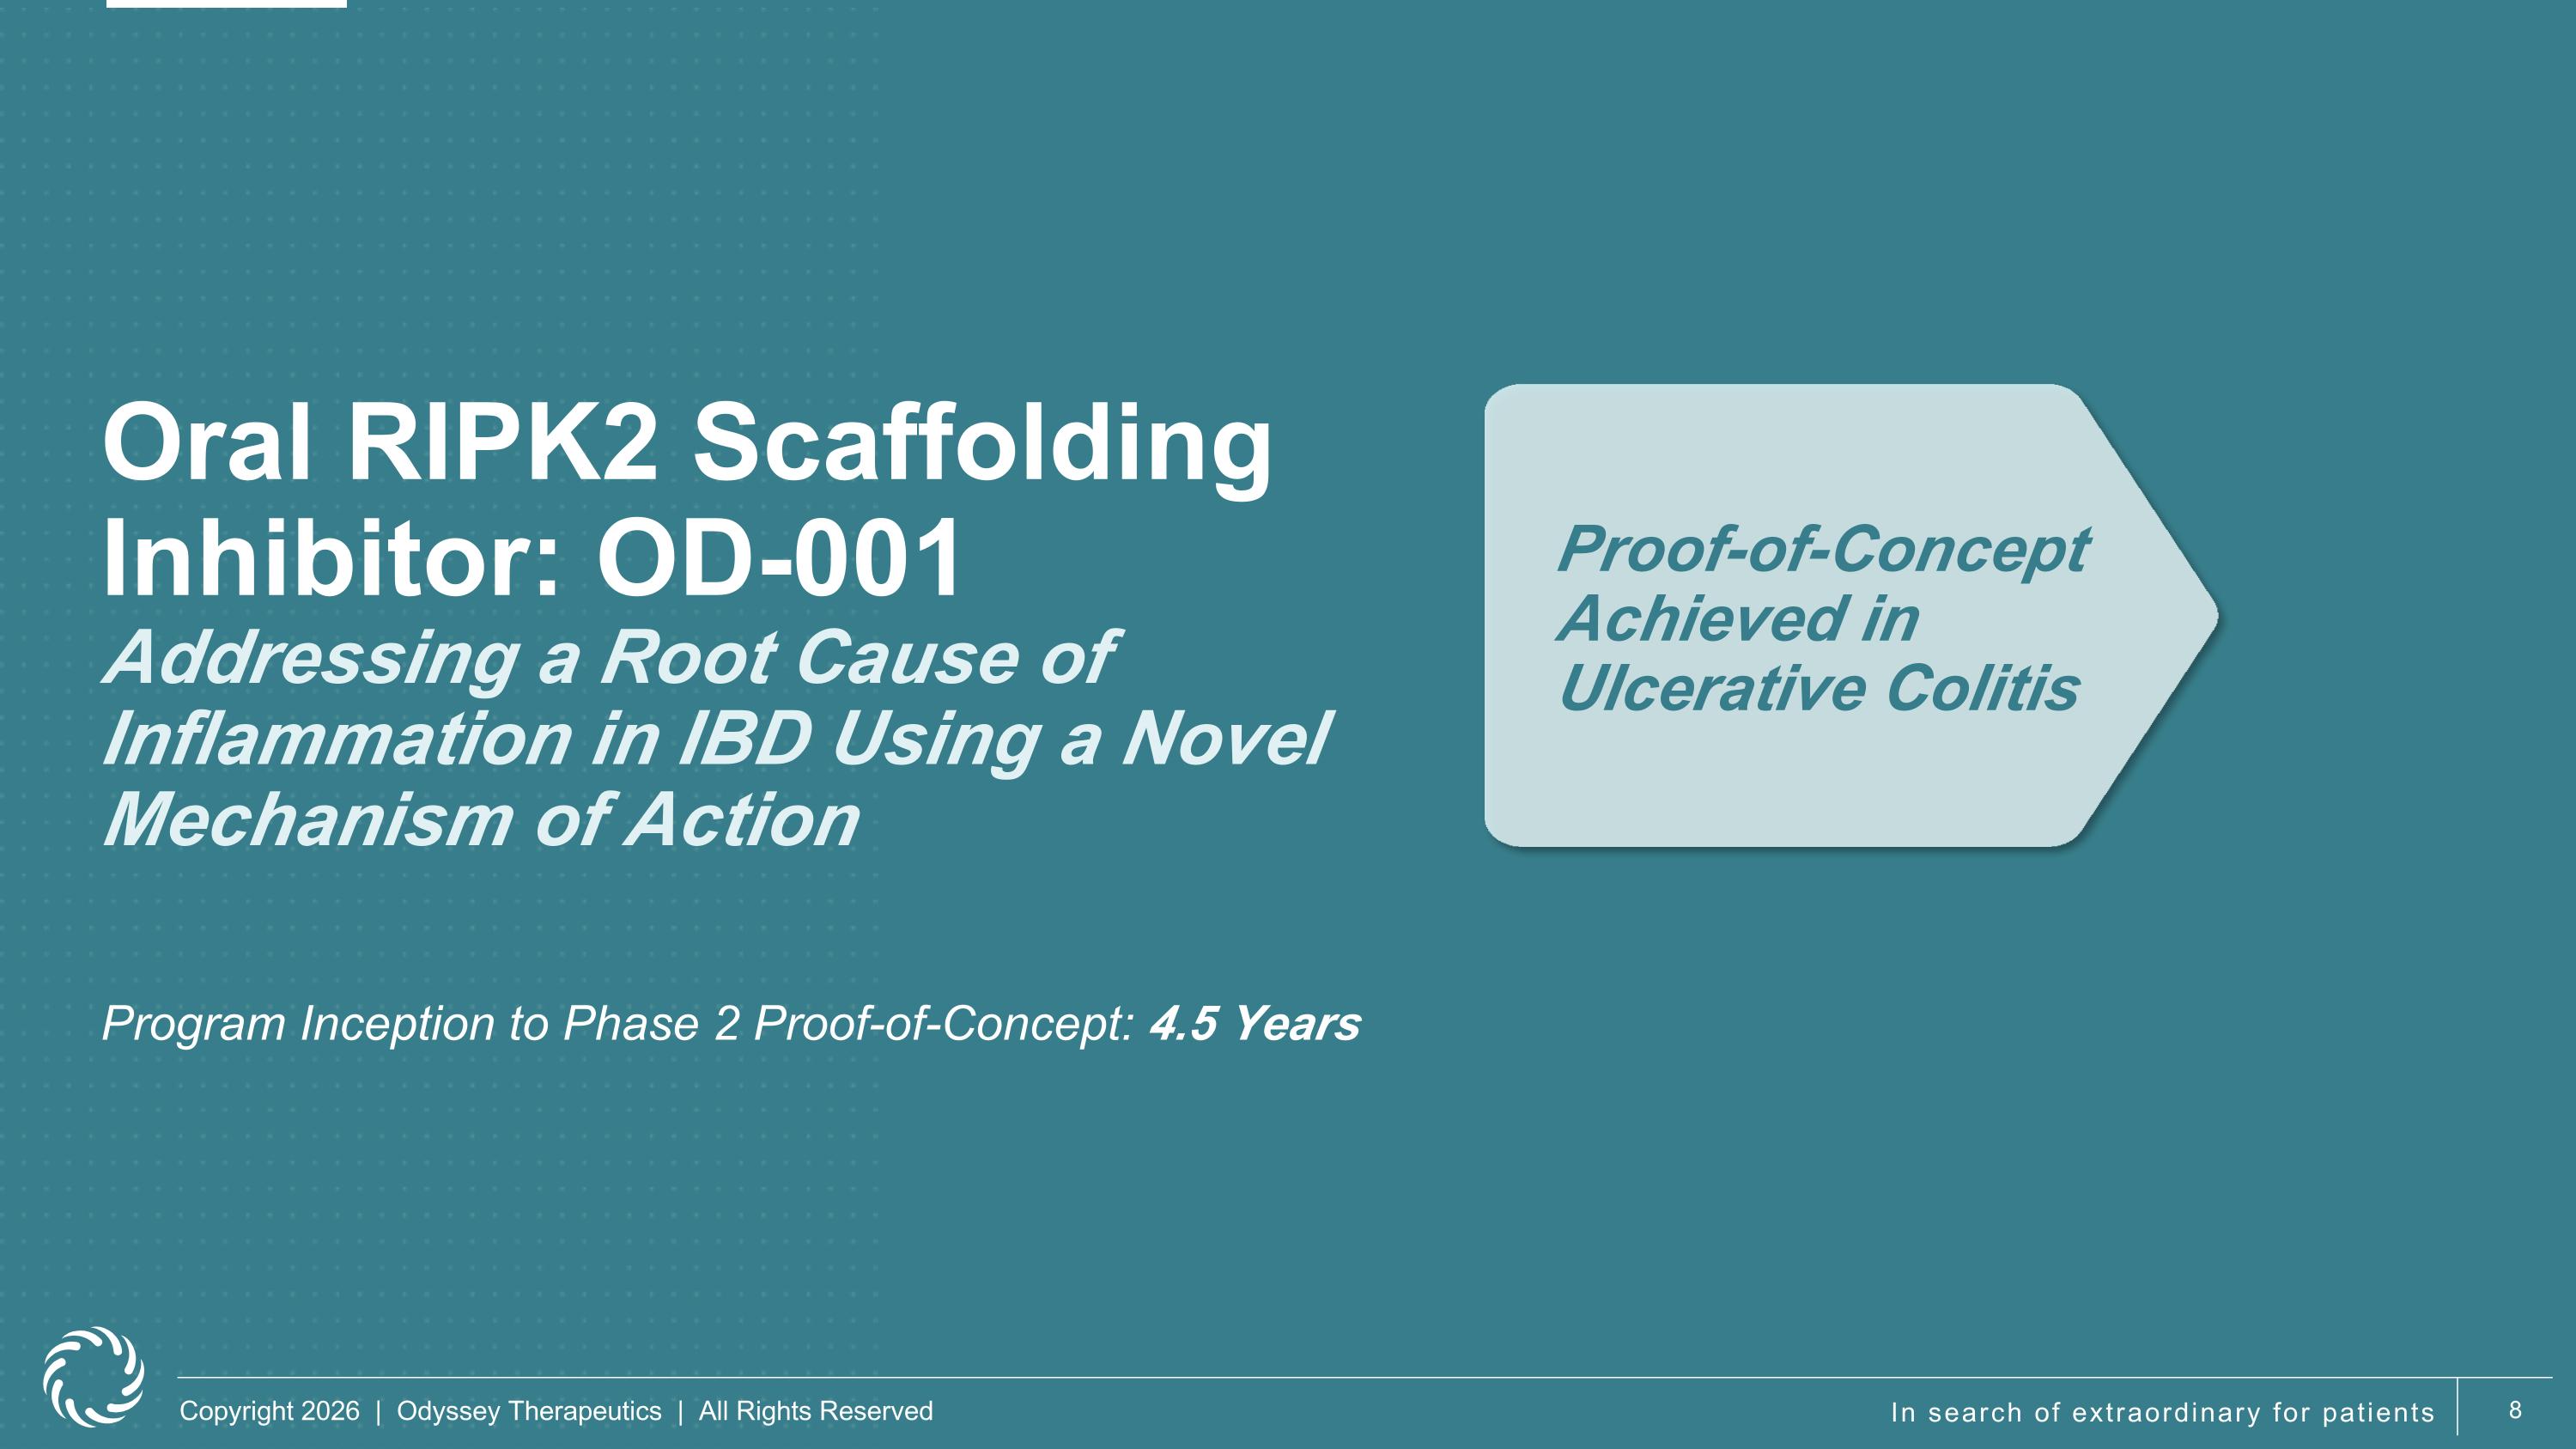
Oral RIPK2 Scaffolding Inhibitor: OD-001 Addressing a Root Cause of Inflammation in IBD Using a Novel Mechanism of Action Proof-of-Concept Achieved in Ulcerative Colitis Program Inception to Phase 2 Proof-of-Concept: 4.5 Years
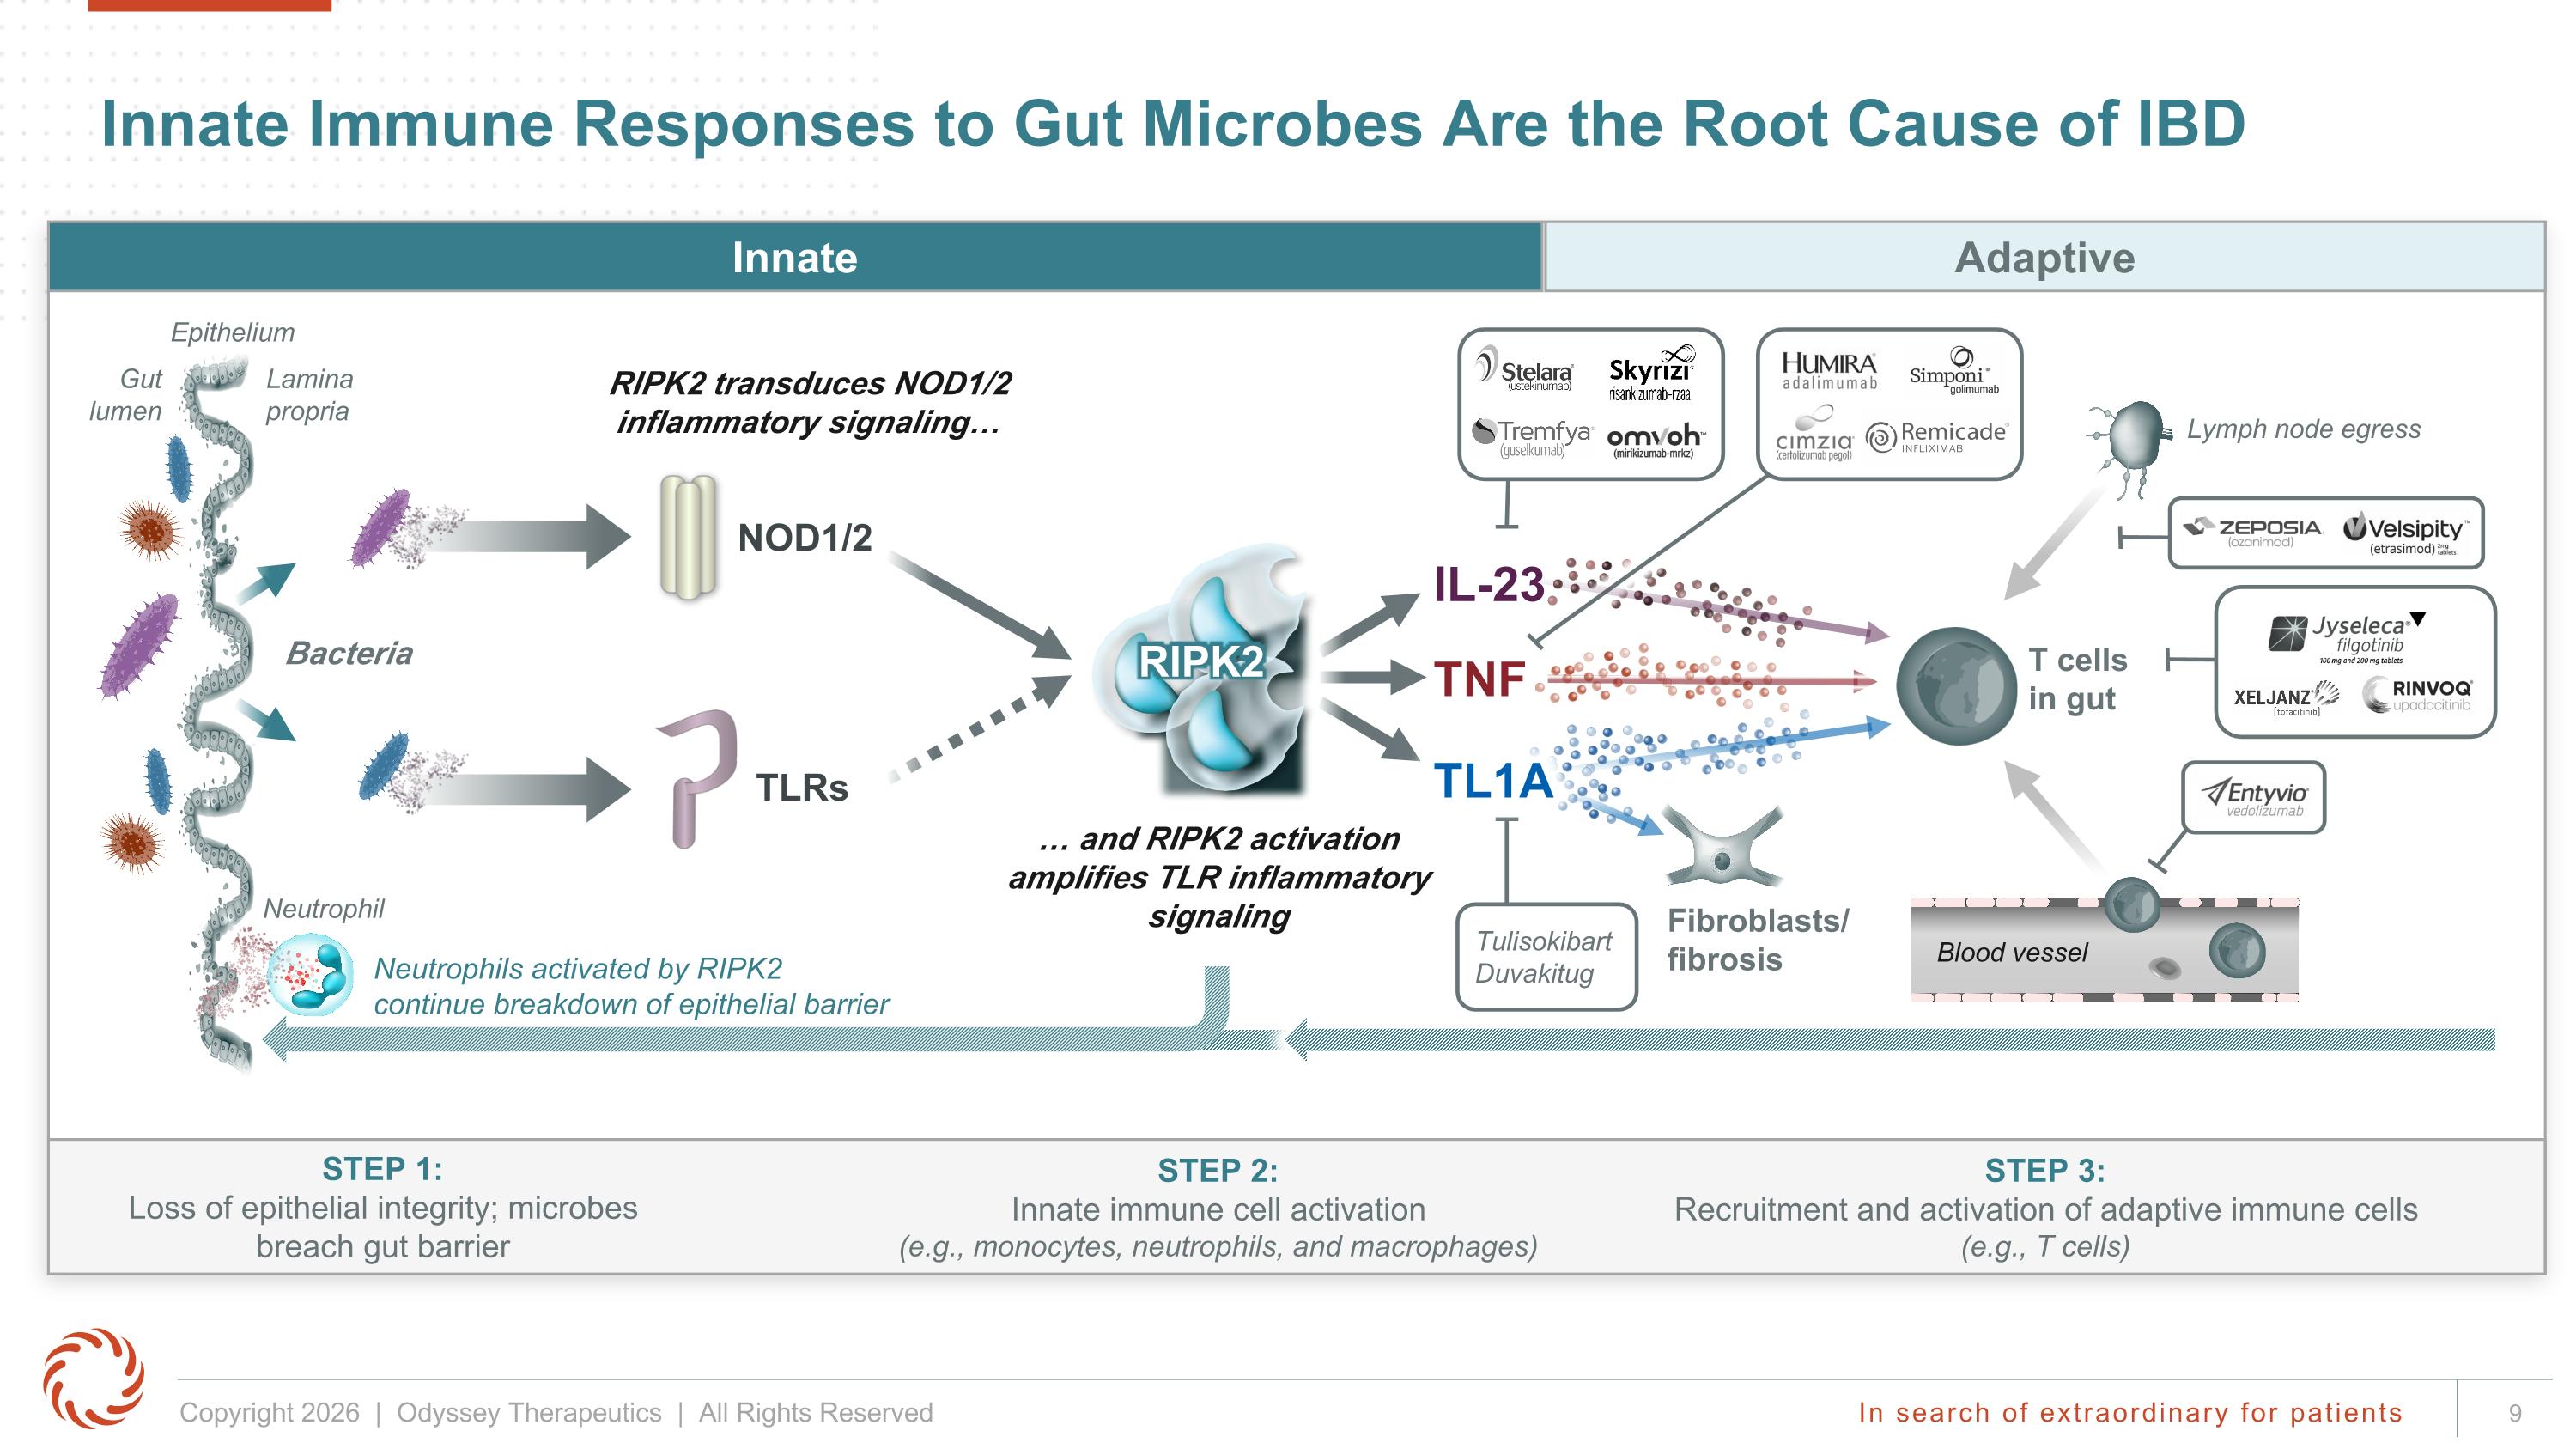
Innate Immune Responses to Gut Microbes Are the Root Cause of IBD STEP 1: Loss of epithelial integrity; microbes breach gut barrier STEP 2: Innate immune cell activation (e.g., monocytes, neutrophils, and macrophages) STEP 3: Recruitment and activation of adaptive immune cells (e.g., T cells) Innate Adaptive Lamina propria TLRs NOD1/2 T cells in gut Lymph node egress IL-23 TNF Bacteria Gut lumen RIPK2 transduces NOD1/2 inflammatory signaling… … and RIPK2 activation amplifies TLR inflammatory signaling Neutrophils activated by RIPK2 continue breakdown of epithelial barrier Neutrophil RIPK2 Epithelium Blood vessel Tulisokibart Duvakitug Fibroblasts/ fibrosis TL1A
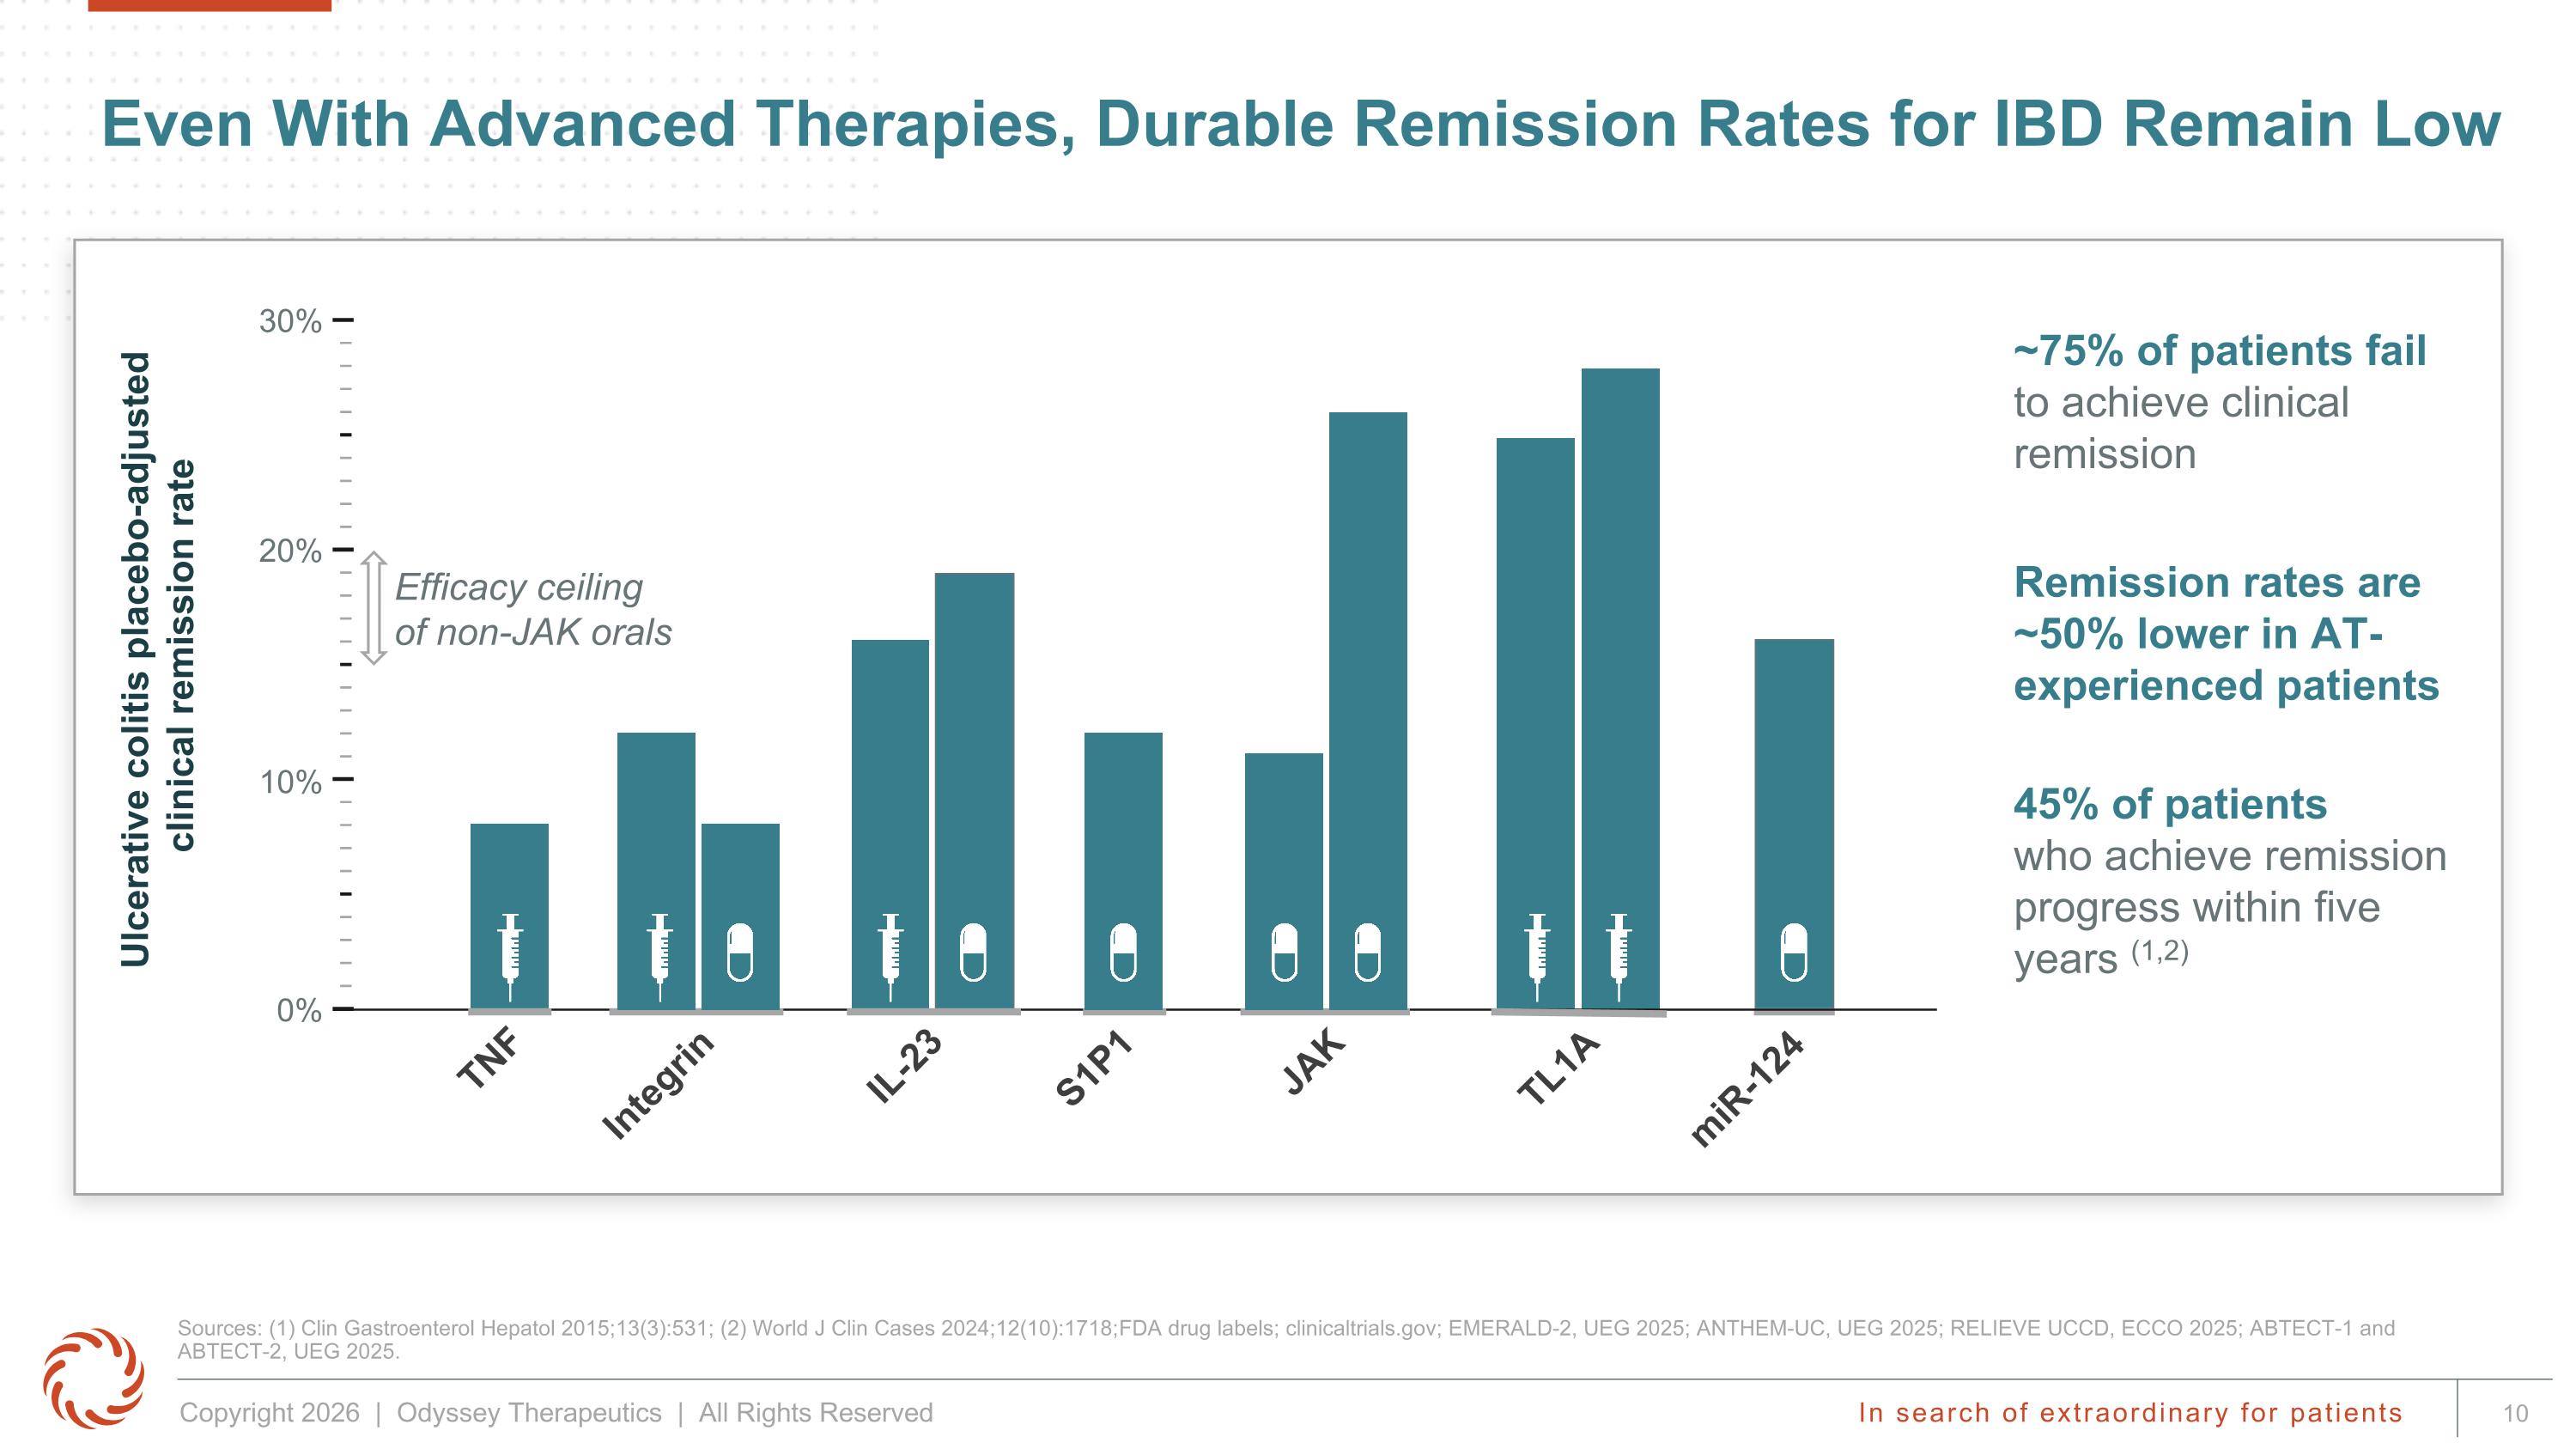
miR-124 Even With Advanced Therapies, Durable Remission Rates for IBD Remain Low Sources: (1) Clin Gastroenterol Hepatol 2015;13(3):531; (2) World J Clin Cases 2024;12(10):1718; FDA drug labels; clinicaltrials.gov; EMERALD-2, UEG 2025; ANTHEM-UC, UEG 2025; RELIEVE UCCD, ECCO 2025; ABTECT-1 and ABTECT-2, UEG 2025. ~75% of patients fail to achieve clinical remission 45% of patients who achieve remission progress within five years (1,2) TNF Integrin S1P1 JAK TL1A IL-23 0% 10% 20% 30% Efficacy ceiling of non-JAK orals Ulcerative colitis placebo-adjusted clinical remission rate Remission rates are ~50% lower in AT-experienced patients
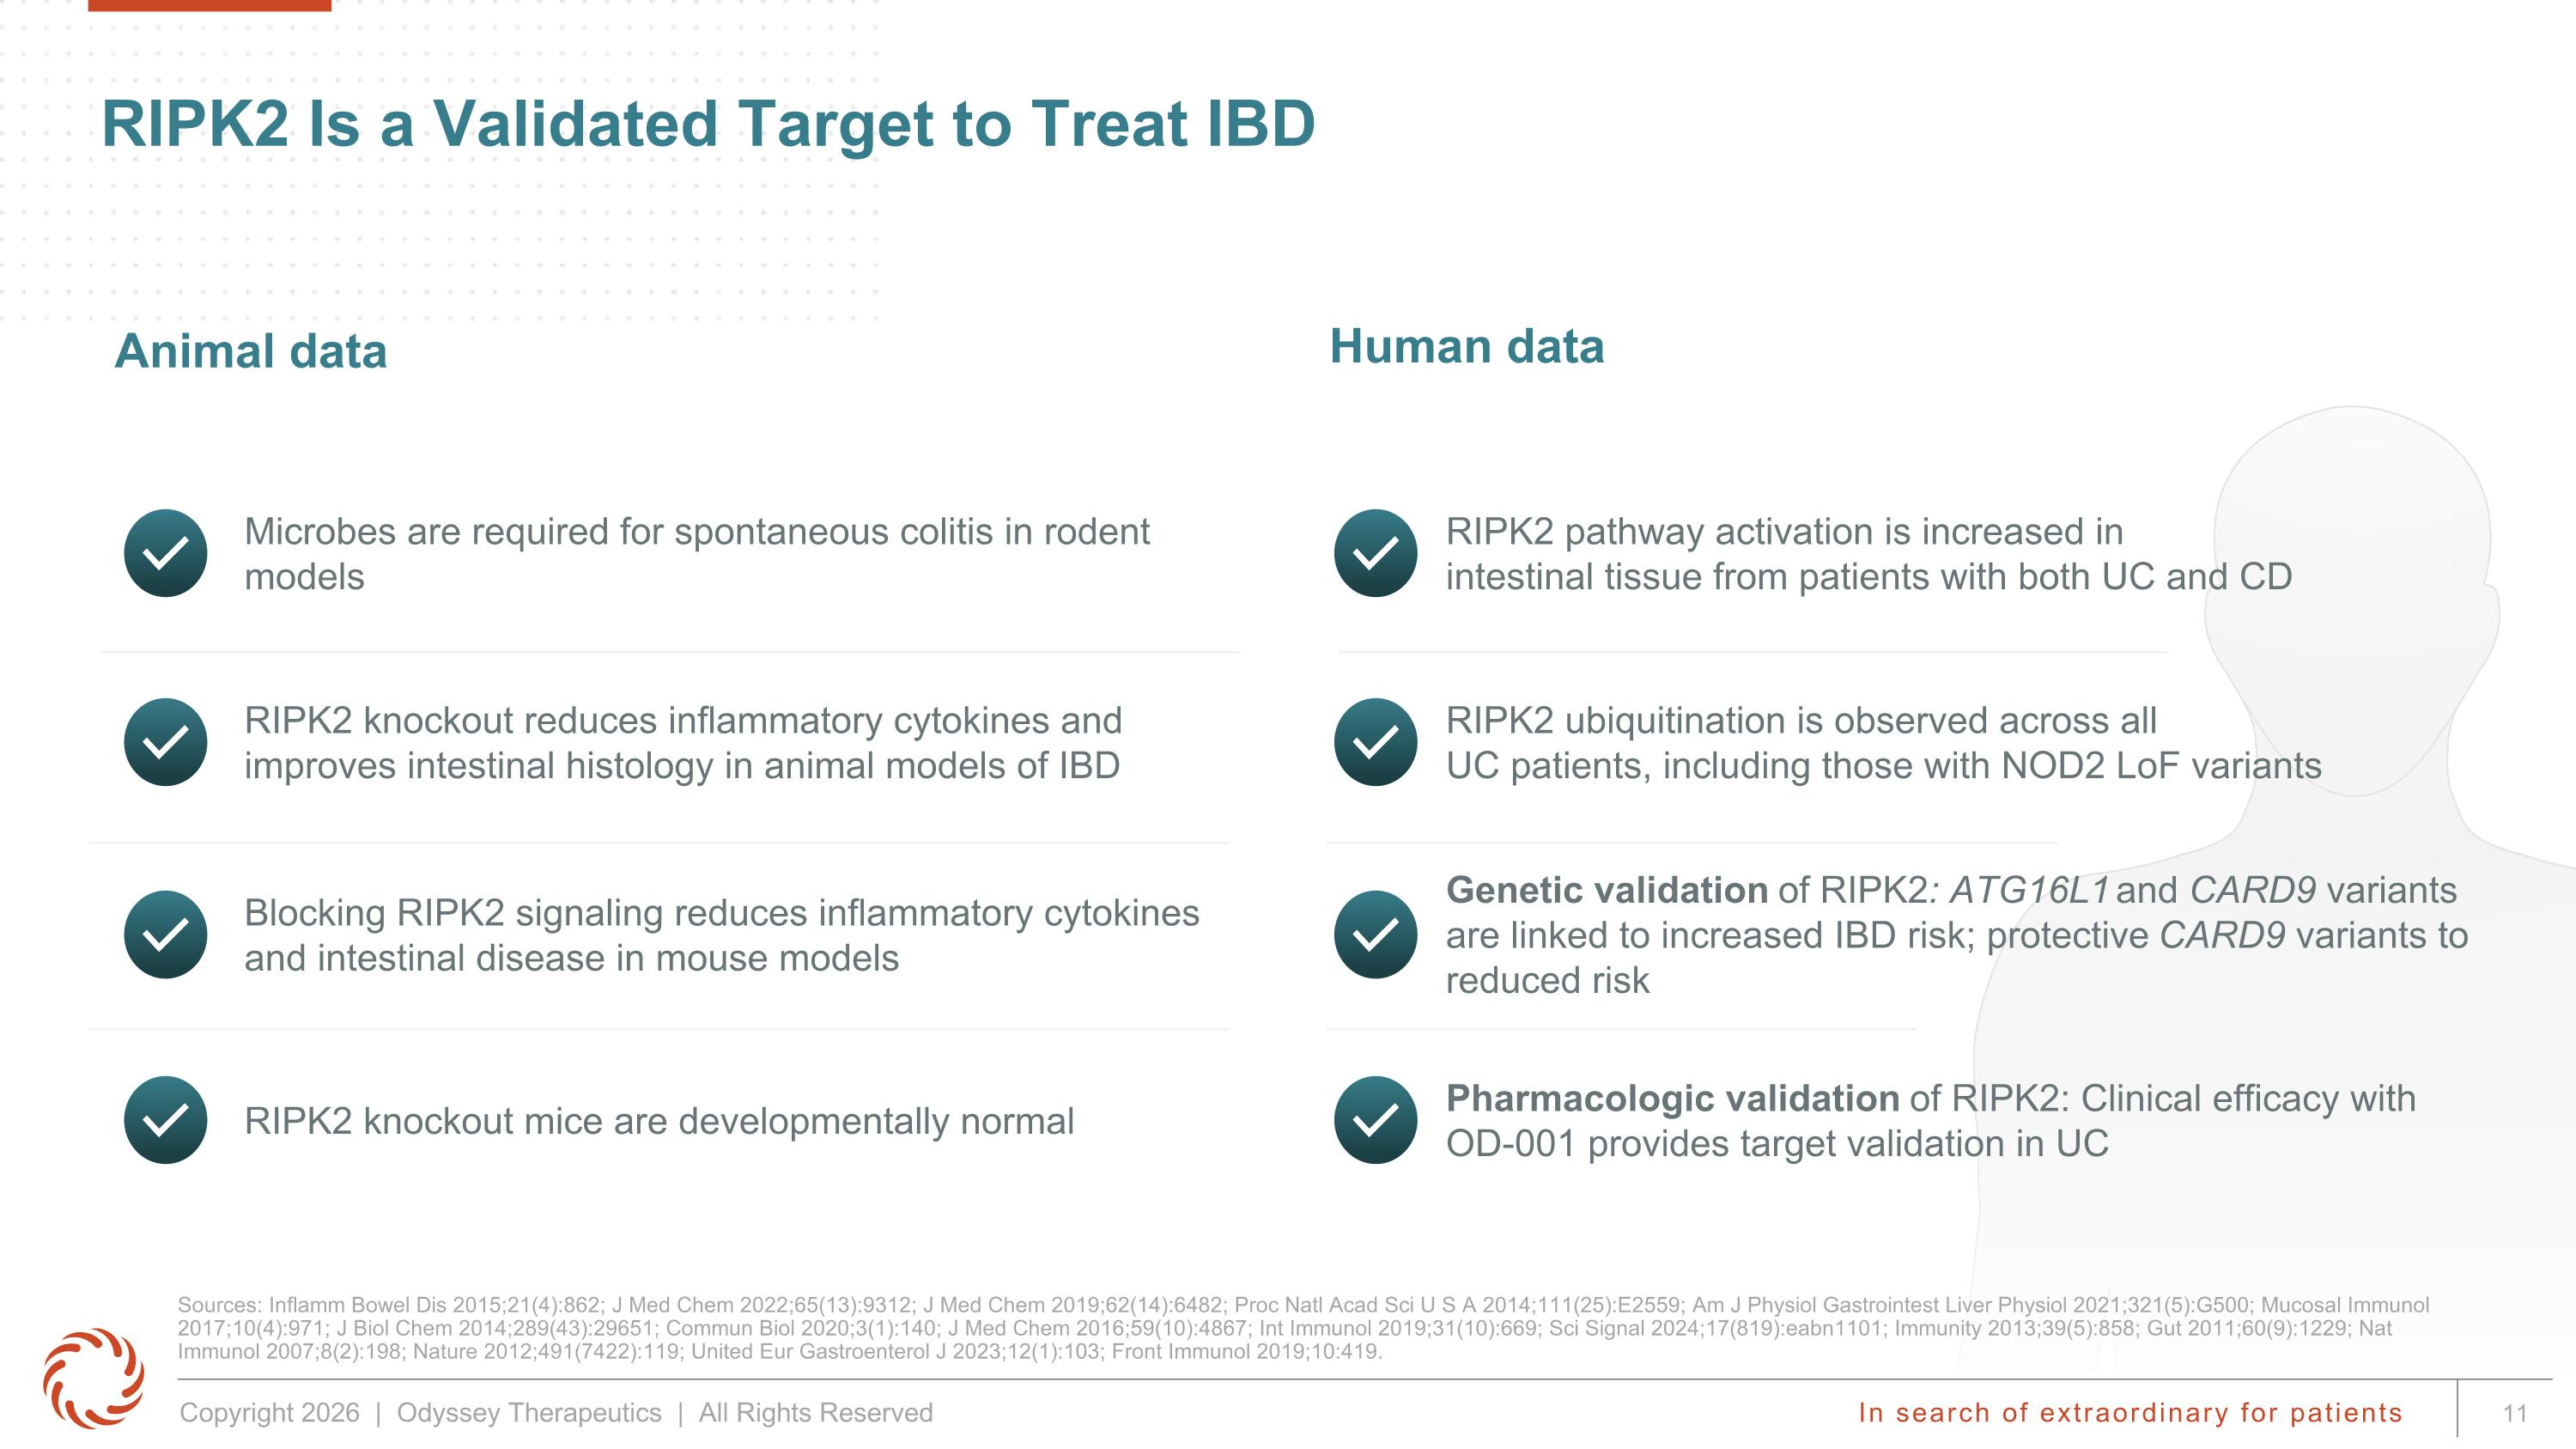
RIPK2 Is a Validated Target to Treat IBD Animal data Human data RIPK2 knockout mice are developmentally normal Pharmacologic validation of RIPK2: Clinical efficacy with OD-001 provides target validation in UC RIPK2 knockout reduces inflammatory cytokines and improves intestinal histology in animal models of IBD RIPK2 ubiquitination is observed across all UC patients, including those with NOD2 LoF variants Microbes are required for spontaneous colitis in rodent models RIPK2 pathway activation is increased in intestinal tissue from patients with both UC and CD Blocking RIPK2 signaling reduces inflammatory cytokines and intestinal disease in mouse models Genetic validation of RIPK2: ATG16L1 and CARD9 variants are linked to increased IBD risk; protective CARD9 variants to reduced risk Sources: Inflamm Bowel Dis 2015;21(4):862; J Med Chem 2022;65(13):9312; J Med Chem 2019;62(14):6482; Proc Natl Acad Sci U S A 2014;111(25):E2559; Am J Physiol Gastrointest Liver Physiol 2021;321(5):G500; Mucosal Immunol 2017;10(4):971; J Biol Chem 2014;289(43):29651; Commun Biol 2020;3(1):140; J Med Chem 2016;59(10):4867; Int Immunol 2019;31(10):669; Sci Signal 2024;17(819):eabn1101; Immunity 2013;39(5):858; Gut 2011;60(9):1229; Nat Immunol 2007;8(2):198; Nature 2012;491(7422):119; United Eur Gastroenterol J 2023;12(1):103; Front Immunol 2019;10:419.
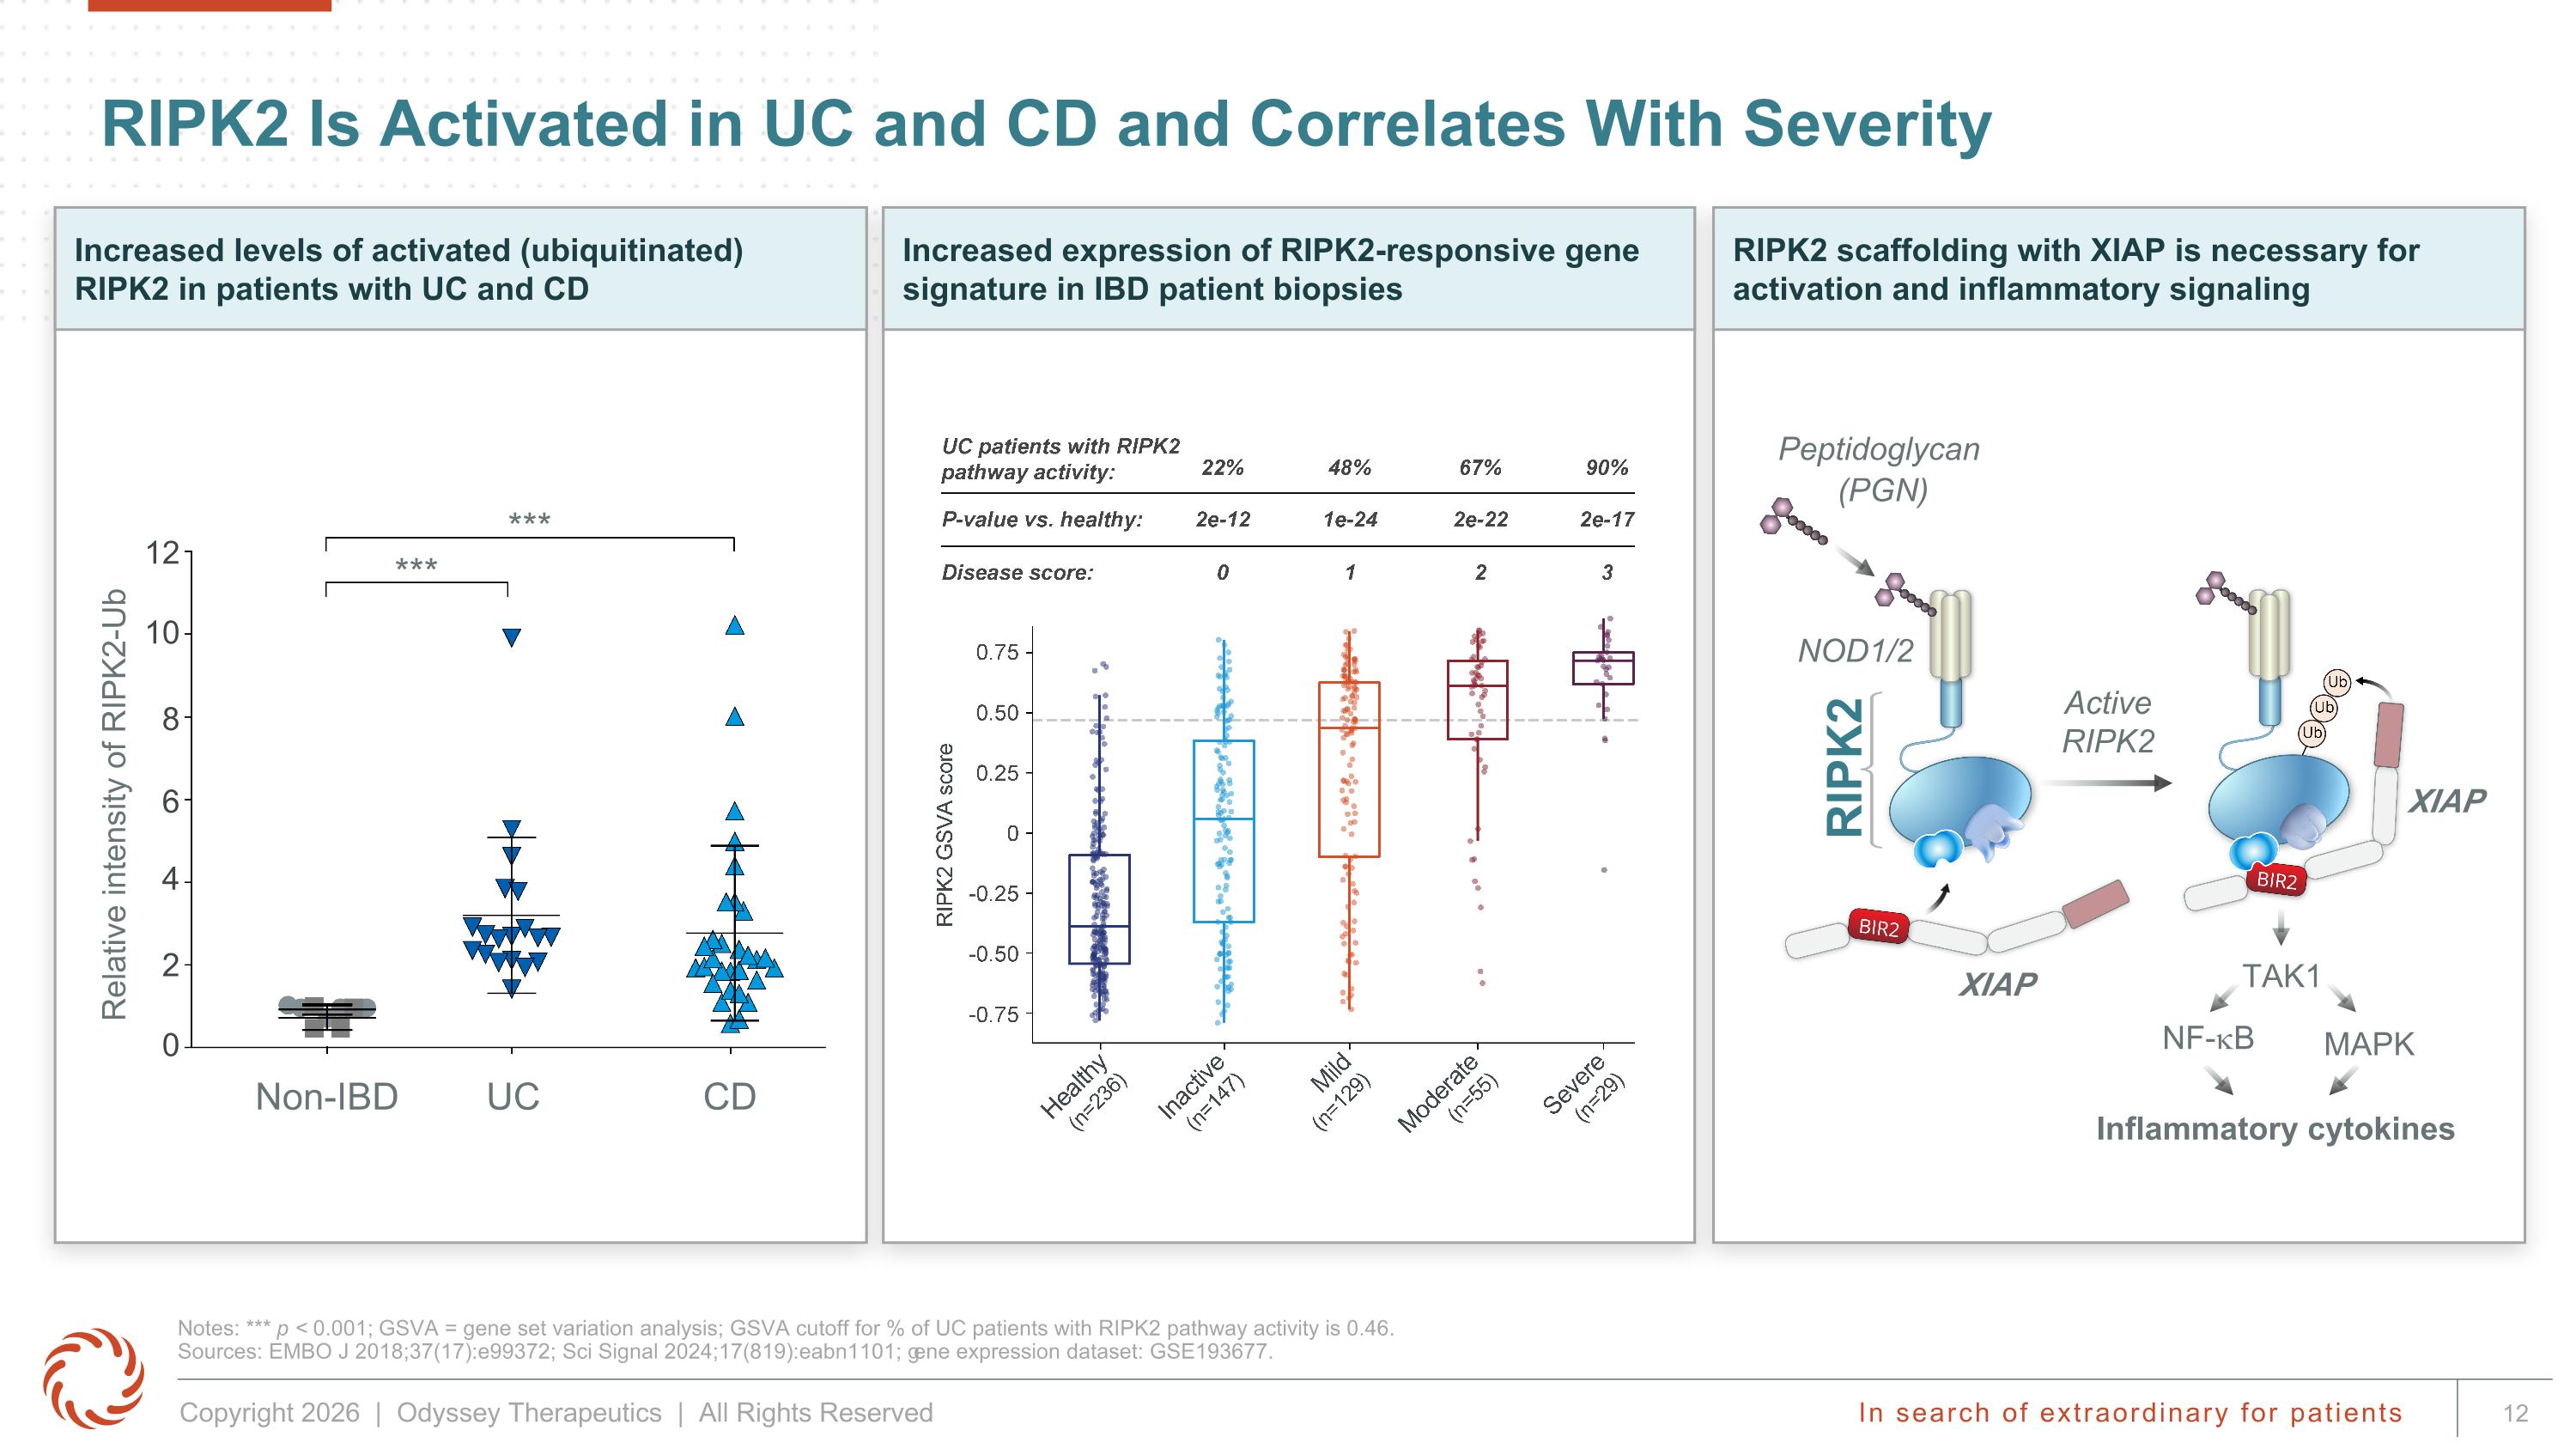
Increased expression of RIPK2-responsive gene signature in IBD patient biopsies RIPK2 Is Activated in UC and CD and Correlates With Severity Notes: *** p < 0.001; GSVA = gene set variation analysis; GSVA cutoff for % of UC patients with RIPK2 pathway activity is 0.46. Sources: EMBO J 2018;37(17):e99372; Sci Signal 2024;17(819):eabn1101; gene expression dataset: GSE193677. Increased levels of activated (ubiquitinated) RIPK2 in patients with UC and CD Relative intensity of RIPK2-Ub Non-IBD UC CD 12 10 8 6 4 2 0 *** *** RIPK2 Inflammatory cytokines NF-kB MAPK TAK1 XIAP Active RIPK2 NOD1/2 Peptidoglycan (PGN) XIAP XIAP RIPK2 scaffolding with XIAP is necessary for activation and inflammatory signaling
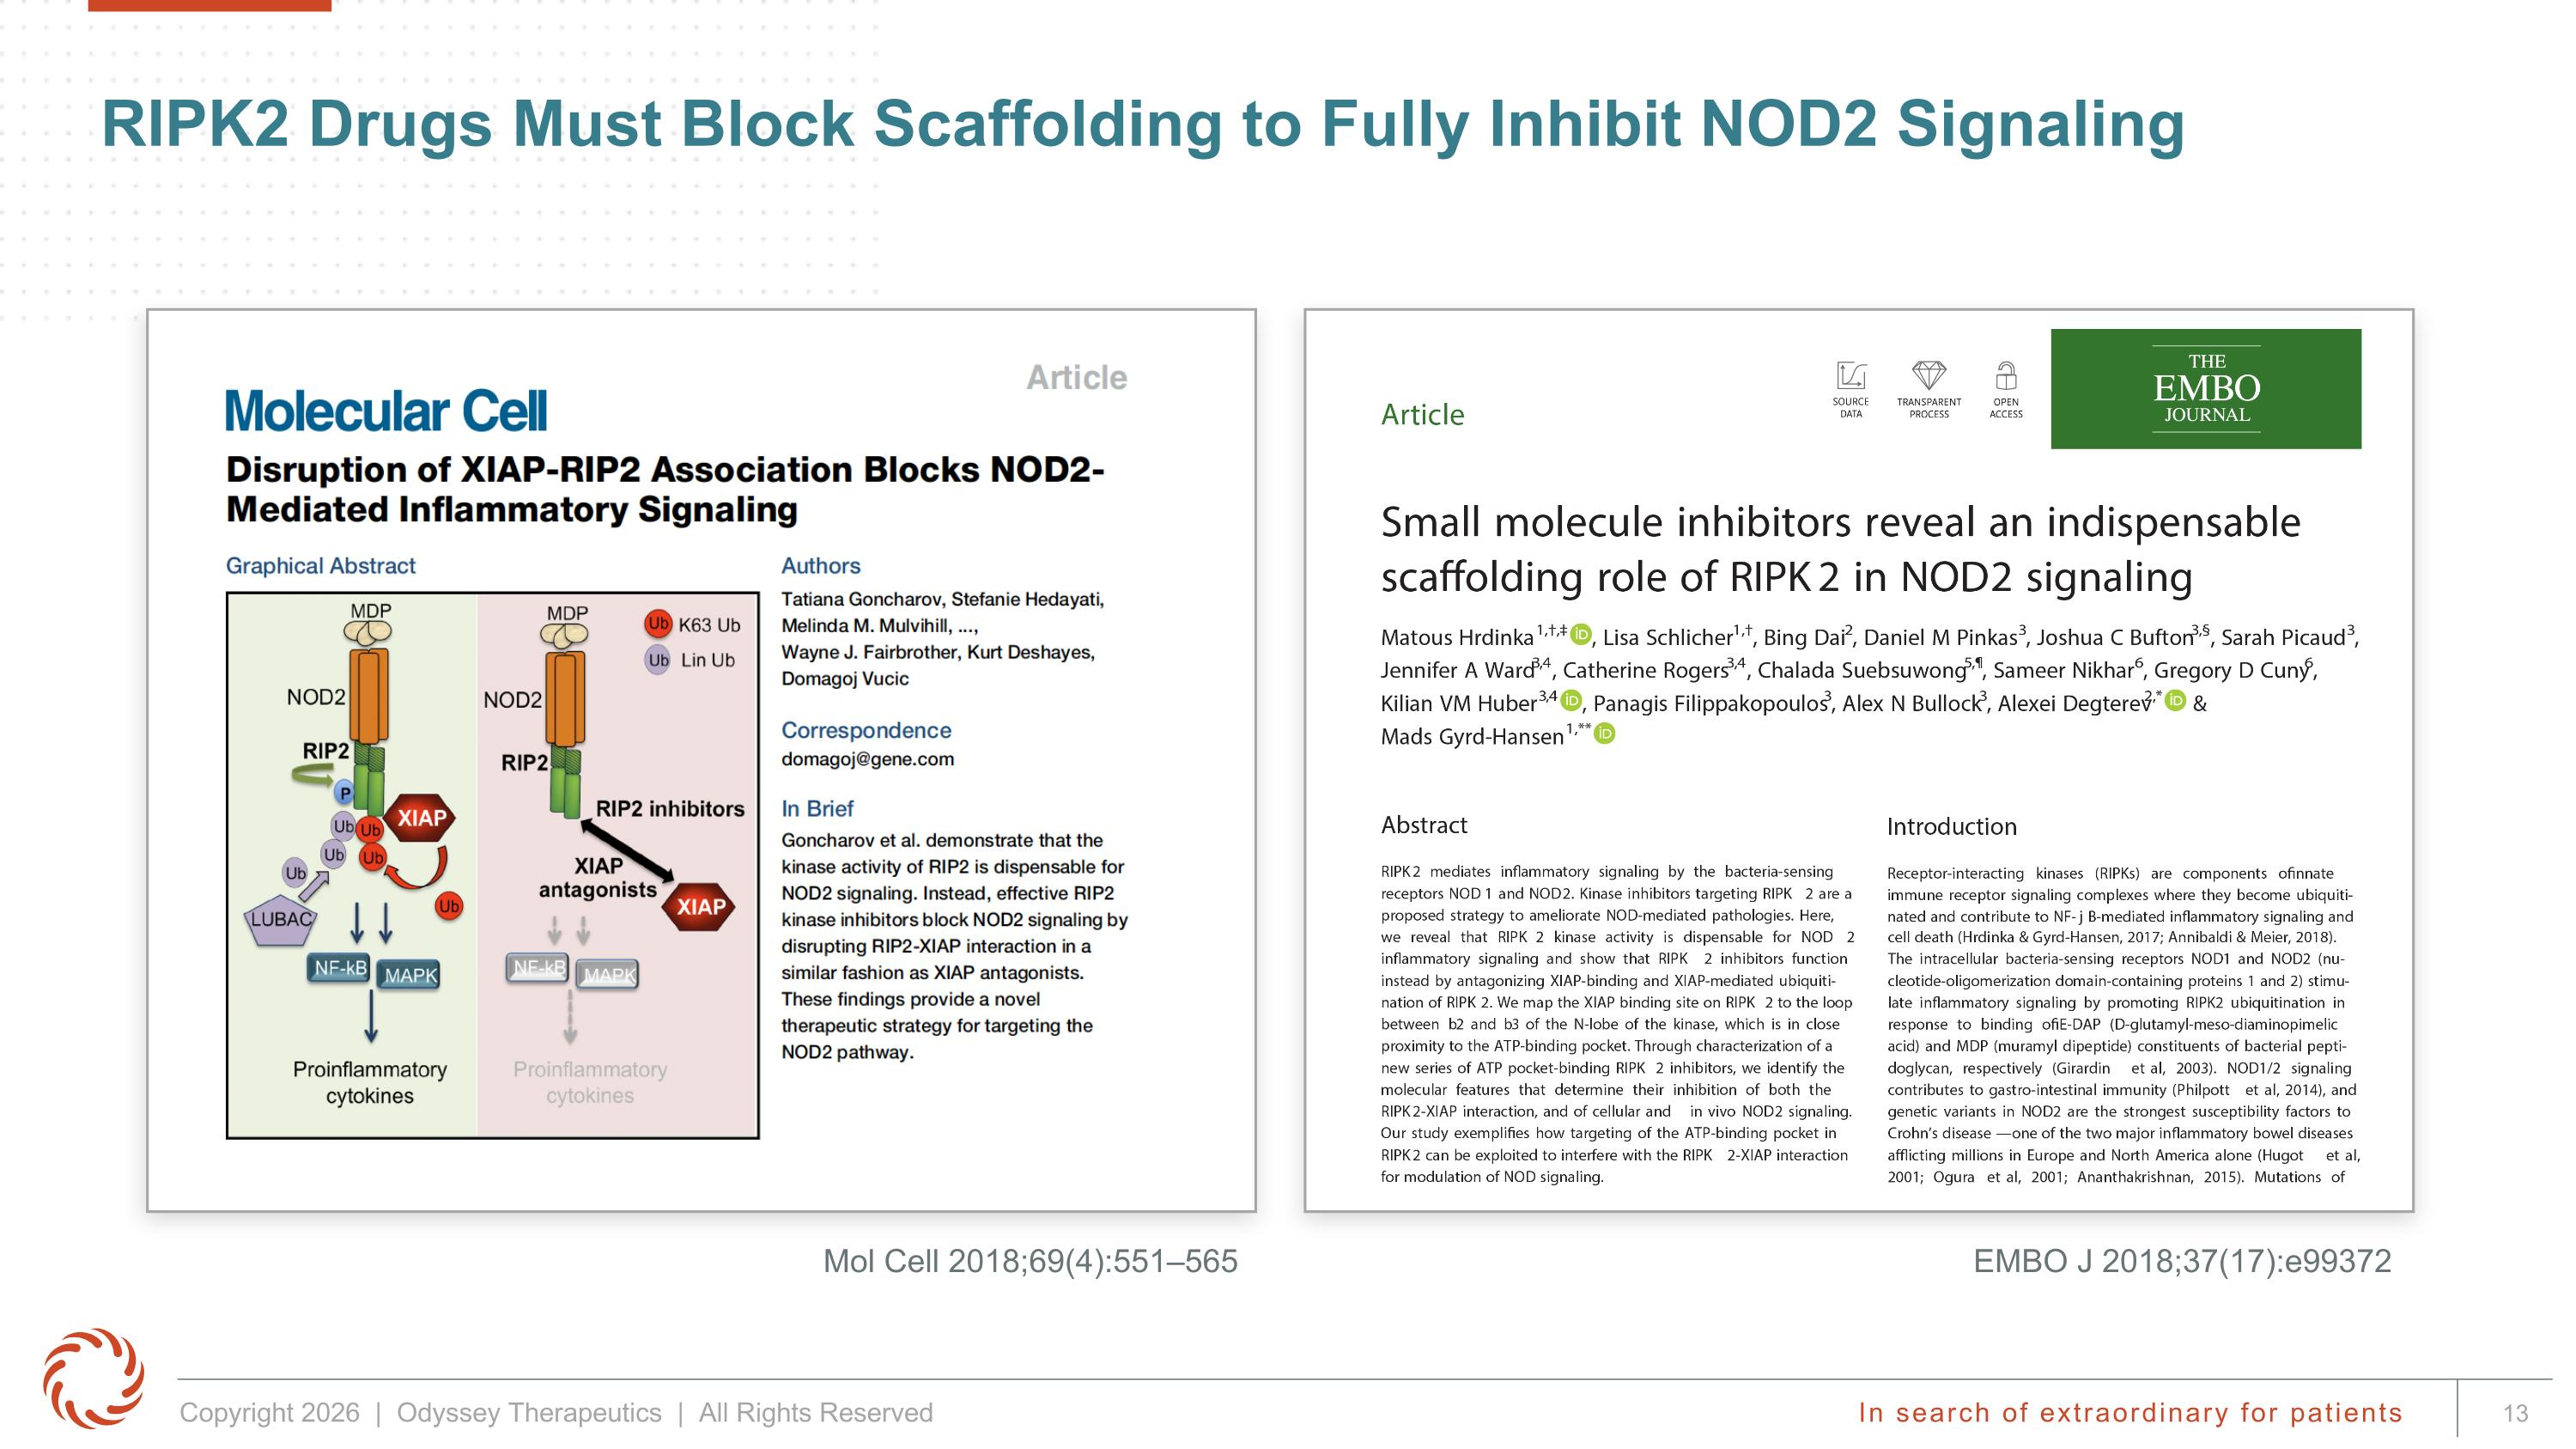
RIPK2 Drugs Must Block Scaffolding to Fully Inhibit NOD2 Signaling Mol Cell 2018;69(4):551–565 EMBO J 2018;37(17):e99372
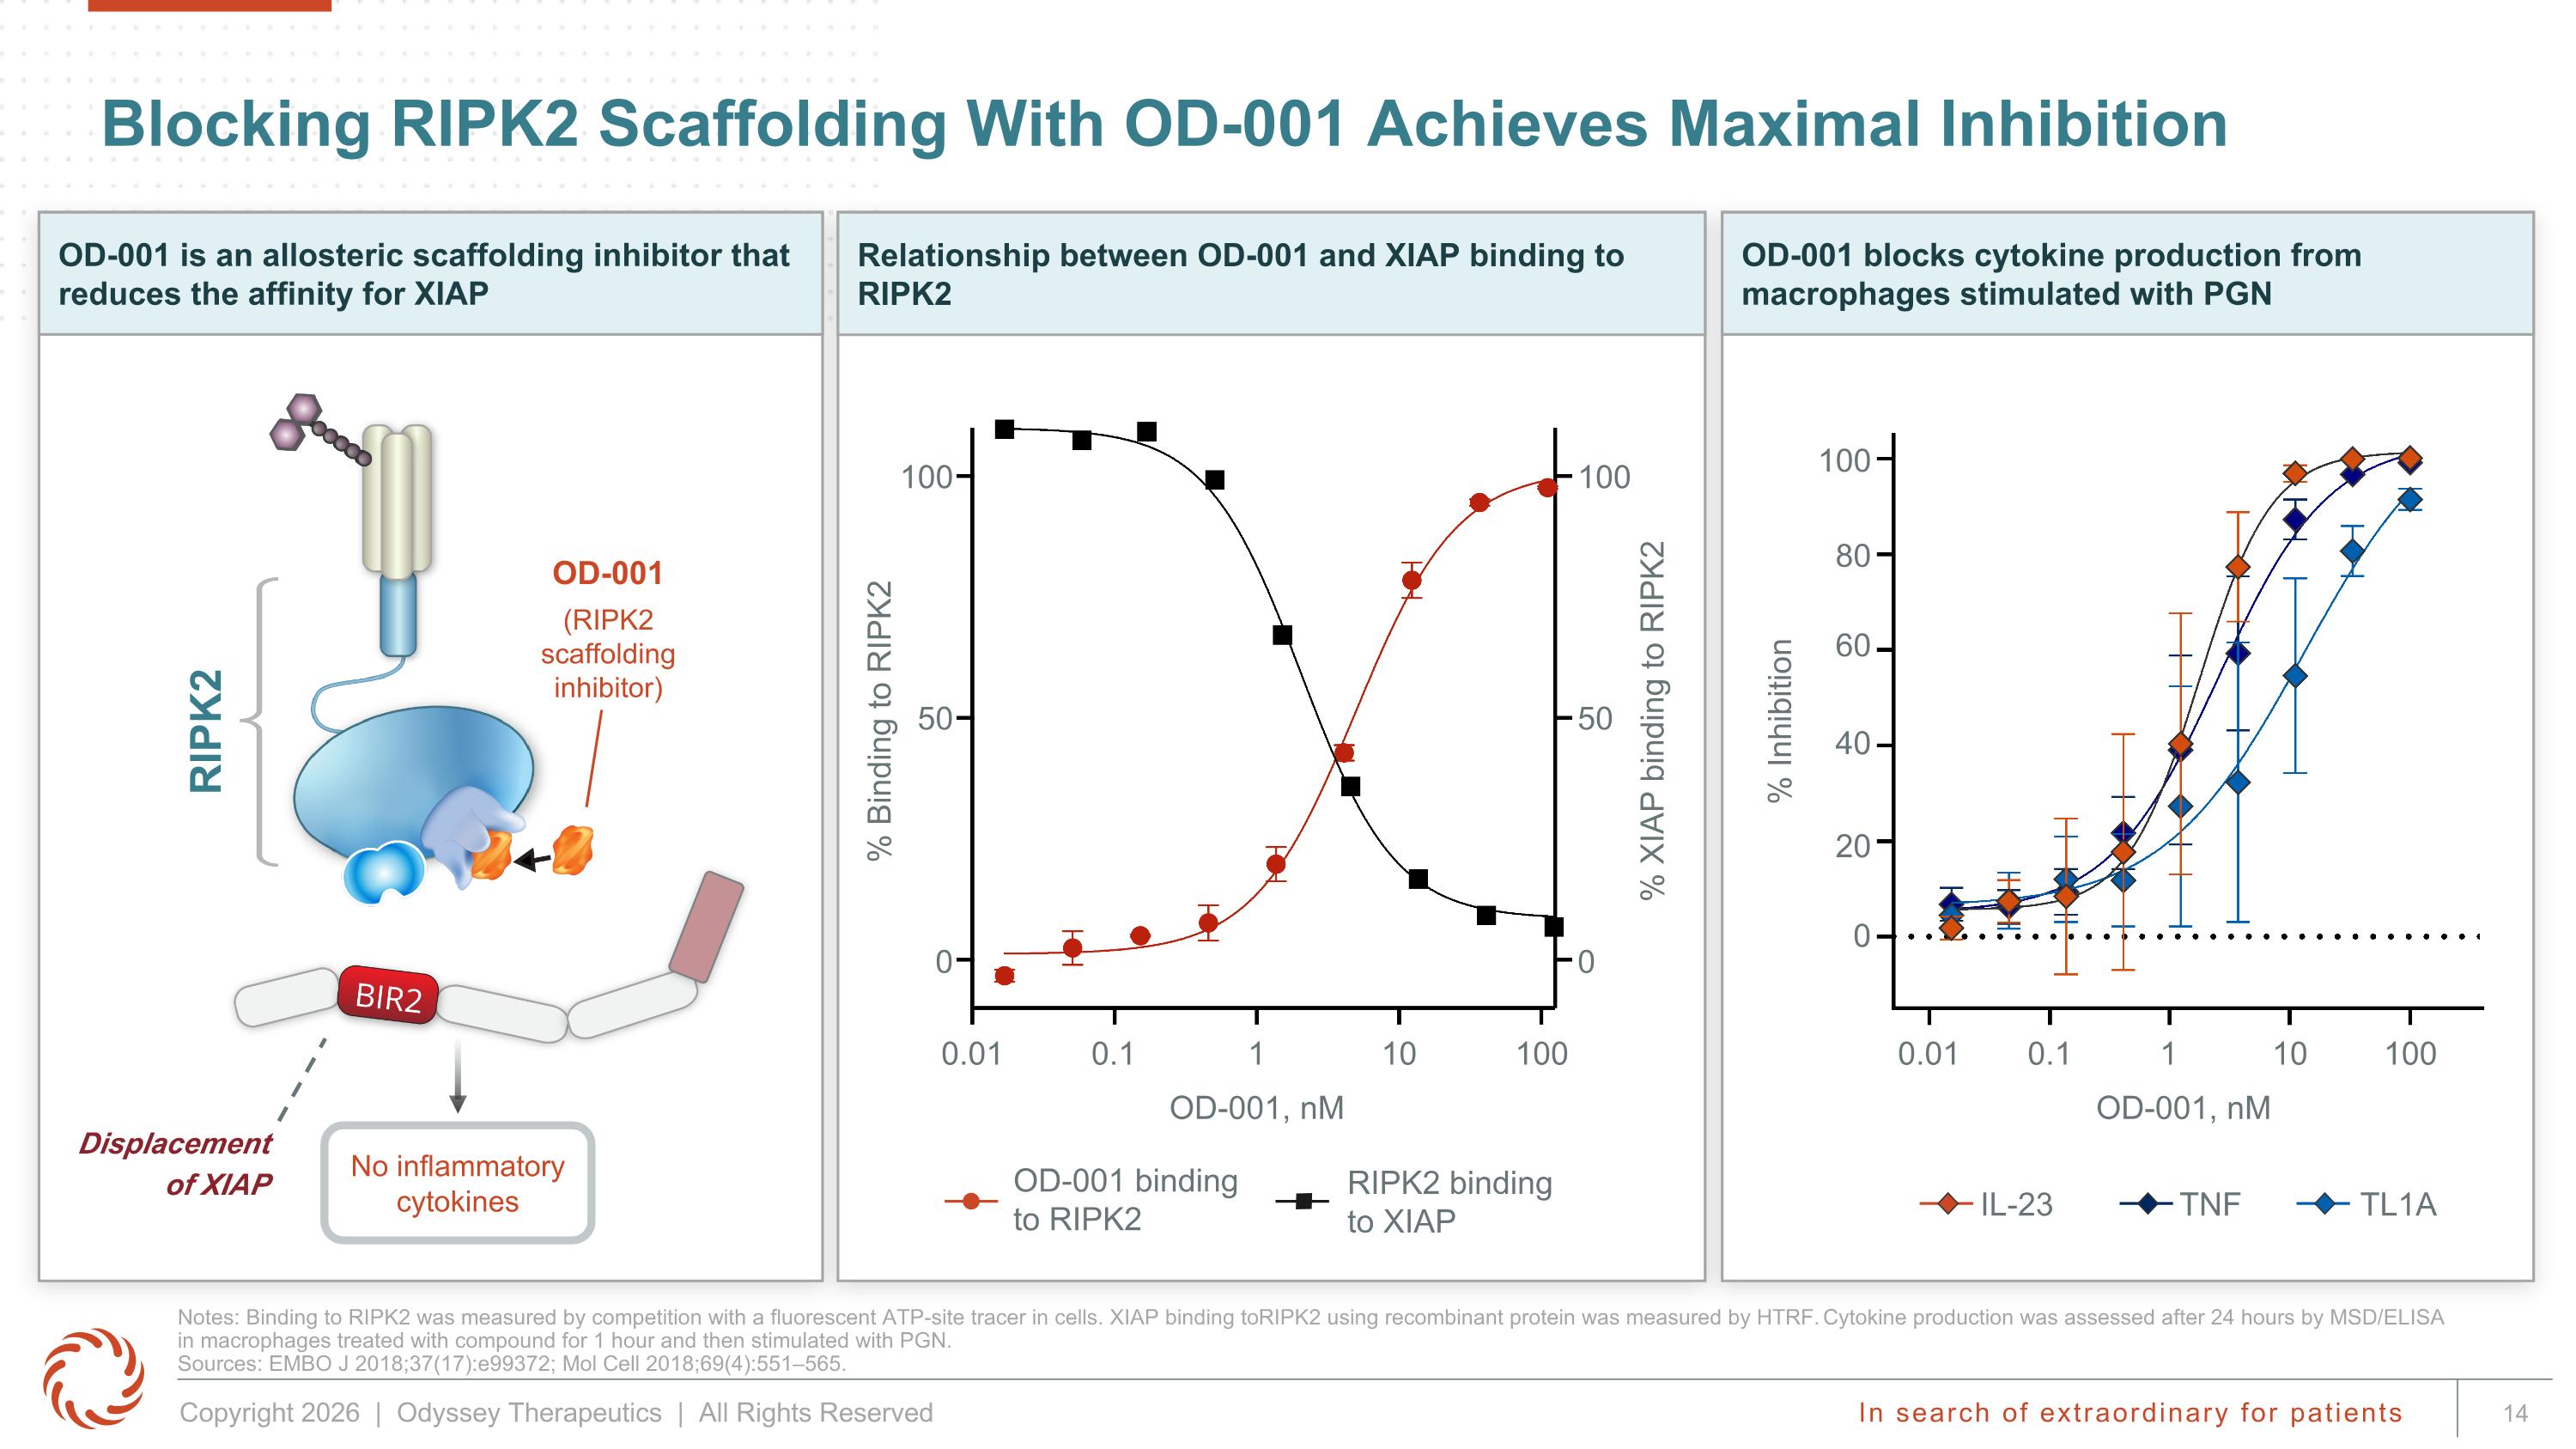
Blocking RIPK2 Scaffolding With OD-001 Achieves Maximal Inhibition Notes: Binding to RIPK2 was measured by competition with a fluorescent ATP-site tracer in cells. XIAP binding to RIPK2 using recombinant protein was measured by HTRF. Cytokine production was assessed after 24 hours by MSD/ELISA in macrophages treated with compound for 1 hour and then stimulated with PGN. Sources: EMBO J 2018;37(17):e99372; Mol Cell 2018;69(4):551–565. OD-001 blocks cytokine production from macrophages stimulated with PGN % Inhibition OD-001, nM 0.01 0.1 1 10 100 0 20 40 60 80 100 % Binding to RIPK2 % XIAP binding to RIPK2 OD-001, nM IL-23 TNF TL1A Relationship between OD-001 and XIAP binding to RIPK2 RIPK2 binding to XIAP OD-001 binding to RIPK2 0.01 0.1 1 10 100 0 100 50 0 100 50 OD-001 is an allosteric scaffolding inhibitor that reduces the affinity for XIAP Displacement of XIAP OD-001 (RIPK2 scaffolding inhibitor) RIPK2 No inflammatory cytokines
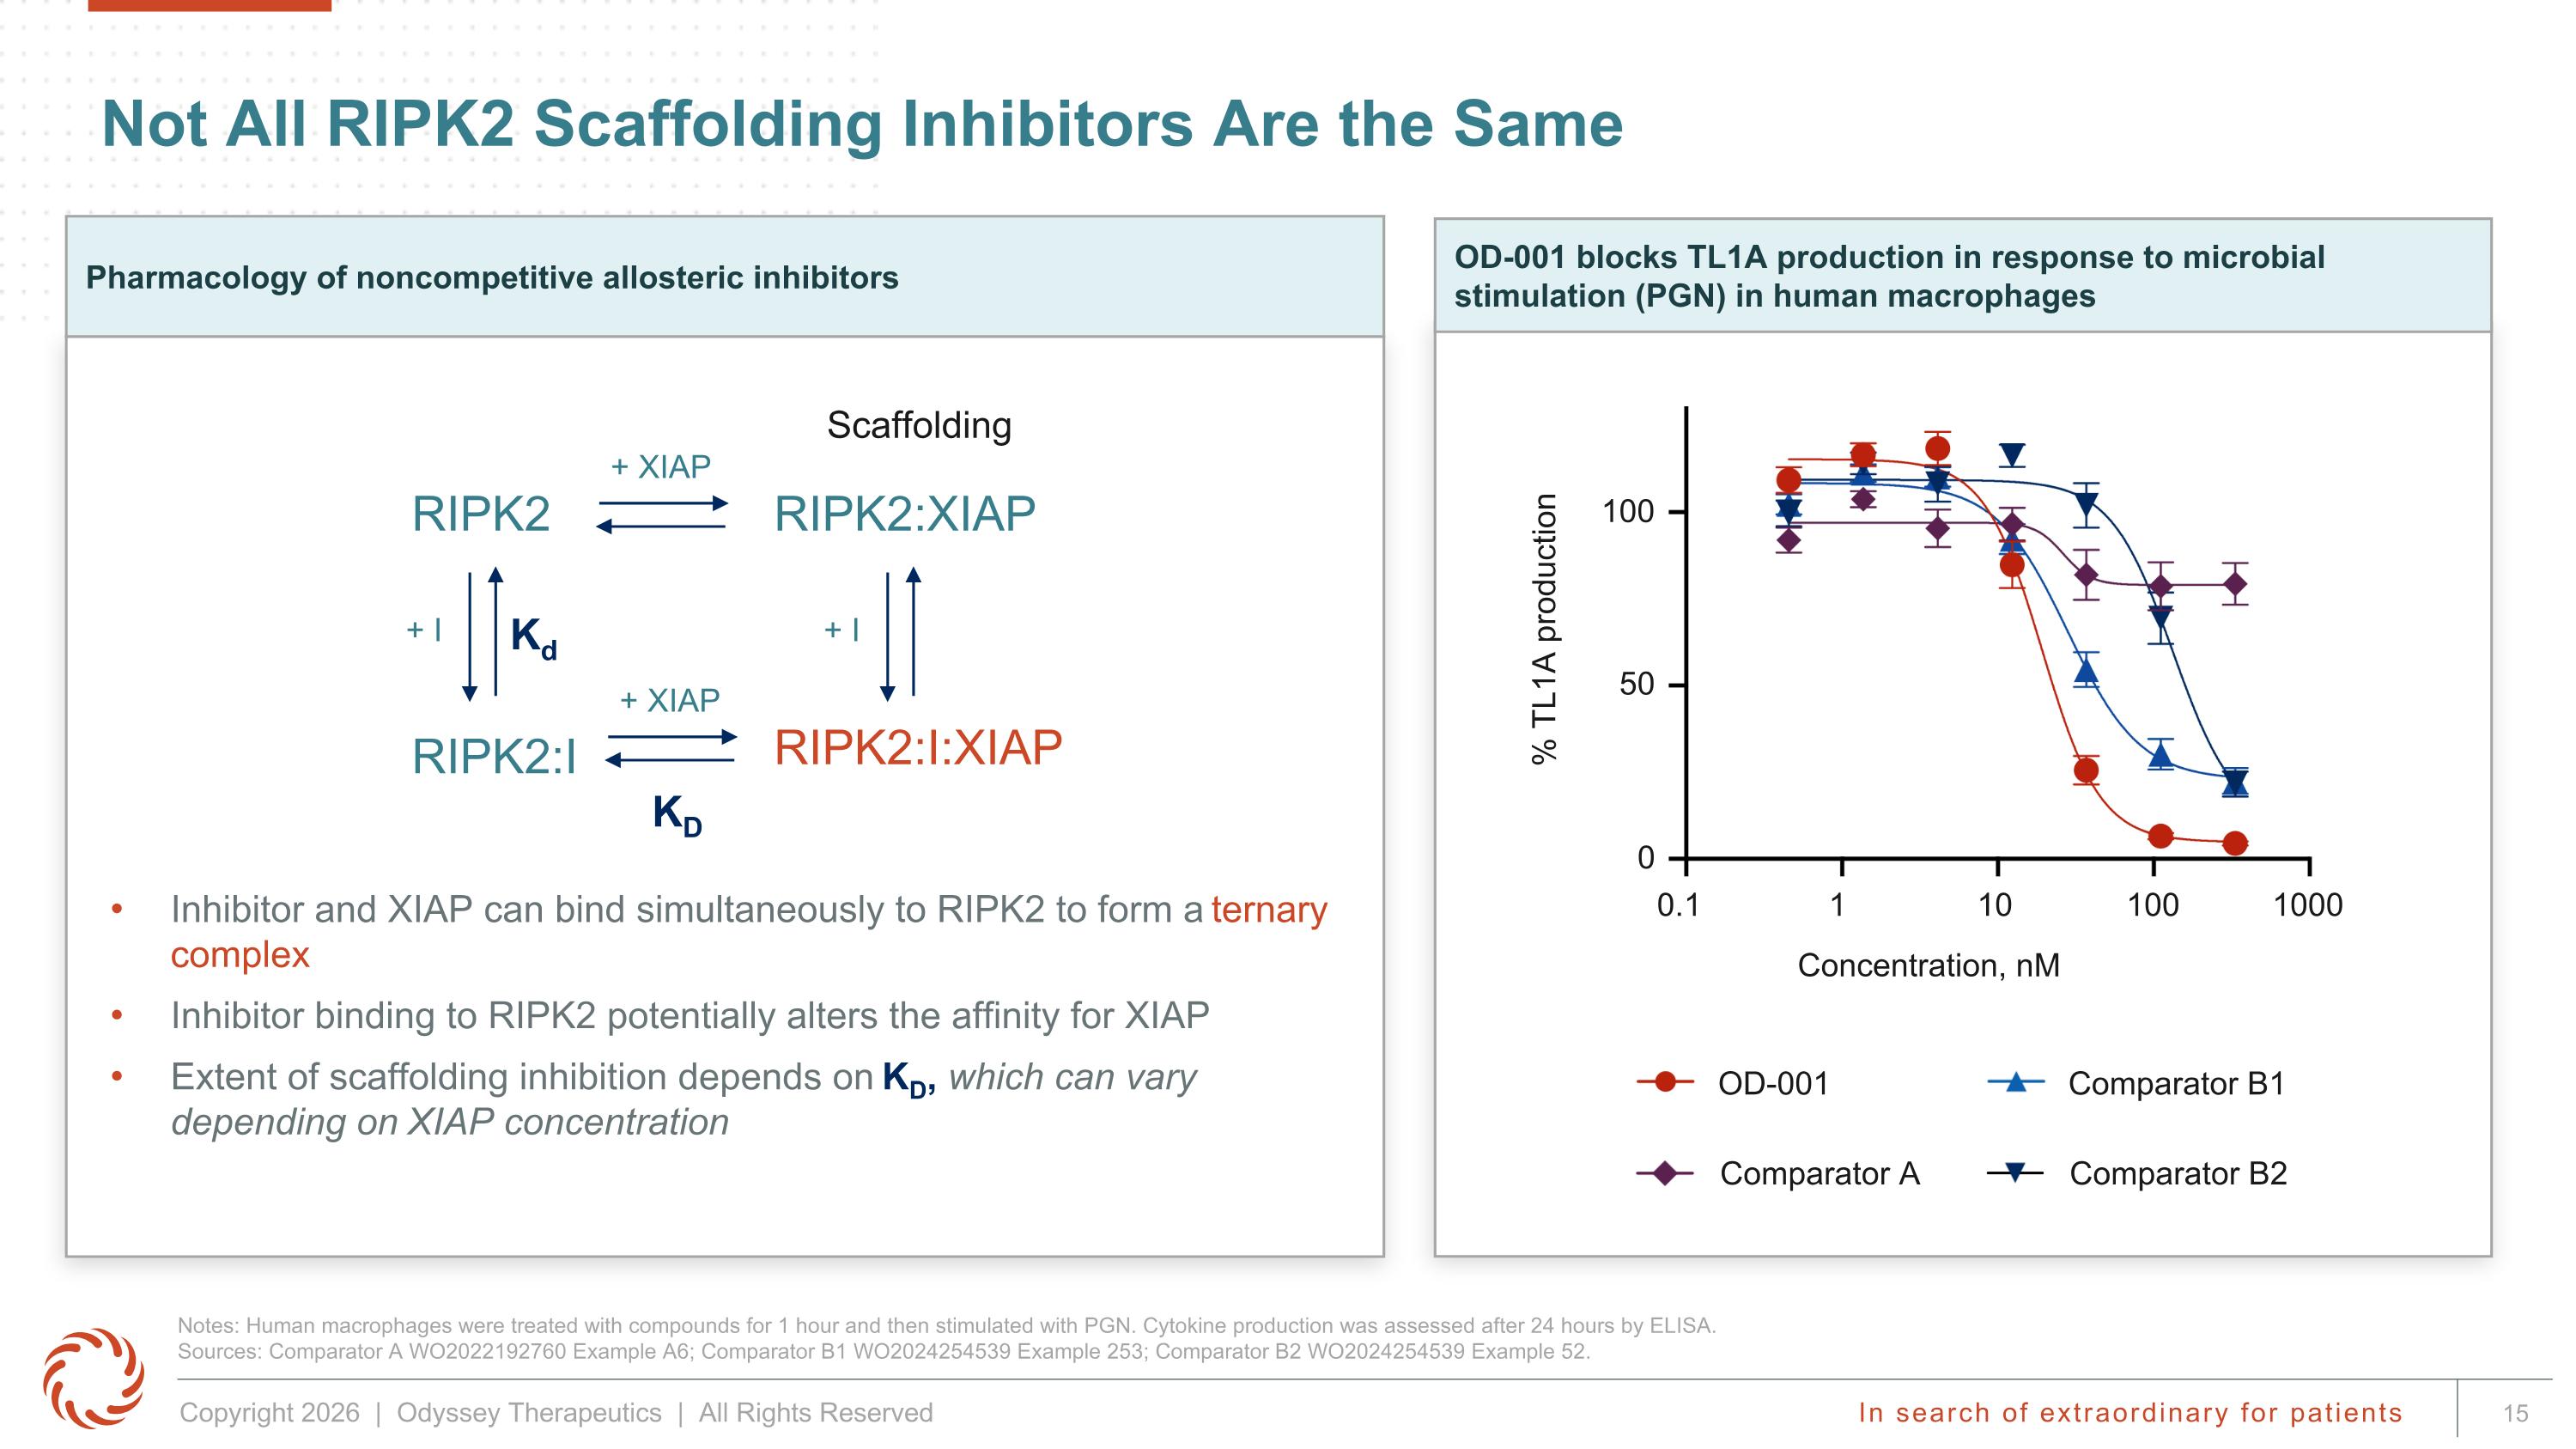
Not All RIPK2 Scaffolding Inhibitors Are the Same OD-001 blocks TL1A production in response to microbial stimulation (PGN) in human macrophages Pharmacology of noncompetitive allosteric inhibitors Inhibitor and XIAP can bind simultaneously to RIPK2 to form a ternary complex Inhibitor binding to RIPK2 potentially alters the affinity for XIAP Extent of scaffolding inhibition depends on KD, which can vary depending on XIAP concentration RIPK2 RIPK2:XIAP RIPK2:I + XIAP + I RIPK2:I:XIAP + XIAP + I KD Scaffolding Kd OD-001 Comparator B1 Comparator A Comparator B2 % TL1A production Concentration, nM 1000 100 0.1 1 10 100 0 50 Notes: Human macrophages were treated with compounds for 1 hour and then stimulated with PGN. Cytokine production was assessed after 24 hours by ELISA. Sources: Comparator A WO2022192760 Example A6; Comparator B1 WO2024254539 Example 253; Comparator B2 WO2024254539 Example 52.
Phase 2a Monotherapy Trial Results
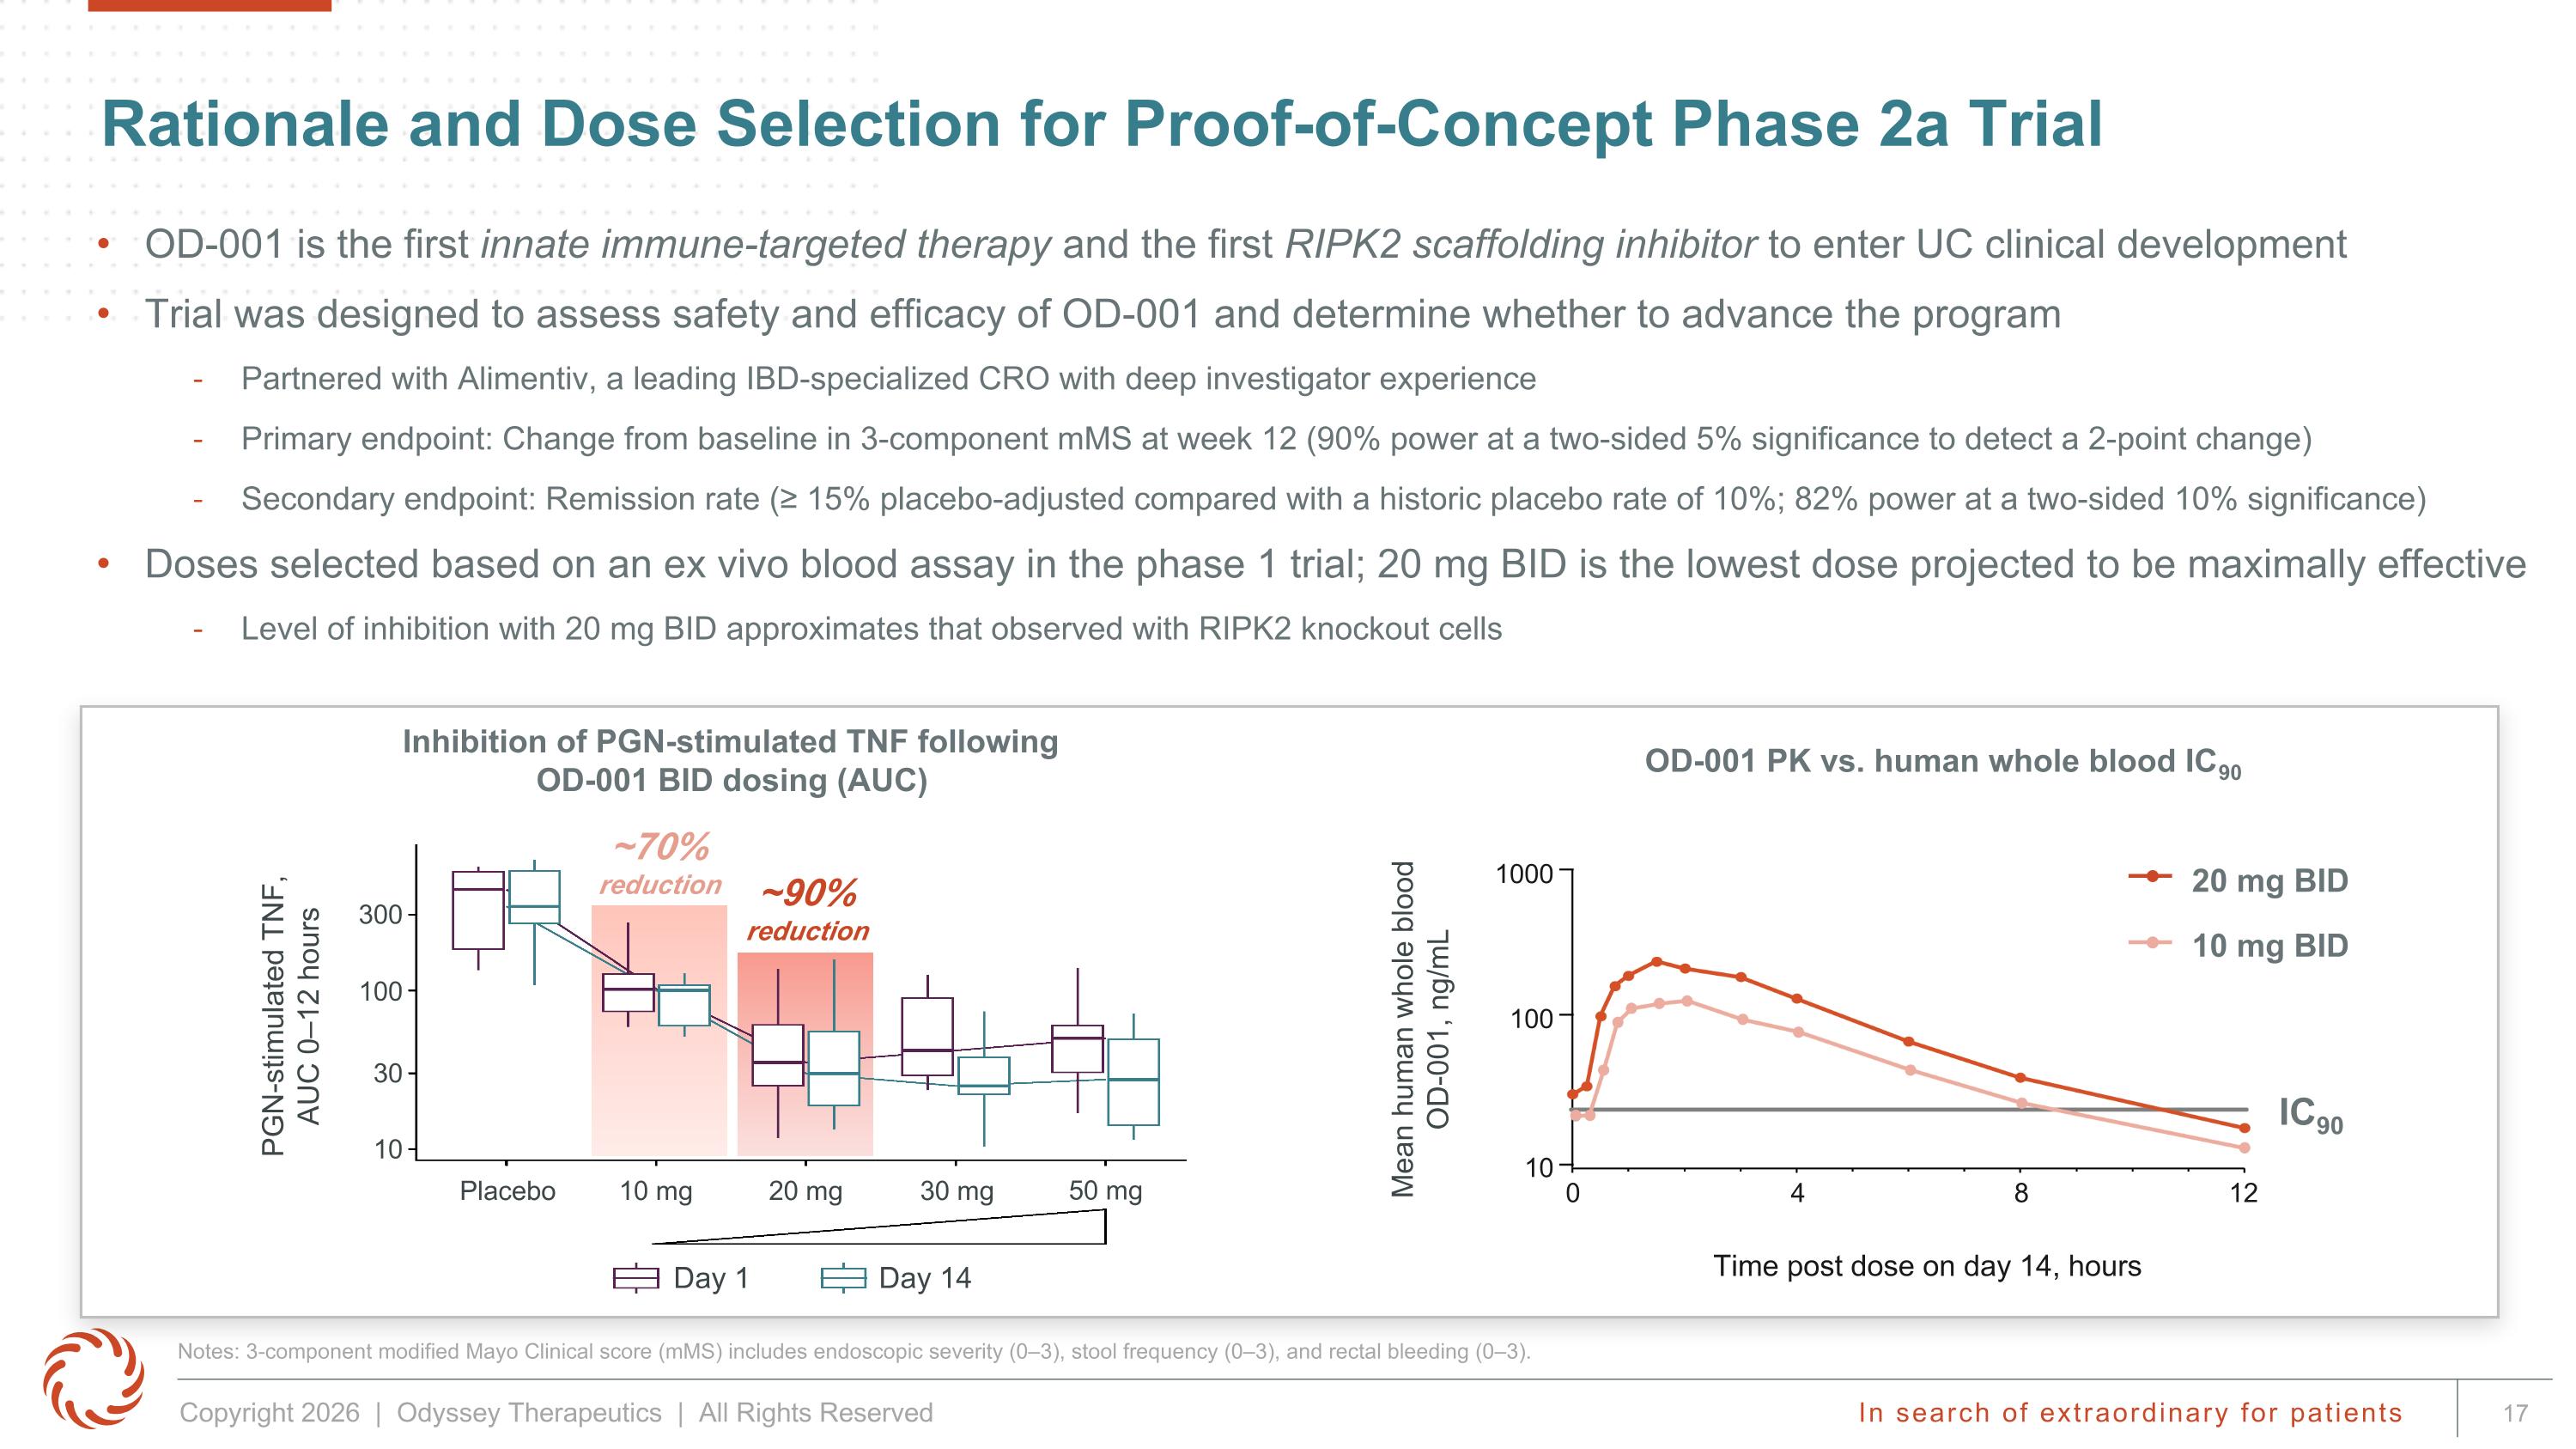
Rationale and Dose Selection for Proof-of-Concept Phase 2a Trial OD-001 is the first innate immune-targeted therapy and the first RIPK2 scaffolding inhibitor to enter UC clinical development Trial was designed to assess safety and efficacy of OD-001 and determine whether to advance the program Partnered with Alimentiv, a leading IBD-specialized CRO with deep investigator experience Primary endpoint: Change from baseline in 3-component mMS at week 12 (90% power at a two-sided 5% significance to detect a 2-point change) Secondary endpoint: Remission rate (≥ 15% placebo-adjusted compared with a historic placebo rate of 10%; 82% power at a two-sided 10% significance) Doses selected based on an ex vivo blood assay in the phase 1 trial; 20 mg BID is the lowest dose projected to be maximally effective Level of inhibition with 20 mg BID approximates that observed with RIPK2 knockout cells IC90 Time post dose on day 14, hours 1000 100 10 0 4 8 12 OD-001 PK vs. human whole blood IC90 10 mg BID 20 mg BID Inhibition of PGN-stimulated TNF following OD-001 BID dosing (AUC) Day 1 Day 14 Placebo 10 mg 20 mg 30 mg 50 mg 10 30 100 300 Mean human whole blood OD-001, ng/mL ~70% reduction ~90% reduction PGN-stimulated TNF, AUC 0–12 hours Notes: 3-component modified Mayo Clinical score (mMS) includes endoscopic severity (0–3), stool frequency (0–3), and rectal bleeding (0–3).
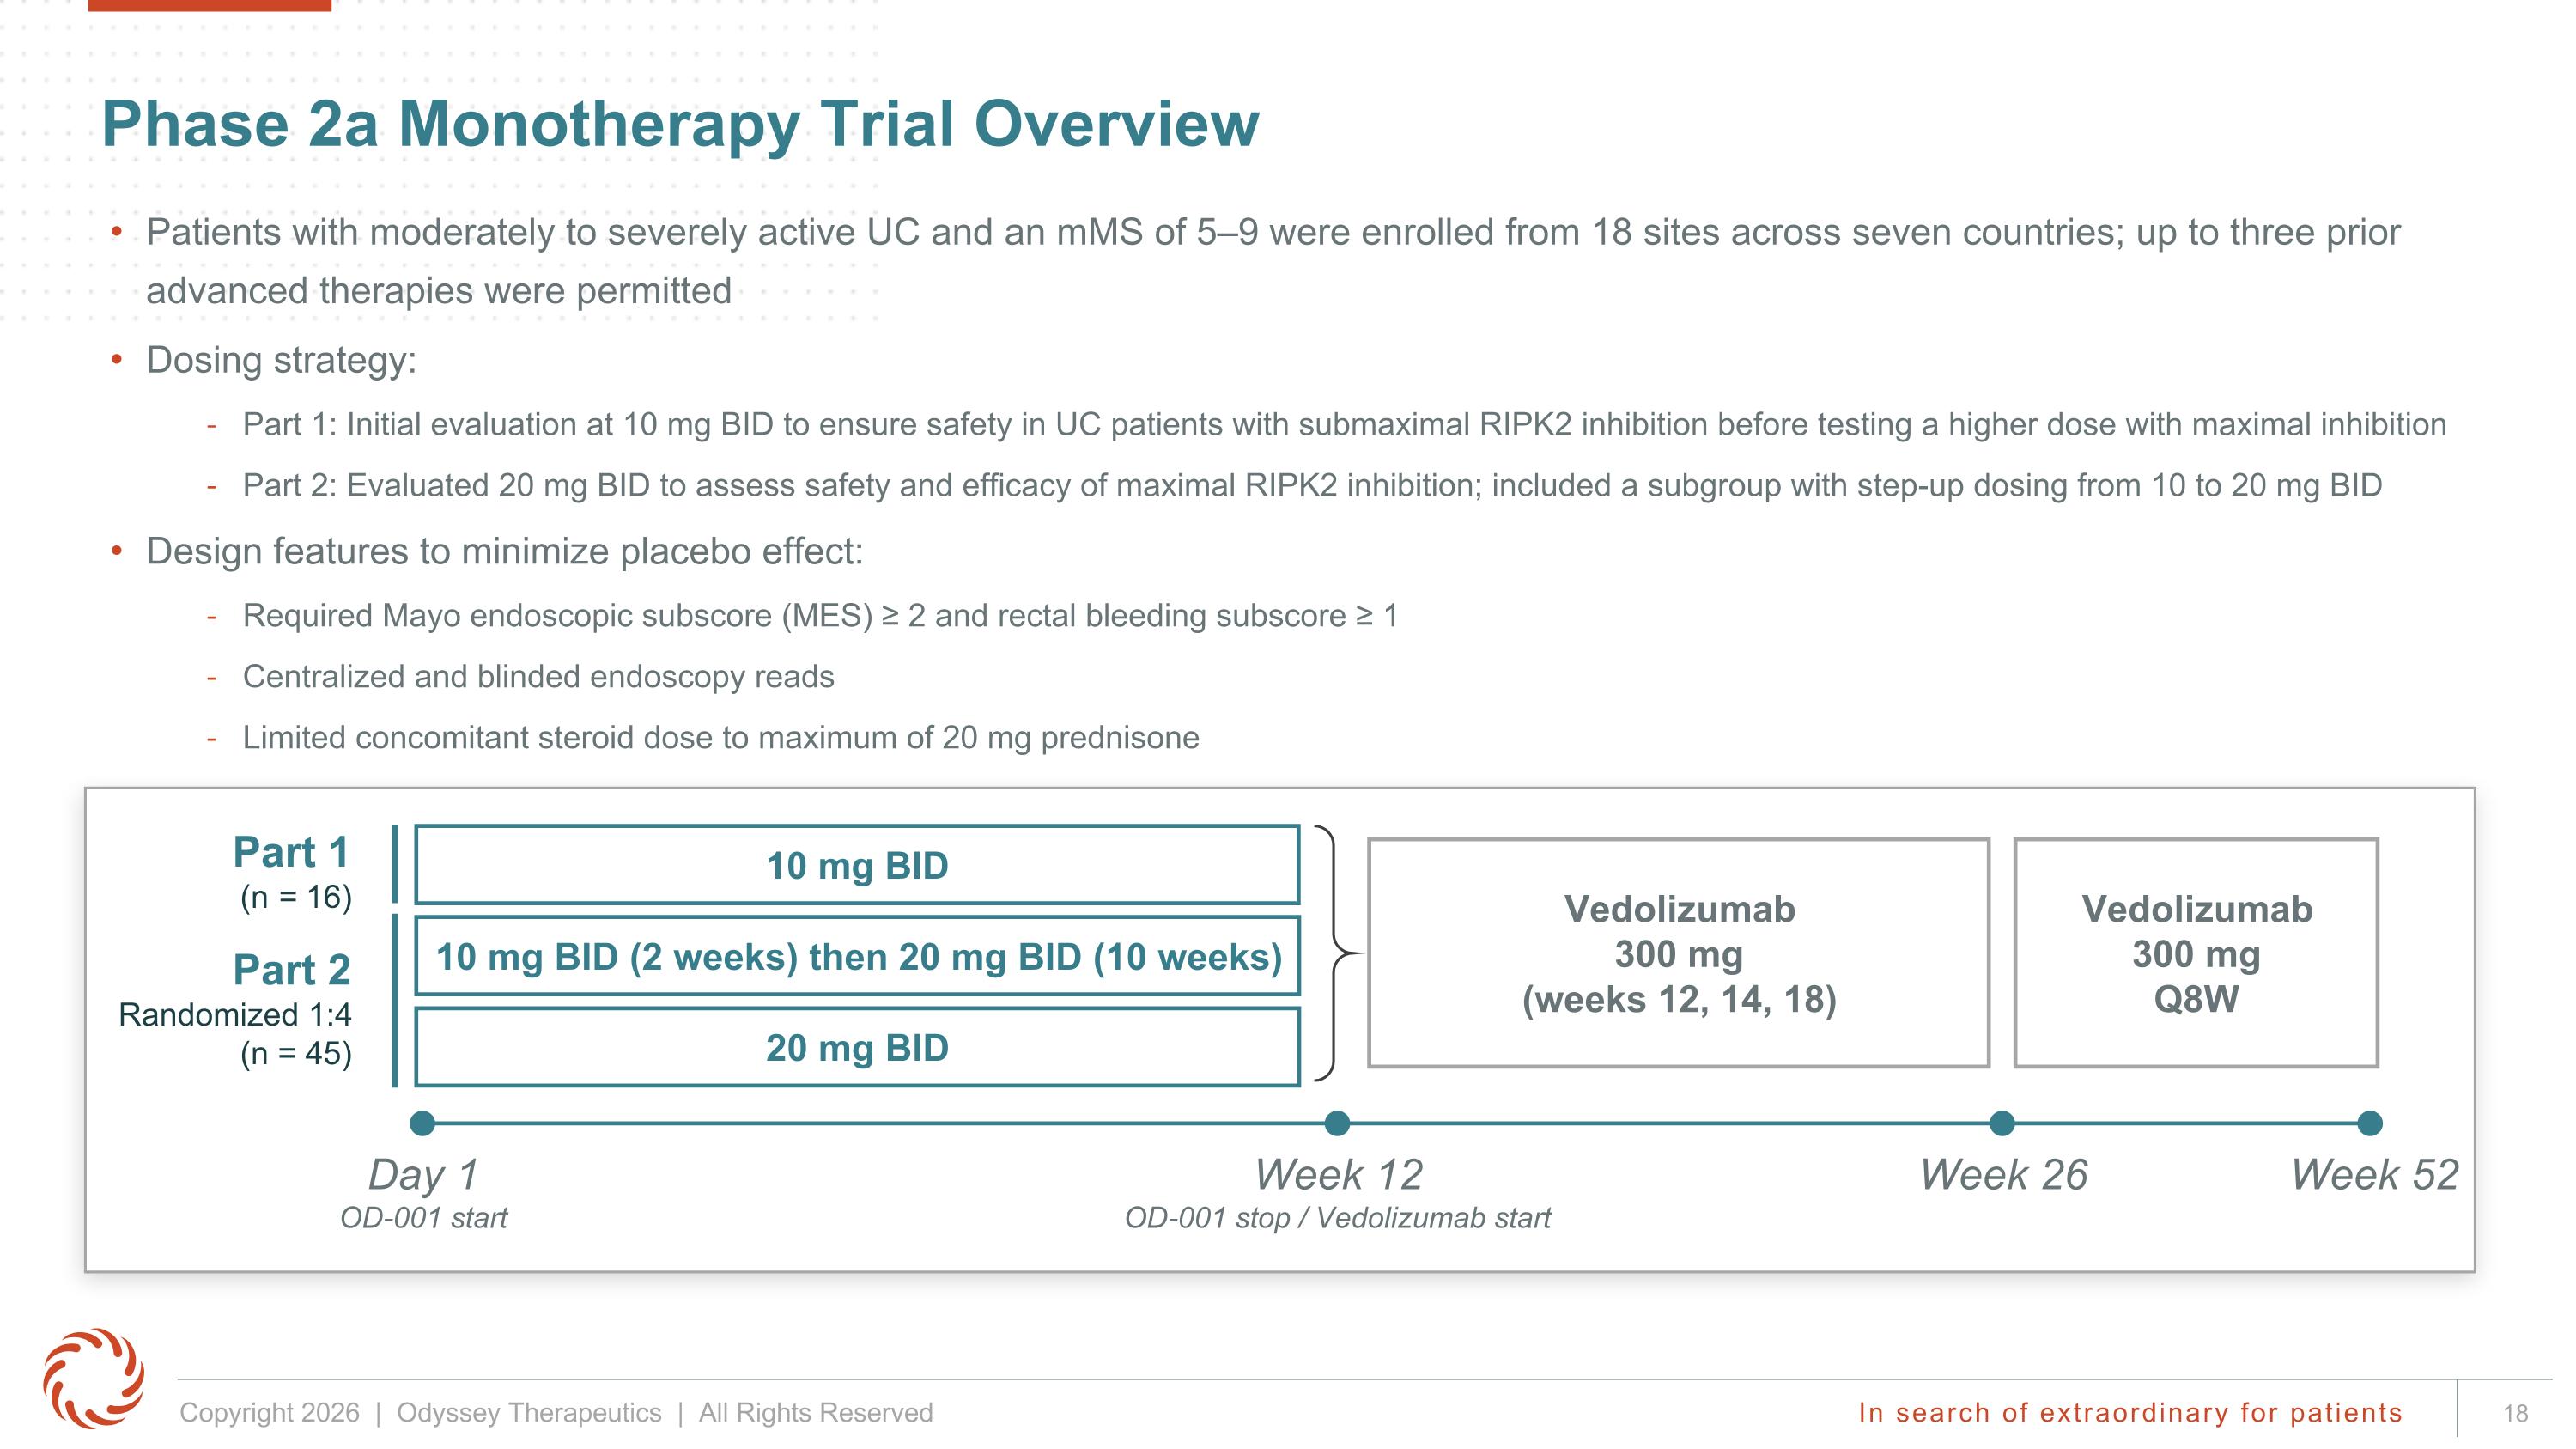
Vedolizumab 300 mg Q8W Vedolizumab 300 mg (weeks 12, 14, 18) Day 1 OD-001 start Week 12 OD-001 stop / Vedolizumab start Week 26 Week 52 10 mg BID 20 mg BID Part 1 (n = 16) Part 2 Randomized 1:4 (n = 45) Phase 2a Monotherapy Trial Overview 10 mg BID (2 weeks) then 20 mg BID (10 weeks) Patients with moderately to severely active UC and an mMS of 5–9 were enrolled from 18 sites across seven countries; up to three prior advanced therapies were permitted Dosing strategy: Part 1: Initial evaluation at 10 mg BID to ensure safety in UC patients with submaximal RIPK2 inhibition before testing a higher dose with maximal inhibition Part 2: Evaluated 20 mg BID to assess safety and efficacy of maximal RIPK2 inhibition; included a subgroup with step-up dosing from 10 to 20 mg BID Design features to minimize placebo effect: Required Mayo endoscopic subscore (MES) ≥ 2 and rectal bleeding subscore ≥ 1 Centralized and blinded endoscopy reads Limited concomitant steroid dose to maximum of 20 mg prednisone
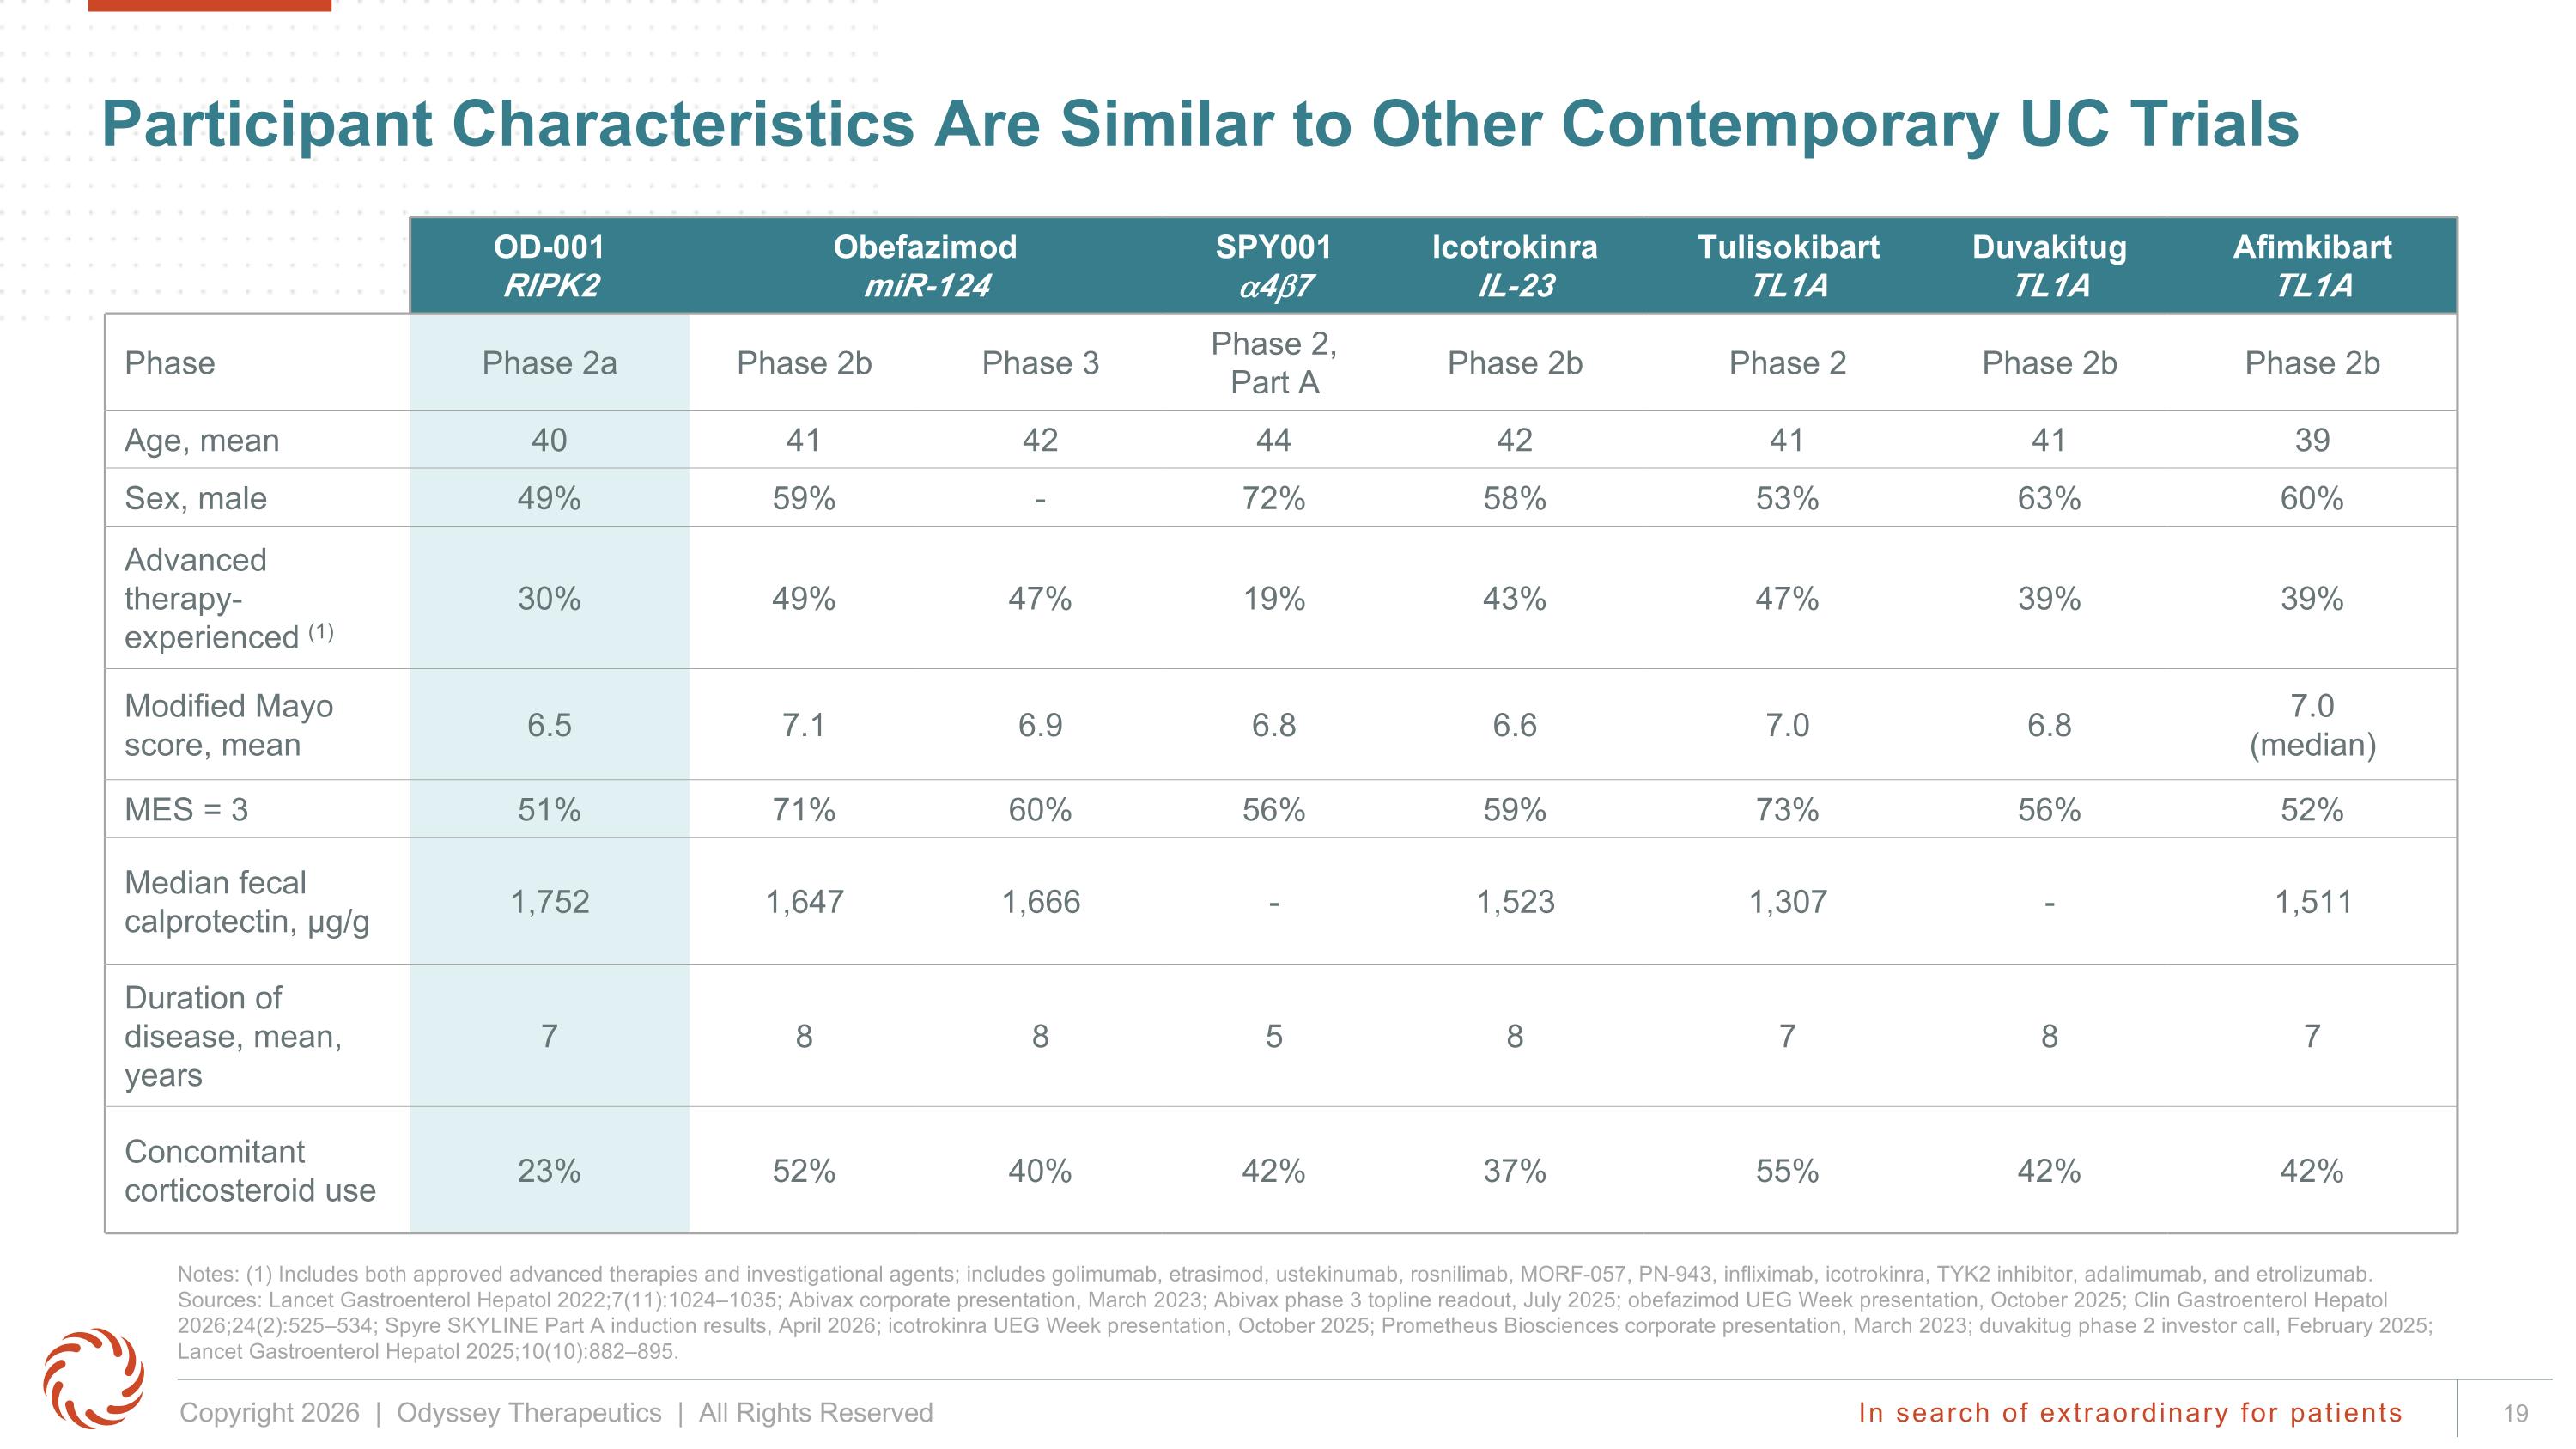
Participant Characteristics Are Similar to Other Contemporary UC Trials Notes: (1) Includes both approved advanced therapies and investigational agents; includes golimumab, etrasimod, ustekinumab, rosnilimab, MORF-057, PN-943, infliximab, icotrokinra, TYK2 inhibitor, adalimumab, and etrolizumab. Sources: Lancet Gastroenterol Hepatol 2022;7(11):1024–1035; Abivax corporate presentation, March 2023; Abivax phase 3 topline readout, July 2025; obefazimod UEG Week presentation, October 2025; Clin Gastroenterol Hepatol 2026;24(2):525–534; Spyre SKYLINE Part A induction results, April 2026; icotrokinra UEG Week presentation, October 2025; Prometheus Biosciences corporate presentation, March 2023; duvakitug phase 2 investor call, February 2025; Lancet Gastroenterol Hepatol 2025;10(10):882–895. OD-001 RIPK2 Obefazimod miR-124 SPY001 a4b7 Icotrokinra IL-23 Tulisokibart TL1A Duvakitug TL1A Afimkibart TL1A Phase Phase 2a Phase 2b Phase 3 Phase 2, Part A Phase 2b Phase 2 Phase 2b Phase 2b Age, mean 40 41 42 44 42 41 41 39 Sex, male 49% 59% - 72% 58% 53% 63% 60% Advanced therapy- experienced (1) 30% 49% 47% 19% 43% 47% 39% 39% Modified Mayo score, mean 6.5 7.1 6.9 6.8 6.6 7.0 6.8 7.0 (median) MES = 3 51% 71% 60% 56% 59% 73% 56% 52% Median fecal calprotectin, µg/g 1,752 1,647 1,666 - 1,523 1,307 - 1,511 Duration of disease, mean, years 7 8 8 5 8 7 8 7 Concomitant corticosteroid use 23% 52% 40% 42% 37% 55% 42% 42%
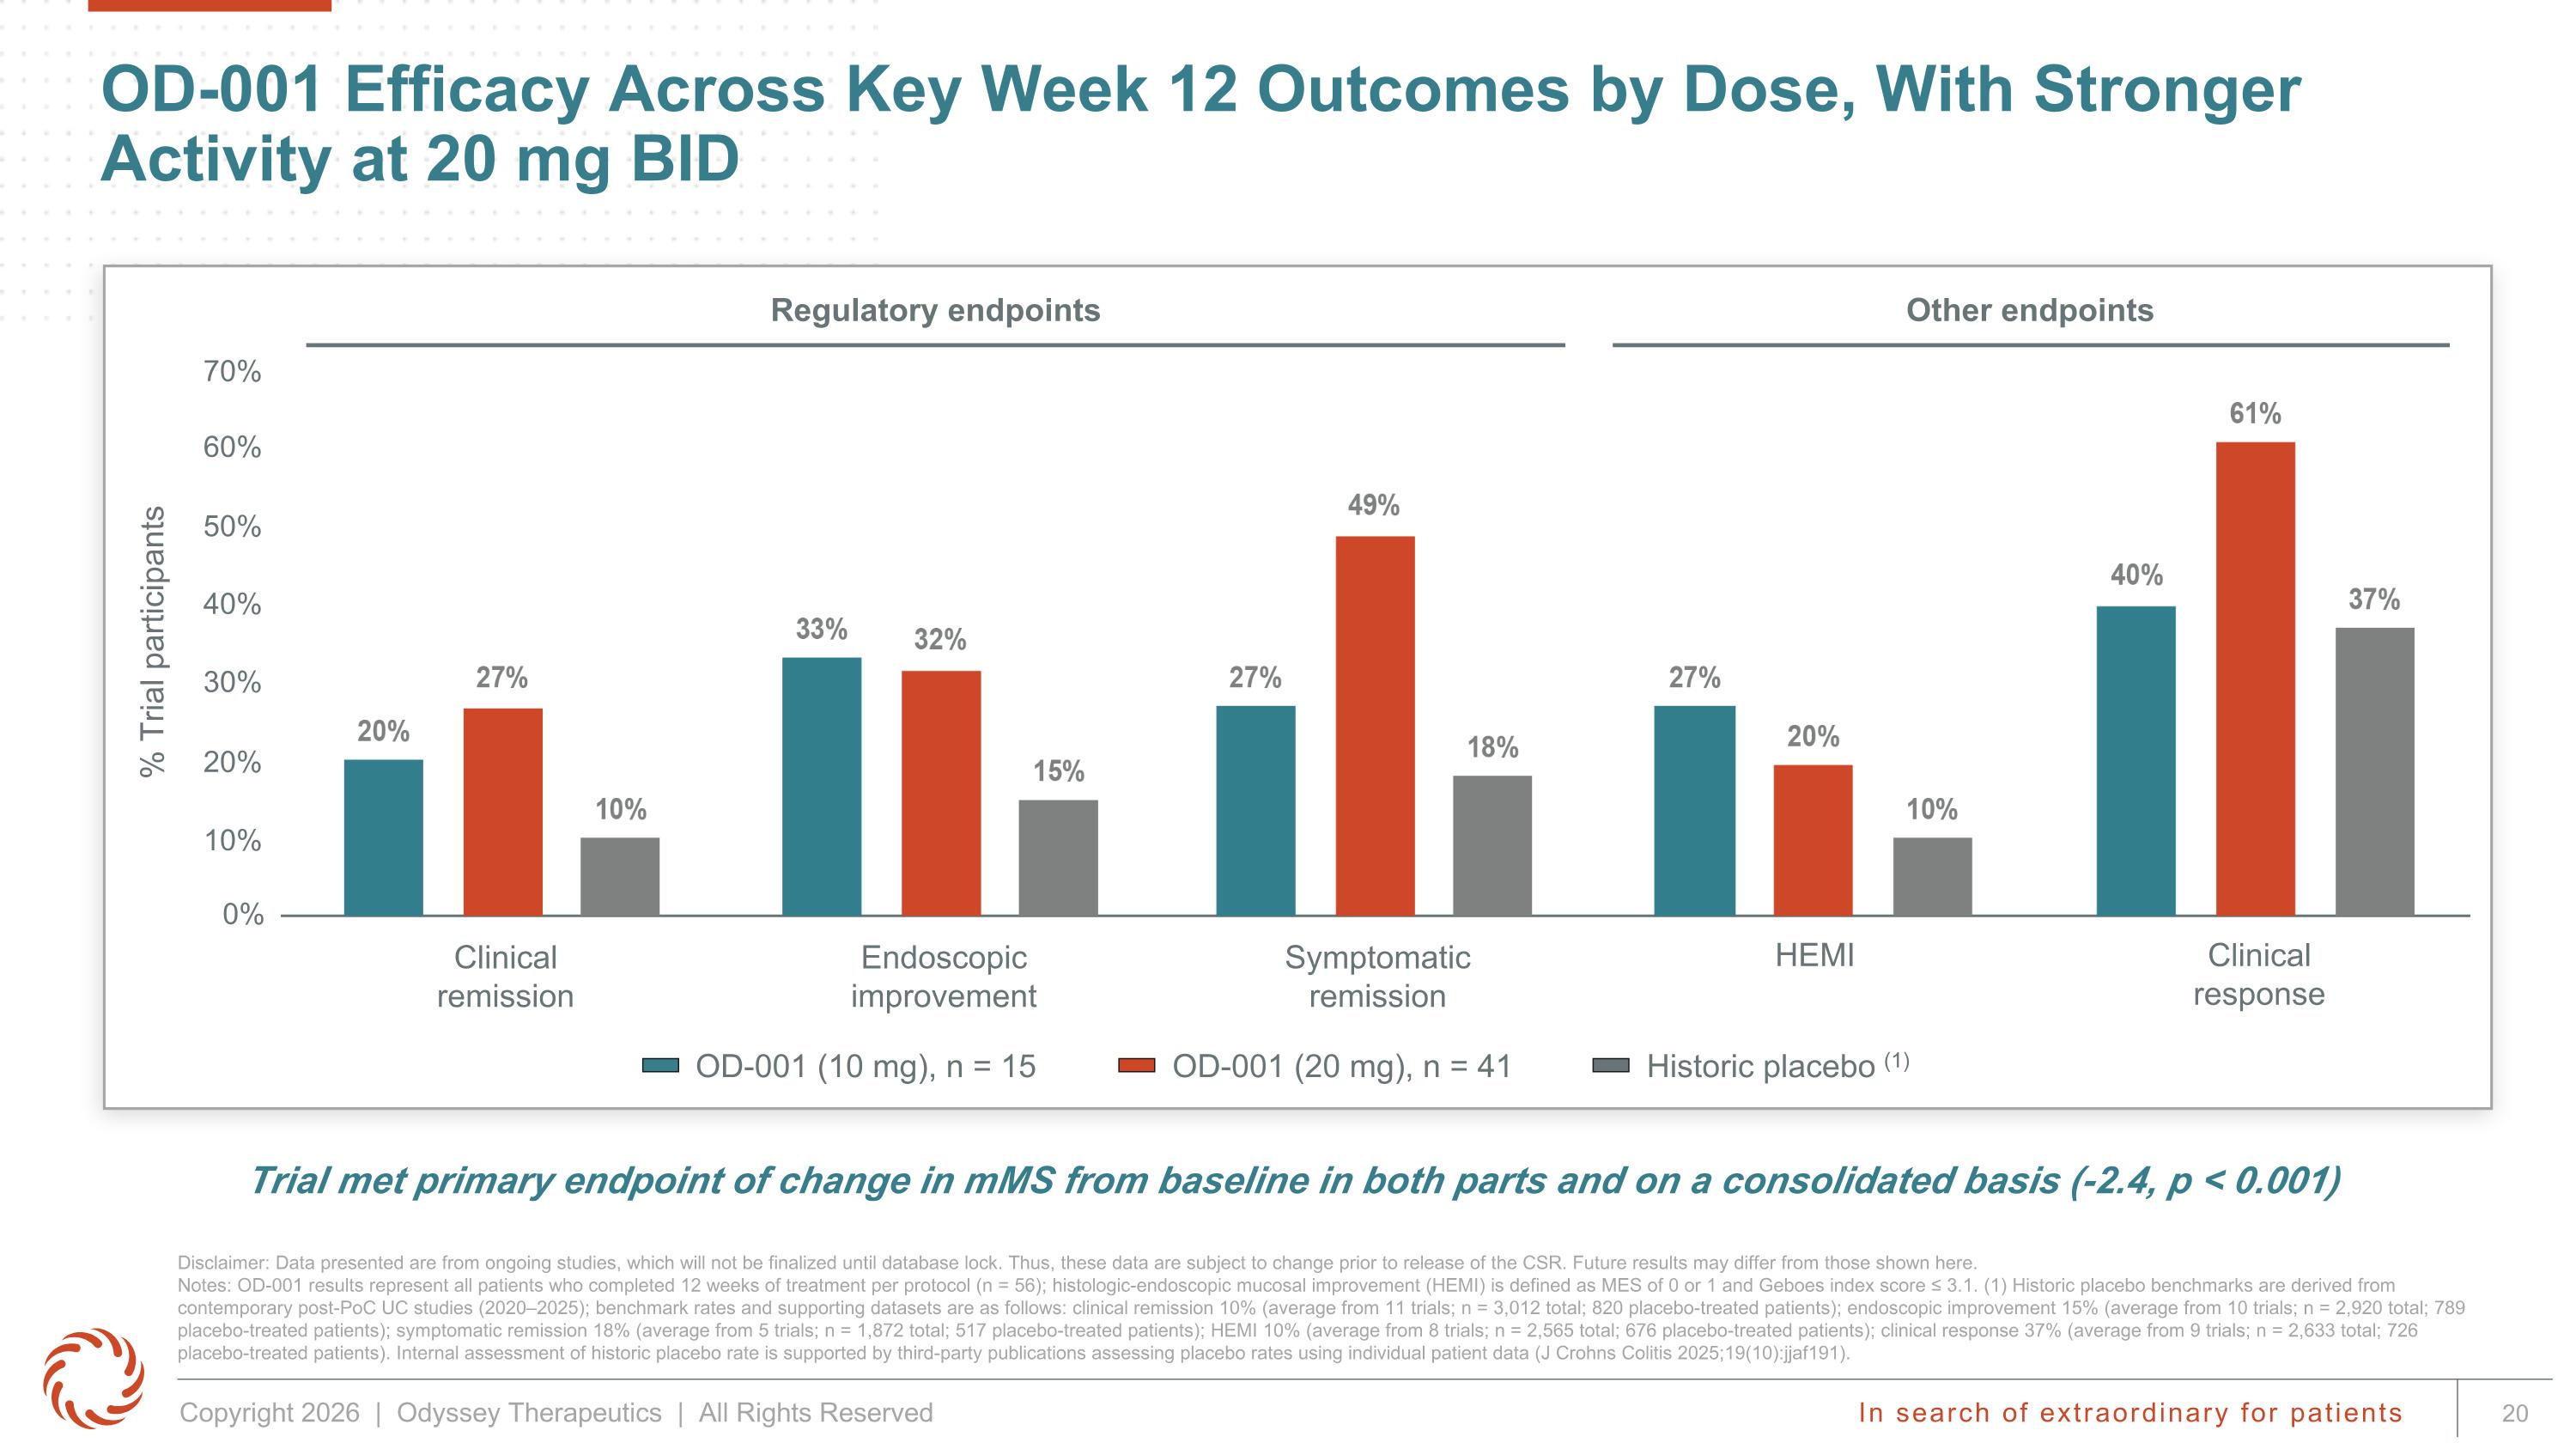
OD-001 Efficacy Across Key Week 12 Outcomes by Dose, With Stronger Activity at 20 mg BID Disclaimer: Data presented are from ongoing studies, which will not be finalized until database lock. Thus, these data are subject to change prior to release of the CSR. Future results may differ from those shown here. Notes: OD-001 results represent all patients who completed 12 weeks of treatment per protocol (n = 56); histologic-endoscopic mucosal improvement (HEMI) is defined as MES of 0 or 1 and Geboes index score ≤ 3.1. (1) Historic placebo benchmarks are derived from contemporary post-PoC UC studies (2020–2025); benchmark rates and supporting datasets are as follows: clinical remission 10% (average from 11 trials; n = 3,012 total; 820 placebo-treated patients); endoscopic improvement 15% (average from 10 trials; n = 2,920 total; 789 placebo-treated patients); symptomatic remission 18% (average from 5 trials; n = 1,872 total; 517 placebo-treated patients); HEMI 10% (average from 8 trials; n = 2,565 total; 676 placebo-treated patients); clinical response 37% (average from 9 trials; n = 2,633 total; 726 placebo-treated patients). Internal assessment of historic placebo rate is supported by third-party publications assessing placebo rates using individual patient data (J Crohns Colitis 2025;19(10):jjaf191). OD-001 (20 mg), n = 41 Historic placebo (1) OD-001 (10 mg), n = 15 Clinical remission Endoscopic improvement Symptomatic remission Clinical response HEMI 70% 60% 50% 40% 30% 20% 10% 0% % Trial participants Regulatory endpoints Other endpoints Trial met primary endpoint of change in mMS from baseline in both parts and on a consolidated basis (-2.4, p < 0.001)
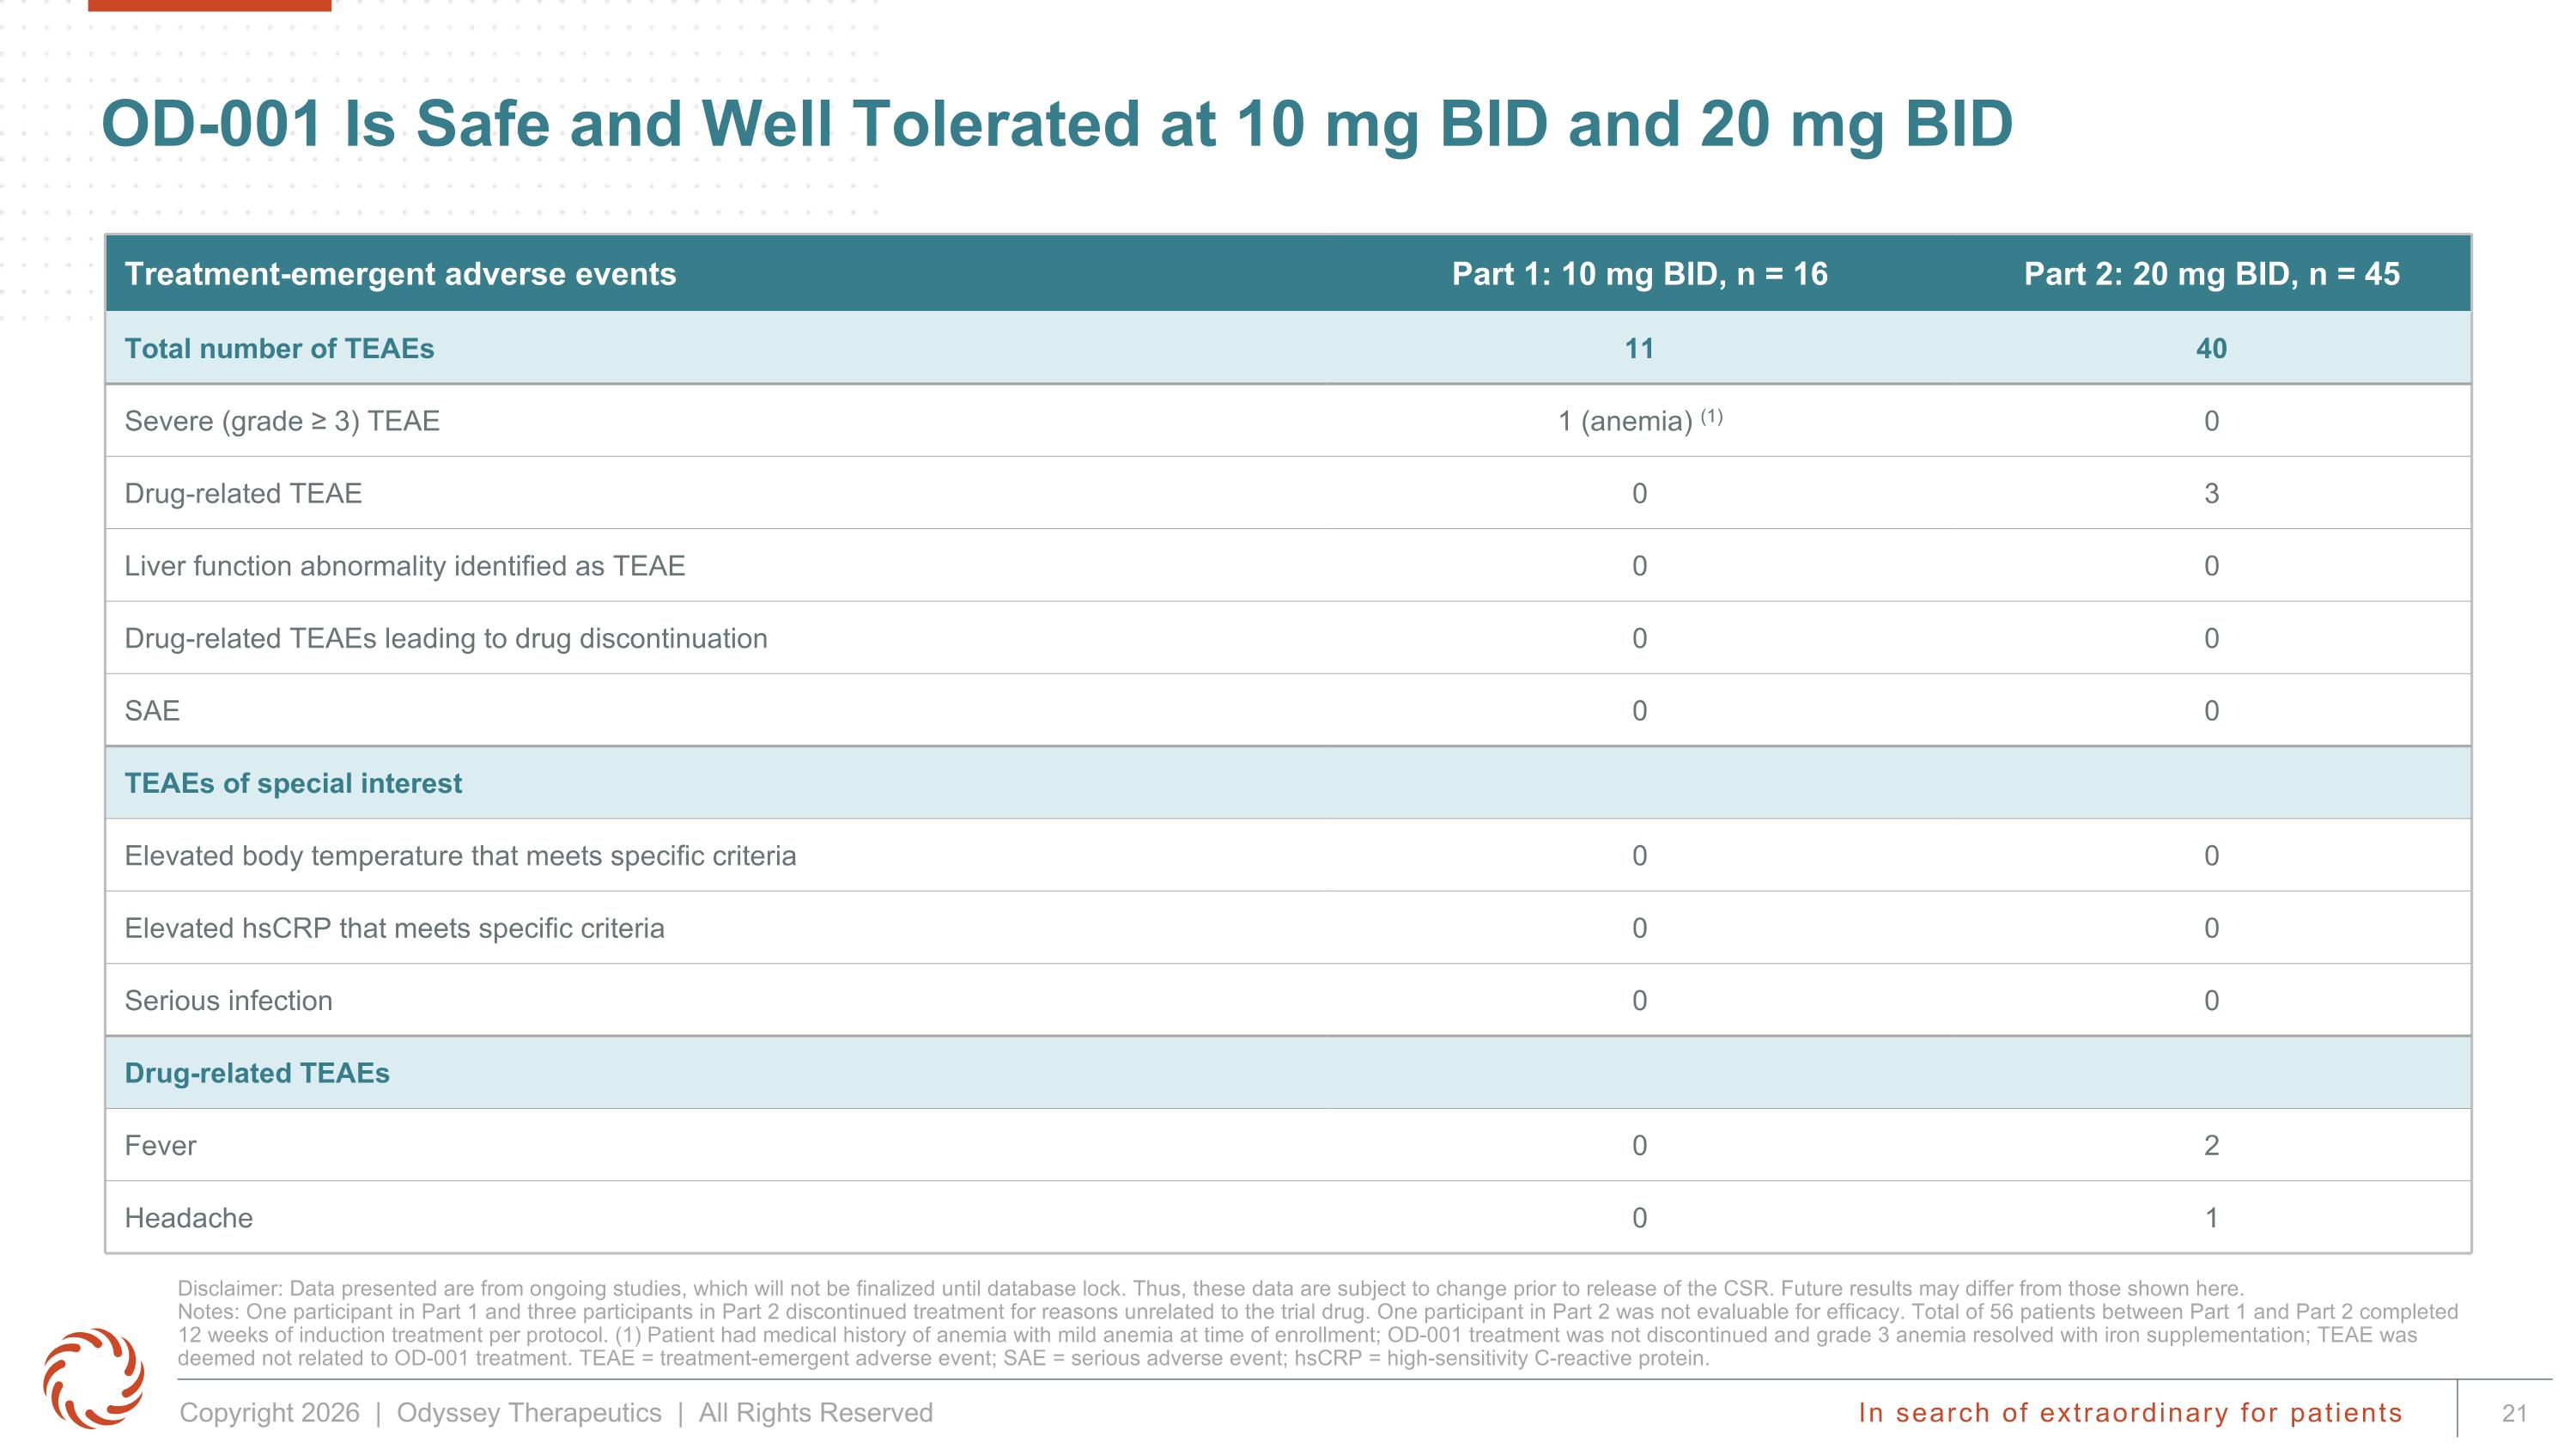
OD-001 Is Safe and Well Tolerated at 10 mg BID and 20 mg BID Disclaimer: Data presented are from ongoing studies, which will not be finalized until database lock. Thus, these data are subject to change prior to release of the CSR. Future results may differ from those shown here. Notes: One participant in Part 1 and three participants in Part 2 discontinued treatment for reasons unrelated to the trial drug. One participant in Part 2 was not evaluable for efficacy. Total of 56 patients between Part 1 and Part 2 completed 12 weeks of induction treatment per protocol. (1) Patient had medical history of anemia with mild anemia at time of enrollment; OD-001 treatment was not discontinued and grade 3 anemia resolved with iron supplementation; TEAE was deemed not related to OD-001 treatment. TEAE = treatment-emergent adverse event; SAE = serious adverse event; hsCRP = high-sensitivity C-reactive protein. Treatment-emergent adverse events Part 1: 10 mg BID, n = 16 Part 2: 20 mg BID, n = 45 Total number of TEAEs 11 40 Severe (grade ≥ 3) TEAE 1 (anemia) (1) 0 Drug-related TEAE 0 3 Liver function abnormality identified as TEAE 0 0 Drug-related TEAEs leading to drug discontinuation 0 0 SAE 0 0 TEAEs of special interest Elevated body temperature that meets specific criteria 0 0 Elevated hsCRP that meets specific criteria 0 0 Serious infection 0 0 Drug-related TEAEs Fever 0 2 Headache 0 1
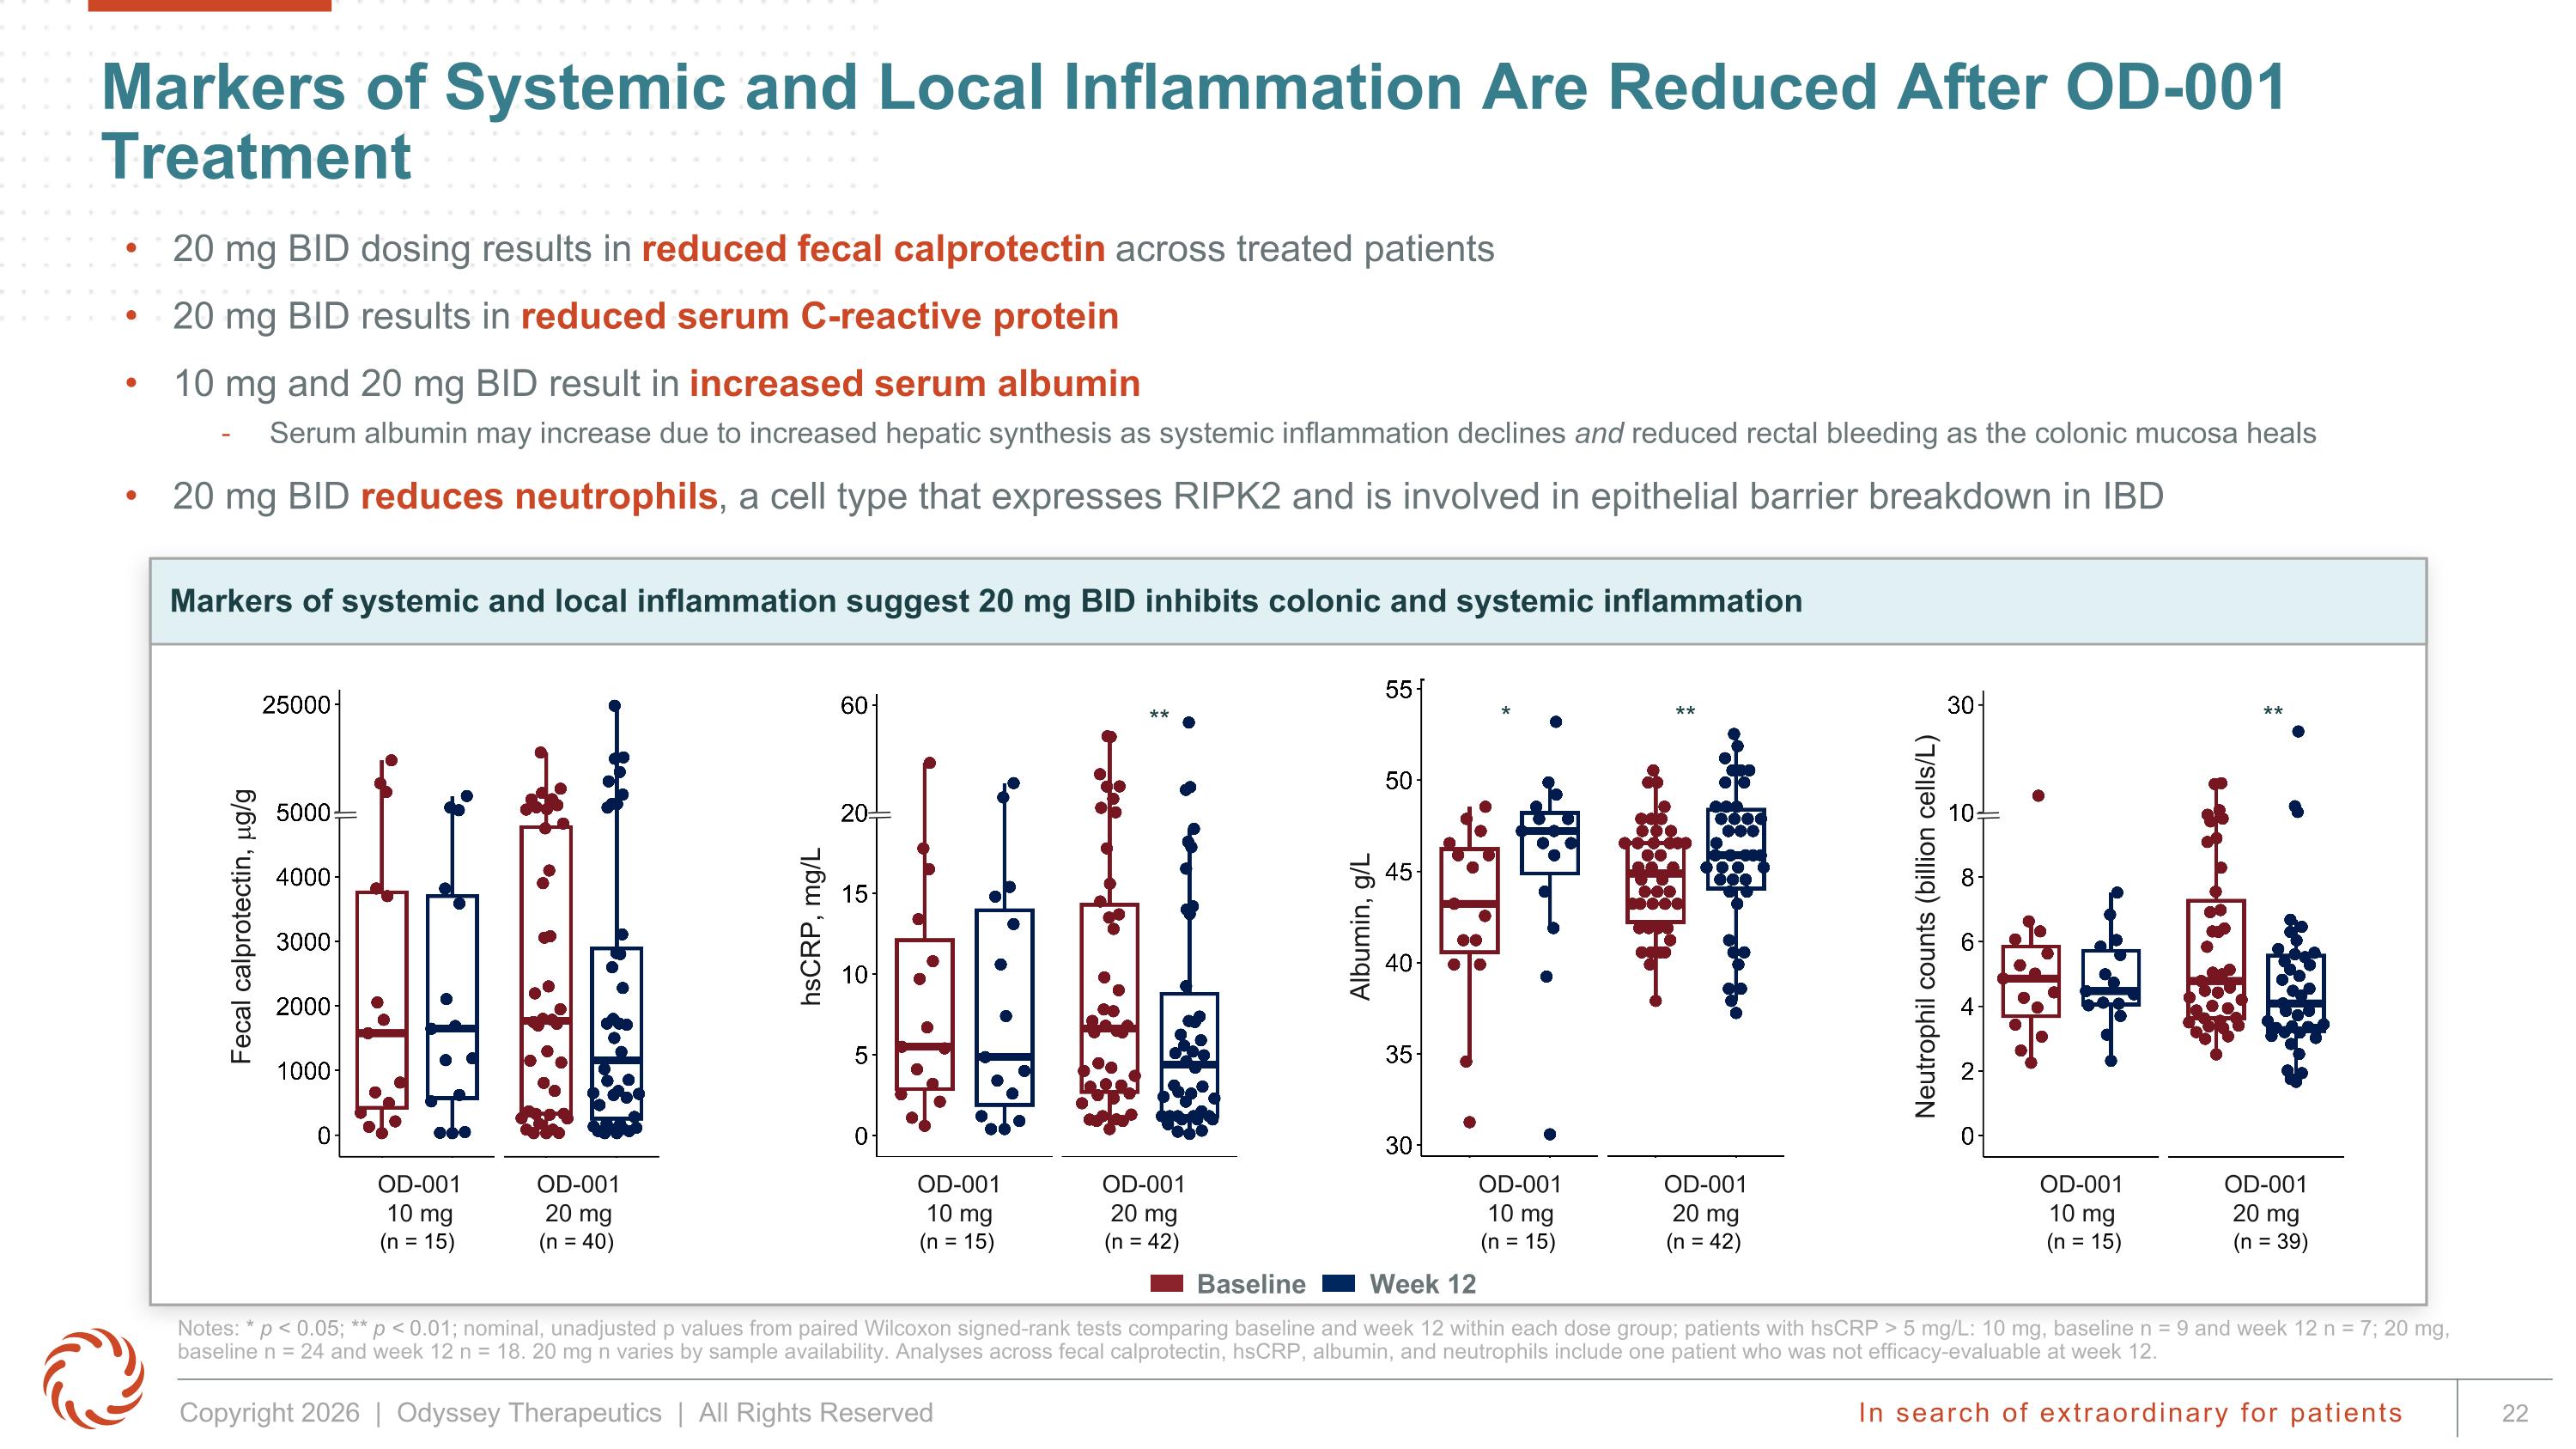
hsCRP, mg/L Markers of systemic and local inflammation suggest 20 mg BID inhibits colonic and systemic inflammation Markers of Systemic and Local Inflammation Are Reduced After OD-001 Treatment Notes: * p < 0.05; ** p < 0.01; nominal, unadjusted p values from paired Wilcoxon signed-rank tests comparing baseline and week 12 within each dose group; patients with hsCRP > 5 mg/L: 10 mg, baseline n = 9 and week 12 n = 7; 20 mg, baseline n = 24 and week 12 n = 18. 20 mg n varies by sample availability. Analyses across fecal calprotectin, hsCRP, albumin, and neutrophils include one patient who was not efficacy-evaluable at week 12. Baseline Week 12 20 mg BID dosing results in reduced fecal calprotectin across treated patients 20 mg BID results in reduced serum C-reactive protein 10 mg and 20 mg BID result in increased serum albumin Serum albumin may increase due to increased hepatic synthesis as systemic inflammation declines and reduced rectal bleeding as the colonic mucosa heals 20 mg BID reduces neutrophils, a cell type that expresses RIPK2 and is involved in epithelial barrier breakdown in IBD ** ** Fecal calprotectin, mg/g Albumin, g/L Neutrophil counts (billion cells/L) OD-001 10 mg OD-001 20 mg OD-001 10 mg OD-001 20 mg OD-001 10 mg OD-001 20 mg OD-001 10 mg OD-001 20 mg (n = 15) (n = 39) (n = 15) (n = 42) (n = 15) (n = 40) (n = 15) (n = 42) * **
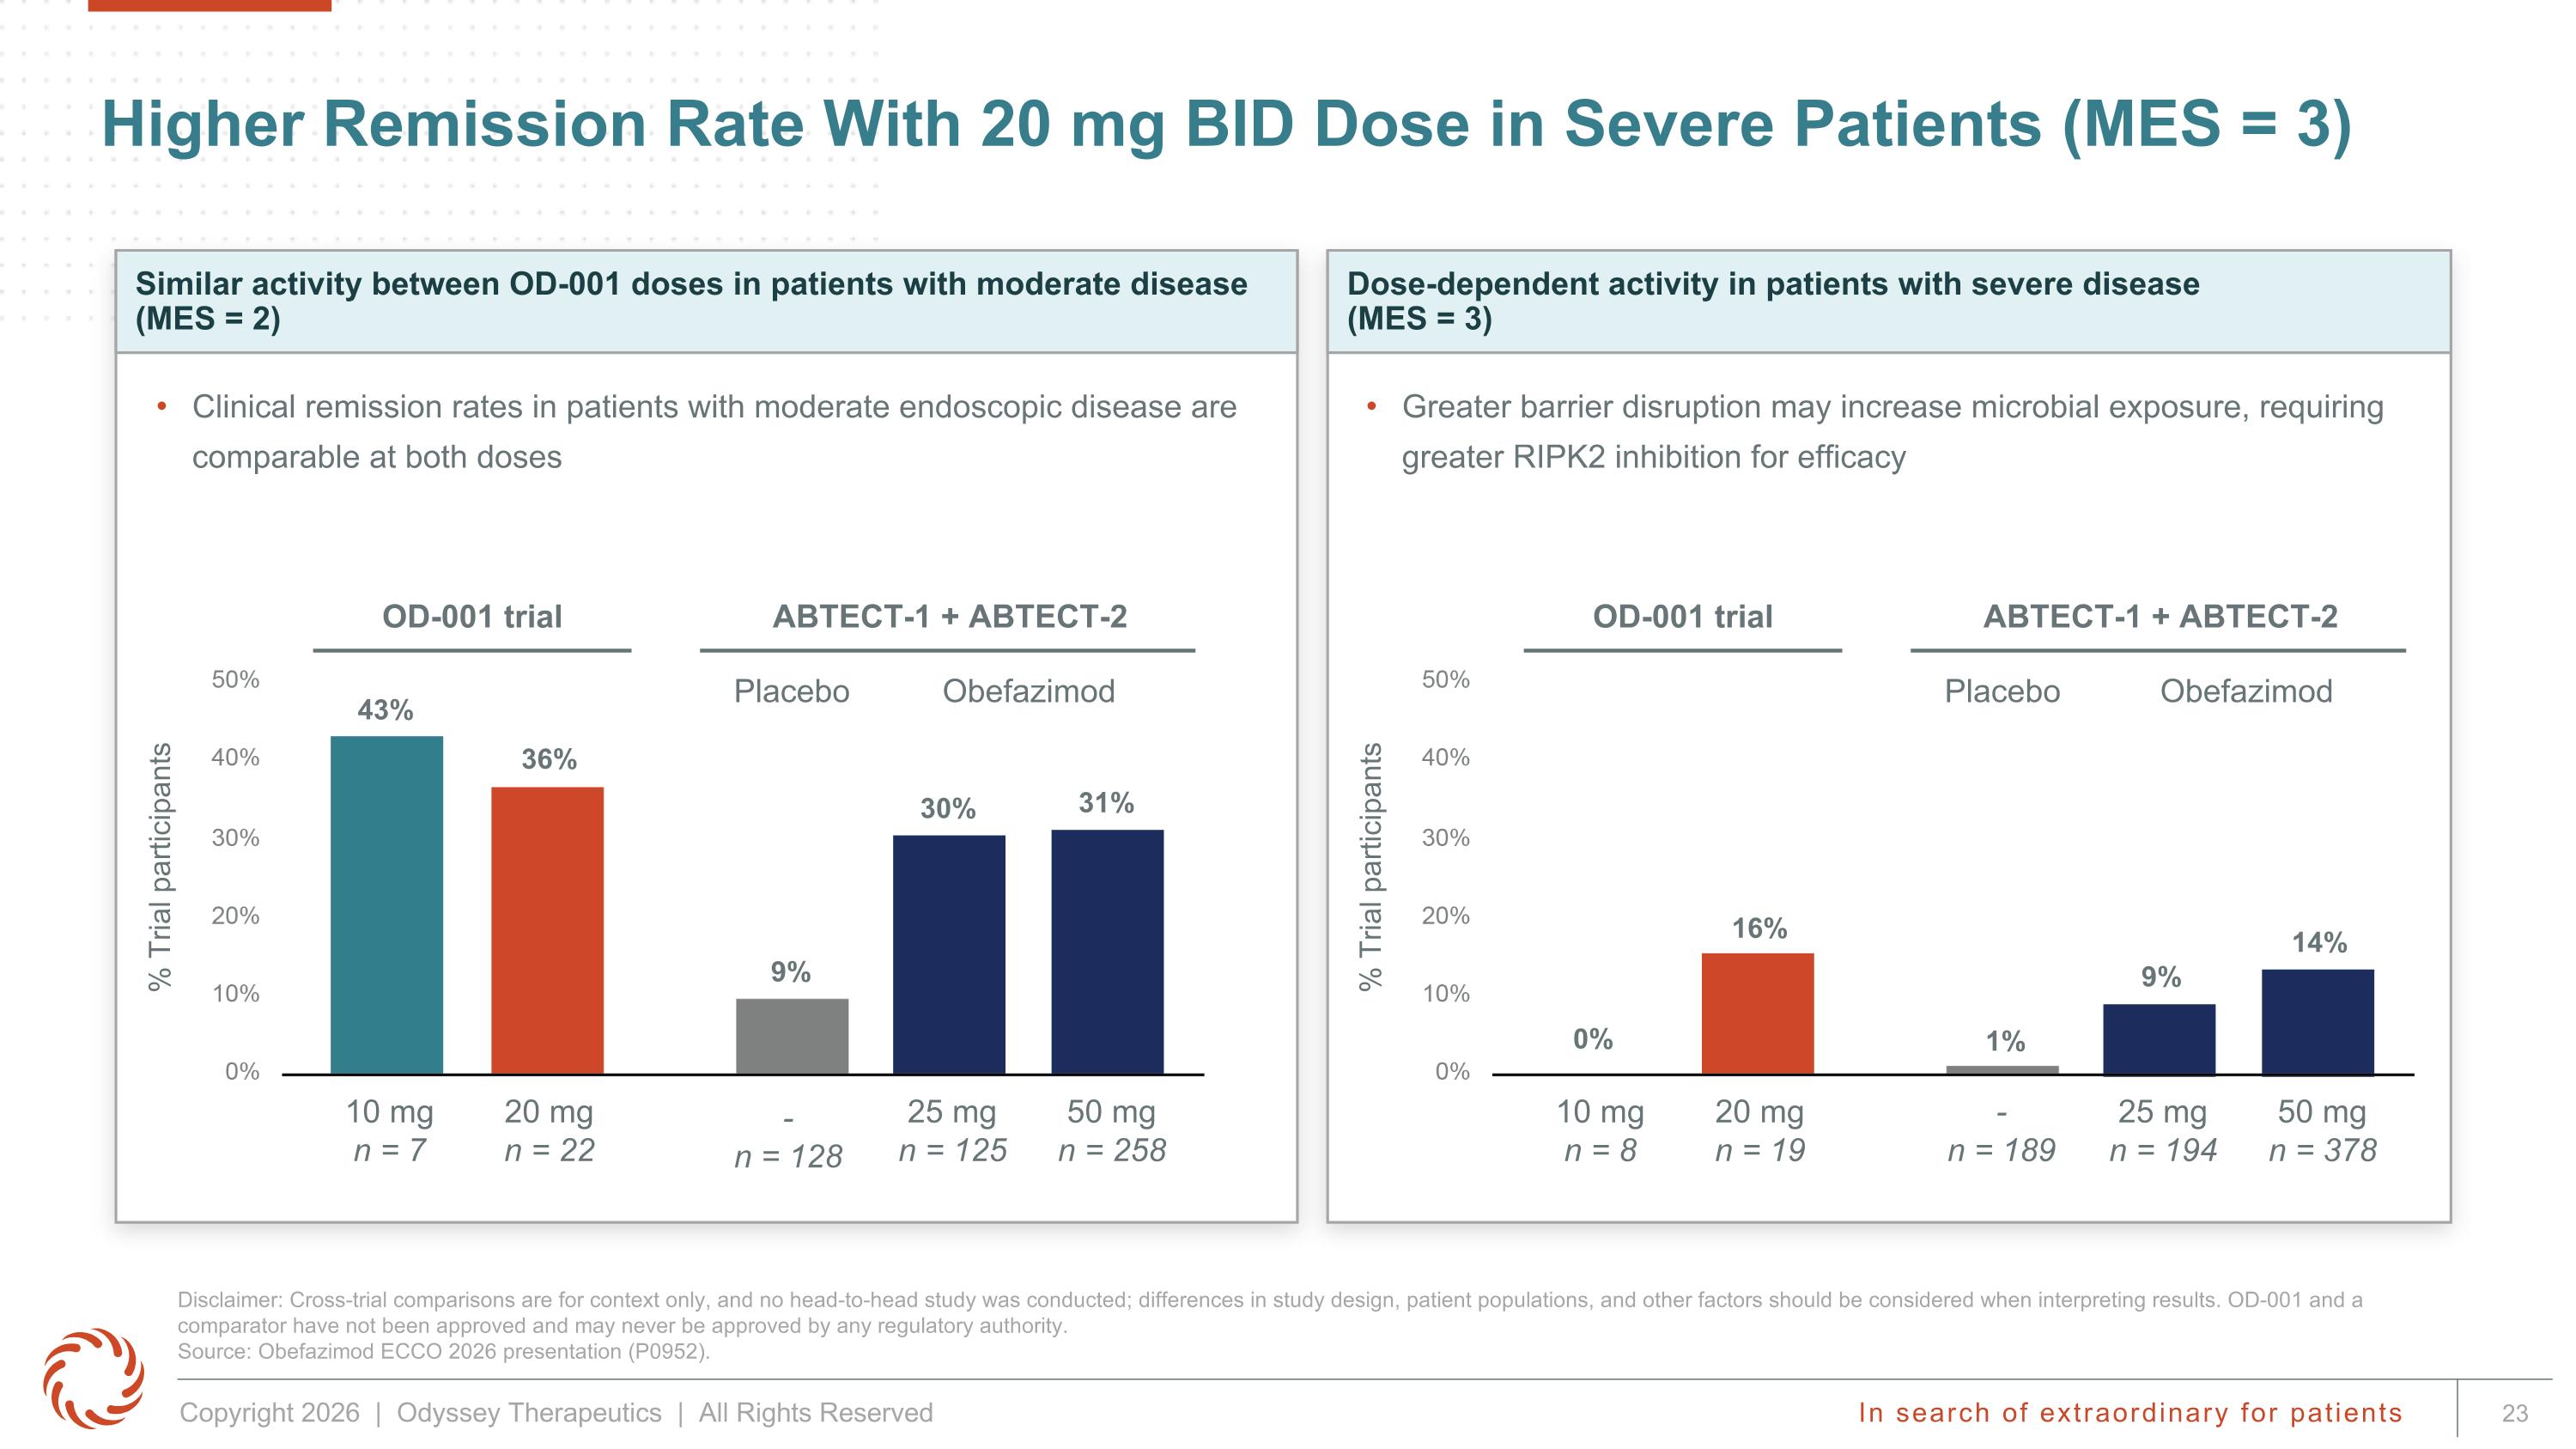
10 mg n = 8 25 mg n = 194 50 mg n = 378 Placebo 20 mg n = 19 ABTECT-1 + ABTECT-2 OD-001 trial % Trial participants Obefazimod - n = 189 Similar activity between OD-001 doses in patients with moderate disease (MES = 2) Higher Remission Rate With 20 mg BID Dose in Severe Patients (MES = 3) Disclaimer: Cross-trial comparisons are for context only, and no head-to-head study was conducted; differences in study design, patient populations, and other factors should be considered when interpreting results. OD-001 and a comparator have not been approved and may never be approved by any regulatory authority. Source: Obefazimod ECCO 2026 presentation (P0952). Dose-dependent activity in patients with severe disease (MES = 3) Greater barrier disruption may increase microbial exposure, requiring greater RIPK2 inhibition for efficacy Clinical remission rates in patients with moderate endoscopic disease are comparable at both doses 10 mg n = 7 25 mg n = 125 50 mg n = 258 Placebo 20 mg n = 22 ABTECT-1 + ABTECT-2 OD-001 trial 43% 36% 9% 30% 31% 0% 16% 1% 9% 14% % Trial participants Obefazimod - n = 128
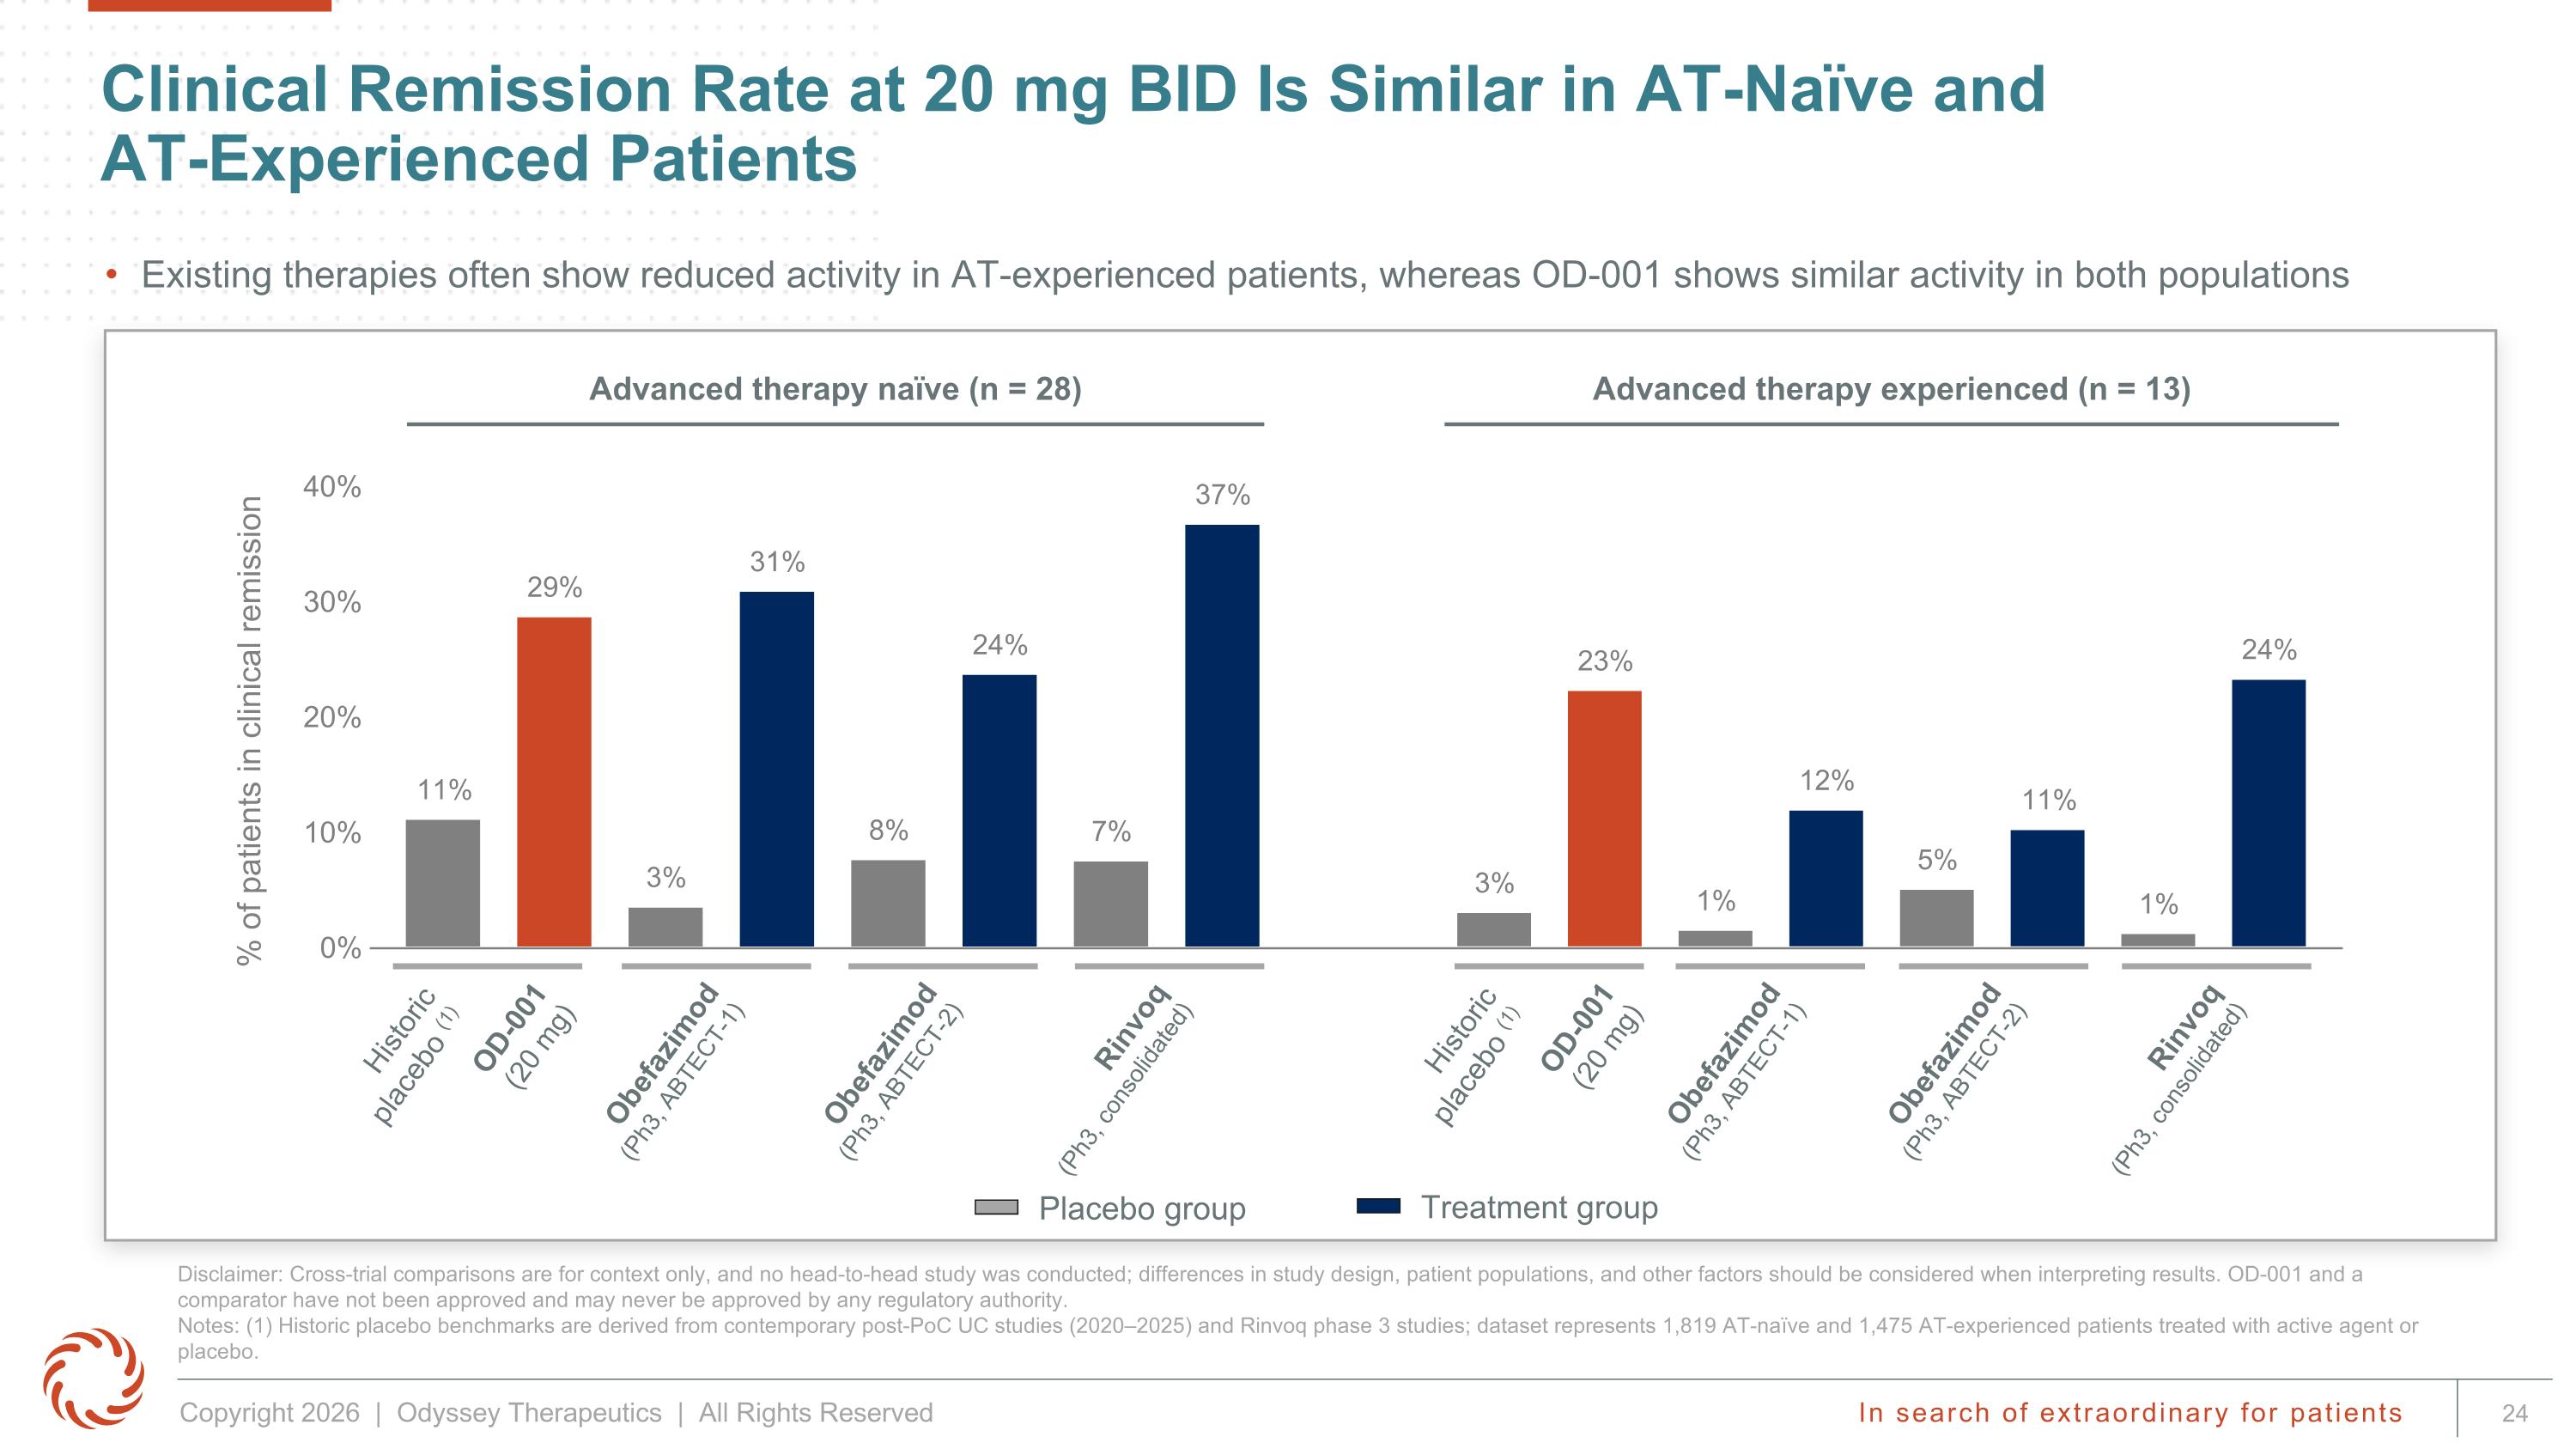
Clinical Remission Rate at 20 mg BID Is Similar in AT-Naïve and AT-Experienced Patients Disclaimer: Cross-trial comparisons are for context only, and no head-to-head study was conducted; differences in study design, patient populations, and other factors should be considered when interpreting results. OD-001 and a comparator have not been approved and may never be approved by any regulatory authority. Notes: (1) Historic placebo benchmarks are derived from contemporary post-PoC UC studies (2020–2025) and Rinvoq phase 3 studies; dataset represents 1,819 AT-naïve and 1,475 AT-experienced patients treated with active agent or placebo. Obefazimod (Ph3, ABTECT-1) Obefazimod (Ph3, ABTECT-2) Rinvoq (Ph3, consolidated) Historic placebo (1) OD-001 (20 mg) Placebo group Treatment group Obefazimod (Ph3, ABTECT-1) Obefazimod (Ph3, ABTECT-2) Rinvoq (Ph3, consolidated) Historic placebo (1) OD-001 (20 mg) Advanced therapy experienced (n = 13) Advanced therapy naïve (n = 28) Existing therapies often show reduced activity in AT-experienced patients, whereas OD-001 shows similar activity in both populations
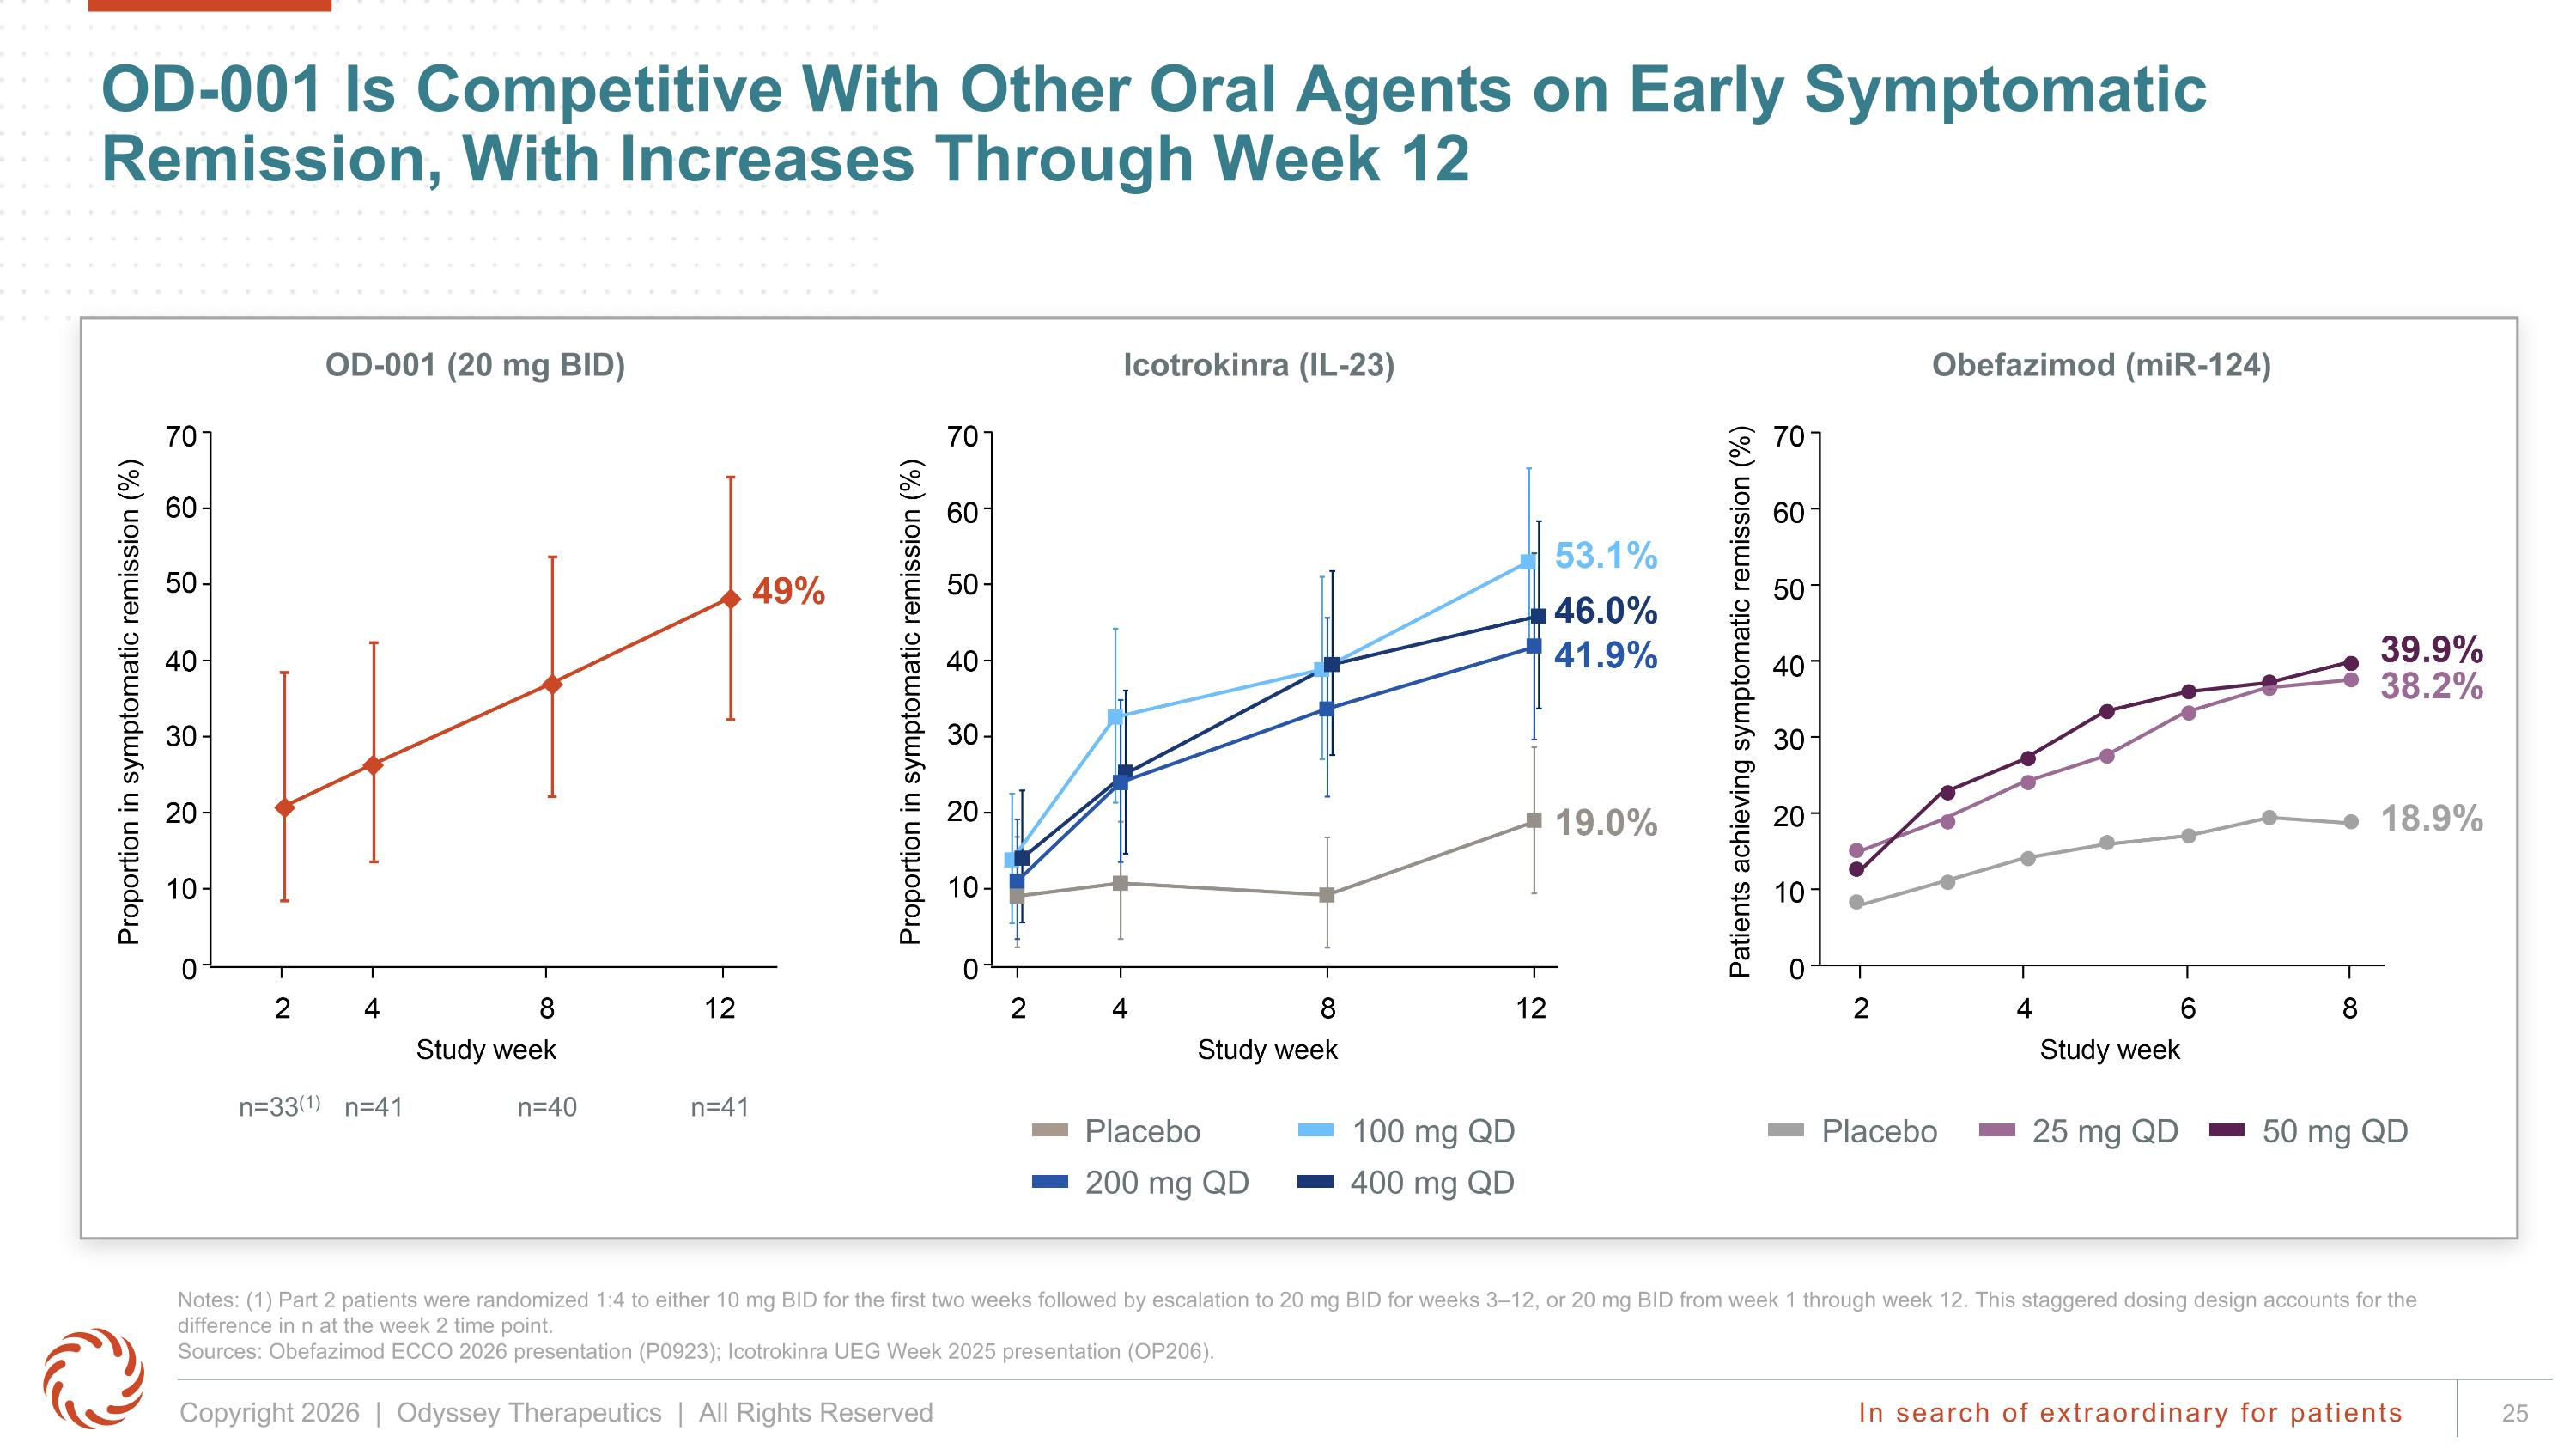
OD-001 Is Competitive With Other Oral Agents on Early Symptomatic Remission, With Increases Through Week 12 100 mg QD 200 mg QD Placebo 400 mg QD 25 mg QD 50 mg QD Placebo Icotrokinra (IL-23) OD-001 (20 mg BID) Obefazimod (miR-124) n=41 n=33(1) n=41 n=40 Notes: (1) Part 2 patients were randomized 1:4 to either 10 mg BID for the first two weeks followed by escalation to 20 mg BID for weeks 3–12, or 20 mg BID from week 1 through week 12. This staggered dosing design accounts for the difference in n at the week 2 time point. Sources: Obefazimod ECCO 2026 presentation (P0923); Icotrokinra UEG Week 2025 presentation (OP206).
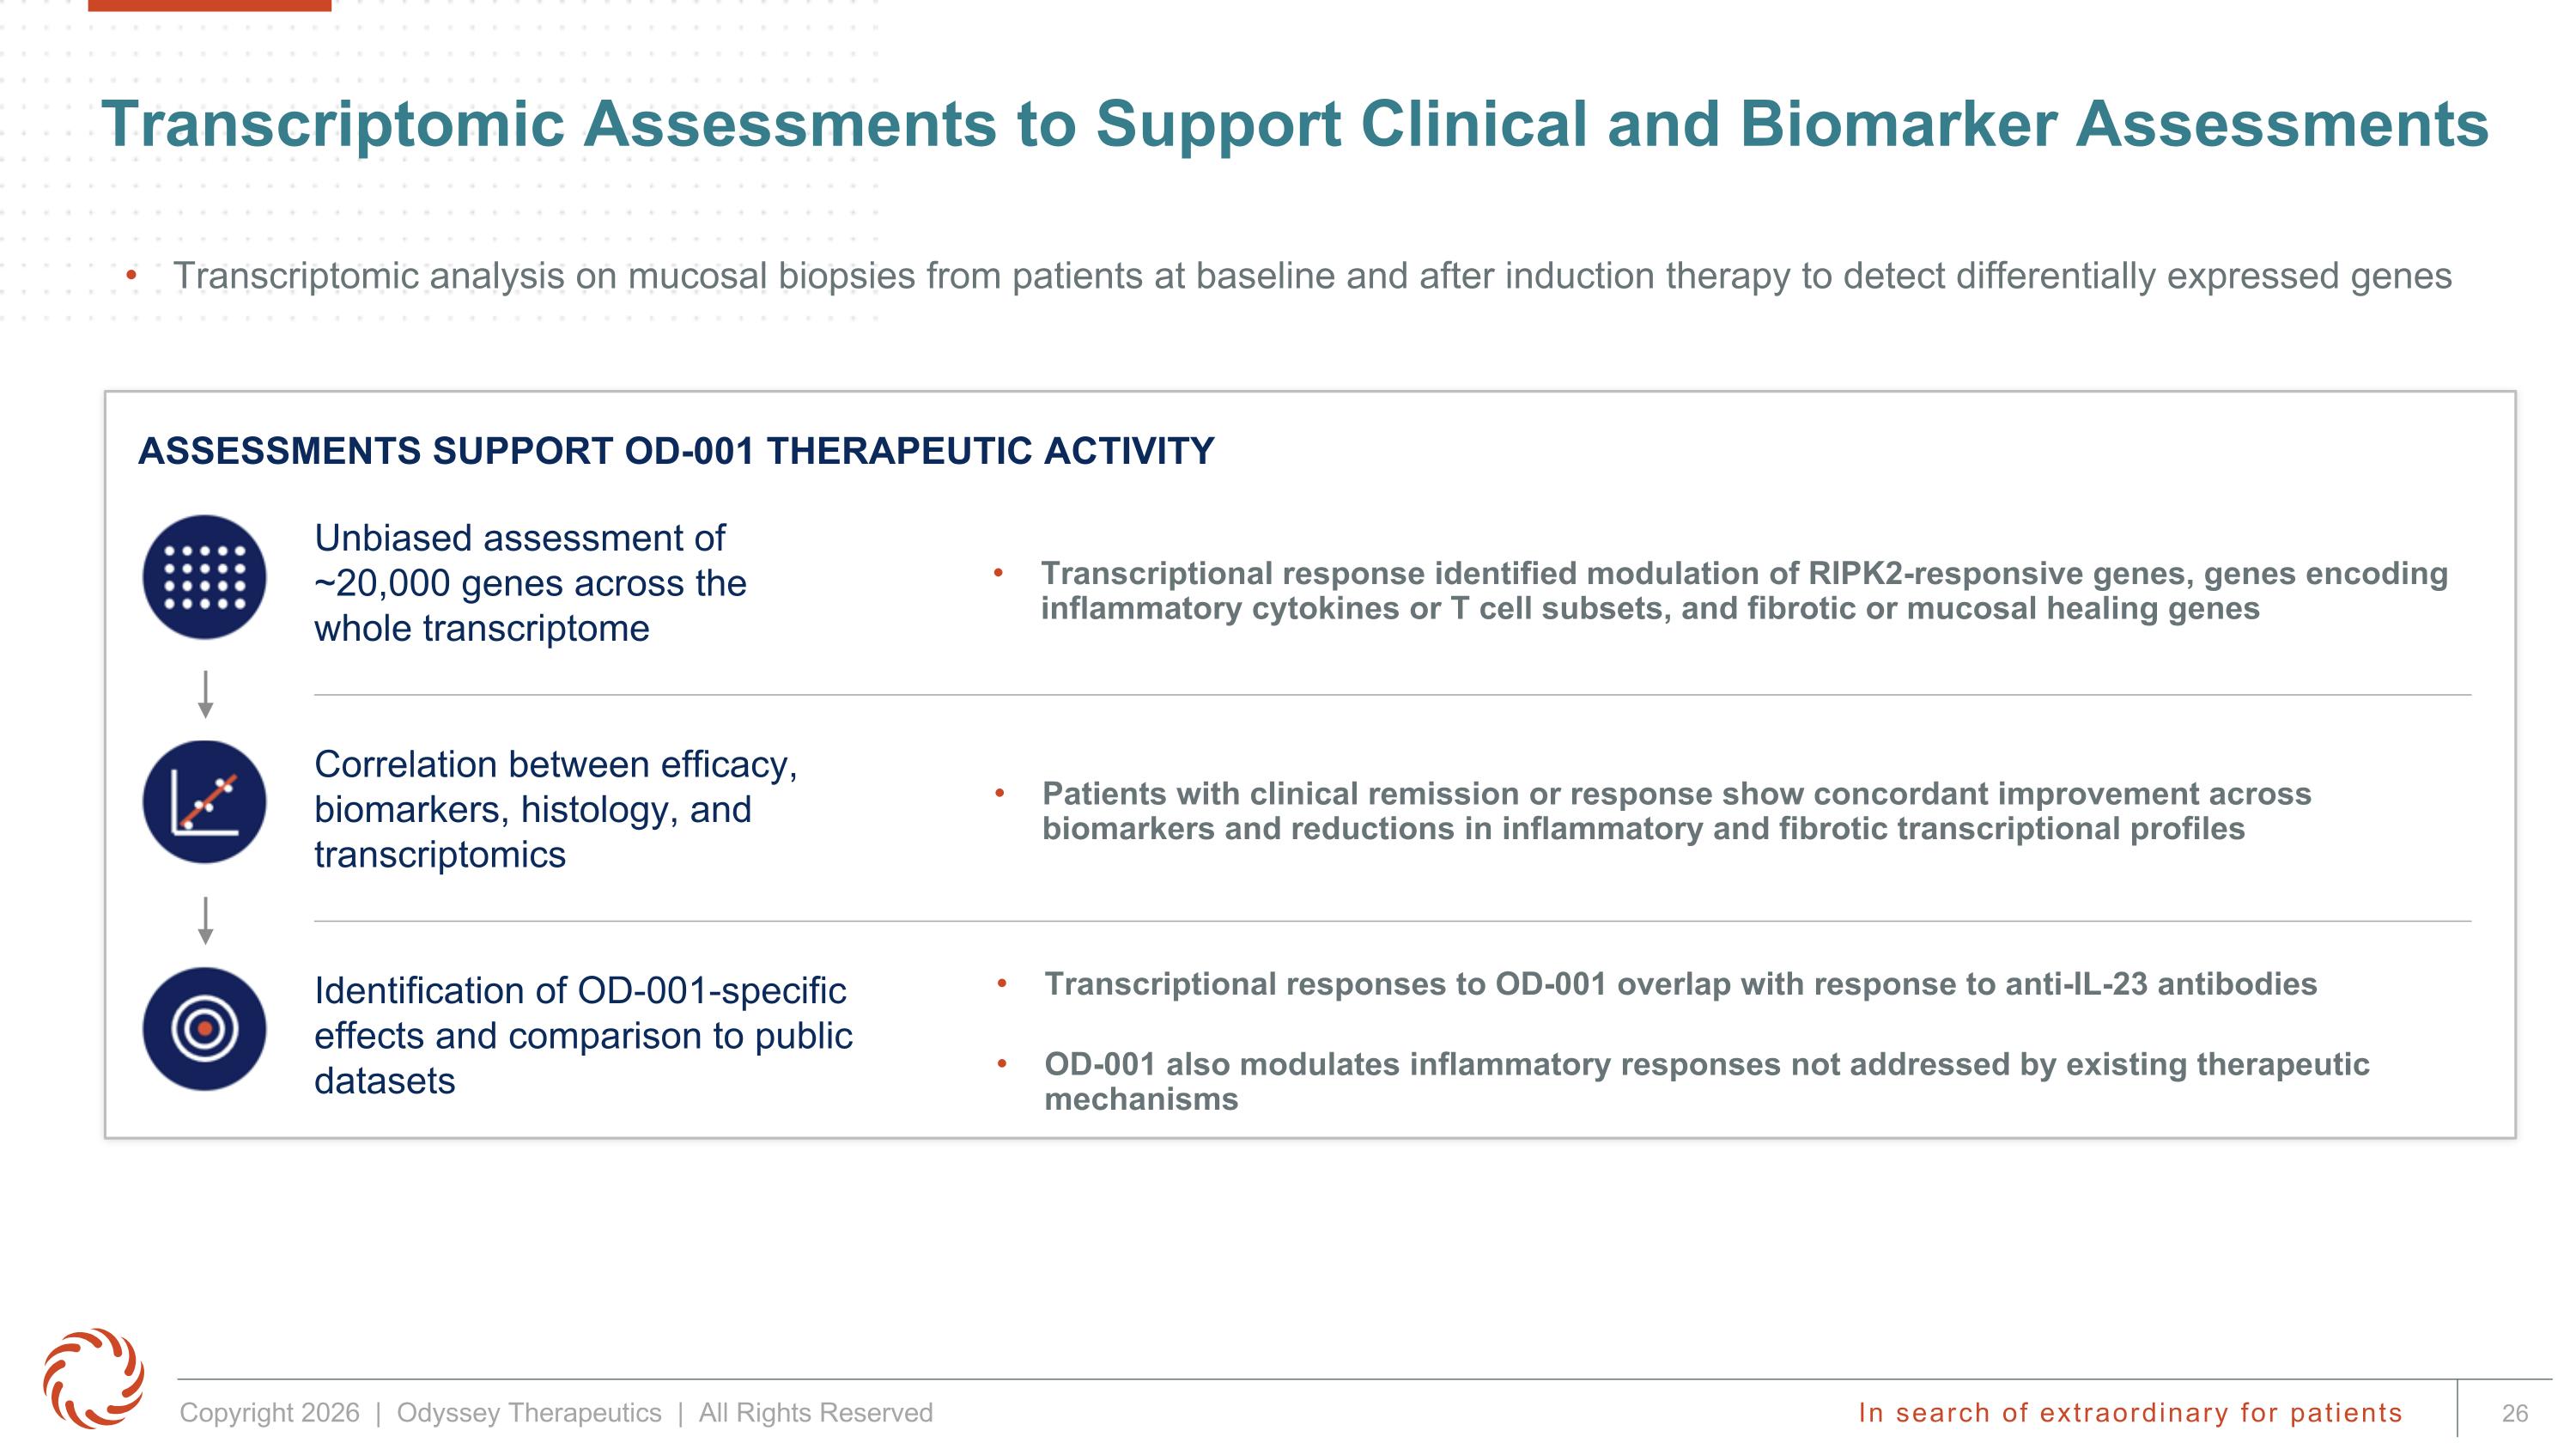
Transcriptomic analysis on mucosal biopsies from patients at baseline and after induction therapy to detect differentially expressed genes Transcriptomic Assessments to Support Clinical and Biomarker Assessments ASSESSMENTS SUPPORT OD-001 THERAPEUTIC ACTIVITY Unbiased assessment of ~20,000 genes across the whole transcriptome Identification of OD-001-specific effects and comparison to public datasets Correlation between efficacy, biomarkers, histology, and transcriptomics Transcriptional response identified modulation of RIPK2-responsive genes, genes encoding inflammatory cytokines or T cell subsets, and fibrotic or mucosal healing genes Patients with clinical remission or response show concordant improvement across biomarkers and reductions in inflammatory and fibrotic transcriptional profiles Transcriptional responses to OD-001 overlap with response to anti-IL-23 antibodies OD-001 also modulates inflammatory responses not addressed by existing therapeutic mechanisms
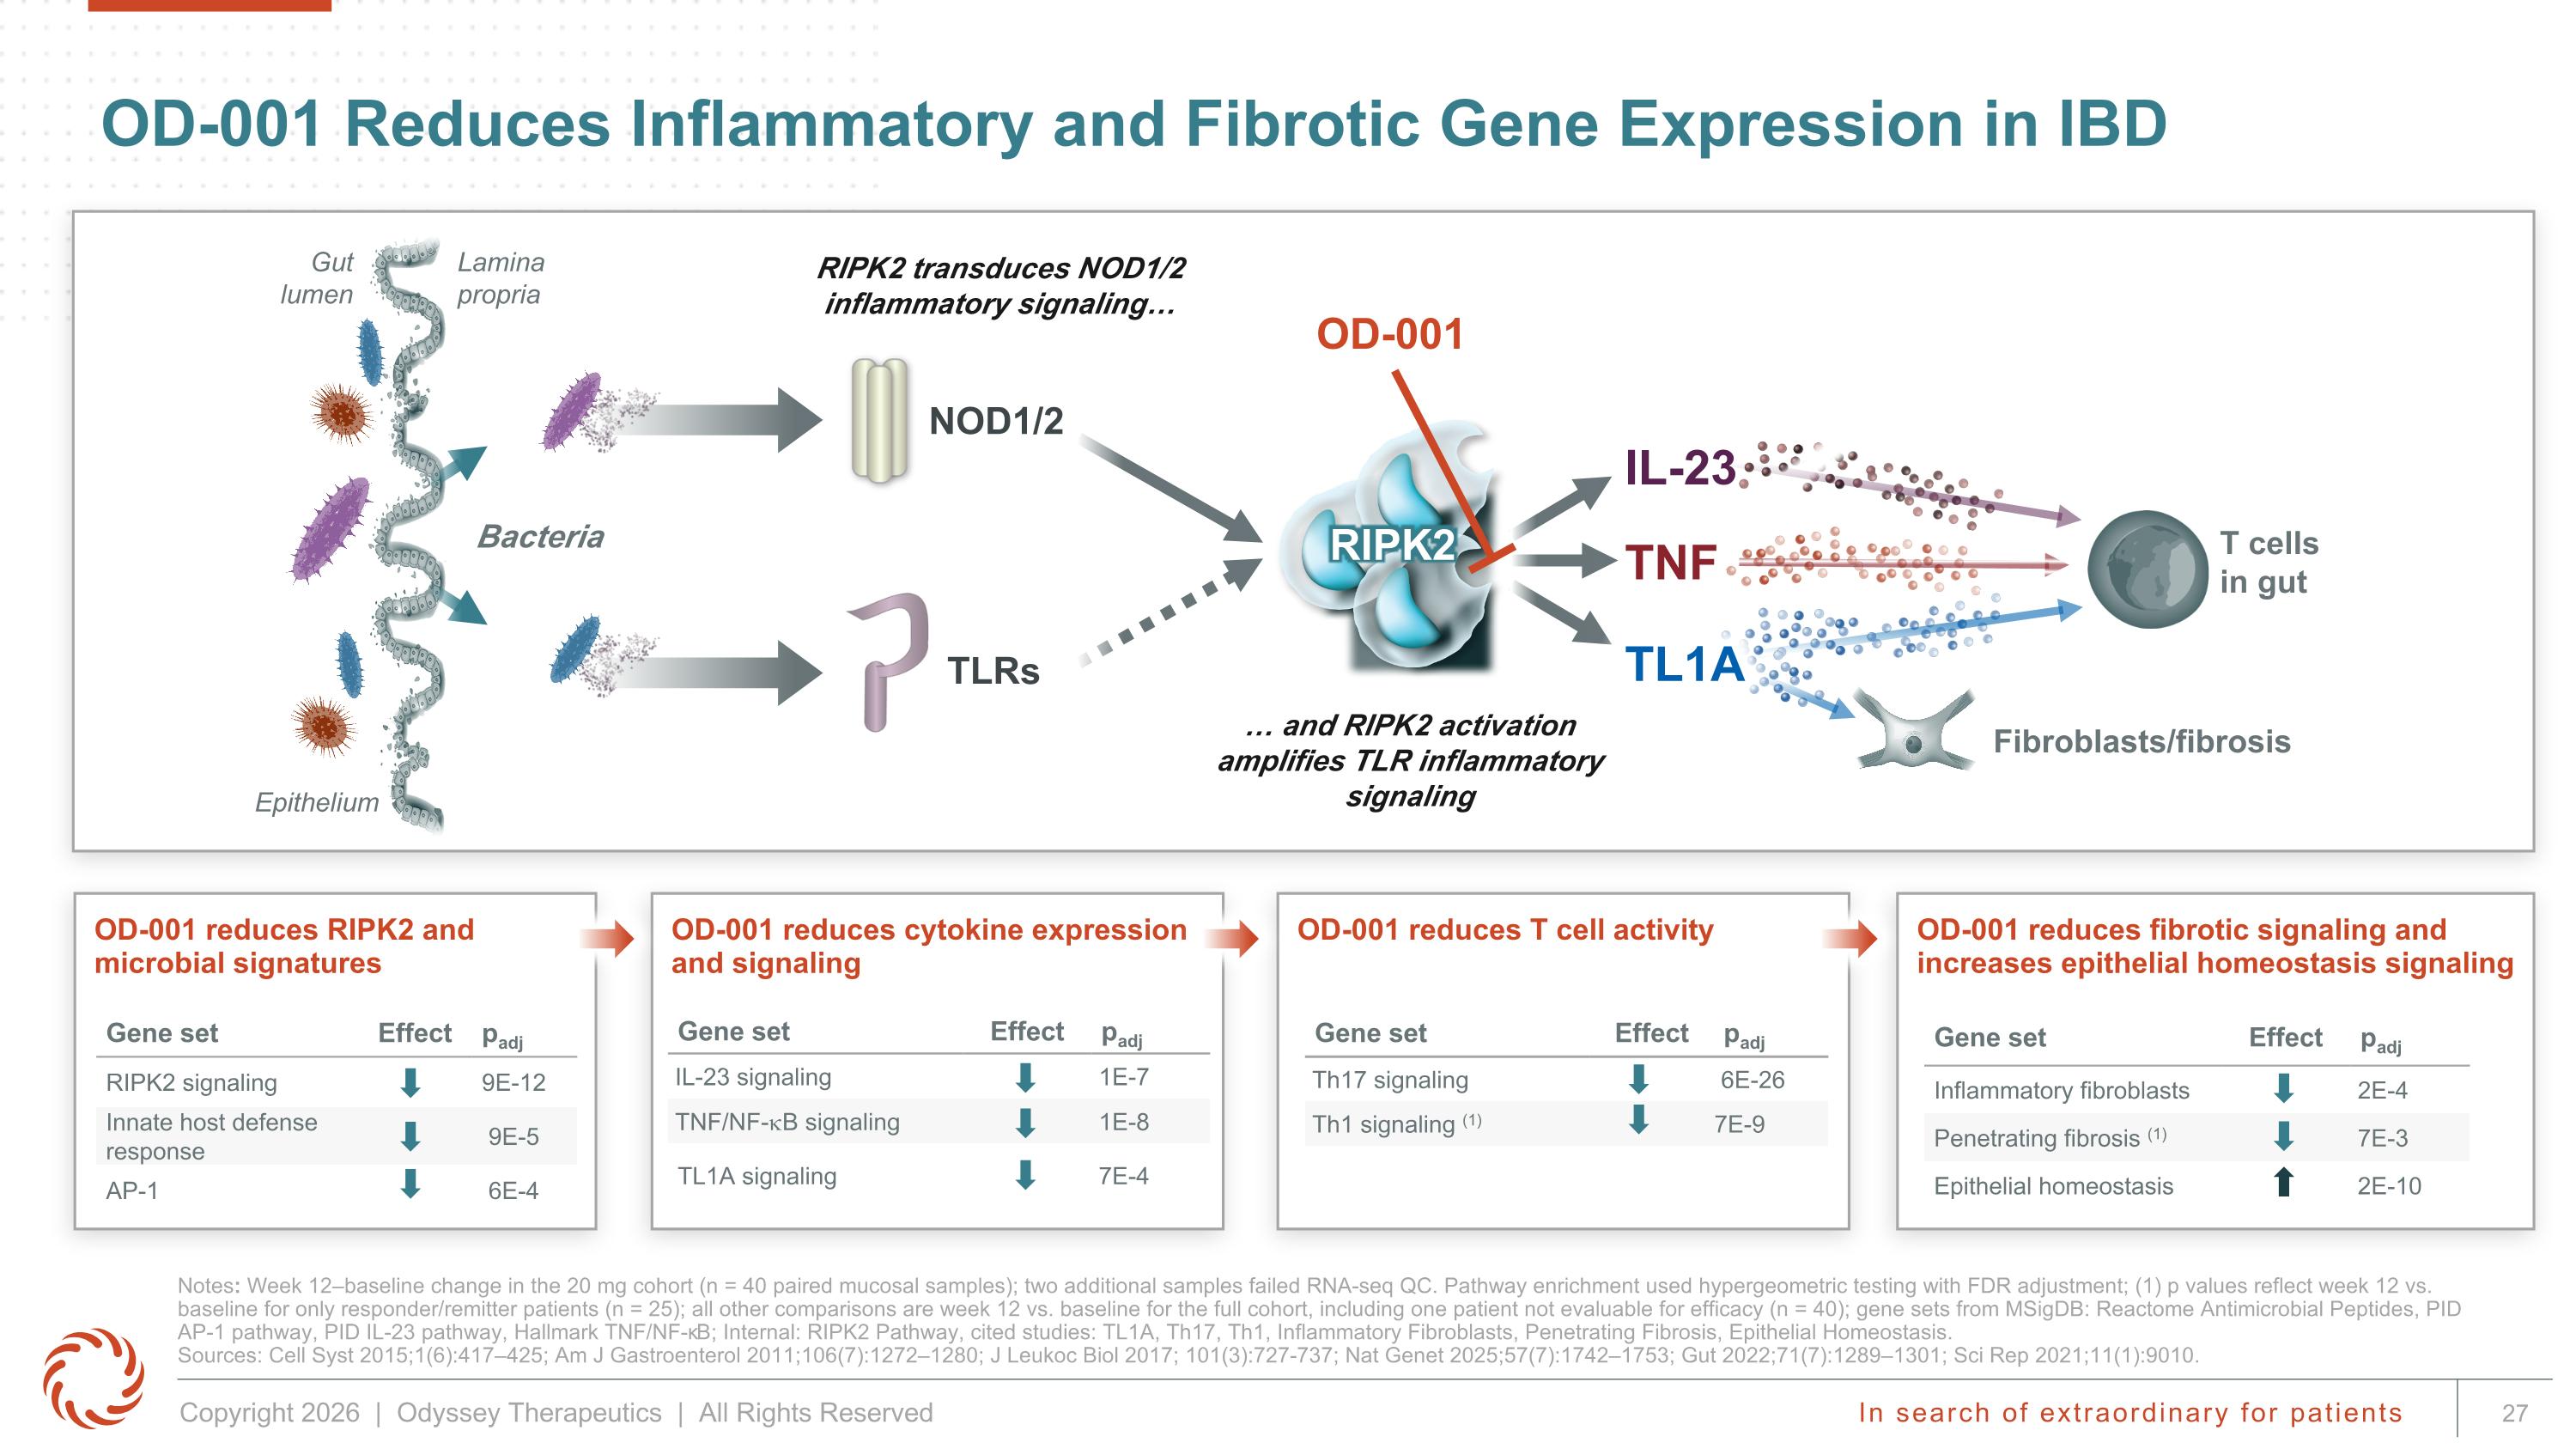
OD-001 reduces RIPK2 and microbial signatures OD-001 reduces cytokine expression and signaling OD-001 reduces T cell activity OD-001 reduces fibrotic signaling and increases epithelial homeostasis signaling OD-001 Reduces Inflammatory and Fibrotic Gene Expression in IBD Notes: Week 12–baseline change in the 20 mg cohort (n = 40 paired mucosal samples); two additional samples failed RNA-seq QC. Pathway enrichment used hypergeometric testing with FDR adjustment; (1) p values reflect week 12 vs. baseline for only responder/remitter patients (n = 25); all other comparisons are week 12 vs. baseline for the full cohort, including one patient not evaluable for efficacy (n = 40); gene sets from MSigDB: Reactome Antimicrobial Peptides, PID AP-1 pathway, PID IL-23 pathway, Hallmark TNF/NF-κB; Internal: RIPK2 Pathway, cited studies: TL1A, Th17, Th1, Inflammatory Fibroblasts, Penetrating Fibrosis, Epithelial Homeostasis. Sources: Cell Syst 2015;1(6):417–425; Am J Gastroenterol 2011;106(7):1272–1280; J Leukoc Biol 2017; 101(3):727-737; Nat Genet 2025;57(7):1742–1753; Gut 2022;71(7):1289–1301; Sci Rep 2021;11(1):9010. Gene set Effect padj RIPK2 signaling 9E-12 Innate host defense response 9E-5 AP-1 6E-4 Gene set Effect padj IL-23 signaling 1E-7 TNF/NF-kB signaling 1E-8 TL1A signaling 7E-4 Gene set Effect padj Th17 signaling 6E-26 Th1 signaling (1) 7E-9 Gene set Effect padj Inflammatory fibroblasts 2E-4 Penetrating fibrosis (1) 7E-3 Epithelial homeostasis 2E-10 Lamina propria TLRs NOD1/2 T cells in gut IL-23 TNF Bacteria Gut lumen RIPK2 transduces NOD1/2 inflammatory signaling… … and RIPK2 activation amplifies TLR inflammatory signaling RIPK2 Epithelium Fibroblasts/fibrosis TL1A OD-001
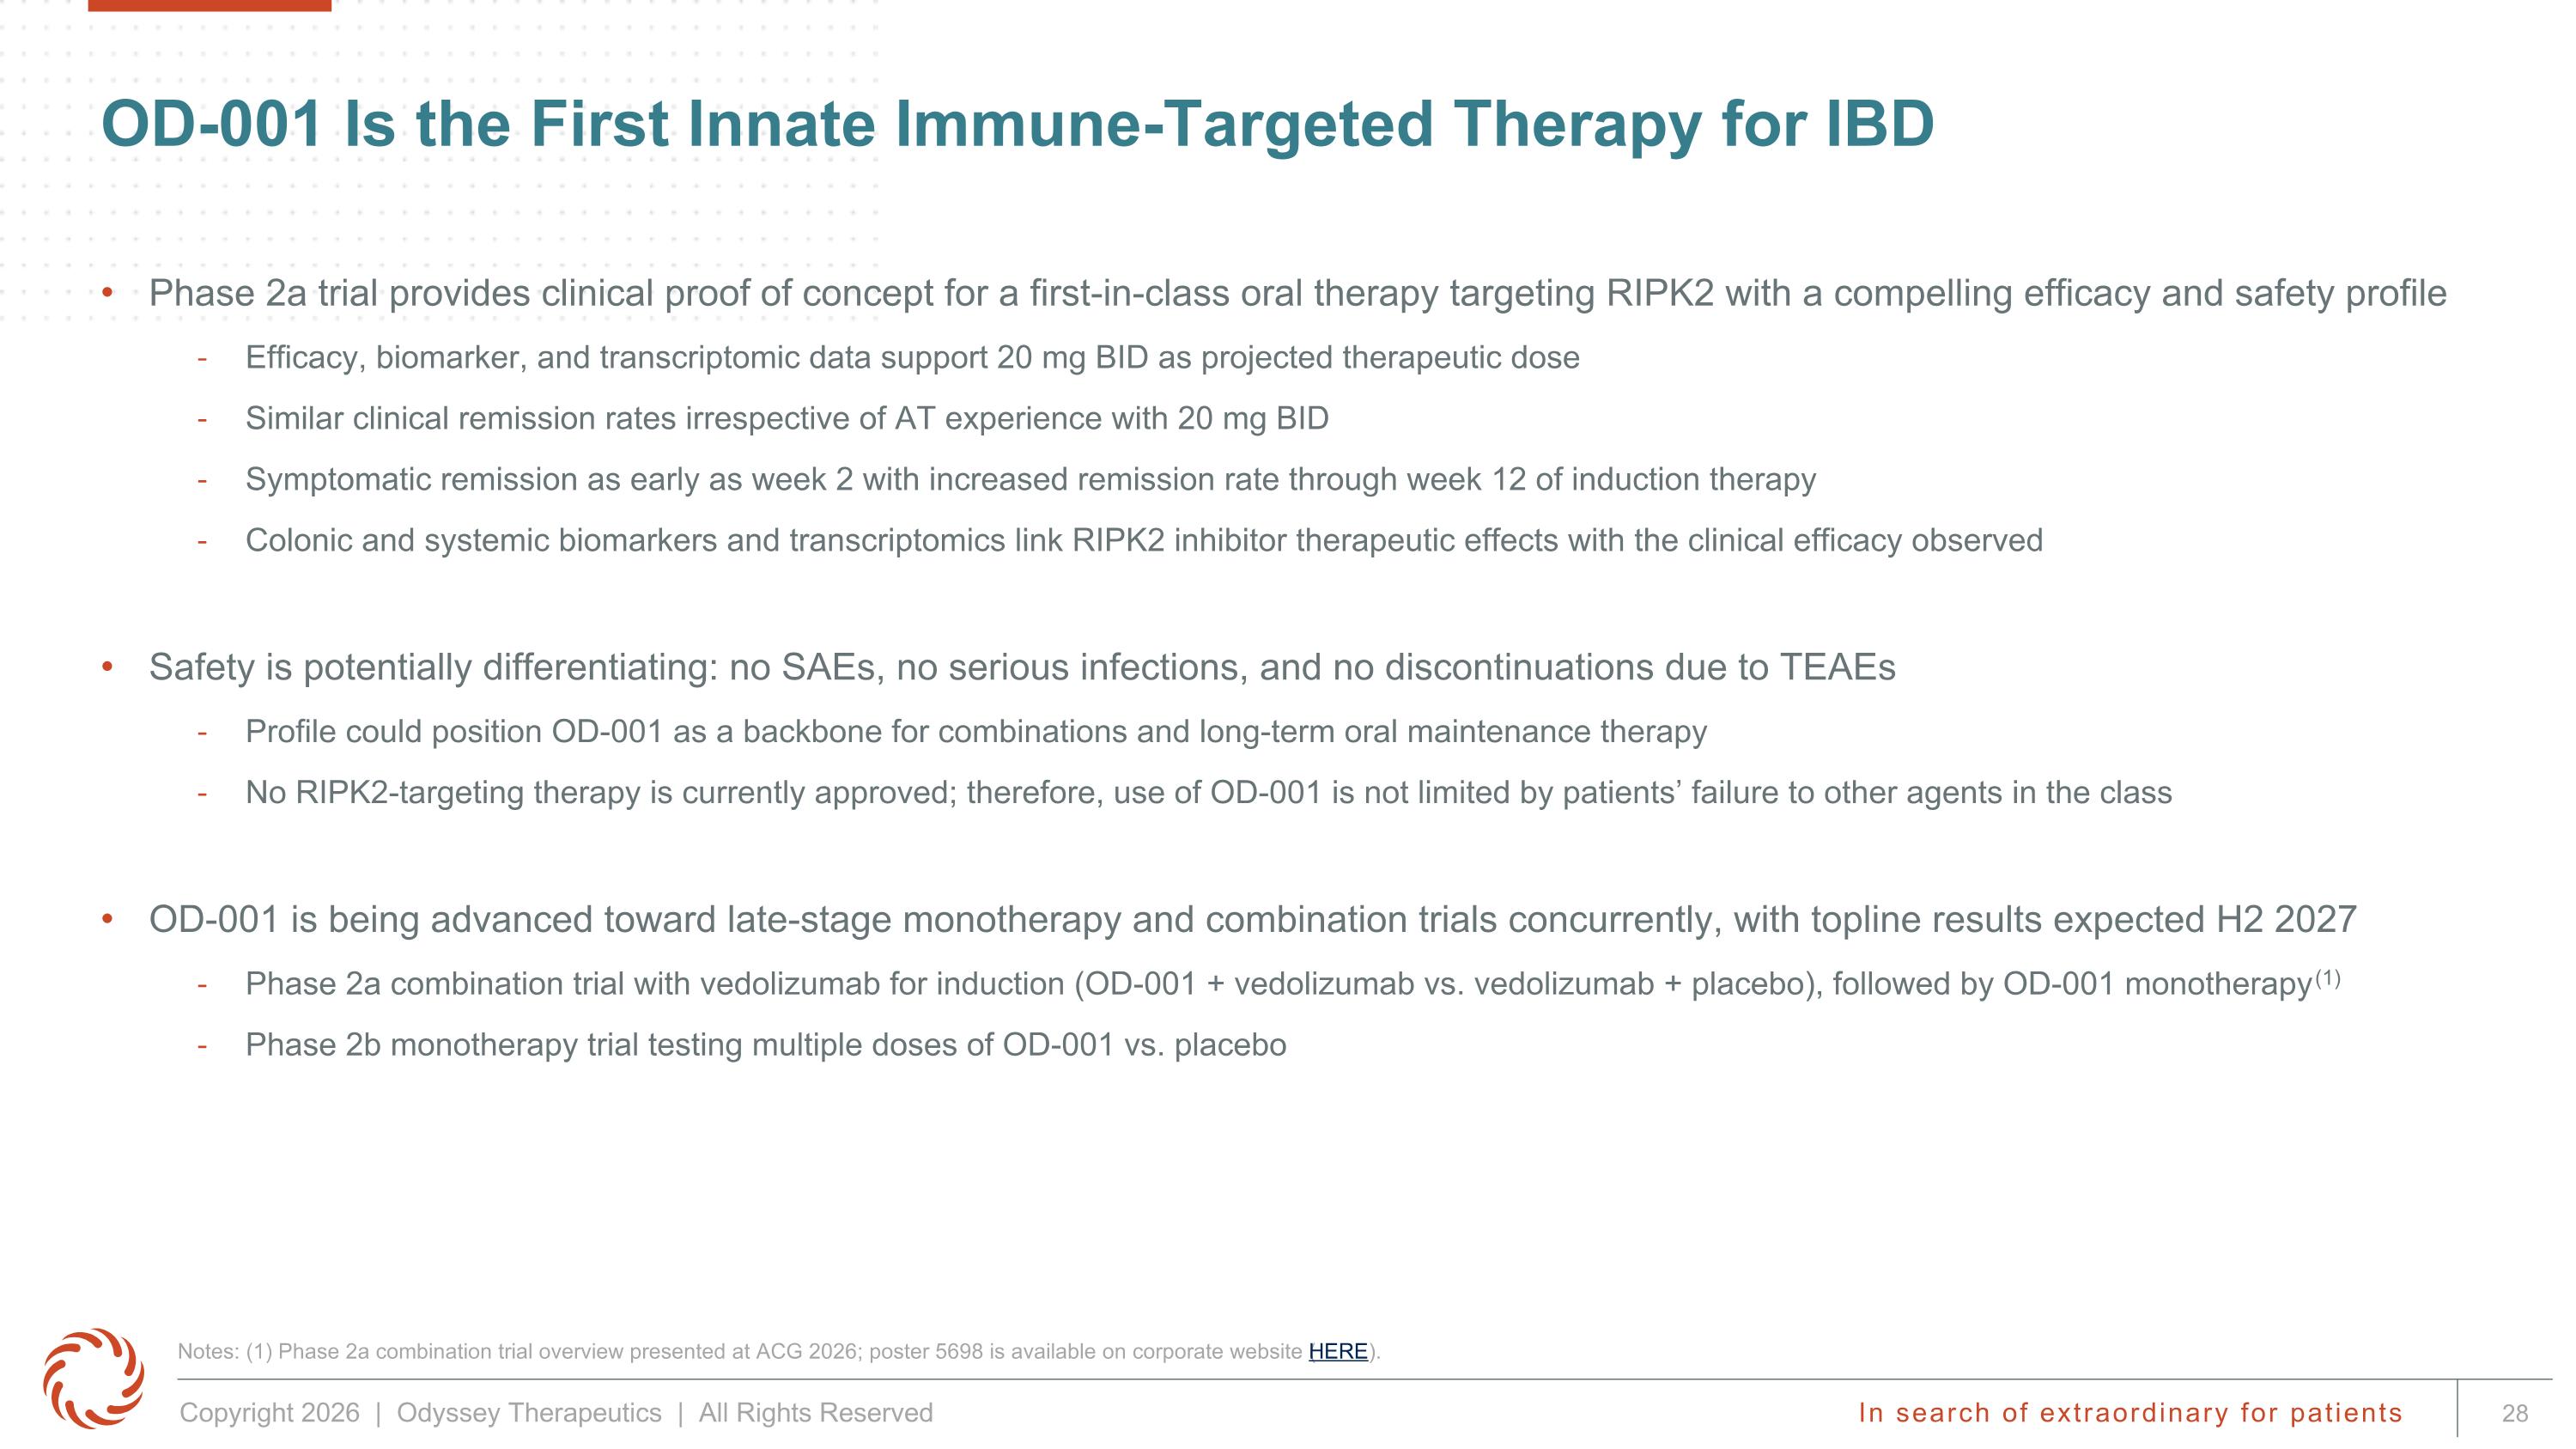
OD-001 Is the First Innate Immune-Targeted Therapy for IBD Phase 2a trial provides clinical proof of concept for a first-in-class oral therapy targeting RIPK2 with a compelling efficacy and safety profile Efficacy, biomarker, and transcriptomic data support 20 mg BID as projected therapeutic dose Similar clinical remission rates irrespective of AT experience with 20 mg BID Symptomatic remission as early as week 2 with increased remission rate through week 12 of induction therapy Colonic and systemic biomarkers and transcriptomics link RIPK2 inhibitor therapeutic effects with the clinical efficacy observed Safety is potentially differentiating: no SAEs, no serious infections, and no discontinuations due to TEAEs Profile could position OD-001 as a backbone for combinations and long-term oral maintenance therapy No RIPK2-targeting therapy is currently approved; therefore, use of OD-001 is not limited by patients’ failure to other agents in the class OD-001 is being advanced toward late-stage monotherapy and combination trials concurrently, with topline results expected H2 2027 Phase 2a combination trial with vedolizumab for induction (OD-001 + vedolizumab vs. vedolizumab + placebo), followed by OD-001 monotherapy (1) Phase 2b monotherapy trial testing multiple doses of OD-001 vs. placebo Notes: (1) Phase 2a combination trial overview presented at ACG 2026; poster 5698 is available on corporate website (HERE).
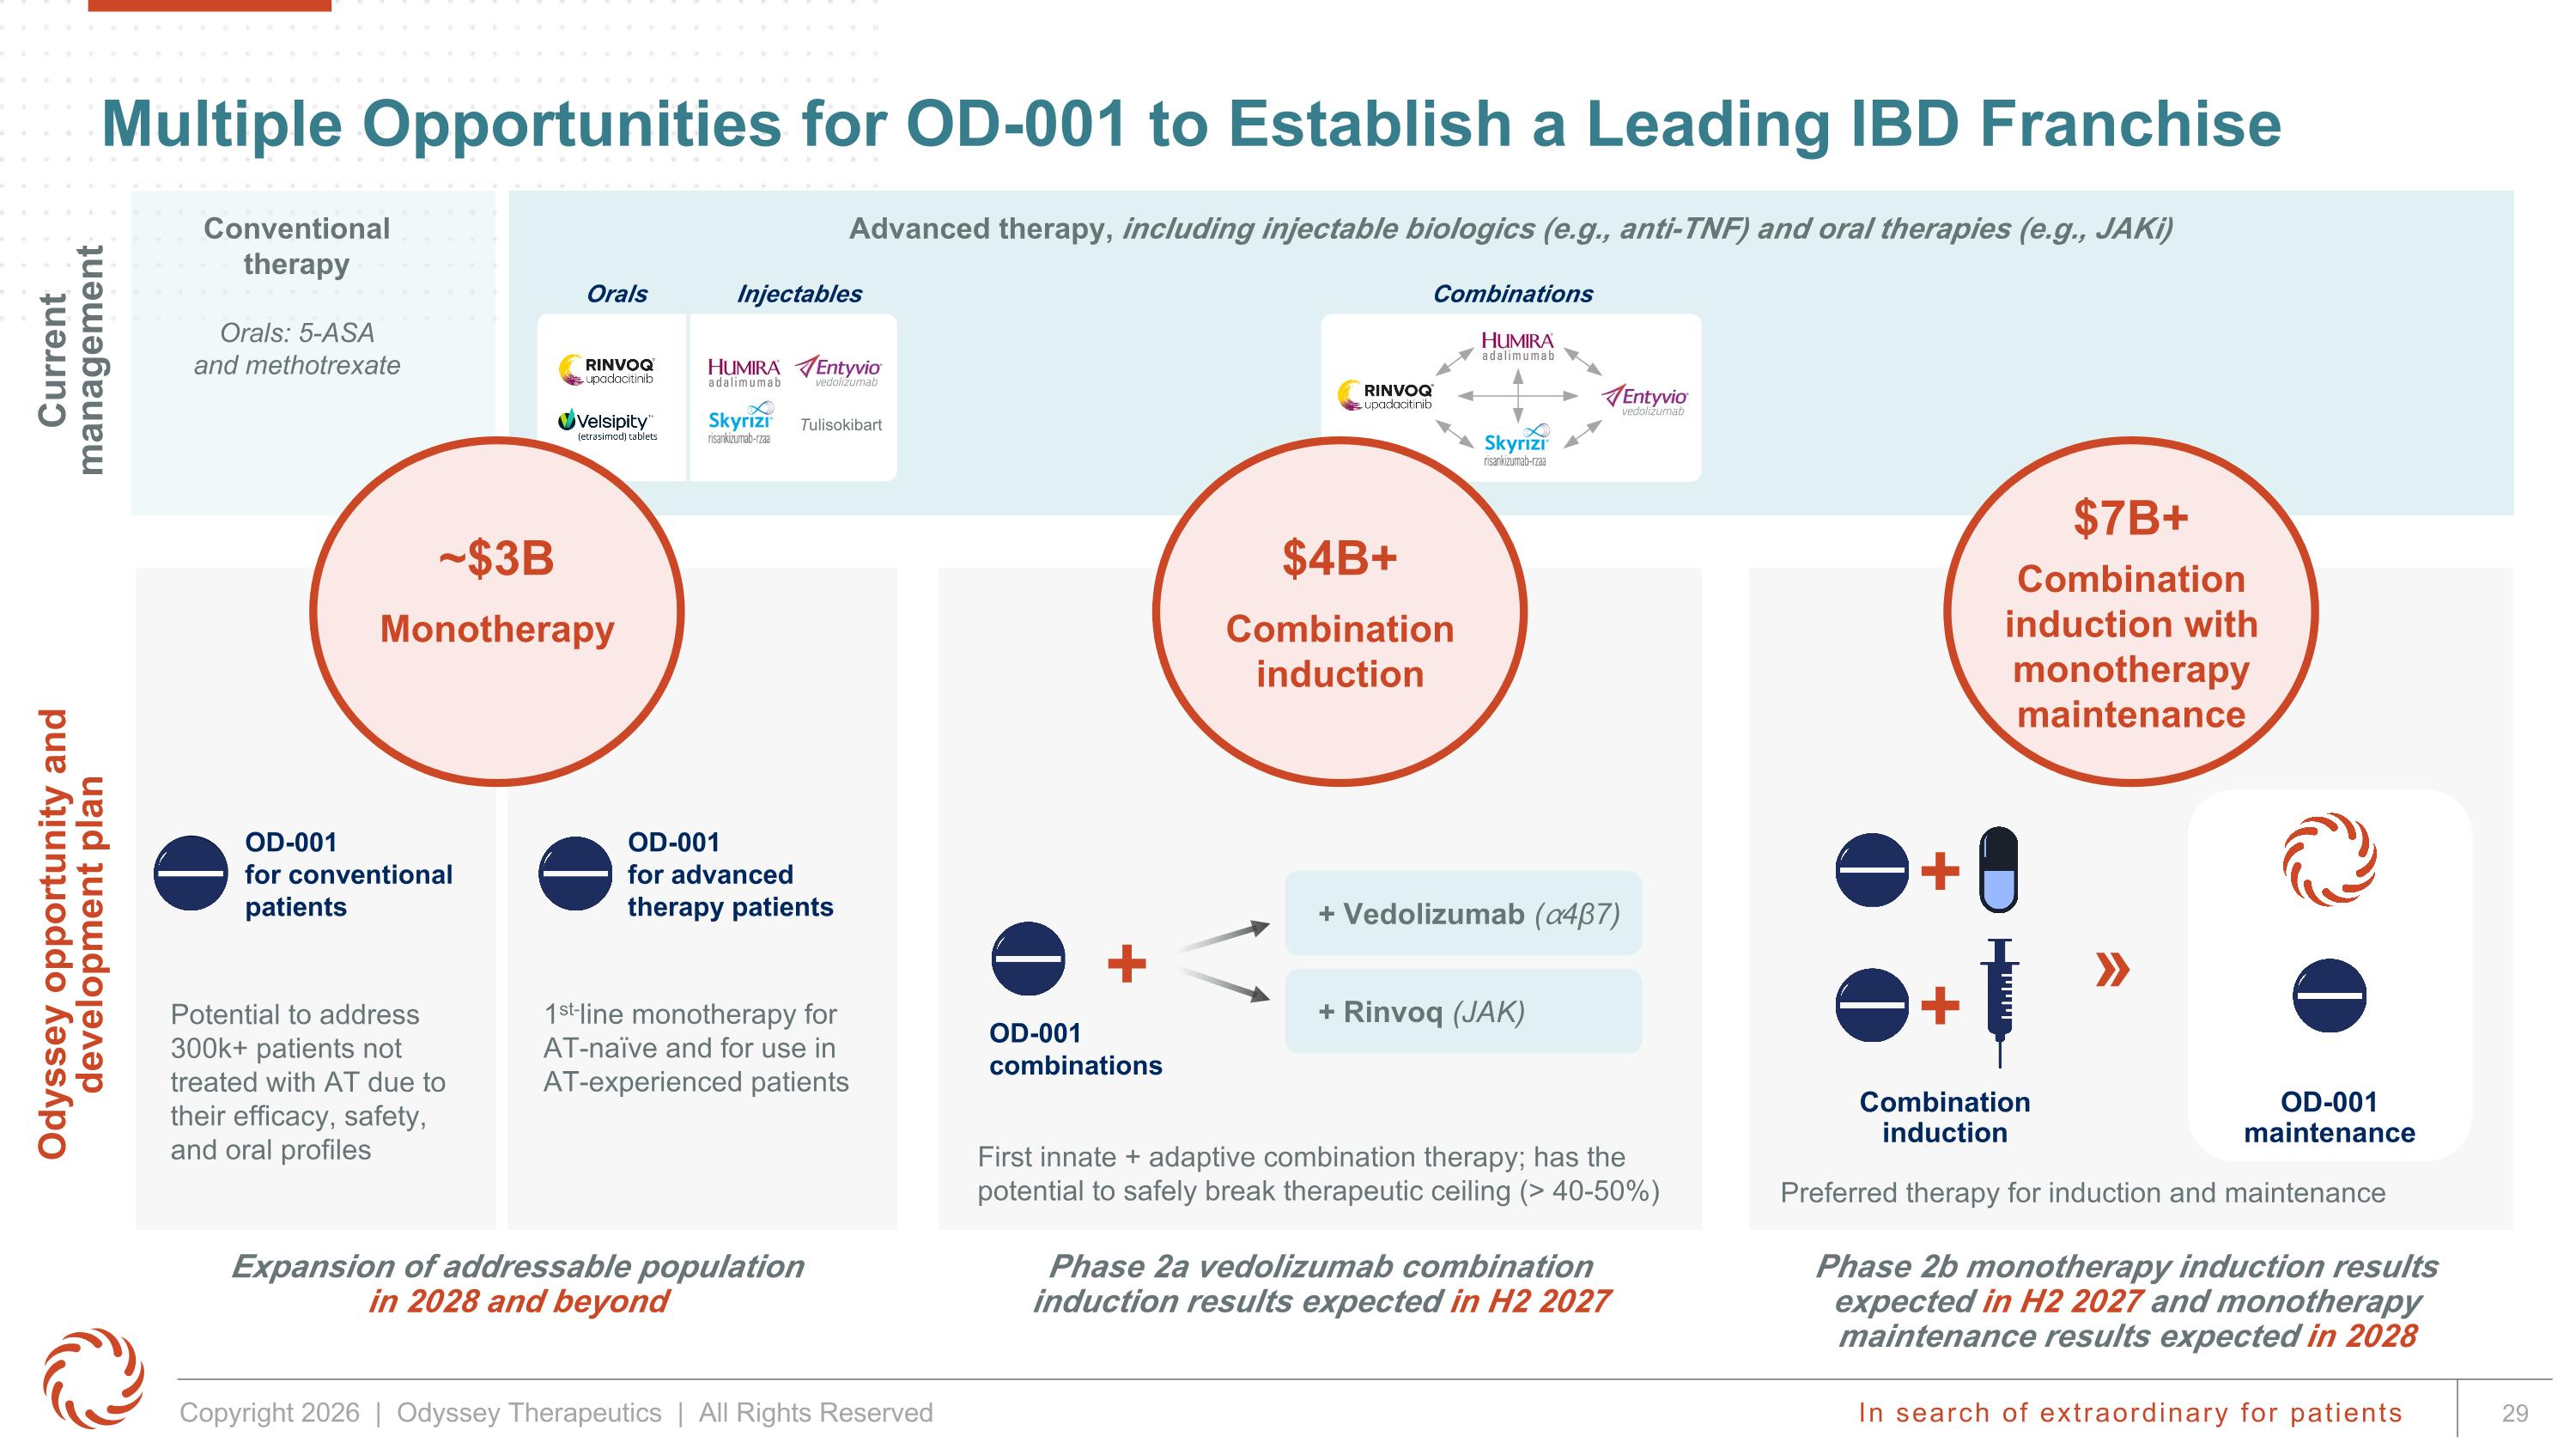
Multiple Opportunities for OD-001 to Establish a Leading IBD Franchise Conventional therapy Phase 2a vedolizumab combination induction results expected in H2 2027 Phase 2b monotherapy induction results expected in H2 2027 and monotherapy maintenance results expected in 2028 Expansion of addressable population in 2028 and beyond Potential to address 300k+ patients not treated with AT due to their efficacy, safety, and oral profiles First innate + adaptive combination therapy; has the potential to safely break therapeutic ceiling (> 40-50%) Current management Odyssey opportunity and development plan 1st-line monotherapy for AT-naïve and for use in AT-experienced patients Tulisokibart Combination induction OD-001 maintenance » + Orals: 5-ASA and methotrexate OD-001 for conventional patients OD-001 for advanced therapy patients Advanced therapy, including injectable biologics (e.g., anti-TNF) and oral therapies (e.g., JAKi) Orals Injectables Combinations $4B+ Combination induction $7B+ Combination induction with monotherapy maintenance ~$3B Monotherapy OD-001 combinations + + Vedolizumab (⍺4β7) + Rinvoq (JAK) Preferred therapy for induction and maintenance +
Oral SLC15A4 Inhibitor: OD-002 Modulating B Cell Activity and Interferon Signaling CTA Filing in H2 2026 AI Platform Drove Program From Inception to GLP Study Initiation in 15 Months
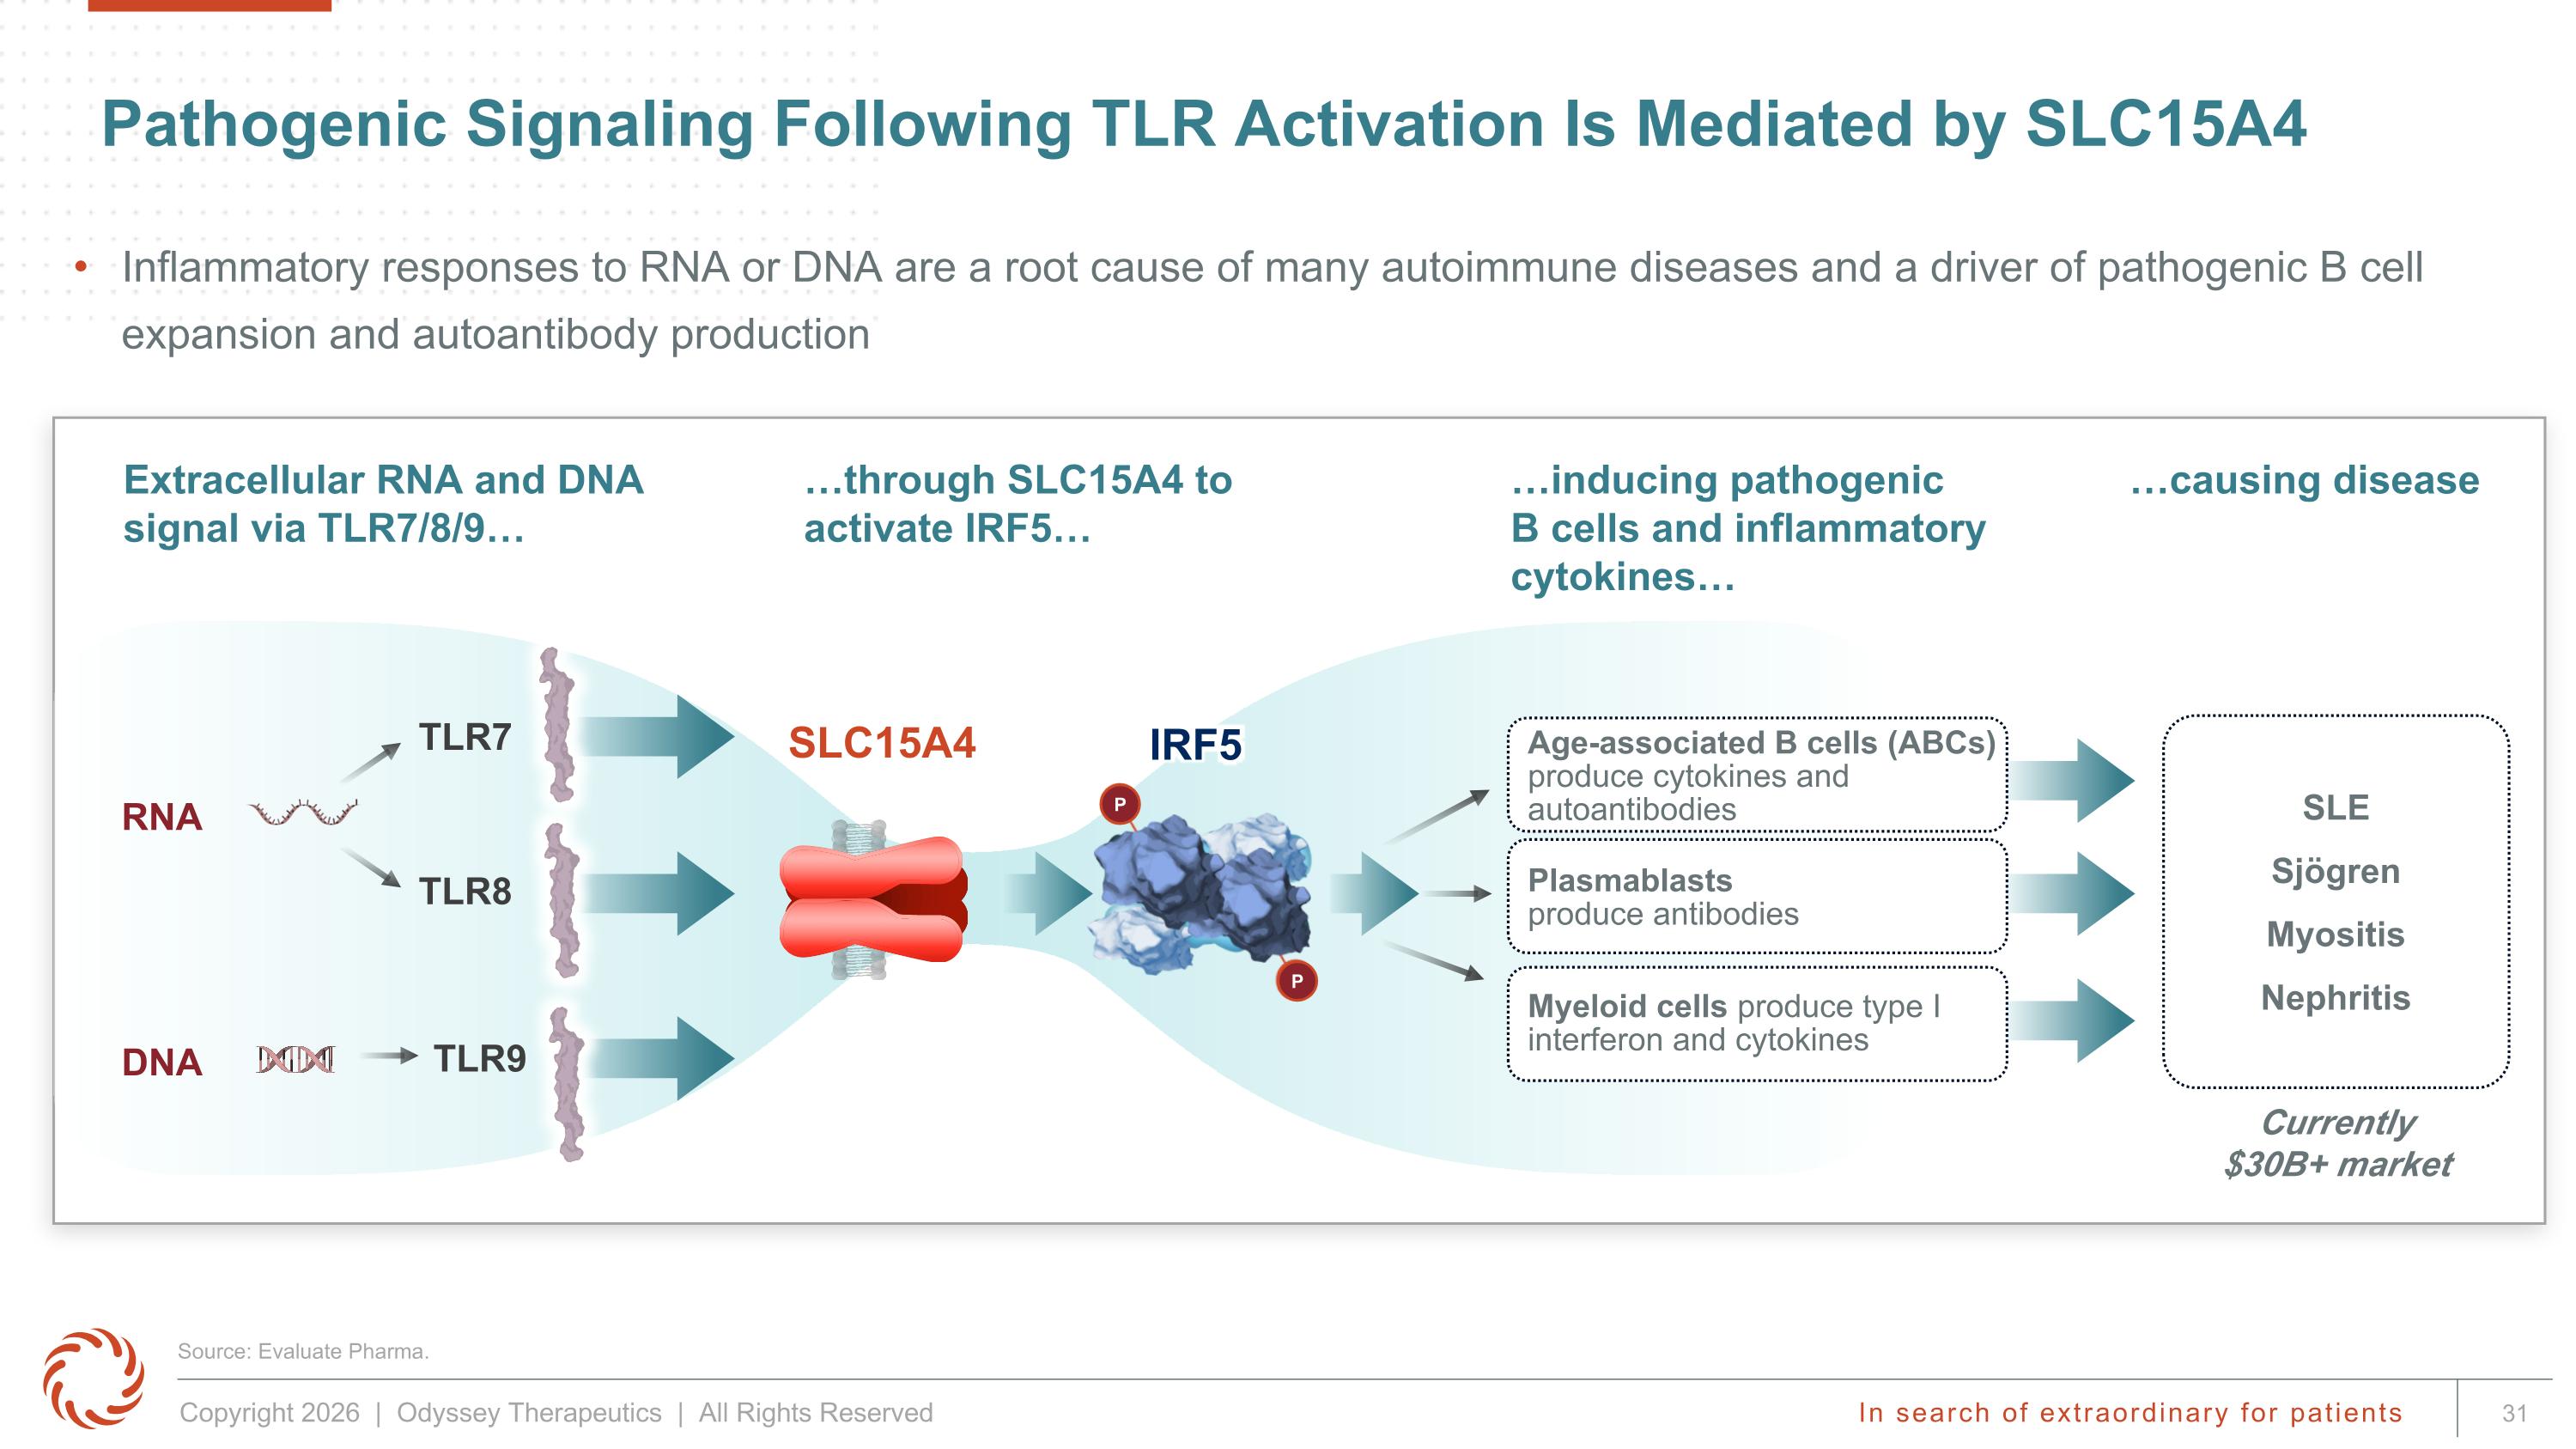
Pathogenic Signaling Following TLR Activation Is Mediated by SLC15A4 Extracellular RNA and DNA signal via TLR7/8/9… …through SLC15A4 to activate IRF5… …inducing pathogenic B cells and inflammatory cytokines… …causing disease Myeloid cells produce type I interferon and cytokines Age-associated B cells (ABCs) produce cytokines and autoantibodies Plasmablasts produce antibodies TLR8 TLR7 TLR9 SLE Sjögren Myositis Nephritis RNA SLC15A4 IRF5 P P DNA Currently $30B+ market Source: Evaluate Pharma. Inflammatory responses to RNA or DNA are a root cause of many autoimmune diseases and a driver of pathogenic B cell expansion and autoantibody production
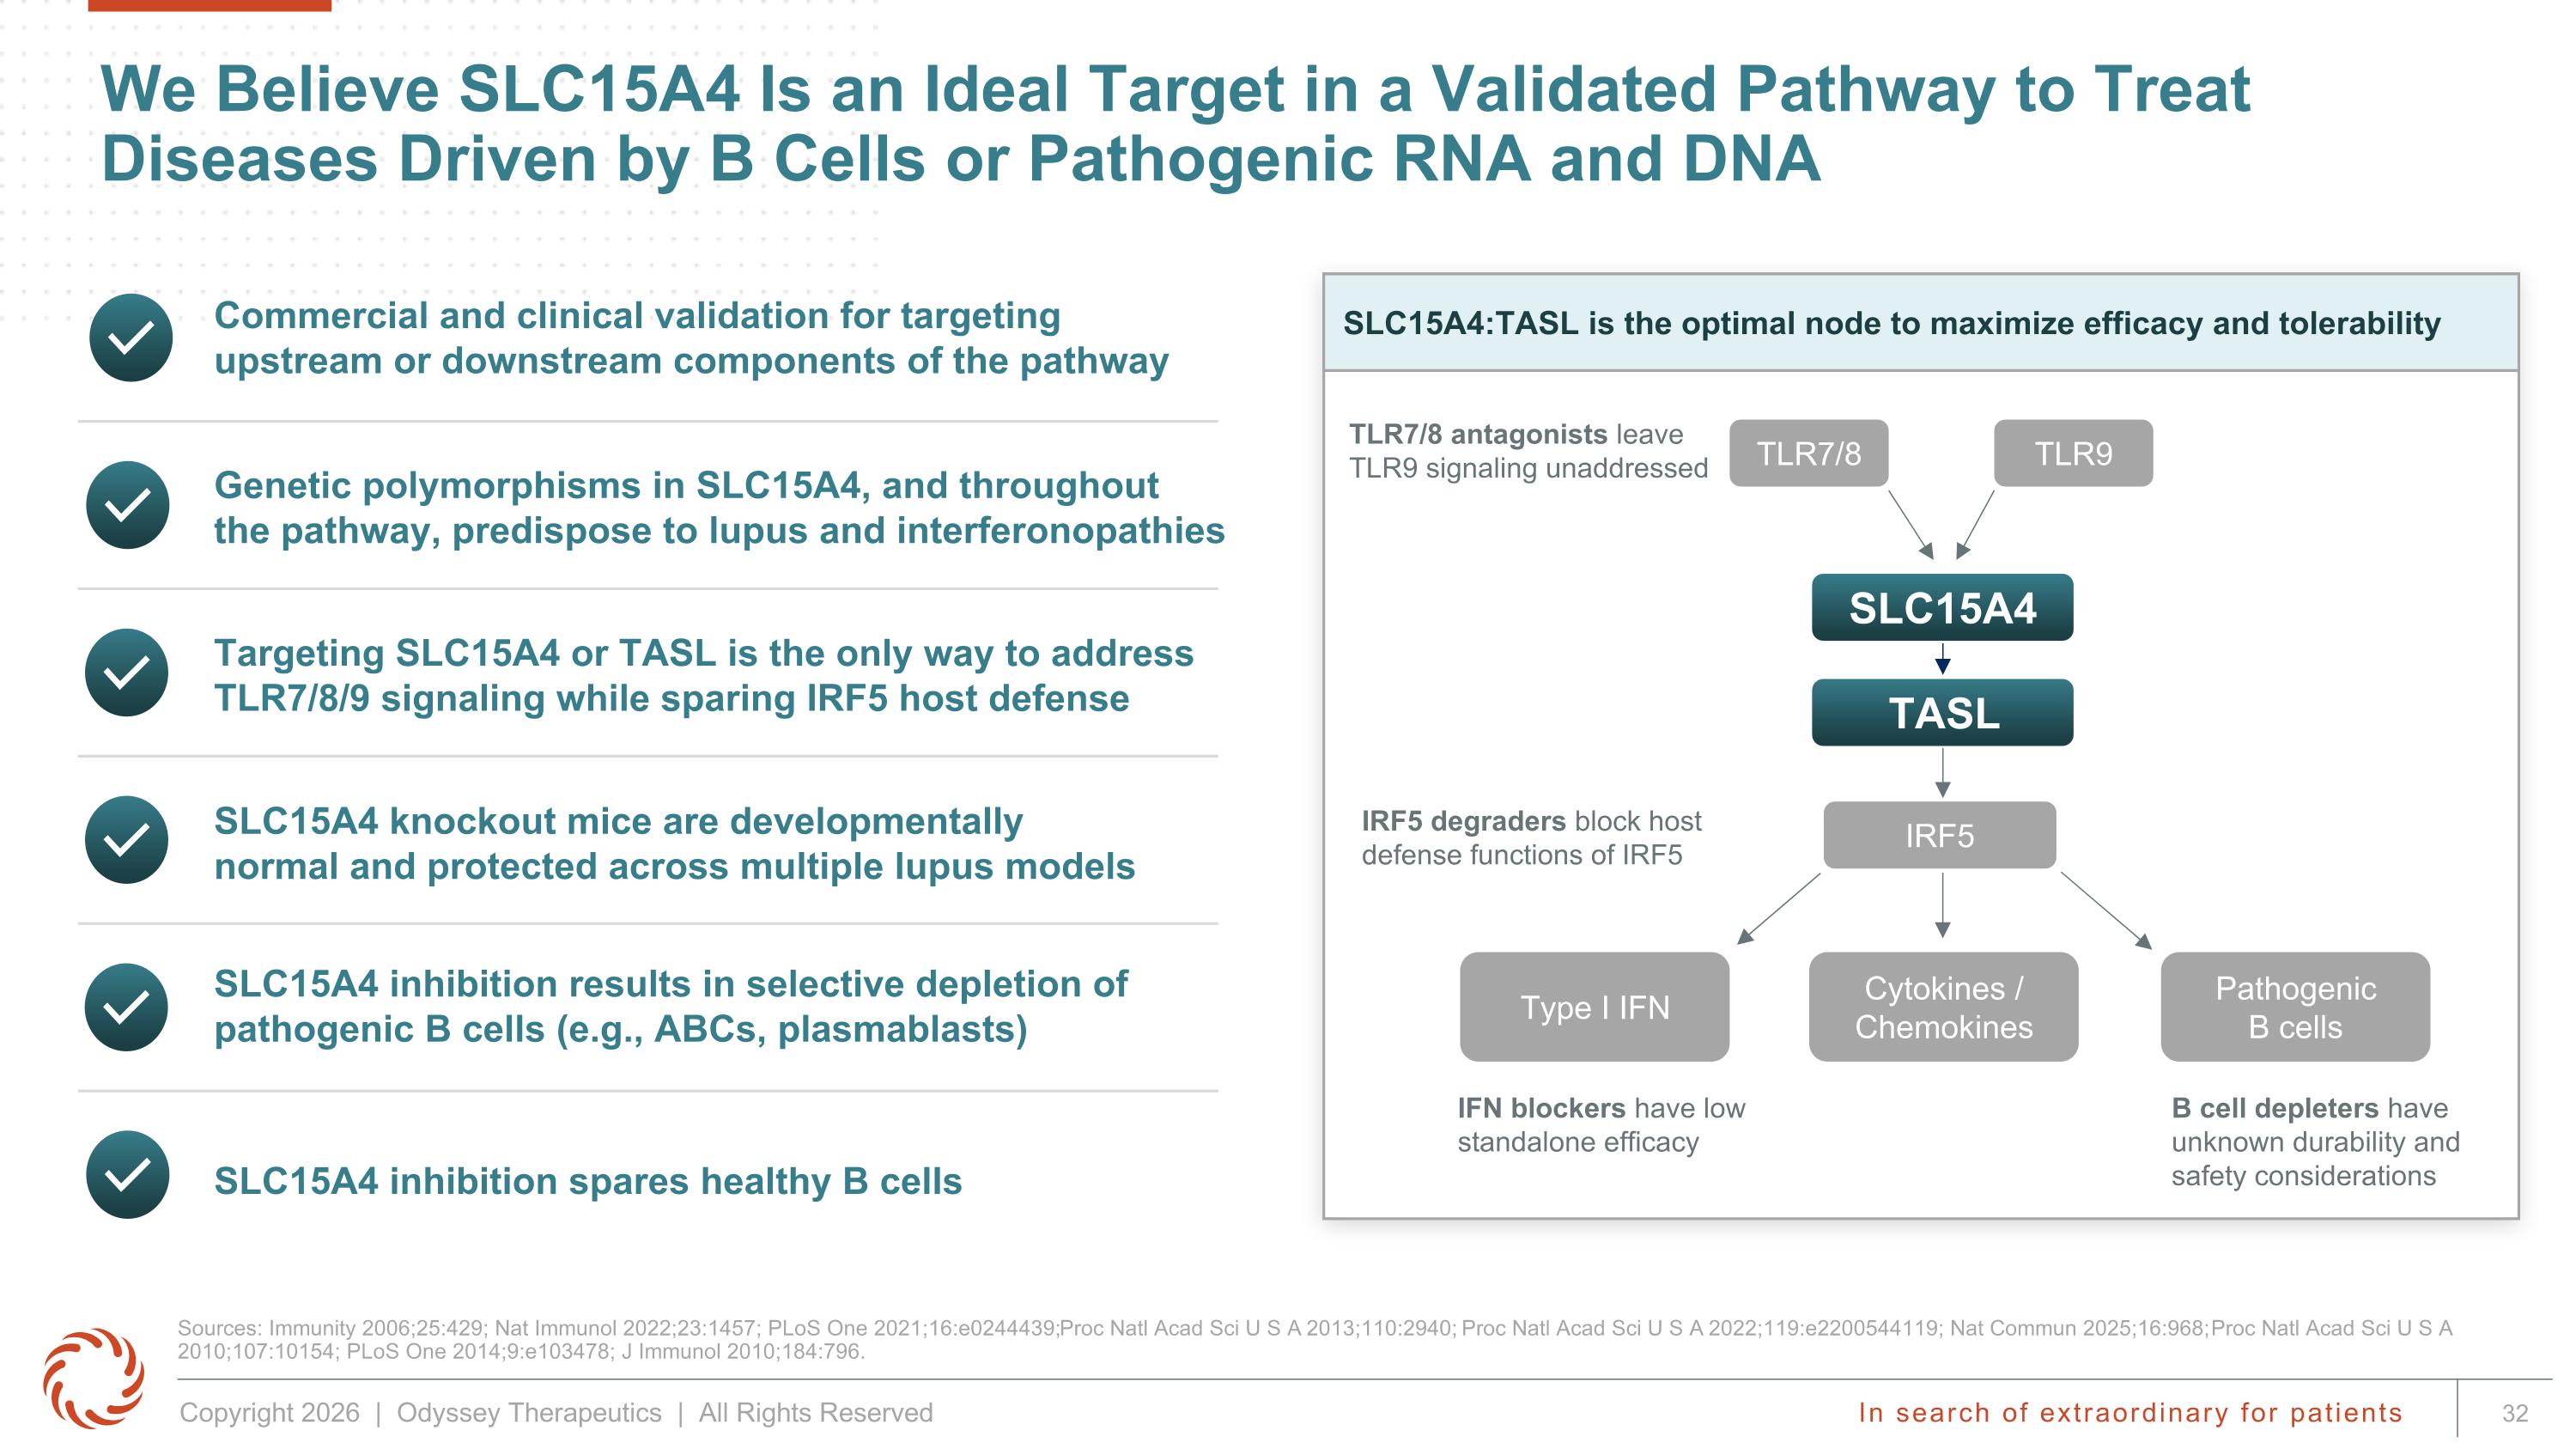
Type I IFN Pathogenic B cells Cytokines / Chemokines TASL We Believe SLC15A4 Is an Ideal Target in a Validated Pathway to Treat Diseases Driven by B Cells or Pathogenic RNA and DNA Sources: Immunity 2006;25:429; Nat Immunol 2022;23:1457; PLoS One 2021;16:e0244439; Proc Natl Acad Sci U S A 2013;110:2940; Proc Natl Acad Sci U S A 2022;119:e2200544119; Nat Commun 2025;16:968; Proc Natl Acad Sci U S A 2010;107:10154; PLoS One 2014;9:e103478; J Immunol 2010;184:796. Targeting SLC15A4 or TASL is the only way to address TLR7/8/9 signaling while sparing IRF5 host defense SLC15A4 inhibition results in selective depletion of pathogenic B cells (e.g., ABCs, plasmablasts) SLC15A4 knockout mice are developmentally normal and protected across multiple lupus models Commercial and clinical validation for targeting upstream or downstream components of the pathway Genetic polymorphisms in SLC15A4, and throughout the pathway, predispose to lupus and interferonopathies SLC15A4 inhibition spares healthy B cells SLC15A4:TASL is the optimal node to maximize efficacy and tolerability TLR7/8 antagonists leave TLR9 signaling unaddressed IRF5 degraders block host defense functions of IRF5 IFN blockers have low standalone efficacy B cell depleters have unknown durability and safety considerations TLR7/8 TLR9 IRF5 SLC15A4
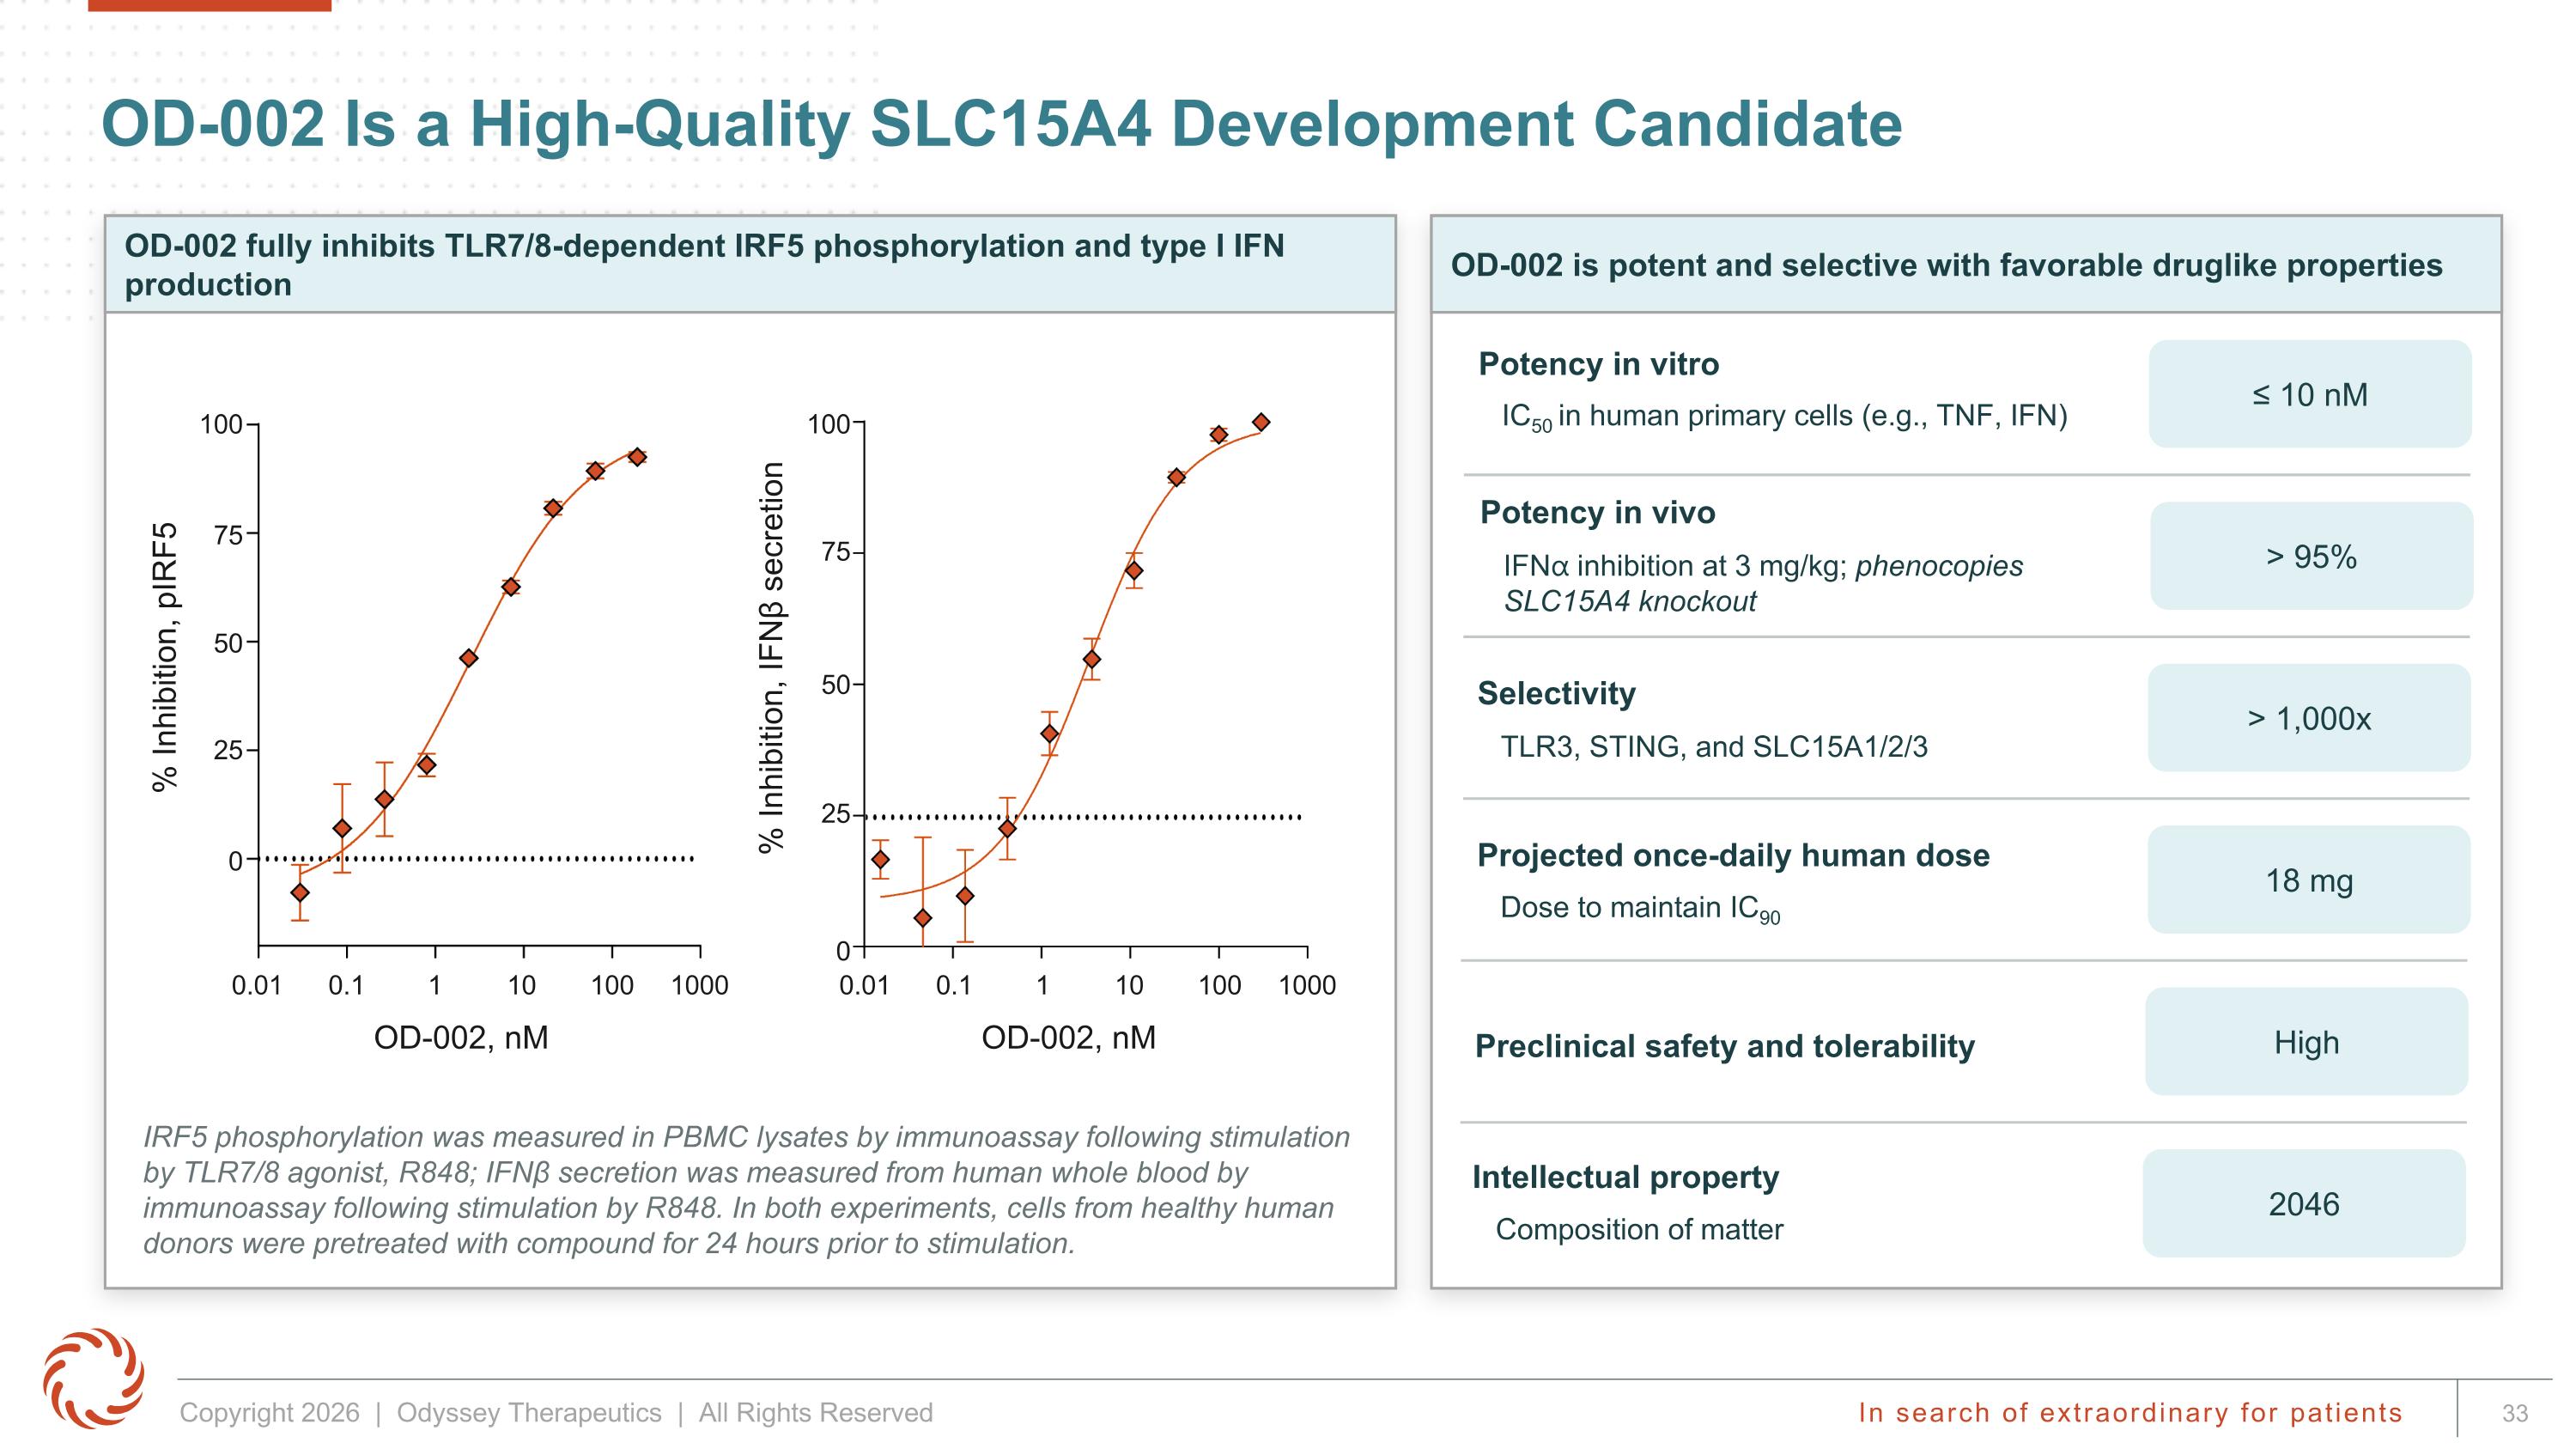
OD-002 is potent and selective with favorable druglike properties OD-002 Is a High-Quality SLC15A4 Development Candidate Potency in vitro IC50 in human primary cells (e.g., TNF, IFN) Projected once-daily human dose Dose to maintain IC90 Preclinical safety and tolerability Selectivity TLR3, STING, and SLC15A1/2/3 ≤ 10 nM > 1,000x 18 mg High Intellectual property Composition of matter 2046 Potency in vivo IFN⍺ inhibition at 3 mg/kg; phenocopies SLC15A4 knockout > 95% OD-002 fully inhibits TLR7/8-dependent IRF5 phosphorylation and type I IFN production IRF5 phosphorylation was measured in PBMC lysates by immunoassay following stimulation by TLR7/8 agonist, R848; IFNβ secretion was measured from human whole blood by immunoassay following stimulation by R848. In both experiments, cells from healthy human donors were pretreated with compound for 24 hours prior to stimulation. % Inhibition, pIRF5 100 75 50 25 0 0.01 0.1 1 10 100 1000 OD-002, nM % Inhibition, IFNβ secretion 100 75 50 25 0 0.01 0.1 1 10 100 1000 OD-002, nM
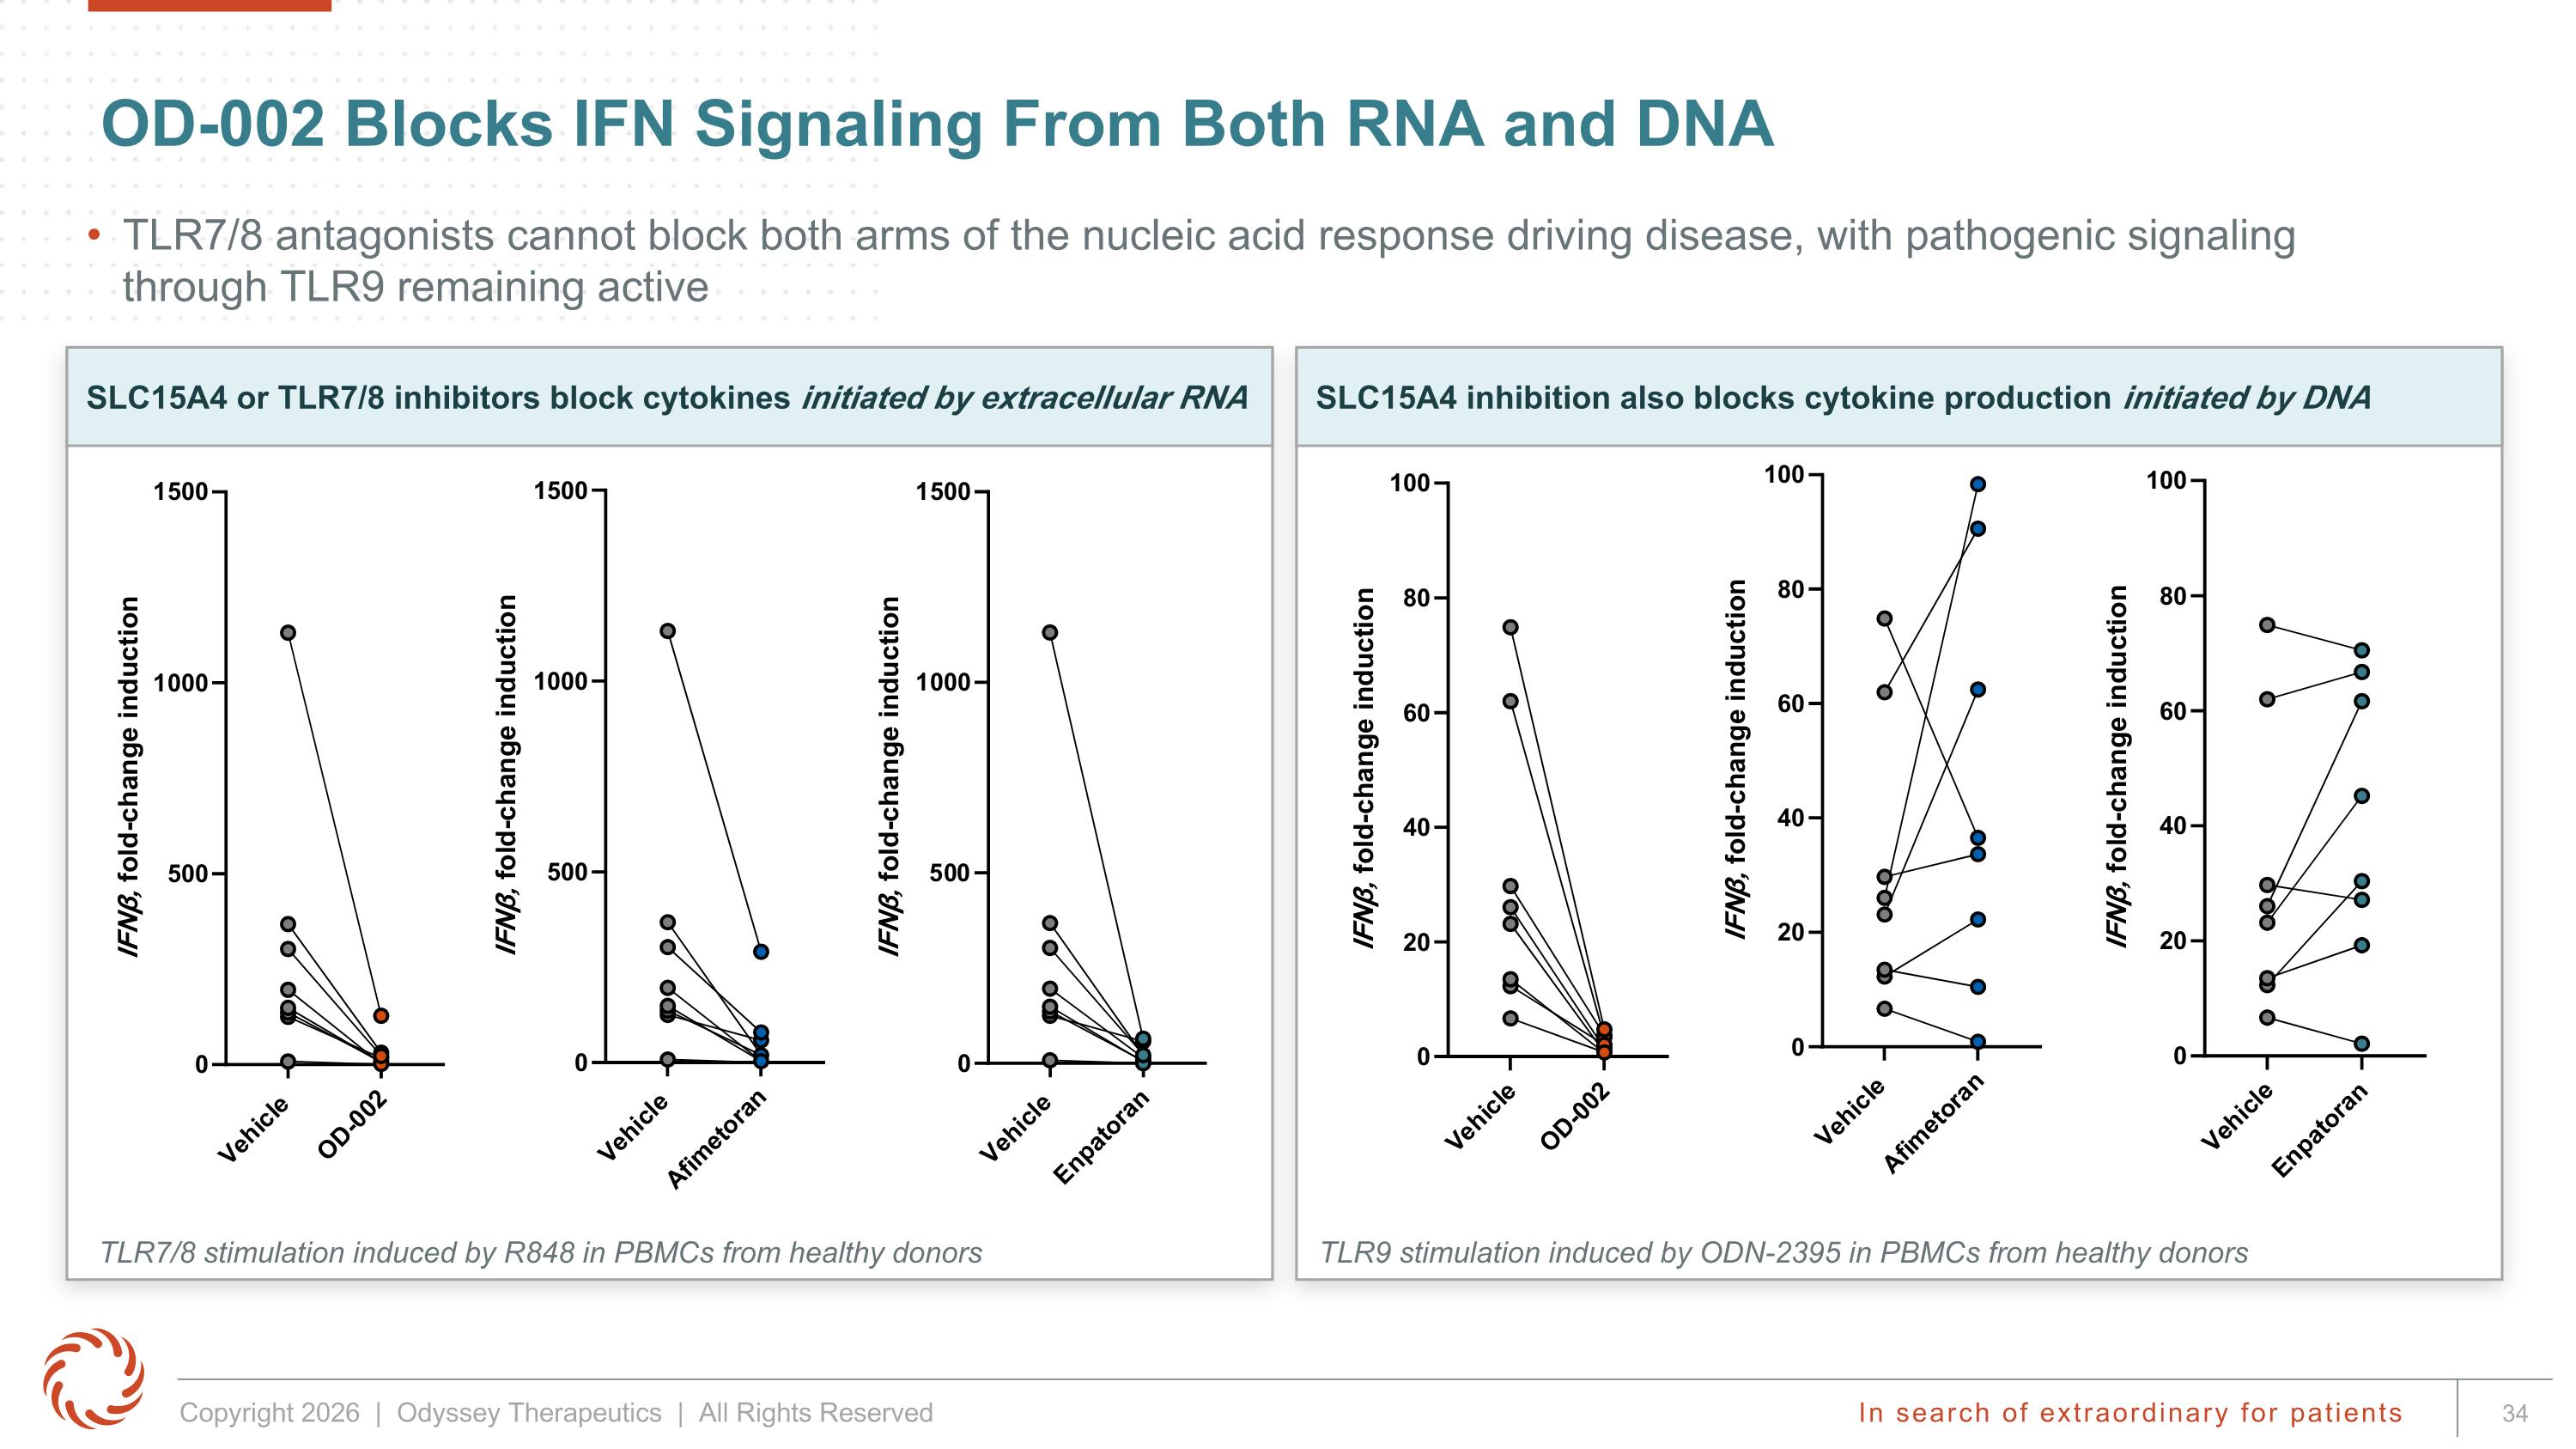
OD-002 Blocks IFN Signaling From Both RNA and DNA SLC15A4 or TLR7/8 inhibitors block cytokines initiated by extracellular RNA TLR7/8 antagonists cannot block both arms of the nucleic acid response driving disease, with pathogenic signaling through TLR9 remaining active TLR7/8 stimulation induced by R848 in PBMCs from healthy donors TLR9 stimulation induced by ODN-2395 in PBMCs from healthy donors SLC15A4 inhibition also blocks cytokine production initiated by DNA
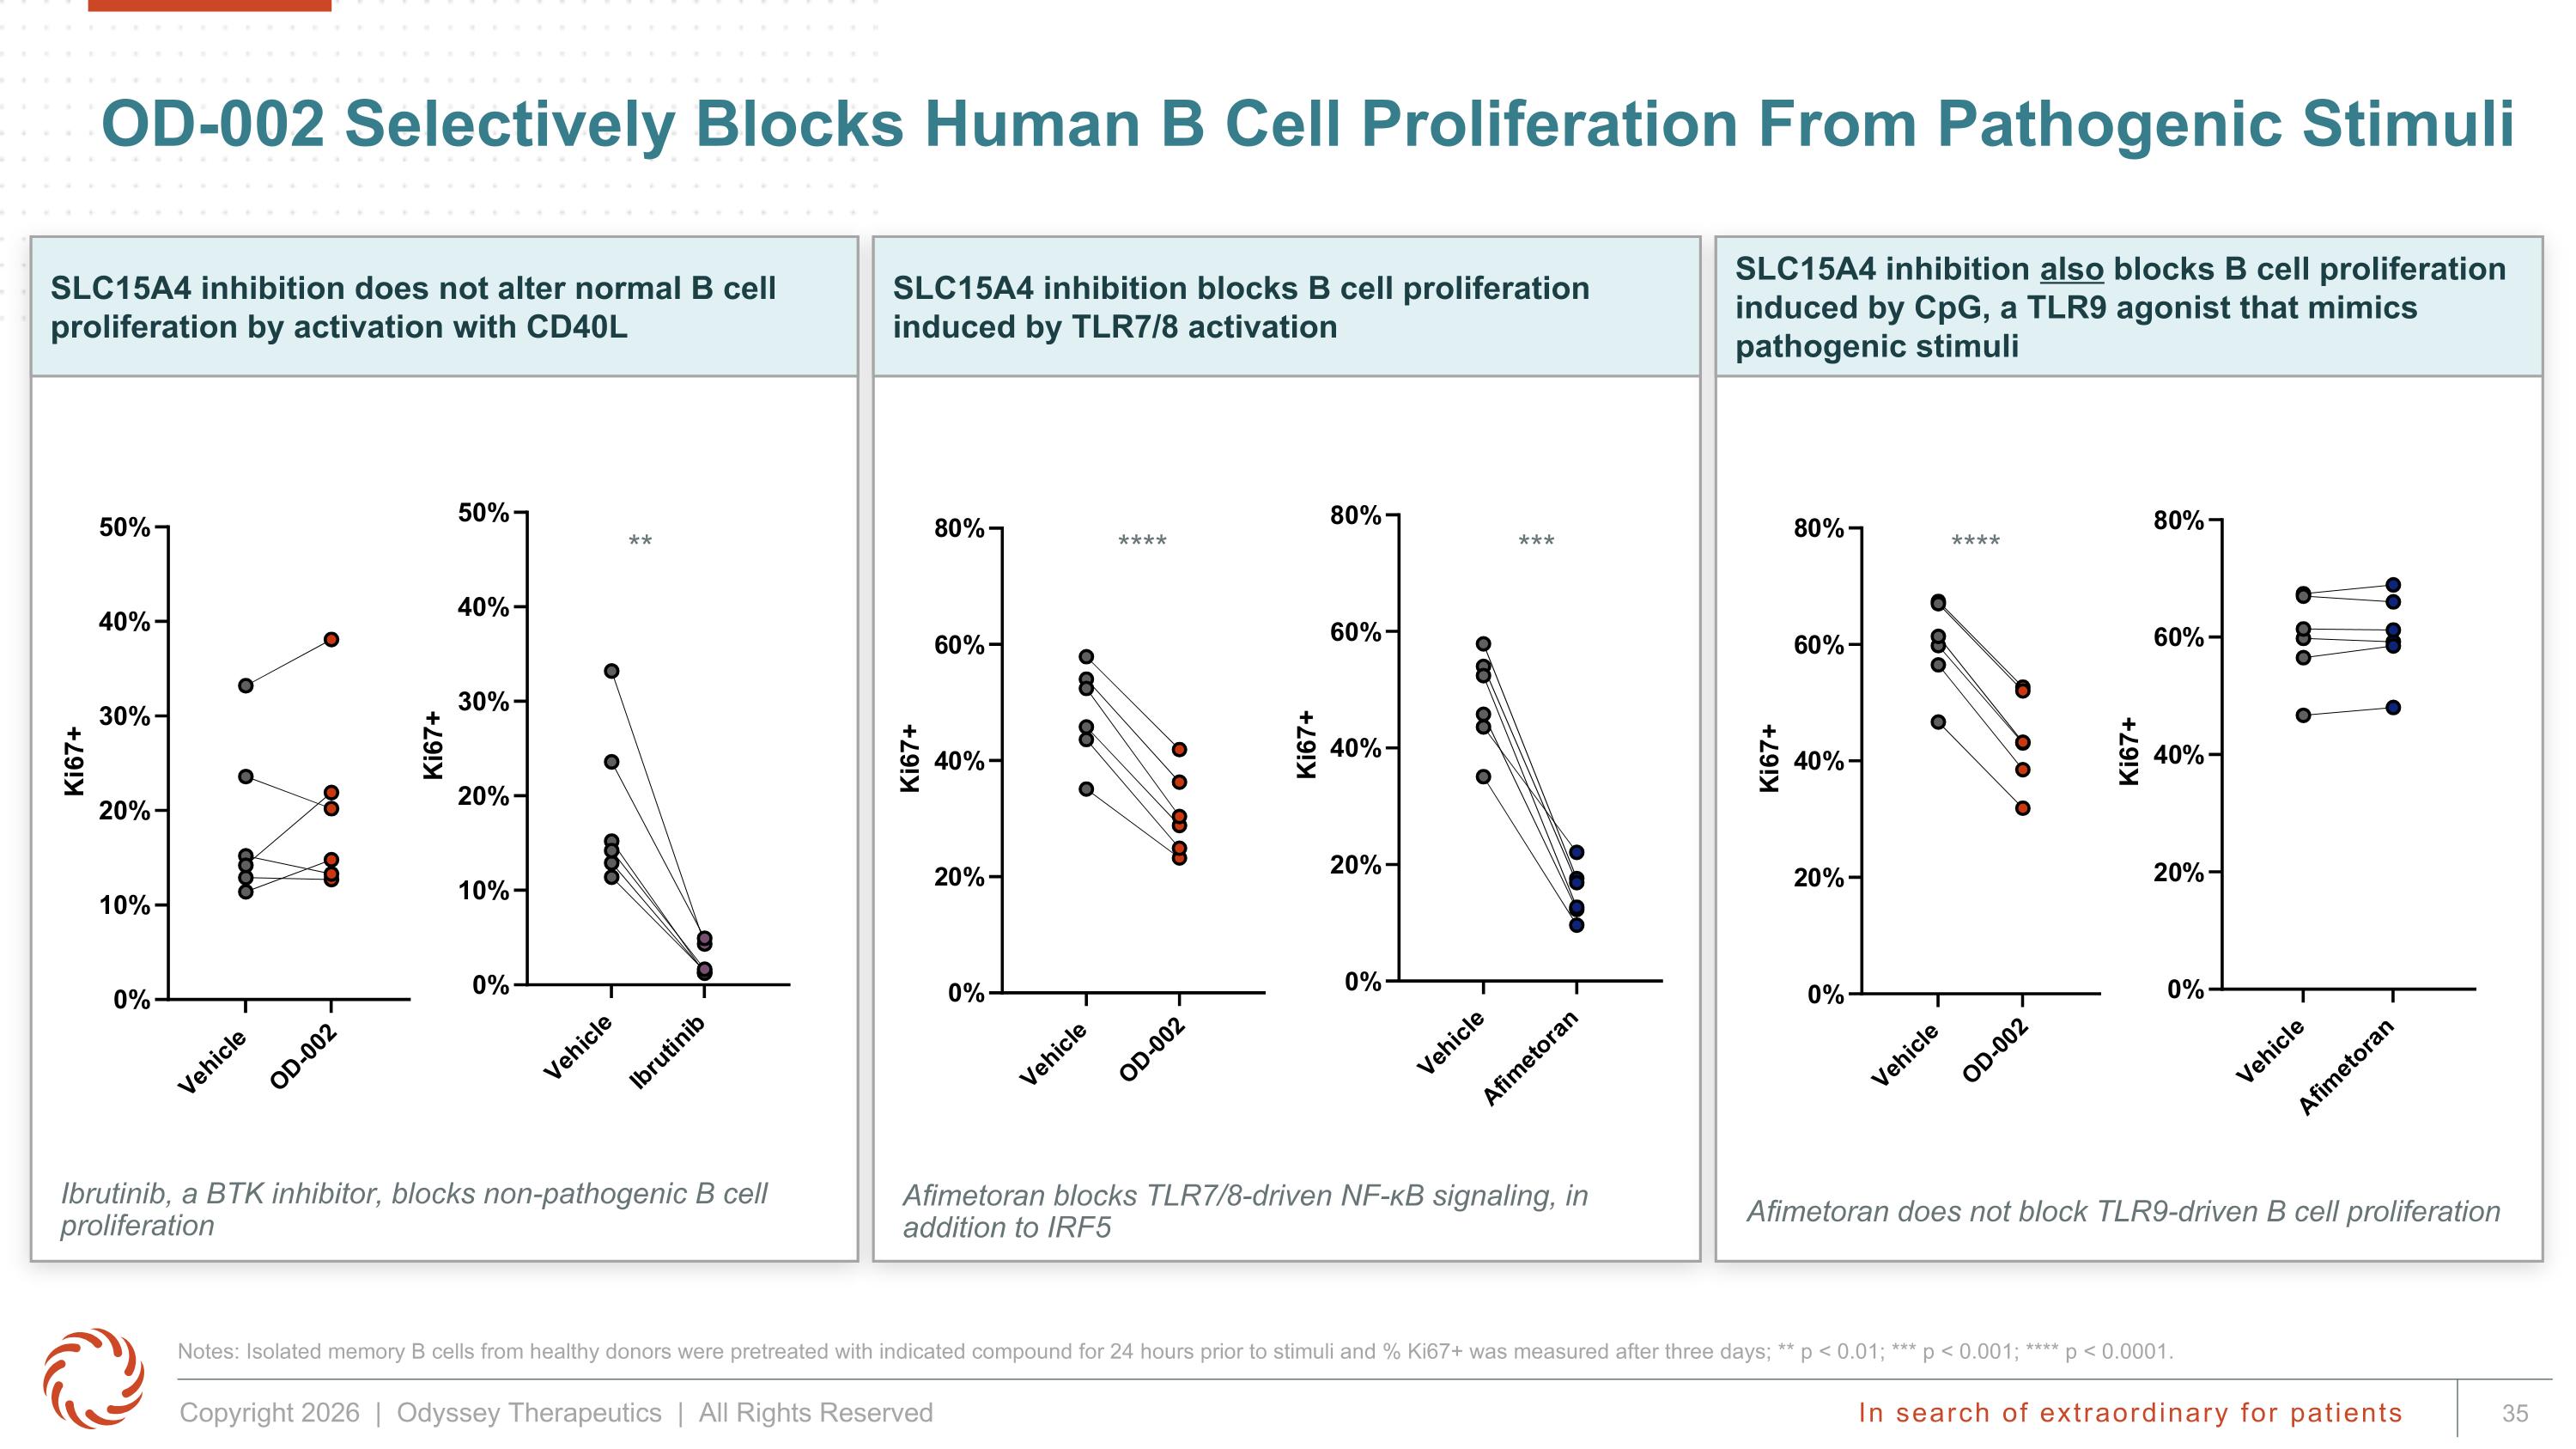
OD-002 Selectively Blocks Human B Cell Proliferation From Pathogenic Stimuli Notes: Isolated memory B cells from healthy donors were pretreated with indicated compound for 24 hours prior to stimuli and % Ki67+ was measured after three days; ** p < 0.01; *** p < 0.001; **** p < 0.0001. SLC15A4 inhibition does not alter normal B cell proliferation by activation with CD40L SLC15A4 inhibition blocks B cell proliferation induced by TLR7/8 activation SLC15A4 inhibition also blocks B cell proliferation induced by CpG, a TLR9 agonist that mimics pathogenic stimuli Afimetoran blocks TLR7/8-driven NF-κB signaling, in addition to IRF5 Ibrutinib, a BTK inhibitor, blocks non-pathogenic B cell proliferation Afimetoran does not block TLR9-driven B cell proliferation ** **** *** ****
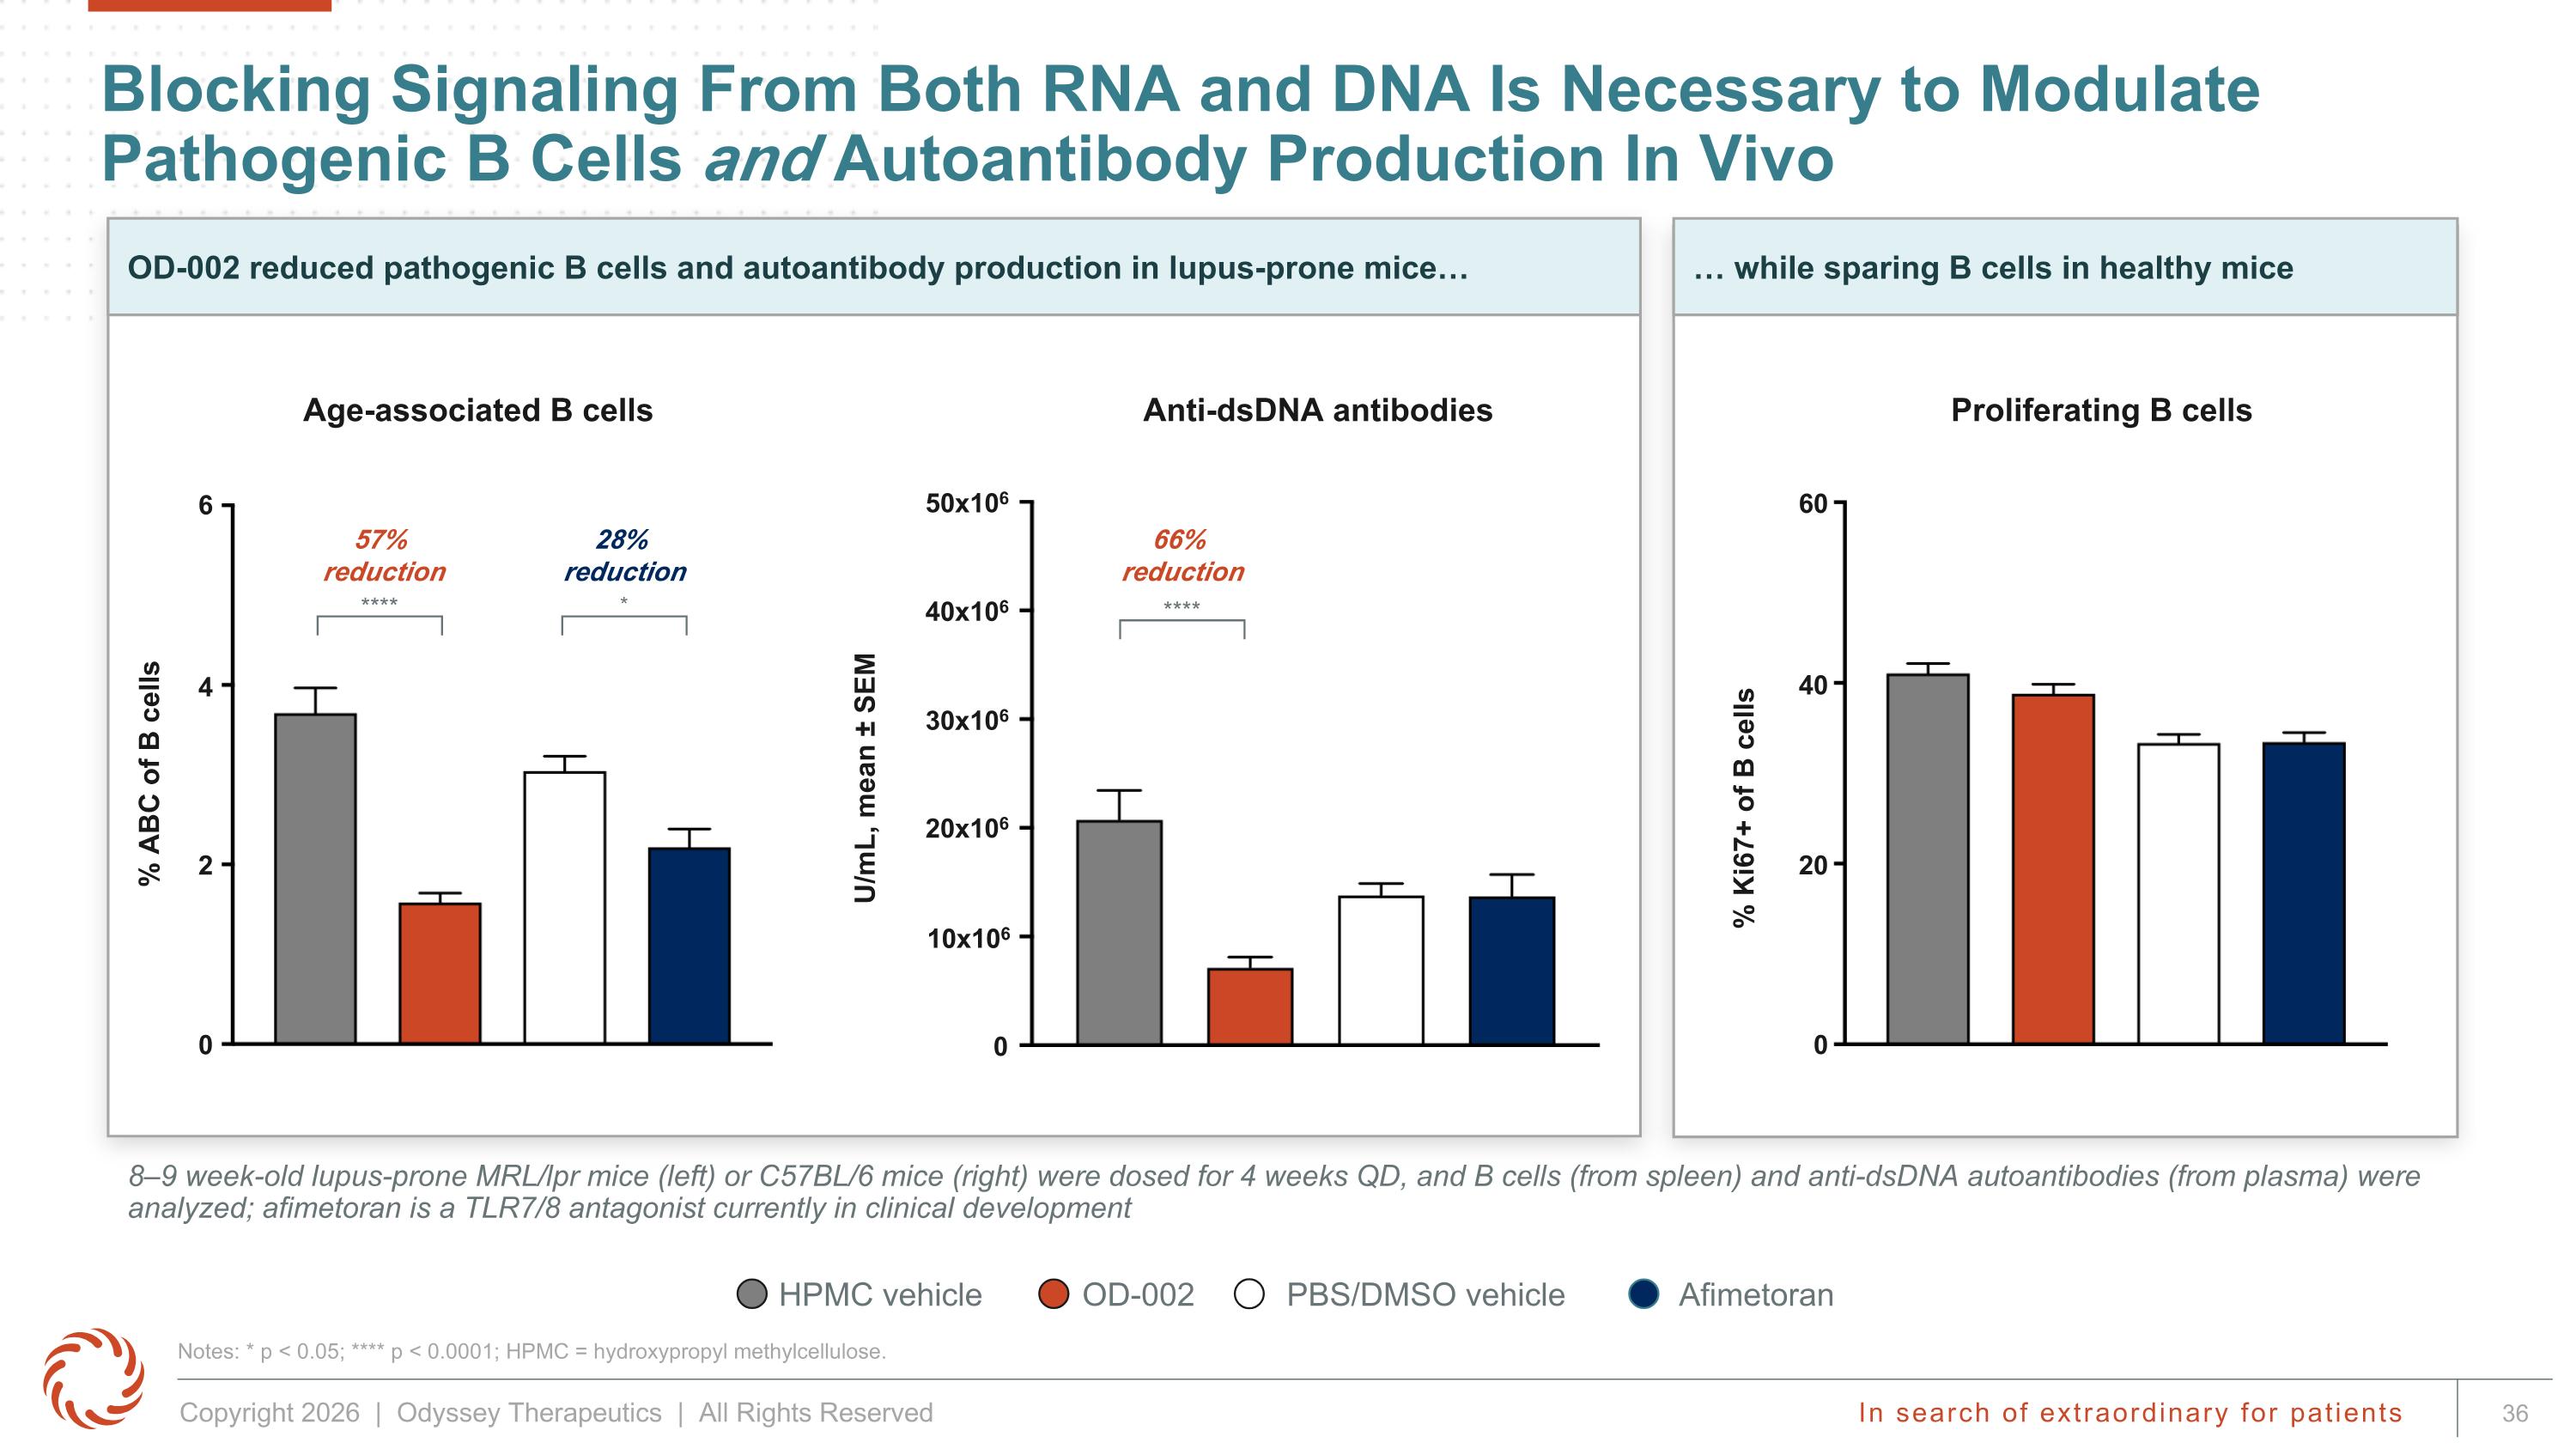
Anti-dsDNA antibodies … while sparing B cells in healthy mice OD-002 reduced pathogenic B cells and autoantibody production in lupus-prone mice… Blocking Signaling From Both RNA and DNA Is Necessary to Modulate Pathogenic B Cells and Autoantibody Production In Vivo Notes: * p < 0.05; **** p < 0.0001; HPMC = hydroxypropyl methylcellulose. 8–9 week-old lupus-prone MRL/lpr mice (left) or C57BL/6 mice (right) were dosed for 4 weeks QD, and B cells (from spleen) and anti-dsDNA autoantibodies (from plasma) were analyzed; afimetoran is a TLR7/8 antagonist currently in clinical development % Ki67+ of B cells % ABC of B cells OD-002 HPMC vehicle Afimetoran PBS/DMSO vehicle Age-associated B cells Proliferating B cells U/mL, mean ± SEM 50x106 40x106 30x106 20x106 10x106 0 60 40 20 0 6 4 2 0 66% reduction **** 57% reduction 28% reduction **** *
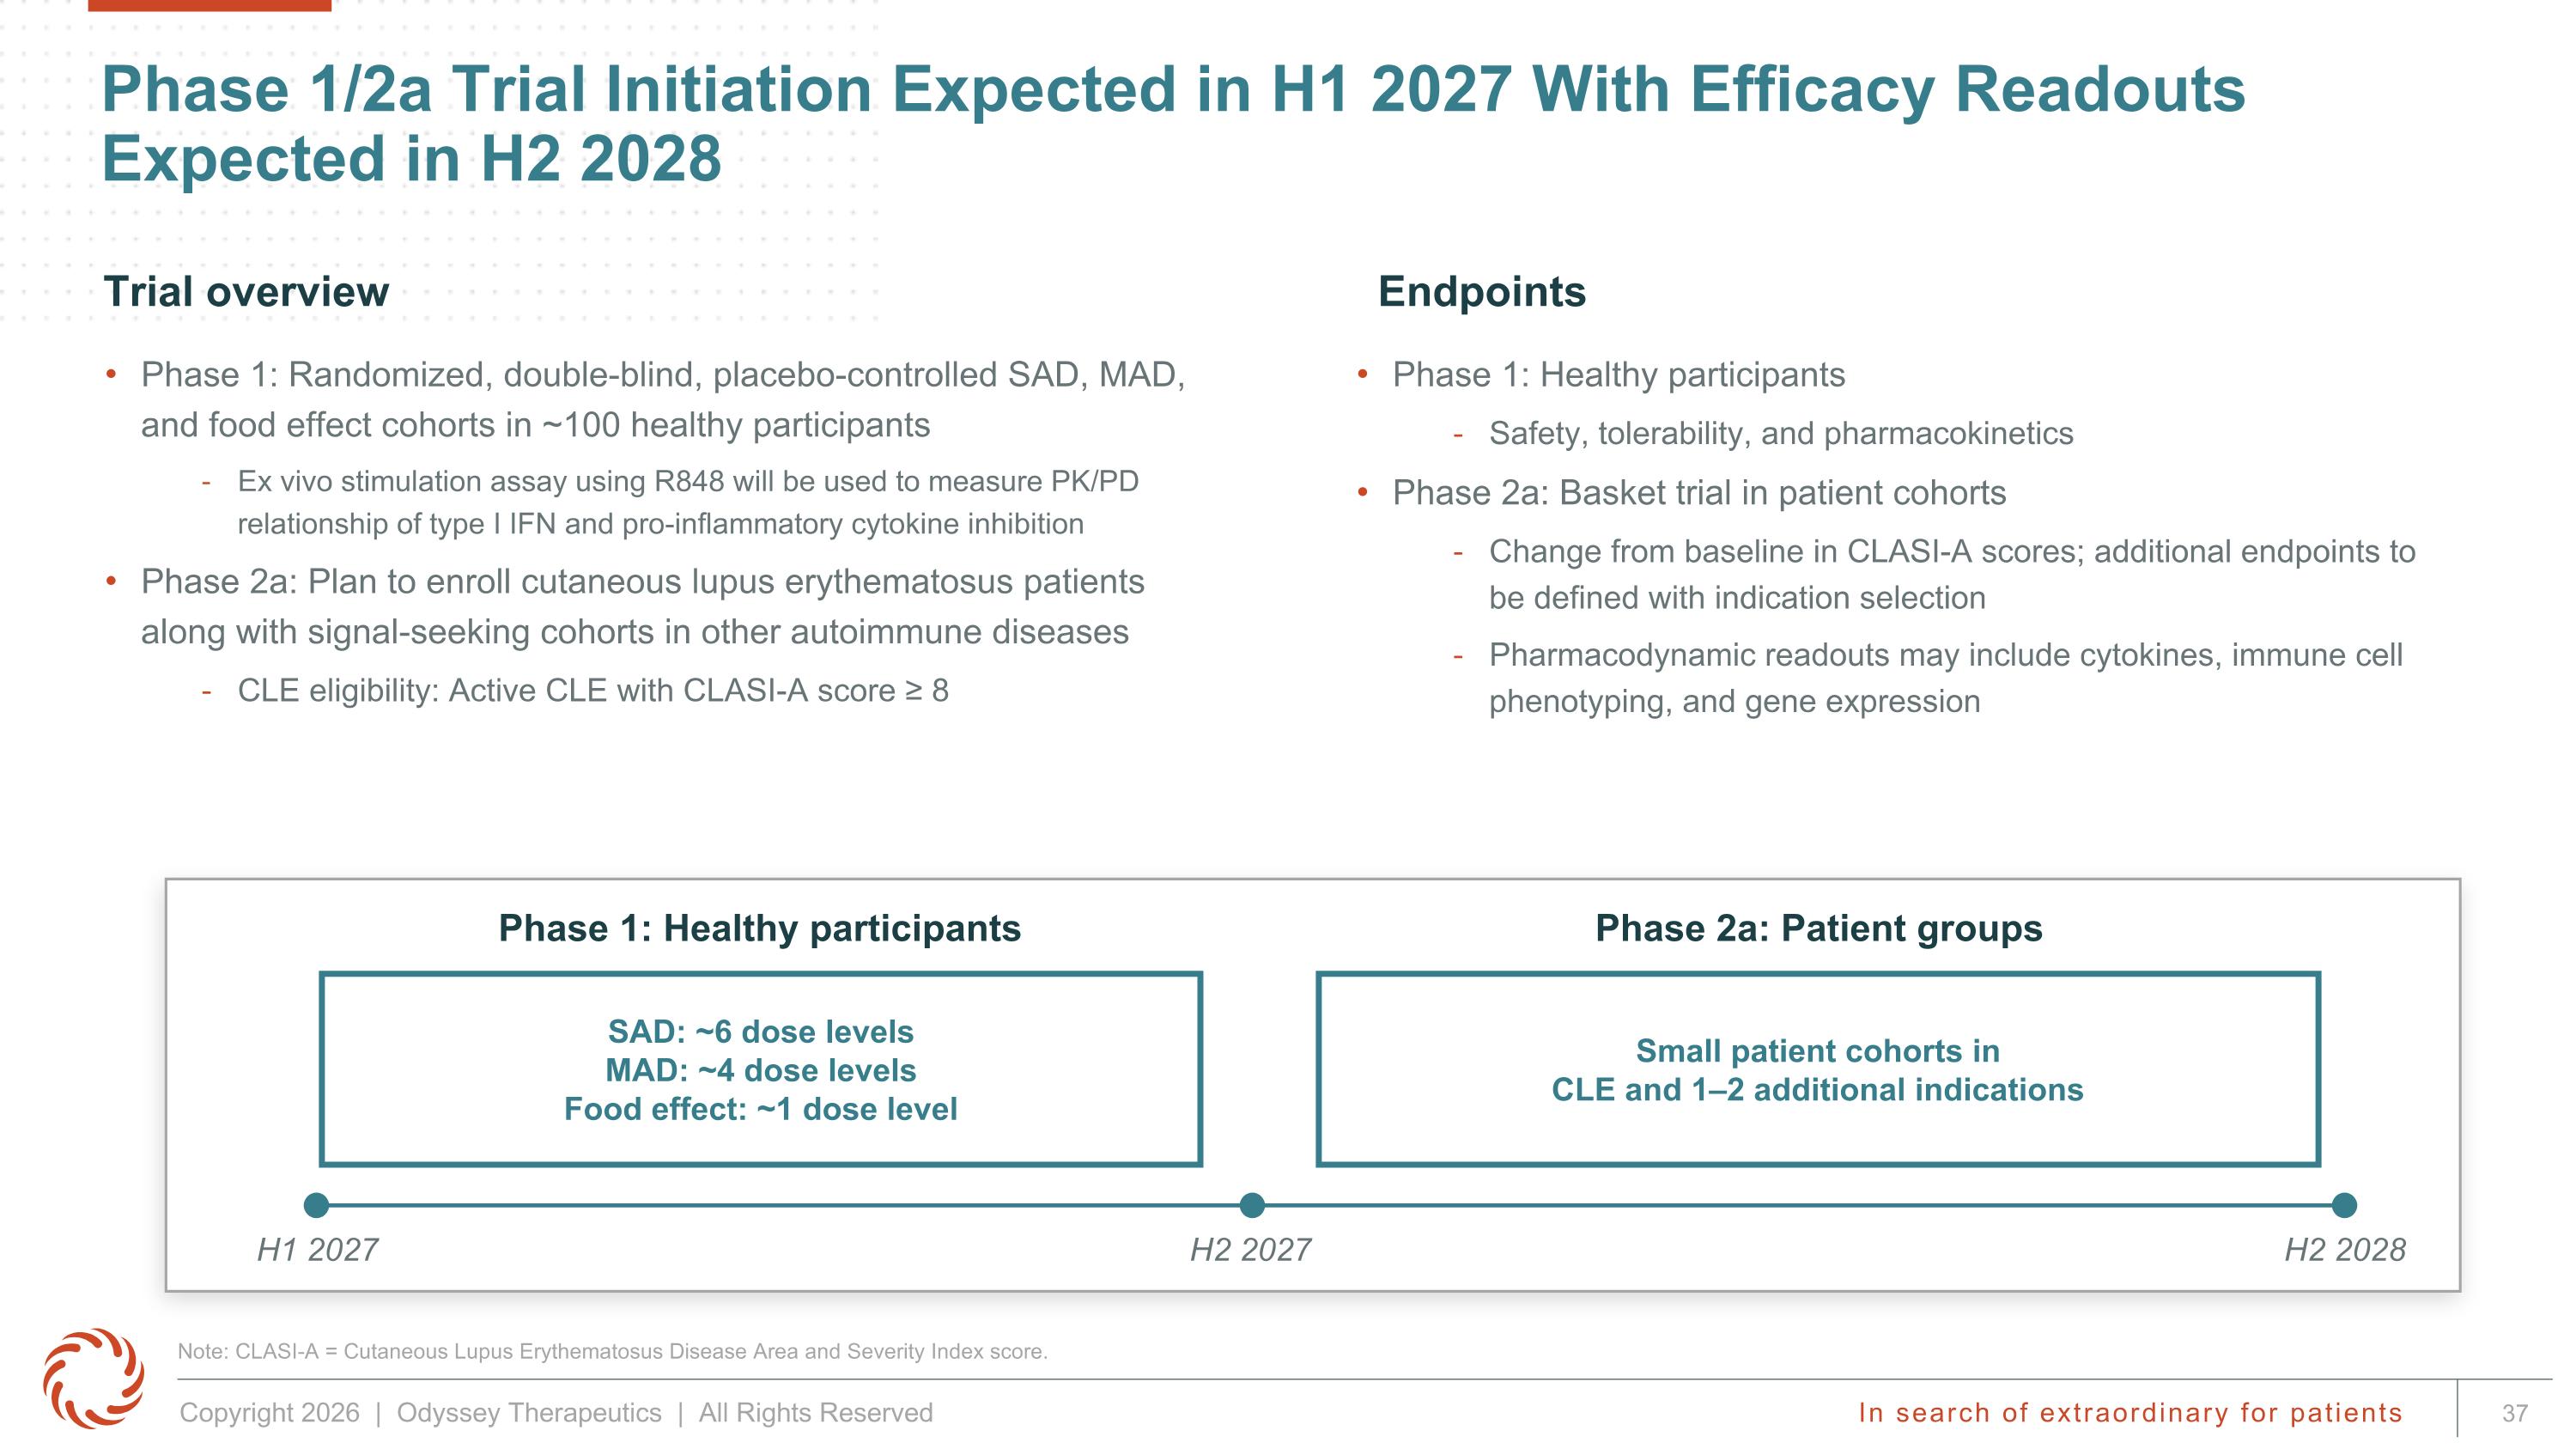
Phase 1/2a Trial Initiation Expected in H1 2027 With Efficacy Readouts Expected in H2 2028 Small patient cohorts in CLE and 1–2 additional indications SAD: ~6 dose levels MAD: ~4 dose levels Food effect: ~1 dose level H1 2027 H2 2027 H2 2028 Phase 2a: Patient groups Phase 1: Randomized, double-blind, placebo-controlled SAD, MAD, and food effect cohorts in ~100 healthy participants Ex vivo stimulation assay using R848 will be used to measure PK/PD relationship of type I IFN and pro-inflammatory cytokine inhibition Phase 2a: Plan to enroll cutaneous lupus erythematosus patients along with signal-seeking cohorts in other autoimmune diseases CLE eligibility: Active CLE with CLASI-A score ≥ 8 Phase 1: Healthy participants Safety, tolerability, and pharmacokinetics Phase 2a: Basket trial in patient cohorts Change from baseline in CLASI-A scores; additional endpoints to be defined with indication selection Pharmacodynamic readouts may include cytokines, immune cell phenotyping, and gene expression Endpoints Trial overview Phase 1: Healthy participants Note: CLASI-A = Cutaneous Lupus Erythematosus Disease Area and Severity Index score.
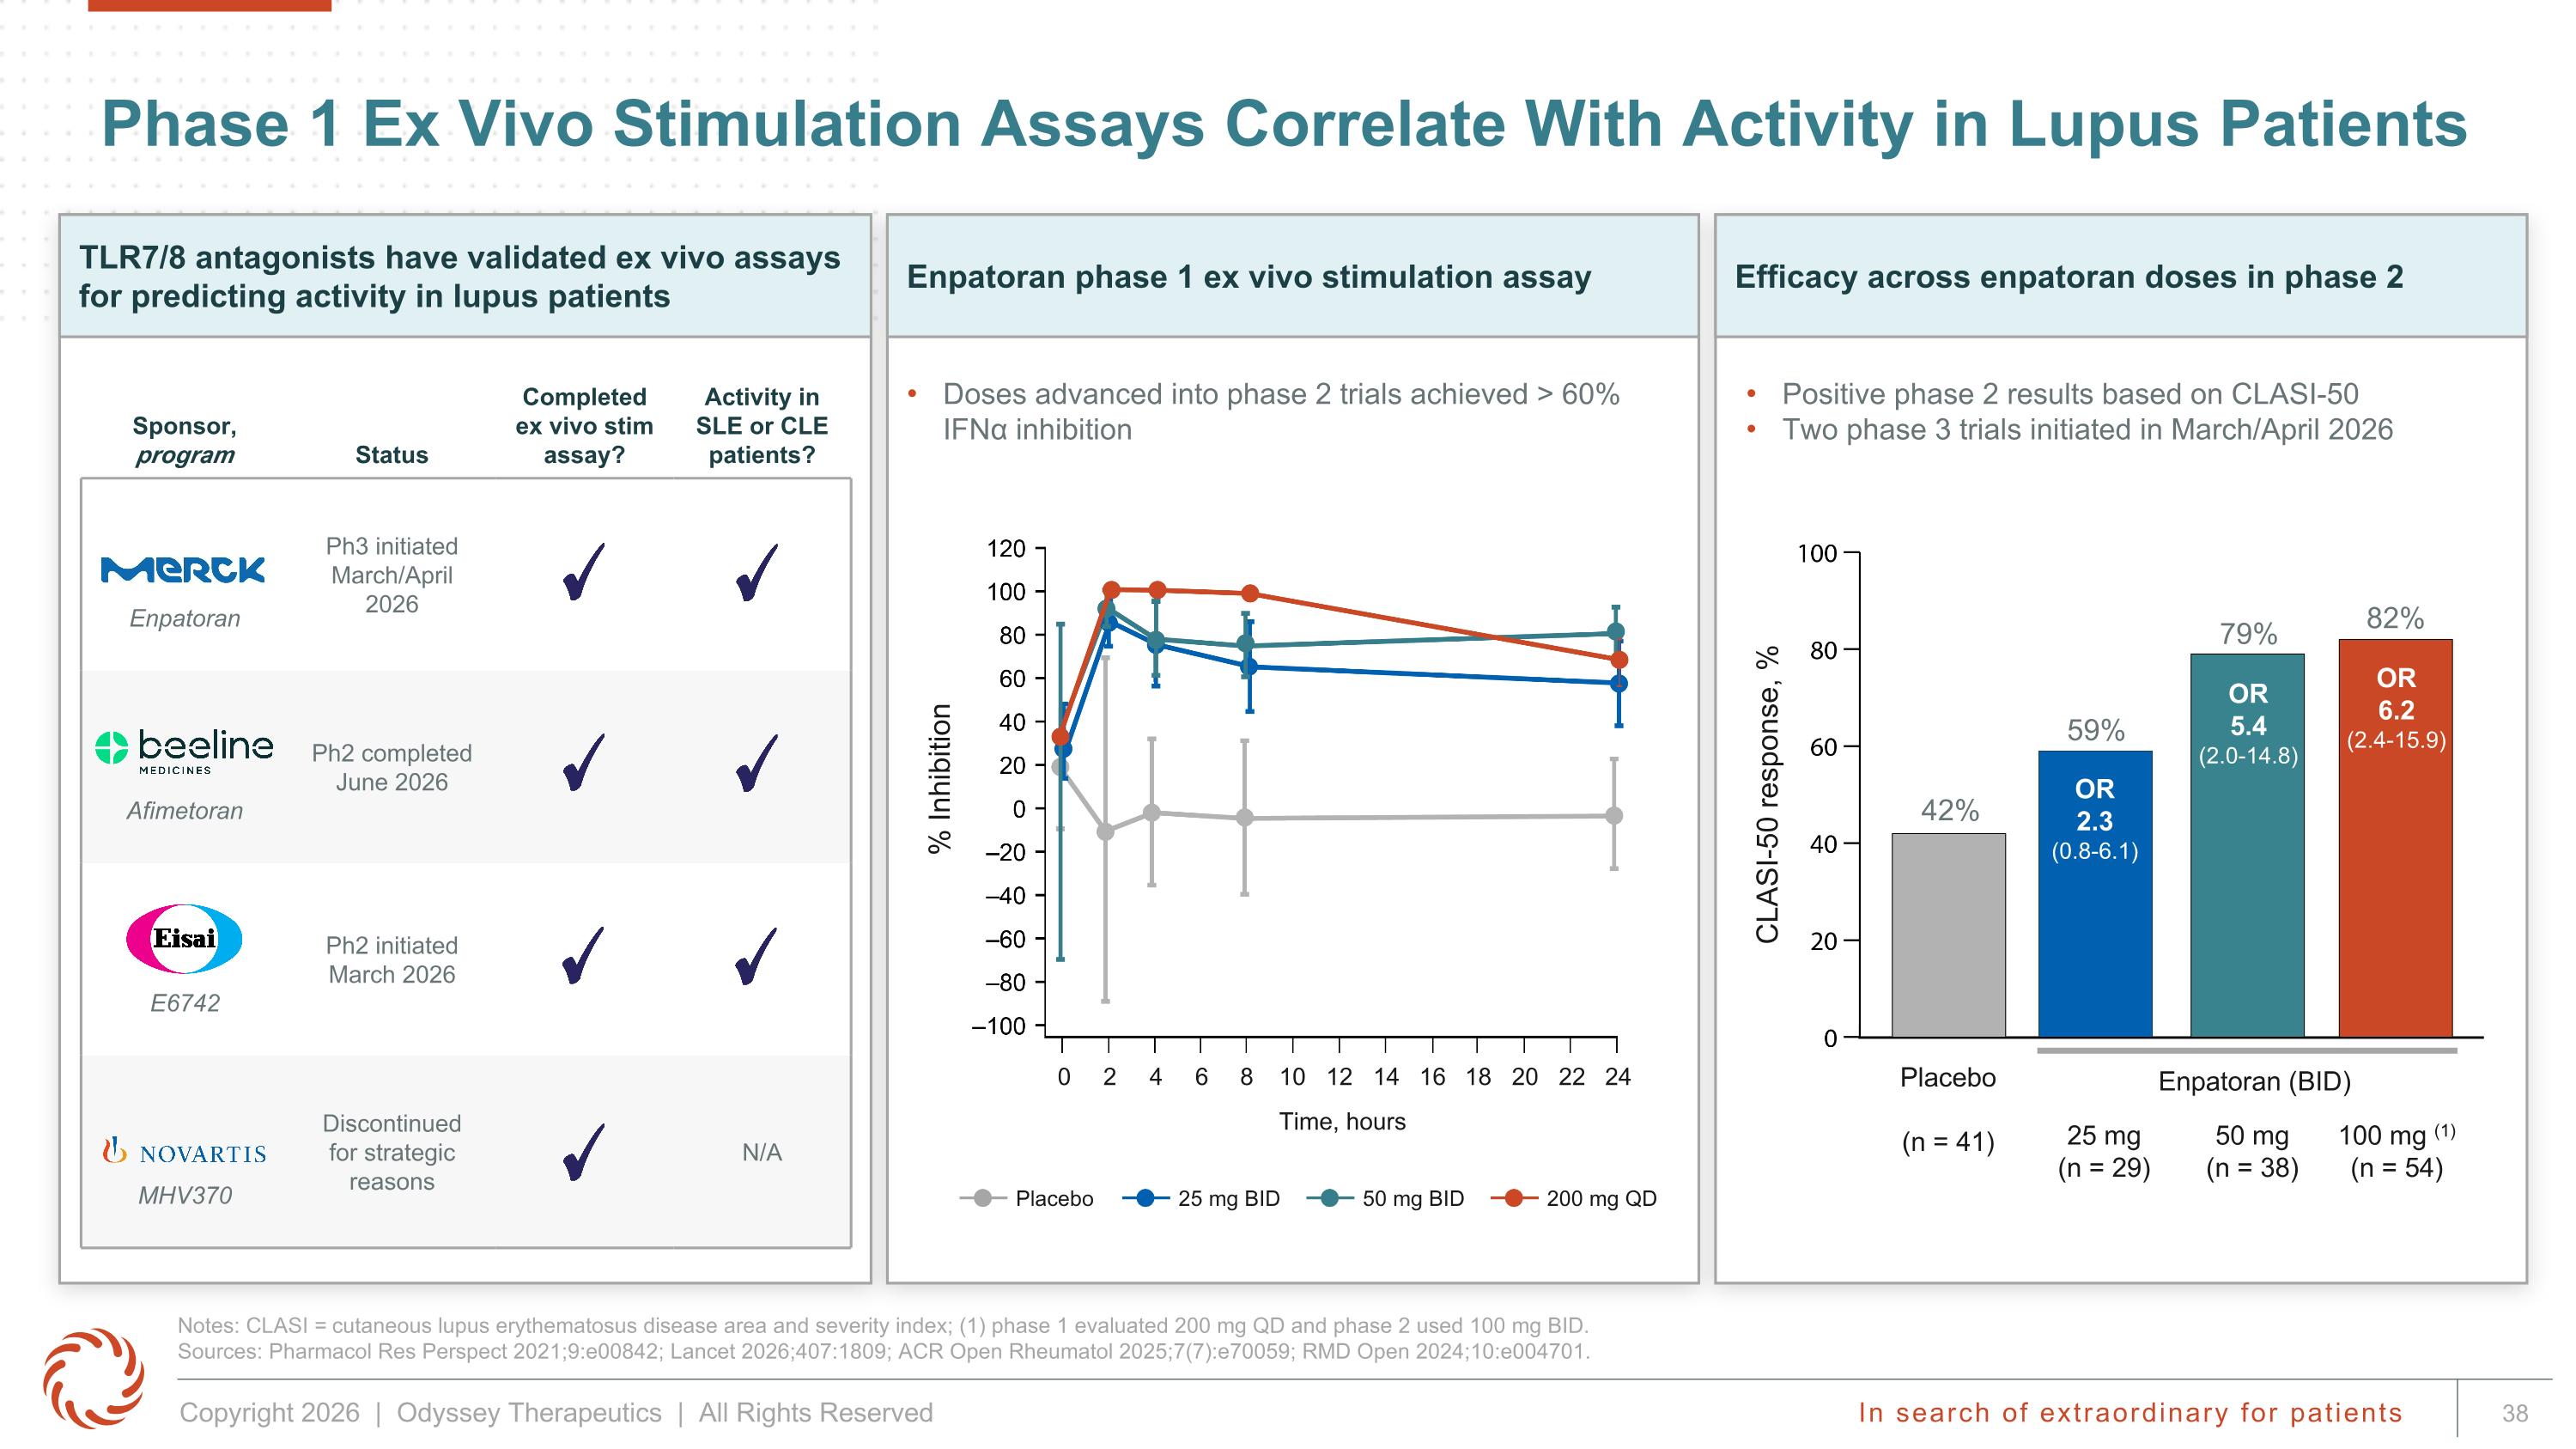
Doses advanced into phase 2 trials achieved > 60% IFNα inhibition Enpatoran phase 1 ex vivo stimulation assay Efficacy across enpatoran doses in phase 2 Sponsor, program Status Completed ex vivo stim assay? Activity in SLE or CLE patients? Enpatoran Ph3 initiated March/April 2026 Afimetoran Ph2 completed June 2026 E6742 Ph2 initiated March 2026 MHV370 Discontinued for strategic reasons N/A Phase 1 Ex Vivo Stimulation Assays Correlate With Activity in Lupus Patients Notes: CLASI = cutaneous lupus erythematosus disease area and severity index; (1) phase 1 evaluated 200 mg QD and phase 2 used 100 mg BID. Sources: Pharmacol Res Perspect 2021;9:e00842; Lancet 2026;407:1809; ACR Open Rheumatol 2025;7(7):e70059; RMD Open 2024;10:e004701. Positive phase 2 results based on CLASI-50 Two phase 3 trials initiated in March/April 2026 CLASI-50 response, % 42% Placebo (n = 41) 25 mg (n = 29) 50 mg (n = 38) 100 mg (1) (n = 54) 59% 79% 82% OR 2.3 (0.8-6.1) OR 5.4 (2.0-14.8) OR 6.2 (2.4-15.9) % Inhibition 0 2 4 6 8 10 12 14 16 18 20 22 24 Time, hours Placebo 25 mg BID 50 mg BID 200 mg QD Enpatoran (BID) TLR7/8 antagonists have validated ex vivo assays for predicting activity in lupus patients
TNFR2 Agonist: OD-003 Modulating Treg to Treat Autoimmune and Inflammatory Disease IND-Enabling Studies Ongoing
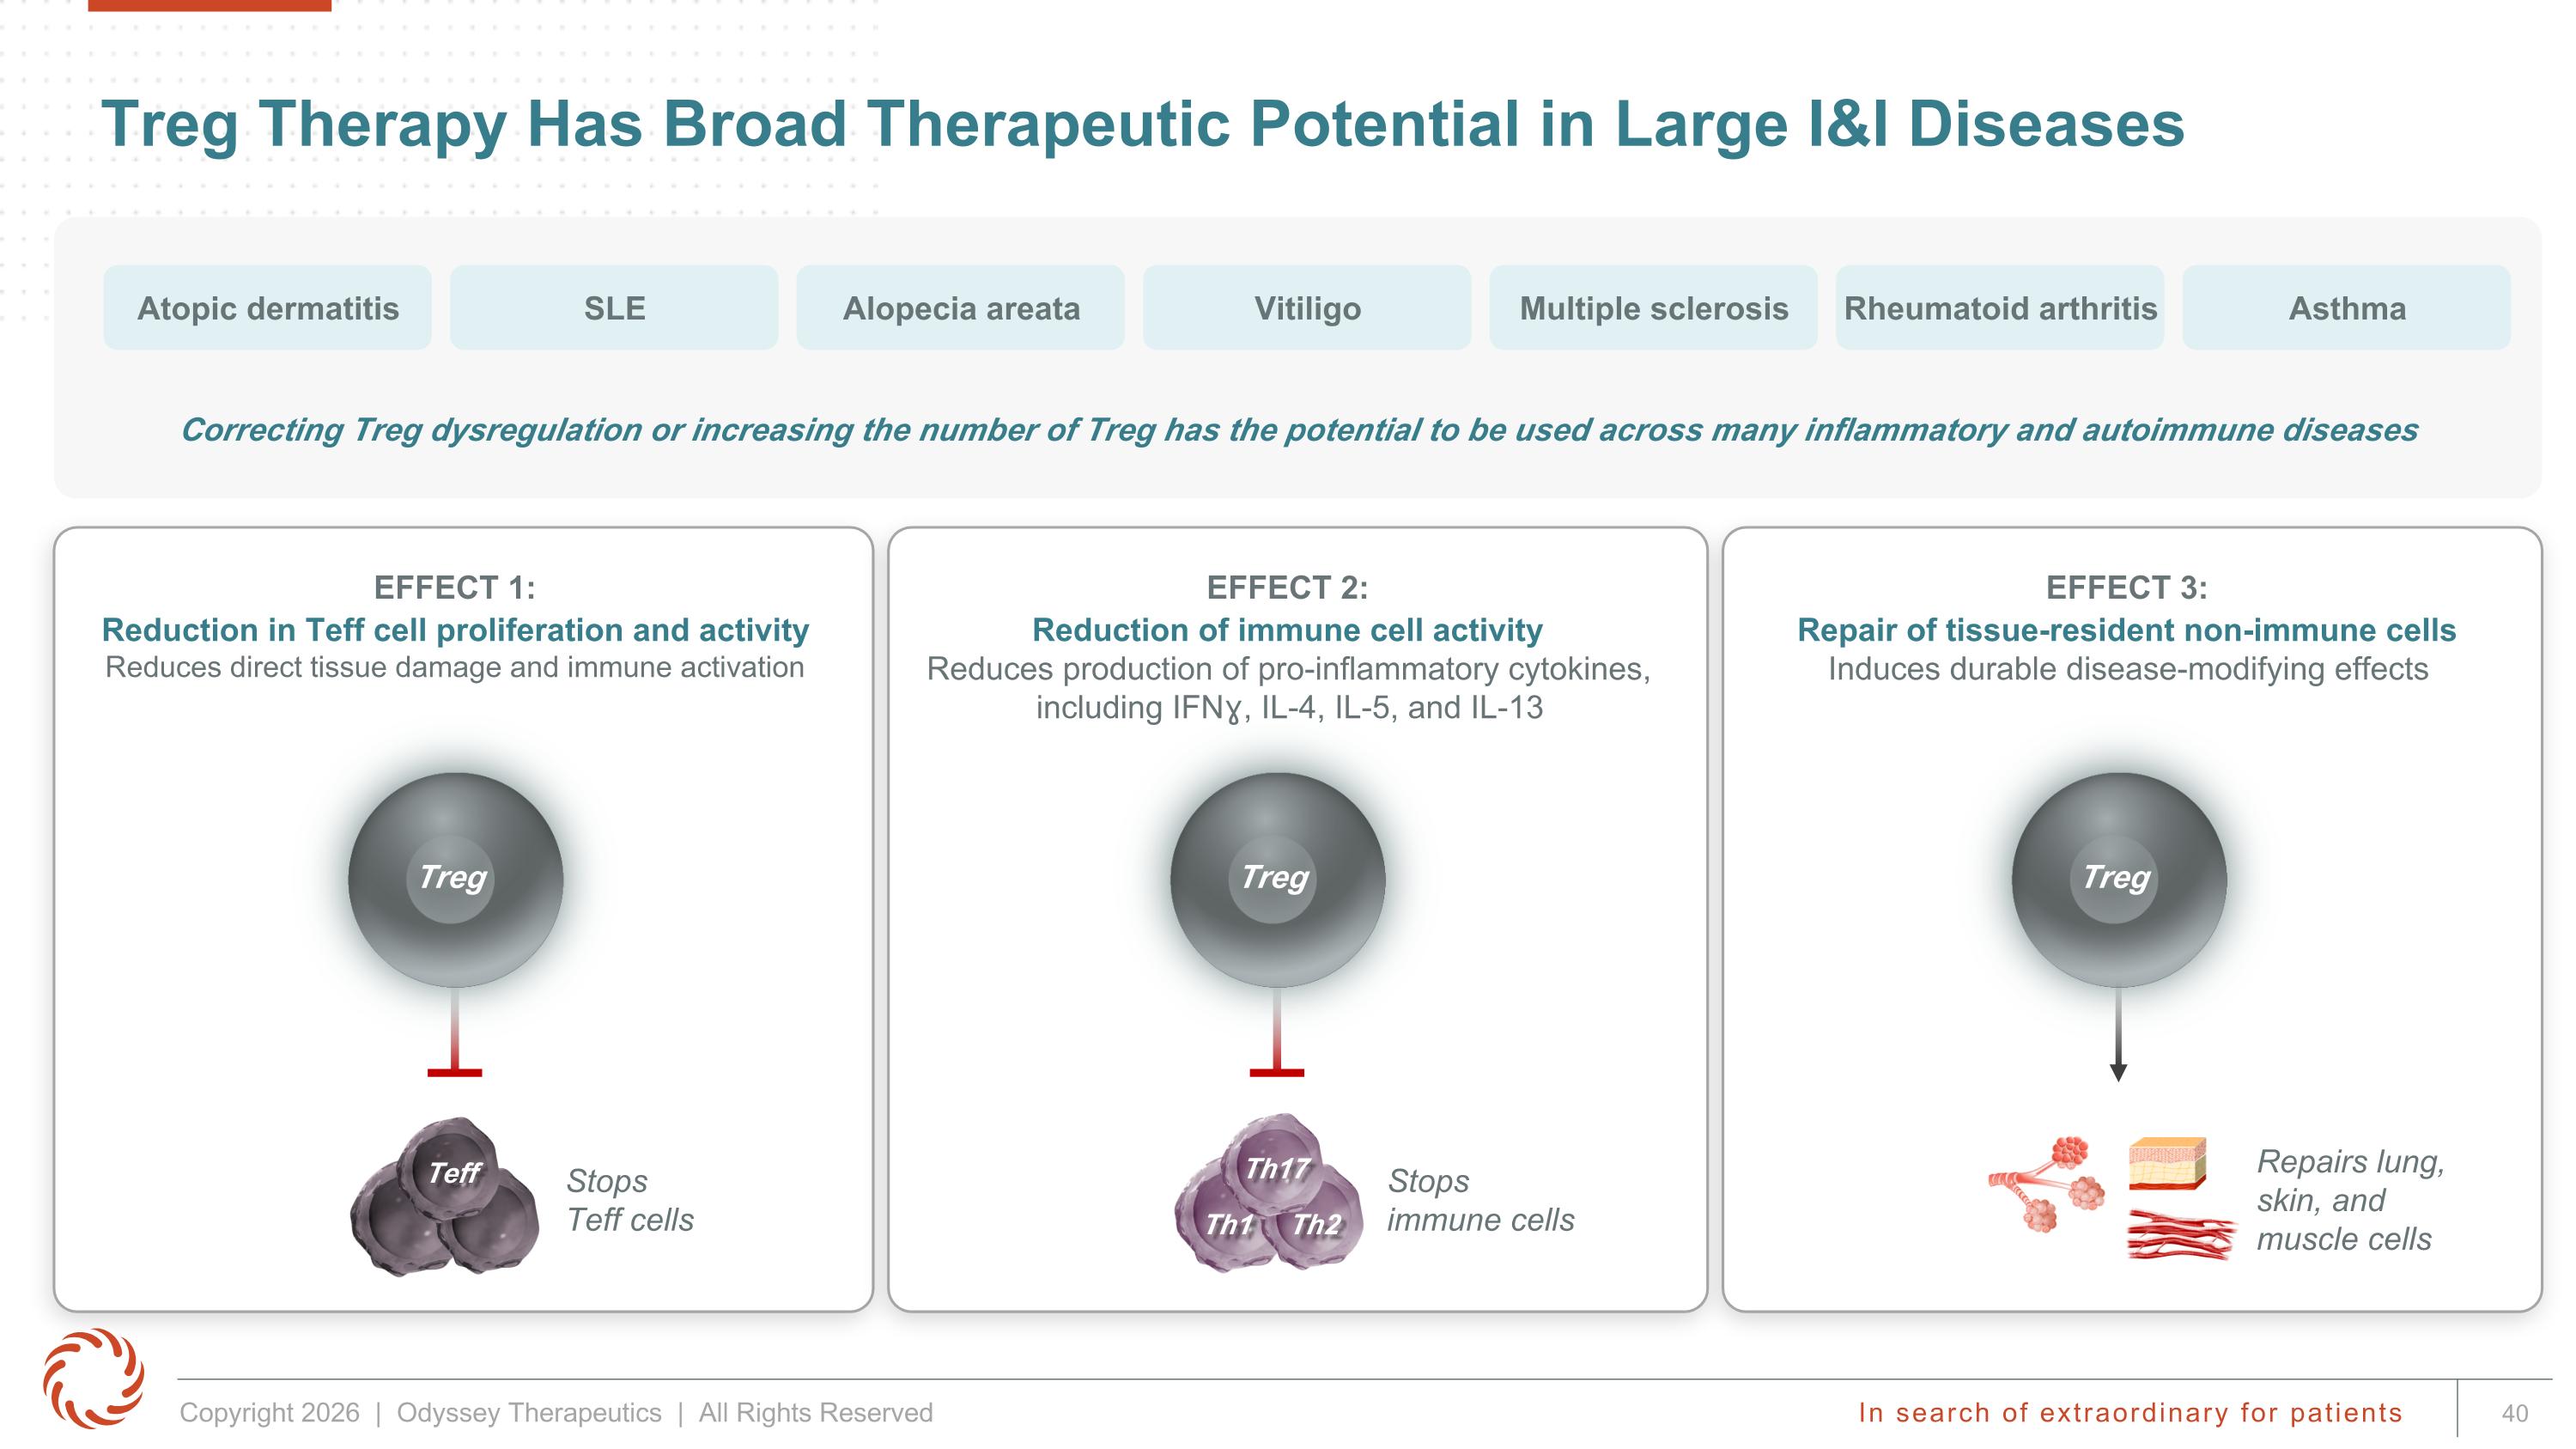
Treg Therapy Has Broad Therapeutic Potential in Large I&I Diseases Correcting Treg dysregulation or increasing the number of Treg has the potential to be used across many inflammatory and autoimmune diseases Atopic dermatitis SLE Alopecia areata Multiple sclerosis Rheumatoid arthritis Asthma EFFECT 1: Reduction in Teff cell proliferation and activity Reduces direct tissue damage and immune activation Stops Teff cells Treg EFFECT 2: Reduction of immune cell activity Reduces production of pro-inflammatory cytokines, including IFNɣ, IL-4, IL-5, and IL-13 EFFECT 3: Repair of tissue-resident non-immune cells Induces durable disease-modifying effects Stops immune cells Treg Repairs lung, skin, and muscle cells Treg Th17 Th1 Th2 Teff Vitiligo
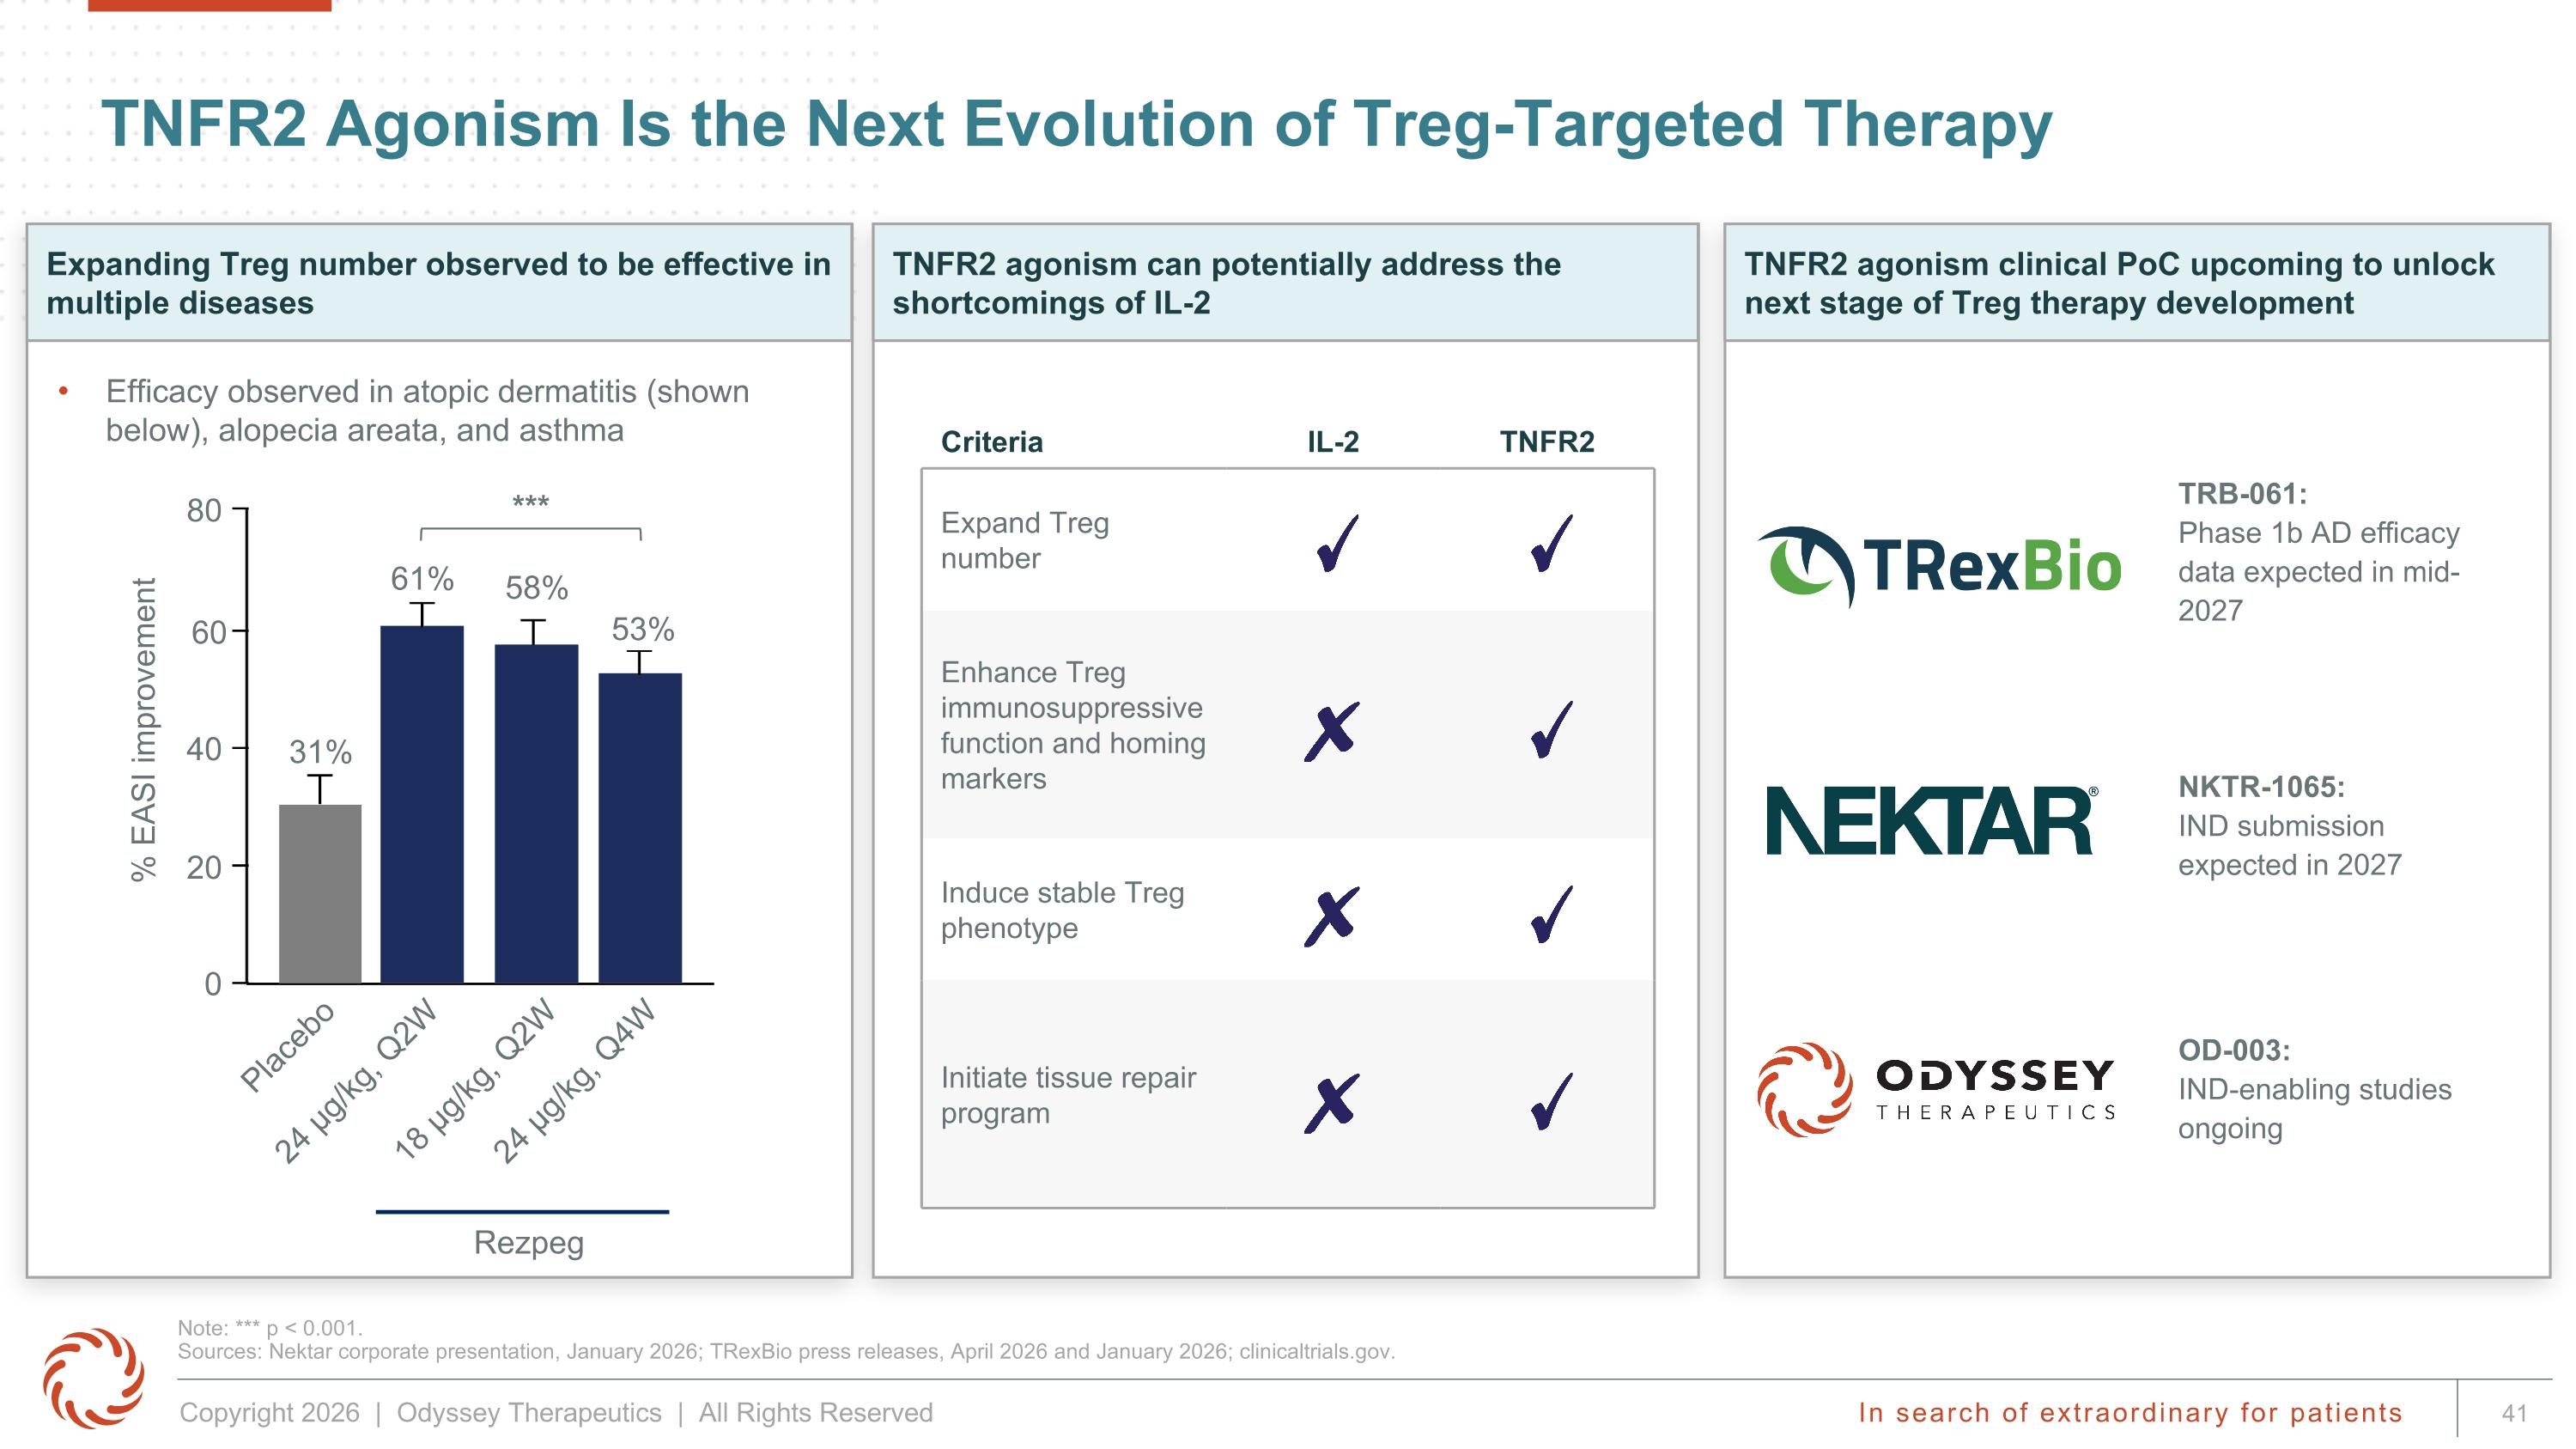
TNFR2 agonism clinical PoC upcoming to unlock next stage of Treg therapy development Expanding Treg number observed to be effective in multiple diseases TNFR2 agonism can potentially address the shortcomings of IL-2 TNFR2 Agonism Is the Next Evolution of Treg-Targeted Therapy Note: *** p < 0.001. Sources: Nektar corporate presentation, January 2026; TRexBio press releases, April 2026 and January 2026; clinicaltrials.gov. Criteria IL-2 TNFR2 Expand Treg number Enhance Treg immunosuppressive function and homing markers Induce stable Treg phenotype Initiate tissue repair program NKTR-1065: IND submission expected in 2027 OD-003: IND-enabling studies ongoing Efficacy observed in atopic dermatitis (shown below), alopecia areata, and asthma TRB-061: Phase 1b AD efficacy data expected in mid-2027 *** % EASI improvement 80 0 20 60 40 31% 61% 58% 53% Placebo 18 µg/kg, Q2W 24 µg/kg, Q4W 24 µg/kg, Q2W Rezpeg
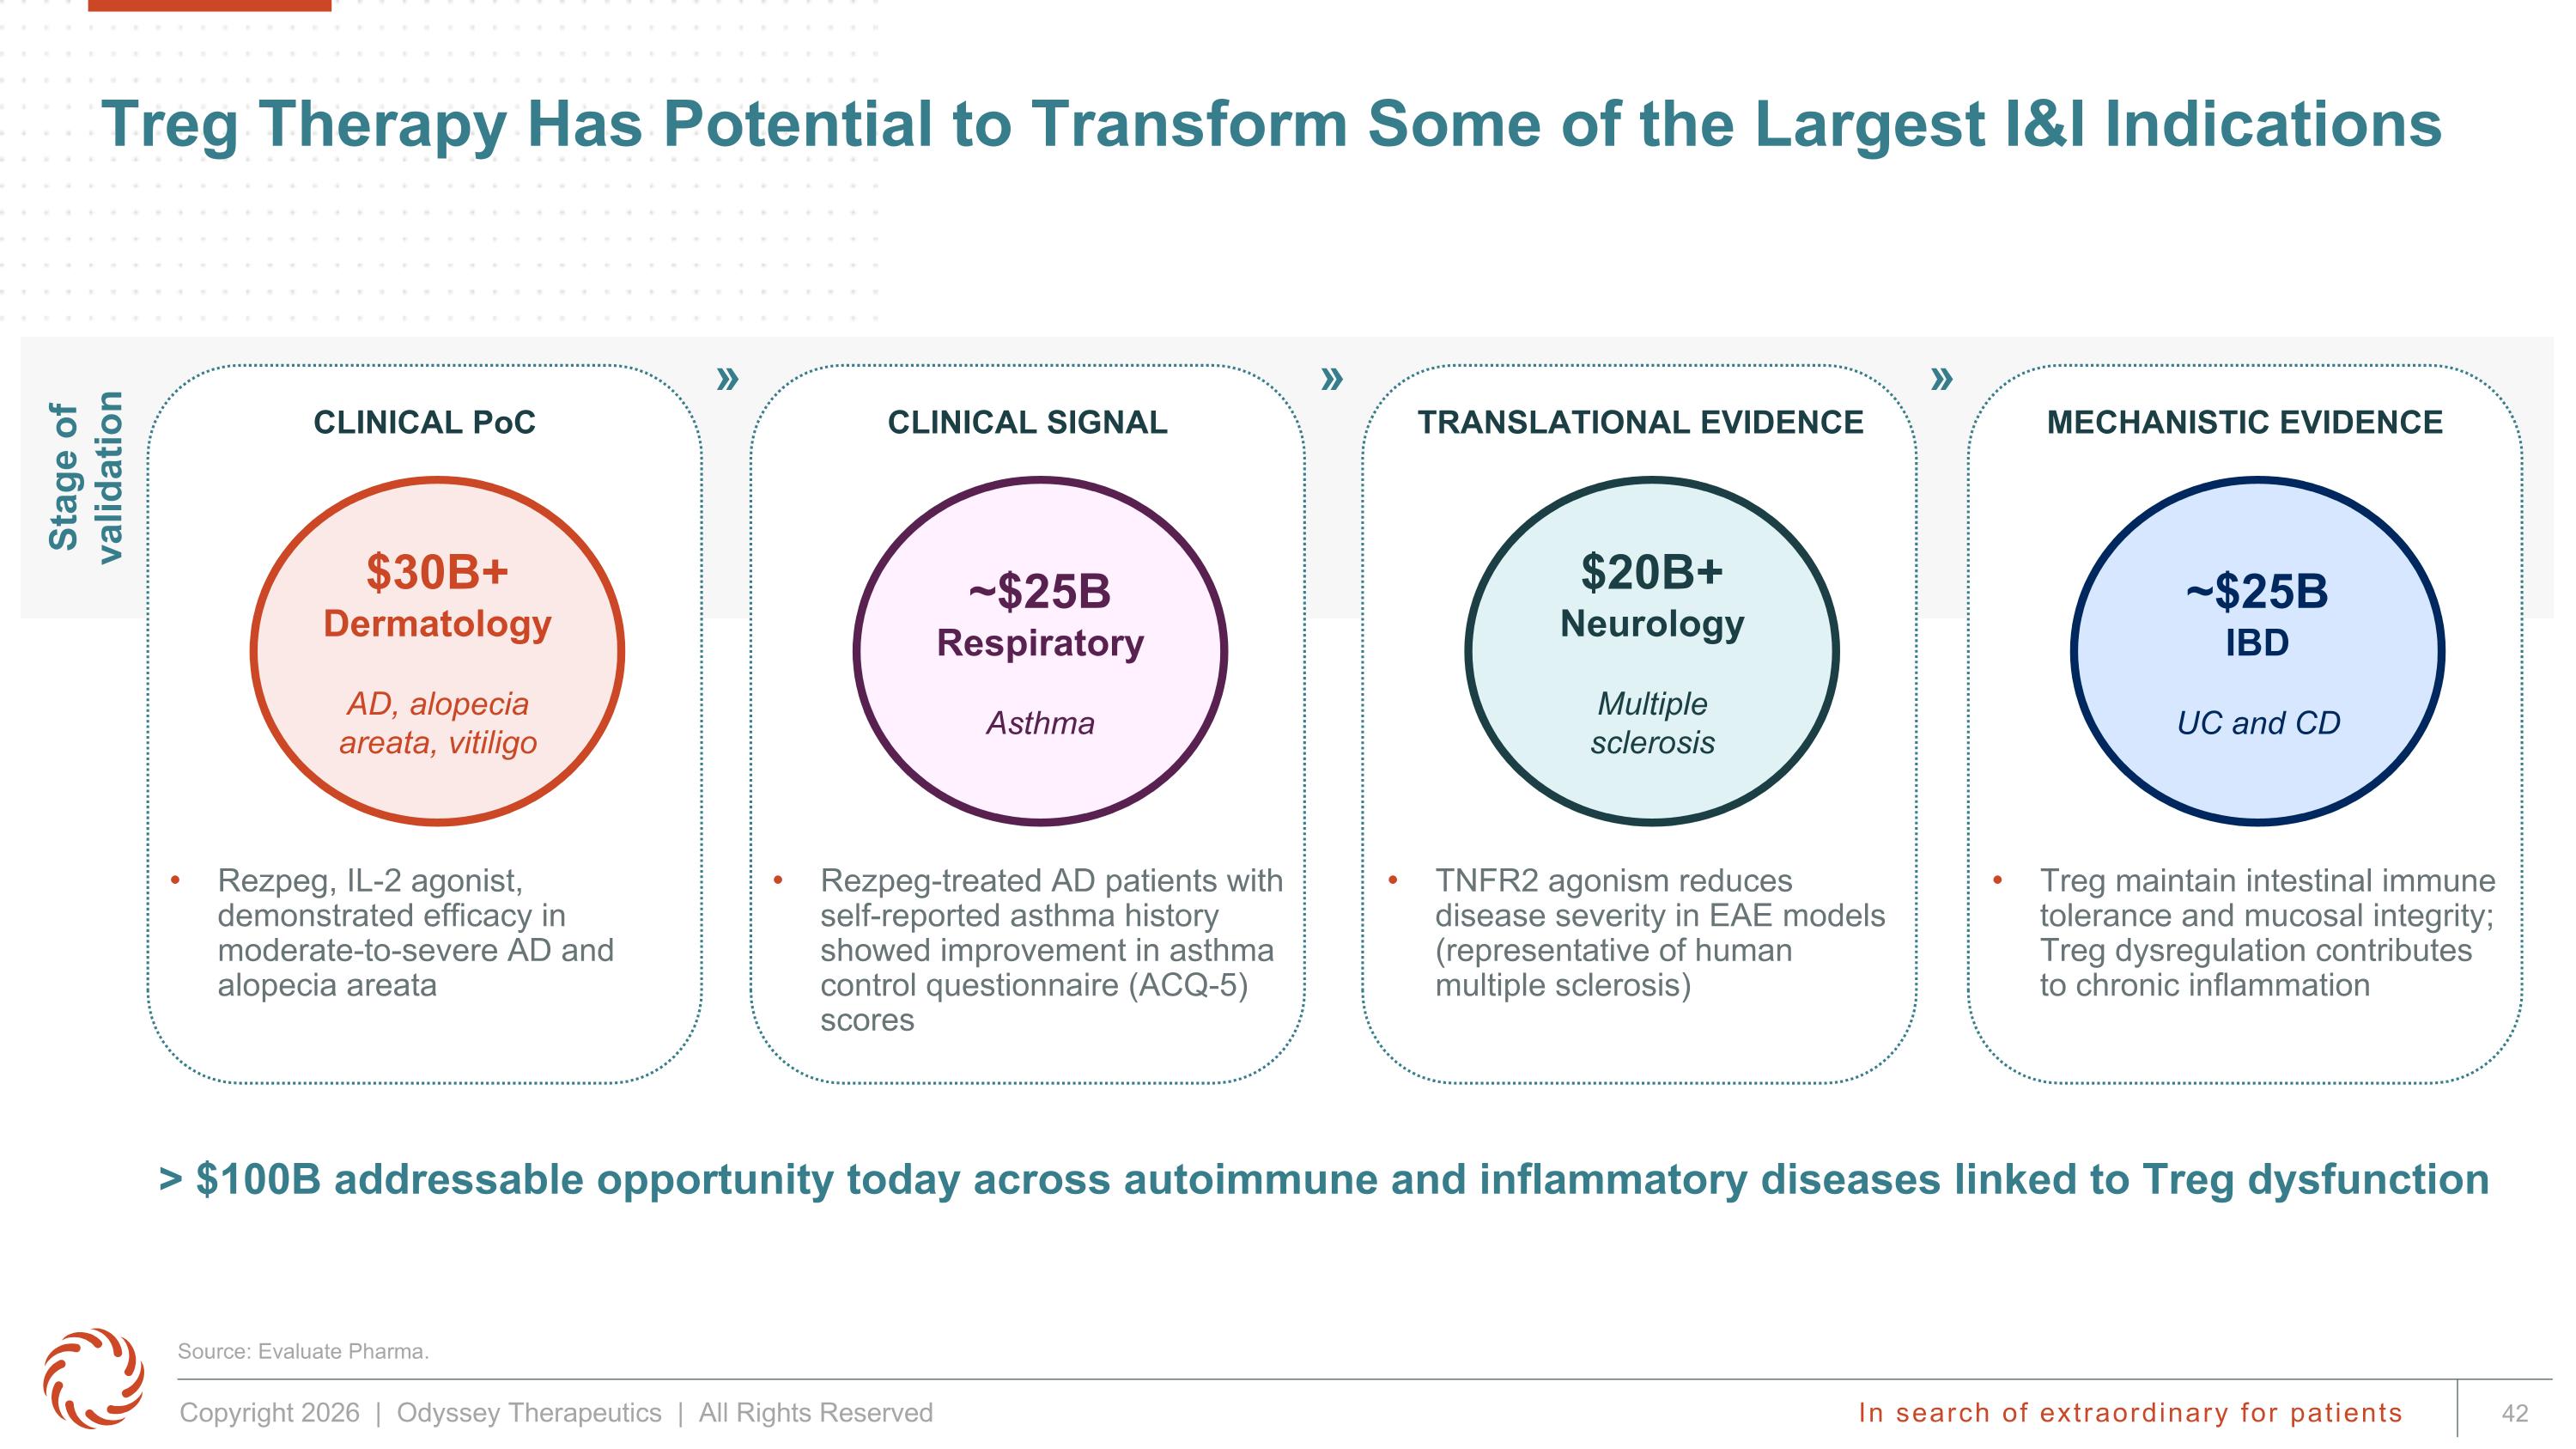
CLINICAL SIGNAL Rezpeg-treated AD patients with self-reported asthma history showed improvement in asthma control questionnaire (ACQ-5) scores ~$25B Respiratory Asthma MECHANISTIC EVIDENCE Treg maintain intestinal immune tolerance and mucosal integrity; Treg dysregulation contributes to chronic inflammation ~$25B IBD UC and CD Treg Therapy Has Potential to Transform Some of the Largest I&I Indications > $100B addressable opportunity today across autoimmune and inflammatory diseases linked to Treg dysfunction Stage of validation CLINICAL PoC Rezpeg, IL-2 agonist, demonstrated efficacy in moderate-to-severe AD and alopecia areata $30B+ Dermatology AD, alopecia areata, vitiligo TRANSLATIONAL EVIDENCE TNFR2 agonism reduces disease severity in EAE models (representative of human multiple sclerosis) $20B+ Neurology Multiple sclerosis » » » Source: Evaluate Pharma.
Final Words
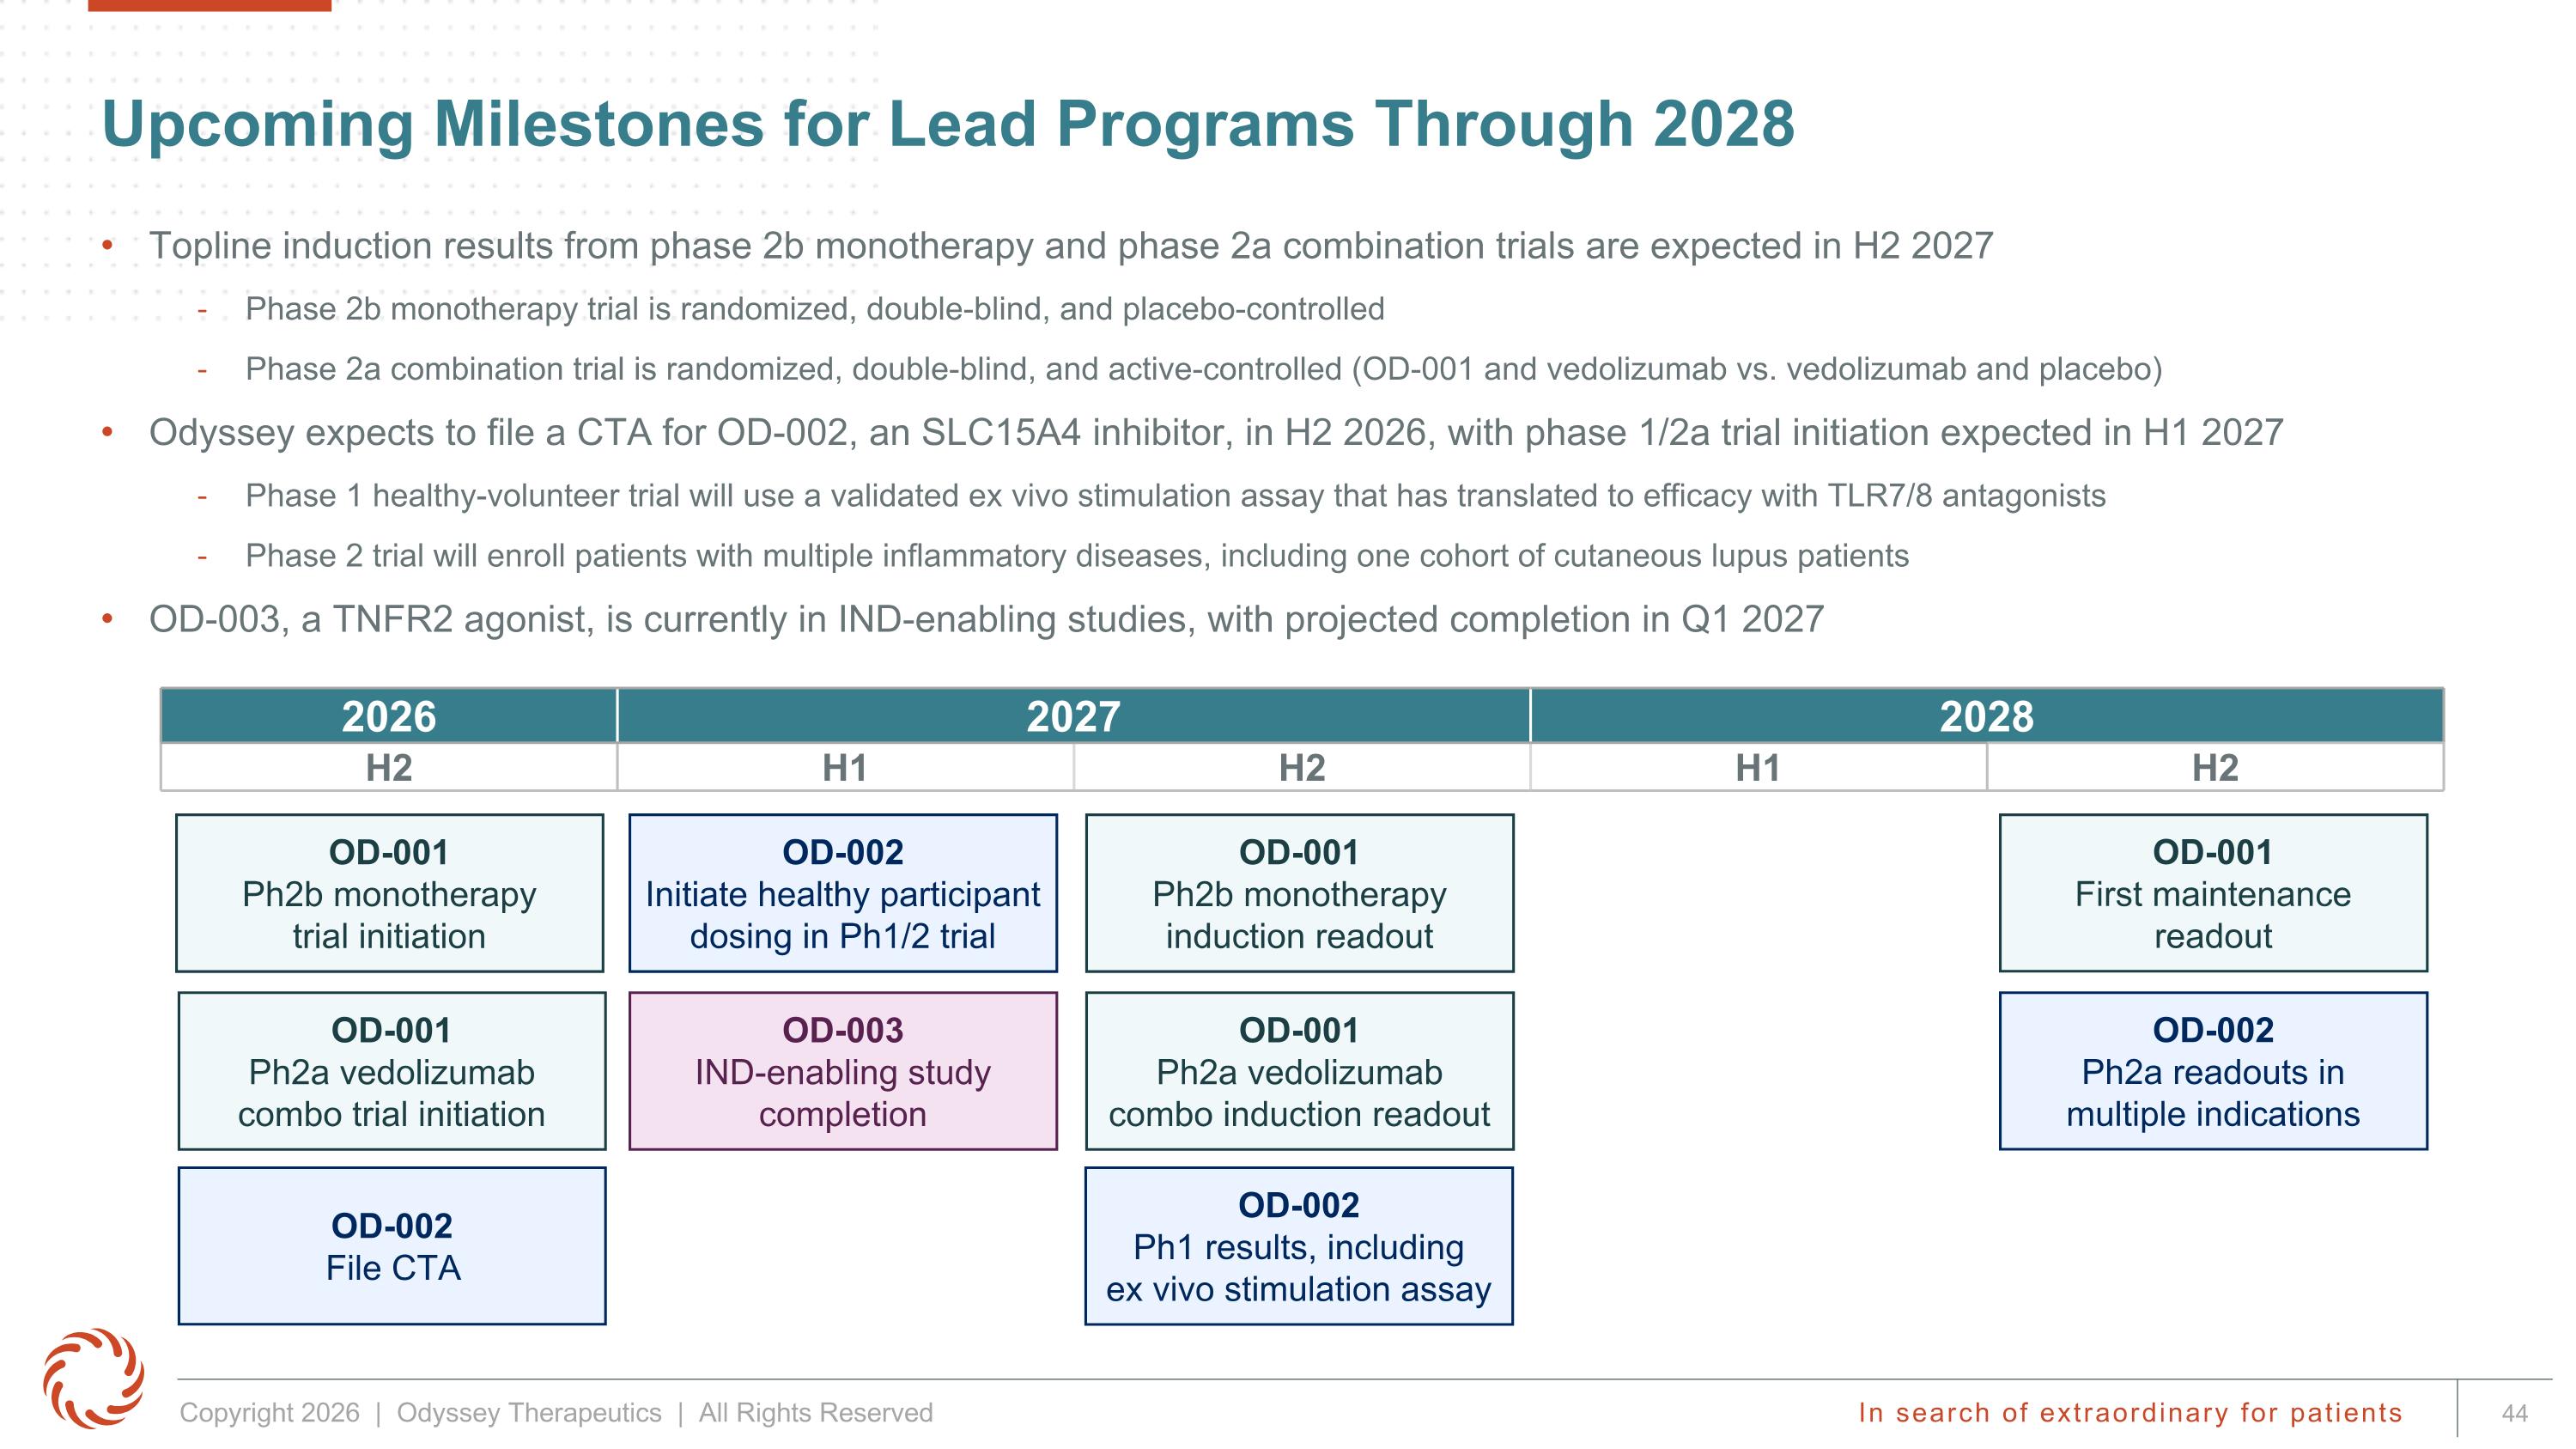
Upcoming Milestones for Lead Programs Through 2028 Topline induction results from phase 2b monotherapy and phase 2a combination trials are expected in H2 2027 Phase 2b monotherapy trial is randomized, double-blind, and placebo-controlled Phase 2a combination trial is randomized, double-blind, and active-controlled (OD-001 and vedolizumab vs. vedolizumab and placebo) Odyssey expects to file a CTA for OD-002, an SLC15A4 inhibitor, in H2 2026, with phase 1/2a trial initiation expected in H1 2027 Phase 1 healthy-volunteer trial will use a validated ex vivo stimulation assay that has translated to efficacy with TLR7/8 antagonists Phase 2 trial will enroll patients with multiple inflammatory diseases, including one cohort of cutaneous lupus patients OD-003, a TNFR2 agonist, is currently in IND-enabling studies, with projected completion in Q1 2027 2026 2027 2028 H2 H1 H2 H1 H2 OD-001 Ph2b monotherapy trial initiation OD-002 File CTA OD-002 Initiate healthy participant dosing in Ph1/2 trial OD-002 Ph1 results, including ex vivo stimulation assay OD-002 Ph2a readouts in multiple indications OD-001 First maintenance readout OD-001 Ph2a vedolizumab combo trial initiation OD-001 Ph2b monotherapy induction readout OD-001 Ph2a vedolizumab combo induction readout OD-003 IND-enabling study completion