Pay vs Performance Disclosure - USD ($)
Dec. 31, 2025
Dec. 31, 2024
Dec. 31, 2023
Dec. 31, 2022
Dec. 31, 2021
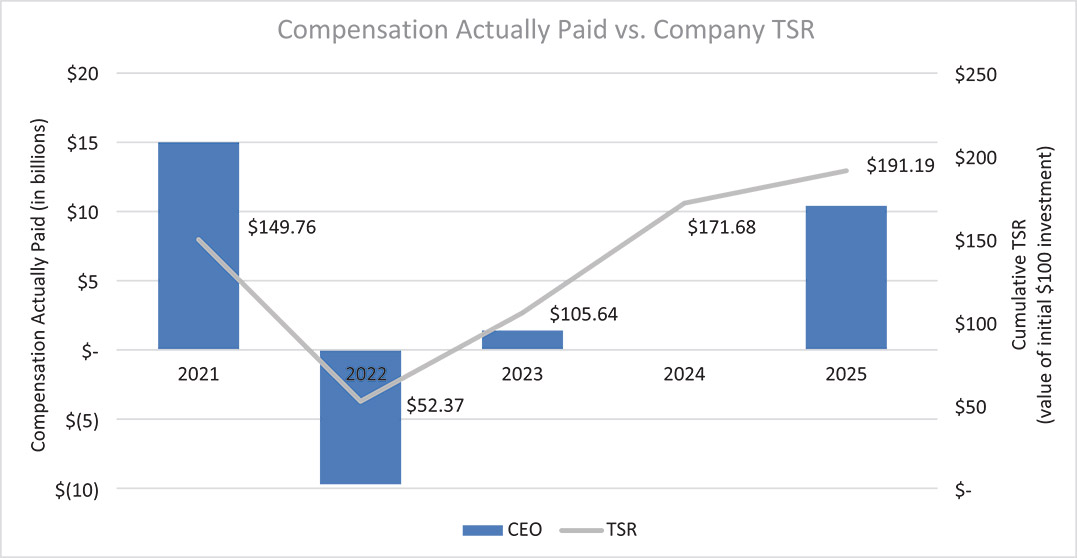
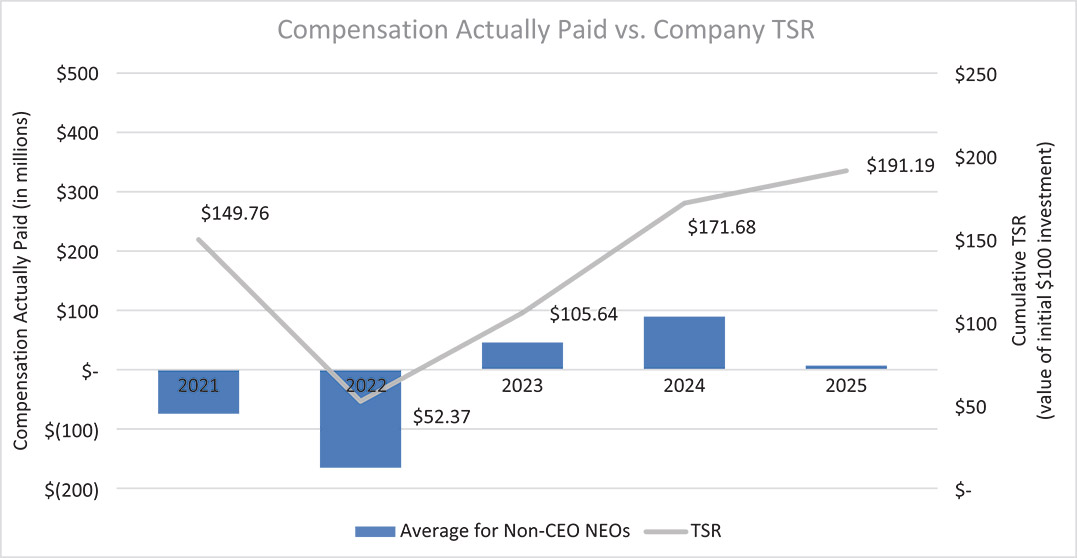
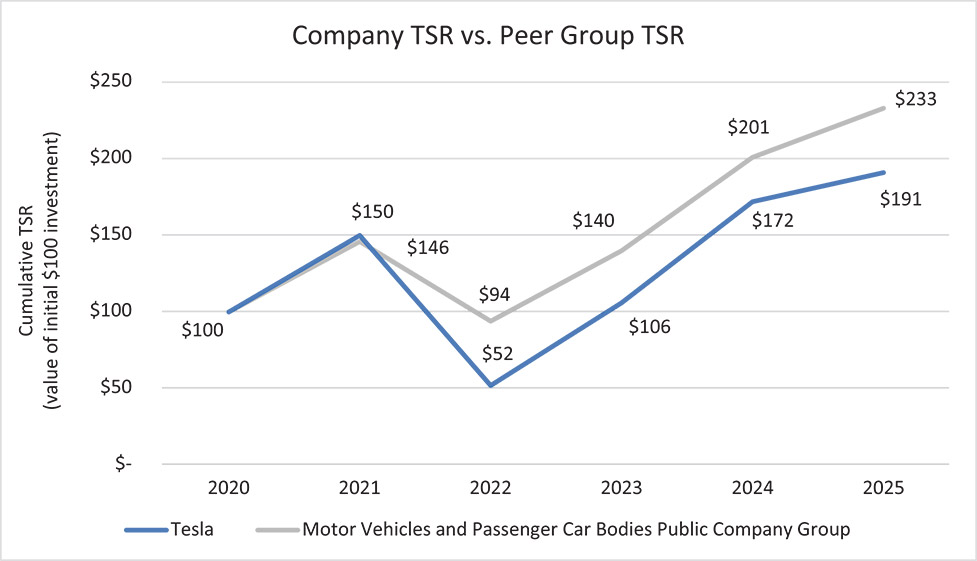
| Year | | | Summary Compensation Table Total for CEO (in millions) ($)(1) | | | Compensation Actually Paid to CEO (in millions) ($)(2) | | | Average Summary Compensation Table Total for Non-CEO NEOs (in millions) ($)(3) | | | Average Compensation Actually Paid to Non-CEO NEOs (in millions) ($)(4) | | | Value of Initial Fixed $100 Investment Based on: | | | Net Income (in millions) ($)(7) | | | Revenue (in millions) ($)(8) | | |||||||||||||||||||||||||||
| | Tesla Total Shareholder Return ($)(5) | | | Peer Group Total Shareholder Return ($)(6) | | ||||||||||||||||||||||||||||||||||||||||||||
| 2025 | | | | | 158,359 | | | | | | 10,370 | | | | | | 0.4 | | | | | | 6.8 | | | | | | 191 | | | | | | 233 | | | | | | 3,855 | | | | | | 94,827 | | |
| 2024 | | | | | | | | | | | | | | | 46.7 | | | | | | 89.3(9) | | | | | | 172 | | | | | | 201 | | | | | | 7,153 | | | | | | 97,690 | | | ||
| 2023 | | | | | | | | | | 1,403 | | | | | | 8.4 | | | | | | 45.8(10) | | | | | | 106 | | | | | | 140 | | | | | | 14,974 | | | | | | 96,773 | | | |
| 2022 | | | | | | | | | | (9,703) | | | | | | 0.3 | | | | | | (165.3) | | | | | | 52 | | | | | | 94 | | | | | | 12,587 | | | | | | 81,462 | | | |
| 2021 | | | | | | | | | | 15,016 | | | | | | 0.3 | | | | | | (74.3)(11) | | | | | | 150 | | | | | | 146 | | | | | | 5,644 | | | | | | 53,823 | | | |
(1)
Represents the total compensation reported for Mr. Musk (our Chief Executive Officer) for each corresponding year in the “Total” column of the Summary Compensation Table.
(2)
The dollar amounts reported in this column represent the amount of “compensation actually paid” to Mr. Musk, computed in accordance with Item 402(v) of Regulation S-K. The dollar amounts do not reflect the actual amount of compensation earned by or paid to Mr. Musk during the applicable year. In accordance with the requirements of Item 402(v) of Regulation S-K, the following adjustments were made to Mr. Musk’s total compensation, as reported in the Summary Compensation Table for each year, to determine the compensation actually paid.
| | | | Reported Summary Compensation Table Total for CEO (in millions) ($) | | | Reported Value of Equity Awards (in millions) ($)(a) | | | Equity Award Adjustments (in millions) ($)(b) | | | Reported Change in the Actuarial Present Value of Pension Benefits ($) | | | Pension Benefit Adjustments ($) | | | Compensation Actually Paid to CEO (in millions) ($) | | ||||||||||||||||||
| 2025 | | | | | 158,359 | | | | | | 158,359 | | | | | | 10,370 | | | | | | | | | | | | | | | | 10,370 | | | ||
| 2024 | | | | | | | | | | | | | | | | | | | | | | | | | | | | | | | | ||||||
| 2023 | | | | | | | | | | | | | | | 1,403 | | | | | | | | | | | | | | | | 1,403 | | | ||||
| 2022 | | | | | | | | | | | | | | | (9,703) | | | | | | | | | | | | | | | | (9,703) | | | ||||
| 2021 | | | | | | | | | | | | | | | 15,016 | | | | | | | | | | | | | | | | 15,016 | | | ||||
(a)
The grant date fair value of equity awards represents the total of the amounts reported in the “Stock Awards” and “Option Awards” columns in the Summary Compensation Table for the applicable year.
(b)
The equity award adjustments for each applicable year include the addition (or subtraction, as applicable) of the following: (i) the year-end fair value of any equity awards granted in the applicable year that are outstanding and unvested as of the end of the year; (ii) the amount of change as of the end of the applicable year (from the end of the prior fiscal year) in fair value of any awards granted in prior years that are outstanding and unvested as of the end of the applicable year; (iii) for awards that are granted and vest in the same applicable year, the fair value as of the vesting date; (iv) for awards granted in prior years that vest in the applicable year, the amount equal to the change as of the vesting date (from the end of the prior fiscal year) in fair value; (v) for awards granted in prior years that are determined to fail to meet the applicable vesting conditions during the applicable year, a deduction for the amount equal to the fair value at the end of the prior fiscal year; and (vi) the dollar value of any dividends or other earnings paid on stock or option awards in the applicable year prior to the vesting date that are not otherwise reflected in the fair value of such award or included in any other component of total compensation for the applicable year. The valuation assumptions used to calculate fair values did not materially differ from those disclosed at the time of grant. The amounts deducted or added in calculating the equity award adjustments are as follows:
| Year | | | Year End Fair Value of Equity Awards Granted and Unvested in the Year (in millions) ($) | | | Year over Year Change in Fair Value of Outstanding and Unvested Equity Awards (in millions) ($) | | | Fair Value as of Vesting Date of Equity Awards Granted and Vested in the Year ($) | | | Change in Fair Value of Equity Awards Granted in Prior Years that Vested in the Year (Vesting Date Compared to the Value at the End of the Prior Year) (in millions) ($) | | | Fair Value at the End of the Prior Year of Equity Awards that Failed to Meet Vesting Conditions in the Year ($) | | | Value of Dividends or other Earnings Paid on Stock or Option Awards not Otherwise Reflected in Fair Value or Total Compensation ($) | | | Total Average Equity Award Adjustments (in millions) ($) | | |||||||||||||||||||||
| 2025 | | | | | 10,370 | | | | | | | | | | | | | | | | | | | | | | | | | | | | | | | 10,370 | | | |||||
| 2024 | | | | | | | | | | | | | | | | | | | | | | | | | | | | | | | | | | | | | |||||||
| 2023 | | | | | | | | | | | | | | | | | | | | 1,403 | | | | | | | | | | | | | | | | 1,403 | | | |||||
| 2022 | | | | | | | | | | (4,973) | | | | | | | | | | | (4,730) | | | | | | | | | | | | | | | | (9,703) | | | ||||
| 2021 | | | | | | | | | | 13,028 | | | | | | | | | | | 1,988 | | | | | | | | | | | | | | | | 15,016 | | | ||||
(3)
Represents the average of the amounts reported for the Company’s NEOs as a group (excluding Mr. Musk, who has served as our CEO since 2008) in the “Total” column of the Summary Compensation Table in each applicable year. The names of each of the NEOs (excluding Mr. Musk) included for purposes of calculating the average amounts in each applicable year are as follows: (i) for 2025, Vaibhav Taneja and Tom Zhu, (ii) for 2024, Vaibhav Taneja, Andrew Baglino and Tom Zhu, (iii) for 2023, Vaibhav Taneja, Andrew Baglino, Tom Zhu and Zachary Kirkhorn, (iv) for 2022, Zachary Kirkhorn and Andrew Baglino and (v) for 2021, Zachary Kirkhorn, Andrew Baglino and Jerome Guillen.
(4)
The dollar amounts reported in this column are the average compensation actually paid for our NEOs other than our CEO in each applicable year, computed in accordance with Item 402(v) of Regulation S-K. The dollar amounts do not reflect the actual amount of compensation earned by or paid to our NEOs during the applicable year. In accordance with the requirements of Item 402(v) of Regulation S-K, the following adjustments were made to the NEOs’ total compensation, as reported in the Summary Compensation Table for each applicable year, to determine the compensation actually paid.
| | | | Average Reported Summary Compensation Table Total for Non-CEO NEOs (in millions) ($) | | | Average Reported Value of Equity Awards (in millions) ($) | | | Average Equity Award Adjustments (in millions) ($)(a) | | | Average Reported Change in the Actuarial Present Value of Pension Benefits ($) | | | Average Pension Benefit Adjustments ($) | | | Average Compensation Actually Paid to Non-CEO NEOs (in millions) ($) | | ||||||||||||||||||
| 2025 | | | | | 0.4 | | | | | | | | | | | 6.4 | | | | | | | | | | | | | | | | 6.8 | | | |||
| 2024 | | | | | 46.7 | | | | | | 46.4 | | | | | | 89.0 | | | | | | | | | | | | | | | | 89.3 | | | ||
| 2023 | | | | | 8.4 | | | | | | 7.9 | | | | | | 45.3 | | | | | | | | | | | | | | | | 45.8 | | | ||
| 2022 | | | | | 0.3 | | | | | | | | | | | (165.6) | | | | | | | | | | | | | | | | (165.3) | | | |||
| 2021 | | | | | 0.3 | | | | | | | | | | | (74.6) | | | | | | | | | | | | | | | | (74.3) | | | |||
(a)
The amounts deducted or added in calculating the total average equity award adjustments are as follows:
| Year | | | Average Year End Fair Value of Equity Awards Granted and Unvested in the Year (in millions) ($) | | | Year over Year Average Change in Fair Value of Outstanding and Unvested Equity Awards (in millions) ($) | | | Average Fair Value as of Vesting Date of Equity Awards Granted and Vested in the Year (in millions) ($) | | | Change in Fair Value of Equity Awards Granted in Prior Years that Vested in the Year (Vesting Date Compared to the Value at the End of the Prior Year) (in millions) ($) | | | Average Fair Value at the End of the Prior Year of Equity Awards that Failed to Meet Vesting Conditions in the Year (in millions) ($) | | | Average Value of Dividends or other Earnings Paid on Stock or Option Awards not Otherwise Reflected in Fair Value or Total Compensation ($) | | | Total Average Equity Award Adjustments (in millions) ($) | | |||||||||||||||||||||
| 2025 | | | | | | | | | | 14.7 | | | | | | | | | | | (8.3) | | | | | | | | | | | | | | | | 6.4 | | | ||||
| 2024 | | | | | 89.9 | | | | | | 9.0 | | | | | | 2.2 | | | | | | (5.3) | | | | | | (6.8) | | | | | | | | | | | 89.0 | | | |
| 2023 | | | | | 9.7 | | | | | | 12.1 | | | | | | 1.8 | | | | | | 23.0 | | | | | | (1.3) | | | | | | | | | | | 45.3 | | | |
| 2022 | | | | | | | | | | (110.5) | | | | | | | | | | | (55.1) | | | | | | | | | | | | | | | | (165.6) | | | ||||
| 2021 | | | | | | | | | | 78.7 | | | | | | | | | | | (2.9) | | | | | | (150.4) | | | | | | | | | | | (74.6) | | | |||
(5)
Total shareholder return (“TSR”) is calculated by dividing the sum of the cumulative amount of dividends for the measurement period, assuming dividend reinvestment, and the difference between the Company’s share price at the end and the beginning of the measurement period by the Company’s share price at the beginning of the measurement period. The beginning of the measurement period is December 31, 2020. The Company has never declared or paid cash dividends on its common stock. The dollar amounts reported in the table are the value of an initial $100 investment made on December 31, 2020, equal to $100 multiplied by one plus the TSR percentage calculated as described above.
(6)
Represents the weighted group TSR, weighted according to the respective companies’ stock market capitalization at the beginning of each period for which a return is indicated. The beginning of the measurement period is December 31, 2020. The peer group used for this purpose is the group of all public companies with SIC code 3711, “Motor Vehicles and Passenger Car Bodies.”
(7)
The dollar amounts reported represent the amount of net income reflected in the Company’s audited financial statements for the applicable year.
(8)
In the Company’s assessment, revenue is the financial performance measure that is the most important financial performance measure (other than TSR and net income) used by the Company for the most recently completed fiscal year, to link compensation actually paid to performance.
(9)
Mr. Baglino departed Tesla in April 2024, resulting in certain forfeitures of unvested awards. The average compensation actually paid in 2024 to our NEOs other than our CEO and Mr. Baglino was approximately $146.3 million.
(10)
Mr. Kirkhorn departed Tesla in December 2023, which led to certain forfeitures of unvested awards. The average compensation actually paid in 2023 to our NEOs other than our CEO and Mr. Kirkhorn was approximately $54.3 million.
(11)
Mr. Guillen departed Tesla in June 2021, resulting in certain forfeitures of unvested awards. The average compensation actually paid in 2021 to our NEOs other than our CEO and Mr. Guillen was approximately $123.2 million.
(1)
Represents the total compensation reported for Mr. Musk (our Chief Executive Officer) for each corresponding year in the “Total” column of the Summary Compensation Table.
(3)
Represents the average of the amounts reported for the Company’s NEOs as a group (excluding Mr. Musk, who has served as our CEO since 2008) in the “Total” column of the Summary Compensation Table in each applicable year. The names of each of the NEOs (excluding Mr. Musk) included for purposes of calculating the average amounts in each applicable year are as follows: (i) for 2025, Vaibhav Taneja and Tom Zhu, (ii) for 2024, Vaibhav Taneja, Andrew Baglino and Tom Zhu, (iii) for 2023, Vaibhav Taneja, Andrew Baglino, Tom Zhu and Zachary Kirkhorn, (iv) for 2022, Zachary Kirkhorn and Andrew Baglino and (v) for 2021, Zachary Kirkhorn, Andrew Baglino and Jerome Guillen.
(6)
Represents the weighted group TSR, weighted according to the respective companies’ stock market capitalization at the beginning of each period for which a return is indicated. The beginning of the measurement period is December 31, 2020. The peer group used for this purpose is the group of all public companies with SIC code 3711, “Motor Vehicles and Passenger Car Bodies.
(2)
The dollar amounts reported in this column represent the amount of “compensation actually paid” to Mr. Musk, computed in accordance with Item 402(v) of Regulation S-K. The dollar amounts do not reflect the actual amount of compensation earned by or paid to Mr. Musk during the applicable year. In accordance with the requirements of Item 402(v) of Regulation S-K, the following adjustments were made to Mr. Musk’s total compensation, as reported in the Summary Compensation Table for each year, to determine the compensation actually paid.
| | | | Reported Summary Compensation Table Total for CEO (in millions) ($) | | | Reported Value of Equity Awards (in millions) ($)(a) | | | Equity Award Adjustments (in millions) ($)(b) | | | Reported Change in the Actuarial Present Value of Pension Benefits ($) | | | Pension Benefit Adjustments ($) | | | Compensation Actually Paid to CEO (in millions) ($) | | ||||||||||||||||||
| 2025 | | | | | 158,359 | | | | | | 158,359 | | | | | | 10,370 | | | | | | | | | | | | | | | | 10,370 | | | ||
| 2024 | | | | | | | | | | | | | | | | | | | | | | | | | | | | | | | | ||||||
| 2023 | | | | | | | | | | | | | | | 1,403 | | | | | | | | | | | | | | | | 1,403 | | | ||||
| 2022 | | | | | | | | | | | | | | | (9,703) | | | | | | | | | | | | | | | | (9,703) | | | ||||
| 2021 | | | | | | | | | | | | | | | 15,016 | | | | | | | | | | | | | | | | 15,016 | | | ||||
(a)
The grant date fair value of equity awards represents the total of the amounts reported in the “Stock Awards” and “Option Awards” columns in the Summary Compensation Table for the applicable year.
(b)
The equity award adjustments for each applicable year include the addition (or subtraction, as applicable) of the following: (i) the year-end fair value of any equity awards granted in the applicable year that are outstanding and unvested as of the end of the year; (ii) the amount of change as of the end of the applicable year (from the end of the prior fiscal year) in fair value of any awards granted in prior years that are outstanding and unvested as of the end of the applicable year; (iii) for awards that are granted and vest in the same applicable year, the fair value as of the vesting date; (iv) for awards granted in prior years that vest in the applicable year, the amount equal to the change as of the vesting date (from the end of the prior fiscal year) in fair value; (v) for awards granted in prior years that are determined to fail to meet the applicable vesting conditions during the applicable year, a deduction for the amount equal to the fair value at the end of the prior fiscal year; and (vi) the dollar value of any dividends or other earnings paid on stock or option awards in the applicable year prior to the vesting date that are not otherwise reflected in the fair value of such award or included in any other component of total compensation for the applicable year. The valuation assumptions used to calculate fair values did not materially differ from those disclosed at the time of grant. The amounts deducted or added in calculating the equity award adjustments are as follows:
| Year | | | Year End Fair Value of Equity Awards Granted and Unvested in the Year (in millions) ($) | | | Year over Year Change in Fair Value of Outstanding and Unvested Equity Awards (in millions) ($) | | | Fair Value as of Vesting Date of Equity Awards Granted and Vested in the Year ($) | | | Change in Fair Value of Equity Awards Granted in Prior Years that Vested in the Year (Vesting Date Compared to the Value at the End of the Prior Year) (in millions) ($) | | | Fair Value at the End of the Prior Year of Equity Awards that Failed to Meet Vesting Conditions in the Year ($) | | | Value of Dividends or other Earnings Paid on Stock or Option Awards not Otherwise Reflected in Fair Value or Total Compensation ($) | | | Total Average Equity Award Adjustments (in millions) ($) | | |||||||||||||||||||||
| 2025 | | | | | 10,370 | | | | | | | | | | | | | | | | | | | | | | | | | | | | | | | 10,370 | | | |||||
| 2024 | | | | | | | | | | | | | | | | | | | | | | | | | | | | | | | | | | | | | |||||||
| 2023 | | | | | | | | | | | | | | | | | | | | 1,403 | | | | | | | | | | | | | | | | 1,403 | | | |||||
| 2022 | | | | | | | | | | (4,973) | | | | | | | | | | | (4,730) | | | | | | | | | | | | | | | | (9,703) | | | ||||
| 2021 | | | | | | | | | | 13,028 | | | | | | | | | | | 1,988 | | | | | | | | | | | | | | | | 15,016 | | | ||||
(4)
The dollar amounts reported in this column are the average compensation actually paid for our NEOs other than our CEO in each applicable year, computed in accordance with Item 402(v) of Regulation S-K. The dollar amounts do not reflect the actual amount of compensation earned by or paid to our NEOs during the applicable year. In accordance with the requirements of Item 402(v) of Regulation S-K, the following adjustments were made to the NEOs’ total compensation, as reported in the Summary Compensation Table for each applicable year, to determine the compensation actually paid.
| | | | Average Reported Summary Compensation Table Total for Non-CEO NEOs (in millions) ($) | | | Average Reported Value of Equity Awards (in millions) ($) | | | Average Equity Award Adjustments (in millions) ($)(a) | | | Average Reported Change in the Actuarial Present Value of Pension Benefits ($) | | | Average Pension Benefit Adjustments ($) | | | Average Compensation Actually Paid to Non-CEO NEOs (in millions) ($) | | ||||||||||||||||||
| 2025 | | | | | 0.4 | | | | | | | | | | | 6.4 | | | | | | | | | | | | | | | | 6.8 | | | |||
| 2024 | | | | | 46.7 | | | | | | 46.4 | | | | | | 89.0 | | | | | | | | | | | | | | | | 89.3 | | | ||
| 2023 | | | | | 8.4 | | | | | | 7.9 | | | | | | 45.3 | | | | | | | | | | | | | | | | 45.8 | | | ||
| 2022 | | | | | 0.3 | | | | | | | | | | | (165.6) | | | | | | | | | | | | | | | | (165.3) | | | |||
| 2021 | | | | | 0.3 | | | | | | | | | | | (74.6) | | | | | | | | | | | | | | | | (74.3) | | | |||
(a)
The amounts deducted or added in calculating the total average equity award adjustments are as follows:
| Year | | | Average Year End Fair Value of Equity Awards Granted and Unvested in the Year (in millions) ($) | | | Year over Year Average Change in Fair Value of Outstanding and Unvested Equity Awards (in millions) ($) | | | Average Fair Value as of Vesting Date of Equity Awards Granted and Vested in the Year (in millions) ($) | | | Change in Fair Value of Equity Awards Granted in Prior Years that Vested in the Year (Vesting Date Compared to the Value at the End of the Prior Year) (in millions) ($) | | | Average Fair Value at the End of the Prior Year of Equity Awards that Failed to Meet Vesting Conditions in the Year (in millions) ($) | | | Average Value of Dividends or other Earnings Paid on Stock or Option Awards not Otherwise Reflected in Fair Value or Total Compensation ($) | | | Total Average Equity Award Adjustments (in millions) ($) | | |||||||||||||||||||||
| 2025 | | | | | | | | | | 14.7 | | | | | | | | | | | (8.3) | | | | | | | | | | | | | | | | 6.4 | | | ||||
| 2024 | | | | | 89.9 | | | | | | 9.0 | | | | | | 2.2 | | | | | | (5.3) | | | | | | (6.8) | | | | | | | | | | | 89.0 | | | |
| 2023 | | | | | 9.7 | | | | | | 12.1 | | | | | | 1.8 | | | | | | 23.0 | | | | | | (1.3) | | | | | | | | | | | 45.3 | | | |
| 2022 | | | | | | | | | | (110.5) | | | | | | | | | | | (55.1) | | | | | | | | | | | | | | | | (165.6) | | | ||||
| 2021 | | | | | | | | | | 78.7 | | | | | | | | | | | (2.9) | | | | | | (150.4) | | | | | | | | | | | (74.6) | | | |||
Most Important Financial Performance Measures
The list below includes the three financial measures that in our assessment represent the most important financial performance measures used to link compensation actually paid to our NEOs, for the most recently completed fiscal year, to the Company’s performance. See “Compensation Discussion and Analysis” for further details.
•
Revenue
•
Adjusted EBITDA
•
Market Capitalization
(8)
In the Company’s assessment, revenue is the financial performance measure that is the most important financial performance measure (other than TSR and net income) used by the Company for the most recently completed fiscal year, to link compensation actually paid to performance.