Q3 2026 Earnings Conference Call
Certain comments in this presentation contain certain forward looking statements (as defined in the Securities Exchange Act of 1934 and the regulations thereunder). Forward looking statements are not historical facts but instead represent only the beliefs, expectations or opinions of Home Bancorp, Inc. and its management regarding future events, many of which, by their nature, are inherently uncertain. Forward looking statements may be identified by the use of such words as: “believe”, “expect”, “anticipate”, “intend”, “plan”, “estimate”, or words of similar meaning, or future or conditional terms such as “will”, “would”, “should”, “could”, “may”, “likely”, “probably”, or “possibly.” Forward looking statements include, but are not limited to, financial projections and estimates and their underlying assumptions; statements regarding plans, objectives and expectations with respect to future operations, products and services; and statements regarding future performance. Such statements are subject to certain risks, uncertainties and assumptions, many of which are difficult to predict and generally are beyond the control of Home Bancorp, Inc. and its management, that could cause actual results to differ materially from those expressed in, or implied or projected by, forward looking statements. The following factors, among others, could cause actual results to differ materially from the anticipated results or other expectations expressed in the forward looking statements: (1) economic and competitive conditions which could affect the volume of loan originations, deposit flows and real estate values; (2) the levels of noninterest income and expense and the amount of loan losses; (3) competitive pressure among depository institutions increasing significantly; (4) changes in the interest rate environment causing reduced interest margins; (5) general economic conditions, either nationally or in the markets in which Home Bancorp, Inc. is or will be doing business, being less favorable than expected; (6) political and social unrest, including acts of war or terrorism; (7) we may not fully realize all the benefits we anticipated in connection with our acquisitions of other institutions or our assumptions made in connection therewith may prove to be inaccurate; (8) cyber incidents or other failures, disruptions or security breaches; or (9) legislation or changes in regulatory requirements adversely affecting the business of Home Bancorp, Inc. Home Bancorp, Inc. undertakes no obligation to update these forward looking statements to reflect events or circumstances that occur after the date on which such statements were made. As used in this presentation, unless the context otherwise requires, the terms “we,” “our,” “us,” or the “Company” refer to Home Bancorp, Inc. and the term the “Bank” refers to Home Bank, N.A., a national bank and wholly owned subsidiary of the Company. In addition, unless the context otherwise requires, references to the operations of the Company include the operations of the Bank. For a more detailed description of the factors that may affect Home Bancorp’s operating results or the outcomes described in these forward-looking statements, we refer you to our filings with the Securities and Exchange Commission, including our annual report on Form 10-K for the year ended December 31, 2025. Home Bancorp assumes no obligation to update the forward-looking statements made during this presentation. For more information, please visit our website www.home24bank.com. Non-GAAP Information This presentation contains financial information determined by methods other than in accordance with generally accepted accounting principles (“GAAP”). The Company's management uses this non-GAAP financial information in its analysis of the Company's performance. In this presentation, information is included which excludes acquired loans, intangible assets, impact of the gain (loss) on the sale of a banking center, the impact of merger-related expenses and one-time tax effects. Management believes the presentation of this non-GAAP financial information provides useful information that is helpful to a full understanding of the Company’s financial position and core operating results. This non-GAAP financial information should not be viewed as a substitute for financial information determined in accordance with GAAP, nor are they necessarily comparable to non-GAAP financial information presented by other companies. | 2 Forward-Looking Statements
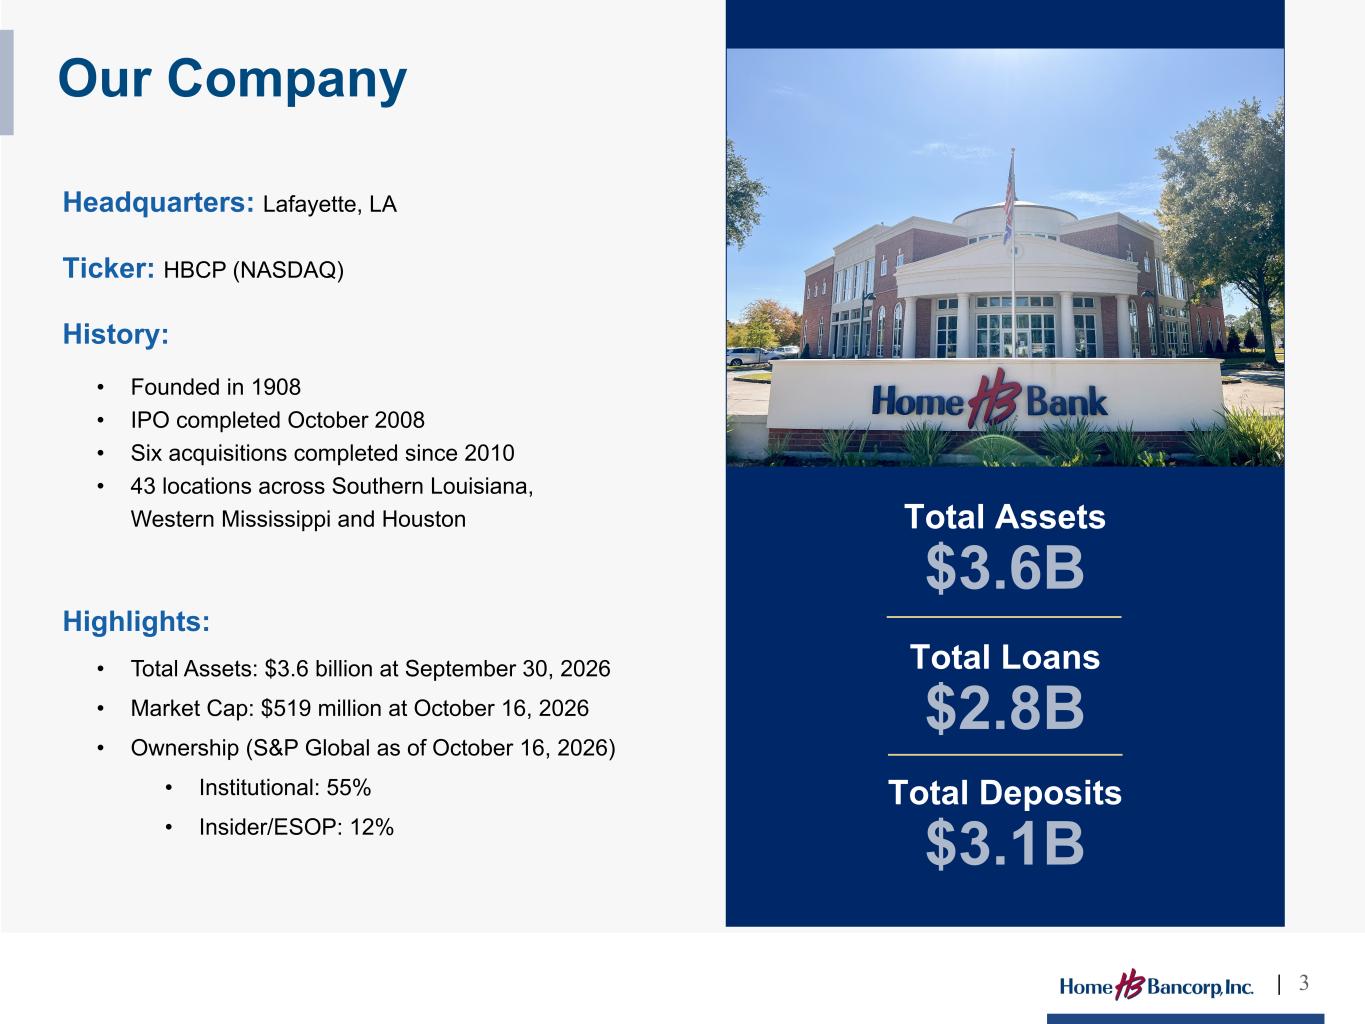
Headquarters: Lafayette, LA Ticker: HBCP (NASDAQ) History: • Founded in 1908 • IPO completed October 2008 • Six acquisitions completed since 2010 • 43 locations across Southern Louisiana, Western Mississippi and Houston Highlights: • Total Assets: $3.6 billion at September 30, 2026 • Market Cap: $519 million at October 16, 2026 • Ownership (S&P Global as of October 16, 2026) • Institutional: 55% • Insider/ESOP: 12% | 3 Our Company Total Assets $3.6B Total Loans $2.8B Total Deposits $3.1B
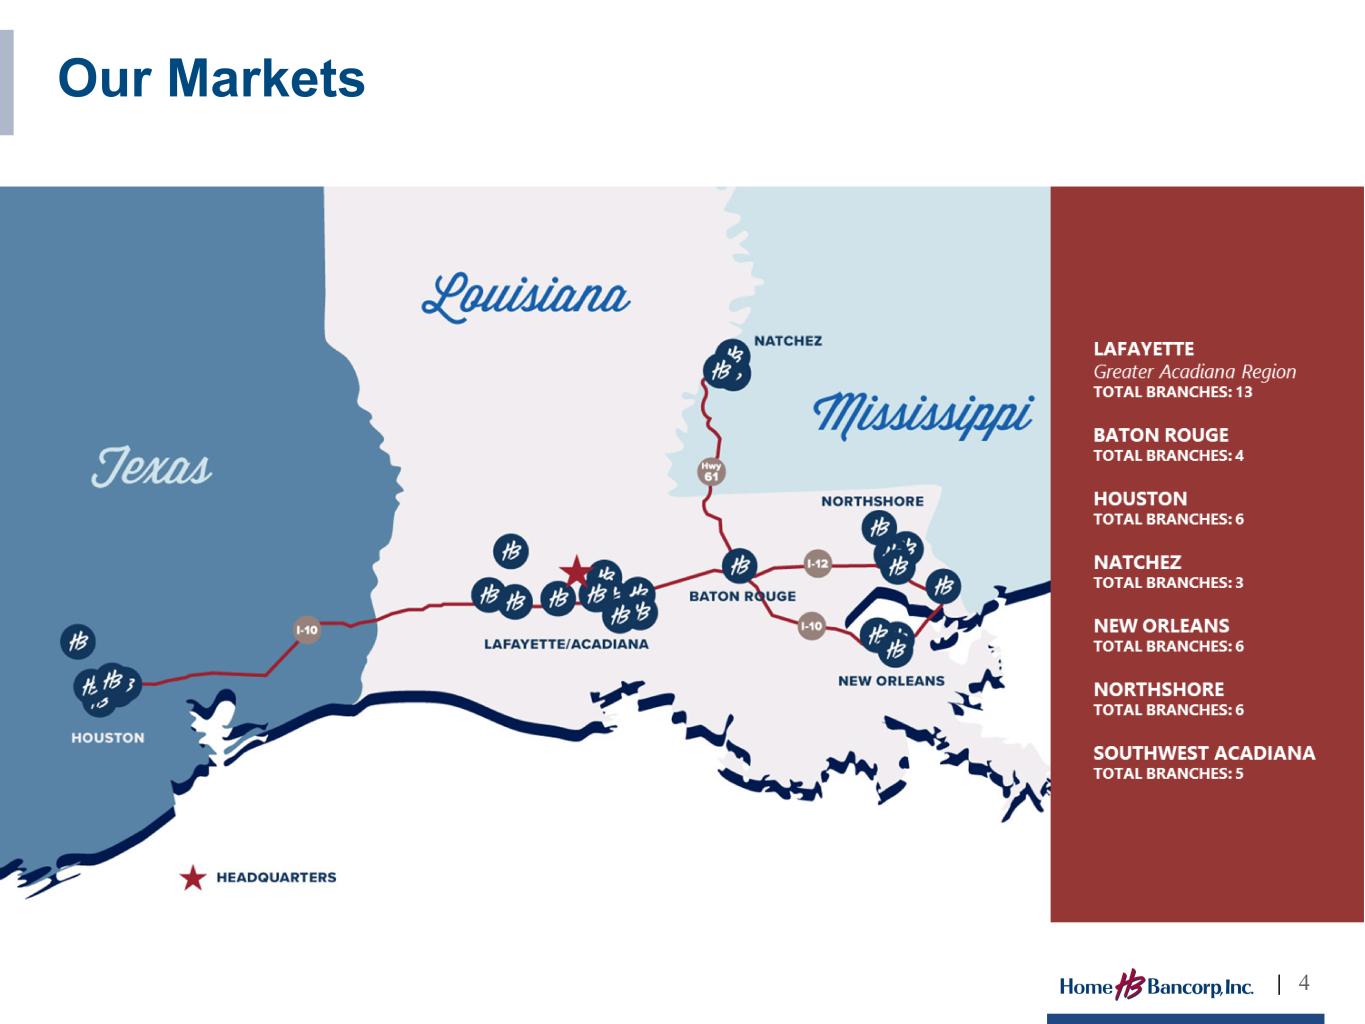
| 4 Our Markets
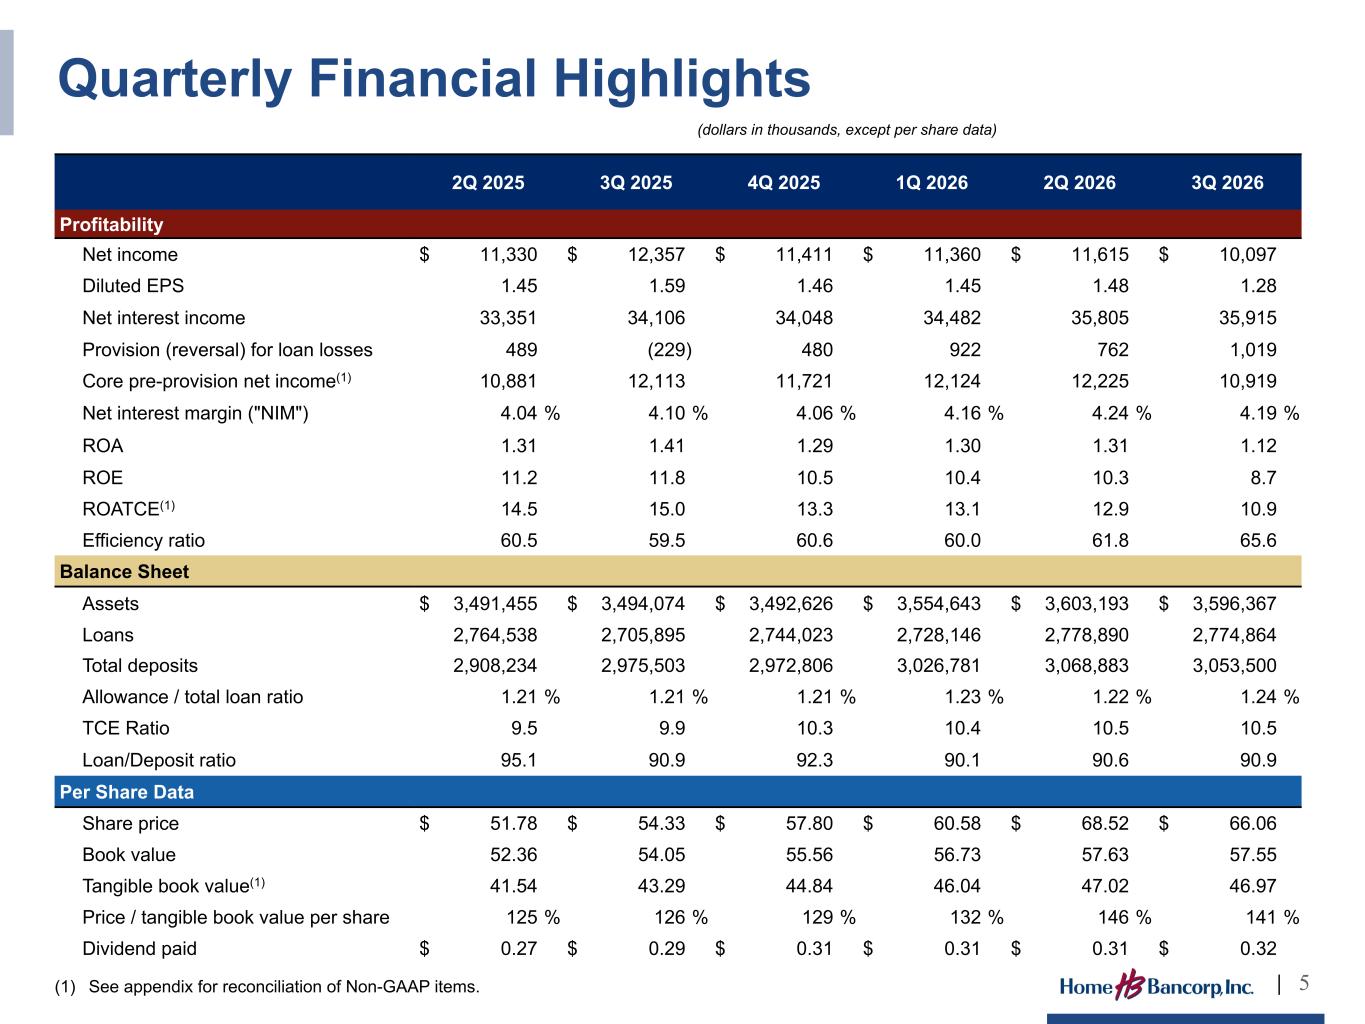
Quarterly Financial Highlights 2Q 2025 3Q 2025 4Q 2025 1Q 2026 2Q 2026 3Q 2026 Profitability Net income $ 11,330 $ 12,357 $ 11,411 $ 11,360 $ 11,615 $ 10,097 Diluted EPS 1.45 1.59 1.46 1.45 1.48 1.28 Net interest income 33,351 34,106 34,048 34,482 35,805 35,915 Provision (reversal) for loan losses 489 (229) 480 922 762 1,019 Core pre-provision net income(1) 10,881 12,113 11,721 12,124 12,225 10,919 Net interest margin ("NIM") 4.04 % 4.10 % 4.06 % 4.16 % 4.24 % 4.19 % ROA 1.31 1.41 1.29 1.30 1.31 1.12 ROE 11.2 11.8 10.5 10.4 10.3 8.7 ROATCE(1) 14.5 15.0 13.3 13.1 12.9 10.9 Efficiency ratio 60.5 59.5 60.6 60.0 61.8 65.6 Balance Sheet Assets $ 3,491,455 $ 3,494,074 $ 3,492,626 $ 3,554,643 $ 3,603,193 $ 3,596,367 Loans 2,764,538 2,705,895 2,744,023 2,728,146 2,778,890 2,774,864 Total deposits 2,908,234 2,975,503 2,972,806 3,026,781 3,068,883 3,053,500 Allowance / total loan ratio 1.21 % 1.21 % 1.21 % 1.23 % 1.22 % 1.24 % TCE Ratio 9.5 9.9 10.3 10.4 10.5 10.5 Loan/Deposit ratio 95.1 90.9 92.3 90.1 90.6 90.9 Per Share Data Share price $ 51.78 $ 54.33 $ 57.80 $ 60.58 $ 68.52 $ 66.06 Book value 52.36 54.05 55.56 56.73 57.63 57.55 Tangible book value(1) 41.54 43.29 44.84 46.04 47.02 46.97 Price / tangible book value per share 125 % 126 % 129 % 132 % 146 % 141 % Dividend paid $ 0.27 $ 0.29 $ 0.31 $ 0.31 $ 0.31 $ 0.32 (1) See appendix for reconciliation of Non-GAAP items. | 5 (dollars in thousands, except per share data)
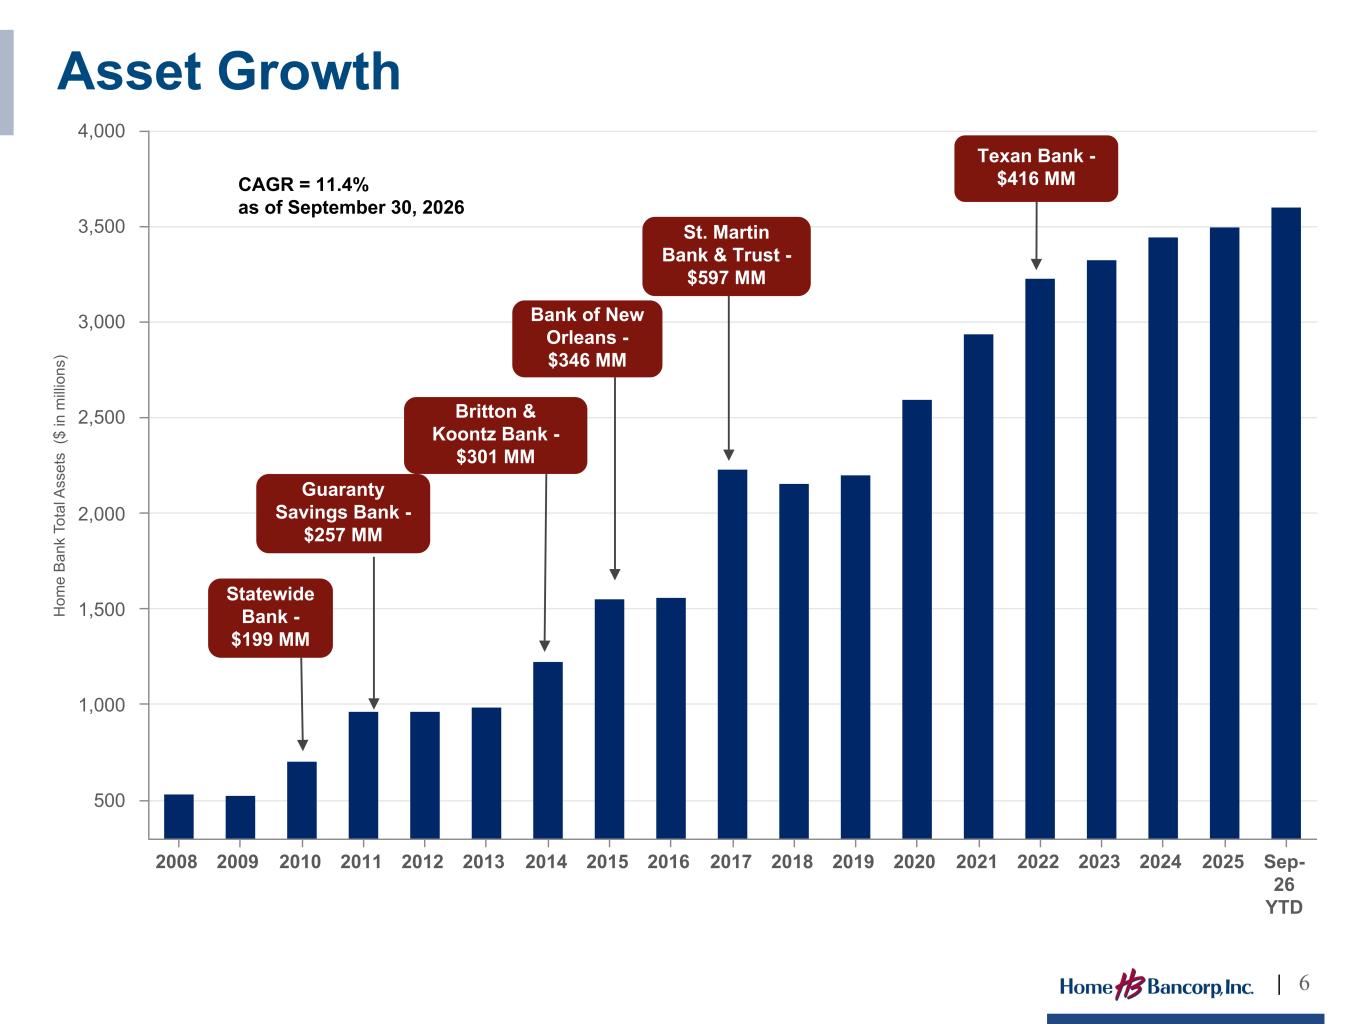
H om e B an k To ta l A ss et s ($ in m illi on s) 2008 2009 2010 2011 2012 2013 2014 2015 2016 2017 2018 2019 2020 2021 2022 2023 2024 2025 Sep- 26 YTD 500 1,000 1,500 2,000 2,500 3,000 3,500 4,000 Statewide Bank - $199 MM Guaranty Savings Bank - $257 MM Britton & Koontz Bank - $301 MM Bank of New Orleans - $346 MM St. Martin Bank & Trust - $597 MM CAGR = 11.4% as of September 30, 2026 | 6 Asset Growth Texan Bank - $416 MM
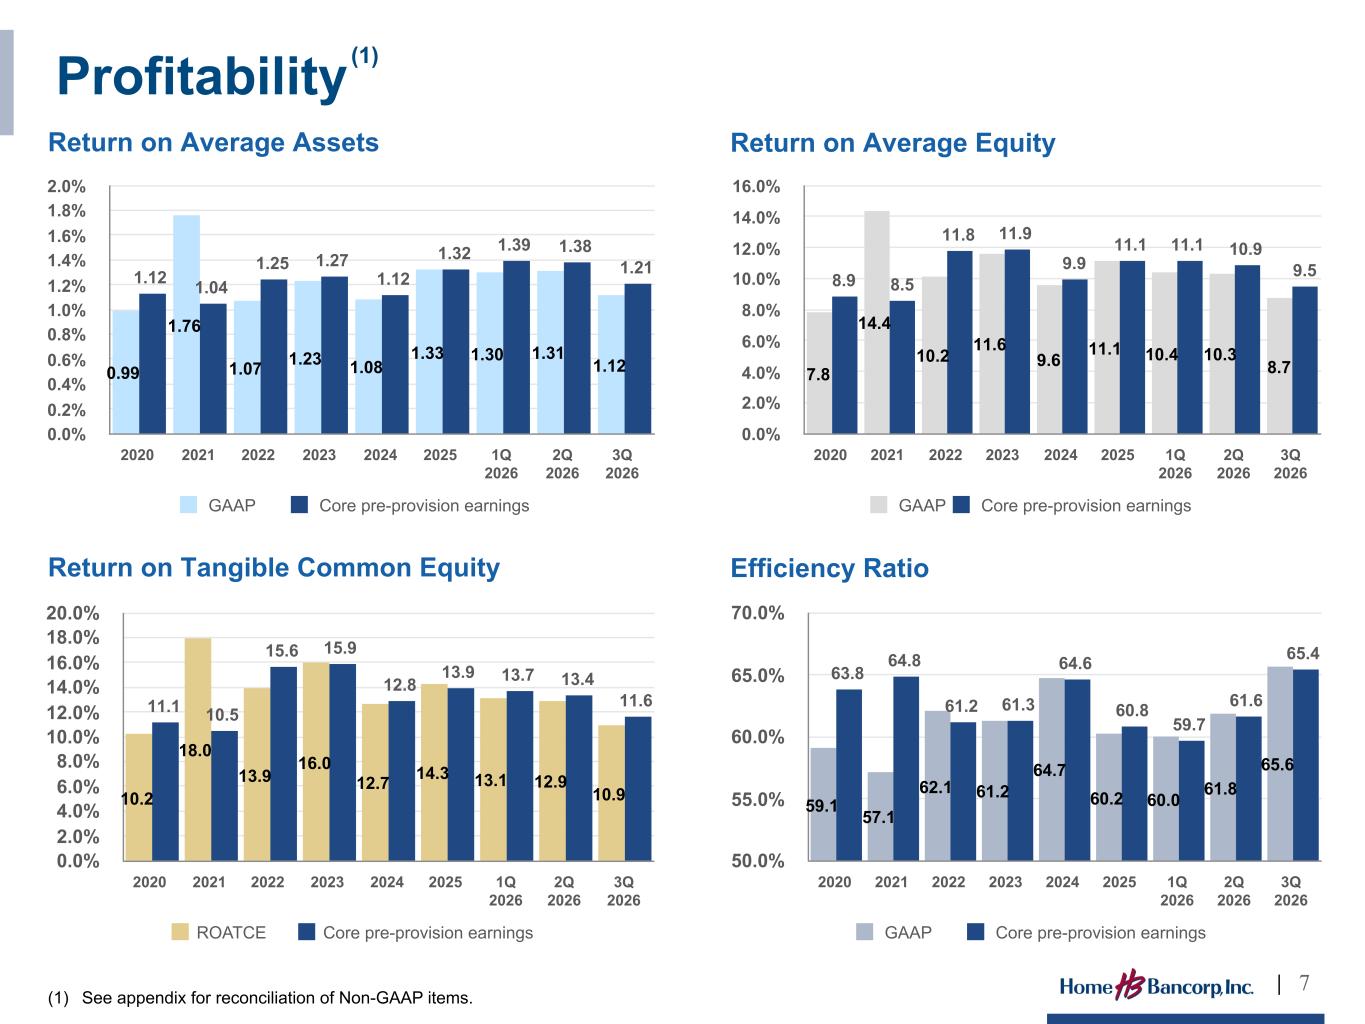
Profitability 0.99 1.76 1.07 1.23 1.08 1.33 1.30 1.31 1.12 1.12 1.04 1.25 1.27 1.12 1.32 1.39 1.38 1.21 GAAP Core pre-provision earnings 2020 2021 2022 2023 2024 2025 1Q 2026 2Q 2026 3Q 2026 0.0% 0.2% 0.4% 0.6% 0.8% 1.0% 1.2% 1.4% 1.6% 1.8% 2.0% Return on Average Assets 7.8 14.4 10.2 11.6 9.6 11.1 10.4 10.3 8.7 8.9 8.5 11.8 11.9 9.9 11.1 11.1 10.9 9.5 GAAP Core pre-provision earnings 2020 2021 2022 2023 2024 2025 1Q 2026 2Q 2026 3Q 2026 0.0% 2.0% 4.0% 6.0% 8.0% 10.0% 12.0% 14.0% 16.0% Return on Average Equity 10.2 18.0 13.9 16.0 12.7 14.3 13.1 12.9 10.9 11.1 10.5 15.6 15.9 12.8 13.9 13.7 13.4 11.6 ROATCE Core pre-provision earnings 2020 2021 2022 2023 2024 2025 1Q 2026 2Q 2026 3Q 2026 0.0% 2.0% 4.0% 6.0% 8.0% 10.0% 12.0% 14.0% 16.0% 18.0% 20.0% Return on Tangible Common Equity 59.1 57.1 62.1 61.2 64.7 60.2 60.0 61.8 65.6 63.8 64.8 61.2 61.3 64.6 60.8 59.7 61.6 65.4 GAAP Core pre-provision earnings 2020 2021 2022 2023 2024 2025 1Q 2026 2Q 2026 3Q 2026 50.0% 55.0% 60.0% 65.0% 70.0% Efficiency Ratio (1) See appendix for reconciliation of Non-GAAP items. (1) | 7
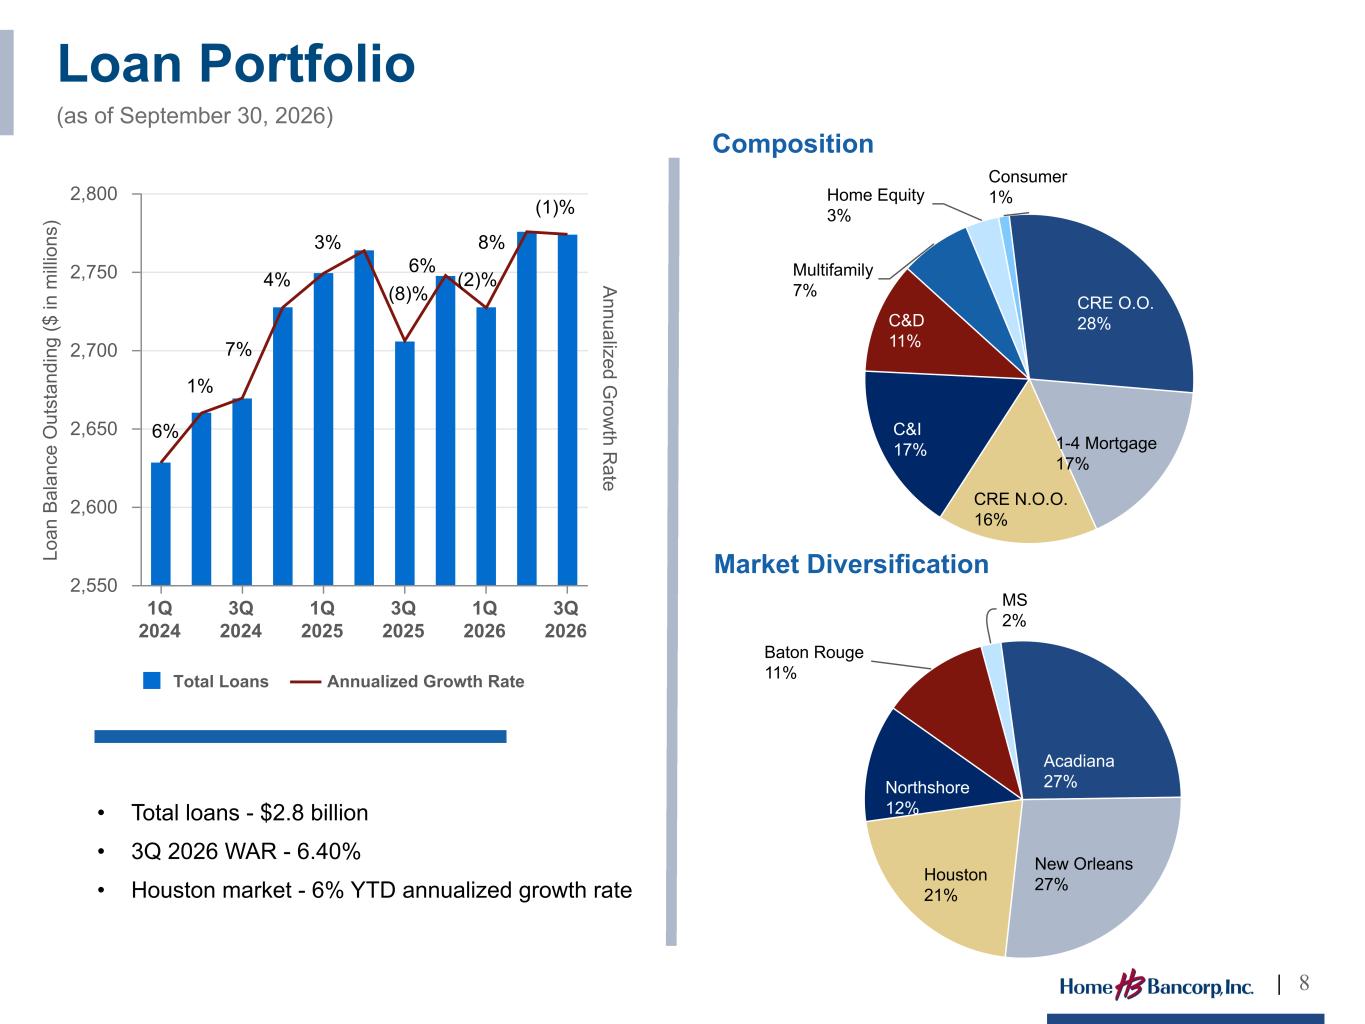
Lo an B al an ce O ut st an di ng ($ in m ill io ns ) A nnualized G row th R ate Total Loans Annualized Growth Rate 1Q 2024 3Q 2024 1Q 2025 3Q 2025 1Q 2026 3Q 2026 2,550 2,600 2,650 2,700 2,750 2,800 Loan Portfolio (as of September 30, 2026) CRE O.O. 28% 1-4 Mortgage 17% CRE N.O.O. 16% C&I 17% C&D 11% Multifamily 7% Home Equity 3% Consumer 1% Composition Market Diversification Acadiana 27% New Orleans 27%Houston 21% Northshore 12% Baton Rouge 11% MS 2% • Total loans - $2.8 billion • 3Q 2026 WAR - 6.40% • Houston market - 6% YTD annualized growth rate • YTD 2026 annualized growth rate - 2% • Houston market - 6% annualized growth rate YTD | 8 (1)% 4% 3% (8)% 6% 7% 1% 6% (2)% 8%
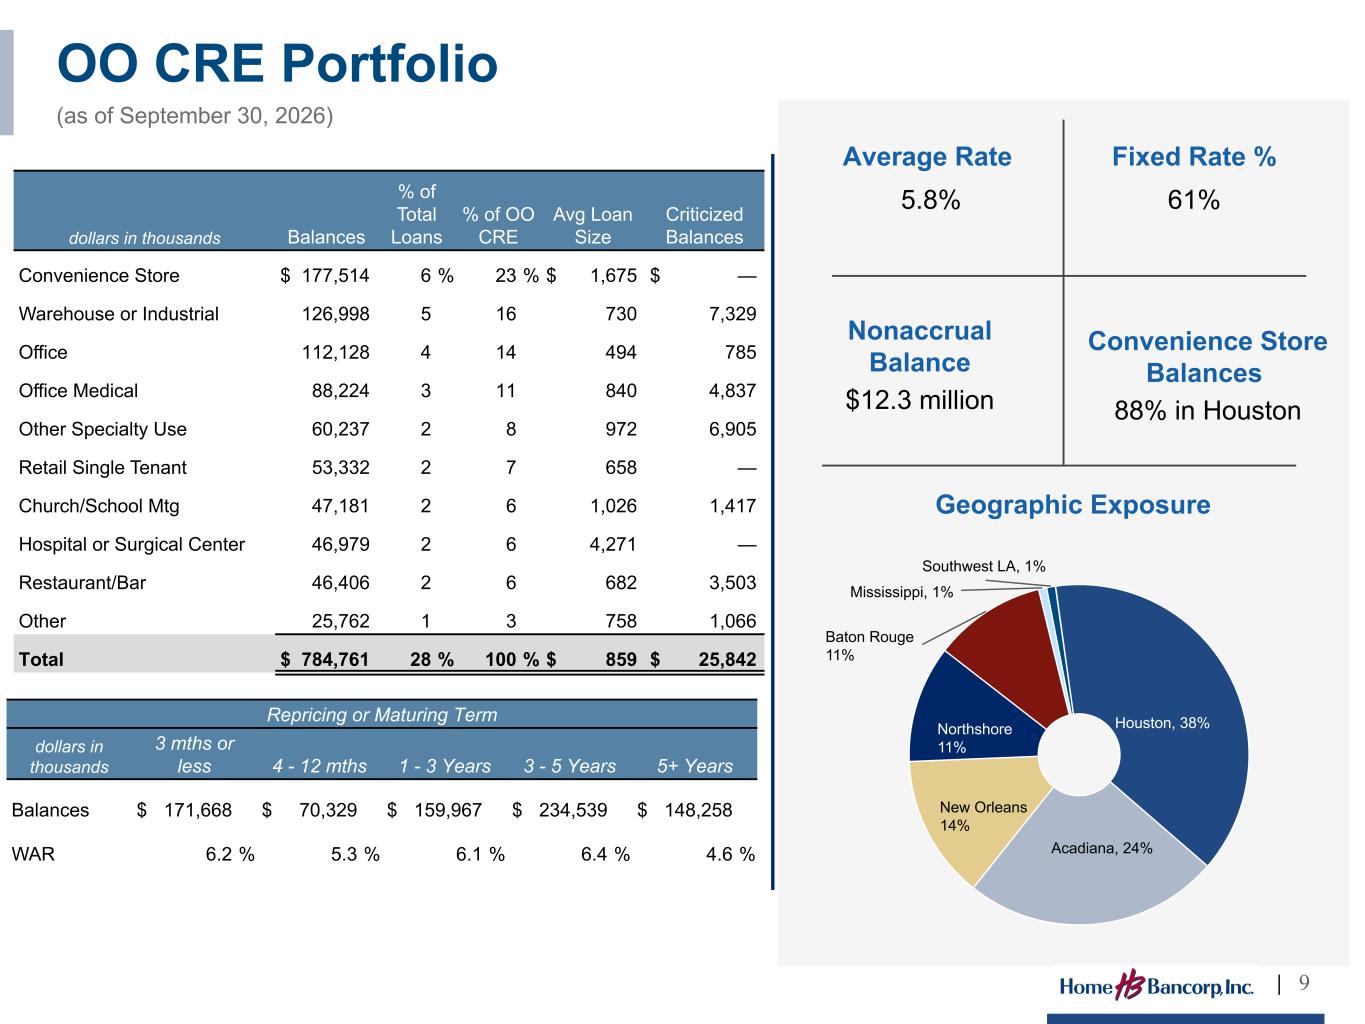
OO CRE Portfolio (as of September 30, 2026) Geographic Exposure | 9 dollars in thousands Balances % of Total Loans % of OO CRE Avg Loan Size Criticized Balances Convenience Store $ 177,514 6 % 23 % $ 1,675 $ — Warehouse or Industrial 126,998 5 16 730 7,329 Office 112,128 4 14 494 785 Office Medical 88,224 3 11 840 4,837 Other Specialty Use 60,237 2 8 972 6,905 Retail Single Tenant 53,332 2 7 658 — Church/School Mtg 47,181 2 6 1,026 1,417 Hospital or Surgical Center 46,979 2 6 4,271 — Restaurant/Bar 46,406 2 6 682 3,503 Other 25,762 1 3 758 1,066 Total $ 784,761 28 % 100 % $ 859 $ 25,842 Repricing or Maturing Term dollars in thousands 3 mths or less 4 - 12 mths 1 - 3 Years 3 - 5 Years 5+ Years Balances $ 171,668 $ 70,329 $ 159,967 $ 234,539 $ 148,258 WAR 6.2 % 5.3 % 6.1 % 6.4 % 4.6 % Average Rate 5.8% Fixed Rate % 61% Convenience Store Balances 88% in Houston Nonaccrual Balance $12.3 million Houston, 38% Acadiana, 24% New Orleans 14% Northshore 11% Baton Rouge 11% Mississippi, 1% Southwest LA, 1%
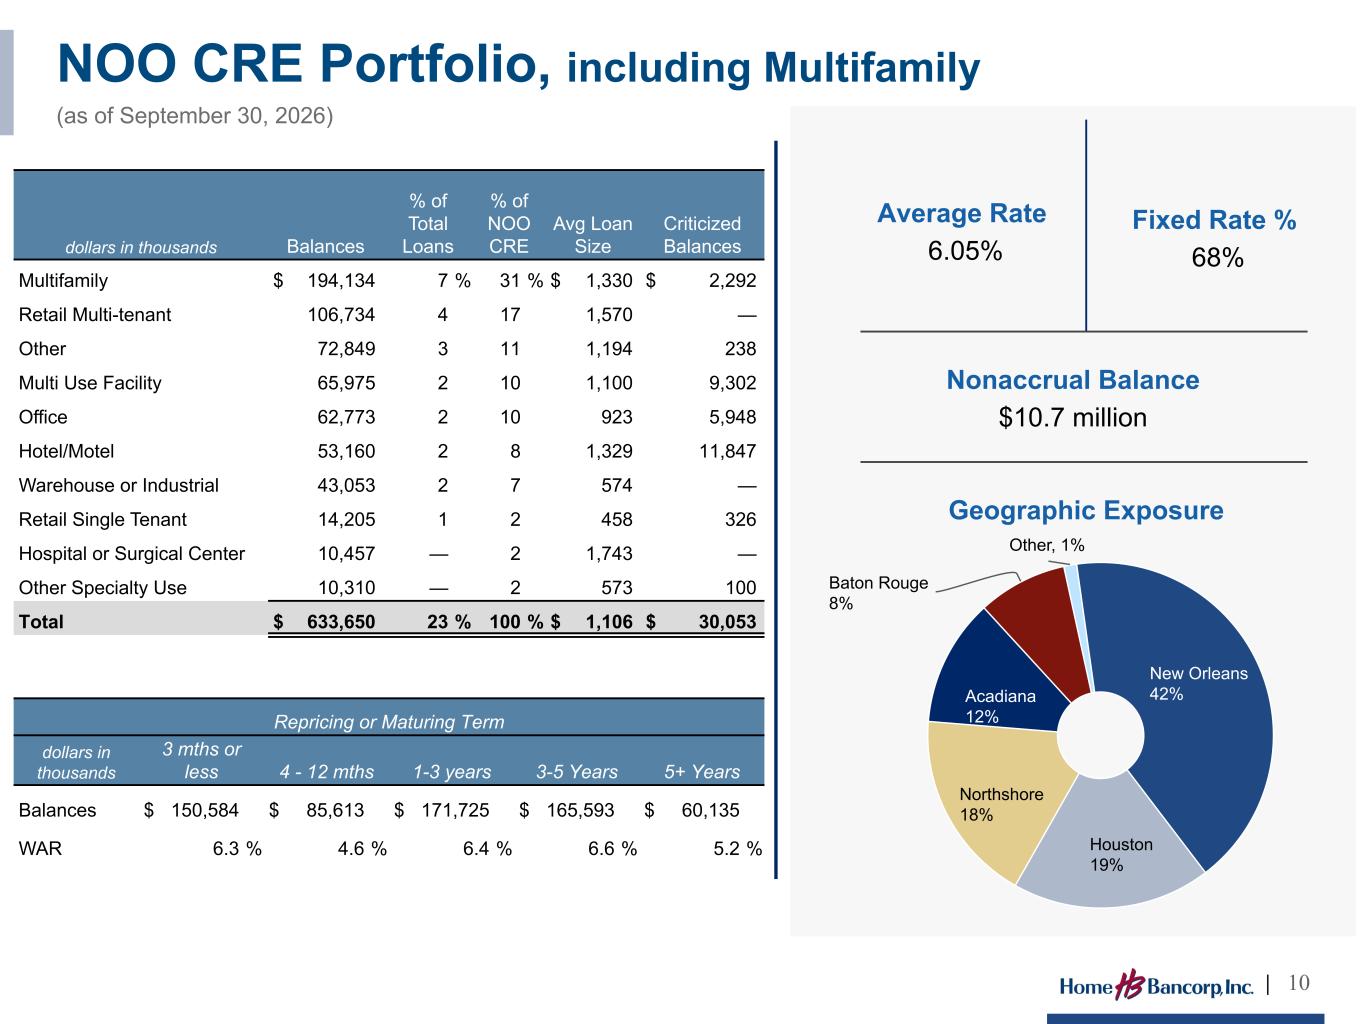
NOO CRE Portfolio, including Multifamily (as of September 30, 2026) Geographic Exposure New Orleans 42% Houston 19% Northshore 18% Acadiana 12% Baton Rouge 8% Other, 1% | 10 dollars in thousands Balances % of Total Loans % of NOO CRE Avg Loan Size Criticized Balances Multifamily $ 194,134 7 % 31 % $ 1,330 $ 2,292 Retail Multi-tenant 106,734 4 17 1,570 — Other 72,849 3 11 1,194 238 Multi Use Facility 65,975 2 10 1,100 9,302 Office 62,773 2 10 923 5,948 Hotel/Motel 53,160 2 8 1,329 11,847 Warehouse or Industrial 43,053 2 7 574 — Retail Single Tenant 14,205 1 2 458 326 Hospital or Surgical Center 10,457 — 2 1,743 — Other Specialty Use 10,310 — 2 573 100 Total $ 633,650 23 % 100 % $ 1,106 $ 30,053 Repricing or Maturing Term dollars in thousands 3 mths or less 4 - 12 mths 1-3 years 3-5 Years 5+ Years Balances $ 150,584 $ 85,613 $ 171,725 $ 165,593 $ 60,135 WAR 6.3 % 4.6 % 6.4 % 6.6 % 5.2 % Average Rate 6.05% Fixed Rate % 68% Nonaccrual Balance $10.7 million
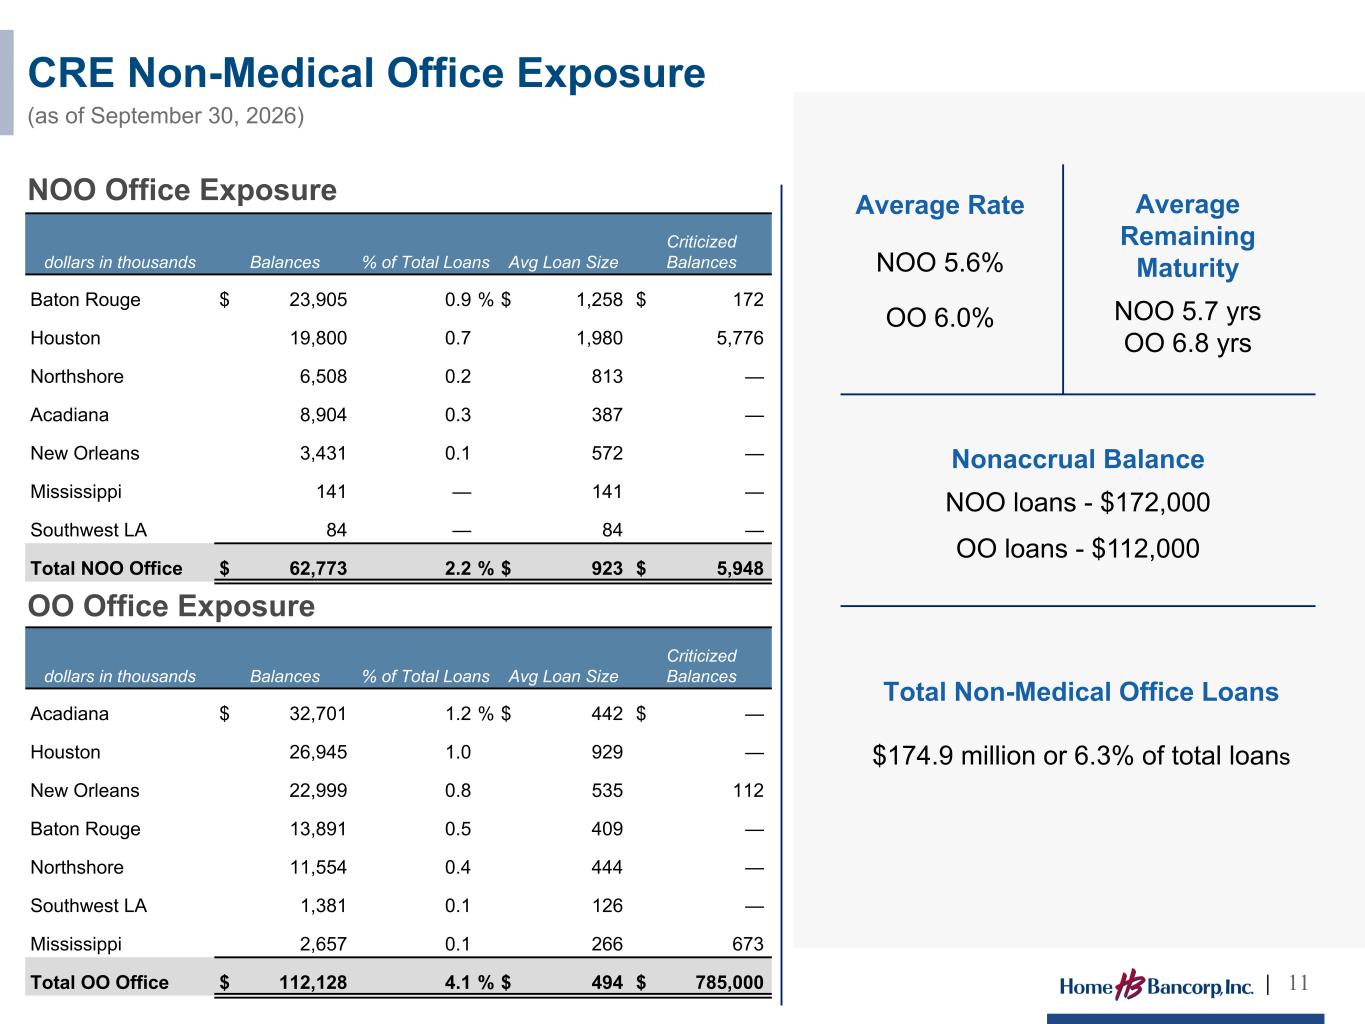
CRE Non-Medical Office Exposure (as of September 30, 2026) | 11 Nonaccrual Balance NOO loans - $172,000 OO loans - $112,000 Total Non-Medical Office Loans $174.9 million or 6.3% of total loans NOO Geographic Exposure Baton Rouge 0.9% Houston 0.7% Norths hore 0.2% Acadiana 0.3% New Orlean s 0.1% dollars in thousands Balances % of Total Loans Avg Loan Size Criticized Balances Baton Rouge $ 23,905 0.9 % $ 1,258 $ 172 Houston 19,800 0.7 1,980 5,776 Northshore 6,508 0.2 813 — Acadiana 8,904 0.3 387 — New Orleans 3,431 0.1 572 — Mississippi 141 — 141 — Southwest LA 84 — 84 — Total NOO Office $ 62,773 2.2 % $ 923 $ 5,948 dollars in thousands Balances % of Total Loans Avg Loan Size Criticized Balances Acadiana $ 32,701 1.2 % $ 442 $ — Houston 26,945 1.0 929 — New Orleans 22,999 0.8 535 112 Baton Rouge 13,891 0.5 409 — Northshore 11,554 0.4 444 — Southwest LA 1,381 0.1 126 — Mississippi 2,657 0.1 266 673 Total OO Office $ 112,128 4.1 % $ 494 $ 785,000 OO Office Exposure NOO Office Exposure Average Remaining Maturity NOO 5.7 yrs OO 6.8 yrs Average Rate NOO 5.6% OO 6.0%
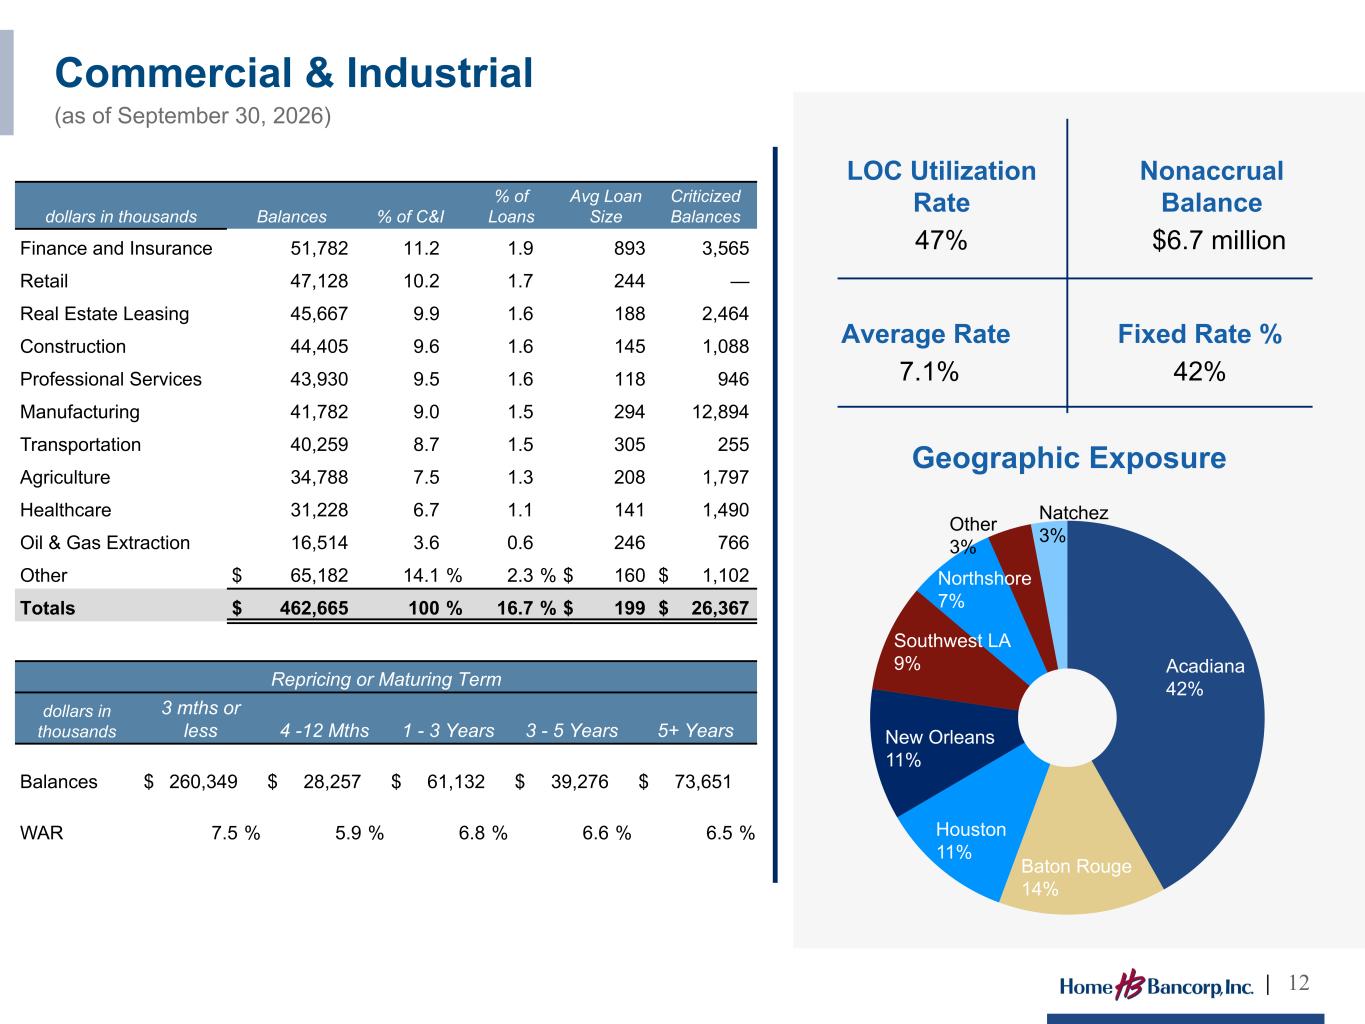
Commercial & Industrial (as of September 30, 2026) | 12 Nonaccrual Balance $6.7 million LOC Utilization Rate 47% Average Rate 7.1% Geographic Exposure Acadiana 42% Baton Rouge 14% Houston 11% New Orleans 11% Southwest LA 9% Northshore 7% Other 3% Natchez 3% dollars in thousands Balances % of C&I % of Loans Avg Loan Size Criticized Balances Finance and Insurance 51,782 11.2 1.9 893 3,565 Retail 47,128 10.2 1.7 244 — Real Estate Leasing 45,667 9.9 1.6 188 2,464 Construction 44,405 9.6 1.6 145 1,088 Professional Services 43,930 9.5 1.6 118 946 Manufacturing 41,782 9.0 1.5 294 12,894 Transportation 40,259 8.7 1.5 305 255 Agriculture 34,788 7.5 1.3 208 1,797 Healthcare 31,228 6.7 1.1 141 1,490 Oil & Gas Extraction 16,514 3.6 0.6 246 766 Other $ 65,182 14.1 % 2.3 % $ 160 $ 1,102 Totals $ 462,665 100 % 16.7 % $ 199 $ 26,367 Repricing or Maturing Term dollars in thousands 3 mths or less 4 -12 Mths 1 - 3 Years 3 - 5 Years 5+ Years Balances $ 260,349 $ 28,257 $ 61,132 $ 39,276 $ 73,651 WAR 7.5 % 5.9 % 6.8 % 6.6 % 6.5 % Fixed Rate % 42%
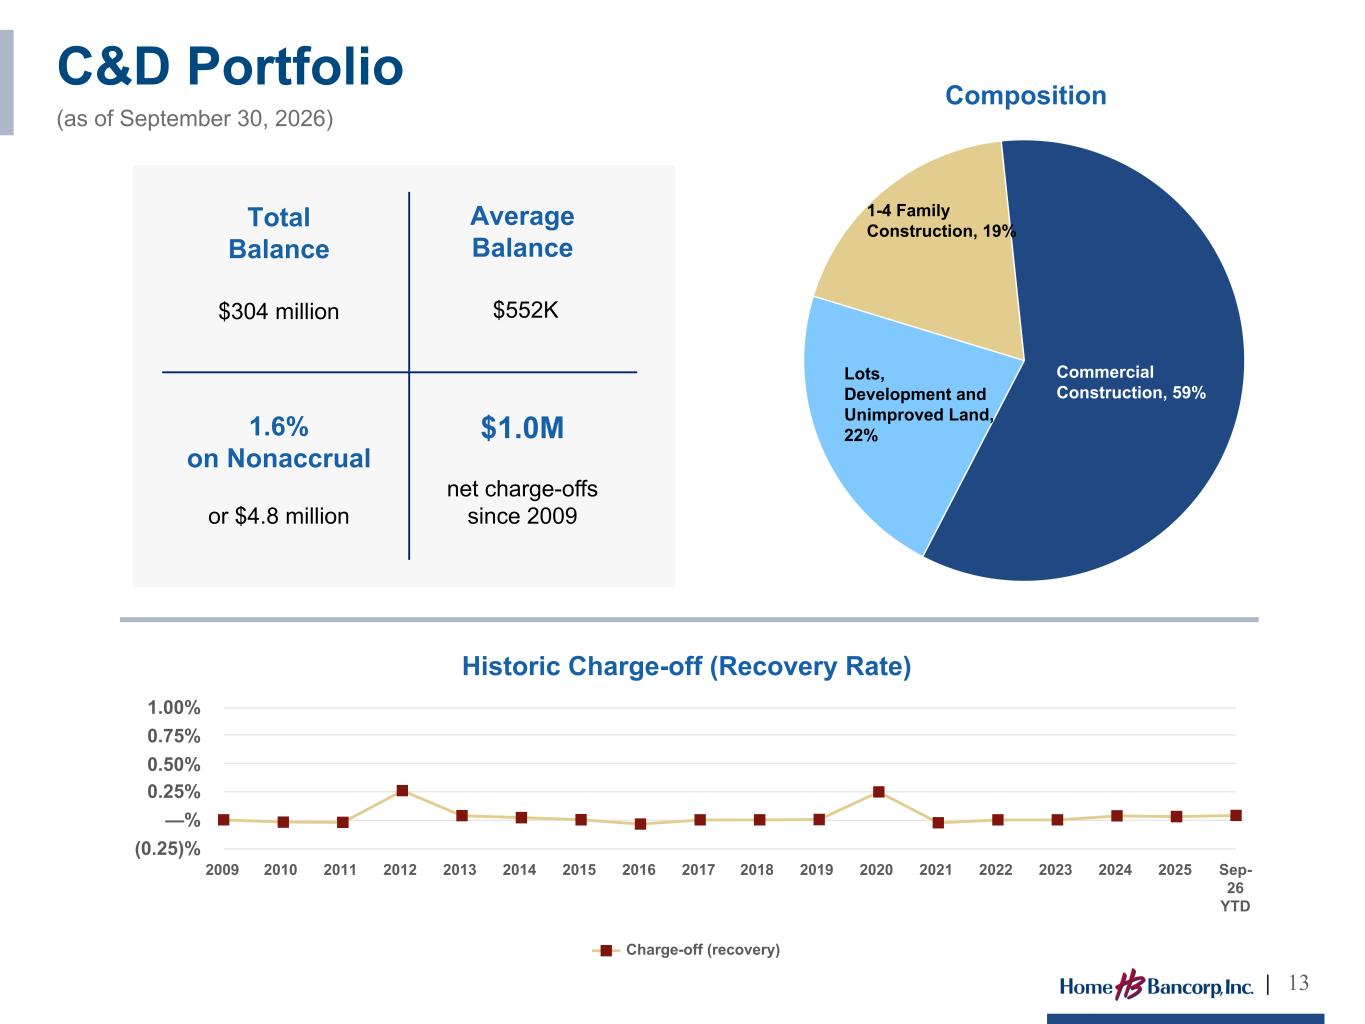
C&D Portfolio (as of September 30, 2026) Commercial Construction, 59% Lots, Development and Unimproved Land, 22% 1-4 Family Construction, 19% Composition | 13 Historic Charge-off (Recovery Rate) Charge-off (recovery) 2009 2010 2011 2012 2013 2014 2015 2016 2017 2018 2019 2020 2021 2022 2023 2024 2025 Sep- 26 YTD (0.25)% —% 0.25% 0.50% 0.75% 1.00% Total Balance $304 million Average Balance $552K $1.0M net charge-offs since 2009 1.6% on Nonaccrual or $4.8 million
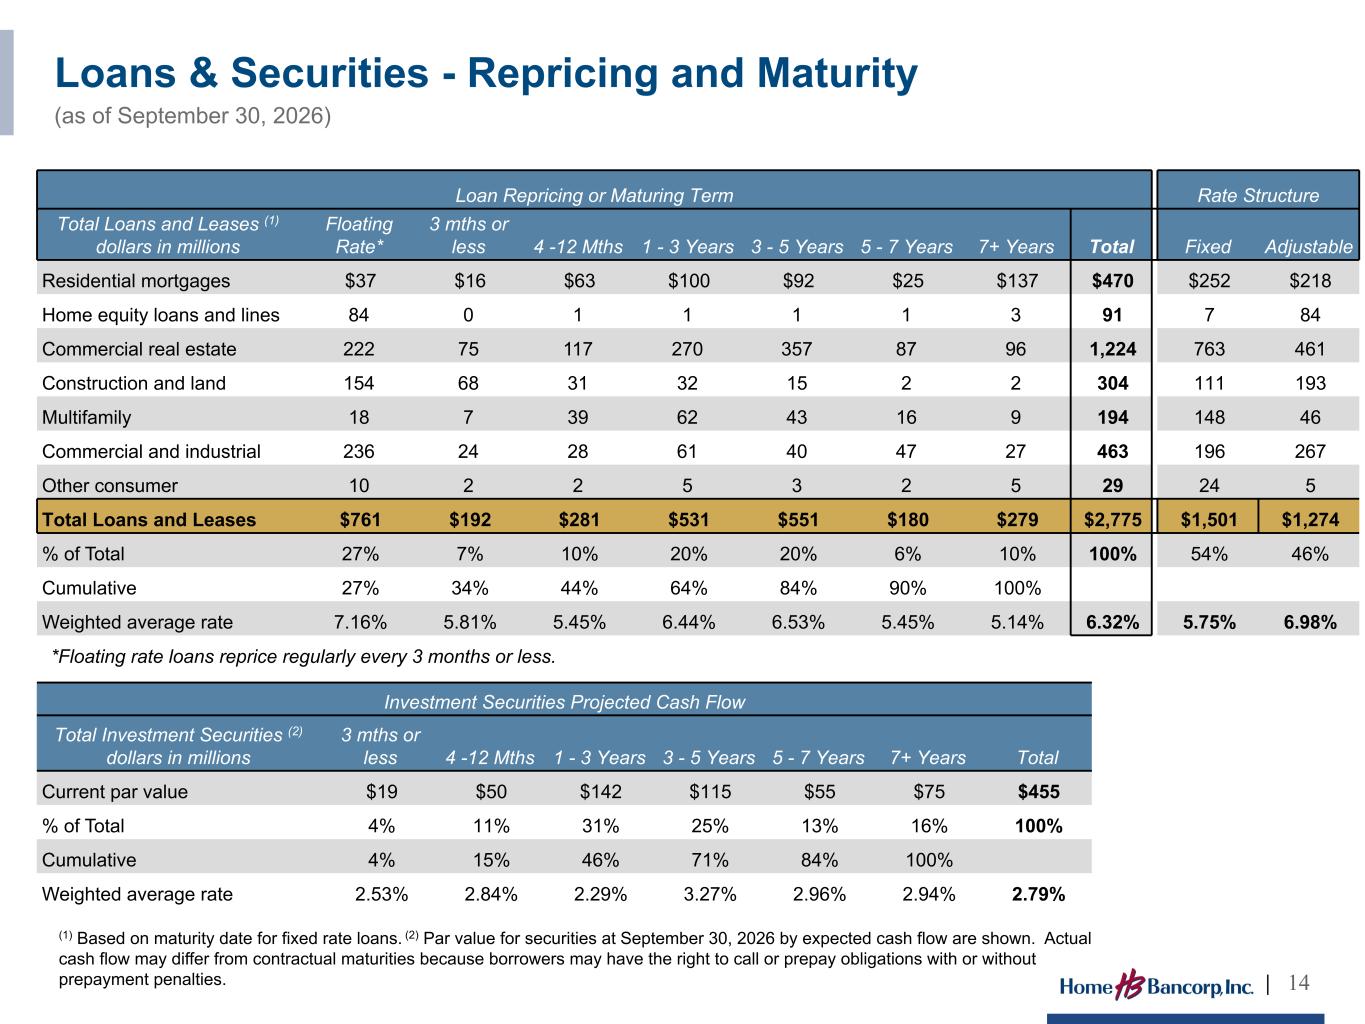
Loans & Securities - Repricing and Maturity (as of September 30, 2026) | 14 Loan Repricing or Maturing Term Rate Structure Total Loans and Leases (1) dollars in millions Floating Rate* 3 mths or less 4 -12 Mths 1 - 3 Years 3 - 5 Years 5 - 7 Years 7+ Years Total Fixed Adjustable Residential mortgages $37 $16 $63 $100 $92 $25 $137 $470 $252 $218 Home equity loans and lines 84 0 1 1 1 1 3 91 7 84 Commercial real estate 222 75 117 270 357 87 96 1,224 763 461 Construction and land 154 68 31 32 15 2 2 304 111 193 Multifamily 18 7 39 62 43 16 9 194 148 46 Commercial and industrial 236 24 28 61 40 47 27 463 196 267 Other consumer 10 2 2 5 3 2 5 29 24 5 Total Loans and Leases $761 $192 $281 $531 $551 $180 $279 $2,775 $1,501 $1,274 % of Total 27% 7% 10% 20% 20% 6% 10% 100% 54% 46% Cumulative 27% 34% 44% 64% 84% 90% 100% Weighted average rate 7.16% 5.81% 5.45% 6.44% 6.53% 5.45% 5.14% 6.32% 5.75% 6.98% Investment Securities Projected Cash Flow Total Investment Securities (2) dollars in millions 3 mths or less 4 -12 Mths 1 - 3 Years 3 - 5 Years 5 - 7 Years 7+ Years Total Current par value $19 $50 $142 $115 $55 $75 $455 % of Total 4% 11% 31% 25% 13% 16% 100% Cumulative 4% 15% 46% 71% 84% 100% Weighted average rate 2.53% 2.84% 2.29% 3.27% 2.96% 2.94% 2.79% (1) Based on maturity date for fixed rate loans. (2) Par value for securities at September 30, 2026 by expected cash flow are shown. Actual cash flow may differ from contractual maturities because borrowers may have the right to call or prepay obligations with or without prepayment penalties. *Floating rate loans reprice regularly every 3 months or less.
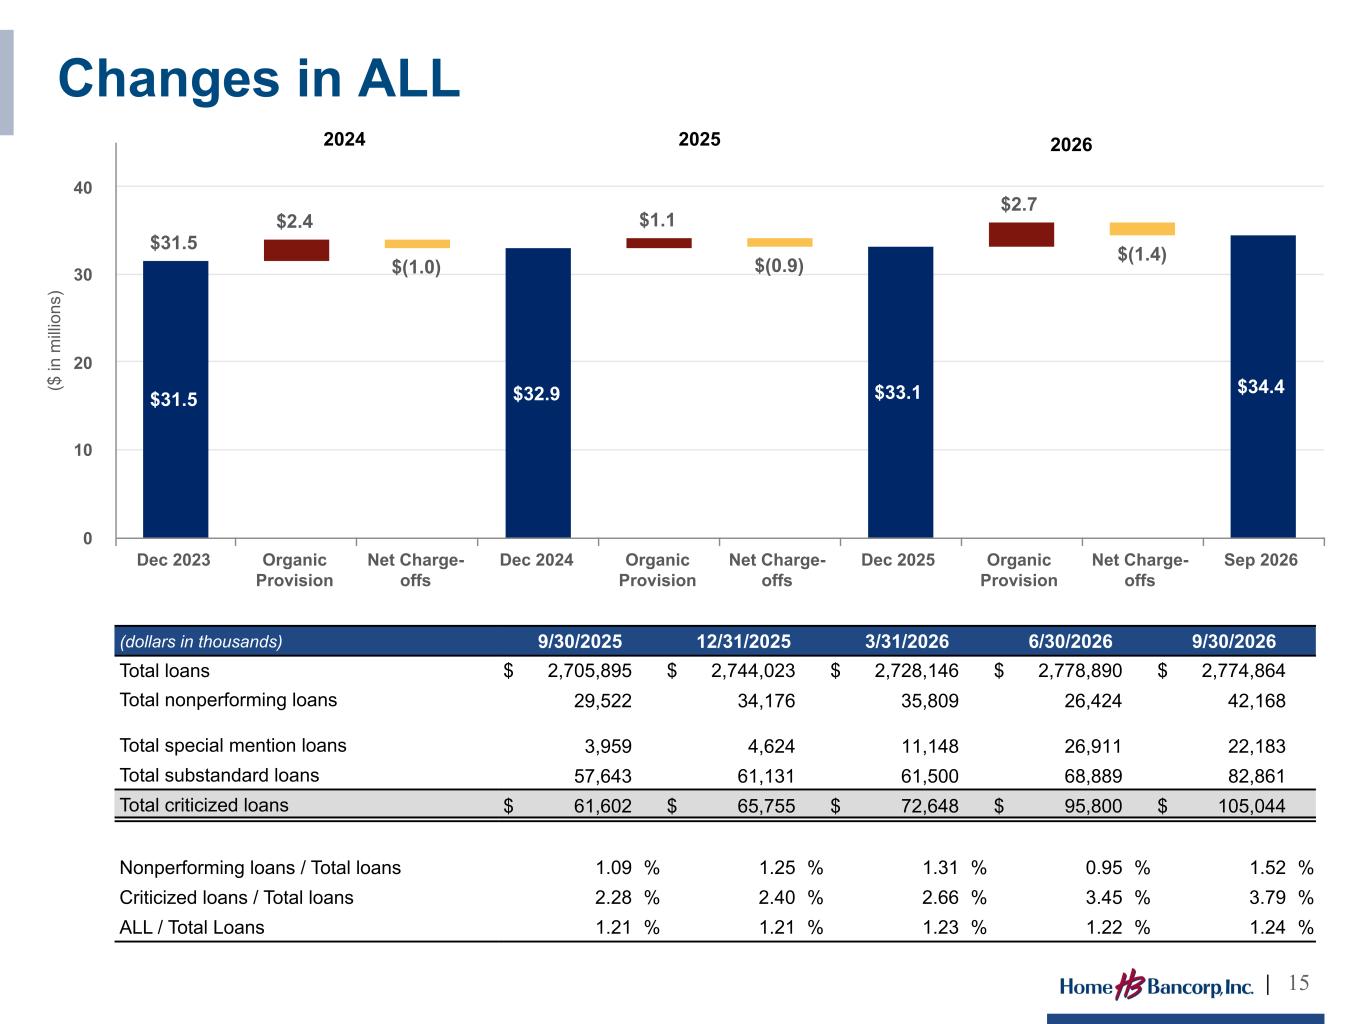
($ in m illi on s) $31.5 $2.4 $(1.0) $1.1 $(0.9) $2.7 $(1.4) $31.5 $32.9 $33.1 $34.4 Dec 2023 Organic Provision Net Charge- offs Dec 2024 Organic Provision Net Charge- offs Dec 2025 Organic Provision Net Charge- offs Sep 2026 0 10 20 30 40 2025 (dollars in thousands) 9/30/2025 12/31/2025 3/31/2026 6/30/2026 9/30/2026 Total loans $ 2,705,895 $ 2,744,023 $ 2,728,146 $ 2,778,890 $ 2,774,864 Total nonperforming loans 29,522 34,176 35,809 26,424 42,168 Total special mention loans 3,959 4,624 11,148 26,911 22,183 Total substandard loans 57,643 61,131 61,500 68,889 82,861 Total criticized loans $ 61,602 $ 65,755 $ 72,648 $ 95,800 $ 105,044 Nonperforming loans / Total loans 1.09 % 1.25 % 1.31 % 0.95 % 1.52 % Criticized loans / Total loans 2.28 % 2.40 % 2.66 % 3.45 % 3.79 % ALL / Total Loans 1.21 % 1.21 % 1.23 % 1.22 % 1.24 % 20262021 Changes in ALL | 15 2024
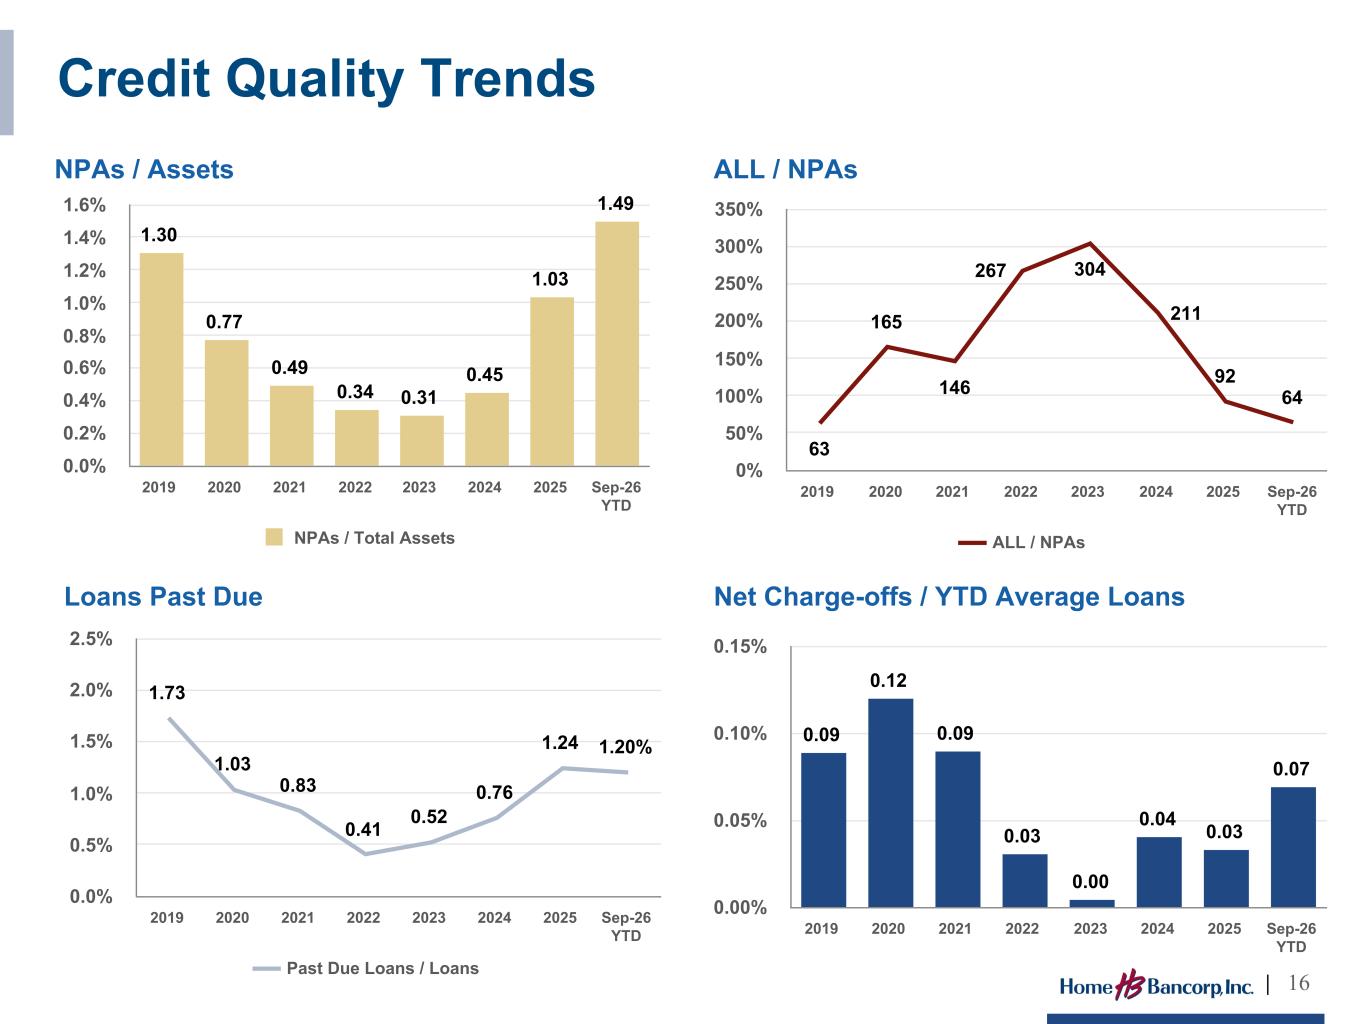
1.30 0.77 0.49 0.34 0.31 0.45 1.03 1.49 NPAs / Total Assets 2019 2020 2021 2022 2023 2024 2025 Sep-26 YTD 0.0% 0.2% 0.4% 0.6% 0.8% 1.0% 1.2% 1.4% 1.6% NPAs / Assets title 0.09 0.12 0.09 0.03 0.00 0.04 0.03 0.07 2019 2020 2021 2022 2023 2024 2025 Sep-26 YTD 0.00% 0.05% 0.10% 0.15% Net Charge-offs / YTD Average Loans 63 165 146 267 304 211 92 64 ALL / NPAs 2019 2020 2021 2022 2023 2024 2025 Sep-26 YTD 0% 50% 100% 150% 200% 250% 300% 350% ALL / NPAs 1.73 1.03 0.83 0.41 0.52 0.76 1.24 1.20% Past Due Loans / Loans 2019 2020 2021 2022 2023 2024 2025 Sep-26 YTD 0.0% 0.5% 1.0% 1.5% 2.0% 2.5% Loans Past Due Credit Quality Trends | 16
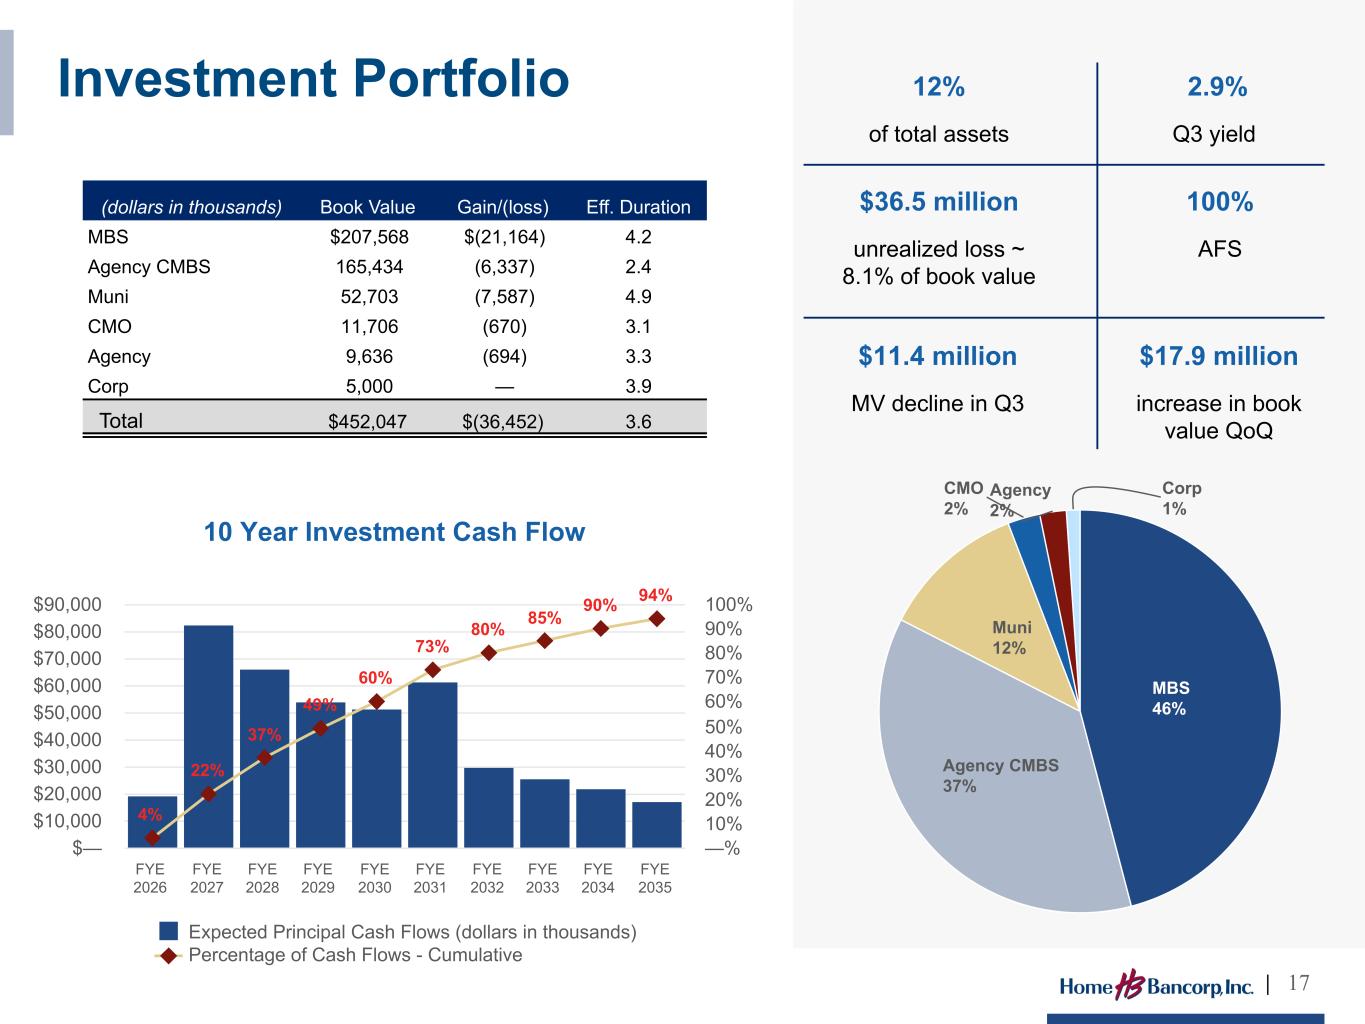
Investment Portfolio | 17 (dollars in thousands) Book Value Gain/(loss) Eff. Duration MBS $207,568 $(21,164) 4.2 Agency CMBS 165,434 (6,337) 2.4 Muni 52,703 (7,587) 4.9 CMO 11,706 (670) 3.1 Agency 9,636 (694) 3.3 Corp 5,000 — 3.9 Total $452,047 $(36,452) 3.6 10 Year Investment Cash Flow 4% 22% 37% 49% 60% 73% 80% 85% 90% 94% Expected Principal Cash Flows (dollars in thousands) Percentage of Cash Flows - Cumulative FYE 2026 FYE 2027 FYE 2028 FYE 2029 FYE 2030 FYE 2031 FYE 2032 FYE 2033 FYE 2034 FYE 2035 $— $10,000 $20,000 $30,000 $40,000 $50,000 $60,000 $70,000 $80,000 $90,000 —% 10% 20% 30% 40% 50% 60% 70% 80% 90% 100% MBS 46% Agency CMBS 37% Muni 12% CMO 2% Agency 2% Corp 1% 12% of total assets 2.9% Q3 yield $36.5 million unrealized loss ~ 8.1% of book value 100% AFS $11.4 million MV decline in Q3 $17.9 million increase in book value QoQ
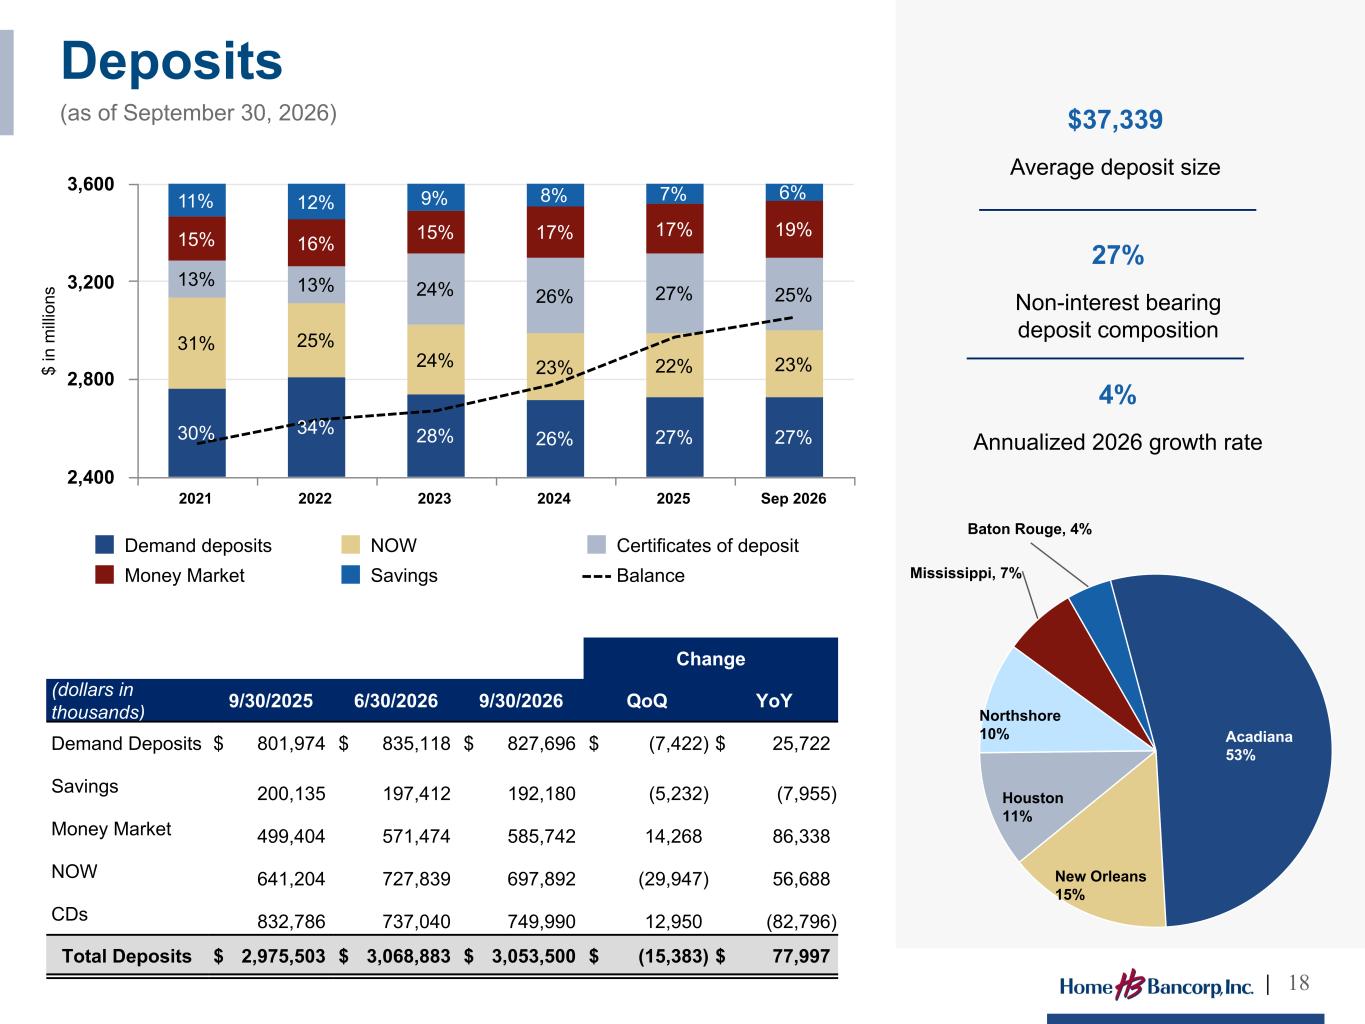
Acadiana 53% New Orleans 15% Houston 11% Northshore 10% Mississippi, 7% Baton Rouge, 4% $ in m illi on s 30% 34% 28% 26% 27% 27% 31% 25% 24% 23% 22% 23% 13% 13% 24% 26% 27% 25% 15% 16% 15% 17% 17% 19% 11% 12% 9% 8% 7% 6% Demand deposits NOW Certificates of deposit Money Market Savings Balance 2021 2022 2023 2024 2025 Sep 2026 2,400 2,800 3,200 3,600 Change (dollars in thousands) 9/30/2025 6/30/2026 9/30/2026 QoQ YoY Demand Deposits $ 801,974 $ 835,118 $ 827,696 $ (7,422) $ 25,722 Savings 200,135 197,412 192,180 (5,232) (7,955) Money Market 499,404 571,474 585,742 14,268 86,338 NOW 641,204 727,839 697,892 (29,947) 56,688 CDs 832,786 737,040 749,990 12,950 (82,796) Total Deposits $ 2,975,503 $ 3,068,883 $ 3,053,500 $ (15,383) $ 77,997 Deposits (as of September 30, 2026) | 18 $37,339 Average deposit size 27% Non-interest bearing deposit composition 4% Annualized 2026 growth rate
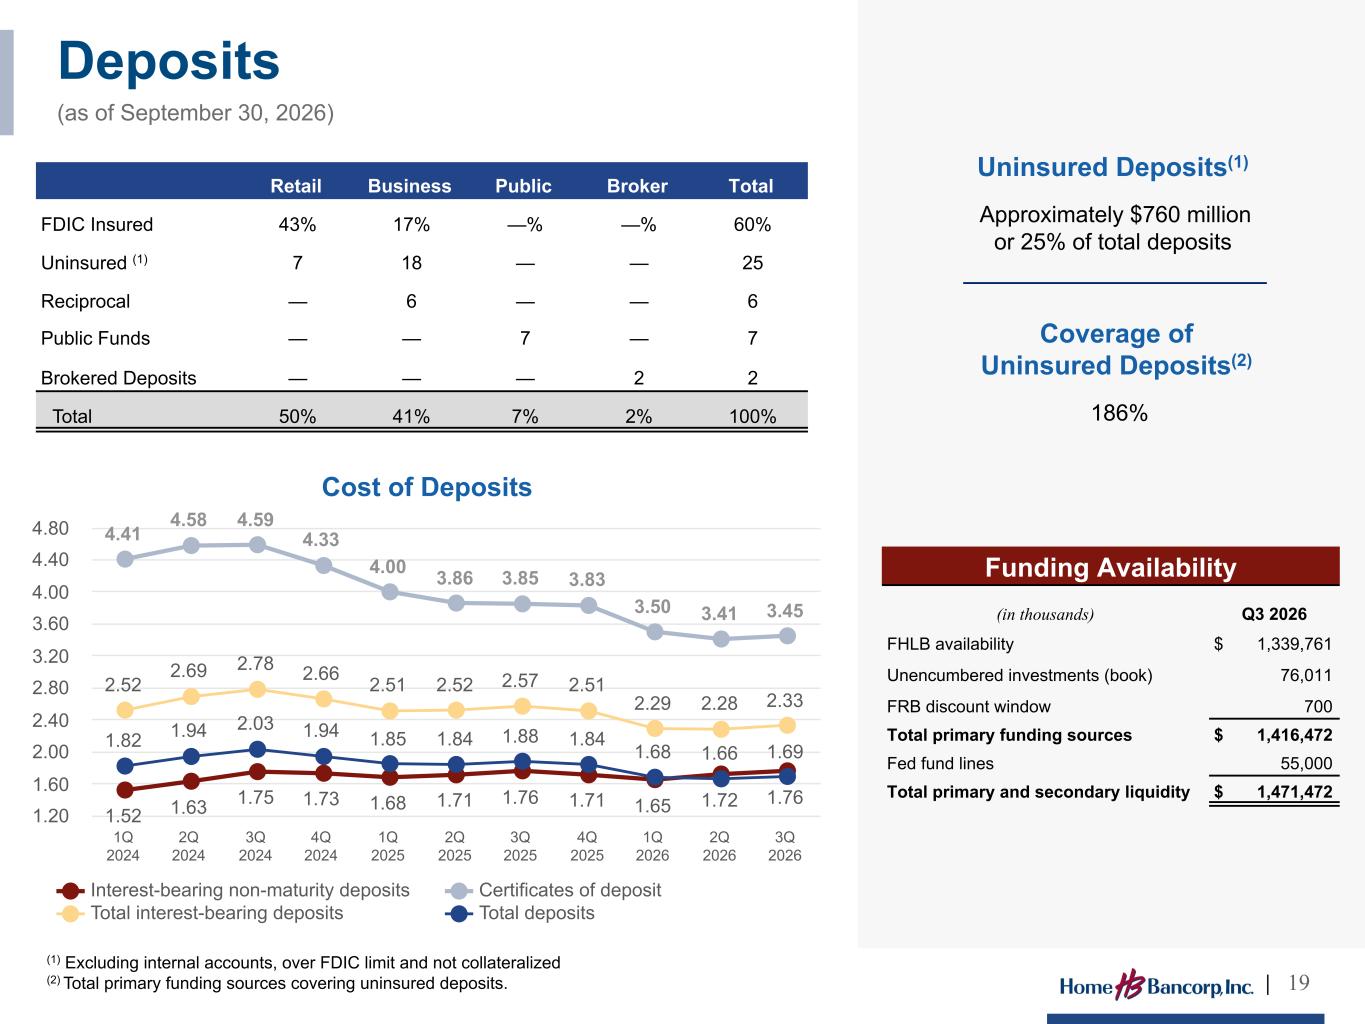
Deposits (as of September 30, 2026) | 19 Retail Business Public Broker Total FDIC Insured 43% 17% —% —% 60% Uninsured (1) 7 18 — — 25 Reciprocal — 6 — — 6 Public Funds — — 7 — 7 Brokered Deposits — — — 2 2 Total 50% 41% 7% 2% 100% Cost of Deposits 1.52 1.63 1.75 1.73 1.68 1.71 1.76 1.71 1.65 1.72 1.76 4.41 4.58 4.59 4.33 4.00 3.86 3.85 3.83 3.50 3.41 3.45 2.52 2.69 2.78 2.66 2.51 2.52 2.57 2.51 2.29 2.28 2.33 1.82 1.94 2.03 1.94 1.85 1.84 1.88 1.84 1.68 1.66 1.69 Interest-bearing non-maturity deposits Certificates of deposit Total interest-bearing deposits Total deposits 1Q 2024 2Q 2024 3Q 2024 4Q 2024 1Q 2025 2Q 2025 3Q 2025 4Q 2025 1Q 2026 2Q 2026 3Q 2026 1.20 1.60 2.00 2.40 2.80 3.20 3.60 4.00 4.40 4.80 (1) Excluding internal accounts, over FDIC limit and not collateralized (2) Total primary funding sources covering uninsured deposits. Funding Availability (in thousands) Q3 2026 FHLB availability $ 1,339,761 Unencumbered investments (book) 76,011 FRB discount window 700 Total primary funding sources $ 1,416,472 Fed fund lines 55,000 Total primary and secondary liquidity $ 1,471,472 Uninsured Deposits(1) Approximately $760 million or 25% of total deposits Coverage of Uninsured Deposits(2) 186%
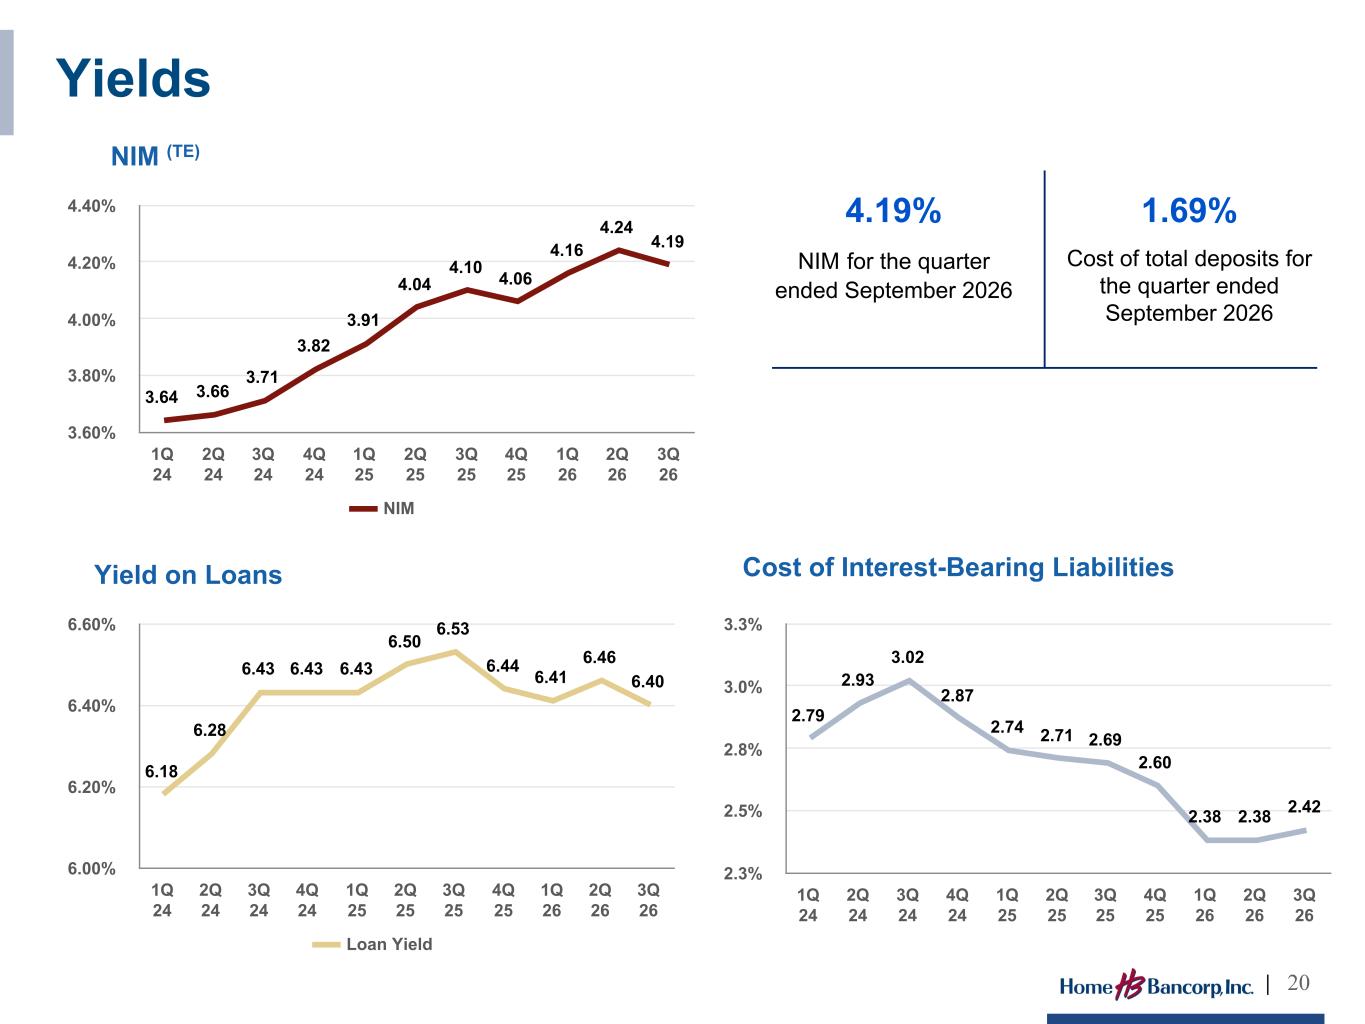
3.64 3.66 3.71 3.82 3.91 4.04 4.10 4.06 4.16 4.24 4.19 NIM 1Q 24 2Q 24 3Q 24 4Q 24 1Q 25 2Q 25 3Q 25 4Q 25 1Q 26 2Q 26 3Q 26 3.60% 3.80% 4.00% 4.20% 4.40% NIM (TE) 6.18 6.28 6.43 6.43 6.43 6.50 6.53 6.44 6.41 6.46 6.40 Loan Yield 1Q 24 2Q 24 3Q 24 4Q 24 1Q 25 2Q 25 3Q 25 4Q 25 1Q 26 2Q 26 3Q 26 6.00% 6.20% 6.40% 6.60% Yield on Loans 2.79 2.93 3.02 2.87 2.74 2.71 2.69 2.60 2.38 2.38 2.42 1Q 24 2Q 24 3Q 24 4Q 24 1Q 25 2Q 25 3Q 25 4Q 25 1Q 26 2Q 26 3Q 26 2.3% 2.5% 2.8% 3.0% 3.3% Cost of Interest-Bearing Liabilities Yields | 20 4.19% NIM for the quarter ended September 2026 1.69% Cost of total deposits for the quarter ended September 2026 Month Total borrowings increased $56,000 for the quarter ended September 2026
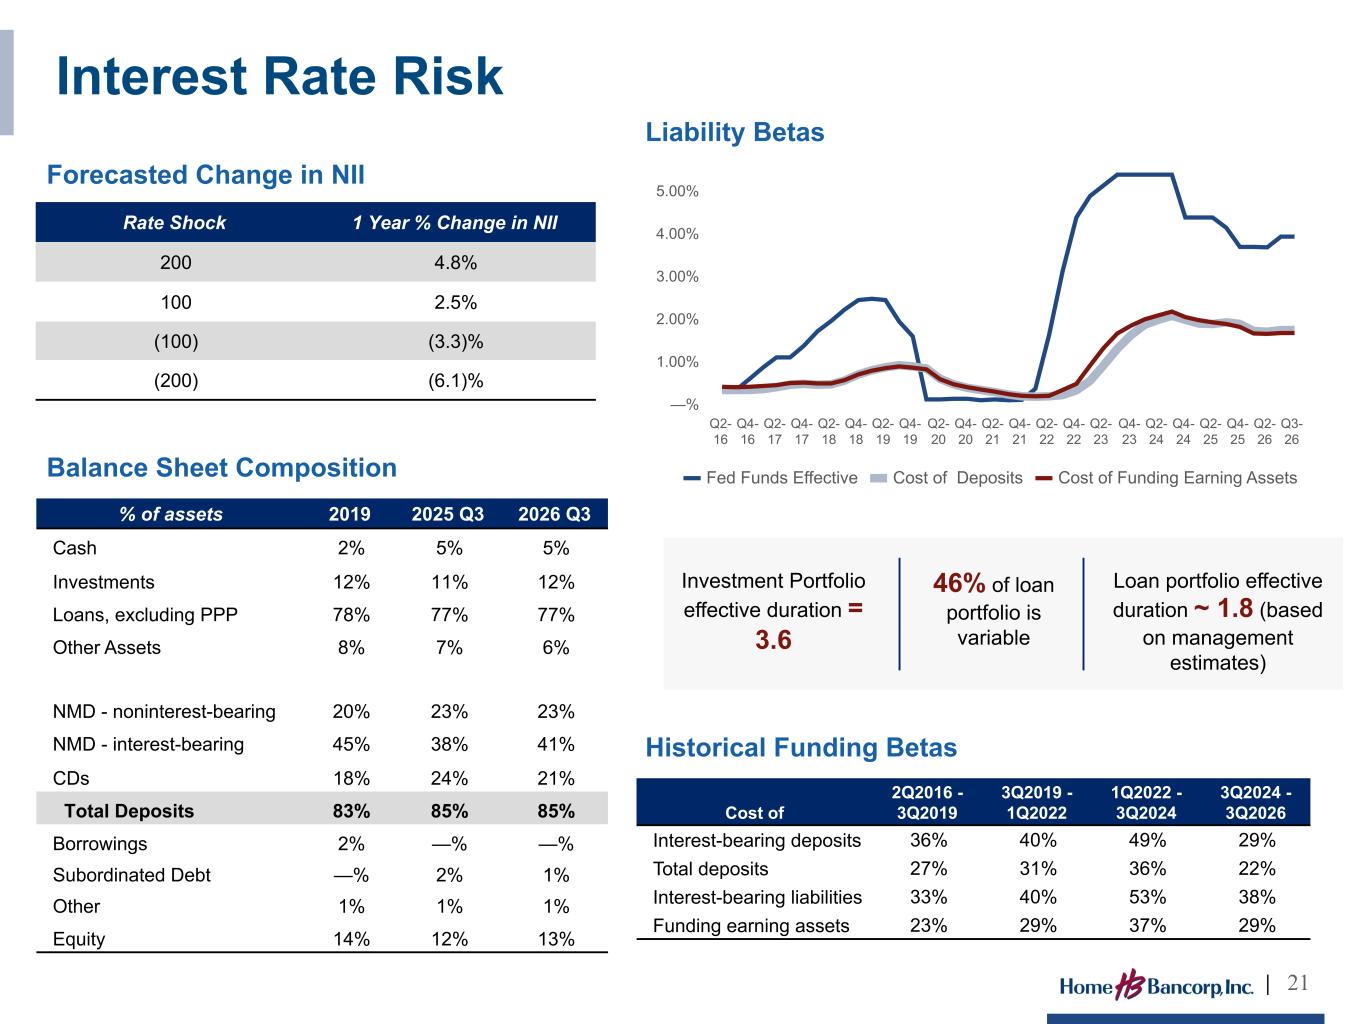
Rate Shock 1 Year % Change in NII 200 4.8% 100 2.5% (100) (3.3)% (200) (6.1)% % of assets 2019 2025 Q3 2026 Q3 Cash 2% 5% 5% Investments 12% 11% 12% Loans, excluding PPP 78% 77% 77% Other Assets 8% 7% 6% NMD - noninterest-bearing 20% 23% 23% NMD - interest-bearing 45% 38% 41% CDs 18% 24% 21% Total Deposits 83% 85% 85% Borrowings 2% —% —% Subordinated Debt —% 2% 1% Other 1% 1% 1% Equity 14% 12% 13% Loan portfolio effective duration ~ 1.8 (based on management estimates) Cost of 2Q2016 - 3Q2019 3Q2019 - 1Q2022 1Q2022 - 3Q2024 3Q2024 - 3Q2026 Interest-bearing deposits 36% 40% 49% 29% Total deposits 27% 31% 36% 22% Interest-bearing liabilities 33% 40% 53% 38% Funding earning assets 23% 29% 37% 29% Interest Rate Risk Forecasted Change in NII Liability Betas Historical Funding Betas Balance Sheet Composition | 21 Fed Funds Effective Cost of Deposits Cost of Funding Earning Assets Q2- 16 Q4- 16 Q2- 17 Q4- 17 Q2- 18 Q4- 18 Q2- 19 Q4- 19 Q2- 20 Q4- 20 Q2- 21 Q4- 21 Q2- 22 Q4- 22 Q2- 23 Q4- 23 Q2- 24 Q4- 24 Q2- 25 Q4- 25 Q2- 26 Q3- 26 —% 1.00% 2.00% 3.00% 4.00% 5.00% Investment Portfolio effective duration = 3.6 46% of loan portfolio is variable
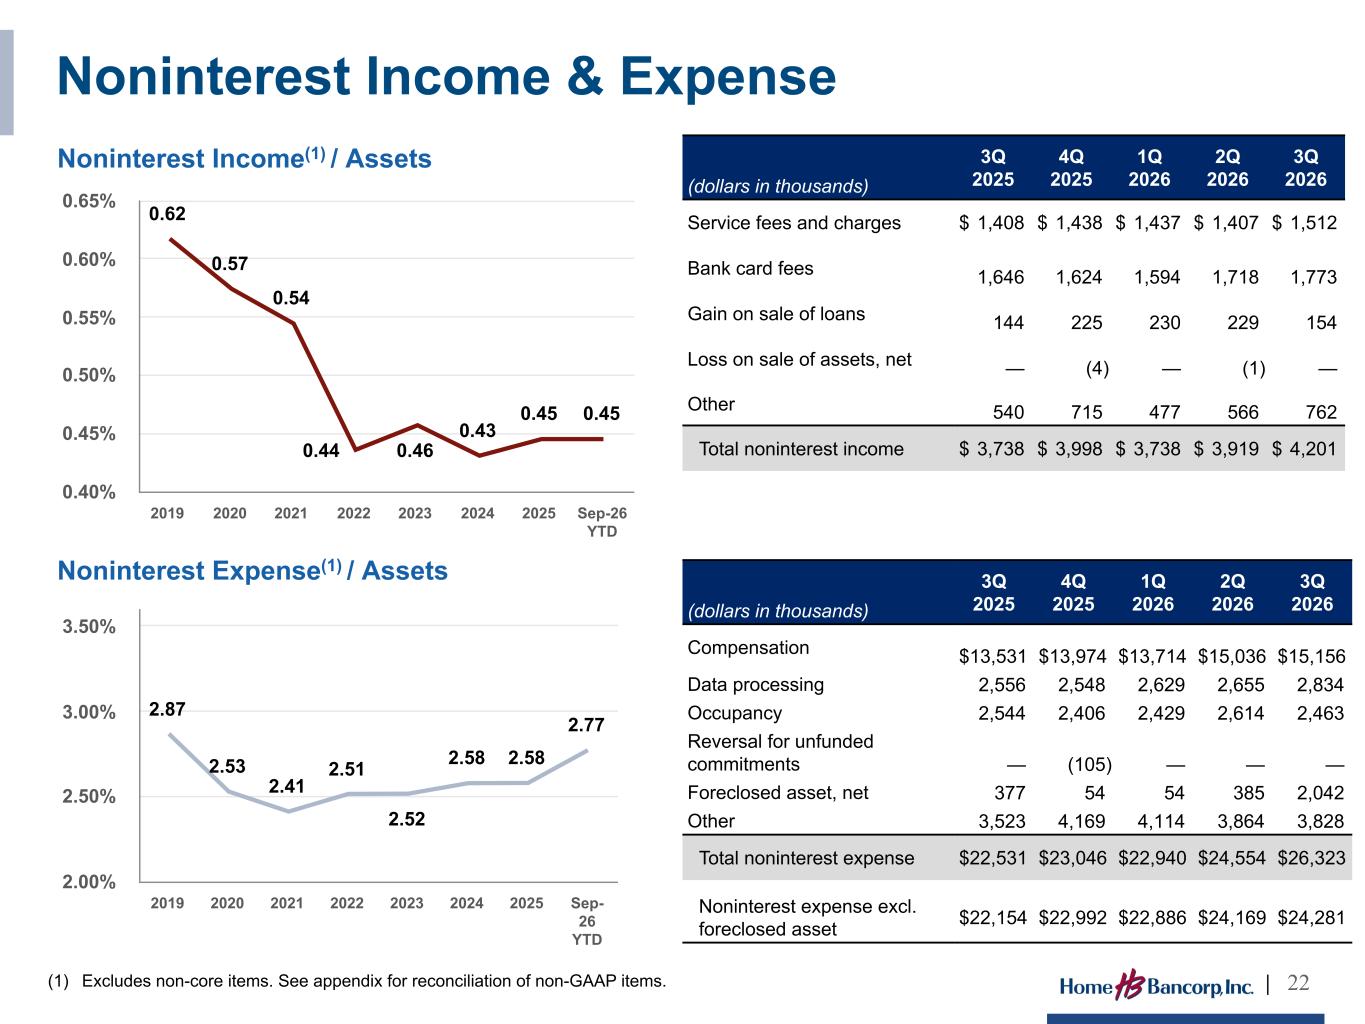
0.62 0.57 0.54 0.44 0.46 0.43 0.45 0.45 2019 2020 2021 2022 2023 2024 2025 Sep-26 YTD 0.40% 0.45% 0.50% 0.55% 0.60% 0.65% Noninterest Income(1) / Assets 2.87 2.53 2.41 2.51 2.52 2.58 2.58 2.77 2019 2020 2021 2022 2023 2024 2025 Sep- 26 YTD 2.00% 2.50% 3.00% 3.50% Noninterest Expense(1) / Assets (1) Excludes non-core items. See appendix for reconciliation of non-GAAP items. (dollars in thousands) 3Q 2025 4Q 2025 1Q 2026 2Q 2026 3Q 2026 Service fees and charges $ 1,408 $ 1,438 $ 1,437 $ 1,407 $ 1,512 Bank card fees 1,646 1,624 1,594 1,718 1,773 Gain on sale of loans 144 225 230 229 154 Loss on sale of assets, net — (4) — (1) — Other 540 715 477 566 762 Total noninterest income $ 3,738 $ 3,998 $ 3,738 $ 3,919 $ 4,201 (dollars in thousands) 3Q 2025 4Q 2025 1Q 2026 2Q 2026 3Q 2026 Compensation $ 13,531 $ 13,974 $ 13,714 $ 15,036 $ 15,156 Data processing 2,556 2,548 2,629 2,655 2,834 Occupancy 2,544 2,406 2,429 2,614 2,463 Reversal for unfunded commitments — (105) — — — Foreclosed asset, net 377 54 54 385 2,042 Other 3,523 4,169 4,114 3,864 3,828 Total noninterest expense $ 22,531 $ 23,046 $ 22,940 $ 24,554 $ 26,323 Noninterest expense excl. foreclosed asset $ 22,154 $ 22,992 $ 22,886 $ 24,169 $ 24,281 Noninterest Income & Expense | 22
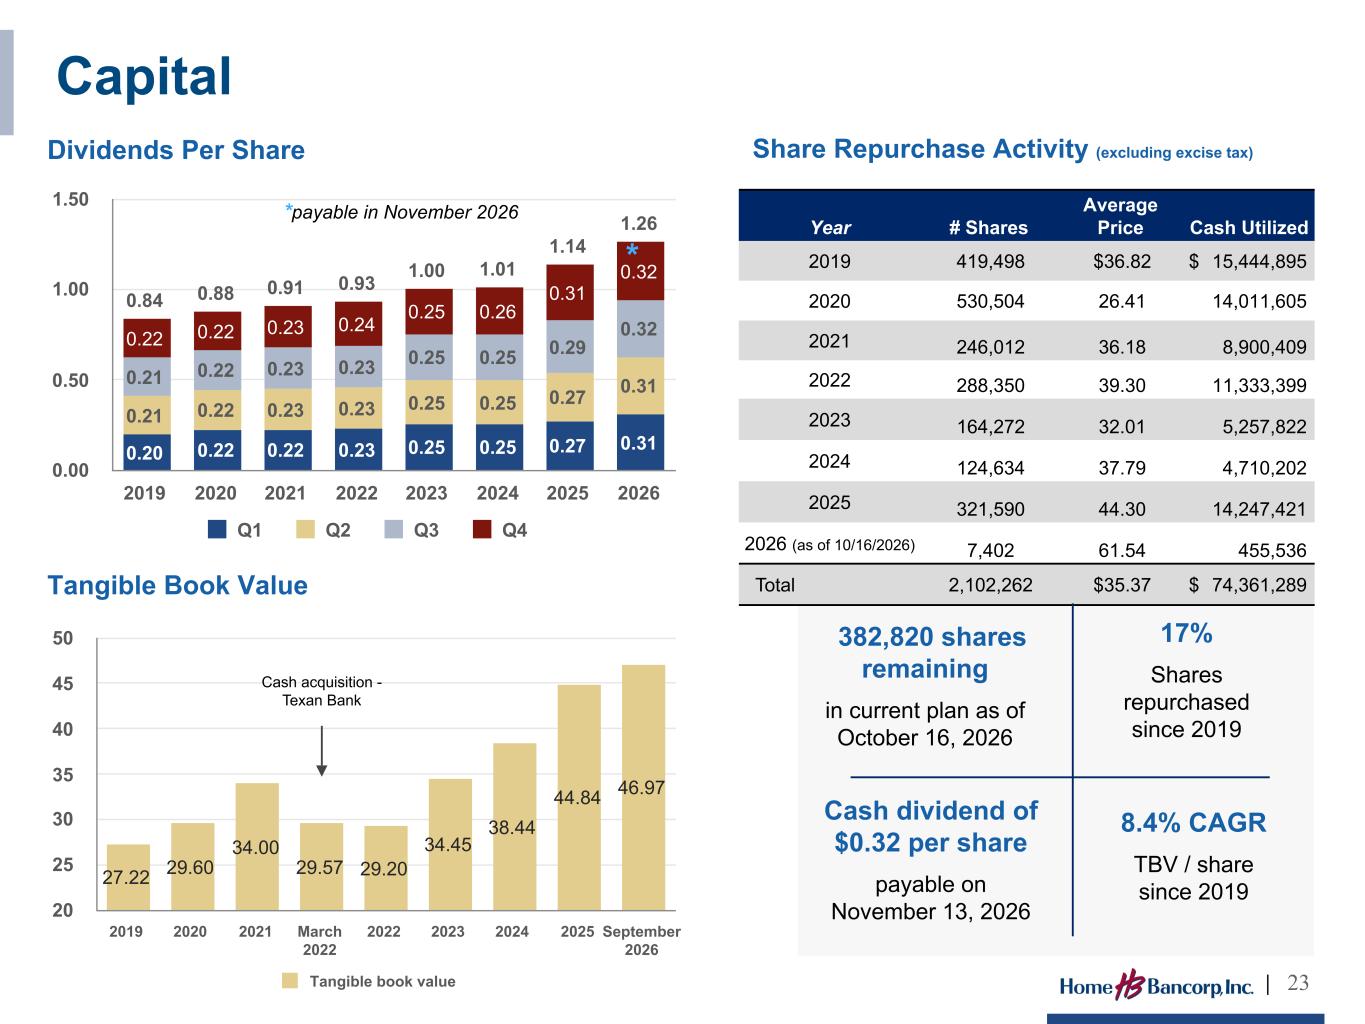
0.84 0.88 0.91 0.93 1.00 1.01 1.14 1.26 0.20 0.22 0.22 0.23 0.25 0.25 0.27 0.31 0.21 0.22 0.23 0.23 0.25 0.25 0.27 0.310.21 0.22 0.23 0.23 0.25 0.25 0.29 0.320.22 0.22 0.23 0.24 0.25 0.26 0.31 0.32 Q1 Q2 Q3 Q4 2019 2020 2021 2022 2023 2024 2025 2026 0.00 0.50 1.00 1.50 Dividends Per Share 27.22 29.60 34.00 29.57 29.20 34.45 38.44 44.84 46.97 Tangible book value 2019 2020 2021 March 2022 2022 2023 2024 2025 September 2026 20 25 30 35 40 45 50 Tangible Book Value Share Repurchase Activity (excluding excise tax) Year # Shares Average Price Cash Utilized 2019 419,498 $36.82 $ 15,444,895 2020 530,504 26.41 14,011,605 2021 246,012 36.18 8,900,409 2022 288,350 39.30 11,333,399 2023 164,272 32.01 5,257,822 2024 124,634 37.79 4,710,202 2025 321,590 44.30 14,247,421 2026 (as of 10/16/2026) 7,402 61.54 455,536 Total 2,102,262 $35.37 $ 74,361,289 Capital | 23 382,820 shares remaining in current plan as of October 16, 2026 New Share Repurchase Plan approved 400,000 shares 17% Shares repurchased since 2019 8.4% CAGR TBV / share since 2019 Cash acquisition - Texan Bank Cash dividend of $0.32 per share payable on November 13, 2026 *payable in November 2026 *
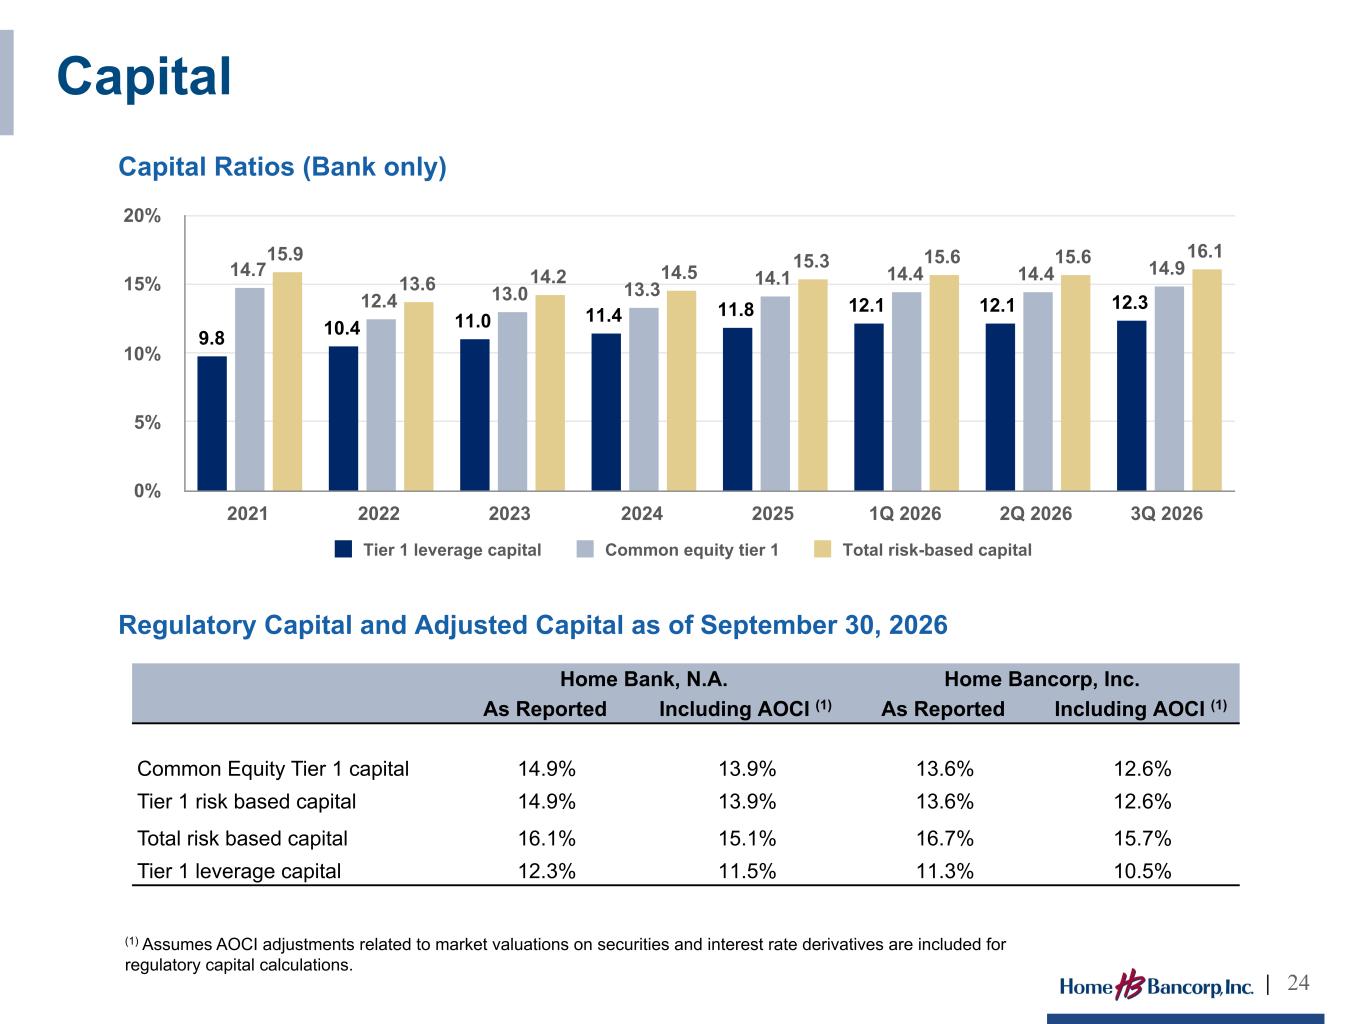
9.8 10.4 11.0 11.4 11.8 12.1 12.1 12.3 14.7 12.4 13.0 13.3 14.1 14.4 14.4 14.9 15.9 13.6 14.2 14.5 15.3 15.6 15.6 16.1 Tier 1 leverage capital Common equity tier 1 Total risk-based capital 2021 2022 2023 2024 2025 1Q 2026 2Q 2026 3Q 2026 0% 5% 10% 15% 20% Capital Ratios (Bank only) Capital | 24 Home Bank, N.A. Home Bancorp, Inc. As Reported Including AOCI (1) As Reported Including AOCI (1) Common Equity Tier 1 capital 14.9% 13.9% 13.6% 12.6% Tier 1 risk based capital 14.9% 13.9% 13.6% 12.6% Total risk based capital 16.1% 15.1% 16.7% 15.7% Tier 1 leverage capital 12.3% 11.5% 11.3% 10.5% (1) Assumes AOCI adjustments related to market valuations on securities and interest rate derivatives are included for regulatory capital calculations. Regulatory Capital and Adjusted Capital as of September 30, 2026
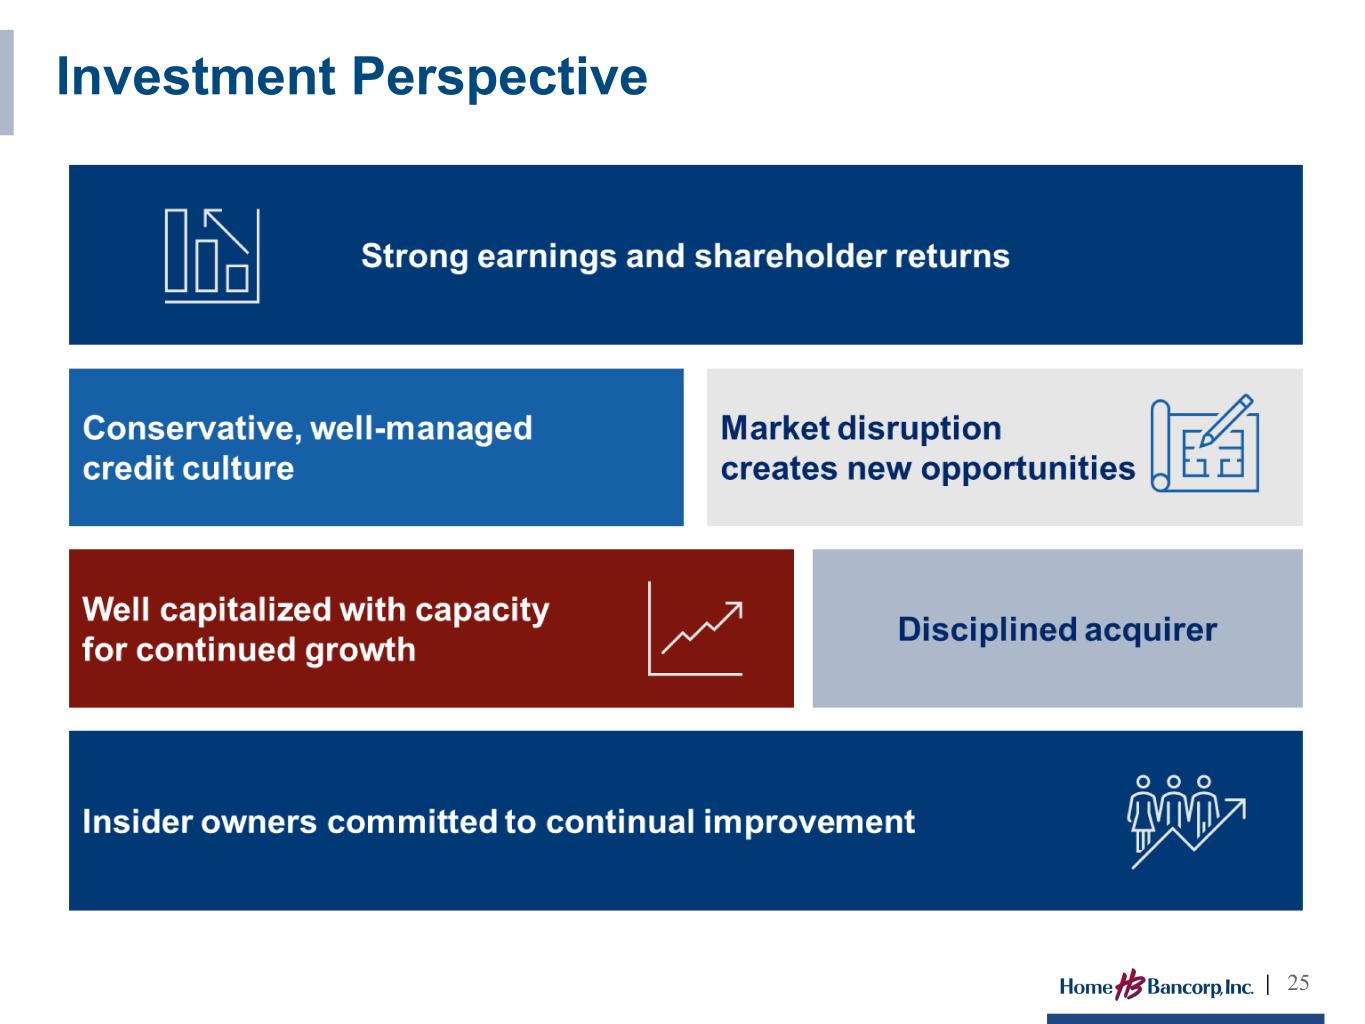
Investment Perspective | 25
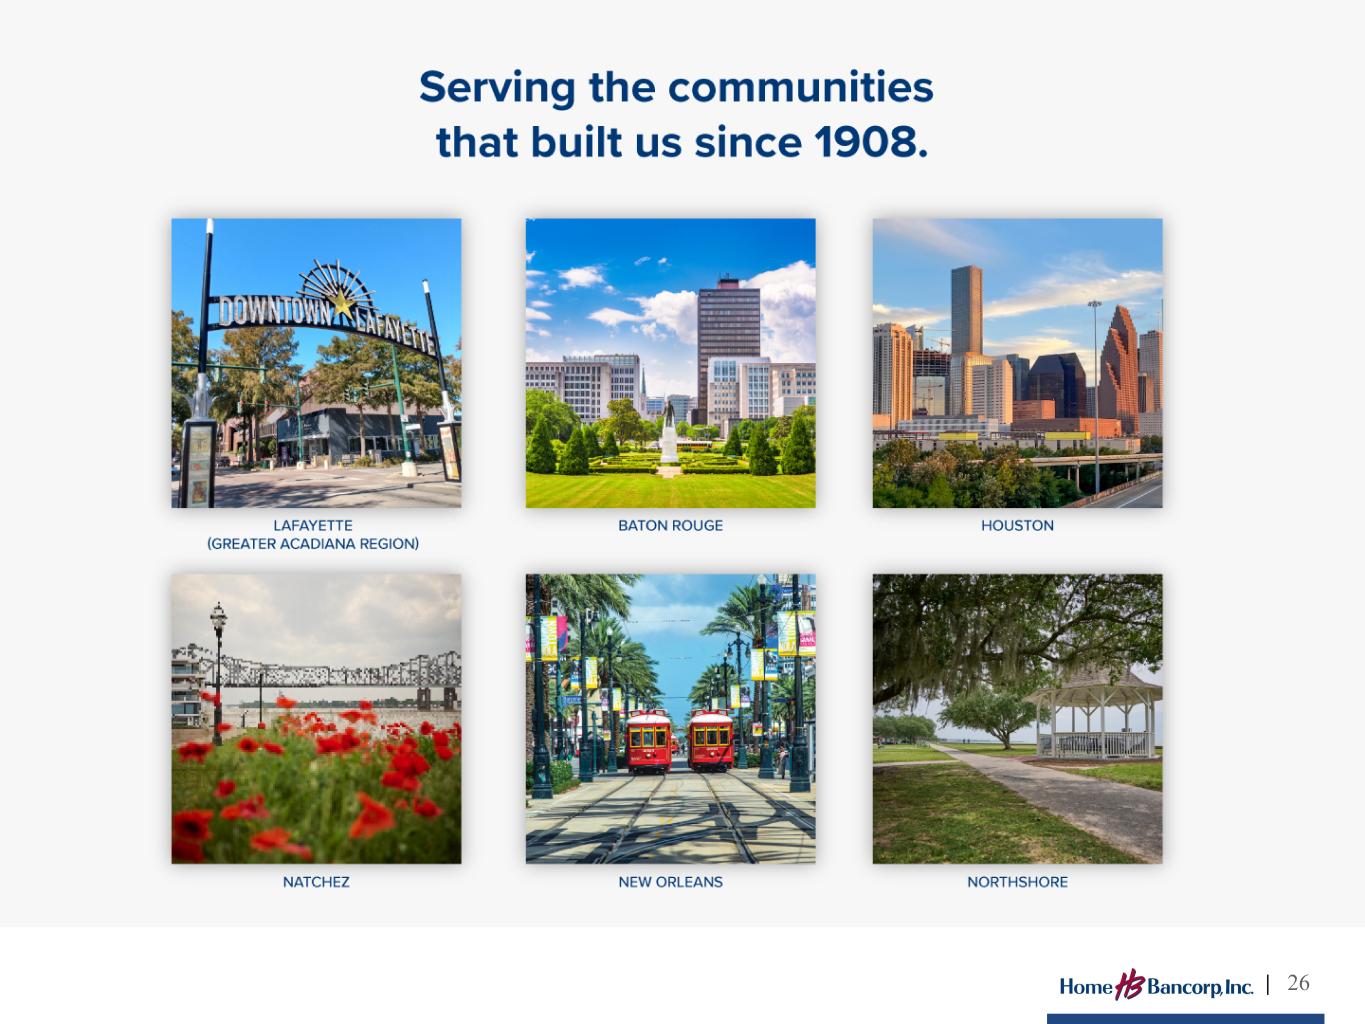
| 26
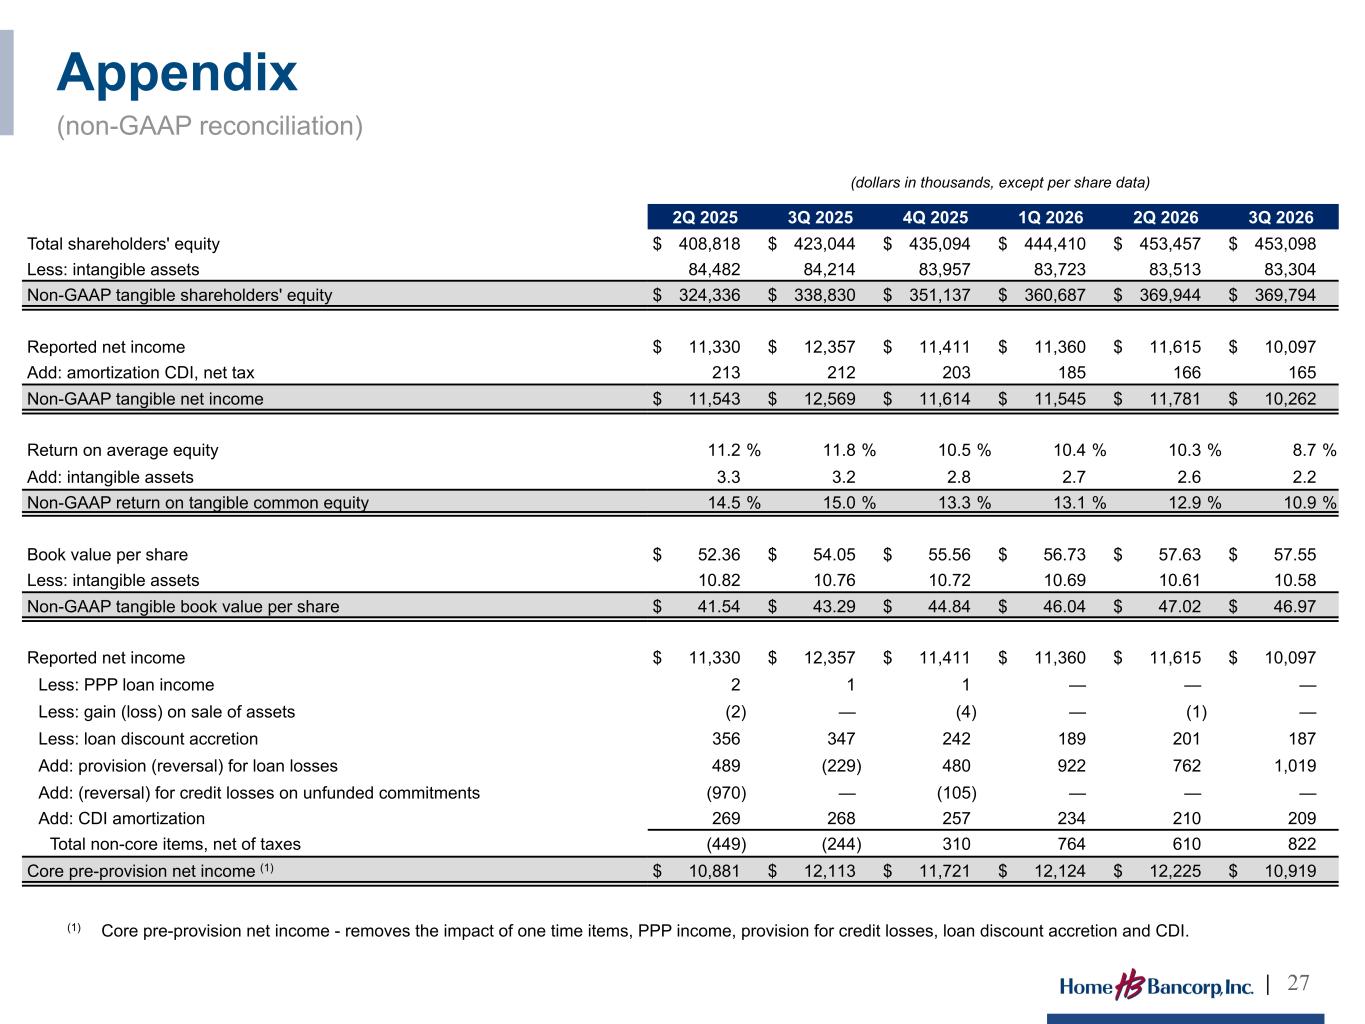
2Q 2025 3Q 2025 4Q 2025 1Q 2026 2Q 2026 3Q 2026 Total shareholders' equity $ 408,818 $ 423,044 $ 435,094 $ 444,410 $ 453,457 $ 453,098 Less: intangible assets 84,482 84,214 83,957 83,723 83,513 83,304 Non-GAAP tangible shareholders' equity $ 324,336 $ 338,830 $ 351,137 $ 360,687 $ 369,944 $ 369,794 Reported net income $ 11,330 $ 12,357 $ 11,411 $ 11,360 $ 11,615 $ 10,097 Add: amortization CDI, net tax 213 212 203 185 166 165 Non-GAAP tangible net income $ 11,543 $ 12,569 $ 11,614 $ 11,545 $ 11,781 $ 10,262 Return on average equity 11.2 % 11.8 % 10.5 % 10.4 % 10.3 % 8.7 % Add: intangible assets 3.3 3.2 2.8 2.7 2.6 2.2 Non-GAAP return on tangible common equity 14.5 % 15.0 % 13.3 % 13.1 % 12.9 % 10.9 % Book value per share $ 52.36 $ 54.05 $ 55.56 $ 56.73 $ 57.63 $ 57.55 Less: intangible assets 10.82 10.76 10.72 10.69 10.61 10.58 Non-GAAP tangible book value per share $ 41.54 $ 43.29 $ 44.84 $ 46.04 $ 47.02 $ 46.97 Reported net income $ 11,330 $ 12,357 $ 11,411 $ 11,360 $ 11,615 $ 10,097 Less: PPP loan income 2 1 1 — — — Less: gain (loss) on sale of assets (2) — (4) — (1) — Less: loan discount accretion 356 347 242 189 201 187 Add: provision (reversal) for loan losses 489 (229) 480 922 762 1,019 Add: (reversal) for credit losses on unfunded commitments (970) — (105) — — — Add: CDI amortization 269 268 257 234 210 209 Total non-core items, net of taxes (449) (244) 310 764 610 822 Core pre-provision net income (1) $ 10,881 $ 12,113 $ 11,721 $ 12,124 $ 12,225 $ 10,919 Appendix (non-GAAP reconciliation) | 27 (dollars in thousands, except per share data) (1) Core pre-provision net income - removes the impact of one time items, PPP income, provision for credit losses, loan discount accretion and CDI.
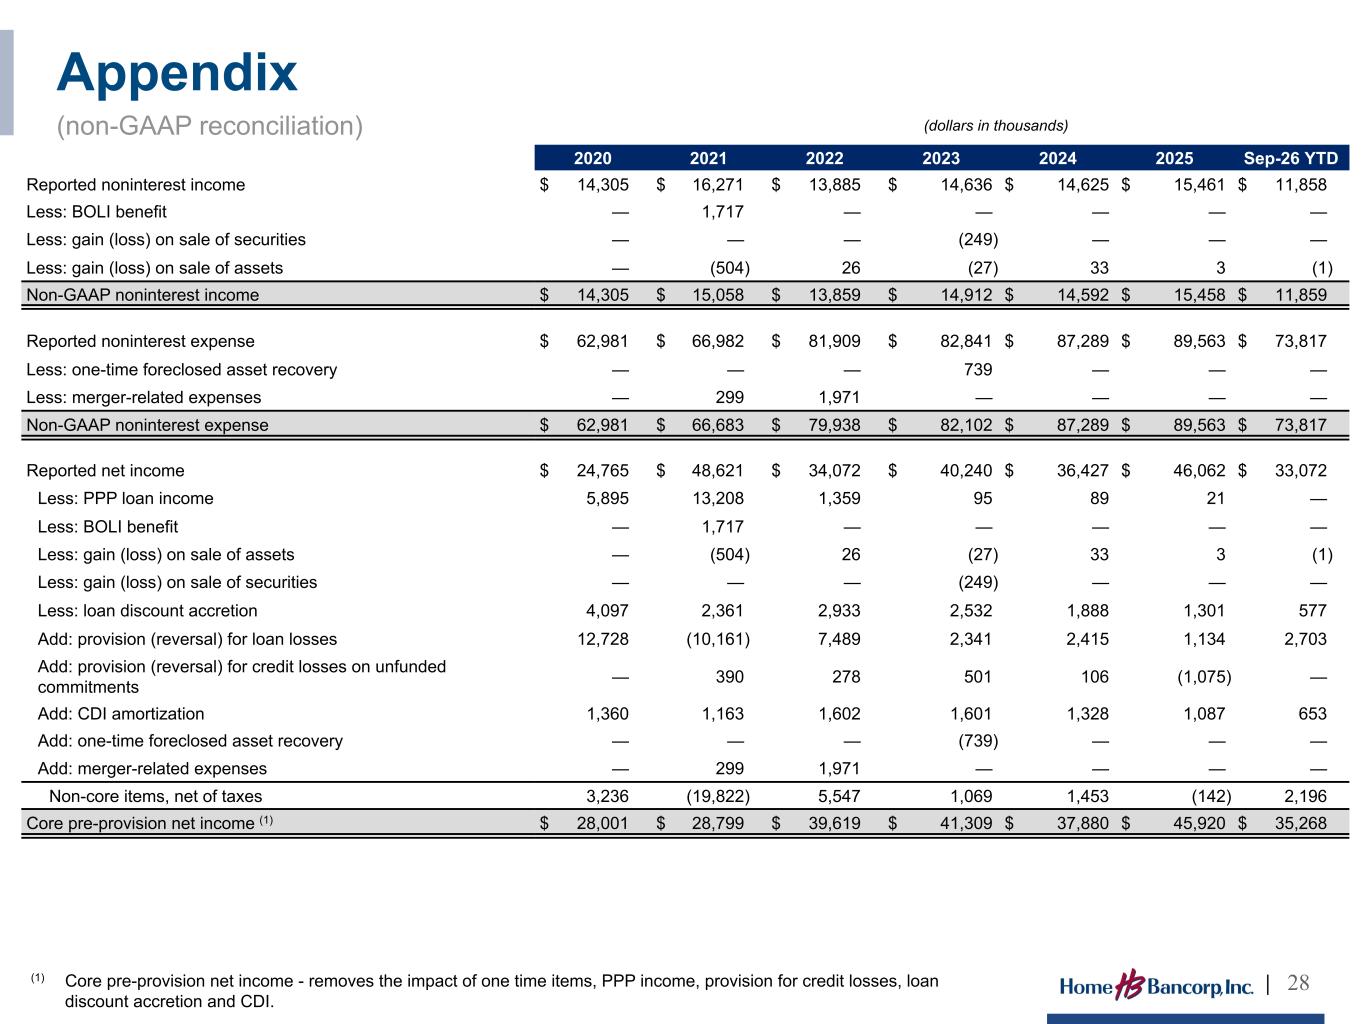
2020 2021 2022 2023 2024 2025 Sep-26 YTD Reported noninterest income $ 14,305 $ 16,271 $ 13,885 $ 14,636 $ 14,625 $ 15,461 $ 11,858 Less: BOLI benefit — 1,717 — — — — — Less: gain (loss) on sale of securities — — — (249) — — — Less: gain (loss) on sale of assets — (504) 26 (27) 33 3 (1) Non-GAAP noninterest income $ 14,305 $ 15,058 $ 13,859 $ 14,912 $ 14,592 $ 15,458 $ 11,859 Reported noninterest expense $ 62,981 $ 66,982 $ 81,909 $ 82,841 $ 87,289 $ 89,563 $ 73,817 Less: one-time foreclosed asset recovery — — — 739 — — — Less: merger-related expenses — 299 1,971 — — — — Non-GAAP noninterest expense $ 62,981 $ 66,683 $ 79,938 $ 82,102 $ 87,289 $ 89,563 $ 73,817 Reported net income $ 24,765 $ 48,621 $ 34,072 $ 40,240 $ 36,427 $ 46,062 $ 33,072 Less: PPP loan income 5,895 13,208 1,359 95 89 21 — Less: BOLI benefit — 1,717 — — — — — Less: gain (loss) on sale of assets — (504) 26 (27) 33 3 (1) Less: gain (loss) on sale of securities — — — (249) — — — Less: loan discount accretion 4,097 2,361 2,933 2,532 1,888 1,301 577 Add: provision (reversal) for loan losses 12,728 (10,161) 7,489 2,341 2,415 1,134 2,703 Add: provision (reversal) for credit losses on unfunded commitments — 390 278 501 106 (1,075) — Add: CDI amortization 1,360 1,163 1,602 1,601 1,328 1,087 653 Add: one-time foreclosed asset recovery — — — (739) — — — Add: merger-related expenses — 299 1,971 — — — — Non-core items, net of taxes 3,236 (19,822) 5,547 1,069 1,453 (142) 2,196 Core pre-provision net income (1) $ 28,001 $ 28,799 $ 39,619 $ 41,309 $ 37,880 $ 45,920 $ 35,268 (1) Core pre-provision net income - removes the impact of one time items, PPP income, provision for credit losses, loan discount accretion and CDI. Appendix (non-GAAP reconciliation) | 28 (dollars in thousands)
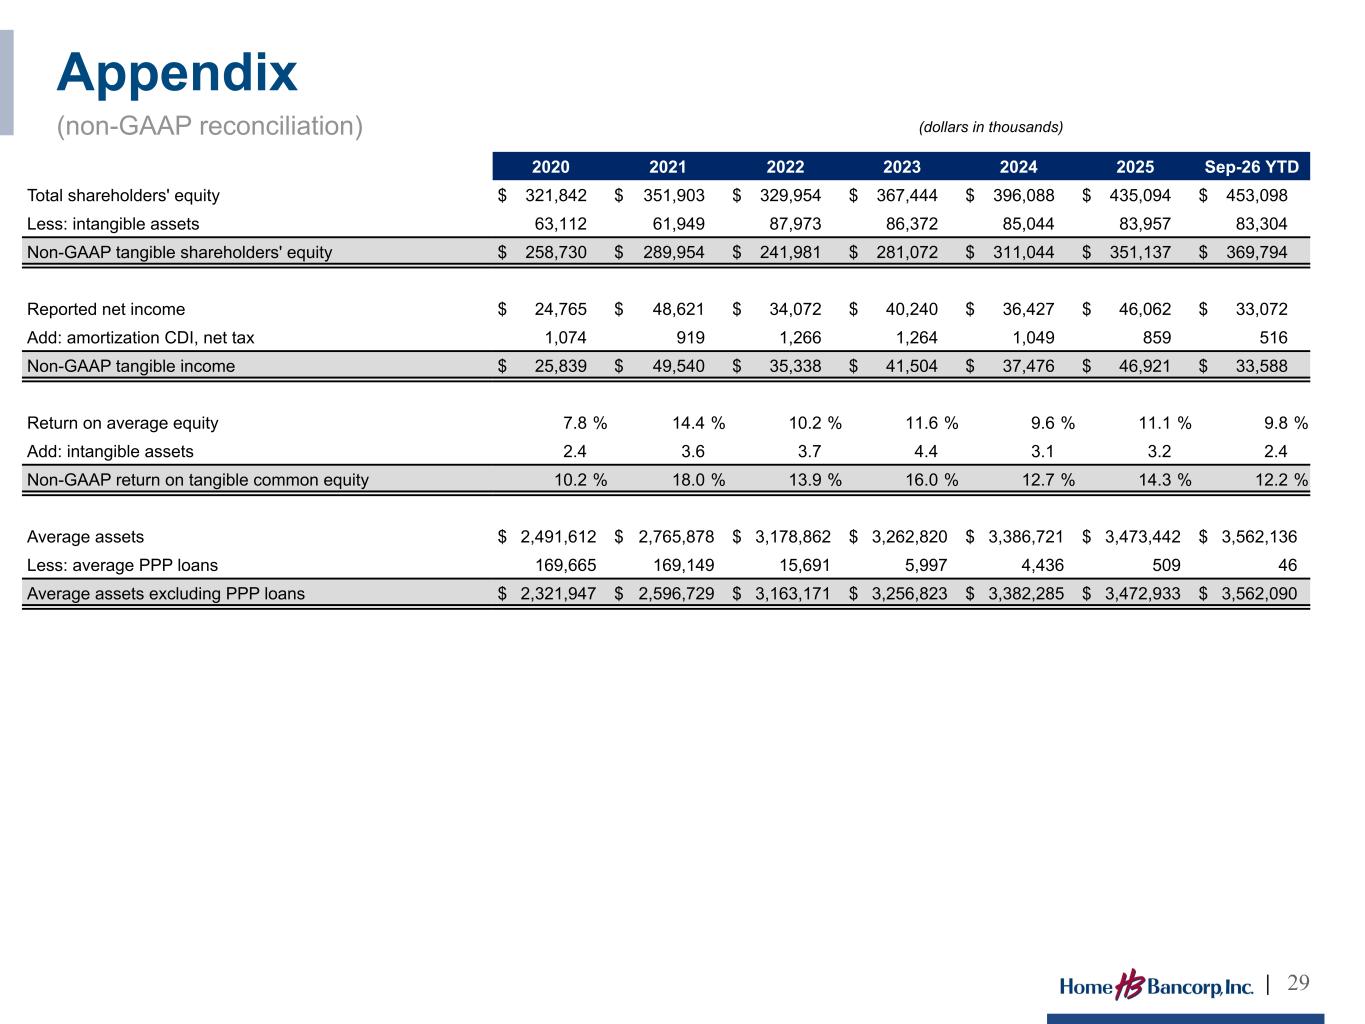
2020 2021 2022 2023 2024 2025 Sep-26 YTD Total shareholders' equity $ 321,842 $ 351,903 $ 329,954 $ 367,444 $ 396,088 $ 435,094 $ 453,098 Less: intangible assets 63,112 61,949 87,973 86,372 85,044 83,957 83,304 Non-GAAP tangible shareholders' equity $ 258,730 $ 289,954 $ 241,981 $ 281,072 $ 311,044 $ 351,137 $ 369,794 Reported net income $ 24,765 $ 48,621 $ 34,072 $ 40,240 $ 36,427 $ 46,062 $ 33,072 Add: amortization CDI, net tax 1,074 919 1,266 1,264 1,049 859 516 Non-GAAP tangible income $ 25,839 $ 49,540 $ 35,338 $ 41,504 $ 37,476 $ 46,921 $ 33,588 Return on average equity 7.8 % 14.4 % 10.2 % 11.6 % 9.6 % 11.1 % 9.8 % Add: intangible assets 2.4 3.6 3.7 4.4 3.1 3.2 2.4 Non-GAAP return on tangible common equity 10.2 % 18.0 % 13.9 % 16.0 % 12.7 % 14.3 % 12.2 % Average assets $ 2,491,612 $ 2,765,878 $ 3,178,862 $ 3,262,820 $ 3,386,721 $ 3,473,442 $ 3,562,136 Less: average PPP loans 169,665 169,149 15,691 5,997 4,436 509 46 Average assets excluding PPP loans $ 2,321,947 $ 2,596,729 $ 3,163,171 $ 3,256,823 $ 3,382,285 $ 3,472,933 $ 3,562,090 Appendix (non-GAAP reconciliation) | 29 (dollars in thousands)
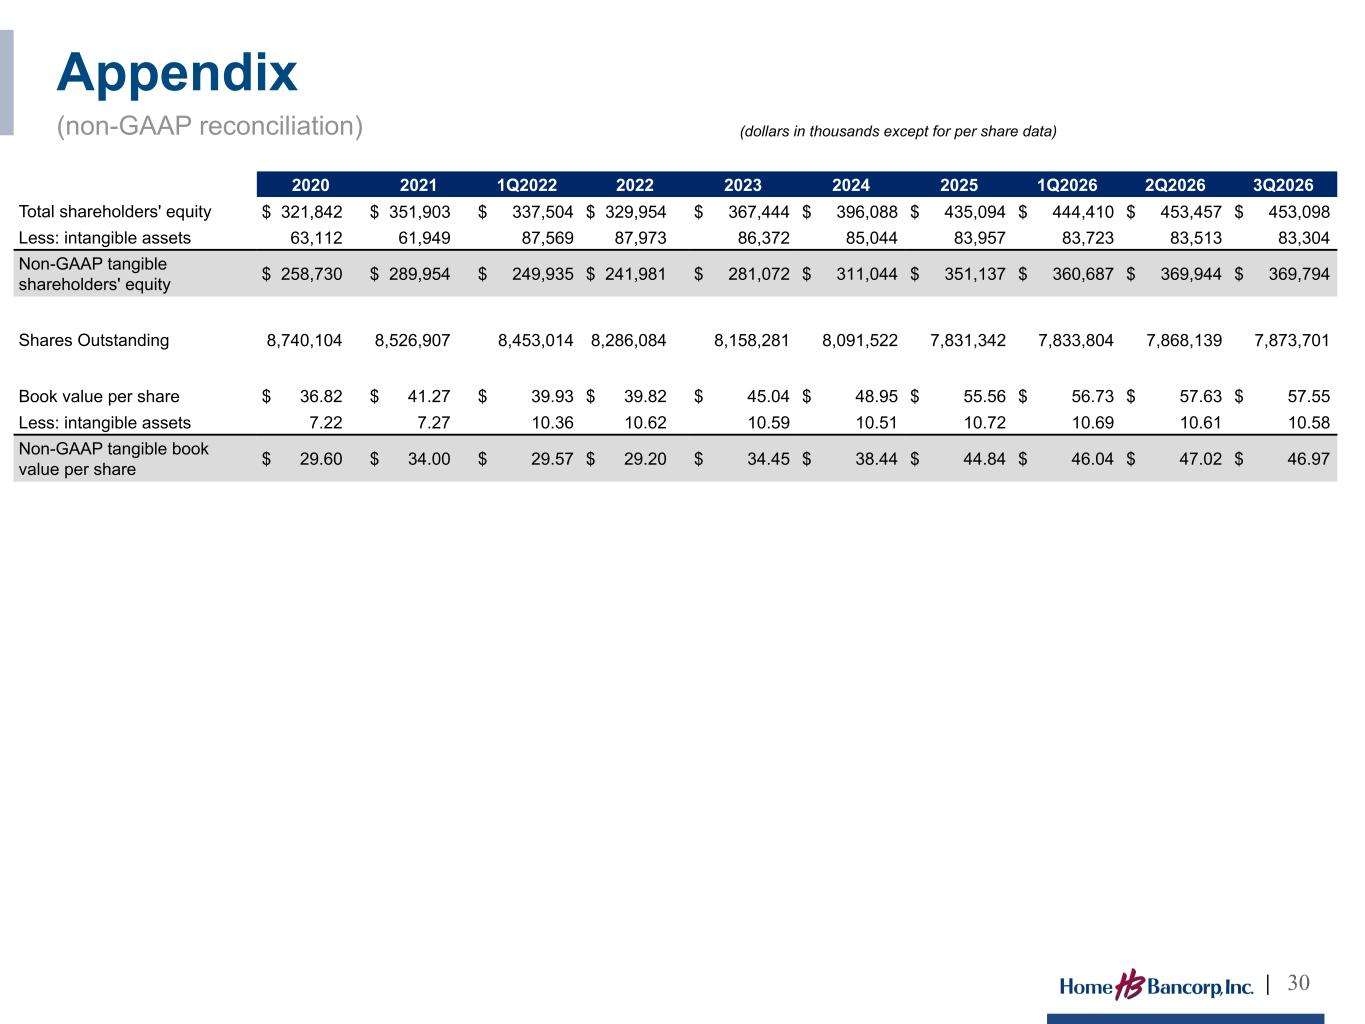
2020 2021 1Q2022 2022 2023 2024 2025 1Q2026 2Q2026 3Q2026 Total shareholders' equity $ 321,842 $ 351,903 $ 337,504 $ 329,954 $ 367,444 $ 396,088 $ 435,094 $ 444,410 $ 453,457 $ 453,098 Less: intangible assets 63,112 61,949 87,569 87,973 86,372 85,044 83,957 83,723 83,513 83,304 Non-GAAP tangible shareholders' equity $ 258,730 $ 289,954 $ 249,935 $ 241,981 $ 281,072 $ 311,044 $ 351,137 $ 360,687 $ 369,944 $ 369,794 Shares Outstanding 8,740,104 8,526,907 8,453,014 8,286,084 8,158,281 8,091,522 7,831,342 7,833,804 7,868,139 7,873,701 Book value per share $ 36.82 $ 41.27 $ 39.93 $ 39.82 $ 45.04 $ 48.95 $ 55.56 $ 56.73 $ 57.63 $ 57.55 Less: intangible assets 7.22 7.27 10.36 10.62 10.59 10.51 10.72 10.69 10.61 10.58 Non-GAAP tangible book value per share $ 29.60 $ 34.00 $ 29.57 $ 29.20 $ 34.45 $ 38.44 $ 44.84 $ 46.04 $ 47.02 $ 46.97 Appendix (non-GAAP reconciliation) | 30 (dollars in thousands except for per share data)