3Q26 Earnings Presentation October 19, 2026 Refer to earnings release dated October 19, 2026 for further information.
© Fifth Third Bancorp | All Rights Reserved This presentation contains statements that we believe are “forward-looking statements” within the meaning of Section 27A of the Securities Act of 1933, as amended, and Rule 175 promulgated thereunder, and Section 21E of the Securities Exchange Act of 1934, as amended, and Rule 3b-6 promulgated thereunder. All statements other than statements of historical fact are forward-looking statements. These statements relate to our financial condition, results of operations, plans, objectives, future performance, capital actions or business. They usually can be identified by the use of forward-looking language such as “will likely result,” “may,” “are expected to,” “is anticipated,” “potential,” “estimate,” “forecast,” “projected,” “intends to,” or may include other similar words or phrases such as “believes,” “plans,” “trend,” “objective,” “continue,” “remain,” or similar expressions, or future or conditional verbs such as “will,” “would,” “should,” “could,” “might,” “can,” or similar verbs. You should not place undue reliance on these statements, as they are subject to risks and uncertainties, including but not limited to the risk factors set forth in our most recent Annual Report on Form 10-K as updated by our filings with the U.S. Securities and Exchange Commission (“SEC”). There are a number of important factors that could cause future results to differ materially from historical performance and these forward-looking statements. Factors that might cause such a difference include, but are not limited to: (1) deteriorating credit quality; (2) loan concentration by location or industry of borrowers or collateral; (3) any instability or disruption in the financial system, including those caused by actual or perceived issues affecting the soundness of other financial institutions or market participants; (4) inadequate sources of funding or liquidity; (5) unfavorable actions of rating agencies; (6) inability to maintain or grow deposits; (7) limitations on the ability to receive dividends from subsidiaries; (8) cyber-security risks; (9) Fifth Third’s ability to secure confidential information and deliver products and services through the use of computer systems and telecommunications networks; (10) failures by third-party service providers; (11) inability to manage strategic initiatives and/or organizational changes; (12) inability to implement technology system enhancements, including the use of artificial intelligence; (13) failure of internal controls and other risk management programs; (14) losses related to fraud, theft, misappropriation or violence; (15) inability to attract and retain skilled personnel; (16) adverse impacts of government regulation; (17) governmental or regulatory changes or other actions; (18) failures to meet applicable capital requirements; (19) regulatory objections to Fifth Third’s capital plan; (20) regulation of Fifth Third’s derivatives activities; (21) deposit insurance premiums; (22) assessments for the orderly liquidation fund; (23) weakness in the national or local economies; (24) global political and economic uncertainty or negative actions; (25) changes in interest rates and the effects of inflation; (26) changes in U.S. trade policies, including the imposition of tariffs and retaliatory tariffs; (27) changes and trends in capital markets; (28) fluctuation of Fifth Third’s stock price; (29) volatility in mortgage banking revenue; (30) litigation, investigations, and enforcement proceedings; (31) breaches of contractual covenants, representations and warranties; (32) competition and changes in the financial services industry; (33) potential impacts of the adoption of real-time payment networks; (34) changing retail distribution strategies, customer preferences and behavior; (35) difficulties in identifying, acquiring or integrating suitable strategic partnerships, investments or acquisitions; (36) potential dilution from future acquisitions; (37) loss of income and/or difficulties encountered in the sale and separation of businesses, investments or other assets; (38) results of investments or acquired entities; (39) changes in accounting standards or interpretation or declines in the value of Fifth Third’s goodwill or other intangible assets; (40) inaccuracies or other failures from the use of models; (41) effects of critical accounting policies and judgments or the use of inaccurate estimates; (42) weather- related events, other natural disasters, or health emergencies (including pandemics); (43) the impact of reputational risk created by these or other developments on such matters as business generation and retention, funding and liquidity; (44) changes in law or requirements imposed by Fifth Third’s regulators impacting our capital actions, including dividend payments and stock repurchases; (45) Fifth Third's ability to meet its environmental and/or social targets, goals and commitments; and (46) risks relating to the merger with Comerica Incorporated, including Fifth Third’s inability to realize the anticipated benefits of the merger and potential disruption to Fifth Third’s business resulting from post-merger integration. You should refer to our periodic and current reports filed with the Securities and Exchange Commission, or “SEC,” for further information on other factors, which could cause actual results to be significantly different from those expressed or implied by these forward-looking statements. Moreover, you should treat these statements as speaking only as of the date they are made and based only on information then actually known to us. We expressly disclaim any obligation or undertaking to release publicly any updates or revisions to any forward-looking statements contained herein to reflect any change in our expectations or any changes in events, conditions or circumstances on which any such statement is based, except as may be required by law, and we claim the protection of the safe harbor for forward-looking statements contained in the Private Securities Litigation Reform Act of 1995. The information contained herein is intended to be reviewed in its entirety. Any qualifications, assumptions, conditions, limitations or other disclosures that apply to a particular item of information are deemed to apply, with any necessary adjustments to all references to that information throughout this presentation. Annualized, pro forma, projected and estimated numbers are used for illustrative purpose only, are not forecasts and may not reflect actual results. In this presentation, we may sometimes provide non-GAAP financial information. Please note that although non-GAAP financial measures provide useful insight to analysts, investors and regulators, they should not be considered in isolation or relied upon as a substitute for analysis using GAAP measures. We provide a discussion of non-GAAP measures and reconciliations to the most directly comparable GAAP measures in later slides in this presentation, as well as on pages 27 through 29 of our 3Q26 earnings release. Management does not provide a reconciliation for forward-looking non-GAAP financial measures where it is unable to provide a meaningful or accurate calculation or estimation of reconciling items and the information is not available without unreasonable effort. This is due to the inherent difficulty of forecasting the occurrence and the financial impact of various items that have not yet occurred, are out of the Bancorp's control or cannot be reasonably predicted. For the same reasons, Bancorp's management is unable to address the probable significance of the unavailable information. Forward-looking non-GAAP financial measures provided without the most directly comparable GAAP financial measures may vary materially from the corresponding GAAP financial measures. Cautionary statement 2
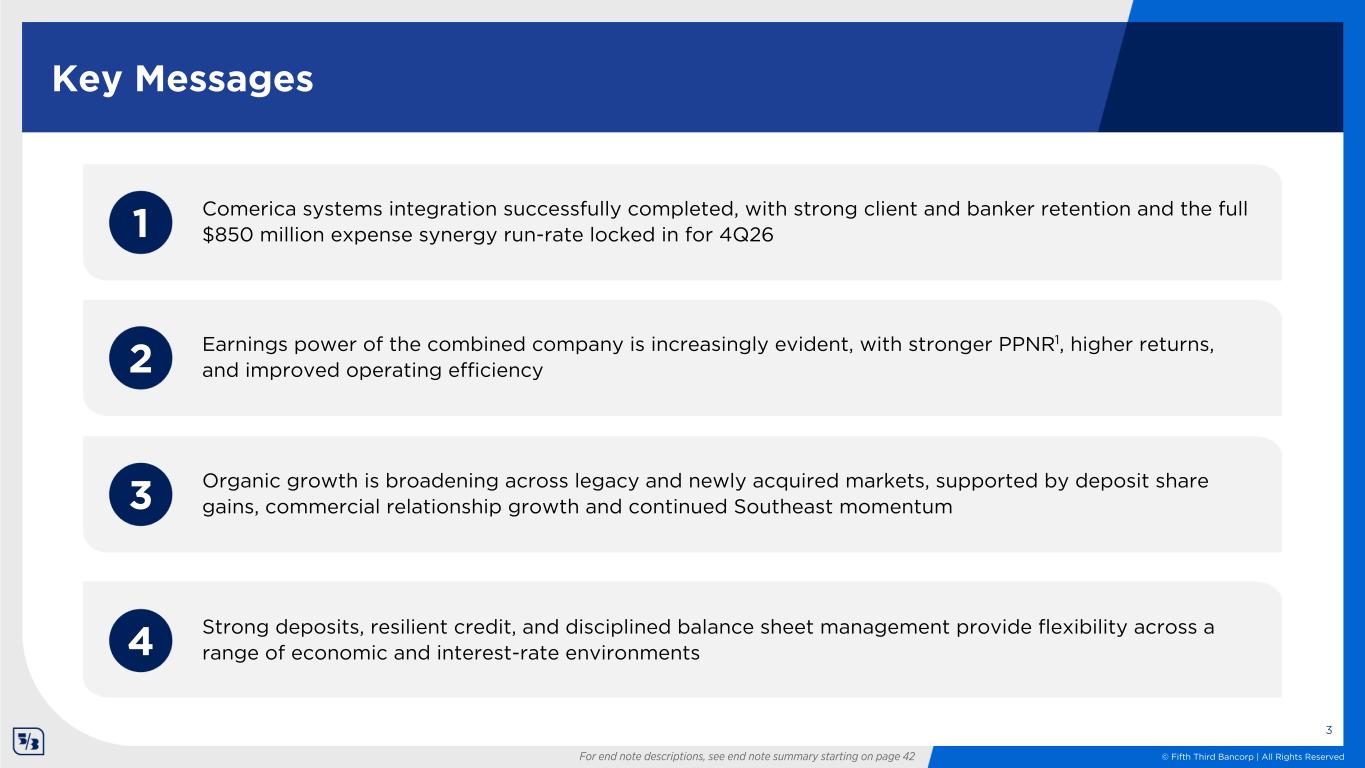
© Fifth Third Bancorp | All Rights Reserved For end note descriptions, see end note summary starting on page 42 Key Messages 3 Strong deposits, resilient credit, and disciplined balance sheet management provide flexibility across a range of economic and interest-rate environments Comerica systems integration successfully completed, with strong client and banker retention and the full $850 million expense synergy run-rate locked in for 4Q26 Earnings power of the combined company is increasingly evident, with stronger PPNR1, higher returns, and improved operating efficiency Organic growth is broadening across legacy and newly acquired markets, supported by deposit share gains, commercial relationship growth and continued Southeast momentum 1 2 3 4
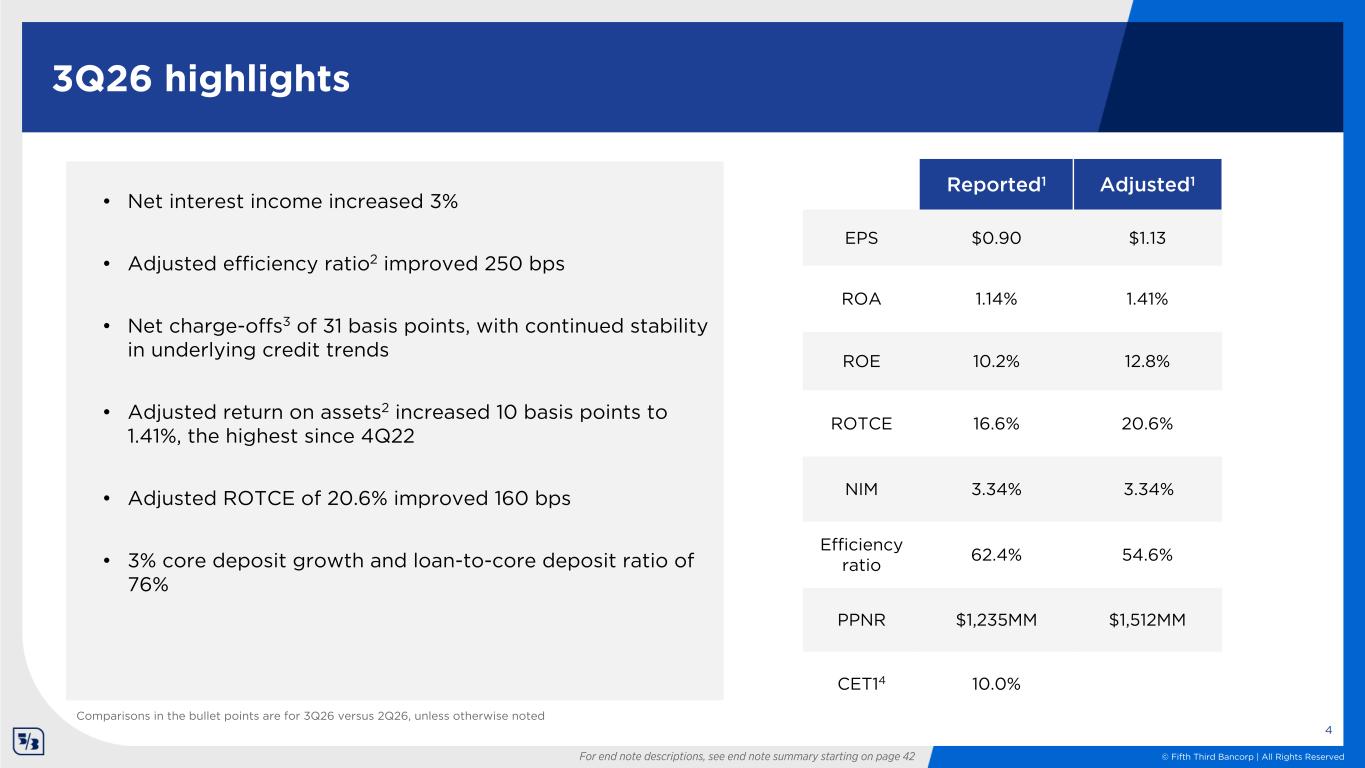
© Fifth Third Bancorp | All Rights Reserved • Net interest income increased 3% • Adjusted efficiency ratio2 improved 250 bps • Net charge-offs3 of 31 basis points, with continued stability in underlying credit trends • Adjusted return on assets2 increased 10 basis points to 1.41%, the highest since 4Q22 • Adjusted ROTCE of 20.6% improved 160 bps • 3% core deposit growth and loan-to-core deposit ratio of 76% Reported1 Adjusted1 EPS $0.90 $1.13 ROA 1.14% 1.41% ROE 10.2% 12.8% ROTCE 16.6% 20.6% NIM 3.34% 3.34% Efficiency ratio 62.4% 54.6% PPNR $1,235MM $1,512MM CET14 10.0% For end note descriptions, see end note summary starting on page 42 3Q26 highlights 4 Comparisons in the bullet points are for 3Q26 versus 2Q26, unless otherwise noted
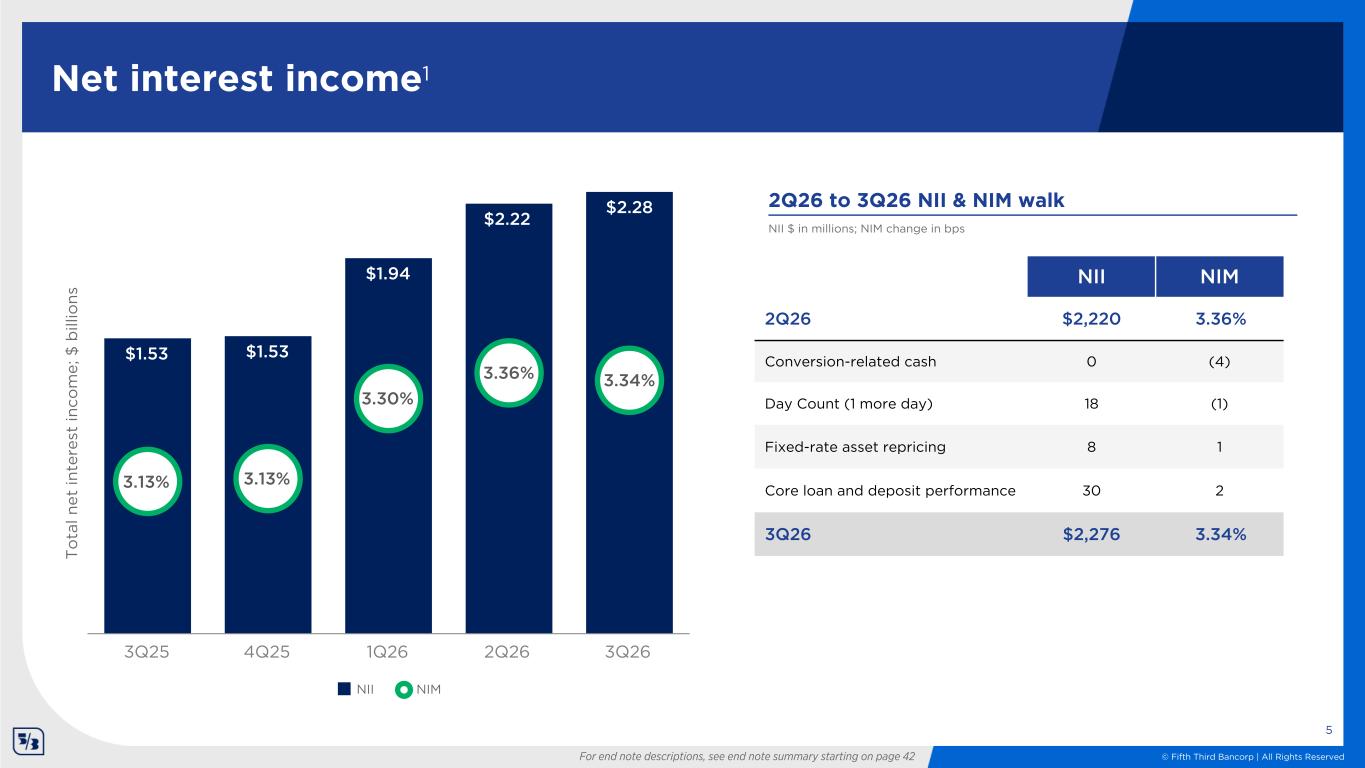
© Fifth Third Bancorp | All Rights Reserved $1.53 $1.53 $1.94 $2.22 $2.28 3.13% 3.13% 3.30% 3.36% 3.34% NII NIM 3Q25 4Q25 1Q26 2Q26 3Q26 NII $ in millions; NIM change in bps 2Q26 to 3Q26 NII & NIM walk T o ta l n et in te re st in co m e; $ b ill io ns Net interest income1 5 For end note descriptions, see end note summary starting on page 42 NII NIM 2Q26 $2,220 3.36% Conversion-related cash 0 (4) Day Count (1 more day) 18 (1) Fixed-rate asset repricing 8 1 Core loan and deposit performance 30 2 3Q26 $2,276 3.34%
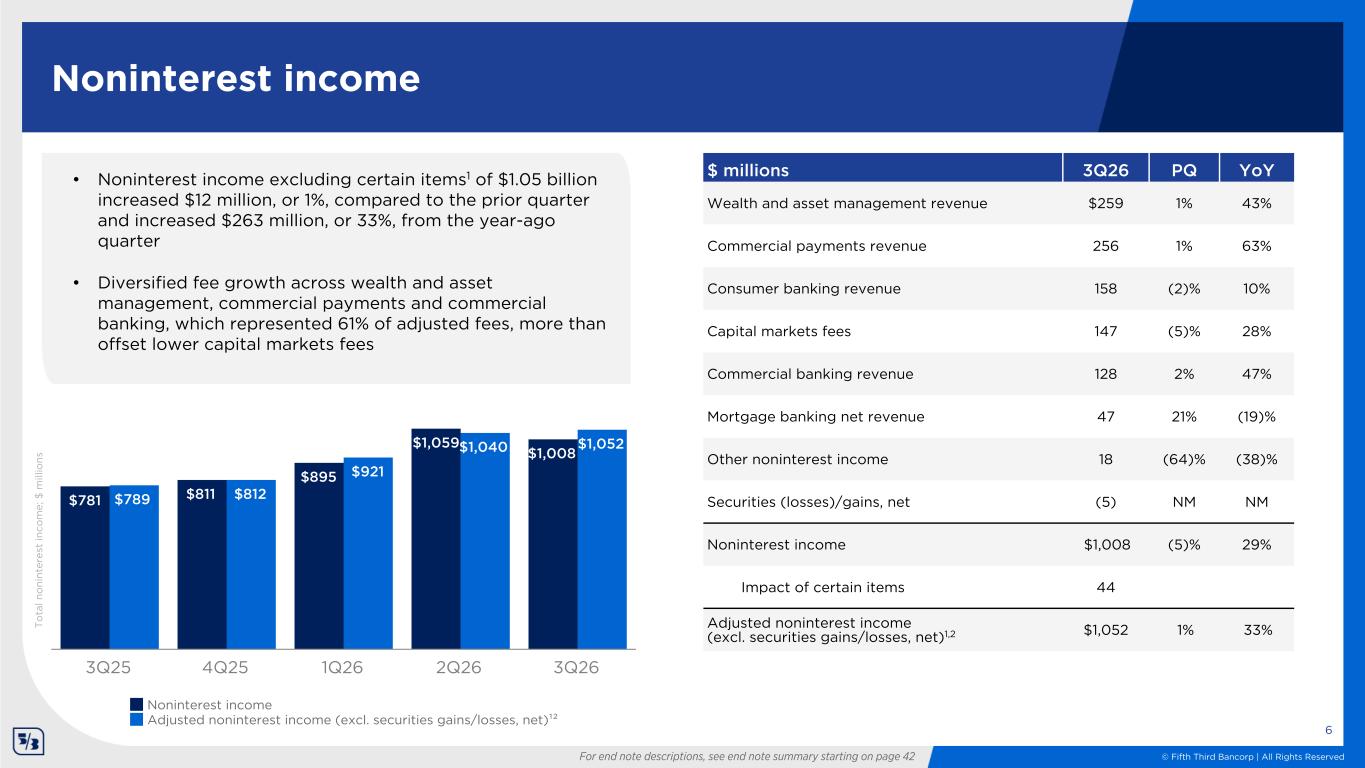
© Fifth Third Bancorp | All Rights Reserved • Noninterest income excluding certain items1 of $1.05 billion increased $12 million, or 1%, compared to the prior quarter and increased $263 million, or 33%, from the year-ago quarter • Diversified fee growth across wealth and asset management, commercial payments and commercial banking, which represented 61% of adjusted fees, more than offset lower capital markets fees Noninterest income T o ta l n o ni nt er es t in co m e; $ m ill io ns For end note descriptions, see end note summary starting on page 42 6 $ millions 3Q26 PQ YoY Wealth and asset management revenue $259 1% 43% Commercial payments revenue 256 1% 63% Consumer banking revenue 158 (2)% 10% Capital markets fees 147 (5)% 28% Commercial banking revenue 128 2% 47% Mortgage banking net revenue 47 21% (19)% Other noninterest income 18 (64)% (38)% Securities (losses)/gains, net (5) NM NM Noninterest income $1,008 (5)% 29% Impact of certain items 44 Adjusted noninterest income (excl. securities gains/losses, net)1,2 $1,052 1% 33% $781 $811 $895 $1,059 $1,008 $789 $812 $921 $1,040 $1,052 Noninterest income Adjusted noninterest income (excl. securities gains/losses, net)¹² 3Q25 4Q25 1Q26 2Q26 3Q26
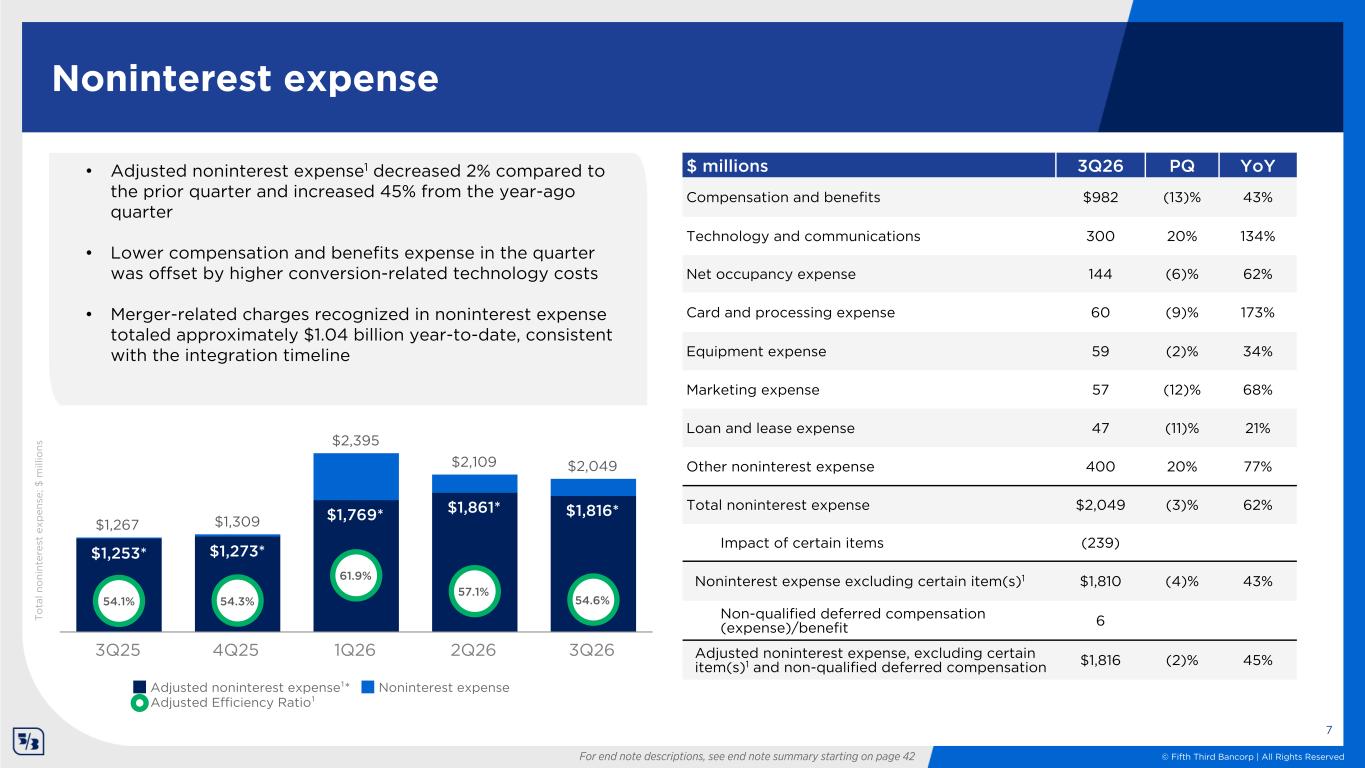
© Fifth Third Bancorp | All Rights Reserved $1,267 $1,309 $2,395 $2,109 $2,049 $1,253* $1,273* $1,769* $1,861* $1,816* 54.1% 54.3% 61.9% 57.1% 54.6% Adjusted noninterest expense¹* Noninterest expense Adjusted Efficiency Ratio¹ 3Q25 4Q25 1Q26 2Q26 3Q26 T o ta l n o ni nt er es t ex p en se ; $ m ill io ns Noninterest expense 7 $ in millions 3Q26 2Q26 3Q25 Non-qualified deferred compensation expense/ (benefit), primarily offset in securities gains/losses ($6) $30 $11 For end note descriptions, see end note summary starting on page 42 $ millions 3Q26 PQ YoY Compensation and benefits $982 (13)% 43% Technology and communications 300 20% 134% Net occupancy expense 144 (6)% 62% Card and processing expense 60 (9)% 173% Equipment expense 59 (2)% 34% Marketing expense 57 (12)% 68% Loan and lease expense 47 (11)% 21% Other noninterest expense 400 20% 77% Total noninterest expense $2,049 (3)% 62% Impact of certain items (239) Noninterest expense excluding certain item(s)1 $1,810 (4)% 43% Non-qualified deferred compensation (expense)/benefit 6 Adjusted noninterest expense, excluding certain item(s)1 and non-qualified deferred compensation $1,816 (2)% 45% • Adjusted noninterest expense1 decreased 2% compared to the prior quarter and increased 45% from the year-ago quarter • Lower compensation and benefits expense in the quarter was offset by higher conversion-related technology costs • Merger-related charges recognized in noninterest expense totaled approximately $1.04 billion year-to-date, consistent with the integration timeline
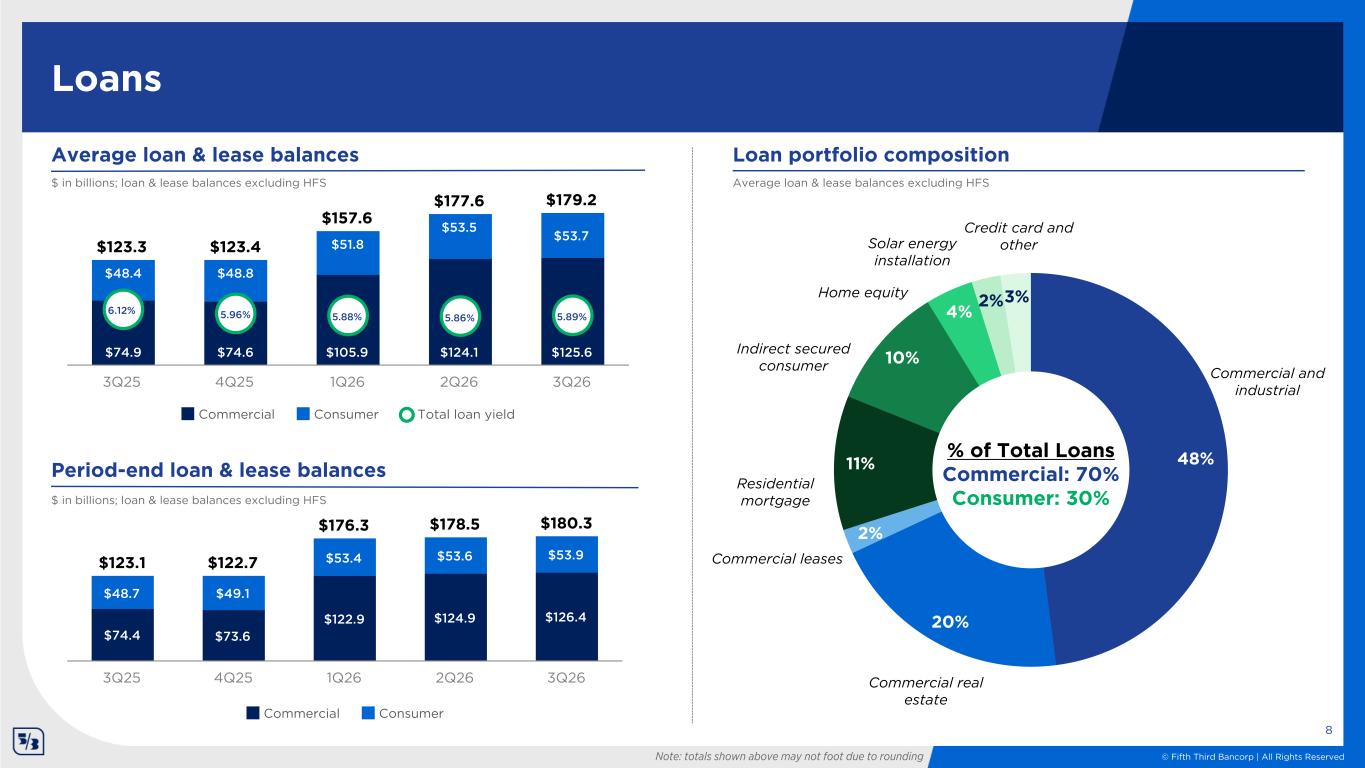
© Fifth Third Bancorp | All Rights Reserved Solar energy installation Average loan & lease balances excluding HFS $123.3 $123.4 $157.6 $177.6 $179.2 $74.9 $74.6 $105.9 $124.1 $125.6 $48.4 $48.8 $51.8 $53.5 $53.7 6.12% 5.96% 5.88% 5.86% 5.89% Commercial Consumer Total loan yield 3Q25 4Q25 1Q26 2Q26 3Q26 $123.1 $122.7 $176.3 $178.5 $180.3 $74.4 $73.6 $122.9 $124.9 $126.4 $48.7 $49.1 $53.4 $53.6 $53.9 Commercial Consumer 3Q25 4Q25 1Q26 2Q26 3Q26 Loans Loan portfolio compositionAverage loan & lease balances $ in billions; loan & lease balances excluding HFS Period-end loan & lease balances $ in billions; loan & lease balances excluding HFS 8 Note: totals shown above may not foot due to rounding 48% 20% 2% 11% 10% 4% 2%3% Commercial and industrial Commercial real estate Commercial leases Residential mortgage Home equity Indirect secured consumer Credit card and other % of Total Loans Commercial: 70% Consumer: 30%
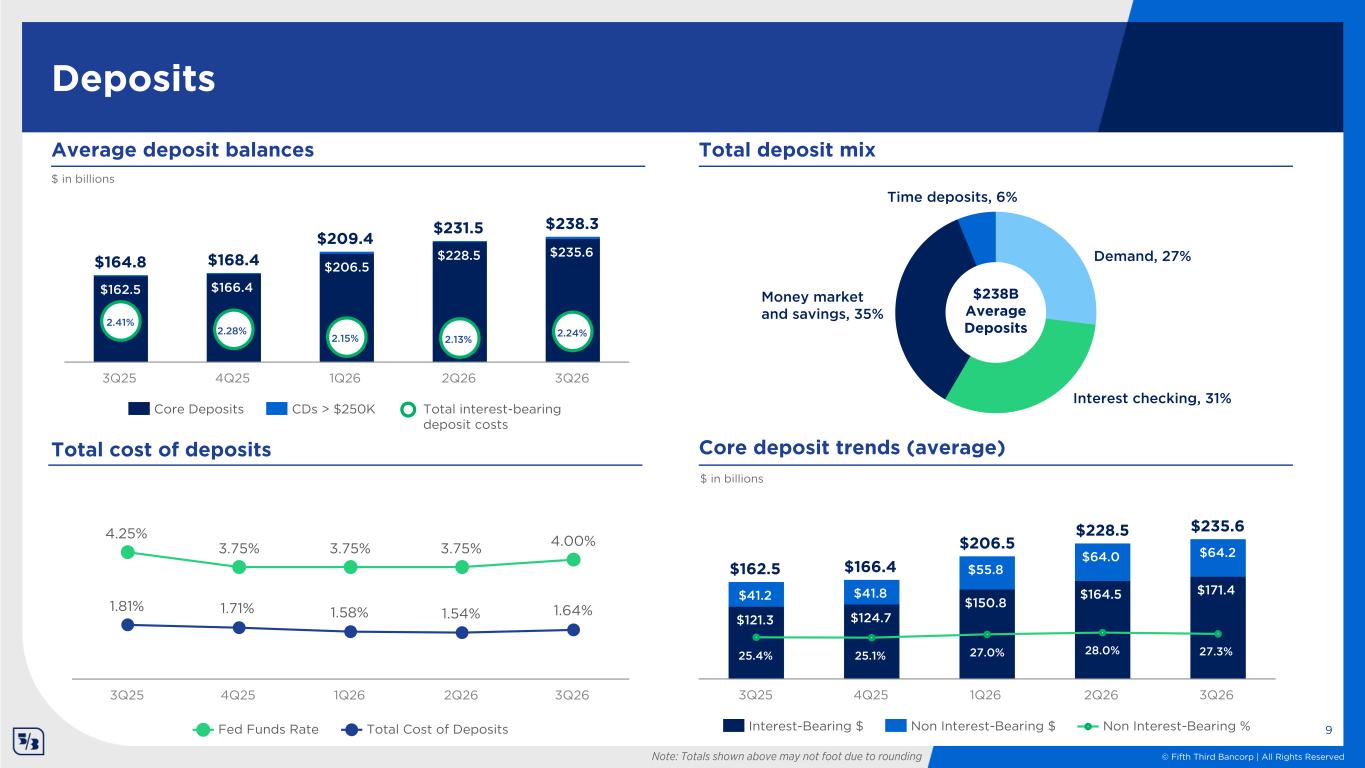
© Fifth Third Bancorp | All Rights Reserved 4.25% 3.75% 3.75% 3.75% 4.00% 1.81% 1.71% 1.58% 1.54% 1.64% Fed Funds Rate Total Cost of Deposits 3Q25 4Q25 1Q26 2Q26 3Q26 Total cost of deposits Total deposit mixAverage deposit balances $164.8 $168.4 $209.4 $231.5 $238.3 $162.5 $166.4 $206.5 $228.5 $235.6 2.41% 2.28% 2.15% 2.13% 2.24% Core Deposits CDs > $250K Total interest-bearing deposit costs 3Q25 4Q25 1Q26 2Q26 3Q26 $ in billions Demand, 27% Interest checking, 31% Money market and savings, 35% Time deposits, 6% $238B Average Deposits $162.5 $166.4 $206.5 $228.5 $235.6 $121.3 $124.7 $150.8 $164.5 $171.4$41.2 $41.8 $55.8 $64.0 $64.2 25.4% 25.1% 27.0% 28.0% 27.3% Interest-Bearing $ Non Interest-Bearing $ Non Interest-Bearing % 3Q25 4Q25 1Q26 2Q26 3Q26 Core deposit trends (average) $ in billions Deposits Note: Totals shown above may not foot due to rounding 9
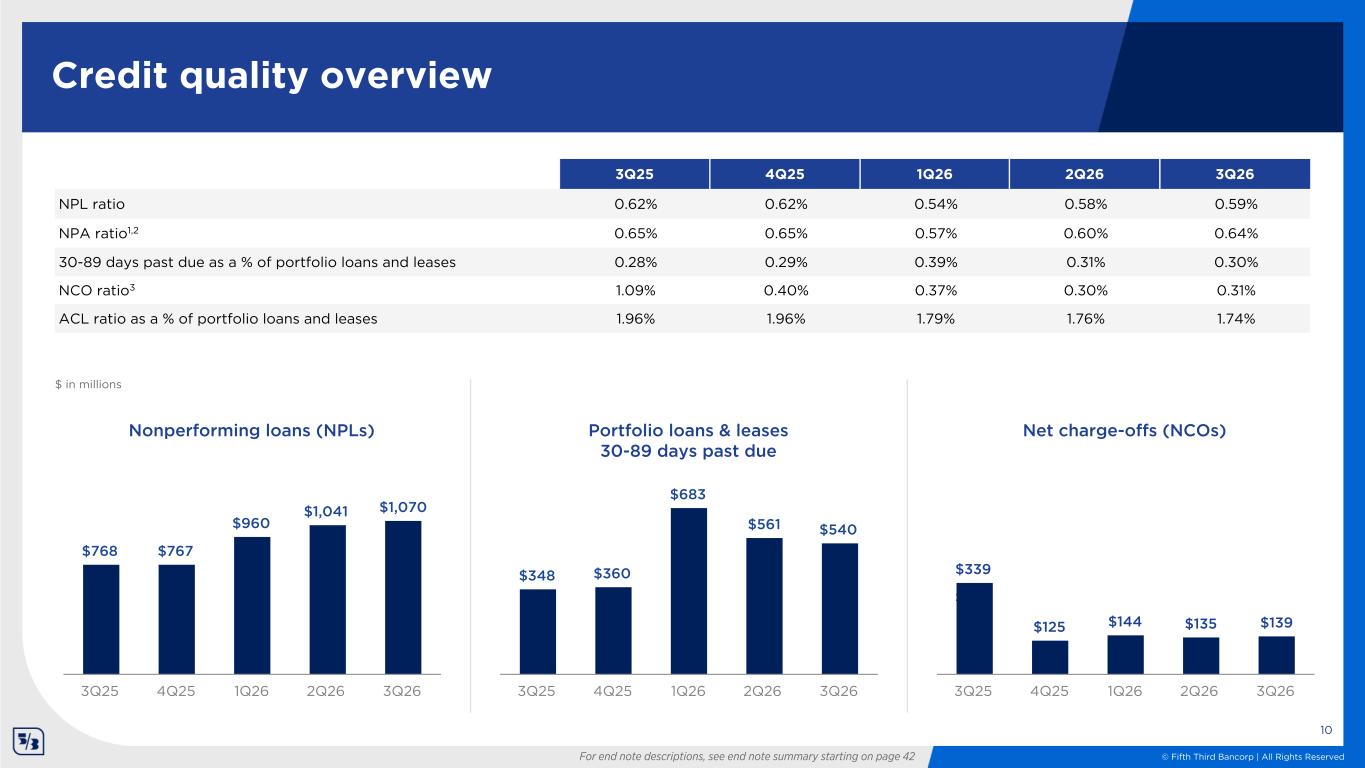
© Fifth Third Bancorp | All Rights Reserved Net charge-offs (NCOs) $339 $125 $144 $135 $139 $339 $125 $144 $135 3Q25 4Q25 1Q26 2Q26 3Q26 Credit quality overview 10 3Q25 4Q25 1Q26 2Q26 3Q26 NPL ratio 0.62% 0.62% 0.54% 0.58% 0.59% NPA ratio1,2 0.65% 0.65% 0.57% 0.60% 0.64% 30-89 days past due as a % of portfolio loans and leases 0.28% 0.29% 0.39% 0.31% 0.30% NCO ratio3 1.09% 0.40% 0.37% 0.30% 0.31% ACL ratio as a % of portfolio loans and leases 1.96% 1.96% 1.79% 1.76% 1.74% Nonperforming loans (NPLs) $768 $767 $960 $1,041 $1,070 3Q25 4Q25 1Q26 2Q26 3Q26 Portfolio loans & leases 30-89 days past due $348 $360 $683 $561 $540 3Q25 4Q25 1Q26 2Q26 3Q26 $ in millions For end note descriptions, see end note summary starting on page 42
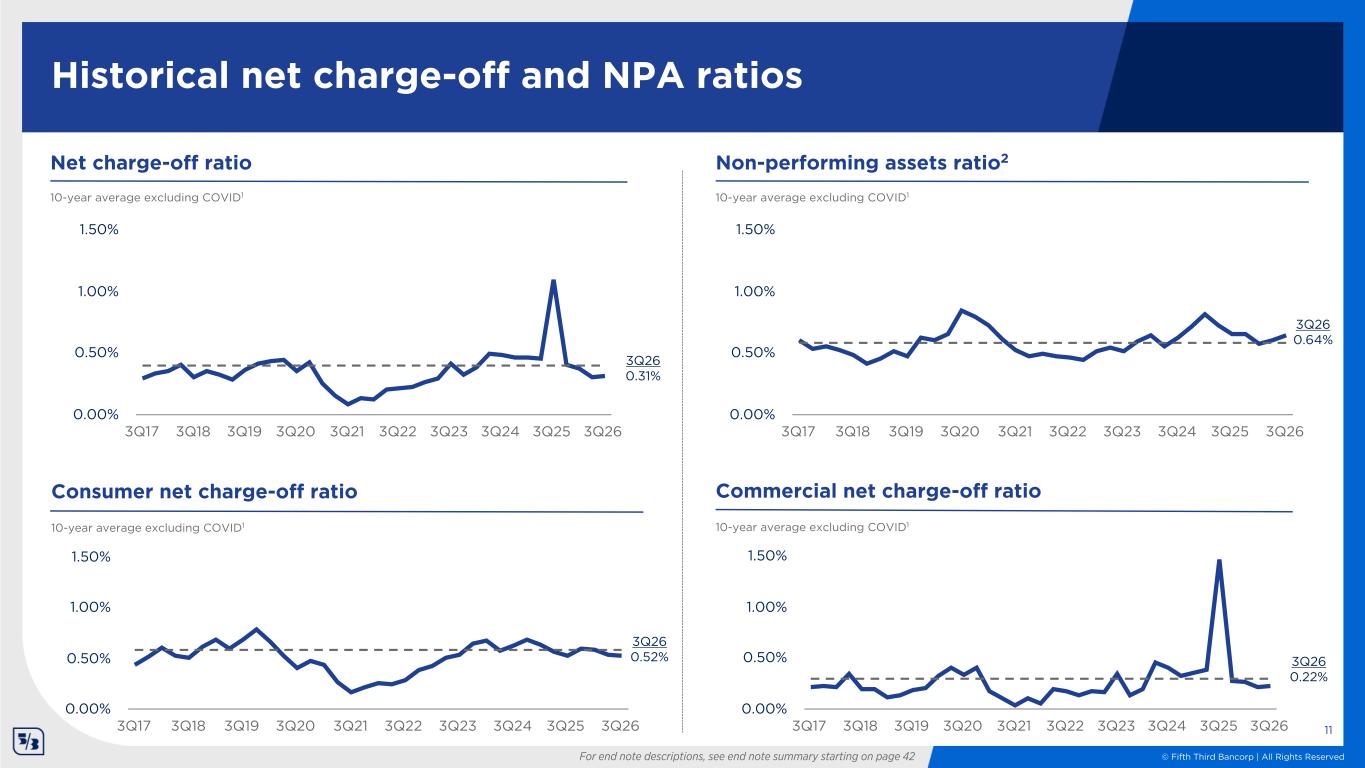
© Fifth Third Bancorp | All Rights Reserved 3Q17 3Q18 3Q19 3Q20 3Q21 3Q22 3Q23 3Q24 3Q25 3Q26 0.00% 0.50% 1.00% 1.50% Historical net charge-off and NPA ratios Net charge-off ratio Non-performing assets ratio2 3Q17 3Q18 3Q19 3Q20 3Q21 3Q22 3Q23 3Q24 3Q25 3Q26 0.00% 0.50% 1.00% 1.50% Commercial net charge-off ratio 3Q17 3Q18 3Q19 3Q20 3Q21 3Q22 3Q23 3Q24 3Q25 3Q26 0.00% 0.50% 1.00% 1.50% 3Q17 3Q18 3Q19 3Q20 3Q21 3Q22 3Q23 3Q24 3Q25 3Q26 0.00% 0.50% 1.00% 1.50% Consumer net charge-off ratio 3Q26 0.22% 3Q26 0.31% 3Q26 0.52% 10-year average excluding COVID1 10-year average excluding COVID1 10-year average excluding COVID1 10-year average excluding COVID1 For end note descriptions, see end note summary starting on page 42 11 3Q26 0.64%
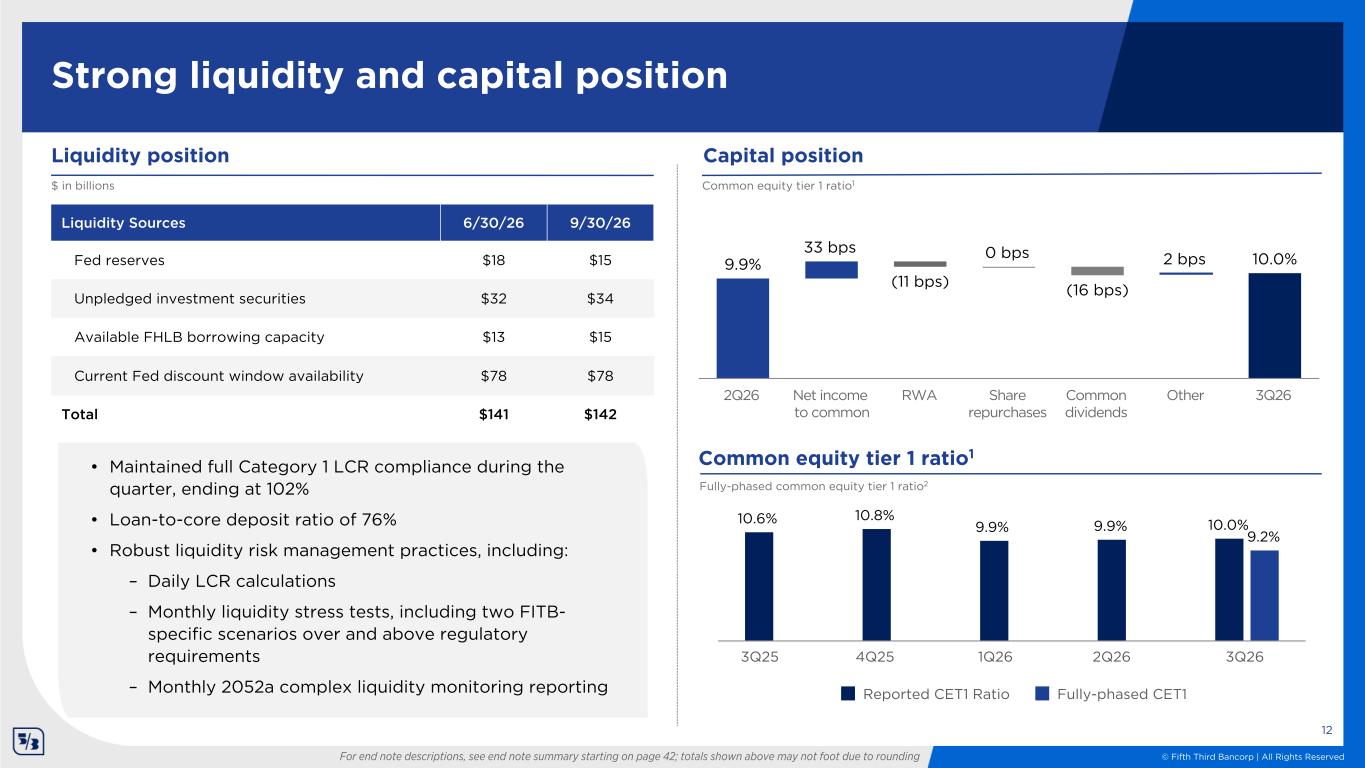
© Fifth Third Bancorp | All Rights Reserved 9.9% 33 bps (11 bps) 0 bps (16 bps) 2 bps 10.0% 2Q26 Net income to common RWA Share repurchases Common dividends Other 3Q26 12 Strong liquidity and capital position Liquidity position $ in billions Capital position Common equity tier 1 ratio1 For end note descriptions, see end note summary starting on page 42; totals shown above may not foot due to rounding Liquidity Sources 6/30/26 9/30/26 Fed reserves $18 $15 Unpledged investment securities $32 $34 Available FHLB borrowing capacity $13 $15 Current Fed discount window availability $78 $78 Total $141 $142 • Maintained full Category 1 LCR compliance during the quarter, ending at 102% • Loan-to-core deposit ratio of 76% • Robust liquidity risk management practices, including: – Daily LCR calculations – Monthly liquidity stress tests, including two FITB- specific scenarios over and above regulatory requirements – Monthly 2052a complex liquidity monitoring reporting Common equity tier 1 ratio1 Fully-phased common equity tier 1 ratio2 10.6% 10.8% 9.9% 9.9% 10.0% 9.2% Reported CET1 Ratio Fully-phased CET1 3Q25 4Q25 1Q26 2Q26 3Q263Q25 4Q25 1Q26 2Q26
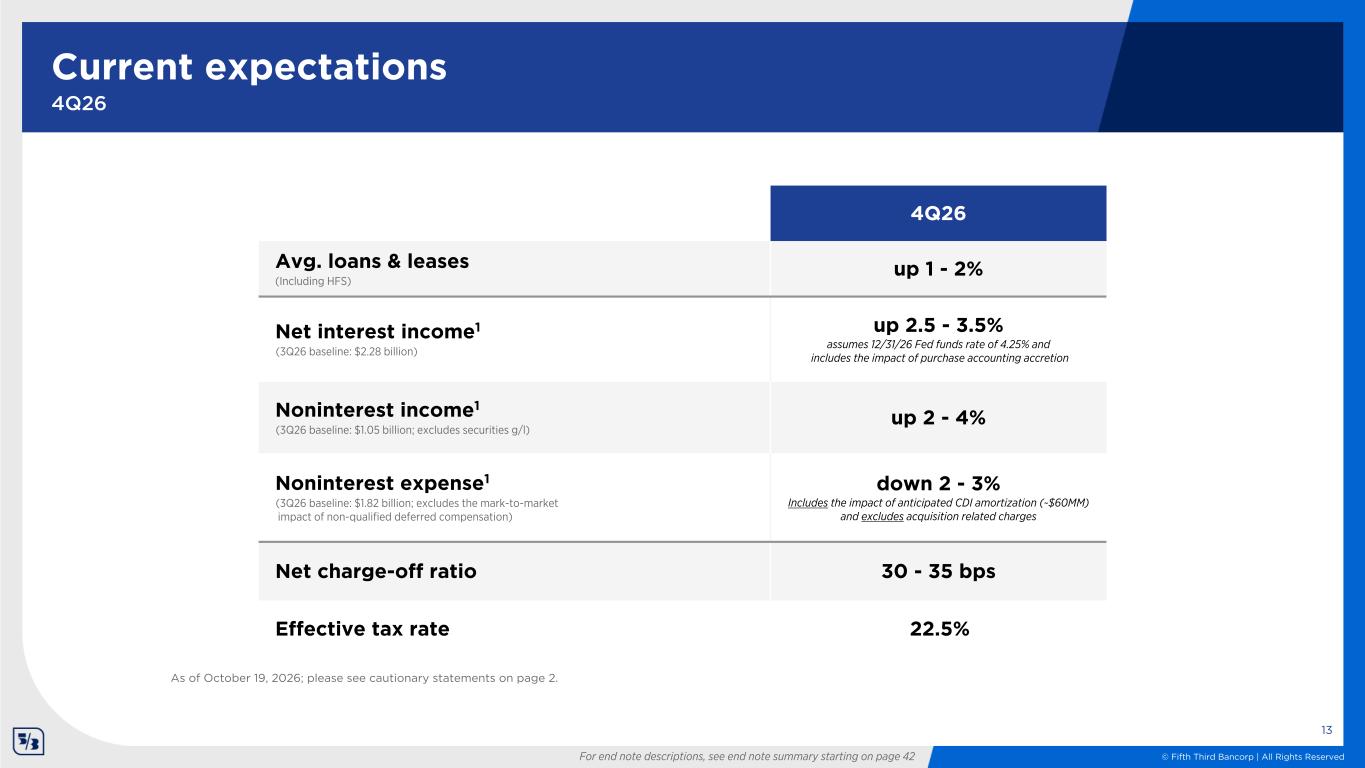
© Fifth Third Bancorp | All Rights Reserved As of October 19, 2026; please see cautionary statements on page 2. Current expectations 4Q26 13 For end note descriptions, see end note summary starting on page 42 4Q26 Avg. loans & leases (Including HFS) up 1 - 2% Net interest income1 (3Q26 baseline: $2.28 billion) up 2.5 - 3.5% assumes 12/31/26 Fed funds rate of 4.25% and includes the impact of purchase accounting accretion Noninterest income1 (3Q26 baseline: $1.05 billion; excludes securities g/l) up 2 - 4% Noninterest expense1 (3Q26 baseline: $1.82 billion; excludes the mark-to-market impact of non-qualified deferred compensation) down 2 - 3% Includes the impact of anticipated CDI amortization (~$60MM) and excludes acquisition related charges Net charge-off ratio 30 - 35 bps Effective tax rate 22.5%

© Fifth Third Bancorp | All Rights Reserved 14 Appendix
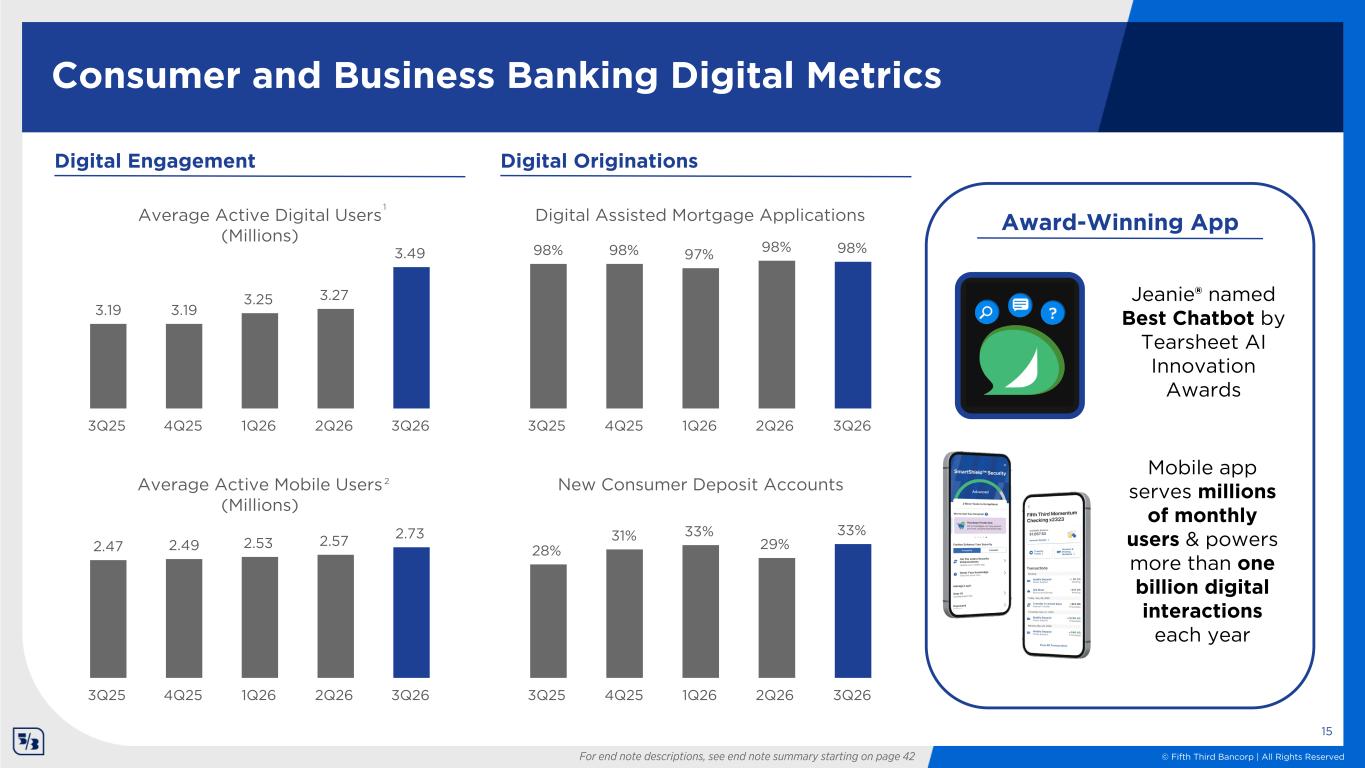
© Fifth Third Bancorp | All Rights Reserved Consumer and Business Banking Digital Metrics Average Active Digital Users (Millions) 3.19 3.19 3.25 3.27 3.49 3Q25 4Q25 1Q26 2Q26 3Q26 Digital Engagement Digital Originations Average Active Mobile Users (Millions) 2.47 2.49 2.53 2.57 2.73 3Q25 4Q25 1Q26 2Q26 3Q26 Digital Assisted Mortgage Applications 98% 98% 97% 98% 98% 3Q25 4Q25 1Q26 2Q26 3Q26 New Consumer Deposit Accounts 28% 31% 33% 29% 33% 3Q25 4Q25 1Q26 2Q26 3Q26 Award-Winning App Jeanie® named Best Chatbot by Tearsheet AI Innovation Awards 15 For end note descriptions, see end note summary starting on page 42 1 2 Mobile app serves millions of monthly users & powers more than one billion digital interactions each year
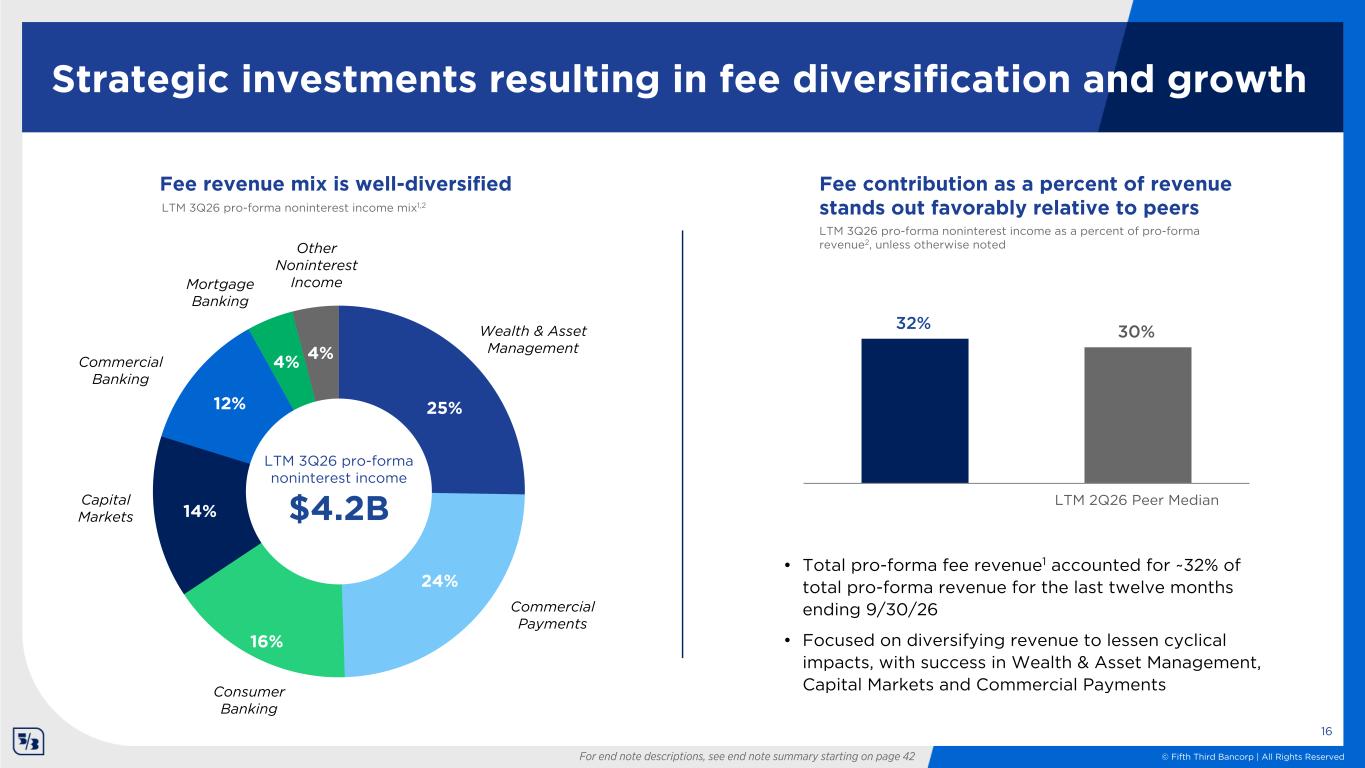
© Fifth Third Bancorp | All Rights Reserved 32% 30% LTM 2Q26 Peer Median 25% 24% 16% 14% 12% 4% 4% Strategic investments resulting in fee diversification and growth • Total pro-forma fee revenue1 accounted for ~32% of total pro-forma revenue for the last twelve months ending 9/30/26 • Focused on diversifying revenue to lessen cyclical impacts, with success in Wealth & Asset Management, Capital Markets and Commercial Payments 16 Fee revenue mix is well-diversified LTM 3Q26 pro-forma noninterest income mix1,2 Wealth & Asset Management Capital Markets Mortgage Banking Other Noninterest Income Consumer Banking Commercial Banking Commercial Payments Fee contribution as a percent of revenue stands out favorably relative to peers LTM 3Q26 pro-forma noninterest income as a percent of pro-forma revenue2, unless otherwise noted LTM 3Q26 pro-forma noninterest income $4.2B For end note descriptions, see end note summary starting on page 42
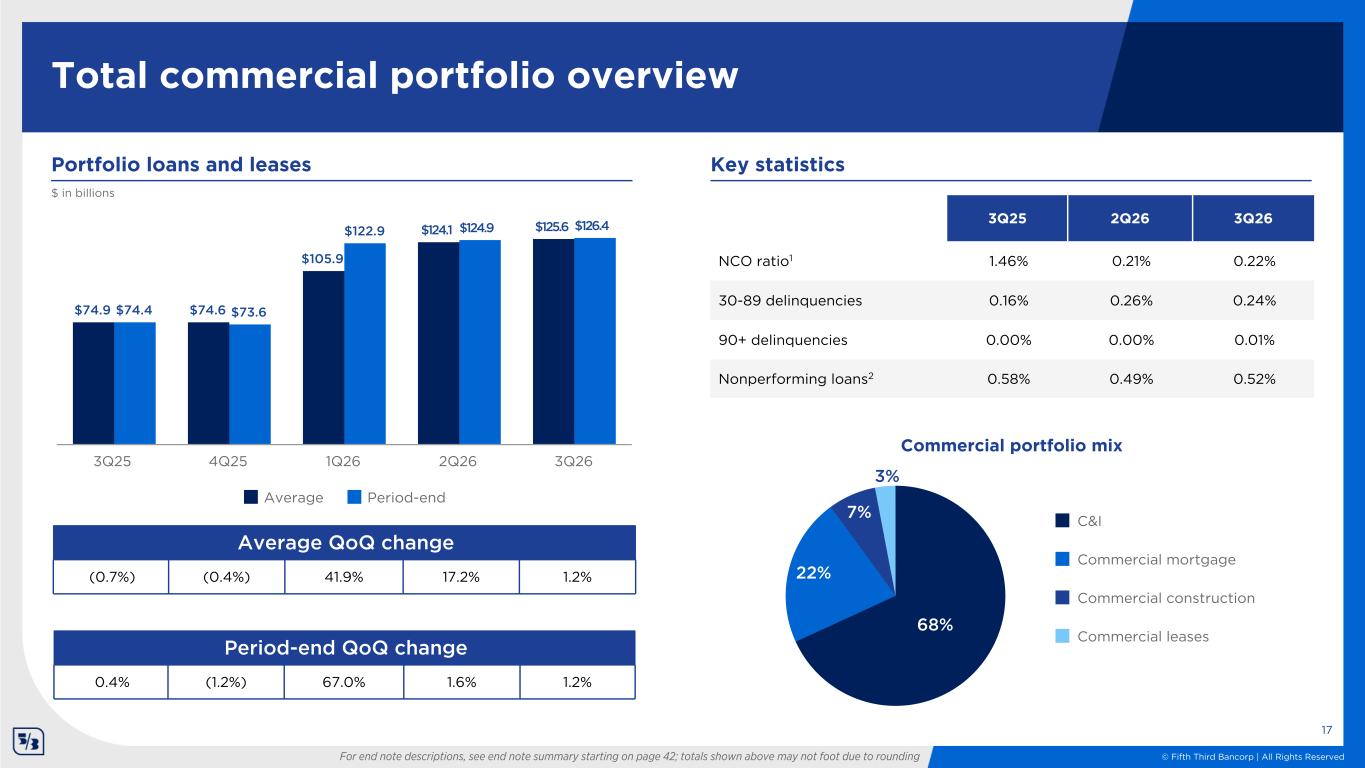
© Fifth Third Bancorp | All Rights Reserved $74.9 $74.6 $105.9 $124.1 $125.6 $74.4 $73.6 $122.9 $124.9 $126.4 Average Period-end 3Q25 4Q25 1Q26 2Q26 3Q26 3Q25 2Q26 3Q26 NCO ratio1 1.46% 0.21% 0.22% 30-89 delinquencies 0.16% 0.26% 0.24% 90+ delinquencies 0.00% 0.00% 0.01% Nonperforming loans2 0.58% 0.49% 0.52% Portfolio loans and leases $ in billions Key statistics Total commercial portfolio overview Average QoQ change (0.7%) (0.4%) 41.9% 17.2% 1.2% Period-end QoQ change 0.4% (1.2%) 67.0% 1.6% 1.2% Commercial portfolio mix 68% 22% 7% 3% C&I Commercial mortgage Commercial construction Commercial leases For end note descriptions, see end note summary starting on page 42; totals shown above may not foot due to rounding 17
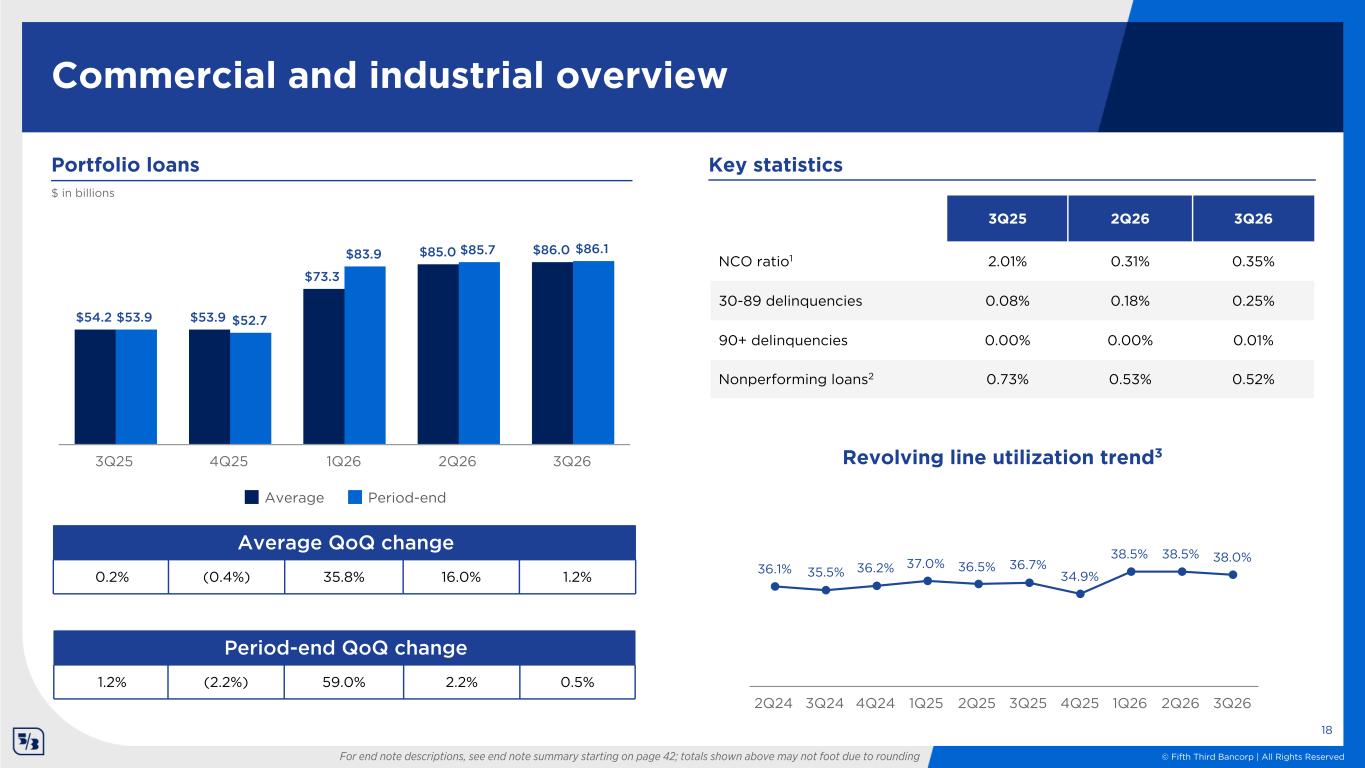
© Fifth Third Bancorp | All Rights Reserved $54.2 $53.9 $73.3 $85.0 $86.0 $53.9 $52.7 $83.9 $85.7 $86.1 Average Period-end 3Q25 4Q25 1Q26 2Q26 3Q26 18 Key statistics Revolving line utilization trend3 Commercial and industrial overview 36.1% 35.5% 36.2% 37.0% 36.5% 36.7% 34.9% 38.5% 38.5% 38.0% 2Q24 3Q24 4Q24 1Q25 2Q25 3Q25 4Q25 1Q26 2Q26 3Q26 Portfolio loans $ in billions Average QoQ change 0.2% (0.4%) 35.8% 16.0% 1.2% Period-end QoQ change 1.2% (2.2%) 59.0% 2.2% 0.5% For end note descriptions, see end note summary starting on page 42; totals shown above may not foot due to rounding 3Q25 2Q26 3Q26 NCO ratio1 2.01% 0.31% 0.35% 30-89 delinquencies 0.08% 0.18% 0.25% 90+ delinquencies 0.00% 0.00% 0.01% Nonperforming loans2 0.73% 0.53% 0.52%
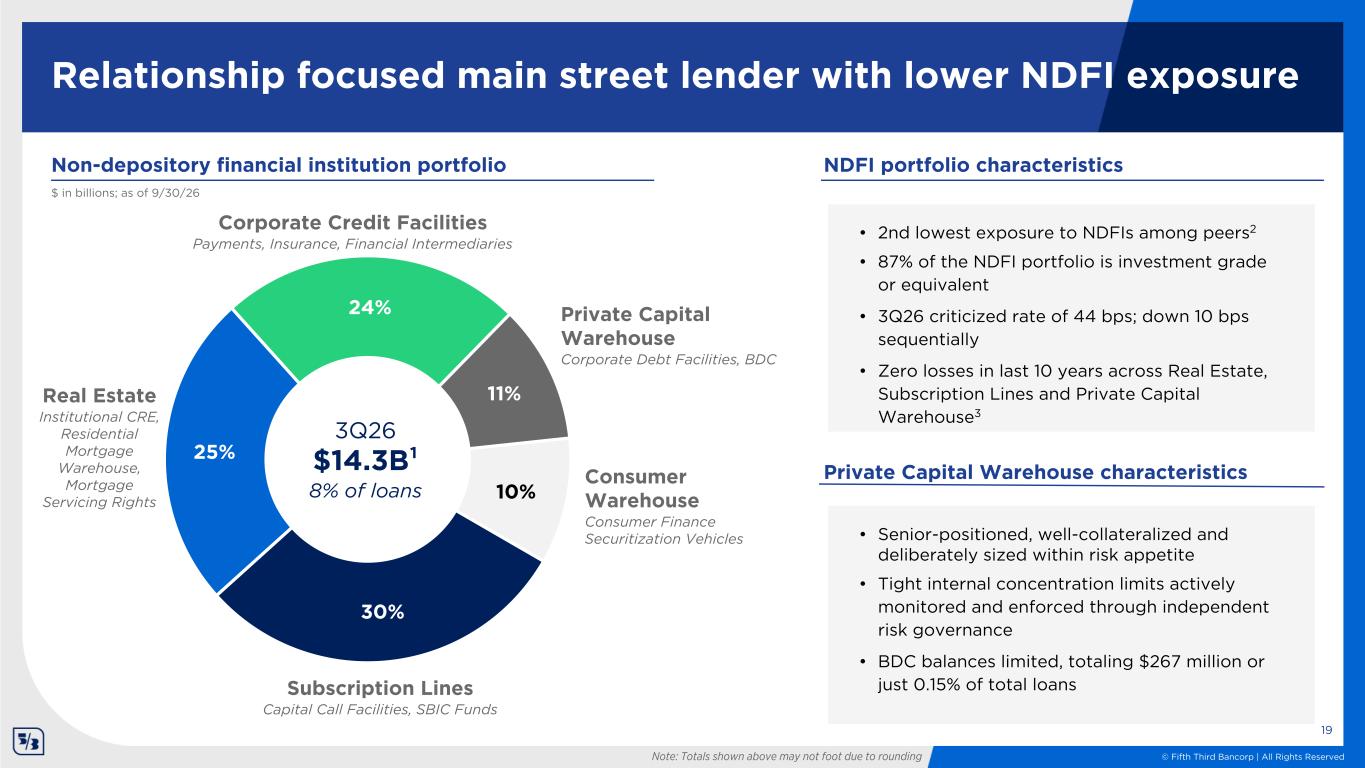
© Fifth Third Bancorp | All Rights Reserved Note: Totals shown above may not foot due to rounding Non-depository financial institution portfolio 30% 25% 24% 11% 10% NDFI portfolio characteristics 3Q26 $14.3B¹ 8% of loans $ in billions; as of 9/30/26 Consumer Warehouse Consumer Finance Securitization Vehicles Real Estate Institutional CRE, Residential Mortgage Warehouse, Mortgage Servicing Rights Private Capital Warehouse Corporate Debt Facilities, BDC Subscription Lines Capital Call Facilities, SBIC Funds Corporate Credit Facilities Payments, Insurance, Financial Intermediaries Relationship focused main street lender with lower NDFI exposure Private Capital Warehouse characteristics • 2nd lowest exposure to NDFIs among peers2 • 87% of the NDFI portfolio is investment grade or equivalent • 3Q26 criticized rate of 44 bps; down 10 bps sequentially • Zero losses in last 10 years across Real Estate, Subscription Lines and Private Capital Warehouse3 • Senior-positioned, well-collateralized and deliberately sized within risk appetite • Tight internal concentration limits actively monitored and enforced through independent risk governance • BDC balances limited, totaling $267 million or just 0.15% of total loans 19
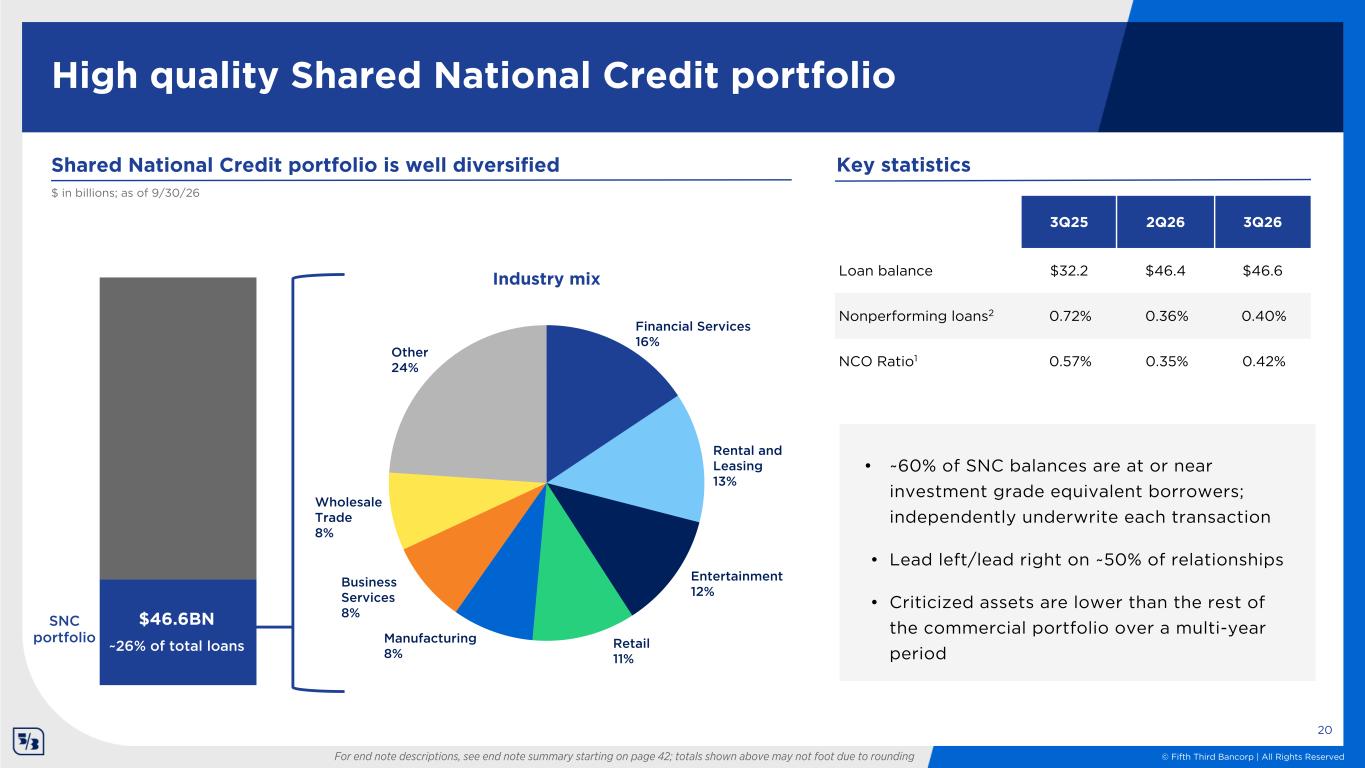
© Fifth Third Bancorp | All Rights Reserved Financial Services 16% Rental and Leasing 13% Entertainment 12% Retail 11% Manufacturing 8% Business Services 8% Wholesale Trade 8% Other 24% 20 High quality Shared National Credit portfolio SNC portfolio $46.6BN ~26% of total loans Shared National Credit portfolio is well diversified Industry mix Key statistics For end note descriptions, see end note summary starting on page 42; totals shown above may not foot due to rounding $ in billions; as of 9/30/26 • ~60% of SNC balances are at or near investment grade equivalent borrowers; independently underwrite each transaction • Lead left/lead right on ~50% of relationships • Criticized assets are lower than the rest of the commercial portfolio over a multi-year period 3Q25 2Q26 3Q26 Loan balance $32.2 $46.4 $46.6 Nonperforming loans2 0.72% 0.36% 0.40% NCO Ratio1 0.57% 0.35% 0.42%
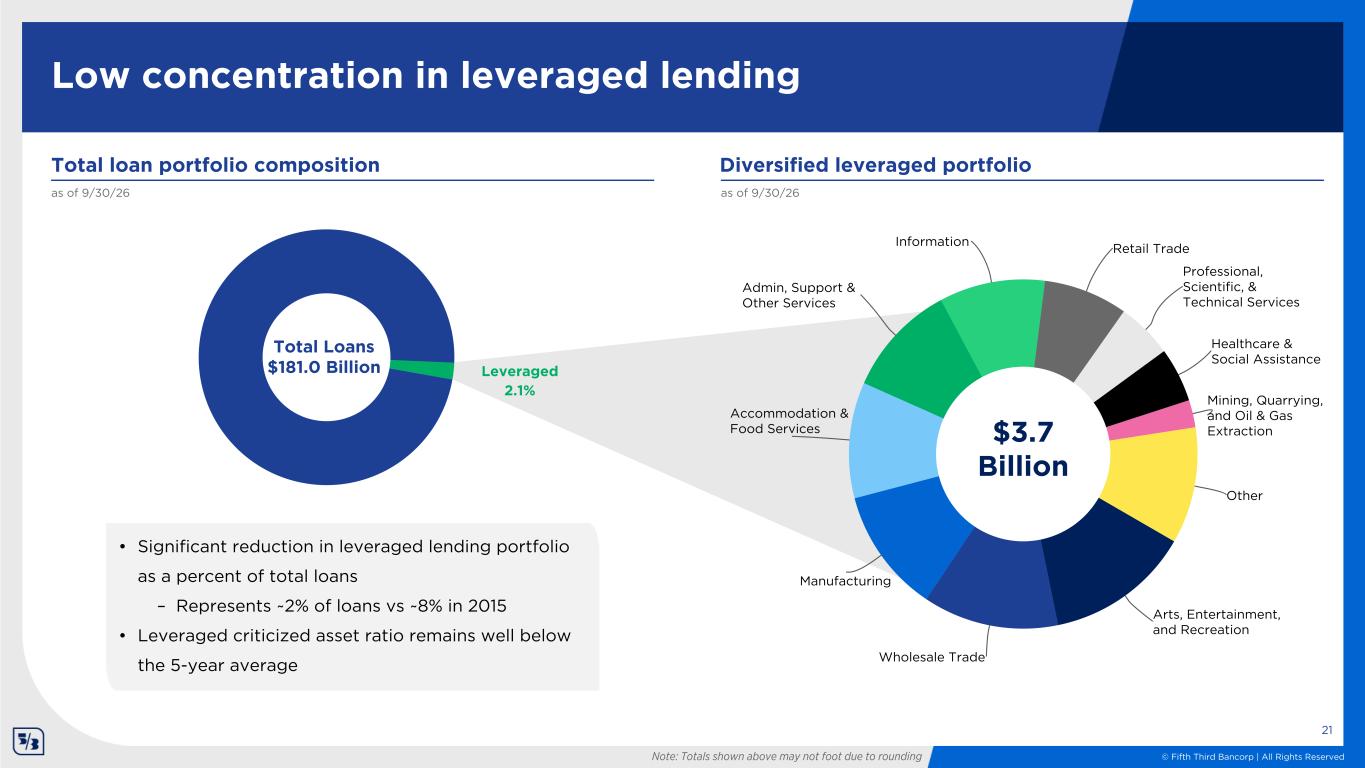
© Fifth Third Bancorp | All Rights Reserved 21 Low concentration in leveraged lending Note: Totals shown above may not foot due to rounding Total loan portfolio composition Arts, Entertainment, and Recreation Wholesale Trade Manufacturing Accommodation & Food Services Admin, Support & Other Services Information Retail Trade Professional, Scientific, & Technical Services Healthcare & Social Assistance Mining, Quarrying, and Oil & Gas Extraction Other Diversified leveraged portfolio Total Loans $181.0 Billion as of 9/30/26 as of 9/30/26 • Significant reduction in leveraged lending portfolio as a percent of total loans – Represents ~2% of loans vs ~8% in 2015 • Leveraged criticized asset ratio remains well below the 5-year average Leveraged 2.1% $3.7 Billion
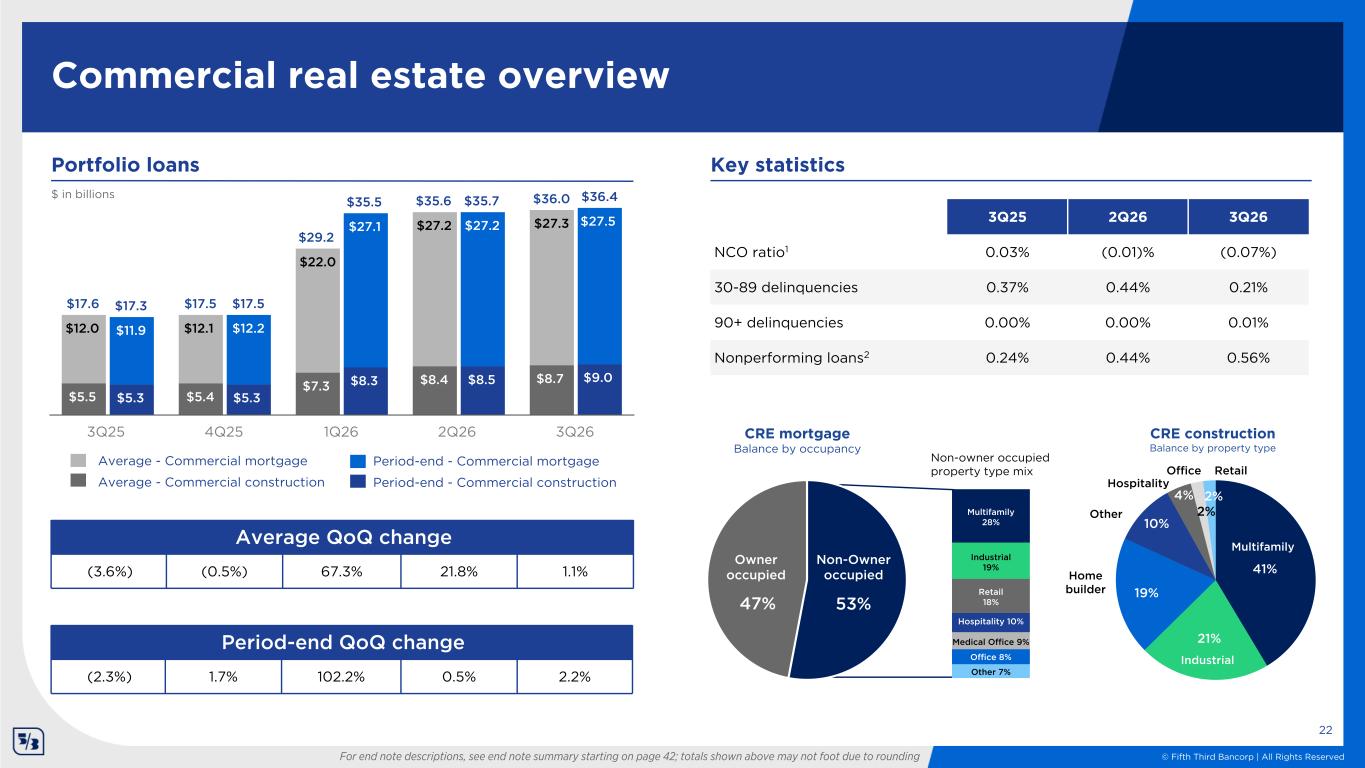
© Fifth Third Bancorp | All Rights Reserved Portfolio loans 41% 21% 19% 10% 4% 2% 2% 53%47% Commercial real estate overview CRE mortgage Balance by occupancy CRE construction Balance by property type Industrial RetailOffice Hospitality Other Home builder Non-Owner occupied Owner occupied Multifamily 28% Industrial 19% Retail 18% Medical Office 9% Office 8% Non-owner occupied property type mix $17.6 $17.5 $29.2 $35.6 $36.0 $17.3 $17.5 $35.5 $35.7 $36.4 $5.5 $5.4 $7.3 $8.4 $8.7 $12.0 $12.1 $22.0 $27.2 $27.3 $5.3 $5.3 $8.3 $8.5 $9.0 $11.9 $12.2 $27.1 $27.2 $27.5 3Q25 4Q25 1Q26 2Q26 3Q26 22 Other 7% For end note descriptions, see end note summary starting on page 42; totals shown above may not foot due to rounding Period-end QoQ change (2.3%) 1.7% 102.2% 0.5% 2.2% $ in billions Average QoQ change (3.6%) (0.5%) 67.3% 21.8% 1.1% 3Q25 2Q26 3Q26 NCO ratio1 0.03% (0.01)% (0.07%) 30-89 delinquencies 0.37% 0.44% 0.21% 90+ delinquencies 0.00% 0.00% 0.01% Nonperforming loans2 0.24% 0.44% 0.56% Key statistics Period-end - Commercial mortgageAverage - Commercial mortgage Period-end - Commercial constructionAverage - Commercial construction Multifamily Hospitality 10%
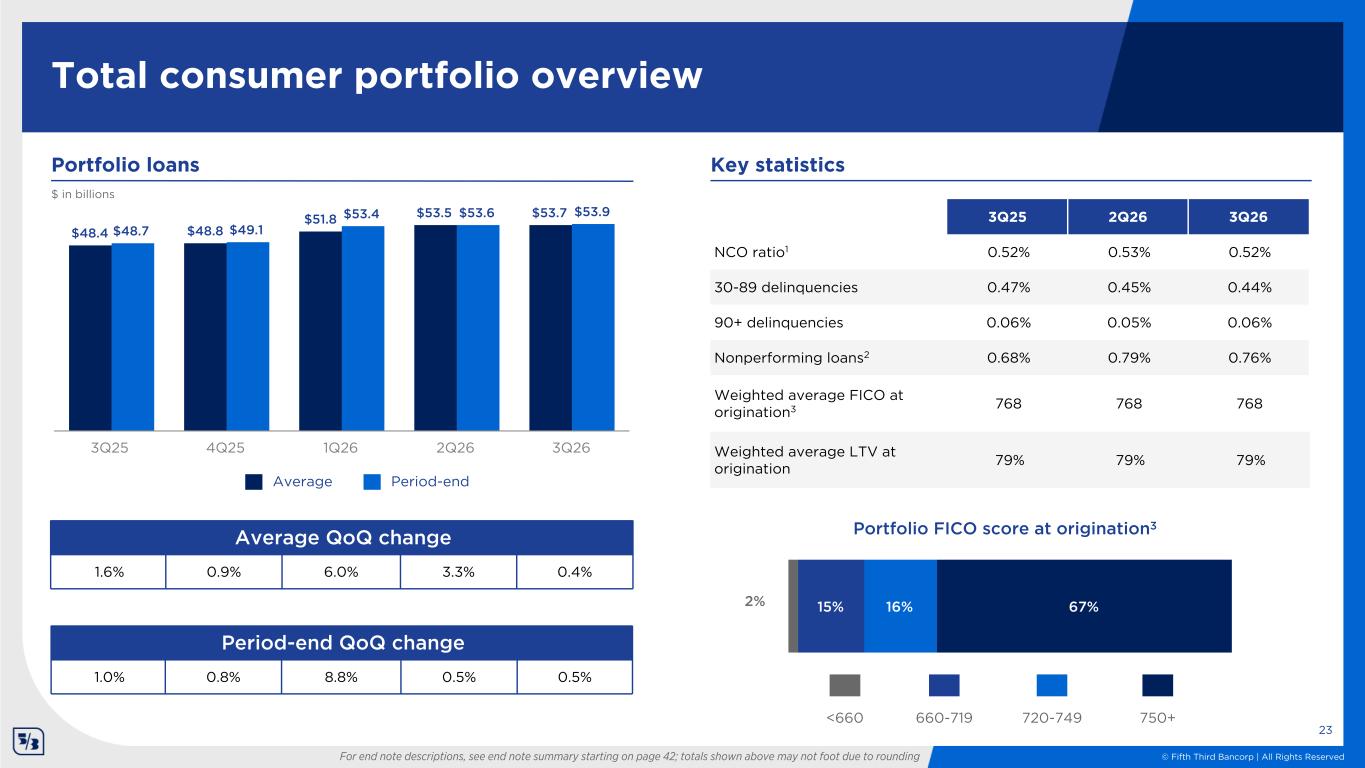
© Fifth Third Bancorp | All Rights Reserved Period-end QoQ change 1.0% 0.8% 8.8% 0.5% 0.5% $48.4 $48.8 $51.8 $53.5 $53.7 $48.7 $49.1 $53.4 $53.6 $53.9 3Q25 4Q25 1Q26 2Q26 3Q26 15% 16% 67% 3Q25 2Q26 3Q26 NCO ratio1 0.52% 0.53% 0.52% 30-89 delinquencies 0.47% 0.45% 0.44% 90+ delinquencies 0.06% 0.05% 0.06% Nonperforming loans2 0.68% 0.79% 0.76% Weighted average FICO at origination3 768 768 768 Weighted average LTV at origination 79% 79% 79% Total consumer portfolio overview 23 Portfolio FICO score at origination3 $ in billions Portfolio loans 2% For end note descriptions, see end note summary starting on page 42; totals shown above may not foot due to rounding Average QoQ change 1.6% 0.9% 6.0% 3.3% 0.4% Key statistics 750+720-749<660 660-719 Period-endAverage
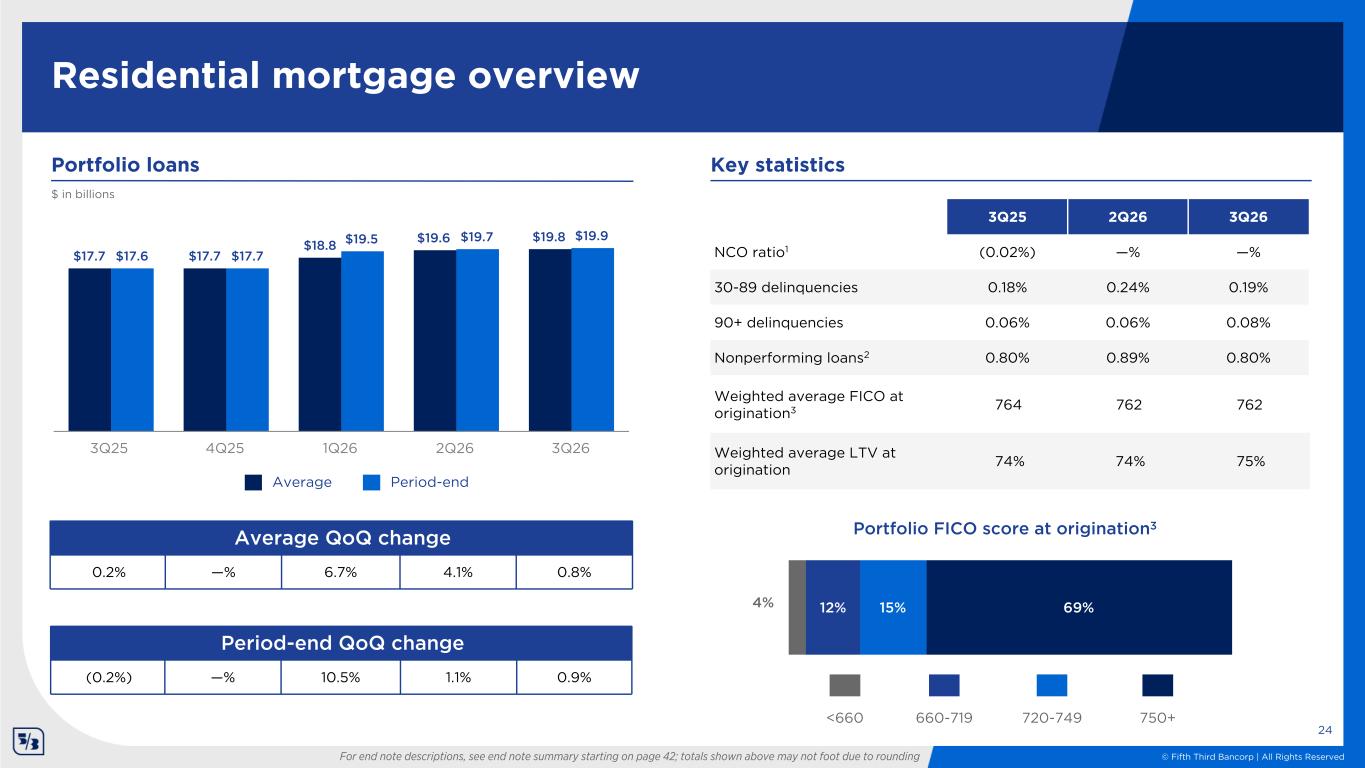
© Fifth Third Bancorp | All Rights Reserved Period-end QoQ change (0.2%) —% 10.5% 1.1% 0.9% Average QoQ change 0.2% —% 6.7% 4.1% 0.8% 12% 15% 69% Weighted average FICO at origination3 764 762 762 Weighted average LTV at origination 74% 74% 75% Residential mortgage overview 24 $17.7 $17.7 $18.8 $19.6 $19.8 $17.6 $17.7 $19.5 $19.7 $19.9 3Q25 4Q25 1Q26 2Q26 3Q26 4% For end note descriptions, see end note summary starting on page 42; totals shown above may not foot due to rounding $ in billions Portfolio loans 3Q25 2Q26 3Q26 NCO ratio1 (0.02%) —% —% 30-89 delinquencies 0.18% 0.24% 0.19% 90+ delinquencies 0.06% 0.06% 0.08% Nonperforming loans2 0.80% 0.89% 0.80% Key statistics 750+720-749<660 660-719 Portfolio FICO score at origination3 Period-endAverage
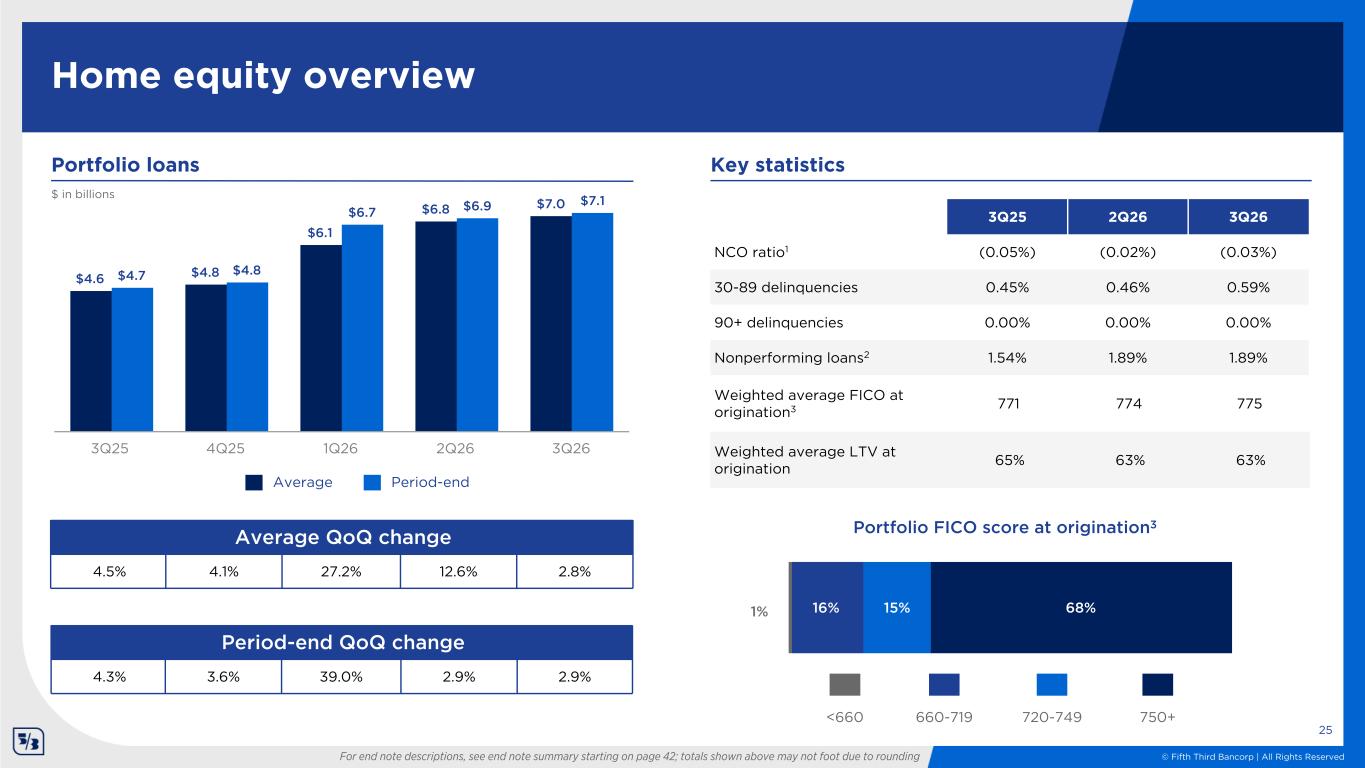
© Fifth Third Bancorp | All Rights Reserved 16% 15% 68% $4.6 $4.8 $6.1 $6.8 $7.0 $4.7 $4.8 $6.7 $6.9 $7.1 3Q25 4Q25 1Q26 2Q26 3Q26 Weighted average FICO at origination3 771 774 775 Weighted average LTV at origination 65% 63% 63% Home equity overview 25 1% For end note descriptions, see end note summary starting on page 42; totals shown above may not foot due to rounding Period-end QoQ change 4.3% 3.6% 39.0% 2.9% 2.9% Average QoQ change 4.5% 4.1% 27.2% 12.6% 2.8% $ in billions Portfolio loans Period-endAverage 750+720-749<660 660-719 Portfolio FICO score at origination3 3Q25 2Q26 3Q26 NCO ratio1 (0.05%) (0.02%) (0.03%) 30-89 delinquencies 0.45% 0.46% 0.59% 90+ delinquencies 0.00% 0.00% 0.00% Nonperforming loans2 1.54% 1.89% 1.89% Key statistics
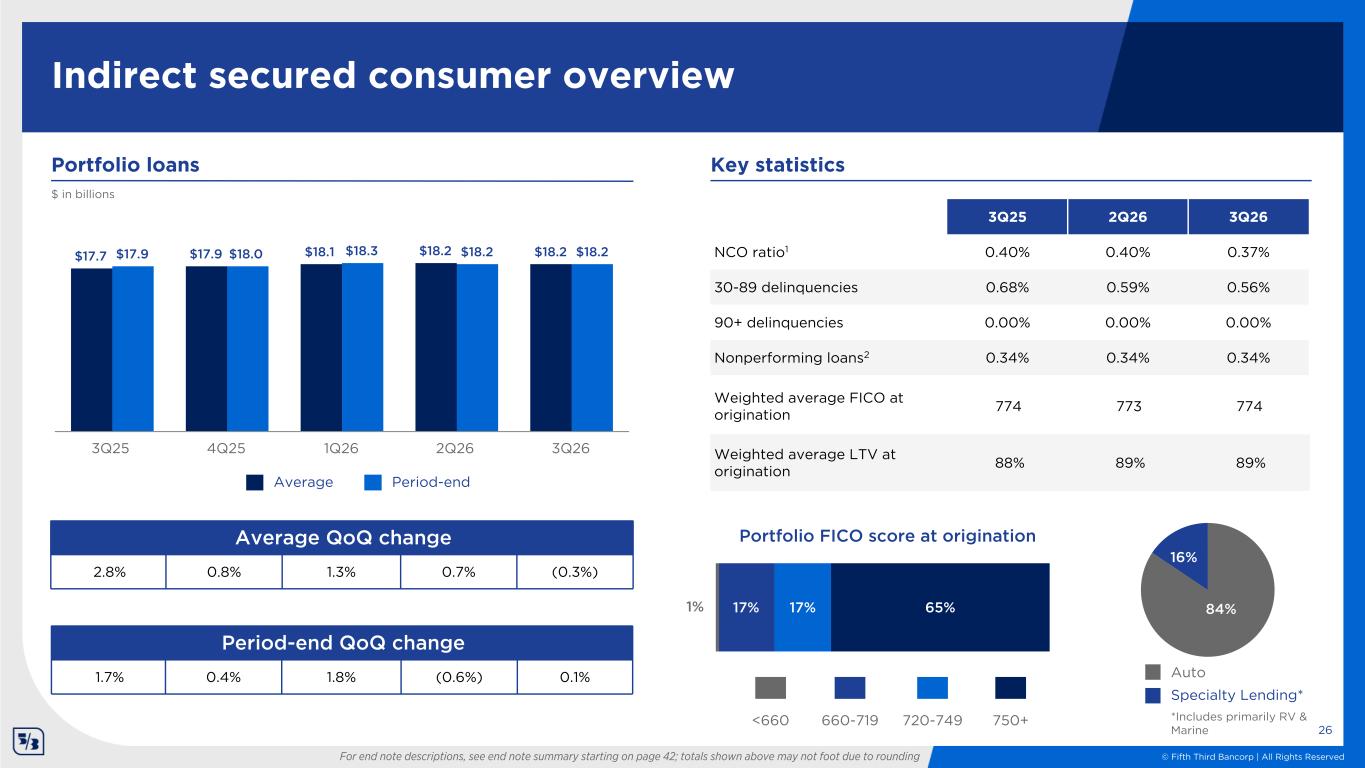
© Fifth Third Bancorp | All Rights Reserved 84% 16% 17% 17% 65% Indirect secured consumer overview 26 Portfolio FICO score at origination *Includes primarily RV & Marine $17.7 $17.9 $18.1 $18.2 $18.2$17.9 $18.0 $18.3 $18.2 $18.2 3Q25 4Q25 1Q26 2Q26 3Q26 1% Weighted average FICO at origination 774 773 774 Weighted average LTV at origination 88% 89% 89% For end note descriptions, see end note summary starting on page 42; totals shown above may not foot due to rounding Period-end QoQ change 1.7% 0.4% 1.8% (0.6%) 0.1% Average QoQ change 2.8% 0.8% 1.3% 0.7% (0.3%) $ in billions Portfolio loans Period-endAverage 3Q25 2Q26 3Q26 NCO ratio1 0.40% 0.40% 0.37% 30-89 delinquencies 0.68% 0.59% 0.56% 90+ delinquencies 0.00% 0.00% 0.00% Nonperforming loans2 0.34% 0.34% 0.34% Key statistics 750+720-749<660 660-719 Portfolio FICO score at origination Auto Specialty Lending*
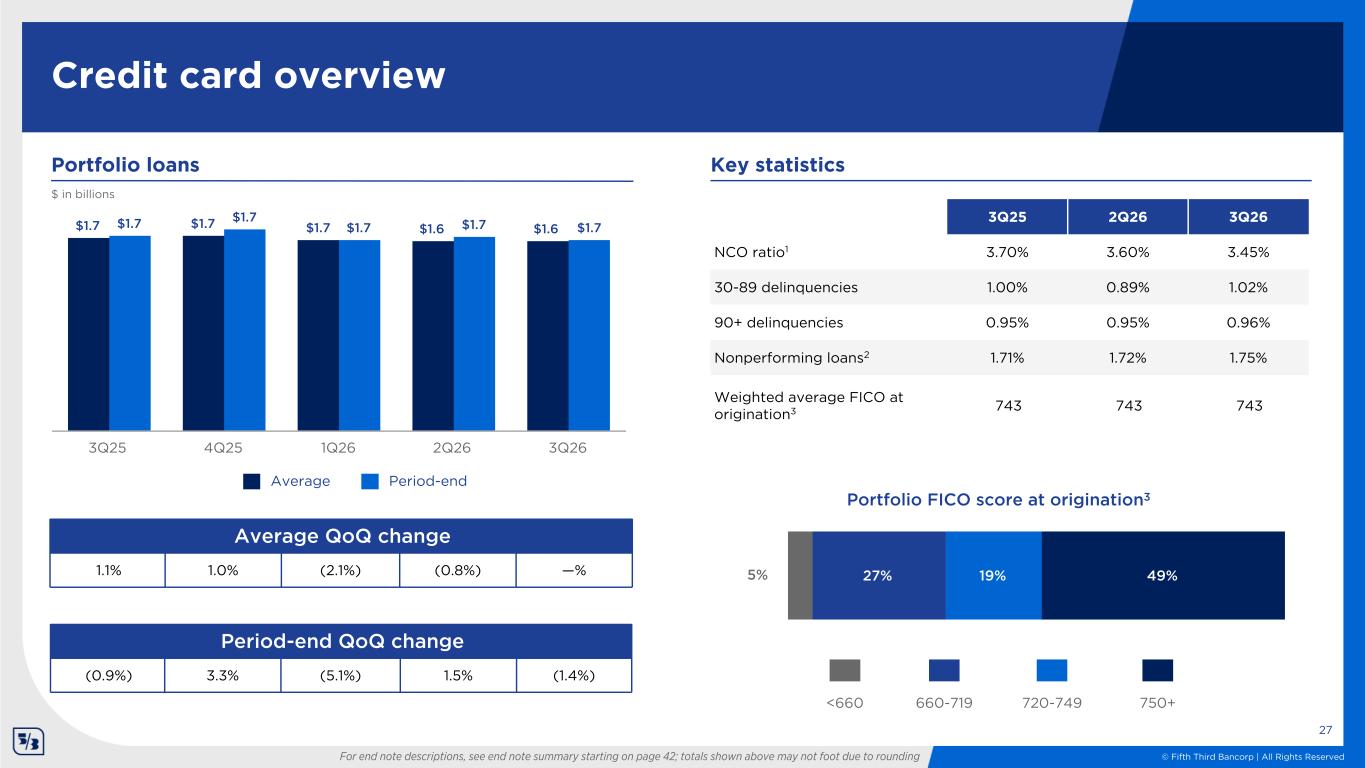
© Fifth Third Bancorp | All Rights Reserved 27% 19% 49% Credit card overview 27 $1.7 $1.7 $1.7 $1.6 $1.6$1.7 $1.7 $1.7 $1.7 $1.7 3Q25 4Q25 1Q26 2Q26 3Q26 Weighted average FICO at origination3 743 743 743 5% Period-end QoQ change (0.9%) 3.3% (5.1%) 1.5% (1.4%) Average QoQ change 1.1% 1.0% (2.1%) (0.8%) —% $ in billions Portfolio loans For end note descriptions, see end note summary starting on page 42; totals shown above may not foot due to rounding Period-endAverage 3Q25 2Q26 3Q26 NCO ratio1 3.70% 3.60% 3.45% 30-89 delinquencies 1.00% 0.89% 1.02% 90+ delinquencies 0.95% 0.95% 0.96% Nonperforming loans2 1.71% 1.72% 1.75% Key statistics Portfolio FICO score at origination3 750+720-749<660 660-719
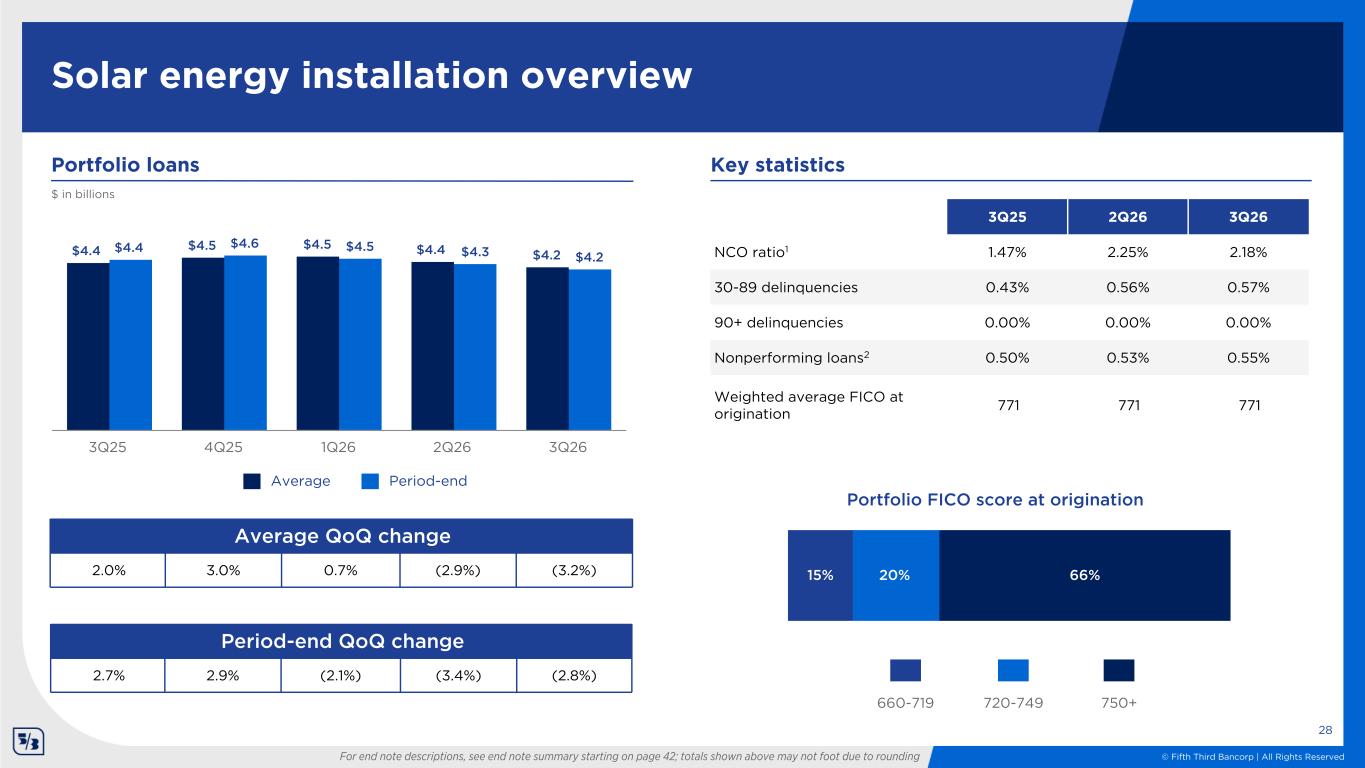
© Fifth Third Bancorp | All Rights Reserved $4.4 $4.5 $4.5 $4.4 $4.2$4.4 $4.6 $4.5 $4.3 $4.2 3Q25 4Q25 1Q26 2Q26 3Q26 15% 20% 66% Weighted average FICO at origination 771 771 771 Solar energy installation overview 28 For end note descriptions, see end note summary starting on page 42; totals shown above may not foot due to rounding Period-end QoQ change 2.7% 2.9% (2.1%) (3.4%) (2.8%) Average QoQ change 2.0% 3.0% 0.7% (2.9%) (3.2%) $ in billions Portfolio loans 3Q25 2Q26 3Q26 NCO ratio1 1.47% 2.25% 2.18% 30-89 delinquencies 0.43% 0.56% 0.57% 90+ delinquencies 0.00% 0.00% 0.00% Nonperforming loans2 0.50% 0.53% 0.55% Key statistics Period-endAverage Portfolio FICO score at origination 750+720-749660-719
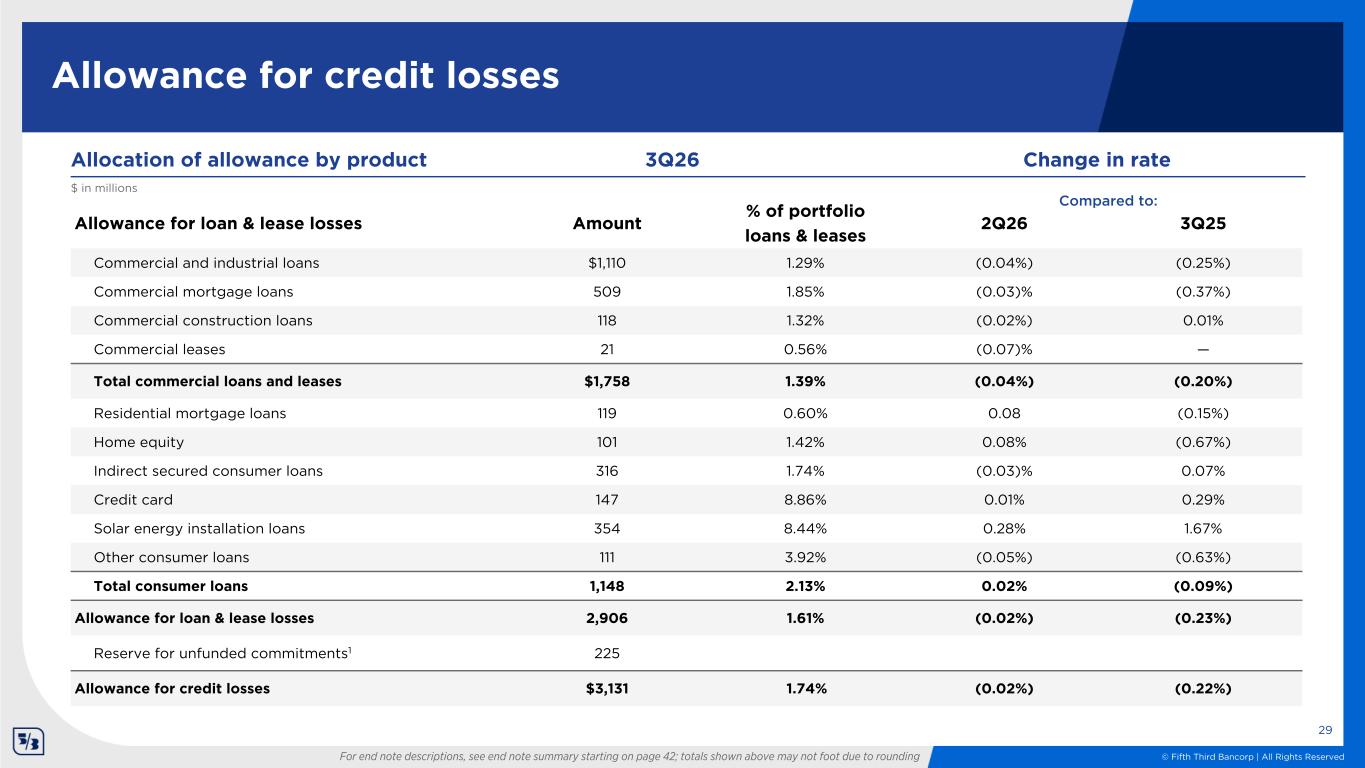
© Fifth Third Bancorp | All Rights Reserved Allowance for credit losses 29 For end note descriptions, see end note summary starting on page 42; totals shown above may not foot due to rounding Allowance for loan & lease losses Amount % of portfolio loans & leases 2Q26 3Q25 Commercial and industrial loans $1,110 1.29% (0.04%) (0.25%) Commercial mortgage loans 509 1.85% (0.03)% (0.37%) Commercial construction loans 118 1.32% (0.02%) 0.01% Commercial leases 21 0.56% (0.07)% — Total commercial loans and leases $1,758 1.39% (0.04%) (0.20%) Residential mortgage loans 119 0.60% 0.08 (0.15%) Home equity 101 1.42% 0.08% (0.67%) Indirect secured consumer loans 316 1.74% (0.03)% 0.07% Credit card 147 8.86% 0.01% 0.29% Solar energy installation loans 354 8.44% 0.28% 1.67% Other consumer loans 111 3.92% (0.05%) (0.63%) Total consumer loans 1,148 2.13% 0.02% (0.09%) Allowance for loan & lease losses 2,906 1.61% (0.02%) (0.23%) Reserve for unfunded commitments1 225 Allowance for credit losses $3,131 1.74% (0.02%) (0.22%) Compared to: Allocation of allowance by product $ in millions 3Q26 Change in rate
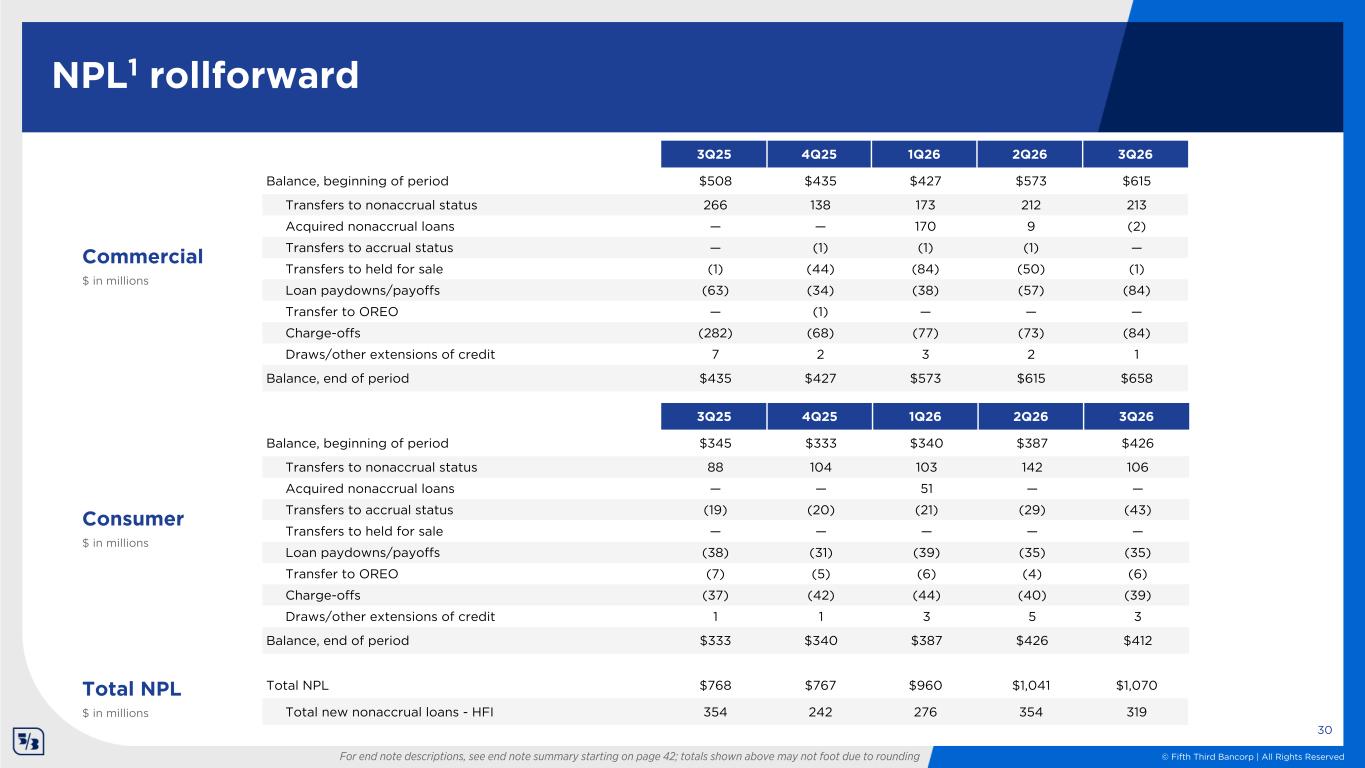
© Fifth Third Bancorp | All Rights Reserved NPL1 rollforward 30 For end note descriptions, see end note summary starting on page 42; totals shown above may not foot due to rounding 3Q25 4Q25 1Q26 2Q26 3Q26 Balance, beginning of period $508 $435 $427 $573 $615 Transfers to nonaccrual status 266 138 173 212 213 Acquired nonaccrual loans — — 170 9 (2) Transfers to accrual status — (1) (1) (1) — Transfers to held for sale (1) (44) (84) (50) (1) Loan paydowns/payoffs (63) (34) (38) (57) (84) Transfer to OREO — (1) — — — Charge-offs (282) (68) (77) (73) (84) Draws/other extensions of credit 7 2 3 2 1 Balance, end of period $435 $427 $573 $615 $658 3Q25 4Q25 1Q26 2Q26 3Q26 Balance, beginning of period $345 $333 $340 $387 $426 Transfers to nonaccrual status 88 104 103 142 106 Acquired nonaccrual loans — — 51 — — Transfers to accrual status (19) (20) (21) (29) (43) Transfers to held for sale — — — — — Loan paydowns/payoffs (38) (31) (39) (35) (35) Transfer to OREO (7) (5) (6) (4) (6) Charge-offs (37) (42) (44) (40) (39) Draws/other extensions of credit 1 1 3 5 3 Balance, end of period $333 $340 $387 $426 $412 Commercial $ in millions Consumer $ in millions Total NPL $768 $767 $960 $1,041 $1,070 Total new nonaccrual loans - HFI 354 242 276 354 319 Total NPL $ in millions
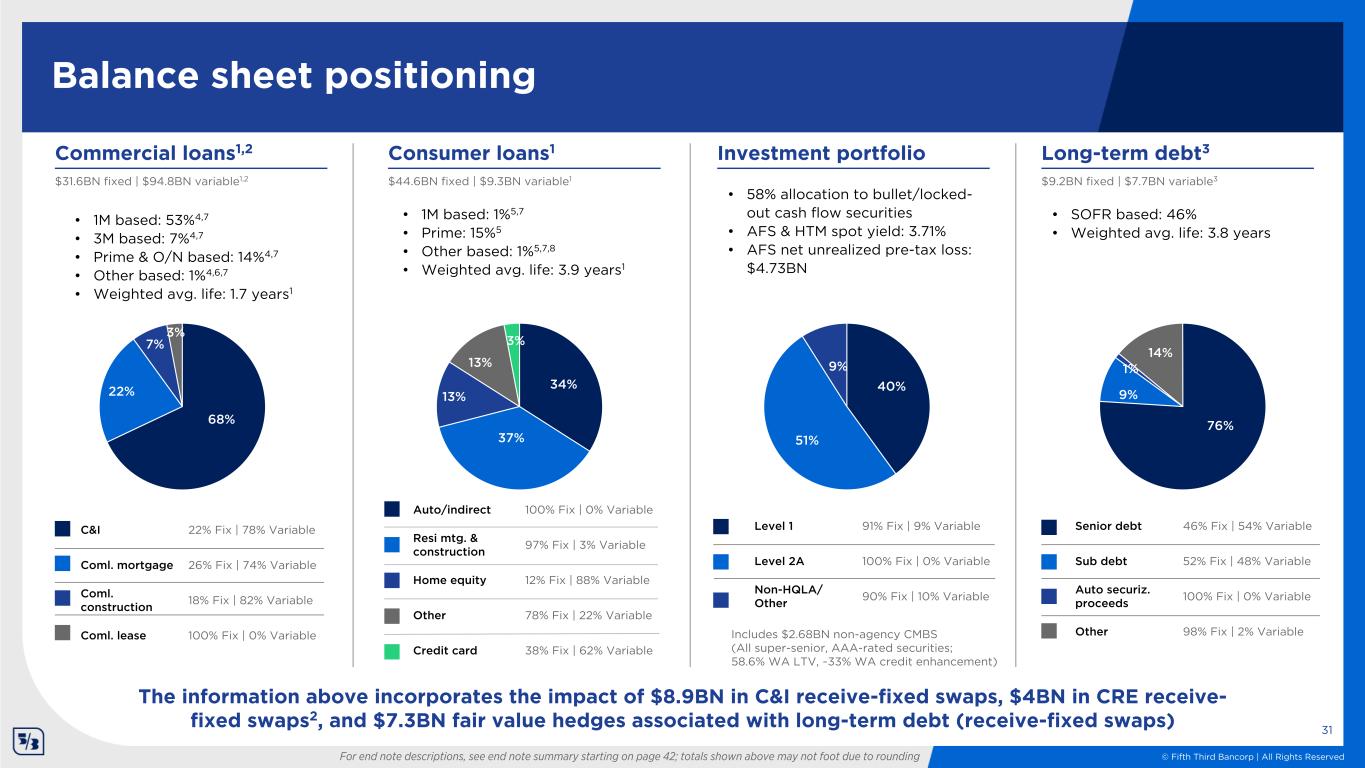
© Fifth Third Bancorp | All Rights Reserved Balance sheet positioning 31 For end note descriptions, see end note summary starting on page 42; totals shown above may not foot due to rounding C&I 22% Fix | 78% Variable Coml. mortgage 26% Fix | 74% Variable Coml. construction 18% Fix | 82% Variable Coml. lease 100% Fix | 0% Variable 40% 51% 9% 68% 22% 7% 3% • 58% allocation to bullet/locked- out cash flow securities • AFS & HTM spot yield: 3.71% • AFS net unrealized pre-tax loss: $4.73BN $31.6BN fixed | $94.8BN variable1,2 Commercial loans1,2 Investment portfolioConsumer loans1 Long-term debt3 $44.6BN fixed | $9.3BN variable1 $9.2BN fixed | $7.7BN variable3 • 1M based: 53%4,7 • 3M based: 7%4,7 • Prime & O/N based: 14%4,7 • Other based: 1%4,6,7 • Weighted avg. life: 1.7 years1 • 1M based: 1%5,7 • Prime: 15%5 • Other based: 1%5,7,8 • Weighted avg. life: 3.9 years1 • SOFR based: 46% • Weighted avg. life: 3.8 years Includes $2.68BN non-agency CMBS (All super-senior, AAA-rated securities; 58.6% WA LTV, ~33% WA credit enhancement) 34% 37% 13% 13% 3% 76% 9% 1% 14% The information above incorporates the impact of $8.9BN in C&I receive-fixed swaps, $4BN in CRE receive- fixed swaps2, and $7.3BN fair value hedges associated with long-term debt (receive-fixed swaps) Auto/indirect 100% Fix | 0% Variable Resi mtg. & construction 97% Fix | 3% Variable Home equity 12% Fix | 88% Variable Other 78% Fix | 22% Variable Credit card 38% Fix | 62% Variable Level 1 91% Fix | 9% Variable Level 2A 100% Fix | 0% Variable Non-HQLA/ Other 90% Fix | 10% Variable Senior debt 46% Fix | 54% Variable Sub debt 52% Fix | 48% Variable Auto securiz. proceeds 100% Fix | 0% Variable Other 98% Fix | 2% Variable
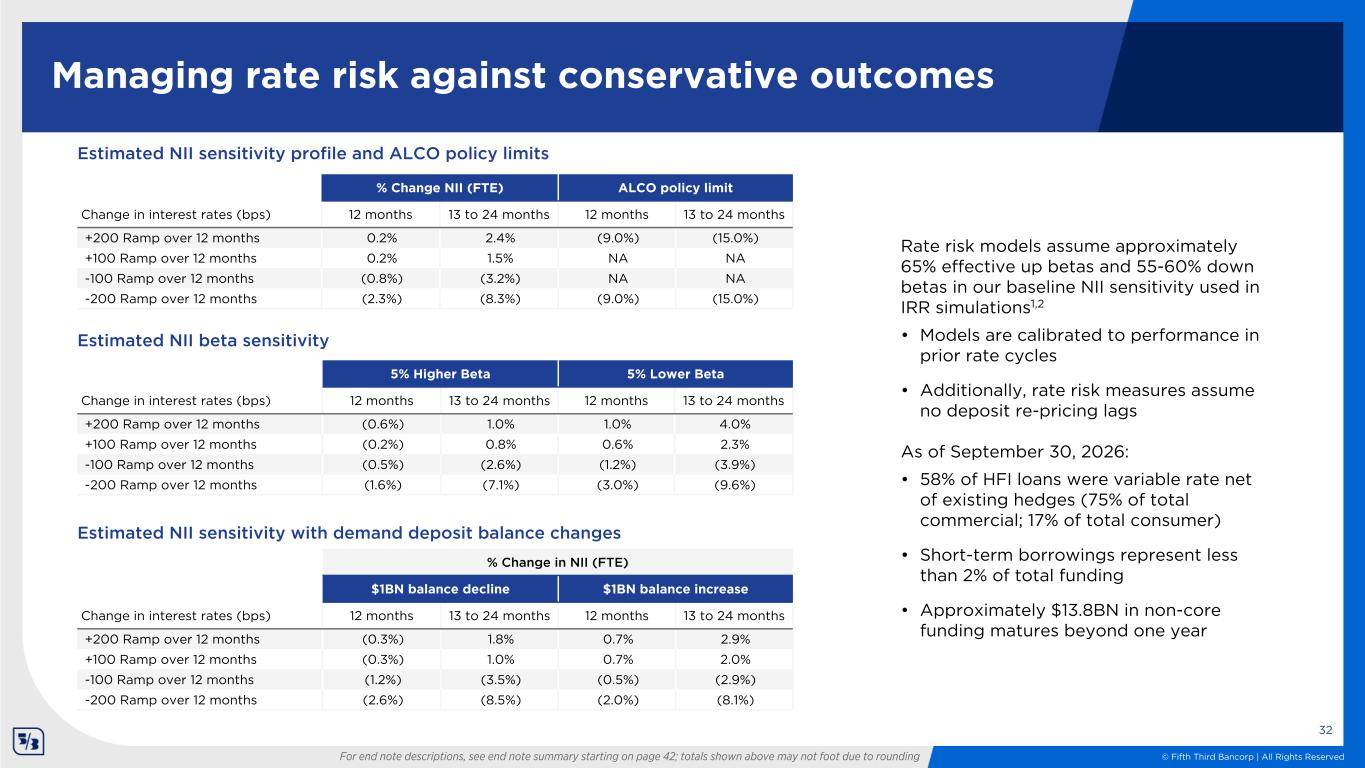
© Fifth Third Bancorp | All Rights Reserved Managing rate risk against conservative outcomes 32 For end note descriptions, see end note summary starting on page 42; totals shown above may not foot due to rounding Estimated NII sensitivity profile and ALCO policy limits Estimated NII beta sensitivity Rate risk models assume approximately 65% effective up betas and 55-60% down betas in our baseline NII sensitivity used in IRR simulations1,2 • Models are calibrated to performance in prior rate cycles • Additionally, rate risk measures assume no deposit re-pricing lags As of September 30, 2026: • 58% of HFI loans were variable rate net of existing hedges (75% of total commercial; 17% of total consumer) • Short-term borrowings represent less than 2% of total funding • Approximately $13.8BN in non-core funding matures beyond one year % Change NII (FTE) ALCO policy limit Change in interest rates (bps) 12 months 13 to 24 months 12 months 13 to 24 months +200 Ramp over 12 months 0.2% 2.4% (9.0%) (15.0%) +100 Ramp over 12 months 0.2% 1.5% NA NA -100 Ramp over 12 months (0.8%) (3.2%) NA NA -200 Ramp over 12 months (2.3%) (8.3%) (9.0%) (15.0%) 5% Higher Beta 5% Lower Beta Change in interest rates (bps) 12 months 13 to 24 months 12 months 13 to 24 months +200 Ramp over 12 months (0.6%) 1.0% 1.0% 4.0% +100 Ramp over 12 months (0.2%) 0.8% 0.6% 2.3% -100 Ramp over 12 months (0.5%) (2.6%) (1.2%) (3.9%) -200 Ramp over 12 months (1.6%) (7.1%) (3.0%) (9.6%) Estimated NII sensitivity with demand deposit balance changes % Change in NII (FTE) $1BN balance decline $1BN balance increase Change in interest rates (bps) 12 months 13 to 24 months 12 months 13 to 24 months +200 Ramp over 12 months (0.3%) 1.8% 0.7% 2.9% +100 Ramp over 12 months (0.3%) 1.0% 0.7% 2.0% -100 Ramp over 12 months (1.2%) (3.5%) (0.5%) (2.9%) -200 Ramp over 12 months (2.6%) (8.5%) (2.0%) (8.1%)
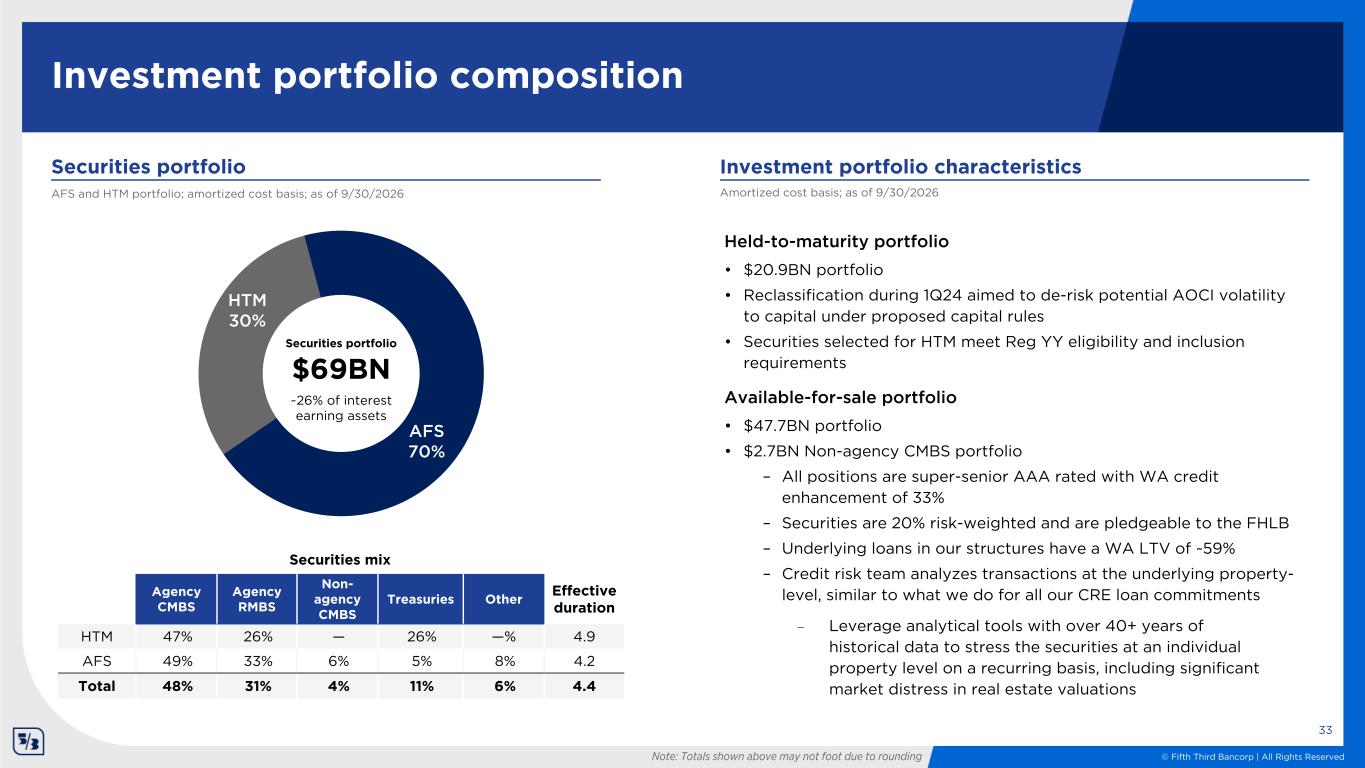
© Fifth Third Bancorp | All Rights Reserved 33 Investment portfolio composition Investment portfolio characteristics Held-to-maturity portfolio • $20.9BN portfolio • Reclassification during 1Q24 aimed to de-risk potential AOCI volatility to capital under proposed capital rules • Securities selected for HTM meet Reg YY eligibility and inclusion requirements Available-for-sale portfolio • $47.7BN portfolio • $2.7BN Non-agency CMBS portfolio – All positions are super-senior AAA rated with WA credit enhancement of 33% – Securities are 20% risk-weighted and are pledgeable to the FHLB – Underlying loans in our structures have a WA LTV of ~59% – Credit risk team analyzes transactions at the underlying property- level, similar to what we do for all our CRE loan commitments HTM 30% AFS 70% AFS and HTM portfolio; amortized cost basis; as of 9/30/2026 Amortized cost basis; as of 9/30/2026 Securities mix Agency CMBS Agency RMBS Non- agency CMBS Treasuries Other Effective duration HTM 47% 26% — 26% —% 4.9 AFS 49% 33% 6% 5% 8% 4.2 Total 48% 31% 4% 11% 6% 4.4 Securities portfolio Securities portfolio $69BN ~26% of interest earning assets ‒ Leverage analytical tools with over 40+ years of historical data to stress the securities at an individual property level on a recurring basis, including significant market distress in real estate valuations Note: Totals shown above may not foot due to rounding
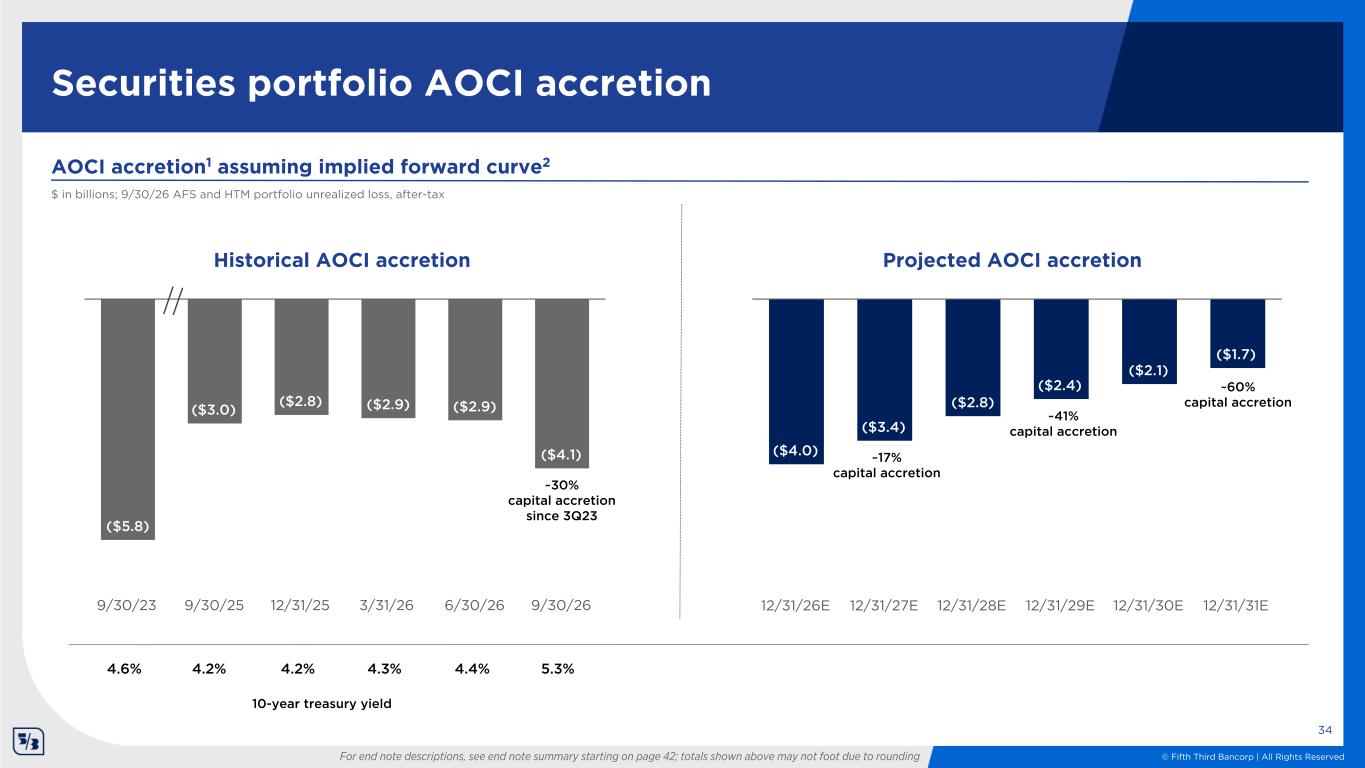
© Fifth Third Bancorp | All Rights Reserved 10-year treasury yield ($5.8) ($3.0) ($2.8) ($2.9) ($2.9) ($4.1) 9/30/23 9/30/25 12/31/25 3/31/26 6/30/26 9/30/26 Projected AOCI accretion ($4.0) ($3.4) ($2.8) ($2.4) ($2.1) ($1.7) 12/31/26E 12/31/27E 12/31/28E 12/31/29E 12/31/30E 12/31/31E Securities portfolio AOCI accretion 34 $ in billions; 9/30/26 AFS and HTM portfolio unrealized loss, after-tax ~60% capital accretion ~17% capital accretion Historical AOCI accretion ~30% capital accretion since 3Q23 AOCI accretion1 assuming implied forward curve2 5.3%4.2% 4.2% 4.3% 4.4% For end note descriptions, see end note summary starting on page 42; totals shown above may not foot due to rounding 4.6% ~41% capital accretion
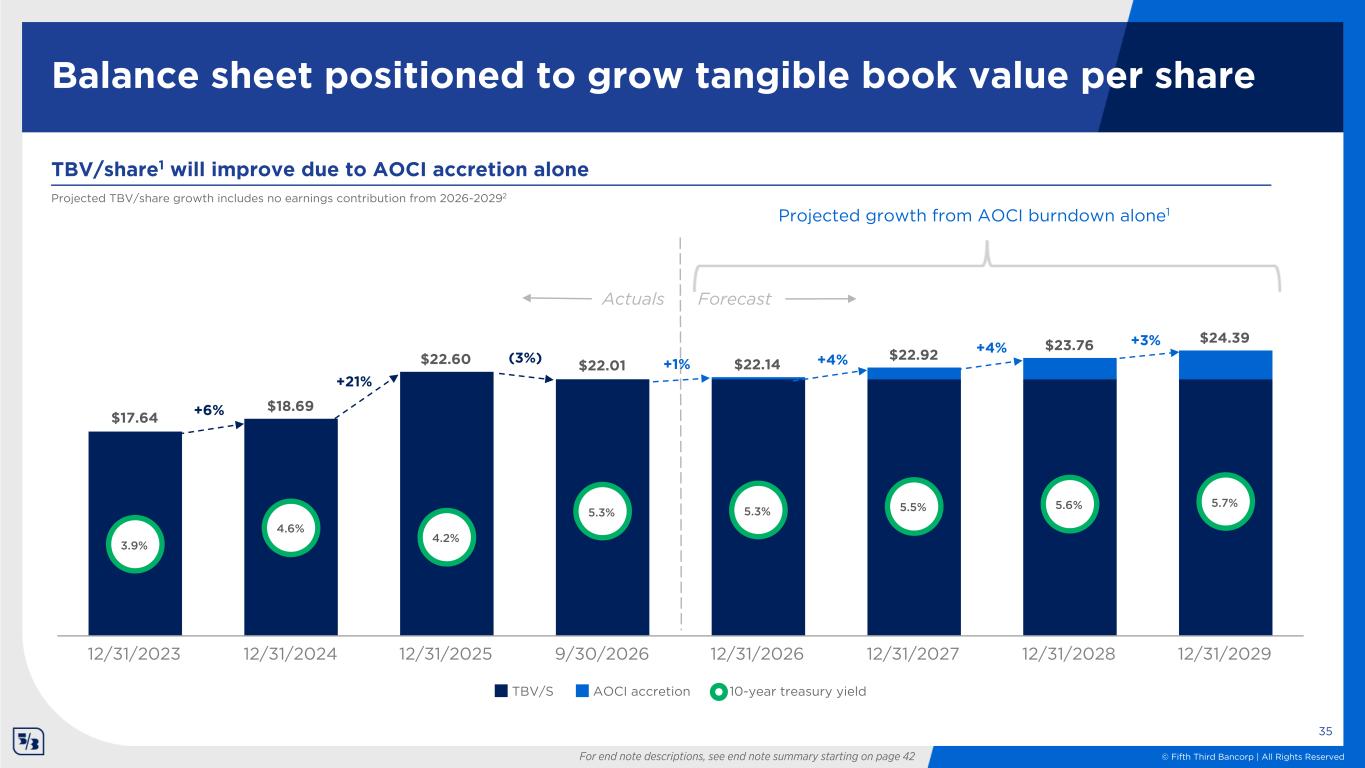
© Fifth Third Bancorp | All Rights Reserved $17.64 $18.69 $22.60 $22.01 $22.14 $22.92 $23.76 $24.39 3.9% 4.6% 4.2% 5.3% 5.3% 5.5% 5.6% 5.7% TBV/S AOCI accretion 10-year treasury yield 12/31/2023 12/31/2024 12/31/2025 9/30/2026 12/31/2026 12/31/2027 12/31/2028 12/31/2029 Balance sheet positioned to grow tangible book value per share 35 TBV/share1 will improve due to AOCI accretion alone Projected TBV/share growth includes no earnings contribution from 2026-20292 For end note descriptions, see end note summary starting on page 42 Actuals Forecast +6% +21% (3%) +4% +4% Projected growth from AOCI burndown alone1 +1% +3%
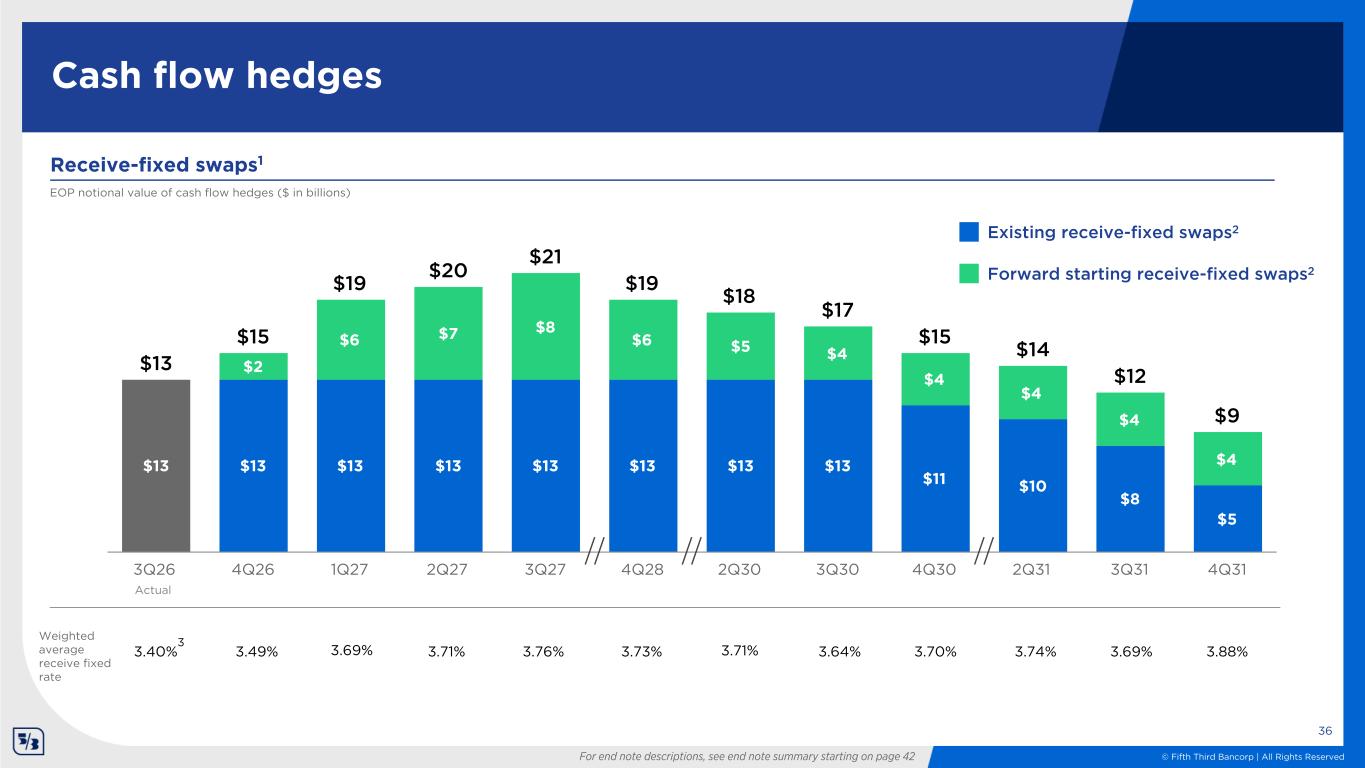
© Fifth Third Bancorp | All Rights Reserved 3.40% $13 $13 $13 $13 $13 $13 $13 $13 $11 $10 $8 $5 $2 $6 $7 $8 $6 $5 $4 $4 $4 $4 $4 $13 $15 $19 $20 $21 $19 $18 $17 $15 $14 $12 $9 3Q26 4Q26 1Q27 2Q27 3Q27 4Q28 2Q30 3Q30 4Q30 2Q31 3Q31 4Q31 Cash flow hedges Receive-fixed swaps1 EOP notional value of cash flow hedges ($ in billions) Actual 36 Existing receive-fixed swaps2 Weighted average receive fixed rate 3.71% 3.64% 3.74% 3.88% 3 For end note descriptions, see end note summary starting on page 42 3.76%3.49% 3.70% 3.69% Forward starting receive-fixed swaps2 3.69% 3.73% 3.71%
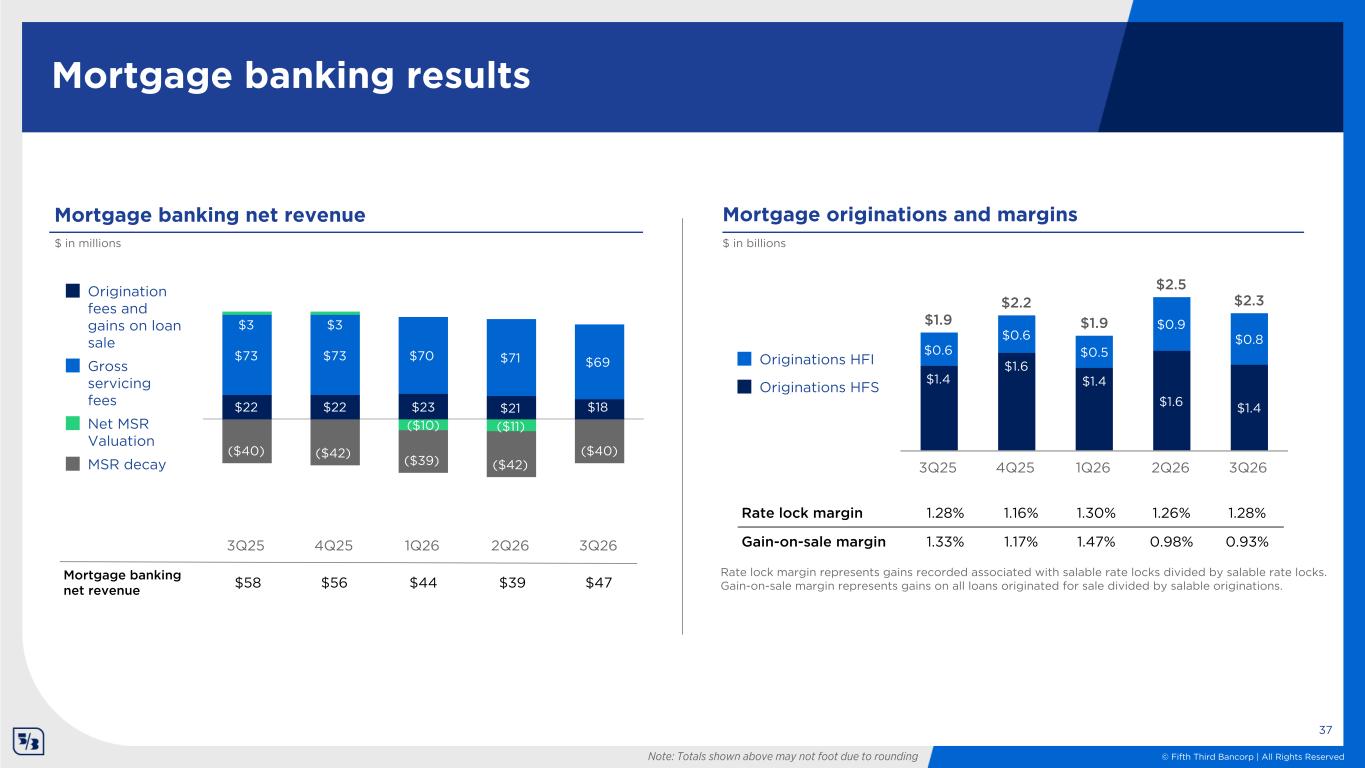
© Fifth Third Bancorp | All Rights Reserved $22 $22 $23 $21 $18 $73 $73 $70 $71 $69 $3 $3 ($10) ($11) ($40) ($42) ($39) ($42) ($40) $58 $56 $44 $39 $47Origination fees and gains on loan sale Gross servicing fees Net MSR Valuation MSR decay 3Q25 4Q25 1Q26 2Q26 3Q26 Mortgage banking results $ in millions Mortgage banking net revenue Mortgage originations and margins $ in billions Rate lock margin represents gains recorded associated with salable rate locks divided by salable rate locks. Gain-on-sale margin represents gains on all loans originated for sale divided by salable originations. 37 $1.9 $2.2 $1.9 $2.5 $2.3 $1.4 $1.6 $1.4 $1.6 $1.4 $0.6 $0.6 $0.5 $0.9 $0.8 Originations HFI Originations HFS 3Q25 4Q25 1Q26 2Q26 3Q26 Note: Totals shown above may not foot due to rounding Rate lock margin 1.28% 1.16% 1.30% 1.26% 1.28% Gain-on-sale margin 1.33% 1.17% 1.47% 0.98% 0.93% Mortgage banking net revenue $58 $56 $44 $39 $47
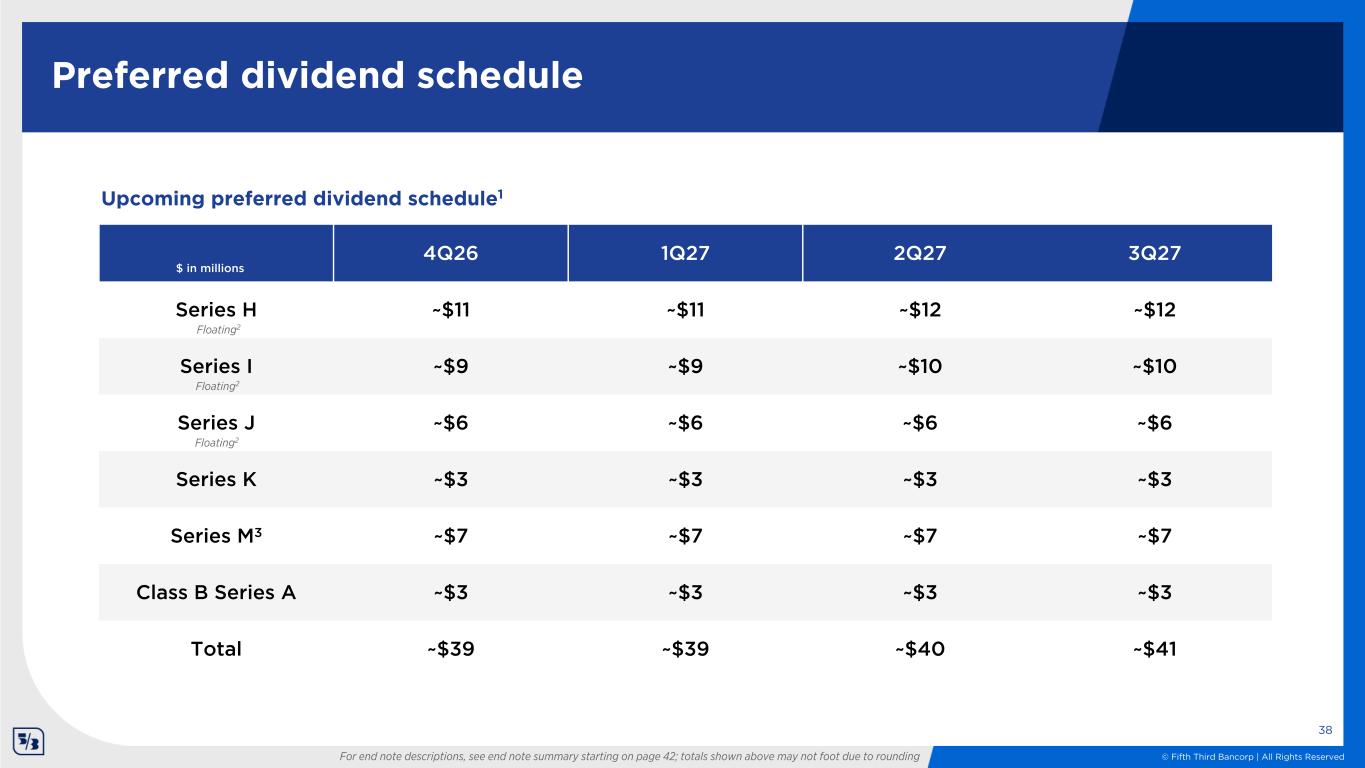
© Fifth Third Bancorp | All Rights Reserved Preferred dividend schedule 4Q26 1Q27 2Q27 3Q27 Series H ~$11 ~$11 ~$12 ~$12 Series I ~$9 ~$9 ~$10 ~$10 Series J ~$6 ~$6 ~$6 ~$6 Series K ~$3 ~$3 ~$3 ~$3 Series M3 ~$7 ~$7 ~$7 ~$7 Class B Series A ~$3 ~$3 ~$3 ~$3 Total ~$39 ~$39 ~$40 ~$41 Upcoming preferred dividend schedule1 $ in millions 38 Floating2 Floating2 Floating2 For end note descriptions, see end note summary starting on page 42; totals shown above may not foot due to rounding
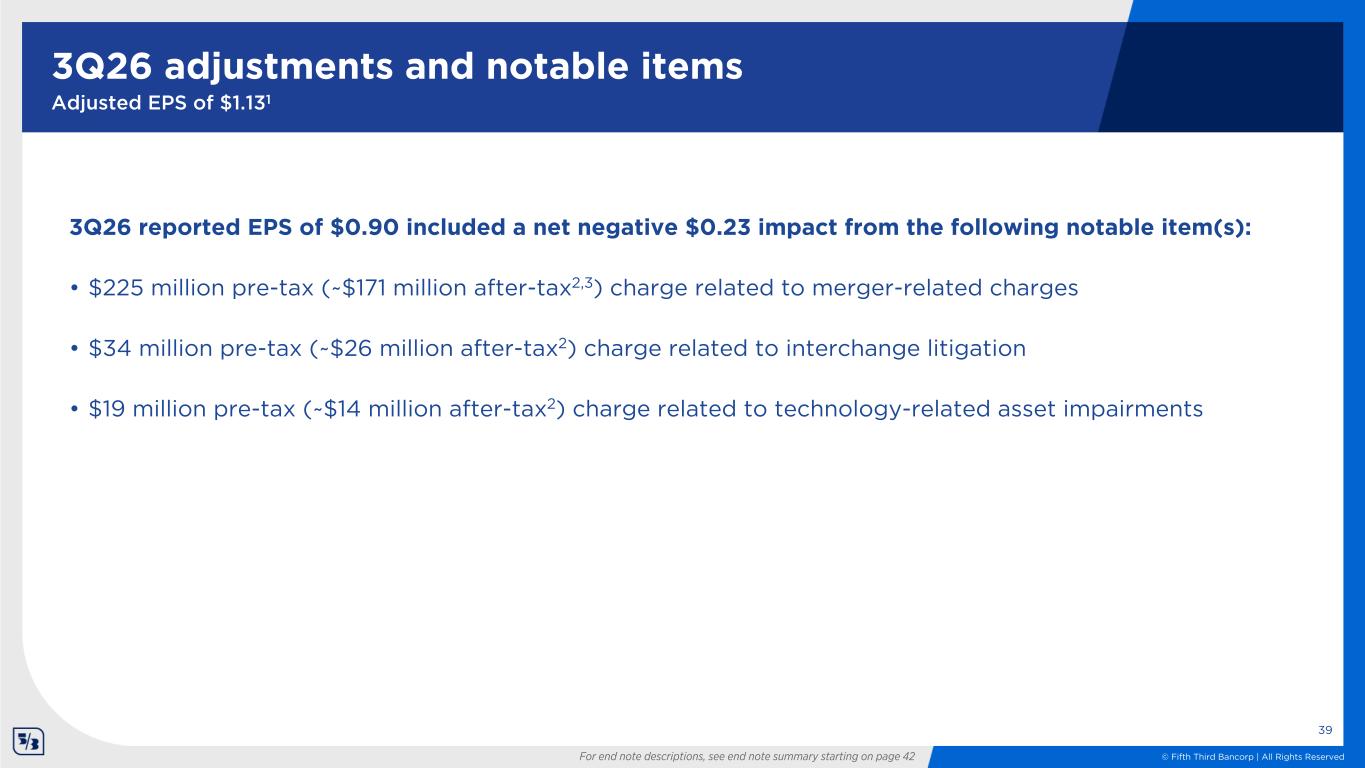
© Fifth Third Bancorp | All Rights Reserved 3Q26 reported EPS of $0.90 included a net negative $0.23 impact from the following notable item(s): • $225 million pre-tax (~$171 million after-tax2,3) charge related to merger-related charges • $34 million pre-tax (~$26 million after-tax2) charge related to interchange litigation • $19 million pre-tax (~$14 million after-tax2) charge related to technology-related asset impairments 3Q26 adjustments and notable items Adjusted EPS of $1.131 39 For end note descriptions, see end note summary starting on page 42
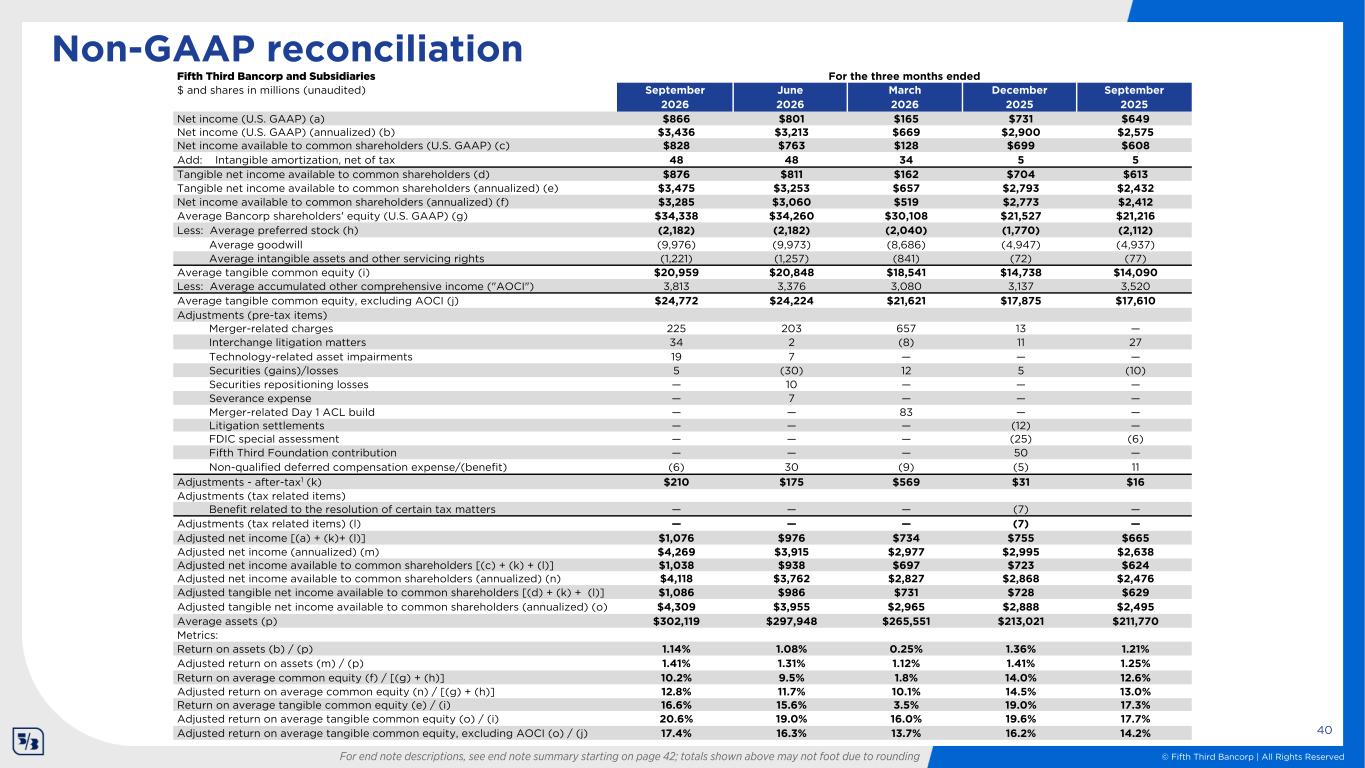
© Fifth Third Bancorp | All Rights Reserved Fifth Third Bancorp and Subsidiaries For the three months ended $ and shares in millions (unaudited) September June March December September 2026 2026 2026 2025 2025 Net income (U.S. GAAP) (a) $866 $801 $165 $731 $649 Net income (U.S. GAAP) (annualized) (b) $3,436 $3,213 $669 $2,900 $2,575 Net income available to common shareholders (U.S. GAAP) (c) $828 $763 $128 $699 $608 Add: Intangible amortization, net of tax 48 48 34 5 5 Tangible net income available to common shareholders (d) $876 $811 $162 $704 $613 Tangible net income available to common shareholders (annualized) (e) $3,475 $3,253 $657 $2,793 $2,432 Net income available to common shareholders (annualized) (f) $3,285 $3,060 $519 $2,773 $2,412 Average Bancorp shareholders' equity (U.S. GAAP) (g) $34,338 $34,260 $30,108 $21,527 $21,216 Less: Average preferred stock (h) (2,182) (2,182) (2,040) (1,770) (2,112) Average goodwill (9,976) (9,973) (8,686) (4,947) (4,937) Average intangible assets and other servicing rights (1,221) (1,257) (841) (72) (77) Average tangible common equity (i) $20,959 $20,848 $18,541 $14,738 $14,090 Less: Average accumulated other comprehensive income ("AOCI") 3,813 3,376 3,080 3,137 3,520 Average tangible common equity, excluding AOCI (j) $24,772 $24,224 $21,621 $17,875 $17,610 Adjustments (pre-tax items) Merger-related charges 225 203 657 13 — Interchange litigation matters 34 2 (8) 11 27 Technology-related asset impairments 19 7 — — — Securities (gains)/losses 5 (30) 12 5 (10) Securities repositioning losses — 10 — — — Severance expense — 7 — — — Merger-related Day 1 ACL build — — 83 — — Litigation settlements — — — (12) — FDIC special assessment — — — (25) (6) Fifth Third Foundation contribution — — — 50 — Non-qualified deferred compensation expense/(benefit) (6) 30 (9) (5) 11 Adjustments - after-tax1 (k) $210 $175 $569 $31 $16 Adjustments (tax related items) Benefit related to the resolution of certain tax matters — — — (7) — Adjustments (tax related items) (l) — — — (7) — Adjusted net income [(a) + (k)+ (l)] $1,076 $976 $734 $755 $665 Adjusted net income (annualized) (m) $4,269 $3,915 $2,977 $2,995 $2,638 Adjusted net income available to common shareholders [(c) + (k) + (l)] $1,038 $938 $697 $723 $624 Adjusted net income available to common shareholders (annualized) (n) $4,118 $3,762 $2,827 $2,868 $2,476 Adjusted tangible net income available to common shareholders [(d) + (k) + (l)] $1,086 $986 $731 $728 $629 Adjusted tangible net income available to common shareholders (annualized) (o) $4,309 $3,955 $2,965 $2,888 $2,495 Average assets (p) $302,119 $297,948 $265,551 $213,021 $211,770 Metrics: Return on assets (b) / (p) 1.14% 1.08% 0.25% 1.36% 1.21% Adjusted return on assets (m) / (p) 1.41% 1.31% 1.12% 1.41% 1.25% Return on average common equity (f) / [(g) + (h)] 10.2% 9.5% 1.8% 14.0% 12.6% Adjusted return on average common equity (n) / [(g) + (h)] 12.8% 11.7% 10.1% 14.5% 13.0% Return on average tangible common equity (e) / (i) 16.6% 15.6% 3.5% 19.0% 17.3% Adjusted return on average tangible common equity (o) / (i) 20.6% 19.0% 16.0% 19.6% 17.7% Adjusted return on average tangible common equity, excluding AOCI (o) / (j) 17.4% 16.3% 13.7% 16.2% 14.2% 40 Non-GAAP reconciliation For end note descriptions, see end note summary starting on page 42; totals shown above may not foot due to rounding
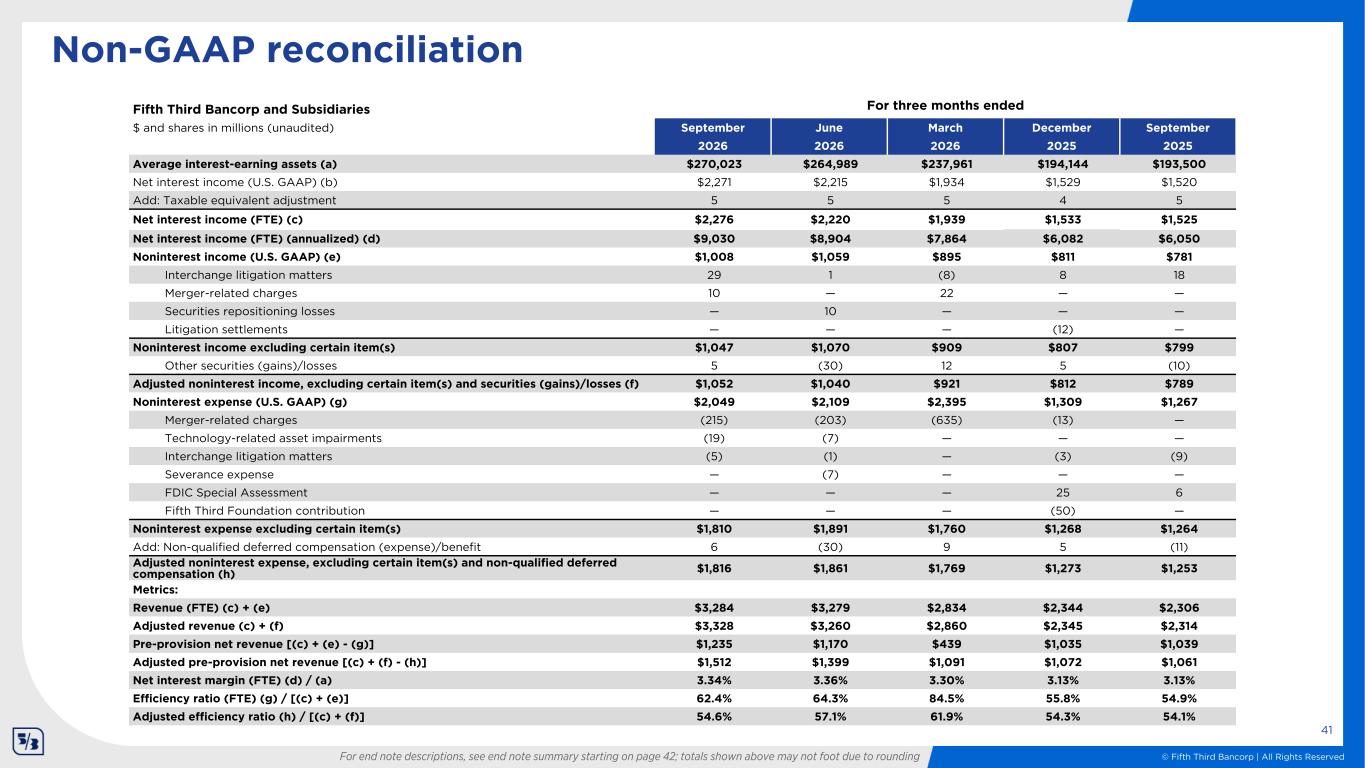
© Fifth Third Bancorp | All Rights Reserved Non-GAAP reconciliation 41 Fifth Third Bancorp and Subsidiaries For three months ended $ and shares in millions (unaudited) September June March December September 2026 2026 2026 2025 2025 Average interest-earning assets (a) $270,023 $264,989 $237,961 $194,144 $193,500 Net interest income (U.S. GAAP) (b) $2,271 $2,215 $1,934 $1,529 $1,520 Add: Taxable equivalent adjustment 5 5 5 4 5 Net interest income (FTE) (c) $2,276 $2,220 $1,939 $1,533 $1,525 Net interest income (FTE) (annualized) (d) $9,030 $8,904 $7,864 $6,082 $6,050 Noninterest income (U.S. GAAP) (e) $1,008 $1,059 $895 $811 $781 Interchange litigation matters 29 1 (8) 8 18 Merger-related charges 10 — 22 — — Securities repositioning losses — 10 — — — Litigation settlements — — — (12) — Noninterest income excluding certain item(s) $1,047 $1,070 $909 $807 $799 Other securities (gains)/losses 5 (30) 12 5 (10) Adjusted noninterest income, excluding certain item(s) and securities (gains)/losses (f) $1,052 $1,040 $921 $812 $789 Noninterest expense (U.S. GAAP) (g) $2,049 $2,109 $2,395 $1,309 $1,267 Merger-related charges (215) (203) (635) (13) — Technology-related asset impairments (19) (7) — — — Interchange litigation matters (5) (1) — (3) (9) Severance expense — (7) — — — FDIC Special Assessment — — — 25 6 Fifth Third Foundation contribution — — — (50) — Noninterest expense excluding certain item(s) $1,810 $1,891 $1,760 $1,268 $1,264 Add: Non-qualified deferred compensation (expense)/benefit 6 (30) 9 5 (11) Adjusted noninterest expense, excluding certain item(s) and non-qualified deferred compensation (h) $1,816 $1,861 $1,769 $1,273 $1,253 Metrics: Revenue (FTE) (c) + (e) $3,284 $3,279 $2,834 $2,344 $2,306 Adjusted revenue (c) + (f) $3,328 $3,260 $2,860 $2,345 $2,314 Pre-provision net revenue [(c) + (e) - (g)] $1,235 $1,170 $439 $1,035 $1,039 Adjusted pre-provision net revenue [(c) + (f) - (h)] $1,512 $1,399 $1,091 $1,072 $1,061 Net interest margin (FTE) (d) / (a) 3.34% 3.36% 3.30% 3.13% 3.13% Efficiency ratio (FTE) (g) / [(c) + (e)] 62.4% 64.3% 84.5% 55.8% 54.9% Adjusted efficiency ratio (h) / [(c) + (f)] 54.6% 57.1% 61.9% 54.3% 54.1% For end note descriptions, see end note summary starting on page 42; totals shown above may not foot due to rounding
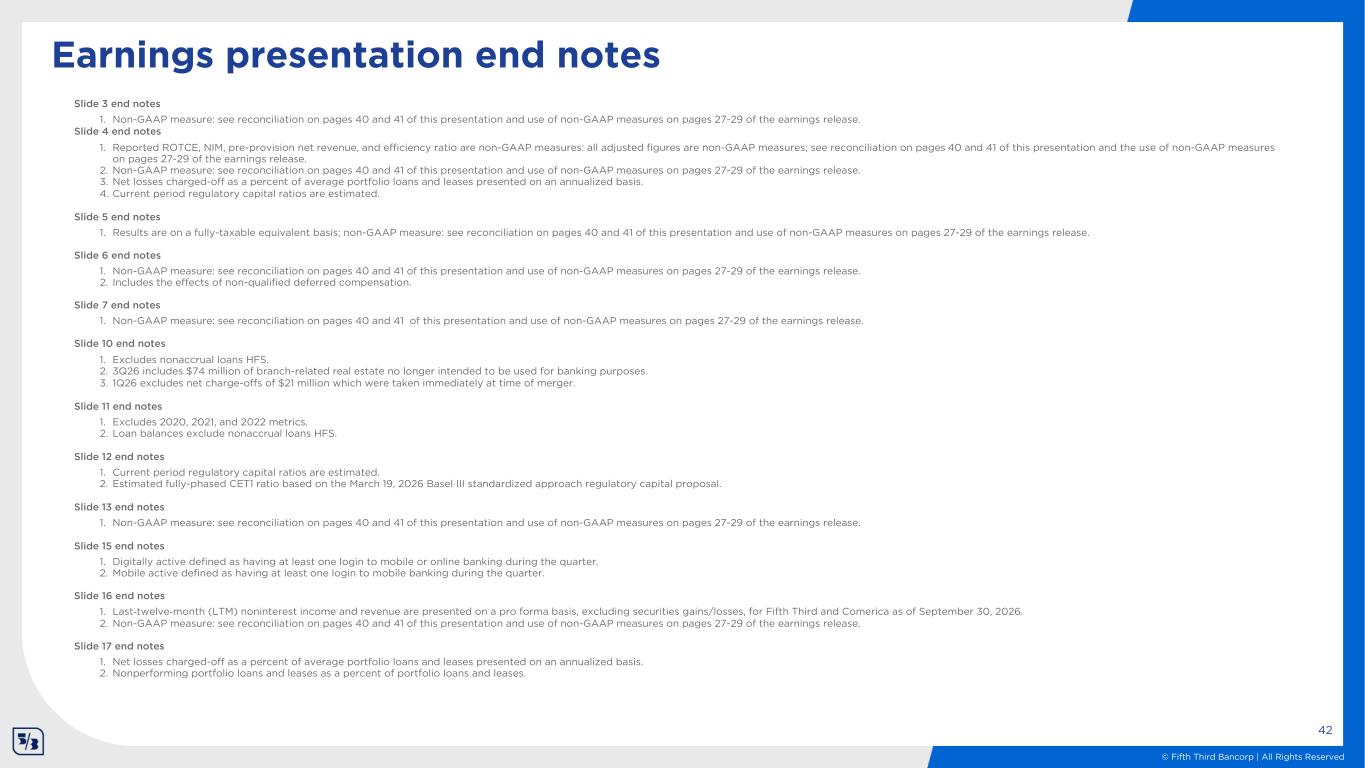
© Fifth Third Bancorp | All Rights Reserved 42 Earnings presentation end notes Slide 3 end notes 1. Non-GAAP measure: see reconciliation on pages 40 and 41 of this presentation and use of non-GAAP measures on pages 27-29 of the earnings release. Slide 4 end notes 1. Reported ROTCE, NIM, pre-provision net revenue, and efficiency ratio are non-GAAP measures: all adjusted figures are non-GAAP measures; see reconciliation on pages 40 and 41 of this presentation and the use of non-GAAP measures on pages 27-29 of the earnings release. 2. Non-GAAP measure: see reconciliation on pages 40 and 41 of this presentation and use of non-GAAP measures on pages 27-29 of the earnings release. 3. Net losses charged-off as a percent of average portfolio loans and leases presented on an annualized basis. 4. Current period regulatory capital ratios are estimated. Slide 5 end notes 1. Results are on a fully-taxable equivalent basis; non-GAAP measure: see reconciliation on pages 40 and 41 of this presentation and use of non-GAAP measures on pages 27-29 of the earnings release. Slide 6 end notes 1. Non-GAAP measure: see reconciliation on pages 40 and 41 of this presentation and use of non-GAAP measures on pages 27-29 of the earnings release. 2. Includes the effects of non-qualified deferred compensation. Slide 7 end notes 1. Non-GAAP measure: see reconciliation on pages 40 and 41 of this presentation and use of non-GAAP measures on pages 27-29 of the earnings release. Slide 10 end notes 1. Excludes nonaccrual loans HFS. 2. 3Q26 includes $74 million of branch-related real estate no longer intended to be used for banking purposes. 3. 1Q26 excludes net charge-offs of $21 million which were taken immediately at time of merger. Slide 11 end notes 1. Excludes 2020, 2021, and 2022 metrics. 2. Loan balances exclude nonaccrual loans HFS. Slide 12 end notes 1. Current period regulatory capital ratios are estimated. 2. Estimated fully-phased CET1 ratio based on the March 19, 2026 Basel III standardized approach regulatory capital proposal. Slide 13 end notes 1. Non-GAAP measure: see reconciliation on pages 40 and 41 of this presentation and use of non-GAAP measures on pages 27-29 of the earnings release. Slide 15 end notes 1. Digitally active defined as having at least one login to mobile or online banking during the quarter. 2. Mobile active defined as having at least one login to mobile banking during the quarter. Slide 16 end notes 1. Last‑twelve‑month (LTM) noninterest income and revenue are presented on a pro forma basis, excluding securities gains/losses, for Fifth Third and Comerica as of September 30, 2026. 2. Non-GAAP measure: see reconciliation on pages 40 and 41 of this presentation and use of non-GAAP measures on pages 27-29 of the earnings release. Slide 17 end notes 1. Net losses charged-off as a percent of average portfolio loans and leases presented on an annualized basis. 2. Nonperforming portfolio loans and leases as a percent of portfolio loans and leases.
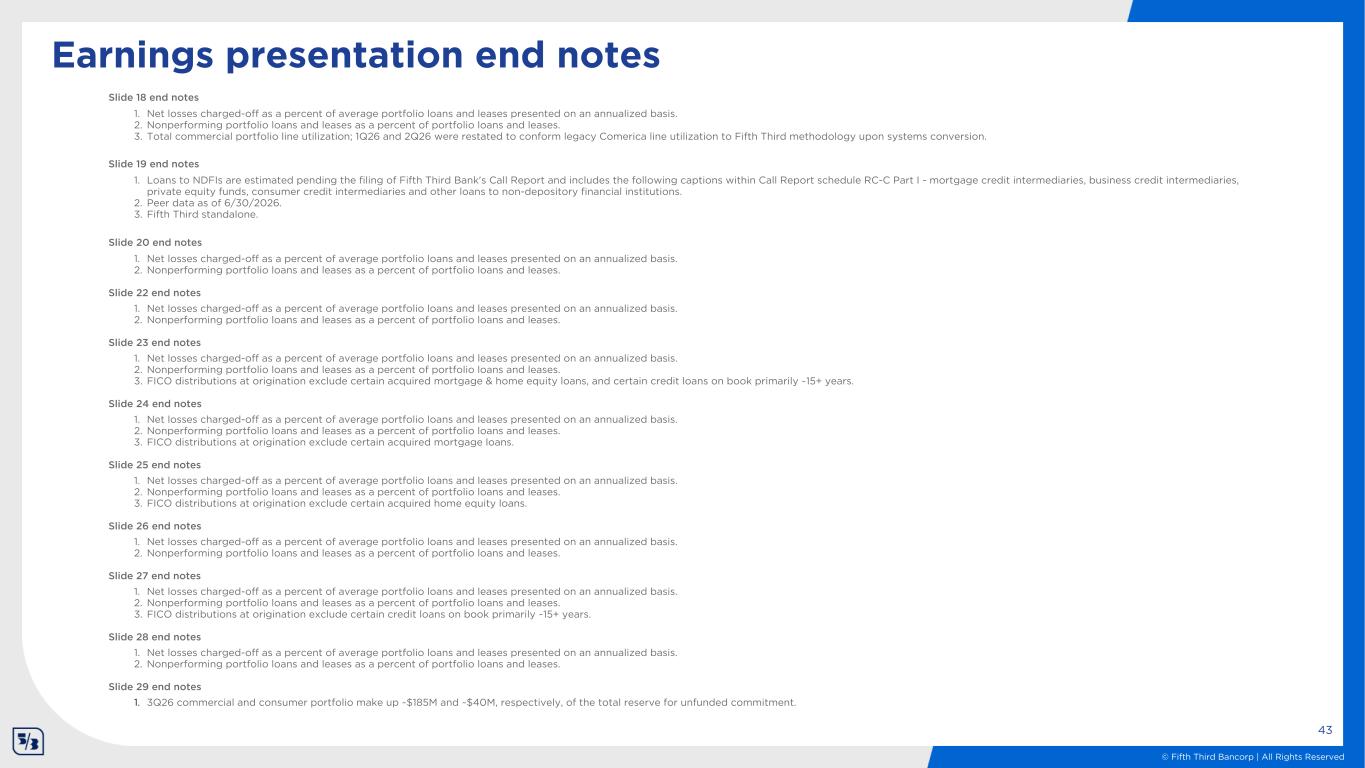
© Fifth Third Bancorp | All Rights Reserved Earnings presentation end notes 43 Slide 18 end notes 1. Net losses charged-off as a percent of average portfolio loans and leases presented on an annualized basis. 2. Nonperforming portfolio loans and leases as a percent of portfolio loans and leases. 3. Total commercial portfolio line utilization; 1Q26 and 2Q26 were restated to conform legacy Comerica line utilization to Fifth Third methodology upon systems conversion. Slide 19 end notes 1. Loans to NDFIs are estimated pending the filing of Fifth Third Bank's Call Report and includes the following captions within Call Report schedule RC-C Part I - mortgage credit intermediaries, business credit intermediaries, private equity funds, consumer credit intermediaries and other loans to non-depository financial institutions. 2. Peer data as of 6/30/2026. 3. Fifth Third standalone. Slide 20 end notes 1. Net losses charged-off as a percent of average portfolio loans and leases presented on an annualized basis. 2. Nonperforming portfolio loans and leases as a percent of portfolio loans and leases. Slide 22 end notes 1. Net losses charged-off as a percent of average portfolio loans and leases presented on an annualized basis. 2. Nonperforming portfolio loans and leases as a percent of portfolio loans and leases. Slide 23 end notes 1. Net losses charged-off as a percent of average portfolio loans and leases presented on an annualized basis. 2. Nonperforming portfolio loans and leases as a percent of portfolio loans and leases. 3. FICO distributions at origination exclude certain acquired mortgage & home equity loans, and certain credit loans on book primarily ~15+ years. Slide 24 end notes 1. Net losses charged-off as a percent of average portfolio loans and leases presented on an annualized basis. 2. Nonperforming portfolio loans and leases as a percent of portfolio loans and leases. 3. FICO distributions at origination exclude certain acquired mortgage loans. Slide 25 end notes 1. Net losses charged-off as a percent of average portfolio loans and leases presented on an annualized basis. 2. Nonperforming portfolio loans and leases as a percent of portfolio loans and leases. 3. FICO distributions at origination exclude certain acquired home equity loans. Slide 26 end notes 1. Net losses charged-off as a percent of average portfolio loans and leases presented on an annualized basis. 2. Nonperforming portfolio loans and leases as a percent of portfolio loans and leases. Slide 27 end notes 1. Net losses charged-off as a percent of average portfolio loans and leases presented on an annualized basis. 2. Nonperforming portfolio loans and leases as a percent of portfolio loans and leases. 3. FICO distributions at origination exclude certain credit loans on book primarily ~15+ years. Slide 28 end notes 1. Net losses charged-off as a percent of average portfolio loans and leases presented on an annualized basis. 2. Nonperforming portfolio loans and leases as a percent of portfolio loans and leases. Slide 29 end notes 1. 3Q26 commercial and consumer portfolio make up ~$185M and ~$40M, respectively, of the total reserve for unfunded commitment.
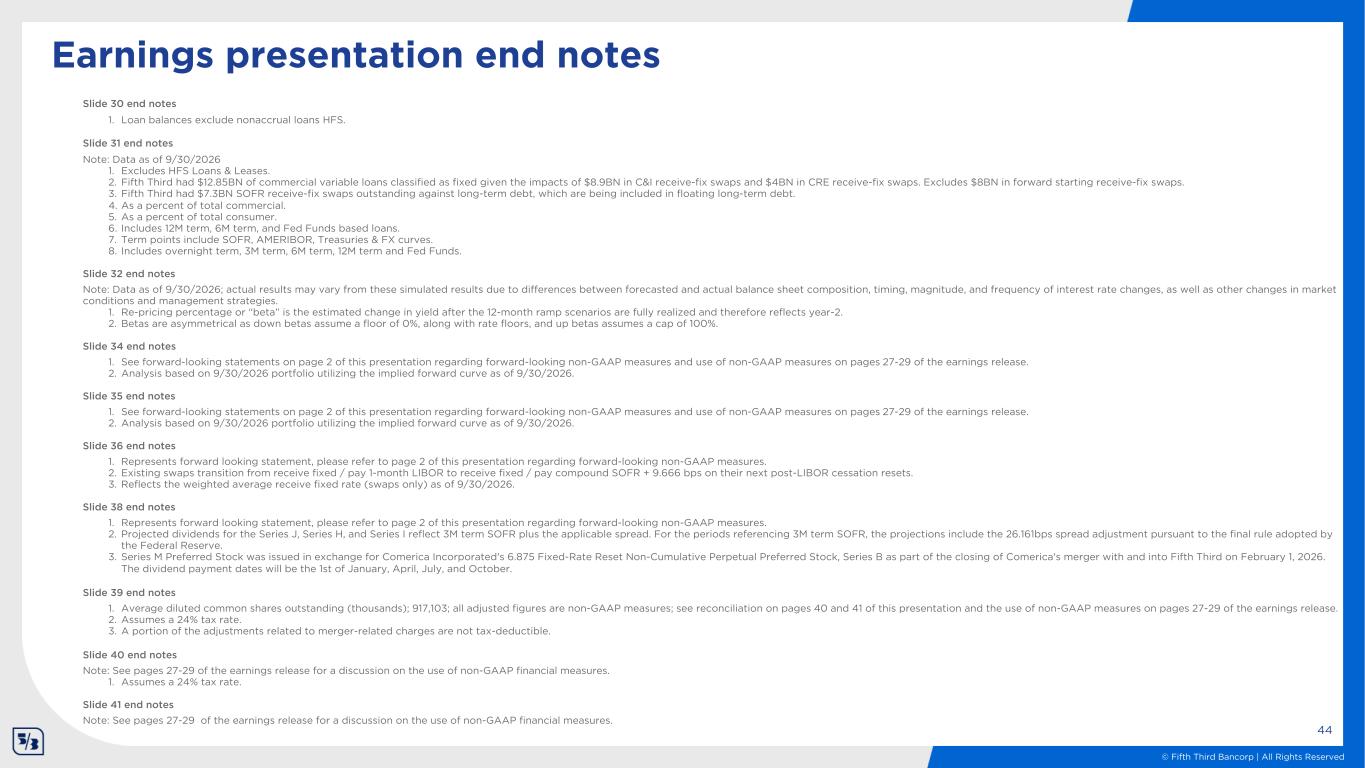
© Fifth Third Bancorp | All Rights Reserved 44 Earnings presentation end notes Slide 30 end notes 1. Loan balances exclude nonaccrual loans HFS. Slide 31 end notes Note: Data as of 9/30/2026 1. Excludes HFS Loans & Leases. 2. Fifth Third had $12.85BN of commercial variable loans classified as fixed given the impacts of $8.9BN in C&I receive-fix swaps and $4BN in CRE receive-fix swaps. Excludes $8BN in forward starting receive-fix swaps. 3. Fifth Third had $7.3BN SOFR receive-fix swaps outstanding against long-term debt, which are being included in floating long-term debt. 4. As a percent of total commercial. 5. As a percent of total consumer. 6. Includes 12M term, 6M term, and Fed Funds based loans. 7. Term points include SOFR, AMERIBOR, Treasuries & FX curves. 8. Includes overnight term, 3M term, 6M term, 12M term and Fed Funds. Slide 32 end notes Note: Data as of 9/30/2026; actual results may vary from these simulated results due to differences between forecasted and actual balance sheet composition, timing, magnitude, and frequency of interest rate changes, as well as other changes in market conditions and management strategies. 1. Re-pricing percentage or “beta” is the estimated change in yield after the 12-month ramp scenarios are fully realized and therefore reflects year-2. 2. Betas are asymmetrical as down betas assume a floor of 0%, along with rate floors, and up betas assumes a cap of 100%. Slide 34 end notes 1. See forward-looking statements on page 2 of this presentation regarding forward-looking non-GAAP measures and use of non-GAAP measures on pages 27-29 of the earnings release. 2. Analysis based on 9/30/2026 portfolio utilizing the implied forward curve as of 9/30/2026. Slide 35 end notes 1. See forward-looking statements on page 2 of this presentation regarding forward-looking non-GAAP measures and use of non-GAAP measures on pages 27-29 of the earnings release. 2. Analysis based on 9/30/2026 portfolio utilizing the implied forward curve as of 9/30/2026. Slide 36 end notes 1. Represents forward looking statement, please refer to page 2 of this presentation regarding forward-looking non-GAAP measures. 2. Existing swaps transition from receive fixed / pay 1-month LIBOR to receive fixed / pay compound SOFR + 9.666 bps on their next post-LIBOR cessation resets. 3. Reflects the weighted average receive fixed rate (swaps only) as of 9/30/2026. Slide 38 end notes 1. Represents forward looking statement, please refer to page 2 of this presentation regarding forward-looking non-GAAP measures. 2. Projected dividends for the Series J, Series H, and Series I reflect 3M term SOFR plus the applicable spread. For the periods referencing 3M term SOFR, the projections include the 26.161bps spread adjustment pursuant to the final rule adopted by the Federal Reserve. 3. Series M Preferred Stock was issued in exchange for Comerica Incorporated's 6.875 Fixed-Rate Reset Non-Cumulative Perpetual Preferred Stock, Series B as part of the closing of Comerica's merger with and into Fifth Third on February 1, 2026. The dividend payment dates will be the 1st of January, April, July, and October. Slide 39 end notes 1. Average diluted common shares outstanding (thousands); 917,103; all adjusted figures are non-GAAP measures; see reconciliation on pages 40 and 41 of this presentation and the use of non-GAAP measures on pages 27-29 of the earnings release. 2. Assumes a 24% tax rate. 3. A portion of the adjustments related to merger-related charges are not tax-deductible. Slide 40 end notes Note: See pages 27-29 of the earnings release for a discussion on the use of non-GAAP financial measures. 1. Assumes a 24% tax rate. Slide 41 end notes Note: See pages 27-29 of the earnings release for a discussion on the use of non-GAAP financial measures.