Shareholder Report
Aug. 31, 2026
USD ($)
Holding
What were the fund costs during the last year ?
(Based on a hypothetical $10,000 investment)
| Fund (Class) | Costs of a $10,000 investment | Costs paid as a percentage of a $10,000 investment |
| Multimanager Lifestyle Aggressive Portfolio (Class R6/JULAX) |
$12 | 0.11% |
Management’s Discussion of Fund Performance
SUMMARY OF RESULTS
Multimanager Lifestyle Aggressive Portfolio (Class R6/JULAX) returned 20.72% for the year ended August 31, 2026. Global equities produced sizable gains in the 12-month period that ended on August 31, 2026. Investors were encouraged by the favorable combination of healthy economic growth trends, robust corporate earnings, and generally supportive central bank policies, together with optimism about artificial intelligence. While technology stocks performed very well, the value style outpaced growth on a global basis and contributed meaningfully to the markets’ strong showing. Emerging market equities also posted outsized returns. Bonds registered more modest gains, led by credit-oriented investments. Income was the primary contributor to total returns for fixed income instruments, as prices came under pressure from concerns about persistent inflation, global conflicts, energy prices, and mounting government debt across the developed world.
TOP PERFORMANCE CONTRIBUTORS
Equity allocation | U.S. equities made the most significant contribution to absolute performance, including the fund’s sizable allocation to large caps. International developed market equities further helped results, as did emerging market stocks. The real assets portfolio was an additional contributor with strong returns for the energy and metals & mining sectors.
Bond funds | The fixed-income allocation also contributed, albeit to a much lesser extent than equities due to its lower return and modest portfolio weighting.
TOP PERFORMANCE DETRACTORS
Specific positions | At a time of positive returns for most segments of the financial markets, the majority of the fund’s holdings recorded a gain. However, small positions in U.S. Treasury STRIPS (Separate Trading of Registered Interest and Principal of Securities) were adversely affected by rising yields.
The views expressed in this report are those of the portfolio management team and are subject to change. They are not meant as investment advice.
Fund Performance
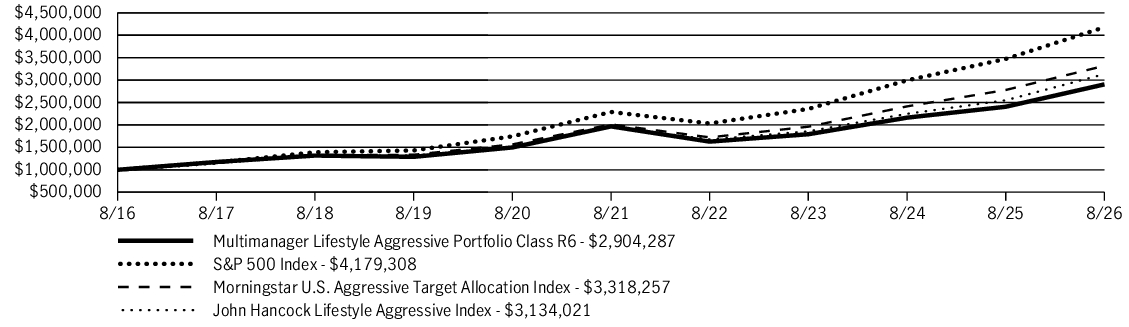
The following graph compares the initial and subsequent account values at the end of each of the most recently completed 10 fiscal years of the fund (or for the life of the fund, if shorter). It assumes a $1,000,000 initial investment in the fund and in an appropriate, broad-based securities market index for the same period.
GROWTH OF $1,000,000
| AVERAGE ANNUAL TOTAL RETURN | 1 Year | 5 Years | 10 Years |
| Multimanager Lifestyle Aggressive Portfolio (Class R6/JULAX) | 20.72% | 8.10% | 11.25% |
| S&P 500 Index | 20.38% | 12.79% | 15.37% |
| Morningstar U.S. Aggressive Target Allocation Index | 19.39% | 10.52% | 12.74% |
| John Hancock Lifestyle Aggressive Index | 22.90% | 9.90% | 12.10% |
Fund Statistics
| Fund net assets | $3,275,684,137 |
| Total number of portfolio holdings | 75 |
| Total advisory fees paid (net) | $2,418,232 |
| Portfolio turnover rate | 11% |
Graphical Representation of Holdings
The table below shows the investment makeup of the fund, representing a percentage of the total net assets of the fund.
Asset Allocation
| Affiliated investment companies | 99.5% |
| Equity | 93.2% |
| U.S. large cap | 38.0% |
| International equity | 28.2% |
| U.S. mid cap | 10.3% |
| Emerging-market equity | 7.3% |
| U.S. small cap | 4.9% |
| Large blend | 4.5% |
| Fixed income | 2.7% |
| Short-term bond | 1.8% |
| Emerging-market debt | 0.5% |
| High yield bond | 0.4% |
| Alternative and specialty | 3.6% |
| Sector equity | 3.1% |
| Absolute return | 0.5% |
| U.S. Government | 0.5% |
Holdings may not have been held by the fund for the entire period and are subject to change without notice. Portfolio composition is subject to review in accordance with the fund’s investment strategy and may vary in the future. Current and future portfolio holdings are subject to risk and may change at any time.
What were the fund costs during the last year ?
(Based on a hypothetical $10,000 investment)
| Fund (Class) | Costs of a $10,000 investment | Costs paid as a percentage of a $10,000 investment |
| Multimanager Lifestyle Aggressive Portfolio (Class R5/JTLAX) |
$18 | 0.16% |
Management’s Discussion of Fund Performance
SUMMARY OF RESULTS
Multimanager Lifestyle Aggressive Portfolio (Class R5/JTLAX) returned 20.64% for the year ended August 31, 2026. Global equities produced sizable gains in the 12-month period that ended on August 31, 2026. Investors were encouraged by the favorable combination of healthy economic growth trends, robust corporate earnings, and generally supportive central bank policies, together with optimism about artificial intelligence. While technology stocks performed very well, the value style outpaced growth on a global basis and contributed meaningfully to the markets’ strong showing. Emerging market equities also posted outsized returns. Bonds registered more modest gains, led by credit-oriented investments. Income was the primary contributor to total returns for fixed income instruments, as prices came under pressure from concerns about persistent inflation, global conflicts, energy prices, and mounting government debt across the developed world.
TOP PERFORMANCE CONTRIBUTORS
Equity allocation | U.S. equities made the most significant contribution to absolute performance, including the fund’s sizable allocation to large caps. International developed market equities further helped results, as did emerging market stocks. The real assets portfolio was an additional contributor with strong returns for the energy and metals & mining sectors.
Bond funds | The fixed-income allocation also contributed, albeit to a much lesser extent than equities due to its lower return and modest portfolio weighting.
TOP PERFORMANCE DETRACTORS
Specific positions | At a time of positive returns for most segments of the financial markets, the majority of the fund’s holdings recorded a gain. However, small positions in U.S. Treasury STRIPS (Separate Trading of Registered Interest and Principal of Securities) were adversely affected by rising yields.
The views expressed in this report are those of the portfolio management team and are subject to change. They are not meant as investment advice.
Fund Performance
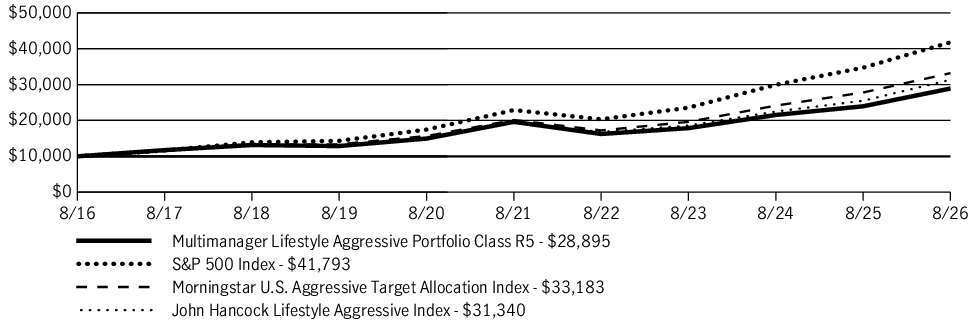
The following graph compares the initial and subsequent account values at the end of each of the most recently completed 10 fiscal years of the fund (or for the life of the fund, if shorter). It assumes a $10,000 initial investment in the fund and in an appropriate, broad-based securities market index for the same period.
GROWTH OF $10,000
| AVERAGE ANNUAL TOTAL RETURN | 1 Year | 5 Years | 10 Years |
| Multimanager Lifestyle Aggressive Portfolio (Class R5/JTLAX) | 20.64% | 8.06% | 11.19% |
| S&P 500 Index | 20.38% | 12.79% | 15.37% |
| Morningstar U.S. Aggressive Target Allocation Index | 19.39% | 10.52% | 12.74% |
| John Hancock Lifestyle Aggressive Index | 22.90% | 9.90% | 12.10% |
Fund Statistics
| Fund net assets | $3,275,684,137 |
| Total number of portfolio holdings | 75 |
| Total advisory fees paid (net) | $2,418,232 |
| Portfolio turnover rate | 11% |
Graphical Representation of Holdings
The table below shows the investment makeup of the fund, representing a percentage of the total net assets of the fund.
Asset Allocation
| Affiliated investment companies | 99.5% |
| Equity | 93.2% |
| U.S. large cap | 38.0% |
| International equity | 28.2% |
| U.S. mid cap | 10.3% |
| Emerging-market equity | 7.3% |
| U.S. small cap | 4.9% |
| Large blend | 4.5% |
| Fixed income | 2.7% |
| Short-term bond | 1.8% |
| Emerging-market debt | 0.5% |
| High yield bond | 0.4% |
| Alternative and specialty | 3.6% |
| Sector equity | 3.1% |
| Absolute return | 0.5% |
| U.S. Government | 0.5% |
Holdings may not have been held by the fund for the entire period and are subject to change without notice. Portfolio composition is subject to review in accordance with the fund’s investment strategy and may vary in the future. Current and future portfolio holdings are subject to risk and may change at any time.
What were the fund costs during the last year ?
(Based on a hypothetical $10,000 investment)
| Fund (Class) | Costs of a $10,000 investment | Costs paid as a percentage of a $10,000 investment |
| Multimanager Lifestyle Aggressive Portfolio (Class R4/JSLAX) |
$40 | 0.36% |
Management’s Discussion of Fund Performance
SUMMARY OF RESULTS
Multimanager Lifestyle Aggressive Portfolio (Class R4/JSLAX) returned 20.46% for the year ended August 31, 2026. Global equities produced sizable gains in the 12-month period that ended on August 31, 2026. Investors were encouraged by the favorable combination of healthy economic growth trends, robust corporate earnings, and generally supportive central bank policies, together with optimism about artificial intelligence. While technology stocks performed very well, the value style outpaced growth on a global basis and contributed meaningfully to the markets’ strong showing. Emerging market equities also posted outsized returns. Bonds registered more modest gains, led by credit-oriented investments. Income was the primary contributor to total returns for fixed income instruments, as prices came under pressure from concerns about persistent inflation, global conflicts, energy prices, and mounting government debt across the developed world.
TOP PERFORMANCE CONTRIBUTORS
Equity allocation | U.S. equities made the most significant contribution to absolute performance, including the fund’s sizable allocation to large caps. International developed market equities further helped results, as did emerging market stocks. The real assets portfolio was an additional contributor with strong returns for the energy and metals & mining sectors.
Bond funds | The fixed-income allocation also contributed, albeit to a much lesser extent than equities due to its lower return and modest portfolio weighting.
TOP PERFORMANCE DETRACTORS
Specific positions | At a time of positive returns for most segments of the financial markets, the majority of the fund’s holdings recorded a gain. However, small positions in U.S. Treasury STRIPS (Separate Trading of Registered Interest and Principal of Securities) were adversely affected by rising yields.
The views expressed in this report are those of the portfolio management team and are subject to change. They are not meant as investment advice.
Fund Performance
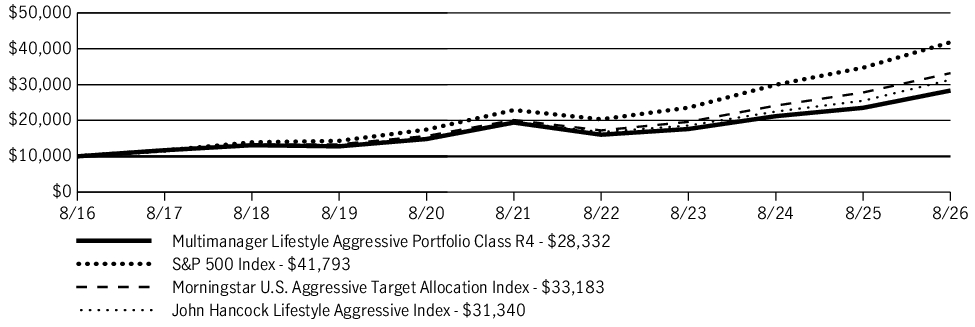
The following graph compares the initial and subsequent account values at the end of each of the most recently completed 10 fiscal years of the fund (or for the life of the fund, if shorter). It assumes a $10,000 initial investment in the fund and in an appropriate, broad-based securities market index for the same period.
GROWTH OF $10,000
| AVERAGE ANNUAL TOTAL RETURN | 1 Year | 5 Years | 10 Years |
| Multimanager Lifestyle Aggressive Portfolio (Class R4/JSLAX) | 20.46% | 7.85% | 10.98% |
| S&P 500 Index | 20.38% | 12.79% | 15.37% |
| Morningstar U.S. Aggressive Target Allocation Index | 19.39% | 10.52% | 12.74% |
| John Hancock Lifestyle Aggressive Index | 22.90% | 9.90% | 12.10% |
Fund Statistics
| Fund net assets | $3,275,684,137 |
| Total number of portfolio holdings | 75 |
| Total advisory fees paid (net) | $2,418,232 |
| Portfolio turnover rate | 11% |
Graphical Representation of Holdings
The table below shows the investment makeup of the fund, representing a percentage of the total net assets of the fund.
Asset Allocation
| Affiliated investment companies | 99.5% |
| Equity | 93.2% |
| U.S. large cap | 38.0% |
| International equity | 28.2% |
| U.S. mid cap | 10.3% |
| Emerging-market equity | 7.3% |
| U.S. small cap | 4.9% |
| Large blend | 4.5% |
| Fixed income | 2.7% |
| Short-term bond | 1.8% |
| Emerging-market debt | 0.5% |
| High yield bond | 0.4% |
| Alternative and specialty | 3.6% |
| Sector equity | 3.1% |
| Absolute return | 0.5% |
| U.S. Government | 0.5% |
Holdings may not have been held by the fund for the entire period and are subject to change without notice. Portfolio composition is subject to review in accordance with the fund’s investment strategy and may vary in the future. Current and future portfolio holdings are subject to risk and may change at any time.
What were the fund costs during the last year ?
(Based on a hypothetical $10,000 investment)
| Fund (Class) | Costs of a $10,000 investment | Costs paid as a percentage of a $10,000 investment |
| Multimanager Lifestyle Aggressive Portfolio (Class R2/JQLAX) |
$67 | 0.61% |
Management’s Discussion of Fund Performance
SUMMARY OF RESULTS
Multimanager Lifestyle Aggressive Portfolio (Class R2/JQLAX) returned 20.09% for the year ended August 31, 2026. Global equities produced sizable gains in the 12-month period that ended on August 31, 2026. Investors were encouraged by the favorable combination of healthy economic growth trends, robust corporate earnings, and generally supportive central bank policies, together with optimism about artificial intelligence. While technology stocks performed very well, the value style outpaced growth on a global basis and contributed meaningfully to the markets’ strong showing. Emerging market equities also posted outsized returns. Bonds registered more modest gains, led by credit-oriented investments. Income was the primary contributor to total returns for fixed income instruments, as prices came under pressure from concerns about persistent inflation, global conflicts, energy prices, and mounting government debt across the developed world.
TOP PERFORMANCE CONTRIBUTORS
Equity allocation | U.S. equities made the most significant contribution to absolute performance, including the fund’s sizable allocation to large caps. International developed market equities further helped results, as did emerging market stocks. The real assets portfolio was an additional contributor with strong returns for the energy and metals & mining sectors.
Bond funds | The fixed-income allocation also contributed, albeit to a much lesser extent than equities due to its lower return and modest portfolio weighting.
TOP PERFORMANCE DETRACTORS
Specific positions | At a time of positive returns for most segments of the financial markets, the majority of the fund’s holdings recorded a gain. However, small positions in U.S. Treasury STRIPS (Separate Trading of Registered Interest and Principal of Securities) were adversely affected by rising yields.
The views expressed in this report are those of the portfolio management team and are subject to change. They are not meant as investment advice.
Fund Performance
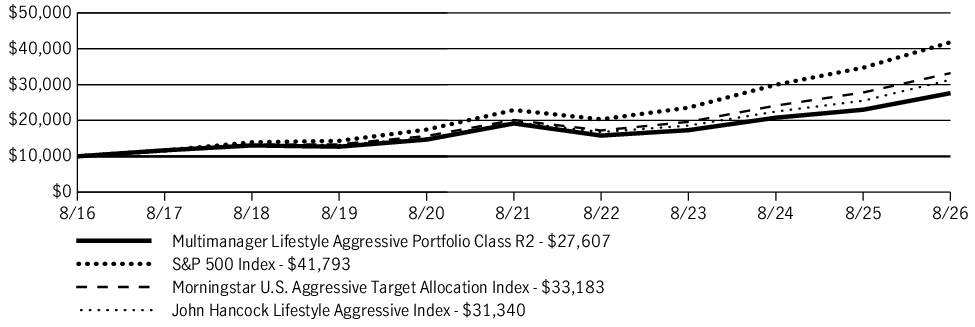
The following graph compares the initial and subsequent account values at the end of each of the most recently completed 10 fiscal years of the fund (or for the life of the fund, if shorter). It assumes a $10,000 initial investment in the fund and in an appropriate, broad-based securities market index for the same period.
GROWTH OF $10,000
| AVERAGE ANNUAL TOTAL RETURN | 1 Year | 5 Years | 10 Years |
| Multimanager Lifestyle Aggressive Portfolio (Class R2/JQLAX) | 20.09% | 7.57% | 10.69% |
| S&P 500 Index | 20.38% | 12.79% | 15.37% |
| Morningstar U.S. Aggressive Target Allocation Index | 19.39% | 10.52% | 12.74% |
| John Hancock Lifestyle Aggressive Index | 22.90% | 9.90% | 12.10% |
Fund Statistics
| Fund net assets | $3,275,684,137 |
| Total number of portfolio holdings | 75 |
| Total advisory fees paid (net) | $2,418,232 |
| Portfolio turnover rate | 11% |
Graphical Representation of Holdings
The table below shows the investment makeup of the fund, representing a percentage of the total net assets of the fund.
Asset Allocation
| Affiliated investment companies | 99.5% |
| Equity | 93.2% |
| U.S. large cap | 38.0% |
| International equity | 28.2% |
| U.S. mid cap | 10.3% |
| Emerging-market equity | 7.3% |
| U.S. small cap | 4.9% |
| Large blend | 4.5% |
| Fixed income | 2.7% |
| Short-term bond | 1.8% |
| Emerging-market debt | 0.5% |
| High yield bond | 0.4% |
| Alternative and specialty | 3.6% |
| Sector equity | 3.1% |
| Absolute return | 0.5% |
| U.S. Government | 0.5% |
Holdings may not have been held by the fund for the entire period and are subject to change without notice. Portfolio composition is subject to review in accordance with the fund’s investment strategy and may vary in the future. Current and future portfolio holdings are subject to risk and may change at any time.
What were the fund costs during the last year ?
(Based on a hypothetical $10,000 investment)
| Fund (Class) | Costs of a $10,000 investment | Costs paid as a percentage of a $10,000 investment |
| Multimanager Lifestyle Aggressive Portfolio (Class I/JTAIX) |
$24 | 0.22% |
Management’s Discussion of Fund Performance
SUMMARY OF RESULTS
Multimanager Lifestyle Aggressive Portfolio (Class I/JTAIX) returned 20.61% for the year ended August 31, 2026. Global equities produced sizable gains in the 12-month period that ended on August 31, 2026. Investors were encouraged by the favorable combination of healthy economic growth trends, robust corporate earnings, and generally supportive central bank policies, together with optimism about artificial intelligence. While technology stocks performed very well, the value style outpaced growth on a global basis and contributed meaningfully to the markets’ strong showing. Emerging market equities also posted outsized returns. Bonds registered more modest gains, led by credit-oriented investments. Income was the primary contributor to total returns for fixed income instruments, as prices came under pressure from concerns about persistent inflation, global conflicts, energy prices, and mounting government debt across the developed world.
TOP PERFORMANCE CONTRIBUTORS
Equity allocation | U.S. equities made the most significant contribution to absolute performance, including the fund’s sizable allocation to large caps. International developed market equities further helped results, as did emerging market stocks. The real assets portfolio was an additional contributor with strong returns for the energy and metals & mining sectors.
Bond funds | The fixed-income allocation also contributed, albeit to a much lesser extent than equities due to its lower return and modest portfolio weighting.
TOP PERFORMANCE DETRACTORS
Specific positions | At a time of positive returns for most segments of the financial markets, the majority of the fund’s holdings recorded a gain. However, small positions in U.S. Treasury STRIPS (Separate Trading of Registered Interest and Principal of Securities) were adversely affected by rising yields.
The views expressed in this report are those of the portfolio management team and are subject to change. They are not meant as investment advice.
Fund Performance
The following graph compares the initial and subsequent account values at the end of each of the most recently completed 10 fiscal years of the fund (or for the life of the fund, if shorter). It assumes a $250,000 initial investment in the fund and in an appropriate, broad-based securities market index for the same period.
GROWTH OF $250,000
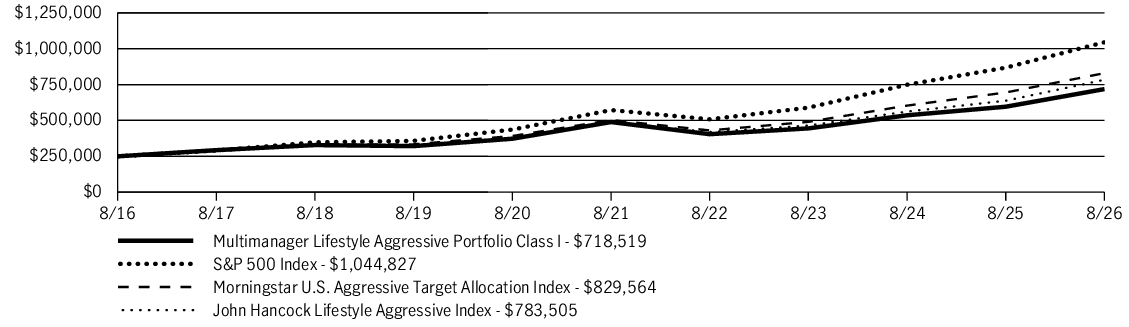
| AVERAGE ANNUAL TOTAL RETURN | 1 Year | 5 Years | 10 Years |
| Multimanager Lifestyle Aggressive Portfolio (Class I/JTAIX) | 20.61% | 8.01% | 11.13% |
| S&P 500 Index | 20.38% | 12.79% | 15.37% |
| Morningstar U.S. Aggressive Target Allocation Index | 19.39% | 10.52% | 12.74% |
| John Hancock Lifestyle Aggressive Index | 22.90% | 9.90% | 12.10% |
Fund Statistics
| Fund net assets | $3,275,684,137 |
| Total number of portfolio holdings | 75 |
| Total advisory fees paid (net) | $2,418,232 |
| Portfolio turnover rate | 11% |
Graphical Representation of Holdings
The table below shows the investment makeup of the fund, representing a percentage of the total net assets of the fund.
Asset Allocation
| Affiliated investment companies | 99.5% |
| Equity | 93.2% |
| U.S. large cap | 38.0% |
| International equity | 28.2% |
| U.S. mid cap | 10.3% |
| Emerging-market equity | 7.3% |
| U.S. small cap | 4.9% |
| Large blend | 4.5% |
| Fixed income | 2.7% |
| Short-term bond | 1.8% |
| Emerging-market debt | 0.5% |
| High yield bond | 0.4% |
| Alternative and specialty | 3.6% |
| Sector equity | 3.1% |
| Absolute return | 0.5% |
| U.S. Government | 0.5% |
Holdings may not have been held by the fund for the entire period and are subject to change without notice. Portfolio composition is subject to review in accordance with the fund’s investment strategy and may vary in the future. Current and future portfolio holdings are subject to risk and may change at any time.
What were the fund costs during the last year ?
(Based on a hypothetical $10,000 investment)
| Fund (Class) | Costs of a $10,000 investment | Costs paid as a percentage of a $10,000 investment |
| Multimanager Lifestyle Aggressive Portfolio (Class C/JCLAX) |
$134 | 1.22% |
Management’s Discussion of Fund Performance
SUMMARY OF RESULTS
Multimanager Lifestyle Aggressive Portfolio (Class C/JCLAX) returned 19.41% (excluding sales charges) for the year ended August 31, 2026. Global equities produced sizable gains in the 12-month period that ended on August 31, 2026. Investors were encouraged by the favorable combination of healthy economic growth trends, robust corporate earnings, and generally supportive central bank policies, together with optimism about artificial intelligence. While technology stocks performed very well, the value style outpaced growth on a global basis and contributed meaningfully to the markets’ strong showing. Emerging market equities also posted outsized returns. Bonds registered more modest gains, led by credit-oriented investments. Income was the primary contributor to total returns for fixed income instruments, as prices came under pressure from concerns about persistent inflation, global conflicts, energy prices, and mounting government debt across the developed world.
TOP PERFORMANCE CONTRIBUTORS
Equity allocation | U.S. equities made the most significant contribution to absolute performance, including the fund’s sizable allocation to large caps. International developed market equities further helped results, as did emerging market stocks. The real assets portfolio was an additional contributor with strong returns for the energy and metals & mining sectors.
Bond funds | The fixed-income allocation also contributed, albeit to a much lesser extent than equities due to its lower return and modest portfolio weighting.
TOP PERFORMANCE DETRACTORS
Specific positions | At a time of positive returns for most segments of the financial markets, the majority of the fund’s holdings recorded a gain. However, small positions in U.S. Treasury STRIPS (Separate Trading of Registered Interest and Principal of Securities) were adversely affected by rising yields.
The views expressed in this report are those of the portfolio management team and are subject to change. They are not meant as investment advice.
Fund Performance
The following graph compares the initial and subsequent account values at the end of each of the most recently completed 10 fiscal years of the fund (or for the life of the fund, if shorter). It assumes a $10,000 initial investment in the fund and in an appropriate, broad-based securities market index for the same period.
GROWTH OF $10,000
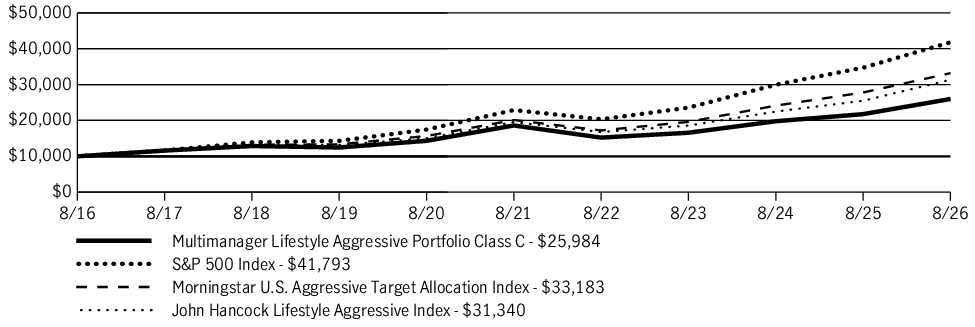
| AVERAGE ANNUAL TOTAL RETURN | 1 Year | 5 Years | 10 Years |
| Multimanager Lifestyle Aggressive Portfolio (Class C/JCLAX) | 18.41% | 6.91% | 10.02% |
| Multimanager Lifestyle Aggressive Portfolio (Class C/JCLAX)—excluding sales charge | 19.41% | 6.91% | 10.02% |
| S&P 500 Index | 20.38% | 12.79% | 15.37% |
| Morningstar U.S. Aggressive Target Allocation Index | 19.39% | 10.52% | 12.74% |
| John Hancock Lifestyle Aggressive Index | 22.90% | 9.90% | 12.10% |
Fund Statistics
| Fund net assets | $3,275,684,137 |
| Total number of portfolio holdings | 75 |
| Total advisory fees paid (net) | $2,418,232 |
| Portfolio turnover rate | 11% |
Graphical Representation of Holdings
The table below shows the investment makeup of the fund, representing a percentage of the total net assets of the fund.
Asset Allocation
| Affiliated investment companies | 99.5% |
| Equity | 93.2% |
| U.S. large cap | 38.0% |
| International equity | 28.2% |
| U.S. mid cap | 10.3% |
| Emerging-market equity | 7.3% |
| U.S. small cap | 4.9% |
| Large blend | 4.5% |
| Fixed income | 2.7% |
| Short-term bond | 1.8% |
| Emerging-market debt | 0.5% |
| High yield bond | 0.4% |
| Alternative and specialty | 3.6% |
| Sector equity | 3.1% |
| Absolute return | 0.5% |
| U.S. Government | 0.5% |
Holdings may not have been held by the fund for the entire period and are subject to change without notice. Portfolio composition is subject to review in accordance with the fund’s investment strategy and may vary in the future. Current and future portfolio holdings are subject to risk and may change at any time.
What were the fund costs during the last year ?
(Based on a hypothetical $10,000 investment)
| Fund (Class) | Costs of a $10,000 investment | Costs paid as a percentage of a $10,000 investment |
| Multimanager Lifestyle Aggressive Portfolio (Class A/JALAX) |
$57 | 0.52% |
Management’s Discussion of Fund Performance
SUMMARY OF RESULTS
Multimanager Lifestyle Aggressive Portfolio (Class A/JALAX) returned 20.18% (excluding sales charges) for the year ended August 31, 2026. Global equities produced sizable gains in the 12-month period that ended on August 31, 2026. Investors were encouraged by the favorable combination of healthy economic growth trends, robust corporate earnings, and generally supportive central bank policies, together with optimism about artificial intelligence. While technology stocks performed very well, the value style outpaced growth on a global basis and contributed meaningfully to the markets’ strong showing. Emerging market equities also posted outsized returns. Bonds registered more modest gains, led by credit-oriented investments. Income was the primary contributor to total returns for fixed income instruments, as prices came under pressure from concerns about persistent inflation, global conflicts, energy prices, and mounting government debt across the developed world.
TOP PERFORMANCE CONTRIBUTORS
Equity allocation | U.S. equities made the most significant contribution to absolute performance, including the fund’s sizable allocation to large caps. International developed market equities further helped results, as did emerging market stocks. The real assets portfolio was an additional contributor with strong returns for the energy and metals & mining sectors.
Bond funds | The fixed-income allocation also contributed, albeit to a much lesser extent than equities due to its lower return and modest portfolio weighting.
TOP PERFORMANCE DETRACTORS
Specific positions | At a time of positive returns for most segments of the financial markets, the majority of the fund’s holdings recorded a gain. However, small positions in U.S. Treasury STRIPS (Separate Trading of Registered Interest and Principal of Securities) were adversely affected by rising yields.
The views expressed in this report are those of the portfolio management team and are subject to change. They are not meant as investment advice.
Fund Performance
The following graph compares the initial and subsequent account values at the end of each of the most recently completed 10 fiscal years of the fund (or for the life of the fund, if shorter). It assumes a $10,000 initial investment in the fund and in an appropriate, broad-based securities market index for the same period.
GROWTH OF $10,000
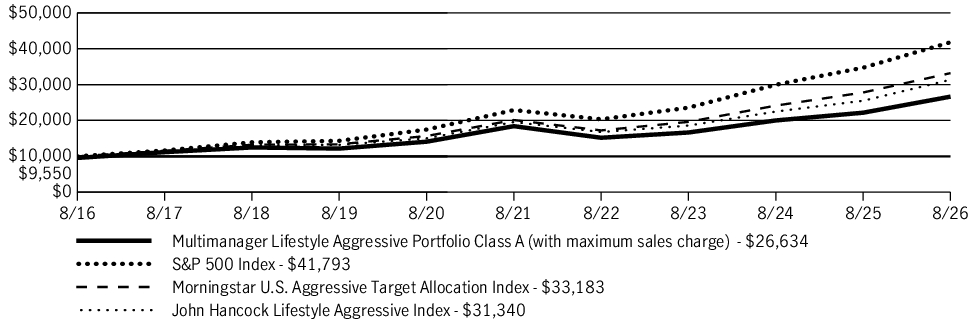
| AVERAGE ANNUAL TOTAL RETURN | 1 Year | 5 Years | 10 Years |
| Multimanager Lifestyle Aggressive Portfolio (Class A/JALAX) | 14.79% | 6.68% | 10.29% |
| Multimanager Lifestyle Aggressive Portfolio (Class A/JALAX)—excluding sales charge | 20.18% | 7.67% | 10.80% |
| S&P 500 Index | 20.38% | 12.79% | 15.37% |
| Morningstar U.S. Aggressive Target Allocation Index | 19.39% | 10.52% | 12.74% |
| John Hancock Lifestyle Aggressive Index | 22.90% | 9.90% | 12.10% |
Fund Statistics
| Fund net assets | $3,275,684,137 |
| Total number of portfolio holdings | 75 |
| Total advisory fees paid (net) | $2,418,232 |
| Portfolio turnover rate | 11% |
Graphical Representation of Holdings
The table below shows the investment makeup of the fund, representing a percentage of the total net assets of the fund.
Asset Allocation
| Affiliated investment companies | 99.5% |
| Equity | 93.2% |
| U.S. large cap | 38.0% |
| International equity | 28.2% |
| U.S. mid cap | 10.3% |
| Emerging-market equity | 7.3% |
| U.S. small cap | 4.9% |
| Large blend | 4.5% |
| Fixed income | 2.7% |
| Short-term bond | 1.8% |
| Emerging-market debt | 0.5% |
| High yield bond | 0.4% |
| Alternative and specialty | 3.6% |
| Sector equity | 3.1% |
| Absolute return | 0.5% |
| U.S. Government | 0.5% |
Holdings may not have been held by the fund for the entire period and are subject to change without notice. Portfolio composition is subject to review in accordance with the fund’s investment strategy and may vary in the future. Current and future portfolio holdings are subject to risk and may change at any time.
What were the fund costs during the last year ?
(Based on a hypothetical $10,000 investment)
| Fund (Class) | Costs of a $10,000 investment | Costs paid as a percentage of a $10,000 investment |
| Multimanager Lifestyle Aggressive Portfolio (Class 1/JILAX) |
$18 | 0.16% |
Management’s Discussion of Fund Performance
SUMMARY OF RESULTS
Multimanager Lifestyle Aggressive Portfolio (Class 1/JILAX) returned 20.67% for the year ended August 31, 2026. Global equities produced sizable gains in the 12-month period that ended on August 31, 2026. Investors were encouraged by the favorable combination of healthy economic growth trends, robust corporate earnings, and generally supportive central bank policies, together with optimism about artificial intelligence. While technology stocks performed very well, the value style outpaced growth on a global basis and contributed meaningfully to the markets’ strong showing. Emerging market equities also posted outsized returns. Bonds registered more modest gains, led by credit-oriented investments. Income was the primary contributor to total returns for fixed income instruments, as prices came under pressure from concerns about persistent inflation, global conflicts, energy prices, and mounting government debt across the developed world.
TOP PERFORMANCE CONTRIBUTORS
Equity allocation | U.S. equities made the most significant contribution to absolute performance, including the fund’s sizable allocation to large caps. International developed market equities further helped results, as did emerging market stocks. The real assets portfolio was an additional contributor with strong returns for the energy and metals & mining sectors.
Bond funds | The fixed-income allocation also contributed, albeit to a much lesser extent than equities due to its lower return and modest portfolio weighting.
TOP PERFORMANCE DETRACTORS
Specific positions | At a time of positive returns for most segments of the financial markets, the majority of the fund’s holdings recorded a gain. However, small positions in U.S. Treasury STRIPS (Separate Trading of Registered Interest and Principal of Securities) were adversely affected by rising yields.
The views expressed in this report are those of the portfolio management team and are subject to change. They are not meant as investment advice.
Fund Performance
The following graph compares the initial and subsequent account values at the end of each of the most recently completed 10 fiscal years of the fund (or for the life of the fund, if shorter). It assumes a $10,000 initial investment in the fund and in an appropriate, broad-based securities market index for the same period.
GROWTH OF $10,000
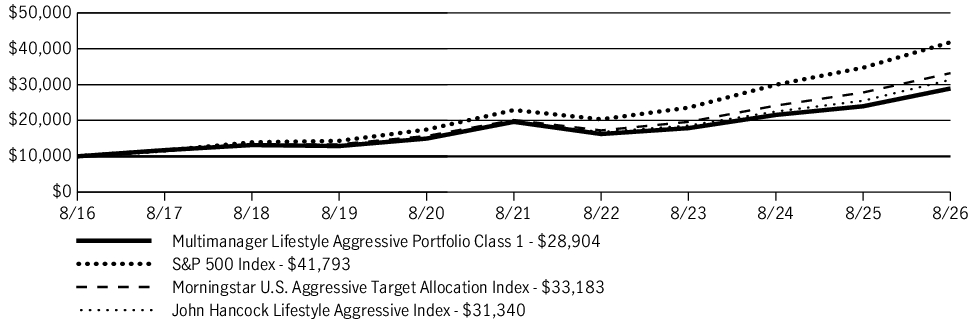
| AVERAGE ANNUAL TOTAL RETURN | 1 Year | 5 Years | 10 Years |
| Multimanager Lifestyle Aggressive Portfolio (Class 1/JILAX) | 20.67% | 8.07% | 11.20% |
| S&P 500 Index | 20.38% | 12.79% | 15.37% |
| Morningstar U.S. Aggressive Target Allocation Index | 19.39% | 10.52% | 12.74% |
| John Hancock Lifestyle Aggressive Index | 22.90% | 9.90% | 12.10% |
Fund Statistics
| Fund net assets | $3,275,684,137 |
| Total number of portfolio holdings | 75 |
| Total advisory fees paid (net) | $2,418,232 |
| Portfolio turnover rate | 11% |
Graphical Representation of Holdings
The table below shows the investment makeup of the fund, representing a percentage of the total net assets of the fund.
Asset Allocation
| Affiliated investment companies | 99.5% |
| Equity | 93.2% |
| U.S. large cap | 38.0% |
| International equity | 28.2% |
| U.S. mid cap | 10.3% |
| Emerging-market equity | 7.3% |
| U.S. small cap | 4.9% |
| Large blend | 4.5% |
| Fixed income | 2.7% |
| Short-term bond | 1.8% |
| Emerging-market debt | 0.5% |
| High yield bond | 0.4% |
| Alternative and specialty | 3.6% |
| Sector equity | 3.1% |
| Absolute return | 0.5% |
| U.S. Government | 0.5% |
Holdings may not have been held by the fund for the entire period and are subject to change without notice. Portfolio composition is subject to review in accordance with the fund’s investment strategy and may vary in the future. Current and future portfolio holdings are subject to risk and may change at any time.
What were the fund costs during the last year ?
(Based on a hypothetical $10,000 investment)
| Fund (Class) | Costs of a $10,000 investment | Costs paid as a percentage of a $10,000 investment |
| Multimanager Lifestyle Balanced Portfolio (Class 1/JILBX) |
$20 | 0.19% |
Management’s Discussion of Fund Performance
SUMMARY OF RESULTS
Multimanager Lifestyle Balanced Portfolio (Class 1/JILBX) returned 13.91% for the year ended August 31, 2026. Global equities produced sizable gains in the 12-month period that ended on August 31, 2026. Investors were encouraged by the favorable combination of healthy economic growth trends, robust corporate earnings, and generally supportive central bank policies, together with optimism about artificial intelligence. While technology stocks performed very well, the value style outpaced growth on a global basis and contributed meaningfully to the markets’ strong showing. Emerging market equities also posted outsized returns. Bonds registered more modest gains, led by credit-oriented investments. Income was the primary contributor to total returns for fixed income instruments, as prices came under pressure from concerns about persistent inflation, global conflicts, energy prices, and mounting government debt across the developed world.
TOP PERFORMANCE CONTRIBUTORS
Equity allocation | U.S. equities made the most significant contribution to absolute performance, including the fund’s sizable allocation to large caps. International developed market equities further helped results, as did emerging market stocks. The real assets portfolio was an additional contributor with strong returns for the energy and metals & mining sectors.
Bond funds | The fixed-income allocation also contributed, led by intermediate-term bonds, emerging markets debt, and multi-sector bonds. Holdings in high yield bonds, bank loans, and short-term bonds aided returns as well.
TOP PERFORMANCE DETRACTORS
Specific positions | At a time of positive returns for most segments of the financial markets, the majority of the fund’s holdings recorded a gain. However, small positions in U.S. Treasury STRIPS (Separate Trading of Registered Interest and Principal of Securities) were adversely affected by rising yields.
The views expressed in this report are those of the portfolio management team and are subject to change. They are not meant as investment advice.
Fund Performance
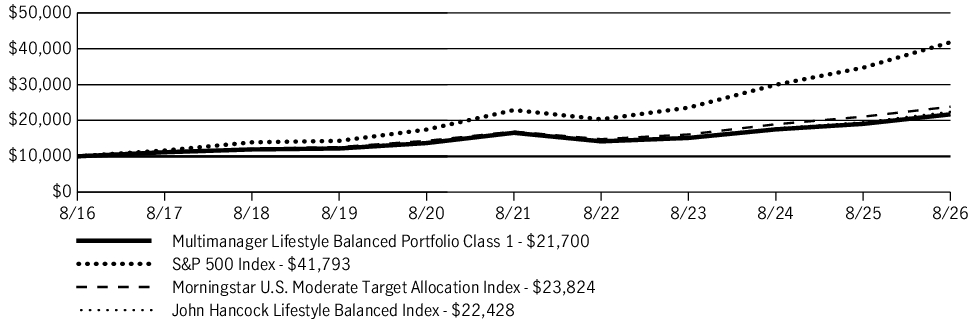
The following graph compares the initial and subsequent account values at the end of each of the most recently completed 10 fiscal years of the fund (or for the life of the fund, if shorter). It assumes a $10,000 initial investment in the fund and in an appropriate, broad-based securities market index for the same period.
GROWTH OF $10,000
| AVERAGE ANNUAL TOTAL RETURN | 1 Year | 5 Years | 10 Years |
| Multimanager Lifestyle Balanced Portfolio (Class 1/JILBX) | 13.91% | 5.56% | 8.06% |
| S&P 500 Index | 20.38% | 12.79% | 15.37% |
| Morningstar U.S. Moderate Target Allocation Index | 13.14% | 7.11% | 9.07% |
| John Hancock Lifestyle Balanced Index | 14.93% | 6.23% | 8.41% |
Fund Statistics
| Fund net assets | $7,077,903,528 |
| Total number of portfolio holdings | 85 |
| Total advisory fees paid (net) | $8,209,056 |
| Portfolio turnover rate | 12% |
Graphical Representation of Holdings
The table below shows the investment makeup of the fund, representing a percentage of the total net assets of the fund.
Asset Allocation
| Affiliated investment companies | 95.1% |
| Equity | 61.1% |
| U.S. large cap | 21.7% |
| International equity | 20.8% |
| U.S. mid cap | 6.4% |
| Large blend | 5.2% |
| Emerging-market equity | 4.4% |
| U.S. small cap | 2.6% |
| Fixed income | 31.2% |
| Intermediate bond | 13.1% |
| Multi-sector bond | 5.8% |
| Emerging-market debt | 3.5% |
| Short-term bond | 3.3% |
| Bank loan | 2.9% |
| High yield bond | 2.6% |
| Alternative and specialty | 2.8% |
| Sector equity | 1.8% |
| Absolute return | 0.5% |
| Multi-asset income | 0.5% |
| U.S. Government | 4.9% |
Holdings may not have been held by the fund for the entire period and are subject to change without notice. Portfolio composition is subject to review in accordance with the fund’s investment strategy and may vary in the future. Current and future portfolio holdings are subject to risk and may change at any time.
What were the fund costs during the last year ?
(Based on a hypothetical $10,000 investment)
| Fund (Class) | Costs of a $10,000 investment | Costs paid as a percentage of a $10,000 investment |
| Multimanager Lifestyle Balanced Portfolio (Class 5/JHLAX) |
$15 | 0.14% |
Management’s Discussion of Fund Performance
SUMMARY OF RESULTS
Multimanager Lifestyle Balanced Portfolio (Class 5/JHLAX) returned 14.03% for the year ended August 31, 2026. Global equities produced sizable gains in the 12-month period that ended on August 31, 2026. Investors were encouraged by the favorable combination of healthy economic growth trends, robust corporate earnings, and generally supportive central bank policies, together with optimism about artificial intelligence. While technology stocks performed very well, the value style outpaced growth on a global basis and contributed meaningfully to the markets’ strong showing. Emerging market equities also posted outsized returns. Bonds registered more modest gains, led by credit-oriented investments. Income was the primary contributor to total returns for fixed income instruments, as prices came under pressure from concerns about persistent inflation, global conflicts, energy prices, and mounting government debt across the developed world.
TOP PERFORMANCE CONTRIBUTORS
Equity allocation | U.S. equities made the most significant contribution to absolute performance, including the fund’s sizable allocation to large caps. International developed market equities further helped results, as did emerging market stocks. The real assets portfolio was an additional contributor with strong returns for the energy and metals & mining sectors.
Bond funds | The fixed-income allocation also contributed, led by intermediate-term bonds, emerging markets debt, and multi-sector bonds. Holdings in high yield bonds, bank loans, and short-term bonds aided returns as well.
TOP PERFORMANCE DETRACTORS
Specific positions | At a time of positive returns for most segments of the financial markets, the majority of the fund’s holdings recorded a gain. However, small positions in U.S. Treasury STRIPS (Separate Trading of Registered Interest and Principal of Securities) were adversely affected by rising yields.
The views expressed in this report are those of the portfolio management team and are subject to change. They are not meant as investment advice.
Fund Performance
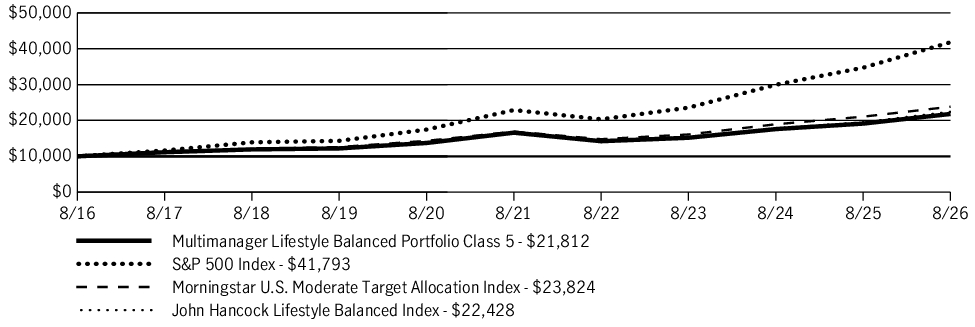
The following graph compares the initial and subsequent account values at the end of each of the most recently completed 10 fiscal years of the fund (or for the life of the fund, if shorter). It assumes a $10,000 initial investment in the fund and in an appropriate, broad-based securities market index for the same period.
GROWTH OF $10,000
| AVERAGE ANNUAL TOTAL RETURN | 1 Year | 5 Years | 10 Years |
| Multimanager Lifestyle Balanced Portfolio (Class 5/JHLAX) | 14.03% | 5.62% | 8.11% |
| S&P 500 Index | 20.38% | 12.79% | 15.37% |
| Morningstar U.S. Moderate Target Allocation Index | 13.14% | 7.11% | 9.07% |
| John Hancock Lifestyle Balanced Index | 14.93% | 6.23% | 8.41% |
Fund Statistics
| Fund net assets | $7,077,903,528 |
| Total number of portfolio holdings | 85 |
| Total advisory fees paid (net) | $8,209,056 |
| Portfolio turnover rate | 12% |
Graphical Representation of Holdings
The table below shows the investment makeup of the fund, representing a percentage of the total net assets of the fund.
Asset Allocation
| Affiliated investment companies | 95.1% |
| Equity | 61.1% |
| U.S. large cap | 21.7% |
| International equity | 20.8% |
| U.S. mid cap | 6.4% |
| Large blend | 5.2% |
| Emerging-market equity | 4.4% |
| U.S. small cap | 2.6% |
| Fixed income | 31.2% |
| Intermediate bond | 13.1% |
| Multi-sector bond | 5.8% |
| Emerging-market debt | 3.5% |
| Short-term bond | 3.3% |
| Bank loan | 2.9% |
| High yield bond | 2.6% |
| Alternative and specialty | 2.8% |
| Sector equity | 1.8% |
| Absolute return | 0.5% |
| Multi-asset income | 0.5% |
| U.S. Government | 4.9% |
Holdings may not have been held by the fund for the entire period and are subject to change without notice. Portfolio composition is subject to review in accordance with the fund’s investment strategy and may vary in the future. Current and future portfolio holdings are subject to risk and may change at any time.
What were the fund costs during the last year ?
(Based on a hypothetical $10,000 investment)
| Fund (Class) | Costs of a $10,000 investment | Costs paid as a percentage of a $10,000 investment |
| Multimanager Lifestyle Balanced Portfolio (Class A/JALBX) |
$59 | 0.55% |
Management’s Discussion of Fund Performance
SUMMARY OF RESULTS
Multimanager Lifestyle Balanced Portfolio (Class A/JALBX) returned 13.51% (excluding sales charges) for the year ended August 31, 2026. Global equities produced sizable gains in the 12-month period that ended on August 31, 2026. Investors were encouraged by the favorable combination of healthy economic growth trends, robust corporate earnings, and generally supportive central bank policies, together with optimism about artificial intelligence. While technology stocks performed very well, the value style outpaced growth on a global basis and contributed meaningfully to the markets’ strong showing. Emerging market equities also posted outsized returns. Bonds registered more modest gains, led by credit-oriented investments. Income was the primary contributor to total returns for fixed income instruments, as prices came under pressure from concerns about persistent inflation, global conflicts, energy prices, and mounting government debt across the developed world.
TOP PERFORMANCE CONTRIBUTORS
Equity allocation | U.S. equities made the most significant contribution to absolute performance, including the fund’s sizable allocation to large caps. International developed market equities further helped results, as did emerging market stocks. The real assets portfolio was an additional contributor with strong returns for the energy and metals & mining sectors.
Bond funds | The fixed-income allocation also contributed, led by intermediate-term bonds, emerging markets debt, and multi-sector bonds. Holdings in high yield bonds, bank loans, and short-term bonds aided returns as well.
TOP PERFORMANCE DETRACTORS
Specific positions | At a time of positive returns for most segments of the financial markets, the majority of the fund’s holdings recorded a gain. However, small positions in U.S. Treasury STRIPS (Separate Trading of Registered Interest and Principal of Securities) were adversely affected by rising yields.
The views expressed in this report are those of the portfolio management team and are subject to change. They are not meant as investment advice.
Fund Performance
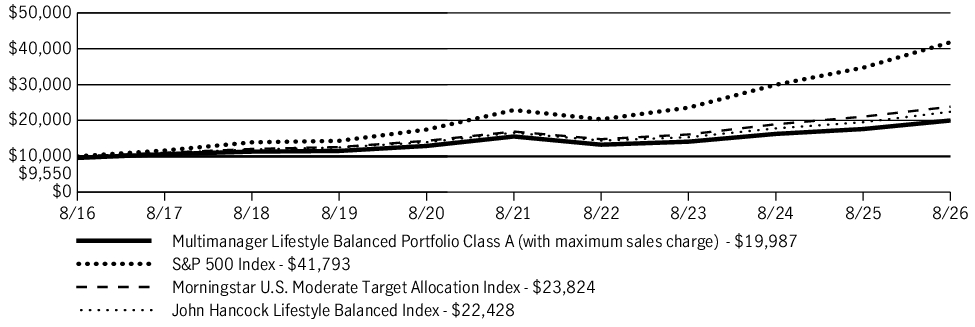
The following graph compares the initial and subsequent account values at the end of each of the most recently completed 10 fiscal years of the fund (or for the life of the fund, if shorter). It assumes a $10,000 initial investment in the fund and in an appropriate, broad-based securities market index for the same period.
GROWTH OF $10,000
| AVERAGE ANNUAL TOTAL RETURN | 1 Year | 5 Years | 10 Years |
| Multimanager Lifestyle Balanced Portfolio (Class A/JALBX) | 8.44% | 4.22% | 7.17% |
| Multimanager Lifestyle Balanced Portfolio (Class A/JALBX)—excluding sales charge | 13.51% | 5.18% | 7.67% |
| S&P 500 Index | 20.38% | 12.79% | 15.37% |
| Morningstar U.S. Moderate Target Allocation Index | 13.14% | 7.11% | 9.07% |
| John Hancock Lifestyle Balanced Index | 14.93% | 6.23% | 8.41% |
Fund Statistics
| Fund net assets | $7,077,903,528 |
| Total number of portfolio holdings | 85 |
| Total advisory fees paid (net) | $8,209,056 |
| Portfolio turnover rate | 12% |
Graphical Representation of Holdings
The table below shows the investment makeup of the fund, representing a percentage of the total net assets of the fund.
Asset Allocation
| Affiliated investment companies | 95.1% |
| Equity | 61.1% |
| U.S. large cap | 21.7% |
| International equity | 20.8% |
| U.S. mid cap | 6.4% |
| Large blend | 5.2% |
| Emerging-market equity | 4.4% |
| U.S. small cap | 2.6% |
| Fixed income | 31.2% |
| Intermediate bond | 13.1% |
| Multi-sector bond | 5.8% |
| Emerging-market debt | 3.5% |
| Short-term bond | 3.3% |
| Bank loan | 2.9% |
| High yield bond | 2.6% |
| Alternative and specialty | 2.8% |
| Sector equity | 1.8% |
| Absolute return | 0.5% |
| Multi-asset income | 0.5% |
| U.S. Government | 4.9% |
Holdings may not have been held by the fund for the entire period and are subject to change without notice. Portfolio composition is subject to review in accordance with the fund’s investment strategy and may vary in the future. Current and future portfolio holdings are subject to risk and may change at any time.
What were the fund costs during the last year ?
(Based on a hypothetical $10,000 investment)
| Fund (Class) | Costs of a $10,000 investment | Costs paid as a percentage of a $10,000 investment |
| Multimanager Lifestyle Balanced Portfolio (Class C/JCLBX) |
$133 | 1.25% |
Management’s Discussion of Fund Performance
SUMMARY OF RESULTS
Multimanager Lifestyle Balanced Portfolio (Class C/JCLBX) returned 12.72% (excluding sales charges) for the year ended August 31, 2026. Global equities produced sizable gains in the 12-month period that ended on August 31, 2026. Investors were encouraged by the favorable combination of healthy economic growth trends, robust corporate earnings, and generally supportive central bank policies, together with optimism about artificial intelligence. While technology stocks performed very well, the value style outpaced growth on a global basis and contributed meaningfully to the markets’ strong showing. Emerging market equities also posted outsized returns. Bonds registered more modest gains, led by credit-oriented investments. Income was the primary contributor to total returns for fixed income instruments, as prices came under pressure from concerns about persistent inflation, global conflicts, energy prices, and mounting government debt across the developed world.
TOP PERFORMANCE CONTRIBUTORS
Equity allocation | U.S. equities made the most significant contribution to absolute performance, including the fund’s sizable allocation to large caps. International developed market equities further helped results, as did emerging market stocks. The real assets portfolio was an additional contributor with strong returns for the energy and metals & mining sectors.
Bond funds | The fixed-income allocation also contributed, led by intermediate-term bonds, emerging markets debt, and multi-sector bonds. Holdings in high yield bonds, bank loans, and short-term bonds aided returns as well.
TOP PERFORMANCE DETRACTORS
Specific positions | At a time of positive returns for most segments of the financial markets, the majority of the fund’s holdings recorded a gain. However, small positions in U.S. Treasury STRIPS (Separate Trading of Registered Interest and Principal of Securities) were adversely affected by rising yields.
The views expressed in this report are those of the portfolio management team and are subject to change. They are not meant as investment advice.
Fund Performance
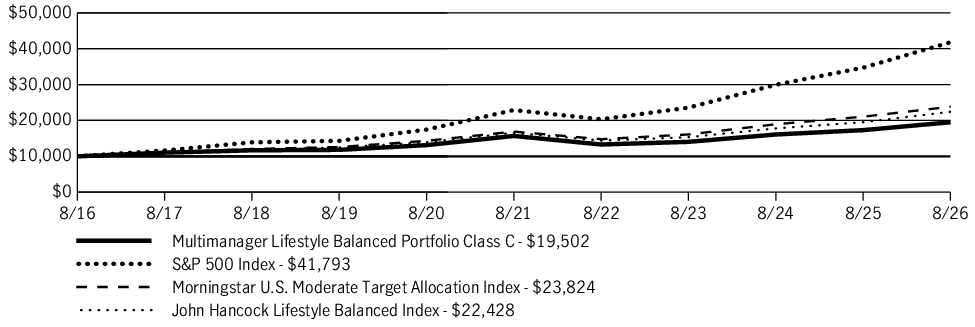
The following graph compares the initial and subsequent account values at the end of each of the most recently completed 10 fiscal years of the fund (or for the life of the fund, if shorter). It assumes a $10,000 initial investment in the fund and in an appropriate, broad-based securities market index for the same period.
GROWTH OF $10,000
| AVERAGE ANNUAL TOTAL RETURN | 1 Year | 5 Years | 10 Years |
| Multimanager Lifestyle Balanced Portfolio (Class C/JCLBX) | 11.72% | 4.46% | 6.91% |
| Multimanager Lifestyle Balanced Portfolio (Class C/JCLBX)—excluding sales charge | 12.72% | 4.46% | 6.91% |
| S&P 500 Index | 20.38% | 12.79% | 15.37% |
| Morningstar U.S. Moderate Target Allocation Index | 13.14% | 7.11% | 9.07% |
| John Hancock Lifestyle Balanced Index | 14.93% | 6.23% | 8.41% |
Fund Statistics
| Fund net assets | $7,077,903,528 |
| Total number of portfolio holdings | 85 |
| Total advisory fees paid (net) | $8,209,056 |
| Portfolio turnover rate | 12% |
Graphical Representation of Holdings
The table below shows the investment makeup of the fund, representing a percentage of the total net assets of the fund.
Asset Allocation
| Affiliated investment companies | 95.1% |
| Equity | 61.1% |
| U.S. large cap | 21.7% |
| International equity | 20.8% |
| U.S. mid cap | 6.4% |
| Large blend | 5.2% |
| Emerging-market equity | 4.4% |
| U.S. small cap | 2.6% |
| Fixed income | 31.2% |
| Intermediate bond | 13.1% |
| Multi-sector bond | 5.8% |
| Emerging-market debt | 3.5% |
| Short-term bond | 3.3% |
| Bank loan | 2.9% |
| High yield bond | 2.6% |
| Alternative and specialty | 2.8% |
| Sector equity | 1.8% |
| Absolute return | 0.5% |
| Multi-asset income | 0.5% |
| U.S. Government | 4.9% |
Holdings may not have been held by the fund for the entire period and are subject to change without notice. Portfolio composition is subject to review in accordance with the fund’s investment strategy and may vary in the future. Current and future portfolio holdings are subject to risk and may change at any time.
What were the fund costs during the last year ?
(Based on a hypothetical $10,000 investment)
| Fund (Class) | Costs of a $10,000 investment | Costs paid as a percentage of a $10,000 investment |
| Multimanager Lifestyle Balanced Portfolio (Class I/JTBIX) |
$27 | 0.25% |
Management’s Discussion of Fund Performance
SUMMARY OF RESULTS
Multimanager Lifestyle Balanced Portfolio (Class I/JTBIX) returned 13.92% for the year ended August 31, 2026. Global equities produced sizable gains in the 12-month period that ended on August 31, 2026. Investors were encouraged by the favorable combination of healthy economic growth trends, robust corporate earnings, and generally supportive central bank policies, together with optimism about artificial intelligence. While technology stocks performed very well, the value style outpaced growth on a global basis and contributed meaningfully to the markets’ strong showing. Emerging market equities also posted outsized returns. Bonds registered more modest gains, led by credit-oriented investments. Income was the primary contributor to total returns for fixed income instruments, as prices came under pressure from concerns about persistent inflation, global conflicts, energy prices, and mounting government debt across the developed world.
TOP PERFORMANCE CONTRIBUTORS
Equity allocation | U.S. equities made the most significant contribution to absolute performance, including the fund’s sizable allocation to large caps. International developed market equities further helped results, as did emerging market stocks. The real assets portfolio was an additional contributor with strong returns for the energy and metals & mining sectors.
Bond funds | The fixed-income allocation also contributed, led by intermediate-term bonds, emerging markets debt, and multi-sector bonds. Holdings in high yield bonds, bank loans, and short-term bonds aided returns as well.
TOP PERFORMANCE DETRACTORS
Specific positions | At a time of positive returns for most segments of the financial markets, the majority of the fund’s holdings recorded a gain. However, small positions in U.S. Treasury STRIPS (Separate Trading of Registered Interest and Principal of Securities) were adversely affected by rising yields.
The views expressed in this report are those of the portfolio management team and are subject to change. They are not meant as investment advice.
Fund Performance
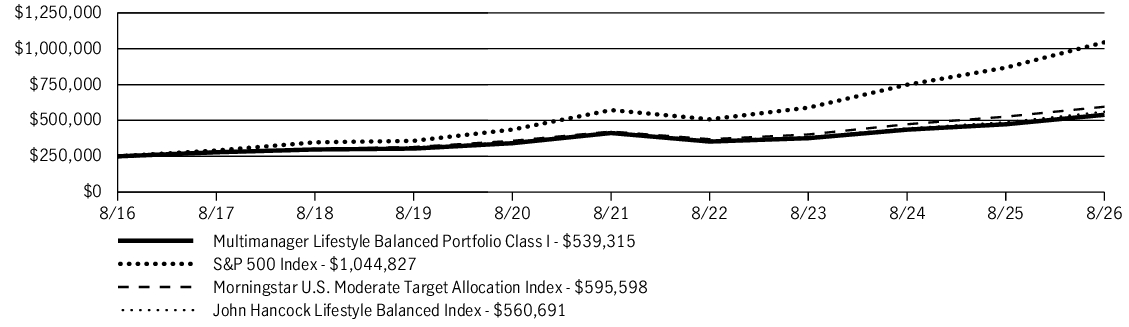
The following graph compares the initial and subsequent account values at the end of each of the most recently completed 10 fiscal years of the fund (or for the life of the fund, if shorter). It assumes a $250,000 initial investment in the fund and in an appropriate, broad-based securities market index for the same period.
GROWTH OF $250,000
| AVERAGE ANNUAL TOTAL RETURN | 1 Year | 5 Years | 10 Years |
| Multimanager Lifestyle Balanced Portfolio (Class I/JTBIX) | 13.92% | 5.51% | 7.99% |
| S&P 500 Index | 20.38% | 12.79% | 15.37% |
| Morningstar U.S. Moderate Target Allocation Index | 13.14% | 7.11% | 9.07% |
| John Hancock Lifestyle Balanced Index | 14.93% | 6.23% | 8.41% |
Fund Statistics
| Fund net assets | $7,077,903,528 |
| Total number of portfolio holdings | 85 |
| Total advisory fees paid (net) | $8,209,056 |
| Portfolio turnover rate | 12% |
Graphical Representation of Holdings
The table below shows the investment makeup of the fund, representing a percentage of the total net assets of the fund.
Asset Allocation
| Affiliated investment companies | 95.1% |
| Equity | 61.1% |
| U.S. large cap | 21.7% |
| International equity | 20.8% |
| U.S. mid cap | 6.4% |
| Large blend | 5.2% |
| Emerging-market equity | 4.4% |
| U.S. small cap | 2.6% |
| Fixed income | 31.2% |
| Intermediate bond | 13.1% |
| Multi-sector bond | 5.8% |
| Emerging-market debt | 3.5% |
| Short-term bond | 3.3% |
| Bank loan | 2.9% |
| High yield bond | 2.6% |
| Alternative and specialty | 2.8% |
| Sector equity | 1.8% |
| Absolute return | 0.5% |
| Multi-asset income | 0.5% |
| U.S. Government | 4.9% |
Holdings may not have been held by the fund for the entire period and are subject to change without notice. Portfolio composition is subject to review in accordance with the fund’s investment strategy and may vary in the future. Current and future portfolio holdings are subject to risk and may change at any time.
What were the fund costs during the last year ?
(Based on a hypothetical $10,000 investment)
| Fund (Class) | Costs of a $10,000 investment | Costs paid as a percentage of a $10,000 investment |
| Multimanager Lifestyle Balanced Portfolio (Class R2/JQLBX) |
$68 | 0.64% |
Management’s Discussion of Fund Performance
SUMMARY OF RESULTS
Multimanager Lifestyle Balanced Portfolio (Class R2/JQLBX) returned 13.51% for the year ended August 31, 2026. Global equities produced sizable gains in the 12-month period that ended on August 31, 2026. Investors were encouraged by the favorable combination of healthy economic growth trends, robust corporate earnings, and generally supportive central bank policies, together with optimism about artificial intelligence. While technology stocks performed very well, the value style outpaced growth on a global basis and contributed meaningfully to the markets’ strong showing. Emerging market equities also posted outsized returns. Bonds registered more modest gains, led by credit-oriented investments. Income was the primary contributor to total returns for fixed income instruments, as prices came under pressure from concerns about persistent inflation, global conflicts, energy prices, and mounting government debt across the developed world.
TOP PERFORMANCE CONTRIBUTORS
Equity allocation | U.S. equities made the most significant contribution to absolute performance, including the fund’s sizable allocation to large caps. International developed market equities further helped results, as did emerging market stocks. The real assets portfolio was an additional contributor with strong returns for the energy and metals & mining sectors.
Bond funds | The fixed-income allocation also contributed, led by intermediate-term bonds, emerging markets debt, and multi-sector bonds. Holdings in high yield bonds, bank loans, and short-term bonds aided returns as well.
TOP PERFORMANCE DETRACTORS
Specific positions | At a time of positive returns for most segments of the financial markets, the majority of the fund’s holdings recorded a gain. However, small positions in U.S. Treasury STRIPS (Separate Trading of Registered Interest and Principal of Securities) were adversely affected by rising yields.
The views expressed in this report are those of the portfolio management team and are subject to change. They are not meant as investment advice.
Fund Performance
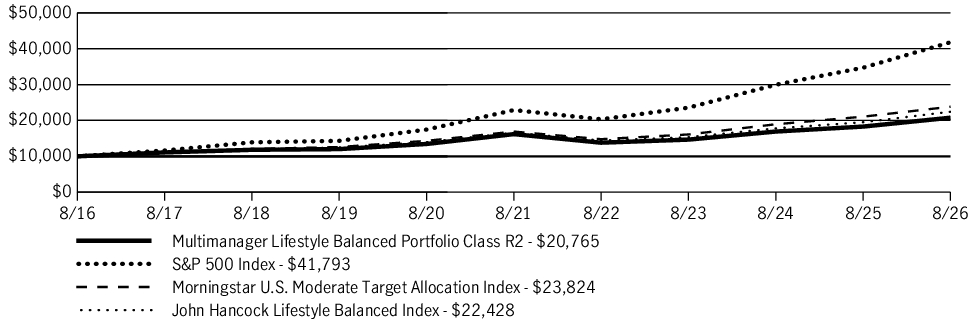
The following graph compares the initial and subsequent account values at the end of each of the most recently completed 10 fiscal years of the fund (or for the life of the fund, if shorter). It assumes a $10,000 initial investment in the fund and in an appropriate, broad-based securities market index for the same period.
GROWTH OF $10,000
| AVERAGE ANNUAL TOTAL RETURN | 1 Year | 5 Years | 10 Years |
| Multimanager Lifestyle Balanced Portfolio (Class R2/JQLBX) | 13.51% | 5.10% | 7.58% |
| S&P 500 Index | 20.38% | 12.79% | 15.37% |
| Morningstar U.S. Moderate Target Allocation Index | 13.14% | 7.11% | 9.07% |
| John Hancock Lifestyle Balanced Index | 14.93% | 6.23% | 8.41% |
Fund Statistics
| Fund net assets | $7,077,903,528 |
| Total number of portfolio holdings | 85 |
| Total advisory fees paid (net) | $8,209,056 |
| Portfolio turnover rate | 12% |
Graphical Representation of Holdings
The table below shows the investment makeup of the fund, representing a percentage of the total net assets of the fund.
Asset Allocation
| Affiliated investment companies | 95.1% |
| Equity | 61.1% |
| U.S. large cap | 21.7% |
| International equity | 20.8% |
| U.S. mid cap | 6.4% |
| Large blend | 5.2% |
| Emerging-market equity | 4.4% |
| U.S. small cap | 2.6% |
| Fixed income | 31.2% |
| Intermediate bond | 13.1% |
| Multi-sector bond | 5.8% |
| Emerging-market debt | 3.5% |
| Short-term bond | 3.3% |
| Bank loan | 2.9% |
| High yield bond | 2.6% |
| Alternative and specialty | 2.8% |
| Sector equity | 1.8% |
| Absolute return | 0.5% |
| Multi-asset income | 0.5% |
| U.S. Government | 4.9% |
Holdings may not have been held by the fund for the entire period and are subject to change without notice. Portfolio composition is subject to review in accordance with the fund’s investment strategy and may vary in the future. Current and future portfolio holdings are subject to risk and may change at any time.
What were the fund costs during the last year ?
(Based on a hypothetical $10,000 investment)
| Fund (Class) | Costs of a $10,000 investment | Costs paid as a percentage of a $10,000 investment |
| Multimanager Lifestyle Balanced Portfolio (Class R4/JSLBX) |
$43 | 0.40% |
Management’s Discussion of Fund Performance
SUMMARY OF RESULTS
Multimanager Lifestyle Balanced Portfolio (Class R4/JSLBX) returned 13.69% for the year ended August 31, 2026. Global equities produced sizable gains in the 12-month period that ended on August 31, 2026. Investors were encouraged by the favorable combination of healthy economic growth trends, robust corporate earnings, and generally supportive central bank policies, together with optimism about artificial intelligence. While technology stocks performed very well, the value style outpaced growth on a global basis and contributed meaningfully to the markets’ strong showing. Emerging market equities also posted outsized returns. Bonds registered more modest gains, led by credit-oriented investments. Income was the primary contributor to total returns for fixed income instruments, as prices came under pressure from concerns about persistent inflation, global conflicts, energy prices, and mounting government debt across the developed world.
TOP PERFORMANCE CONTRIBUTORS
Equity allocation | U.S. equities made the most significant contribution to absolute performance, including the fund’s sizable allocation to large caps. International developed market equities further helped results, as did emerging market stocks. The real assets portfolio was an additional contributor with strong returns for the energy and metals & mining sectors.
Bond funds | The fixed-income allocation also contributed, led by intermediate-term bonds, emerging markets debt, and multi-sector bonds. Holdings in high yield bonds, bank loans, and short-term bonds aided returns as well.
TOP PERFORMANCE DETRACTORS
Specific positions | At a time of positive returns for most segments of the financial markets, the majority of the fund’s holdings recorded a gain. However, small positions in U.S. Treasury STRIPS (Separate Trading of Registered Interest and Principal of Securities) were adversely affected by rising yields.
The views expressed in this report are those of the portfolio management team and are subject to change. They are not meant as investment advice.
Fund Performance
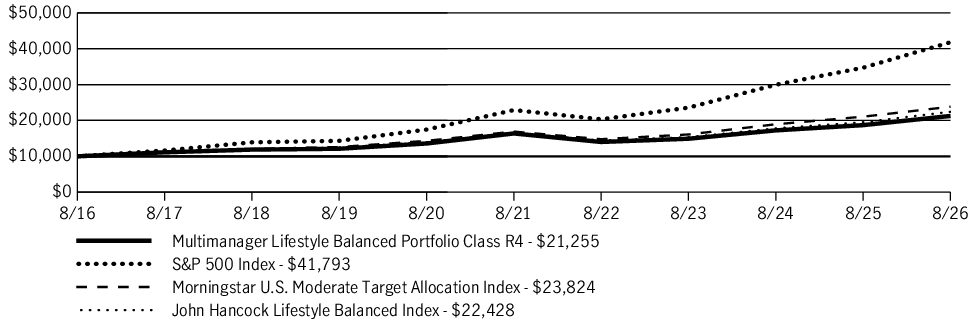
The following graph compares the initial and subsequent account values at the end of each of the most recently completed 10 fiscal years of the fund (or for the life of the fund, if shorter). It assumes a $10,000 initial investment in the fund and in an appropriate, broad-based securities market index for the same period.
GROWTH OF $10,000
| AVERAGE ANNUAL TOTAL RETURN | 1 Year | 5 Years | 10 Years |
| Multimanager Lifestyle Balanced Portfolio (Class R4/JSLBX) | 13.69% | 5.36% | 7.83% |
| S&P 500 Index | 20.38% | 12.79% | 15.37% |
| Morningstar U.S. Moderate Target Allocation Index | 13.14% | 7.11% | 9.07% |
| John Hancock Lifestyle Balanced Index | 14.93% | 6.23% | 8.41% |
Fund Statistics
| Fund net assets | $7,077,903,528 |
| Total number of portfolio holdings | 85 |
| Total advisory fees paid (net) | $8,209,056 |
| Portfolio turnover rate | 12% |
Graphical Representation of Holdings
The table below shows the investment makeup of the fund, representing a percentage of the total net assets of the fund.
Asset Allocation
| Affiliated investment companies | 95.1% |
| Equity | 61.1% |
| U.S. large cap | 21.7% |
| International equity | 20.8% |
| U.S. mid cap | 6.4% |
| Large blend | 5.2% |
| Emerging-market equity | 4.4% |
| U.S. small cap | 2.6% |
| Fixed income | 31.2% |
| Intermediate bond | 13.1% |
| Multi-sector bond | 5.8% |
| Emerging-market debt | 3.5% |
| Short-term bond | 3.3% |
| Bank loan | 2.9% |
| High yield bond | 2.6% |
| Alternative and specialty | 2.8% |
| Sector equity | 1.8% |
| Absolute return | 0.5% |
| Multi-asset income | 0.5% |
| U.S. Government | 4.9% |
Holdings may not have been held by the fund for the entire period and are subject to change without notice. Portfolio composition is subject to review in accordance with the fund’s investment strategy and may vary in the future. Current and future portfolio holdings are subject to risk and may change at any time.
What were the fund costs during the last year ?
(Based on a hypothetical $10,000 investment)
| Fund (Class) | Costs of a $10,000 investment | Costs paid as a percentage of a $10,000 investment |
| Multimanager Lifestyle Balanced Portfolio (Class R5/JTSBX) |
$21 | 0.20% |
Management’s Discussion of Fund Performance
SUMMARY OF RESULTS
Multimanager Lifestyle Balanced Portfolio (Class R5/JTSBX) returned 13.91% for the year ended August 31, 2026. Global equities produced sizable gains in the 12-month period that ended on August 31, 2026. Investors were encouraged by the favorable combination of healthy economic growth trends, robust corporate earnings, and generally supportive central bank policies, together with optimism about artificial intelligence. While technology stocks performed very well, the value style outpaced growth on a global basis and contributed meaningfully to the markets’ strong showing. Emerging market equities also posted outsized returns. Bonds registered more modest gains, led by credit-oriented investments. Income was the primary contributor to total returns for fixed income instruments, as prices came under pressure from concerns about persistent inflation, global conflicts, energy prices, and mounting government debt across the developed world.
TOP PERFORMANCE CONTRIBUTORS
Equity allocation | U.S. equities made the most significant contribution to absolute performance, including the fund’s sizable allocation to large caps. International developed market equities further helped results, as did emerging market stocks. The real assets portfolio was an additional contributor with strong returns for the energy and metals & mining sectors.
Bond funds | The fixed-income allocation also contributed, led by intermediate-term bonds, emerging markets debt, and multi-sector bonds. Holdings in high yield bonds, bank loans, and short-term bonds aided returns as well.
TOP PERFORMANCE DETRACTORS
Specific positions | At a time of positive returns for most segments of the financial markets, the majority of the fund’s holdings recorded a gain. However, small positions in U.S. Treasury STRIPS (Separate Trading of Registered Interest and Principal of Securities) were adversely affected by rising yields.
The views expressed in this report are those of the portfolio management team and are subject to change. They are not meant as investment advice.
Fund Performance
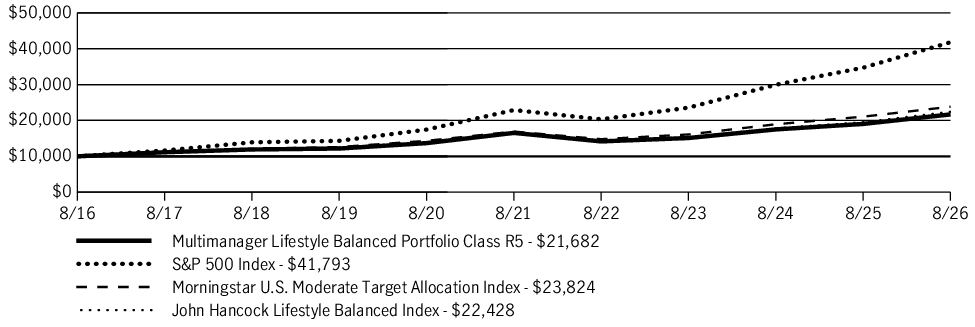
The following graph compares the initial and subsequent account values at the end of each of the most recently completed 10 fiscal years of the fund (or for the life of the fund, if shorter). It assumes a $10,000 initial investment in the fund and in an appropriate, broad-based securities market index for the same period.
GROWTH OF $10,000
| AVERAGE ANNUAL TOTAL RETURN | 1 Year | 5 Years | 10 Years |
| Multimanager Lifestyle Balanced Portfolio (Class R5/JTSBX) | 13.91% | 5.57% | 8.05% |
| S&P 500 Index | 20.38% | 12.79% | 15.37% |
| Morningstar U.S. Moderate Target Allocation Index | 13.14% | 7.11% | 9.07% |
| John Hancock Lifestyle Balanced Index | 14.93% | 6.23% | 8.41% |
Fund Statistics
| Fund net assets | $7,077,903,528 |
| Total number of portfolio holdings | 85 |
| Total advisory fees paid (net) | $8,209,056 |
| Portfolio turnover rate | 12% |
Graphical Representation of Holdings
The table below shows the investment makeup of the fund, representing a percentage of the total net assets of the fund.
Asset Allocation
| Affiliated investment companies | 95.1% |
| Equity | 61.1% |
| U.S. large cap | 21.7% |
| International equity | 20.8% |
| U.S. mid cap | 6.4% |
| Large blend | 5.2% |
| Emerging-market equity | 4.4% |
| U.S. small cap | 2.6% |
| Fixed income | 31.2% |
| Intermediate bond | 13.1% |
| Multi-sector bond | 5.8% |
| Emerging-market debt | 3.5% |
| Short-term bond | 3.3% |
| Bank loan | 2.9% |
| High yield bond | 2.6% |
| Alternative and specialty | 2.8% |
| Sector equity | 1.8% |
| Absolute return | 0.5% |
| Multi-asset income | 0.5% |
| U.S. Government | 4.9% |
Holdings may not have been held by the fund for the entire period and are subject to change without notice. Portfolio composition is subject to review in accordance with the fund’s investment strategy and may vary in the future. Current and future portfolio holdings are subject to risk and may change at any time.
What were the fund costs during the last year ?
(Based on a hypothetical $10,000 investment)
| Fund (Class) | Costs of a $10,000 investment | Costs paid as a percentage of a $10,000 investment |
| Multimanager Lifestyle Balanced Portfolio (Class R6/JULBX) |
$16 | 0.15% |
Management’s Discussion of Fund Performance
SUMMARY OF RESULTS
Multimanager Lifestyle Balanced Portfolio (Class R6/JULBX) returned 14.03% for the year ended August 31, 2026. Global equities produced sizable gains in the 12-month period that ended on August 31, 2026. Investors were encouraged by the favorable combination of healthy economic growth trends, robust corporate earnings, and generally supportive central bank policies, together with optimism about artificial intelligence. While technology stocks performed very well, the value style outpaced growth on a global basis and contributed meaningfully to the markets’ strong showing. Emerging market equities also posted outsized returns. Bonds registered more modest gains, led by credit-oriented investments. Income was the primary contributor to total returns for fixed income instruments, as prices came under pressure from concerns about persistent inflation, global conflicts, energy prices, and mounting government debt across the developed world.
TOP PERFORMANCE CONTRIBUTORS
Equity allocation | U.S. equities made the most significant contribution to absolute performance, including the fund’s sizable allocation to large caps. International developed market equities further helped results, as did emerging market stocks. The real assets portfolio was an additional contributor with strong returns for the energy and metals & mining sectors.
Bond funds | The fixed-income allocation also contributed, led by intermediate-term bonds, emerging markets debt, and multi-sector bonds. Holdings in high yield bonds, bank loans, and short-term bonds aided returns as well.
TOP PERFORMANCE DETRACTORS
Specific positions | At a time of positive returns for most segments of the financial markets, the majority of the fund’s holdings recorded a gain. However, small positions in U.S. Treasury STRIPS (Separate Trading of Registered Interest and Principal of Securities) were adversely affected by rising yields.
The views expressed in this report are those of the portfolio management team and are subject to change. They are not meant as investment advice.
Fund Performance
The following graph compares the initial and subsequent account values at the end of each of the most recently completed 10 fiscal years of the fund (or for the life of the fund, if shorter). It assumes a $1,000,000 initial investment in the fund and in an appropriate, broad-based securities market index for the same period.
GROWTH OF $1,000,000
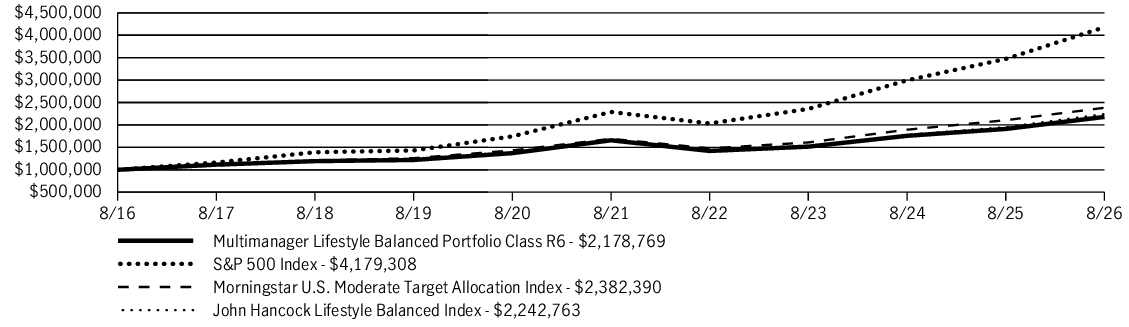
| AVERAGE ANNUAL TOTAL RETURN | 1 Year | 5 Years | 10 Years |
| Multimanager Lifestyle Balanced Portfolio (Class R6/JULBX) | 14.03% | 5.62% | 8.10% |
| S&P 500 Index | 20.38% | 12.79% | 15.37% |
| Morningstar U.S. Moderate Target Allocation Index | 13.14% | 7.11% | 9.07% |
| John Hancock Lifestyle Balanced Index | 14.93% | 6.23% | 8.41% |
Fund Statistics
| Fund net assets | $7,077,903,528 |
| Total number of portfolio holdings | 85 |
| Total advisory fees paid (net) | $8,209,056 |
| Portfolio turnover rate | 12% |
Graphical Representation of Holdings
The table below shows the investment makeup of the fund, representing a percentage of the total net assets of the fund.
Asset Allocation
| Affiliated investment companies | 95.1% |
| Equity | 61.1% |
| U.S. large cap | 21.7% |
| International equity | 20.8% |
| U.S. mid cap | 6.4% |
| Large blend | 5.2% |
| Emerging-market equity | 4.4% |
| U.S. small cap | 2.6% |
| Fixed income | 31.2% |
| Intermediate bond | 13.1% |
| Multi-sector bond | 5.8% |
| Emerging-market debt | 3.5% |
| Short-term bond | 3.3% |
| Bank loan | 2.9% |
| High yield bond | 2.6% |
| Alternative and specialty | 2.8% |
| Sector equity | 1.8% |
| Absolute return | 0.5% |
| Multi-asset income | 0.5% |
| U.S. Government | 4.9% |
Holdings may not have been held by the fund for the entire period and are subject to change without notice. Portfolio composition is subject to review in accordance with the fund’s investment strategy and may vary in the future. Current and future portfolio holdings are subject to risk and may change at any time.
What were the fund costs during the last year ?
(Based on a hypothetical $10,000 investment)
| Fund (Class) | Costs of a $10,000 investment | Costs paid as a percentage of a $10,000 investment |
| Multimanager Lifestyle Conservative Portfolio (Class R6/JULCX) |
$22 | 0.21% |
Management’s Discussion of Fund Performance
SUMMARY OF RESULTS
Multimanager Lifestyle Conservative Portfolio (Class R6/JULCX) returned 6.43% for the year ended August 31, 2026. Global equities produced sizable gains in the 12-month period that ended on August 31, 2026. Investors were encouraged by the favorable combination of healthy economic growth trends, robust corporate earnings, and generally supportive central bank policies, together with optimism about artificial intelligence. While technology stocks performed very well, the value style outpaced growth on a global basis and contributed meaningfully to the markets’ strong showing. Emerging market equities also posted outsized returns. Bonds registered more modest gains, led by credit-oriented investments. Income was the primary contributor to total returns for fixed income instruments, as prices came under pressure from concerns about persistent inflation, global conflicts, energy prices, and mounting government debt across the developed world.
TOP PERFORMANCE CONTRIBUTORS
Equity allocation | U.S. equities made the most significant contribution to absolute performance, led by large cap equities. International developed market equities further helped results, as did emerging market stocks. Defensive equities also generated positive returns.
Bond funds | The fixed-income allocation contributed positively, led by intermediate-term bonds and emerging markets debt. Holdings in multi-sector bonds, high yield bonds, short-term bonds, bank loans, and short-term U.S. Treasury Inflation Protected Securities aided returns as well.
TOP PERFORMANCE DETRACTORS
No detractors | At a time of positive returns for most segments of the financial markets, none of the fund’s holdings detracted from absolute performance.
The views expressed in this report are those of the portfolio management team and are subject to change. They are not meant as investment advice.
Fund Performance
The following graph compares the initial and subsequent account values at the end of each of the most recently completed 10 fiscal years of the fund (or for the life of the fund, if shorter). It assumes a $1,000,000 initial investment in the fund and in an appropriate, broad-based securities market index for the same period.
GROWTH OF $1,000,000
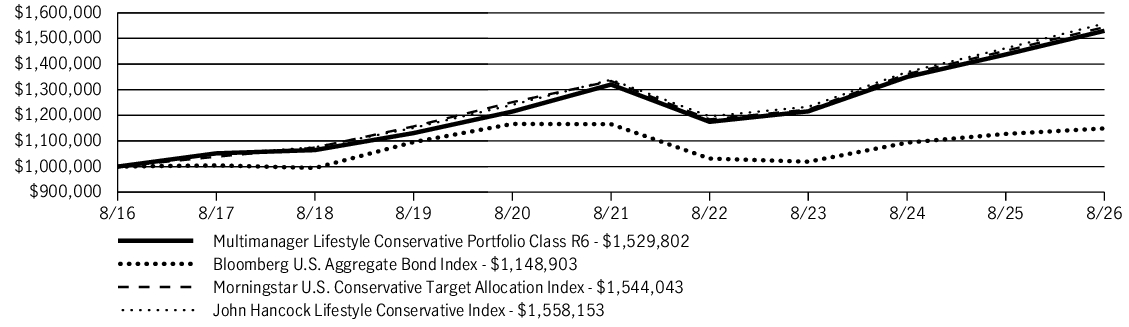
| AVERAGE ANNUAL TOTAL RETURN | 1 Year | 5 Years | 10 Years |
| Multimanager Lifestyle Conservative Portfolio (Class R6/JULCX) | 6.43% | 2.99% | 4.34% |
| Bloomberg U.S. Aggregate Bond Index | 1.89% | (0.29)% | 1.40% |
| Morningstar U.S. Conservative Target Allocation Index | 6.35% | 2.97% | 4.44% |
| John Hancock Lifestyle Conservative Index | 6.58% | 3.08% | 4.53% |
Fund Statistics
| Fund net assets | $1,422,833,140 |
| Total number of portfolio holdings | 26 |
| Total advisory fees paid (net) | $2,431,019 |
| Portfolio turnover rate | 13% |
Graphical Representation of Holdings
The table below shows the investment makeup of the fund, representing a percentage of the total net assets of the fund.
Asset Allocation
| Affiliated investment companies | 90.1% |
| Equity | 21.7% |
| International equity | 7.6% |
| U.S. large cap | 5.9% |
| Large blend | 4.4% |
| U.S. mid cap | 2.3% |
| U.S. small cap | 0.9% |
| Emerging-market equity | 0.6% |
| Fixed income | 66.4% |
| Intermediate bond | 32.7% |
| Multi-sector bond | 8.5% |
| Short-term bond | 7.7% |
| Emerging-market debt | 6.5% |
| Bank loan | 5.7% |
| High yield bond | 5.3% |
| Alternative and specialty | 2.0% |
| Multi-asset income | 2.0% |
| U.S. Government | 9.8% |
| Short-term investments and other | 0.1% |
Holdings may not have been held by the fund for the entire period and are subject to change without notice. Portfolio composition is subject to review in accordance with the fund’s investment strategy and may vary in the future. Current and future portfolio holdings are subject to risk and may change at any time.
What were the fund costs during the last year ?
(Based on a hypothetical $10,000 investment)
| Fund (Class) | Costs of a $10,000 investment | Costs paid as a percentage of a $10,000 investment |
| Multimanager Lifestyle Conservative Portfolio (Class R5/JTLRX) |
$26 | 0.25% |
Management’s Discussion of Fund Performance
SUMMARY OF RESULTS
Multimanager Lifestyle Conservative Portfolio (Class R5/JTLRX) returned 6.28% for the year ended August 31, 2026. Global equities produced sizable gains in the 12-month period that ended on August 31, 2026. Investors were encouraged by the favorable combination of healthy economic growth trends, robust corporate earnings, and generally supportive central bank policies, together with optimism about artificial intelligence. While technology stocks performed very well, the value style outpaced growth on a global basis and contributed meaningfully to the markets’ strong showing. Emerging market equities also posted outsized returns. Bonds registered more modest gains, led by credit-oriented investments. Income was the primary contributor to total returns for fixed income instruments, as prices came under pressure from concerns about persistent inflation, global conflicts, energy prices, and mounting government debt across the developed world.
TOP PERFORMANCE CONTRIBUTORS
Equity allocation | U.S. equities made the most significant contribution to absolute performance, led by large cap equities. International developed market equities further helped results, as did emerging market stocks. Defensive equities also generated positive returns.
Bond funds | The fixed-income allocation contributed positively, led by intermediate-term bonds and emerging markets debt. Holdings in multi-sector bonds, high yield bonds, short-term bonds, bank loans, and short-term U.S. Treasury Inflation Protected Securities aided returns as well.
TOP PERFORMANCE DETRACTORS
No detractors | At a time of positive returns for most segments of the financial markets, none of the fund’s holdings detracted from absolute performance.
The views expressed in this report are those of the portfolio management team and are subject to change. They are not meant as investment advice.
Fund Performance
The following graph compares the initial and subsequent account values at the end of each of the most recently completed 10 fiscal years of the fund (or for the life of the fund, if shorter). It assumes a $10,000 initial investment in the fund and in an appropriate, broad-based securities market index for the same period.
GROWTH OF $10,000
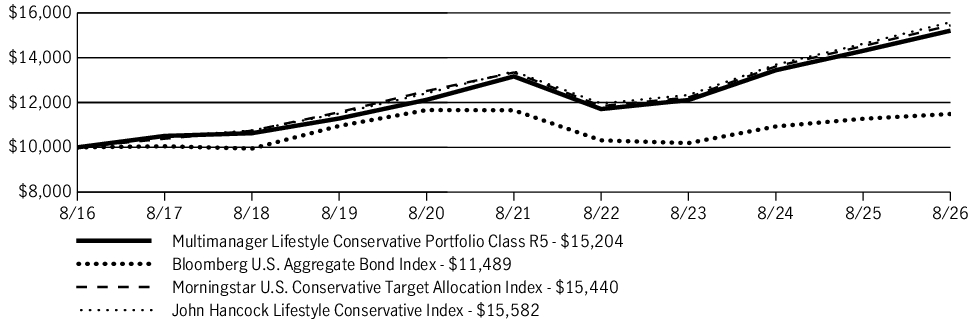
| AVERAGE ANNUAL TOTAL RETURN | 1 Year | 5 Years | 10 Years |
| Multimanager Lifestyle Conservative Portfolio (Class R5/JTLRX) | 6.28% | 2.92% | 4.28% |
| Bloomberg U.S. Aggregate Bond Index | 1.89% | (0.29)% | 1.40% |
| Morningstar U.S. Conservative Target Allocation Index | 6.35% | 2.97% | 4.44% |
| John Hancock Lifestyle Conservative Index | 6.58% | 3.08% | 4.53% |
Fund Statistics
| Fund net assets | $1,422,833,140 |
| Total number of portfolio holdings | 26 |
| Total advisory fees paid (net) | $2,431,019 |
| Portfolio turnover rate | 13% |
Graphical Representation of Holdings
The table below shows the investment makeup of the fund, representing a percentage of the total net assets of the fund.
Asset Allocation
| Affiliated investment companies | 90.1% |
| Equity | 21.7% |
| International equity | 7.6% |
| U.S. large cap | 5.9% |
| Large blend | 4.4% |
| U.S. mid cap | 2.3% |
| U.S. small cap | 0.9% |
| Emerging-market equity | 0.6% |
| Fixed income | 66.4% |
| Intermediate bond | 32.7% |
| Multi-sector bond | 8.5% |
| Short-term bond | 7.7% |
| Emerging-market debt | 6.5% |
| Bank loan | 5.7% |
| High yield bond | 5.3% |
| Alternative and specialty | 2.0% |
| Multi-asset income | 2.0% |
| U.S. Government | 9.8% |
| Short-term investments and other | 0.1% |
Holdings may not have been held by the fund for the entire period and are subject to change without notice. Portfolio composition is subject to review in accordance with the fund’s investment strategy and may vary in the future. Current and future portfolio holdings are subject to risk and may change at any time.
What were the fund costs during the last year ?
(Based on a hypothetical $10,000 investment)
| Fund (Class) | Costs of a $10,000 investment | Costs paid as a percentage of a $10,000 investment |
| Multimanager Lifestyle Conservative Portfolio (Class R4/JSLCX) |
$46 | 0.45% |
Management’s Discussion of Fund Performance
SUMMARY OF RESULTS
Multimanager Lifestyle Conservative Portfolio (Class R4/JSLCX) returned 6.08% for the year ended August 31, 2026. Global equities produced sizable gains in the 12-month period that ended on August 31, 2026. Investors were encouraged by the favorable combination of healthy economic growth trends, robust corporate earnings, and generally supportive central bank policies, together with optimism about artificial intelligence. While technology stocks performed very well, the value style outpaced growth on a global basis and contributed meaningfully to the markets’ strong showing. Emerging market equities also posted outsized returns. Bonds registered more modest gains, led by credit-oriented investments. Income was the primary contributor to total returns for fixed income instruments, as prices came under pressure from concerns about persistent inflation, global conflicts, energy prices, and mounting government debt across the developed world.
TOP PERFORMANCE CONTRIBUTORS
Equity allocation | U.S. equities made the most significant contribution to absolute performance, led by large cap equities. International developed market equities further helped results, as did emerging market stocks. Defensive equities also generated positive returns.
Bond funds | The fixed-income allocation contributed positively, led by intermediate-term bonds and emerging markets debt. Holdings in multi-sector bonds, high yield bonds, short-term bonds, bank loans, and short-term U.S. Treasury Inflation Protected Securities aided returns as well.
TOP PERFORMANCE DETRACTORS
No detractors | At a time of positive returns for most segments of the financial markets, none of the fund’s holdings detracted from absolute performance.
The views expressed in this report are those of the portfolio management team and are subject to change. They are not meant as investment advice.
Fund Performance
The following graph compares the initial and subsequent account values at the end of each of the most recently completed 10 fiscal years of the fund (or for the life of the fund, if shorter). It assumes a $10,000 initial investment in the fund and in an appropriate, broad-based securities market index for the same period.
GROWTH OF $10,000
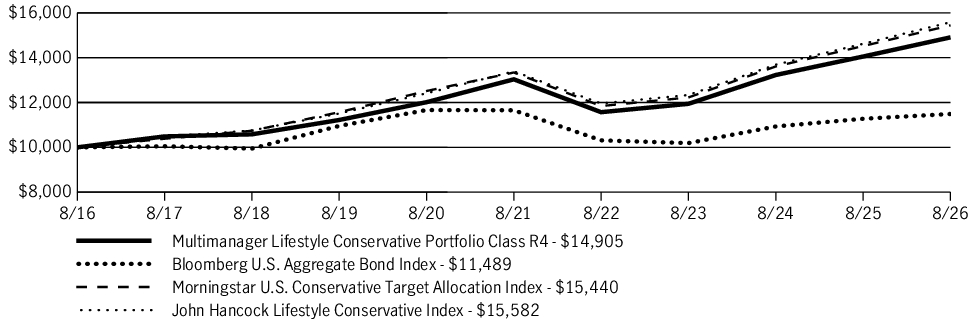
| AVERAGE ANNUAL TOTAL RETURN | 1 Year | 5 Years | 10 Years |
| Multimanager Lifestyle Conservative Portfolio (Class R4/JSLCX) | 6.08% | 2.72% | 4.07% |
| Bloomberg U.S. Aggregate Bond Index | 1.89% | (0.29)% | 1.40% |
| Morningstar U.S. Conservative Target Allocation Index | 6.35% | 2.97% | 4.44% |
| John Hancock Lifestyle Conservative Index | 6.58% | 3.08% | 4.53% |
Fund Statistics
| Fund net assets | $1,422,833,140 |
| Total number of portfolio holdings | 26 |
| Total advisory fees paid (net) | $2,431,019 |
| Portfolio turnover rate | 13% |
Graphical Representation of Holdings
The table below shows the investment makeup of the fund, representing a percentage of the total net assets of the fund.
Asset Allocation
| Affiliated investment companies | 90.1% |
| Equity | 21.7% |
| International equity | 7.6% |
| U.S. large cap | 5.9% |
| Large blend | 4.4% |
| U.S. mid cap | 2.3% |
| U.S. small cap | 0.9% |
| Emerging-market equity | 0.6% |
| Fixed income | 66.4% |
| Intermediate bond | 32.7% |
| Multi-sector bond | 8.5% |
| Short-term bond | 7.7% |
| Emerging-market debt | 6.5% |
| Bank loan | 5.7% |
| High yield bond | 5.3% |
| Alternative and specialty | 2.0% |
| Multi-asset income | 2.0% |
| U.S. Government | 9.8% |
| Short-term investments and other | 0.1% |
Holdings may not have been held by the fund for the entire period and are subject to change without notice. Portfolio composition is subject to review in accordance with the fund’s investment strategy and may vary in the future. Current and future portfolio holdings are subject to risk and may change at any time.
What were the fund costs during the last year ?
(Based on a hypothetical $10,000 investment)
| Fund (Class) | Costs of a $10,000 investment | Costs paid as a percentage of a $10,000 investment |
| Multimanager Lifestyle Conservative Portfolio (Class R2/JQLCX) |
$70 | 0.68% |
Management’s Discussion of Fund Performance
SUMMARY OF RESULTS
Multimanager Lifestyle Conservative Portfolio (Class R2/JQLCX) returned 5.91% for the year ended August 31, 2026. Global equities produced sizable gains in the 12-month period that ended on August 31, 2026. Investors were encouraged by the favorable combination of healthy economic growth trends, robust corporate earnings, and generally supportive central bank policies, together with optimism about artificial intelligence. While technology stocks performed very well, the value style outpaced growth on a global basis and contributed meaningfully to the markets’ strong showing. Emerging market equities also posted outsized returns. Bonds registered more modest gains, led by credit-oriented investments. Income was the primary contributor to total returns for fixed income instruments, as prices came under pressure from concerns about persistent inflation, global conflicts, energy prices, and mounting government debt across the developed world.
TOP PERFORMANCE CONTRIBUTORS
Equity allocation | U.S. equities made the most significant contribution to absolute performance, led by large cap equities. International developed market equities further helped results, as did emerging market stocks. Defensive equities also generated positive returns.
Bond funds | The fixed-income allocation contributed positively, led by intermediate-term bonds and emerging markets debt. Holdings in multi-sector bonds, high yield bonds, short-term bonds, bank loans, and short-term U.S. Treasury Inflation Protected Securities aided returns as well.
TOP PERFORMANCE DETRACTORS
No detractors | At a time of positive returns for most segments of the financial markets, none of the fund’s holdings detracted from absolute performance.
The views expressed in this report are those of the portfolio management team and are subject to change. They are not meant as investment advice.
Fund Performance
The following graph compares the initial and subsequent account values at the end of each of the most recently completed 10 fiscal years of the fund (or for the life of the fund, if shorter). It assumes a $10,000 initial investment in the fund and in an appropriate, broad-based securities market index for the same period.
GROWTH OF $10,000
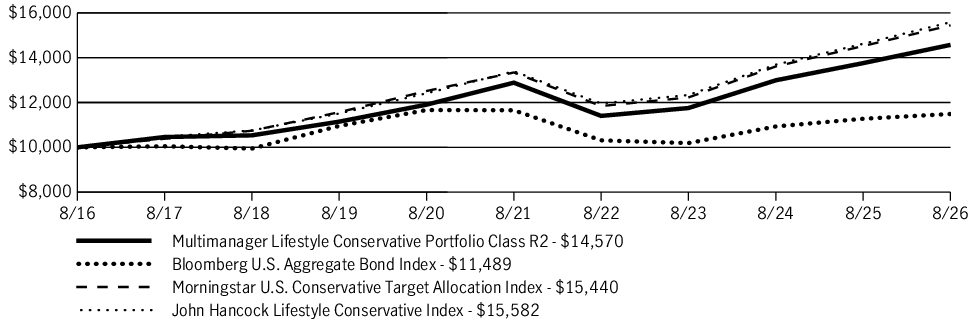
| AVERAGE ANNUAL TOTAL RETURN | 1 Year | 5 Years | 10 Years |
| Multimanager Lifestyle Conservative Portfolio (Class R2/JQLCX) | 5.91% | 2.49% | 3.84% |
| Bloomberg U.S. Aggregate Bond Index | 1.89% | (0.29)% | 1.40% |
| Morningstar U.S. Conservative Target Allocation Index | 6.35% | 2.97% | 4.44% |
| John Hancock Lifestyle Conservative Index | 6.58% | 3.08% | 4.53% |
Fund Statistics
| Fund net assets | $1,422,833,140 |
| Total number of portfolio holdings | 26 |
| Total advisory fees paid (net) | $2,431,019 |
| Portfolio turnover rate | 13% |
Graphical Representation of Holdings
The table below shows the investment makeup of the fund, representing a percentage of the total net assets of the fund.
Asset Allocation
| Affiliated investment companies | 90.1% |
| Equity | 21.7% |
| International equity | 7.6% |
| U.S. large cap | 5.9% |
| Large blend | 4.4% |
| U.S. mid cap | 2.3% |
| U.S. small cap | 0.9% |
| Emerging-market equity | 0.6% |
| Fixed income | 66.4% |
| Intermediate bond | 32.7% |
| Multi-sector bond | 8.5% |
| Short-term bond | 7.7% |
| Emerging-market debt | 6.5% |
| Bank loan | 5.7% |
| High yield bond | 5.3% |
| Alternative and specialty | 2.0% |
| Multi-asset income | 2.0% |
| U.S. Government | 9.8% |
| Short-term investments and other | 0.1% |
Holdings may not have been held by the fund for the entire period and are subject to change without notice. Portfolio composition is subject to review in accordance with the fund’s investment strategy and may vary in the future. Current and future portfolio holdings are subject to risk and may change at any time.
What were the fund costs during the last year ?
(Based on a hypothetical $10,000 investment)
| Fund (Class) | Costs of a $10,000 investment | Costs paid as a percentage of a $10,000 investment |
| Multimanager Lifestyle Conservative Portfolio (Class I/JTOIX) |
$32 | 0.31% |
Management’s Discussion of Fund Performance
SUMMARY OF RESULTS
Multimanager Lifestyle Conservative Portfolio (Class I/JTOIX) returned 6.31% for the year ended August 31, 2026. Global equities produced sizable gains in the 12-month period that ended on August 31, 2026. Investors were encouraged by the favorable combination of healthy economic growth trends, robust corporate earnings, and generally supportive central bank policies, together with optimism about artificial intelligence. While technology stocks performed very well, the value style outpaced growth on a global basis and contributed meaningfully to the markets’ strong showing. Emerging market equities also posted outsized returns. Bonds registered more modest gains, led by credit-oriented investments. Income was the primary contributor to total returns for fixed income instruments, as prices came under pressure from concerns about persistent inflation, global conflicts, energy prices, and mounting government debt across the developed world.
TOP PERFORMANCE CONTRIBUTORS
Equity allocation | U.S. equities made the most significant contribution to absolute performance, led by large cap equities. International developed market equities further helped results, as did emerging market stocks. Defensive equities also generated positive returns.
Bond funds | The fixed-income allocation contributed positively, led by intermediate-term bonds and emerging markets debt. Holdings in multi-sector bonds, high yield bonds, short-term bonds, bank loans, and short-term U.S. Treasury Inflation Protected Securities aided returns as well.
TOP PERFORMANCE DETRACTORS
No detractors | At a time of positive returns for most segments of the financial markets, none of the fund’s holdings detracted from absolute performance.
The views expressed in this report are those of the portfolio management team and are subject to change. They are not meant as investment advice.
Fund Performance
The following graph compares the initial and subsequent account values at the end of each of the most recently completed 10 fiscal years of the fund (or for the life of the fund, if shorter). It assumes a $250,000 initial investment in the fund and in an appropriate, broad-based securities market index for the same period.
GROWTH OF $250,000
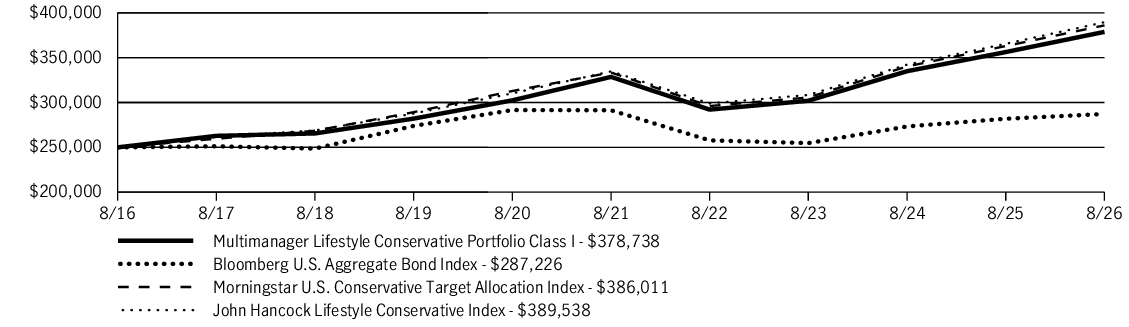
| AVERAGE ANNUAL TOTAL RETURN | 1 Year | 5 Years | 10 Years |
| Multimanager Lifestyle Conservative Portfolio (Class I/JTOIX) | 6.31% | 2.88% | 4.24% |
| Bloomberg U.S. Aggregate Bond Index | 1.89% | (0.29)% | 1.40% |
| Morningstar U.S. Conservative Target Allocation Index | 6.35% | 2.97% | 4.44% |
| John Hancock Lifestyle Conservative Index | 6.58% | 3.08% | 4.53% |
Fund Statistics
| Fund net assets | $1,422,833,140 |
| Total number of portfolio holdings | 26 |
| Total advisory fees paid (net) | $2,431,019 |
| Portfolio turnover rate | 13% |
Graphical Representation of Holdings
The table below shows the investment makeup of the fund, representing a percentage of the total net assets of the fund.
Asset Allocation
| Affiliated investment companies | 90.1% |
| Equity | 21.7% |
| International equity | 7.6% |
| U.S. large cap | 5.9% |
| Large blend | 4.4% |
| U.S. mid cap | 2.3% |
| U.S. small cap | 0.9% |
| Emerging-market equity | 0.6% |
| Fixed income | 66.4% |
| Intermediate bond | 32.7% |
| Multi-sector bond | 8.5% |
| Short-term bond | 7.7% |
| Emerging-market debt | 6.5% |
| Bank loan | 5.7% |
| High yield bond | 5.3% |
| Alternative and specialty | 2.0% |
| Multi-asset income | 2.0% |
| U.S. Government | 9.8% |
| Short-term investments and other | 0.1% |
Holdings may not have been held by the fund for the entire period and are subject to change without notice. Portfolio composition is subject to review in accordance with the fund’s investment strategy and may vary in the future. Current and future portfolio holdings are subject to risk and may change at any time.
What were the fund costs during the last year ?
(Based on a hypothetical $10,000 investment)
| Fund (Class) | Costs of a $10,000 investment | Costs paid as a percentage of a $10,000 investment |
| Multimanager Lifestyle Conservative Portfolio (Class C/JCLCX) |
$134 | 1.31% |
Management’s Discussion of Fund Performance
SUMMARY OF RESULTS
Multimanager Lifestyle Conservative Portfolio (Class C/JCLCX) returned 5.25% (excluding sales charges) for the year ended August 31, 2026. Global equities produced sizable gains in the 12-month period that ended on August 31, 2026. Investors were encouraged by the favorable combination of healthy economic growth trends, robust corporate earnings, and generally supportive central bank policies, together with optimism about artificial intelligence. While technology stocks performed very well, the value style outpaced growth on a global basis and contributed meaningfully to the markets’ strong showing. Emerging market equities also posted outsized returns. Bonds registered more modest gains, led by credit-oriented investments. Income was the primary contributor to total returns for fixed income instruments, as prices came under pressure from concerns about persistent inflation, global conflicts, energy prices, and mounting government debt across the developed world.
TOP PERFORMANCE CONTRIBUTORS
Equity allocation | U.S. equities made the most significant contribution to absolute performance, led by large cap equities. International developed market equities further helped results, as did emerging market stocks. Defensive equities also generated positive returns.
Bond funds | The fixed-income allocation contributed positively, led by intermediate-term bonds and emerging markets debt. Holdings in multi-sector bonds, high yield bonds, short-term bonds, bank loans, and short-term U.S. Treasury Inflation Protected Securities aided returns as well.
TOP PERFORMANCE DETRACTORS
No detractors | At a time of positive returns for most segments of the financial markets, none of the fund’s holdings detracted from absolute performance.
The views expressed in this report are those of the portfolio management team and are subject to change. They are not meant as investment advice.
Fund Performance
The following graph compares the initial and subsequent account values at the end of each of the most recently completed 10 fiscal years of the fund (or for the life of the fund, if shorter). It assumes a $10,000 initial investment in the fund and in an appropriate, broad-based securities market index for the same period.
GROWTH OF $10,000
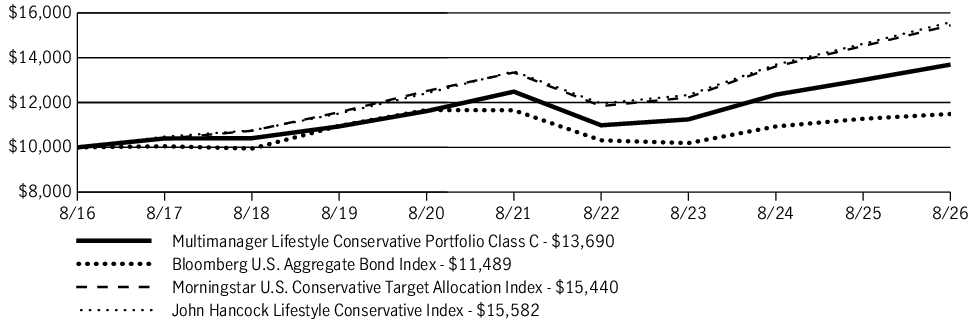
| AVERAGE ANNUAL TOTAL RETURN | 1 Year | 5 Years | 10 Years |
| Multimanager Lifestyle Conservative Portfolio (Class C/JCLCX) | 4.25% | 1.86% | 3.19% |
| Multimanager Lifestyle Conservative Portfolio (Class C/JCLCX)—excluding sales charge | 5.25% | 1.86% | 3.19% |
| Bloomberg U.S. Aggregate Bond Index | 1.89% | (0.29)% | 1.40% |
| Morningstar U.S. Conservative Target Allocation Index | 6.35% | 2.97% | 4.44% |
| John Hancock Lifestyle Conservative Index | 6.58% | 3.08% | 4.53% |
Fund Statistics
| Fund net assets | $1,422,833,140 |
| Total number of portfolio holdings | 26 |
| Total advisory fees paid (net) | $2,431,019 |
| Portfolio turnover rate | 13% |
Graphical Representation of Holdings
The table below shows the investment makeup of the fund, representing a percentage of the total net assets of the fund.
Asset Allocation
| Affiliated investment companies | 90.1% |
| Equity | 21.7% |
| International equity | 7.6% |
| U.S. large cap | 5.9% |
| Large blend | 4.4% |
| U.S. mid cap | 2.3% |
| U.S. small cap | 0.9% |
| Emerging-market equity | 0.6% |
| Fixed income | 66.4% |
| Intermediate bond | 32.7% |
| Multi-sector bond | 8.5% |
| Short-term bond | 7.7% |
| Emerging-market debt | 6.5% |
| Bank loan | 5.7% |
| High yield bond | 5.3% |
| Alternative and specialty | 2.0% |
| Multi-asset income | 2.0% |
| U.S. Government | 9.8% |
| Short-term investments and other | 0.1% |
Holdings may not have been held by the fund for the entire period and are subject to change without notice. Portfolio composition is subject to review in accordance with the fund’s investment strategy and may vary in the future. Current and future portfolio holdings are subject to risk and may change at any time.
What were the fund costs during the last year ?
(Based on a hypothetical $10,000 investment)
| Fund (Class) | Costs of a $10,000 investment | Costs paid as a percentage of a $10,000 investment |
| Multimanager Lifestyle Conservative Portfolio (Class A/JALRX) |
$63 | 0.61% |
Management’s Discussion of Fund Performance
SUMMARY OF RESULTS
Multimanager Lifestyle Conservative Portfolio (Class A/JALRX) returned 5.98% (excluding sales charges) for the year ended August 31, 2026. Global equities produced sizable gains in the 12-month period that ended on August 31, 2026. Investors were encouraged by the favorable combination of healthy economic growth trends, robust corporate earnings, and generally supportive central bank policies, together with optimism about artificial intelligence. While technology stocks performed very well, the value style outpaced growth on a global basis and contributed meaningfully to the markets’ strong showing. Emerging market equities also posted outsized returns. Bonds registered more modest gains, led by credit-oriented investments. Income was the primary contributor to total returns for fixed income instruments, as prices came under pressure from concerns about persistent inflation, global conflicts, energy prices, and mounting government debt across the developed world.
TOP PERFORMANCE CONTRIBUTORS
Equity allocation | U.S. equities made the most significant contribution to absolute performance, led by large cap equities. International developed market equities further helped results, as did emerging market stocks. Defensive equities also generated positive returns.
Bond funds | The fixed-income allocation contributed positively, led by intermediate-term bonds and emerging markets debt. Holdings in multi-sector bonds, high yield bonds, short-term bonds, bank loans, and short-term U.S. Treasury Inflation Protected Securities aided returns as well.
TOP PERFORMANCE DETRACTORS
No detractors | At a time of positive returns for most segments of the financial markets, none of the fund’s holdings detracted from absolute performance.
The views expressed in this report are those of the portfolio management team and are subject to change. They are not meant as investment advice.
Fund Performance
The following graph compares the initial and subsequent account values at the end of each of the most recently completed 10 fiscal years of the fund (or for the life of the fund, if shorter). It assumes a $10,000 initial investment in the fund and in an appropriate, broad-based securities market index for the same period.
GROWTH OF $10,000
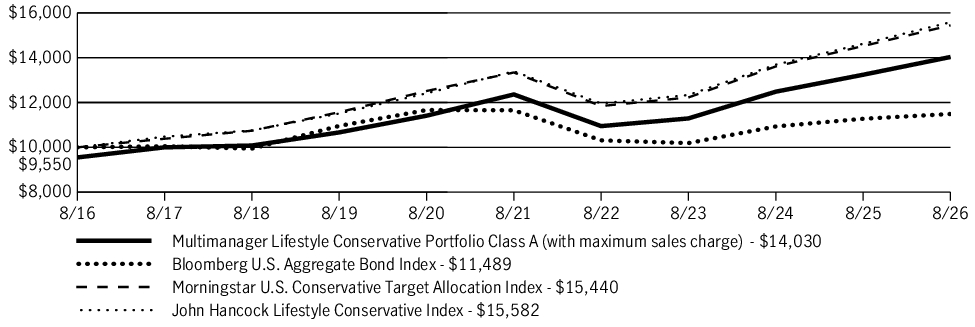
| AVERAGE ANNUAL TOTAL RETURN | 1 Year | 5 Years | 10 Years |
| Multimanager Lifestyle Conservative Portfolio (Class A/JALRX) | 1.21% | 1.63% | 3.44% |
| Multimanager Lifestyle Conservative Portfolio (Class A/JALRX)—excluding sales charge | 5.98% | 2.57% | 3.92% |
| Bloomberg U.S. Aggregate Bond Index | 1.89% | (0.29)% | 1.40% |
| Morningstar U.S. Conservative Target Allocation Index | 6.35% | 2.97% | 4.44% |
| John Hancock Lifestyle Conservative Index | 6.58% | 3.08% | 4.53% |
Fund Statistics
| Fund net assets | $1,422,833,140 |
| Total number of portfolio holdings | 26 |
| Total advisory fees paid (net) | $2,431,019 |
| Portfolio turnover rate | 13% |
Graphical Representation of Holdings
The table below shows the investment makeup of the fund, representing a percentage of the total net assets of the fund.
Asset Allocation
| Affiliated investment companies | 90.1% |
| Equity | 21.7% |
| International equity | 7.6% |
| U.S. large cap | 5.9% |
| Large blend | 4.4% |
| U.S. mid cap | 2.3% |
| U.S. small cap | 0.9% |
| Emerging-market equity | 0.6% |
| Fixed income | 66.4% |
| Intermediate bond | 32.7% |
| Multi-sector bond | 8.5% |
| Short-term bond | 7.7% |
| Emerging-market debt | 6.5% |
| Bank loan | 5.7% |
| High yield bond | 5.3% |
| Alternative and specialty | 2.0% |
| Multi-asset income | 2.0% |
| U.S. Government | 9.8% |
| Short-term investments and other | 0.1% |
Holdings may not have been held by the fund for the entire period and are subject to change without notice. Portfolio composition is subject to review in accordance with the fund’s investment strategy and may vary in the future. Current and future portfolio holdings are subject to risk and may change at any time.
What were the fund costs during the last year ?
(Based on a hypothetical $10,000 investment)
| Fund (Class) | Costs of a $10,000 investment | Costs paid as a percentage of a $10,000 investment |
| Multimanager Lifestyle Conservative Portfolio (Class 1/JILCX) |
$26 | 0.25% |
Management’s Discussion of Fund Performance
SUMMARY OF RESULTS
Multimanager Lifestyle Conservative Portfolio (Class 1/JILCX) returned 6.38% for the year ended August 31, 2026. Global equities produced sizable gains in the 12-month period that ended on August 31, 2026. Investors were encouraged by the favorable combination of healthy economic growth trends, robust corporate earnings, and generally supportive central bank policies, together with optimism about artificial intelligence. While technology stocks performed very well, the value style outpaced growth on a global basis and contributed meaningfully to the markets’ strong showing. Emerging market equities also posted outsized returns. Bonds registered more modest gains, led by credit-oriented investments. Income was the primary contributor to total returns for fixed income instruments, as prices came under pressure from concerns about persistent inflation, global conflicts, energy prices, and mounting government debt across the developed world.
TOP PERFORMANCE CONTRIBUTORS
Equity allocation | U.S. equities made the most significant contribution to absolute performance, led by large cap equities. International developed market equities further helped results, as did emerging market stocks. Defensive equities also generated positive returns.
Bond funds | The fixed-income allocation contributed positively, led by intermediate-term bonds and emerging markets debt. Holdings in multi-sector bonds, high yield bonds, short-term bonds, bank loans, and short-term U.S. Treasury Inflation Protected Securities aided returns as well.
TOP PERFORMANCE DETRACTORS
No detractors | At a time of positive returns for most segments of the financial markets, none of the fund’s holdings detracted from absolute performance.
The views expressed in this report are those of the portfolio management team and are subject to change. They are not meant as investment advice.
Fund Performance
The following graph compares the initial and subsequent account values at the end of each of the most recently completed 10 fiscal years of the fund (or for the life of the fund, if shorter). It assumes a $10,000 initial investment in the fund and in an appropriate, broad-based securities market index for the same period.
GROWTH OF $10,000
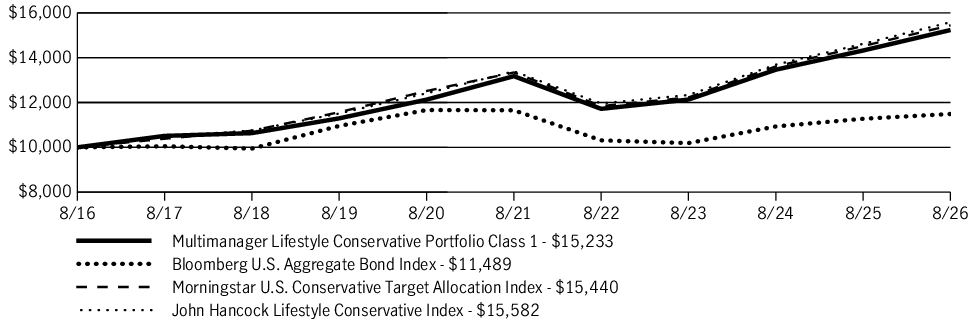
| AVERAGE ANNUAL TOTAL RETURN | 1 Year | 5 Years | 10 Years |
| Multimanager Lifestyle Conservative Portfolio (Class 1/JILCX) | 6.38% | 2.95% | 4.30% |
| Bloomberg U.S. Aggregate Bond Index | 1.89% | (0.29)% | 1.40% |
| Morningstar U.S. Conservative Target Allocation Index | 6.35% | 2.97% | 4.44% |
| John Hancock Lifestyle Conservative Index | 6.58% | 3.08% | 4.53% |
Fund Statistics
| Fund net assets | $1,422,833,140 |
| Total number of portfolio holdings | 26 |
| Total advisory fees paid (net) | $2,431,019 |
| Portfolio turnover rate | 13% |
Graphical Representation of Holdings
The table below shows the investment makeup of the fund, representing a percentage of the total net assets of the fund.
Asset Allocation
| Affiliated investment companies | 90.1% |
| Equity | 21.7% |
| International equity | 7.6% |
| U.S. large cap | 5.9% |
| Large blend | 4.4% |
| U.S. mid cap | 2.3% |
| U.S. small cap | 0.9% |
| Emerging-market equity | 0.6% |
| Fixed income | 66.4% |
| Intermediate bond | 32.7% |
| Multi-sector bond | 8.5% |
| Short-term bond | 7.7% |
| Emerging-market debt | 6.5% |
| Bank loan | 5.7% |
| High yield bond | 5.3% |
| Alternative and specialty | 2.0% |
| Multi-asset income | 2.0% |
| U.S. Government | 9.8% |
| Short-term investments and other | 0.1% |
Holdings may not have been held by the fund for the entire period and are subject to change without notice. Portfolio composition is subject to review in accordance with the fund’s investment strategy and may vary in the future. Current and future portfolio holdings are subject to risk and may change at any time.
What were the fund costs during the last year ?
(Based on a hypothetical $10,000 investment)
| Fund (Class) | Costs of a $10,000 investment | Costs paid as a percentage of a $10,000 investment |
| Multimanager Lifestyle Growth Portfolio (Class 1/JILGX) |
$19 | 0.17% |
Management’s Discussion of Fund Performance
SUMMARY OF RESULTS
Multimanager Lifestyle Growth Portfolio (Class 1/JILGX) returned 17.72% for the year ended August 31, 2026. Global equities produced sizable gains in the 12-month period that ended on August 31, 2026. Investors were encouraged by the favorable combination of healthy economic growth trends, robust corporate earnings, and generally supportive central bank policies, together with optimism about artificial intelligence. While technology stocks performed very well, the value style outpaced growth on a global basis and contributed meaningfully to the markets’ strong showing. Emerging market equities also posted outsized returns. Bonds registered more modest gains, led by credit-oriented investments. Income was the primary contributor to total returns for fixed income instruments, as prices came under pressure from concerns about persistent inflation, global conflicts, energy prices, and mounting government debt across the developed world.
TOP PERFORMANCE CONTRIBUTORS
Equity allocation | U.S. equities made the most significant contribution to absolute performance, including the fund’s sizable allocation to large caps. International developed market equities further helped results, as did emerging market stocks. The real assets portfolio was an additional contributor with strong returns for the energy and metals & mining sectors.
Bond funds | The fixed-income allocation also contributed, led by intermediate-term bonds and emerging markets debt.
TOP PERFORMANCE DETRACTORS
Specific positions | At a time of positive returns for most segments of the financial markets, the majority of the fund’s holdings recorded a gain. However, small positions in U.S. Treasury STRIPS (Separate Trading of Registered Interest and Principal of Securities) were adversely affected by rising yields.
The views expressed in this report are those of the portfolio management team and are subject to change. They are not meant as investment advice.
Fund Performance
The following graph compares the initial and subsequent account values at the end of each of the most recently completed 10 fiscal years of the fund (or for the life of the fund, if shorter). It assumes a $10,000 initial investment in the fund and in an appropriate, broad-based securities market index for the same period.
GROWTH OF $10,000
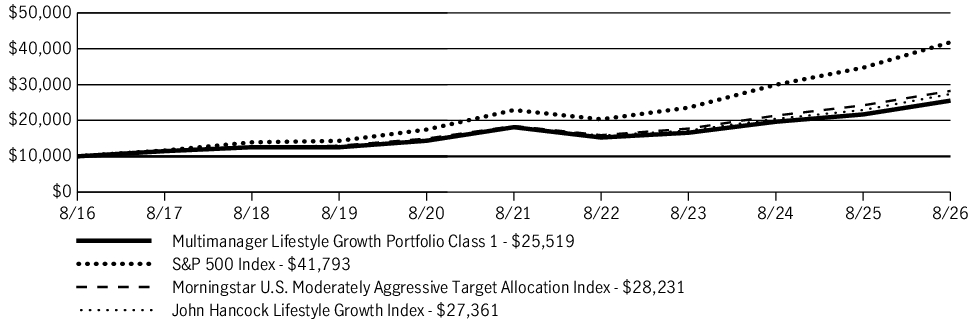
| AVERAGE ANNUAL TOTAL RETURN | 1 Year | 5 Years | 10 Years |
| Multimanager Lifestyle Growth Portfolio (Class 1/JILGX) | 17.72% | 7.09% | 9.82% |
| S&P 500 Index | 20.38% | 12.79% | 15.37% |
| Morningstar U.S. Moderately Aggressive Target Allocation Index | 16.60% | 8.89% | 10.94% |
| John Hancock Lifestyle Growth Index | 19.41% | 8.46% | 10.59% |
Fund Statistics
| Fund net assets | $8,421,057,018 |
| Total number of portfolio holdings | 85 |
| Total advisory fees paid (net) | $7,904,648 |
| Portfolio turnover rate | 11% |
Graphical Representation of Holdings
The table below shows the investment makeup of the fund, representing a percentage of the total net assets of the fund.
Asset Allocation
| Affiliated investment companies | 97.5% |
| Equity | 80.2% |
| U.S. large cap | 31.2% |
| International equity | 27.2% |
| U.S. mid cap | 8.4% |
| Emerging-market equity | 5.6% |
| Large blend | 4.0% |
| U.S. small cap | 3.8% |
| Fixed income | 14.3% |
| Intermediate bond | 5.7% |
| Multi-sector bond | 2.2% |
| Emerging-market debt | 1.9% |
| Short-term bond | 1.9% |
| Bank loan | 1.4% |
| High yield bond | 1.2% |
| Alternative and specialty | 3.0% |
| Sector equity | 2.5% |
| Absolute return | 0.5% |
| U.S. Government | 2.5% |
Holdings may not have been held by the fund for the entire period and are subject to change without notice. Portfolio composition is subject to review in accordance with the fund’s investment strategy and may vary in the future. Current and future portfolio holdings are subject to risk and may change at any time.
What were the fund costs during the last year ?
(Based on a hypothetical $10,000 investment)
| Fund (Class) | Costs of a $10,000 investment | Costs paid as a percentage of a $10,000 investment |
| Multimanager Lifestyle Growth Portfolio (Class 5/JHLGX) |
$13 | 0.12% |
Management’s Discussion of Fund Performance
SUMMARY OF RESULTS
Multimanager Lifestyle Growth Portfolio (Class 5/JHLGX) returned 17.90% for the year ended August 31, 2026. Global equities produced sizable gains in the 12-month period that ended on August 31, 2026. Investors were encouraged by the favorable combination of healthy economic growth trends, robust corporate earnings, and generally supportive central bank policies, together with optimism about artificial intelligence. While technology stocks performed very well, the value style outpaced growth on a global basis and contributed meaningfully to the markets’ strong showing. Emerging market equities also posted outsized returns. Bonds registered more modest gains, led by credit-oriented investments. Income was the primary contributor to total returns for fixed income instruments, as prices came under pressure from concerns about persistent inflation, global conflicts, energy prices, and mounting government debt across the developed world.
TOP PERFORMANCE CONTRIBUTORS
Equity allocation | U.S. equities made the most significant contribution to absolute performance, including the fund’s sizable allocation to large caps. International developed market equities further helped results, as did emerging market stocks. The real assets portfolio was an additional contributor with strong returns for the energy and metals & mining sectors.
Bond funds | The fixed-income allocation also contributed, led by intermediate-term bonds and emerging markets debt.
TOP PERFORMANCE DETRACTORS
Specific positions | At a time of positive returns for most segments of the financial markets, the majority of the fund’s holdings recorded a gain. However, small positions in U.S. Treasury STRIPS (Separate Trading of Registered Interest and Principal of Securities) were adversely affected by rising yields.
The views expressed in this report are those of the portfolio management team and are subject to change. They are not meant as investment advice.
Fund Performance
The following graph compares the initial and subsequent account values at the end of each of the most recently completed 10 fiscal years of the fund (or for the life of the fund, if shorter). It assumes a $10,000 initial investment in the fund and in an appropriate, broad-based securities market index for the same period.
GROWTH OF $10,000
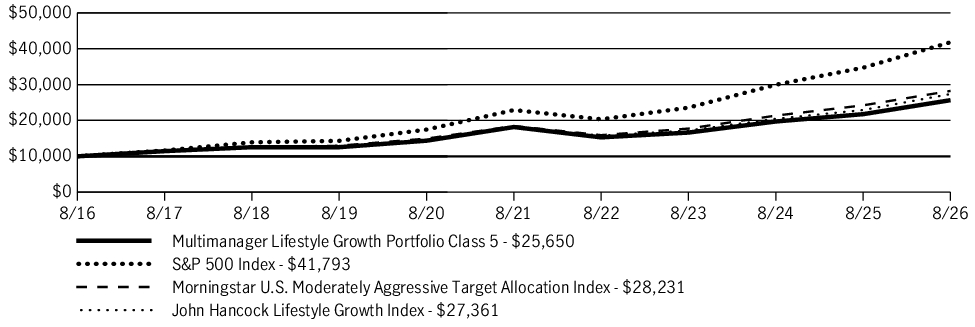
| AVERAGE ANNUAL TOTAL RETURN | 1 Year | 5 Years | 10 Years |
| Multimanager Lifestyle Growth Portfolio (Class 5/JHLGX) | 17.90% | 7.15% | 9.88% |
| S&P 500 Index | 20.38% | 12.79% | 15.37% |
| Morningstar U.S. Moderately Aggressive Target Allocation Index | 16.60% | 8.89% | 10.94% |
| John Hancock Lifestyle Growth Index | 19.41% | 8.46% | 10.59% |
Fund Statistics
| Fund net assets | $8,421,057,018 |
| Total number of portfolio holdings | 85 |
| Total advisory fees paid (net) | $7,904,648 |
| Portfolio turnover rate | 11% |
Graphical Representation of Holdings
The table below shows the investment makeup of the fund, representing a percentage of the total net assets of the fund.
Asset Allocation
| Affiliated investment companies | 97.5% |
| Equity | 80.2% |
| U.S. large cap | 31.2% |
| International equity | 27.2% |
| U.S. mid cap | 8.4% |
| Emerging-market equity | 5.6% |
| Large blend | 4.0% |
| U.S. small cap | 3.8% |
| Fixed income | 14.3% |
| Intermediate bond | 5.7% |
| Multi-sector bond | 2.2% |
| Emerging-market debt | 1.9% |
| Short-term bond | 1.9% |
| Bank loan | 1.4% |
| High yield bond | 1.2% |
| Alternative and specialty | 3.0% |
| Sector equity | 2.5% |
| Absolute return | 0.5% |
| U.S. Government | 2.5% |
Holdings may not have been held by the fund for the entire period and are subject to change without notice. Portfolio composition is subject to review in accordance with the fund’s investment strategy and may vary in the future. Current and future portfolio holdings are subject to risk and may change at any time.
What were the fund costs during the last year ?
(Based on a hypothetical $10,000 investment)
| Fund (Class) | Costs of a $10,000 investment | Costs paid as a percentage of a $10,000 investment |
| Multimanager Lifestyle Growth Portfolio (Class A/JALGX) |
$58 | 0.53% |
Management’s Discussion of Fund Performance
SUMMARY OF RESULTS
Multimanager Lifestyle Growth Portfolio (Class A/JALGX) returned 17.43% (excluding sales charges) for the year ended August 31, 2026. Global equities produced sizable gains in the 12-month period that ended on August 31, 2026. Investors were encouraged by the favorable combination of healthy economic growth trends, robust corporate earnings, and generally supportive central bank policies, together with optimism about artificial intelligence. While technology stocks performed very well, the value style outpaced growth on a global basis and contributed meaningfully to the markets’ strong showing. Emerging market equities also posted outsized returns. Bonds registered more modest gains, led by credit-oriented investments. Income was the primary contributor to total returns for fixed income instruments, as prices came under pressure from concerns about persistent inflation, global conflicts, energy prices, and mounting government debt across the developed world.
TOP PERFORMANCE CONTRIBUTORS
Equity allocation | U.S. equities made the most significant contribution to absolute performance, including the fund’s sizable allocation to large caps. International developed market equities further helped results, as did emerging market stocks. The real assets portfolio was an additional contributor with strong returns for the energy and metals & mining sectors.
Bond funds | The fixed-income allocation also contributed, led by intermediate-term bonds and emerging markets debt.
TOP PERFORMANCE DETRACTORS
Specific positions | At a time of positive returns for most segments of the financial markets, the majority of the fund’s holdings recorded a gain. However, small positions in U.S. Treasury STRIPS (Separate Trading of Registered Interest and Principal of Securities) were adversely affected by rising yields.
The views expressed in this report are those of the portfolio management team and are subject to change. They are not meant as investment advice.
Fund Performance
The following graph compares the initial and subsequent account values at the end of each of the most recently completed 10 fiscal years of the fund (or for the life of the fund, if shorter). It assumes a $10,000 initial investment in the fund and in an appropriate, broad-based securities market index for the same period.
GROWTH OF $10,000
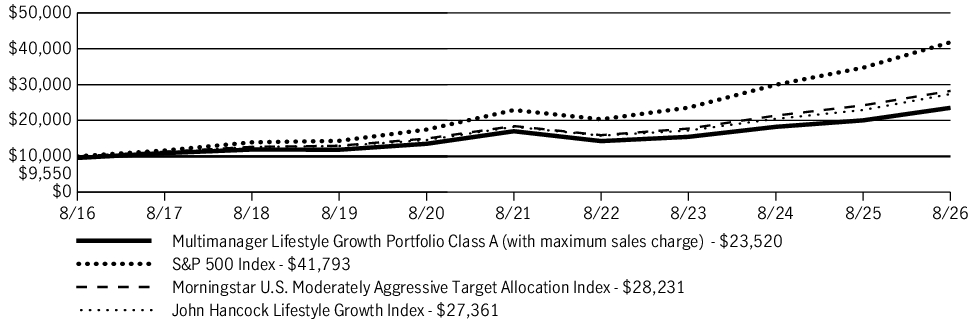
| AVERAGE ANNUAL TOTAL RETURN | 1 Year | 5 Years | 10 Years |
| Multimanager Lifestyle Growth Portfolio (Class A/JALGX) | 12.16% | 5.74% | 8.93% |
| Multimanager Lifestyle Growth Portfolio (Class A/JALGX)—excluding sales charge | 17.43% | 6.72% | 9.43% |
| S&P 500 Index | 20.38% | 12.79% | 15.37% |
| Morningstar U.S. Moderately Aggressive Target Allocation Index | 16.60% | 8.89% | 10.94% |
| John Hancock Lifestyle Growth Index | 19.41% | 8.46% | 10.59% |
Fund Statistics
| Fund net assets | $8,421,057,018 |
| Total number of portfolio holdings | 85 |
| Total advisory fees paid (net) | $7,904,648 |
| Portfolio turnover rate | 11% |
Graphical Representation of Holdings
The table below shows the investment makeup of the fund, representing a percentage of the total net assets of the fund.
Asset Allocation
| Affiliated investment companies | 97.5% |
| Equity | 80.2% |
| U.S. large cap | 31.2% |
| International equity | 27.2% |
| U.S. mid cap | 8.4% |
| Emerging-market equity | 5.6% |
| Large blend | 4.0% |
| U.S. small cap | 3.8% |
| Fixed income | 14.3% |
| Intermediate bond | 5.7% |
| Multi-sector bond | 2.2% |
| Emerging-market debt | 1.9% |
| Short-term bond | 1.9% |
| Bank loan | 1.4% |
| High yield bond | 1.2% |
| Alternative and specialty | 3.0% |
| Sector equity | 2.5% |
| Absolute return | 0.5% |
| U.S. Government | 2.5% |
Holdings may not have been held by the fund for the entire period and are subject to change without notice. Portfolio composition is subject to review in accordance with the fund’s investment strategy and may vary in the future. Current and future portfolio holdings are subject to risk and may change at any time.
What were the fund costs during the last year ?
(Based on a hypothetical $10,000 investment)
| Fund (Class) | Costs of a $10,000 investment | Costs paid as a percentage of a $10,000 investment |
| Multimanager Lifestyle Growth Portfolio (Class C/JCLGX) |
$133 | 1.23% |
Management’s Discussion of Fund Performance
SUMMARY OF RESULTS
Multimanager Lifestyle Growth Portfolio (Class C/JCLGX) returned 16.55% (excluding sales charges) for the year ended August 31, 2026. Global equities produced sizable gains in the 12-month period that ended on August 31, 2026. Investors were encouraged by the favorable combination of healthy economic growth trends, robust corporate earnings, and generally supportive central bank policies, together with optimism about artificial intelligence. While technology stocks performed very well, the value style outpaced growth on a global basis and contributed meaningfully to the markets’ strong showing. Emerging market equities also posted outsized returns. Bonds registered more modest gains, led by credit-oriented investments. Income was the primary contributor to total returns for fixed income instruments, as prices came under pressure from concerns about persistent inflation, global conflicts, energy prices, and mounting government debt across the developed world.
TOP PERFORMANCE CONTRIBUTORS
Equity allocation | U.S. equities made the most significant contribution to absolute performance, including the fund’s sizable allocation to large caps. International developed market equities further helped results, as did emerging market stocks. The real assets portfolio was an additional contributor with strong returns for the energy and metals & mining sectors.
Bond funds | The fixed-income allocation also contributed, led by intermediate-term bonds and emerging markets debt.
TOP PERFORMANCE DETRACTORS
Specific positions | At a time of positive returns for most segments of the financial markets, the majority of the fund’s holdings recorded a gain. However, small positions in U.S. Treasury STRIPS (Separate Trading of Registered Interest and Principal of Securities) were adversely affected by rising yields.
The views expressed in this report are those of the portfolio management team and are subject to change. They are not meant as investment advice.
Fund Performance
The following graph compares the initial and subsequent account values at the end of each of the most recently completed 10 fiscal years of the fund (or for the life of the fund, if shorter). It assumes a $10,000 initial investment in the fund and in an appropriate, broad-based securities market index for the same period.
GROWTH OF $10,000
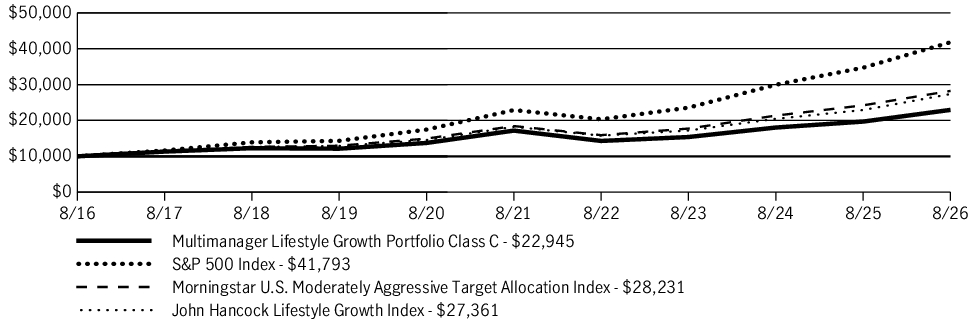
| AVERAGE ANNUAL TOTAL RETURN | 1 Year | 5 Years | 10 Years |
| Multimanager Lifestyle Growth Portfolio (Class C/JCLGX) | 15.55% | 5.97% | 8.66% |
| Multimanager Lifestyle Growth Portfolio (Class C/JCLGX)—excluding sales charge | 16.55% | 5.97% | 8.66% |
| S&P 500 Index | 20.38% | 12.79% | 15.37% |
| Morningstar U.S. Moderately Aggressive Target Allocation Index | 16.60% | 8.89% | 10.94% |
| John Hancock Lifestyle Growth Index | 19.41% | 8.46% | 10.59% |
Fund Statistics
| Fund net assets | $8,421,057,018 |
| Total number of portfolio holdings | 85 |
| Total advisory fees paid (net) | $7,904,648 |
| Portfolio turnover rate | 11% |
Graphical Representation of Holdings
The table below shows the investment makeup of the fund, representing a percentage of the total net assets of the fund.
Asset Allocation
| Affiliated investment companies | 97.5% |
| Equity | 80.2% |
| U.S. large cap | 31.2% |
| International equity | 27.2% |
| U.S. mid cap | 8.4% |
| Emerging-market equity | 5.6% |
| Large blend | 4.0% |
| U.S. small cap | 3.8% |
| Fixed income | 14.3% |
| Intermediate bond | 5.7% |
| Multi-sector bond | 2.2% |
| Emerging-market debt | 1.9% |
| Short-term bond | 1.9% |
| Bank loan | 1.4% |
| High yield bond | 1.2% |
| Alternative and specialty | 3.0% |
| Sector equity | 2.5% |
| Absolute return | 0.5% |
| U.S. Government | 2.5% |
Holdings may not have been held by the fund for the entire period and are subject to change without notice. Portfolio composition is subject to review in accordance with the fund’s investment strategy and may vary in the future. Current and future portfolio holdings are subject to risk and may change at any time.
What were the fund costs during the last year ?
(Based on a hypothetical $10,000 investment)
| Fund (Class) | Costs of a $10,000 investment | Costs paid as a percentage of a $10,000 investment |
| Multimanager Lifestyle Growth Portfolio (Class I/JTGIX) |
$25 | 0.23% |
Management’s Discussion of Fund Performance
SUMMARY OF RESULTS
Multimanager Lifestyle Growth Portfolio (Class I/JTGIX) returned 17.77% for the year ended August 31, 2026. Global equities produced sizable gains in the 12-month period that ended on August 31, 2026. Investors were encouraged by the favorable combination of healthy economic growth trends, robust corporate earnings, and generally supportive central bank policies, together with optimism about artificial intelligence. While technology stocks performed very well, the value style outpaced growth on a global basis and contributed meaningfully to the markets’ strong showing. Emerging market equities also posted outsized returns. Bonds registered more modest gains, led by credit-oriented investments. Income was the primary contributor to total returns for fixed income instruments, as prices came under pressure from concerns about persistent inflation, global conflicts, energy prices, and mounting government debt across the developed world.
TOP PERFORMANCE CONTRIBUTORS
Equity allocation | U.S. equities made the most significant contribution to absolute performance, including the fund’s sizable allocation to large caps. International developed market equities further helped results, as did emerging market stocks. The real assets portfolio was an additional contributor with strong returns for the energy and metals & mining sectors.
Bond funds | The fixed-income allocation also contributed, led by intermediate-term bonds and emerging markets debt.
TOP PERFORMANCE DETRACTORS
Specific positions | At a time of positive returns for most segments of the financial markets, the majority of the fund’s holdings recorded a gain. However, small positions in U.S. Treasury STRIPS (Separate Trading of Registered Interest and Principal of Securities) were adversely affected by rising yields.
The views expressed in this report are those of the portfolio management team and are subject to change. They are not meant as investment advice.
Fund Performance
The following graph compares the initial and subsequent account values at the end of each of the most recently completed 10 fiscal years of the fund (or for the life of the fund, if shorter). It assumes a $250,000 initial investment in the fund and in an appropriate, broad-based securities market index for the same period.
GROWTH OF $250,000
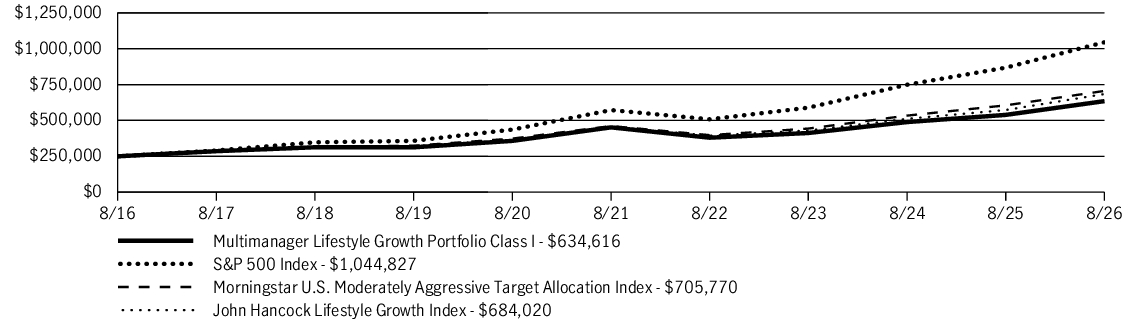
| AVERAGE ANNUAL TOTAL RETURN | 1 Year | 5 Years | 10 Years |
| Multimanager Lifestyle Growth Portfolio (Class I/JTGIX) | 17.77% | 7.03% | 9.76% |
| S&P 500 Index | 20.38% | 12.79% | 15.37% |
| Morningstar U.S. Moderately Aggressive Target Allocation Index | 16.60% | 8.89% | 10.94% |
| John Hancock Lifestyle Growth Index | 19.41% | 8.46% | 10.59% |
Fund Statistics
| Fund net assets | $8,421,057,018 |
| Total number of portfolio holdings | 85 |
| Total advisory fees paid (net) | $7,904,648 |
| Portfolio turnover rate | 11% |
Graphical Representation of Holdings
The table below shows the investment makeup of the fund, representing a percentage of the total net assets of the fund.
Asset Allocation
| Affiliated investment companies | 97.5% |
| Equity | 80.2% |
| U.S. large cap | 31.2% |
| International equity | 27.2% |
| U.S. mid cap | 8.4% |
| Emerging-market equity | 5.6% |
| Large blend | 4.0% |
| U.S. small cap | 3.8% |
| Fixed income | 14.3% |
| Intermediate bond | 5.7% |
| Multi-sector bond | 2.2% |
| Emerging-market debt | 1.9% |
| Short-term bond | 1.9% |
| Bank loan | 1.4% |
| High yield bond | 1.2% |
| Alternative and specialty | 3.0% |
| Sector equity | 2.5% |
| Absolute return | 0.5% |
| U.S. Government | 2.5% |
Holdings may not have been held by the fund for the entire period and are subject to change without notice. Portfolio composition is subject to review in accordance with the fund’s investment strategy and may vary in the future. Current and future portfolio holdings are subject to risk and may change at any time.
What were the fund costs during the last year ?
(Based on a hypothetical $10,000 investment)
| Fund (Class) | Costs of a $10,000 investment | Costs paid as a percentage of a $10,000 investment |
| Multimanager Lifestyle Growth Portfolio (Class R2/JQLGX) |
$67 | 0.62% |
Management’s Discussion of Fund Performance
SUMMARY OF RESULTS
Multimanager Lifestyle Growth Portfolio (Class R2/JQLGX) returned 17.28% for the year ended August 31, 2026. Global equities produced sizable gains in the 12-month period that ended on August 31, 2026. Investors were encouraged by the favorable combination of healthy economic growth trends, robust corporate earnings, and generally supportive central bank policies, together with optimism about artificial intelligence. While technology stocks performed very well, the value style outpaced growth on a global basis and contributed meaningfully to the markets’ strong showing. Emerging market equities also posted outsized returns. Bonds registered more modest gains, led by credit-oriented investments. Income was the primary contributor to total returns for fixed income instruments, as prices came under pressure from concerns about persistent inflation, global conflicts, energy prices, and mounting government debt across the developed world.
TOP PERFORMANCE CONTRIBUTORS
Equity allocation | U.S. equities made the most significant contribution to absolute performance, including the fund’s sizable allocation to large caps. International developed market equities further helped results, as did emerging market stocks. The real assets portfolio was an additional contributor with strong returns for the energy and metals & mining sectors.
Bond funds | The fixed-income allocation also contributed, led by intermediate-term bonds and emerging markets debt.
TOP PERFORMANCE DETRACTORS
Specific positions | At a time of positive returns for most segments of the financial markets, the majority of the fund’s holdings recorded a gain. However, small positions in U.S. Treasury STRIPS (Separate Trading of Registered Interest and Principal of Securities) were adversely affected by rising yields.
The views expressed in this report are those of the portfolio management team and are subject to change. They are not meant as investment advice.
Fund Performance
The following graph compares the initial and subsequent account values at the end of each of the most recently completed 10 fiscal years of the fund (or for the life of the fund, if shorter). It assumes a $10,000 initial investment in the fund and in an appropriate, broad-based securities market index for the same period.
GROWTH OF $10,000
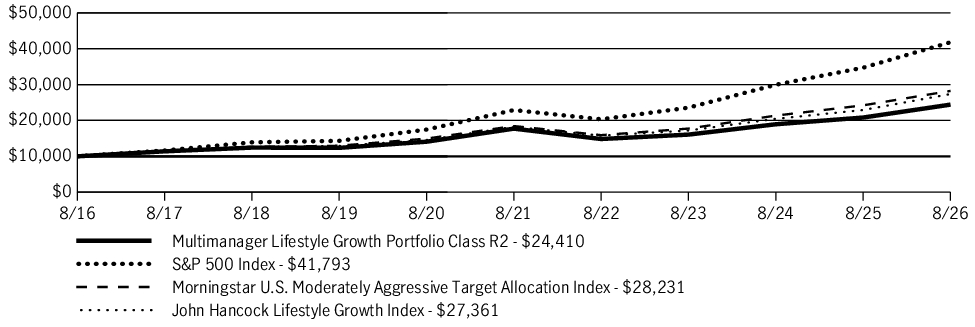
| AVERAGE ANNUAL TOTAL RETURN | 1 Year | 5 Years | 10 Years |
| Multimanager Lifestyle Growth Portfolio (Class R2/JQLGX) | 17.28% | 6.62% | 9.33% |
| S&P 500 Index | 20.38% | 12.79% | 15.37% |
| Morningstar U.S. Moderately Aggressive Target Allocation Index | 16.60% | 8.89% | 10.94% |
| John Hancock Lifestyle Growth Index | 19.41% | 8.46% | 10.59% |
Fund Statistics
| Fund net assets | $8,421,057,018 |
| Total number of portfolio holdings | 85 |
| Total advisory fees paid (net) | $7,904,648 |
| Portfolio turnover rate | 11% |
Graphical Representation of Holdings
The table below shows the investment makeup of the fund, representing a percentage of the total net assets of the fund.
Asset Allocation
| Affiliated investment companies | 97.5% |
| Equity | 80.2% |
| U.S. large cap | 31.2% |
| International equity | 27.2% |
| U.S. mid cap | 8.4% |
| Emerging-market equity | 5.6% |
| Large blend | 4.0% |
| U.S. small cap | 3.8% |
| Fixed income | 14.3% |
| Intermediate bond | 5.7% |
| Multi-sector bond | 2.2% |
| Emerging-market debt | 1.9% |
| Short-term bond | 1.9% |
| Bank loan | 1.4% |
| High yield bond | 1.2% |
| Alternative and specialty | 3.0% |
| Sector equity | 2.5% |
| Absolute return | 0.5% |
| U.S. Government | 2.5% |
Holdings may not have been held by the fund for the entire period and are subject to change without notice. Portfolio composition is subject to review in accordance with the fund’s investment strategy and may vary in the future. Current and future portfolio holdings are subject to risk and may change at any time.
What were the fund costs during the last year ?
(Based on a hypothetical $10,000 investment)
| Fund (Class) | Costs of a $10,000 investment | Costs paid as a percentage of a $10,000 investment |
| Multimanager Lifestyle Growth Portfolio (Class R4/JSLGX) |
$41 | 0.38% |
Management’s Discussion of Fund Performance
SUMMARY OF RESULTS
Multimanager Lifestyle Growth Portfolio (Class R4/JSLGX) returned 17.55% for the year ended August 31, 2026. Global equities produced sizable gains in the 12-month period that ended on August 31, 2026. Investors were encouraged by the favorable combination of healthy economic growth trends, robust corporate earnings, and generally supportive central bank policies, together with optimism about artificial intelligence. While technology stocks performed very well, the value style outpaced growth on a global basis and contributed meaningfully to the markets’ strong showing. Emerging market equities also posted outsized returns. Bonds registered more modest gains, led by credit-oriented investments. Income was the primary contributor to total returns for fixed income instruments, as prices came under pressure from concerns about persistent inflation, global conflicts, energy prices, and mounting government debt across the developed world.
TOP PERFORMANCE CONTRIBUTORS
Equity allocation | U.S. equities made the most significant contribution to absolute performance, including the fund’s sizable allocation to large caps. International developed market equities further helped results, as did emerging market stocks. The real assets portfolio was an additional contributor with strong returns for the energy and metals & mining sectors.
Bond funds | The fixed-income allocation also contributed, led by intermediate-term bonds and emerging markets debt.
TOP PERFORMANCE DETRACTORS
Specific positions | At a time of positive returns for most segments of the financial markets, the majority of the fund’s holdings recorded a gain. However, small positions in U.S. Treasury STRIPS (Separate Trading of Registered Interest and Principal of Securities) were adversely affected by rising yields.
The views expressed in this report are those of the portfolio management team and are subject to change. They are not meant as investment advice.
Fund Performance
The following graph compares the initial and subsequent account values at the end of each of the most recently completed 10 fiscal years of the fund (or for the life of the fund, if shorter). It assumes a $10,000 initial investment in the fund and in an appropriate, broad-based securities market index for the same period.
GROWTH OF $10,000
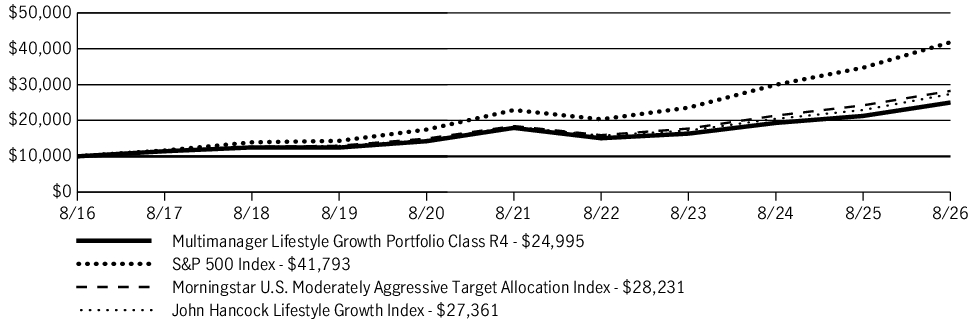
| AVERAGE ANNUAL TOTAL RETURN | 1 Year | 5 Years | 10 Years |
| Multimanager Lifestyle Growth Portfolio (Class R4/JSLGX) | 17.55% | 6.88% | 9.59% |
| S&P 500 Index | 20.38% | 12.79% | 15.37% |
| Morningstar U.S. Moderately Aggressive Target Allocation Index | 16.60% | 8.89% | 10.94% |
| John Hancock Lifestyle Growth Index | 19.41% | 8.46% | 10.59% |
Fund Statistics
| Fund net assets | $8,421,057,018 |
| Total number of portfolio holdings | 85 |
| Total advisory fees paid (net) | $7,904,648 |
| Portfolio turnover rate | 11% |
Graphical Representation of Holdings
The table below shows the investment makeup of the fund, representing a percentage of the total net assets of the fund.
Asset Allocation
| Affiliated investment companies | 97.5% |
| Equity | 80.2% |
| U.S. large cap | 31.2% |
| International equity | 27.2% |
| U.S. mid cap | 8.4% |
| Emerging-market equity | 5.6% |
| Large blend | 4.0% |
| U.S. small cap | 3.8% |
| Fixed income | 14.3% |
| Intermediate bond | 5.7% |
| Multi-sector bond | 2.2% |
| Emerging-market debt | 1.9% |
| Short-term bond | 1.9% |
| Bank loan | 1.4% |
| High yield bond | 1.2% |
| Alternative and specialty | 3.0% |
| Sector equity | 2.5% |
| Absolute return | 0.5% |
| U.S. Government | 2.5% |
Holdings may not have been held by the fund for the entire period and are subject to change without notice. Portfolio composition is subject to review in accordance with the fund’s investment strategy and may vary in the future. Current and future portfolio holdings are subject to risk and may change at any time.
What were the fund costs during the last year ?
(Based on a hypothetical $10,000 investment)
| Fund (Class) | Costs of a $10,000 investment | Costs paid as a percentage of a $10,000 investment |
| Multimanager Lifestyle Growth Portfolio (Class R5/JTLGX) |
$20 | 0.18% |
Management’s Discussion of Fund Performance
SUMMARY OF RESULTS
Multimanager Lifestyle Growth Portfolio (Class R5/JTLGX) returned 17.82% for the year ended August 31, 2026. Global equities produced sizable gains in the 12-month period that ended on August 31, 2026. Investors were encouraged by the favorable combination of healthy economic growth trends, robust corporate earnings, and generally supportive central bank policies, together with optimism about artificial intelligence. While technology stocks performed very well, the value style outpaced growth on a global basis and contributed meaningfully to the markets’ strong showing. Emerging market equities also posted outsized returns. Bonds registered more modest gains, led by credit-oriented investments. Income was the primary contributor to total returns for fixed income instruments, as prices came under pressure from concerns about persistent inflation, global conflicts, energy prices, and mounting government debt across the developed world.
TOP PERFORMANCE CONTRIBUTORS
Equity allocation | U.S. equities made the most significant contribution to absolute performance, including the fund’s sizable allocation to large caps. International developed market equities further helped results, as did emerging market stocks. The real assets portfolio was an additional contributor with strong returns for the energy and metals & mining sectors.
Bond funds | The fixed-income allocation also contributed, led by intermediate-term bonds and emerging markets debt.
TOP PERFORMANCE DETRACTORS
Specific positions | At a time of positive returns for most segments of the financial markets, the majority of the fund’s holdings recorded a gain. However, small positions in U.S. Treasury STRIPS (Separate Trading of Registered Interest and Principal of Securities) were adversely affected by rising yields.
The views expressed in this report are those of the portfolio management team and are subject to change. They are not meant as investment advice.
Fund Performance
The following graph compares the initial and subsequent account values at the end of each of the most recently completed 10 fiscal years of the fund (or for the life of the fund, if shorter). It assumes a $10,000 initial investment in the fund and in an appropriate, broad-based securities market index for the same period.
GROWTH OF $10,000
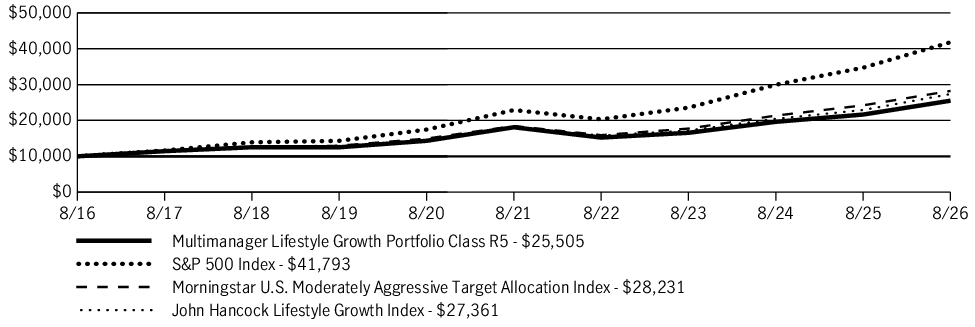
| AVERAGE ANNUAL TOTAL RETURN | 1 Year | 5 Years | 10 Years |
| Multimanager Lifestyle Growth Portfolio (Class R5/JTLGX) | 17.82% | 7.10% | 9.82% |
| S&P 500 Index | 20.38% | 12.79% | 15.37% |
| Morningstar U.S. Moderately Aggressive Target Allocation Index | 16.60% | 8.89% | 10.94% |
| John Hancock Lifestyle Growth Index | 19.41% | 8.46% | 10.59% |
Fund Statistics
| Fund net assets | $8,421,057,018 |
| Total number of portfolio holdings | 85 |
| Total advisory fees paid (net) | $7,904,648 |
| Portfolio turnover rate | 11% |
Graphical Representation of Holdings
The table below shows the investment makeup of the fund, representing a percentage of the total net assets of the fund.
Asset Allocation
| Affiliated investment companies | 97.5% |
| Equity | 80.2% |
| U.S. large cap | 31.2% |
| International equity | 27.2% |
| U.S. mid cap | 8.4% |
| Emerging-market equity | 5.6% |
| Large blend | 4.0% |
| U.S. small cap | 3.8% |
| Fixed income | 14.3% |
| Intermediate bond | 5.7% |
| Multi-sector bond | 2.2% |
| Emerging-market debt | 1.9% |
| Short-term bond | 1.9% |
| Bank loan | 1.4% |
| High yield bond | 1.2% |
| Alternative and specialty | 3.0% |
| Sector equity | 2.5% |
| Absolute return | 0.5% |
| U.S. Government | 2.5% |
Holdings may not have been held by the fund for the entire period and are subject to change without notice. Portfolio composition is subject to review in accordance with the fund’s investment strategy and may vary in the future. Current and future portfolio holdings are subject to risk and may change at any time.
What were the fund costs during the last year ?
(Based on a hypothetical $10,000 investment)
| Fund (Class) | Costs of a $10,000 investment | Costs paid as a percentage of a $10,000 investment |
| Multimanager Lifestyle Growth Portfolio (Class R6/JULGX) |
$14 | 0.13% |
Management’s Discussion of Fund Performance
SUMMARY OF RESULTS
Multimanager Lifestyle Growth Portfolio (Class R6/JULGX) returned 17.84% for the year ended August 31, 2026. Global equities produced sizable gains in the 12-month period that ended on August 31, 2026. Investors were encouraged by the favorable combination of healthy economic growth trends, robust corporate earnings, and generally supportive central bank policies, together with optimism about artificial intelligence. While technology stocks performed very well, the value style outpaced growth on a global basis and contributed meaningfully to the markets’ strong showing. Emerging market equities also posted outsized returns. Bonds registered more modest gains, led by credit-oriented investments. Income was the primary contributor to total returns for fixed income instruments, as prices came under pressure from concerns about persistent inflation, global conflicts, energy prices, and mounting government debt across the developed world.
TOP PERFORMANCE CONTRIBUTORS
Equity allocation | U.S. equities made the most significant contribution to absolute performance, including the fund’s sizable allocation to large caps. International developed market equities further helped results, as did emerging market stocks. The real assets portfolio was an additional contributor with strong returns for the energy and metals & mining sectors.
Bond funds | The fixed-income allocation also contributed, led by intermediate-term bonds and emerging markets debt.
TOP PERFORMANCE DETRACTORS
Specific positions | At a time of positive returns for most segments of the financial markets, the majority of the fund’s holdings recorded a gain. However, small positions in U.S. Treasury STRIPS (Separate Trading of Registered Interest and Principal of Securities) were adversely affected by rising yields.
The views expressed in this report are those of the portfolio management team and are subject to change. They are not meant as investment advice.
Fund Performance
The following graph compares the initial and subsequent account values at the end of each of the most recently completed 10 fiscal years of the fund (or for the life of the fund, if shorter). It assumes a $1,000,000 initial investment in the fund and in an appropriate, broad-based securities market index for the same period.
GROWTH OF $1,000,000
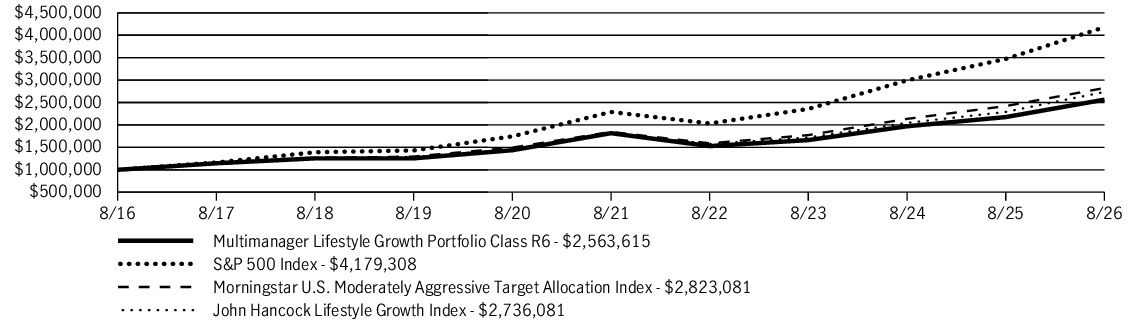
| AVERAGE ANNUAL TOTAL RETURN | 1 Year | 5 Years | 10 Years |
| Multimanager Lifestyle Growth Portfolio (Class R6/JULGX) | 17.84% | 7.14% | 9.87% |
| S&P 500 Index | 20.38% | 12.79% | 15.37% |
| Morningstar U.S. Moderately Aggressive Target Allocation Index | 16.60% | 8.89% | 10.94% |
| John Hancock Lifestyle Growth Index | 19.41% | 8.46% | 10.59% |
Fund Statistics
| Fund net assets | $8,421,057,018 |
| Total number of portfolio holdings | 85 |
| Total advisory fees paid (net) | $7,904,648 |
| Portfolio turnover rate | 11% |
Graphical Representation of Holdings
The table below shows the investment makeup of the fund, representing a percentage of the total net assets of the fund.
Asset Allocation
| Affiliated investment companies | 97.5% |
| Equity | 80.2% |
| U.S. large cap | 31.2% |
| International equity | 27.2% |
| U.S. mid cap | 8.4% |
| Emerging-market equity | 5.6% |
| Large blend | 4.0% |
| U.S. small cap | 3.8% |
| Fixed income | 14.3% |
| Intermediate bond | 5.7% |
| Multi-sector bond | 2.2% |
| Emerging-market debt | 1.9% |
| Short-term bond | 1.9% |
| Bank loan | 1.4% |
| High yield bond | 1.2% |
| Alternative and specialty | 3.0% |
| Sector equity | 2.5% |
| Absolute return | 0.5% |
| U.S. Government | 2.5% |
Holdings may not have been held by the fund for the entire period and are subject to change without notice. Portfolio composition is subject to review in accordance with the fund’s investment strategy and may vary in the future. Current and future portfolio holdings are subject to risk and may change at any time.
What were the fund costs during the last year ?
(Based on a hypothetical $10,000 investment)
| Fund (Class) | Costs of a $10,000 investment | Costs paid as a percentage of a $10,000 investment |
| Multimanager Lifestyle Moderate Portfolio (Class R6/JULMX) |
$18 | 0.17% |
Management’s Discussion of Fund Performance
SUMMARY OF RESULTS
Multimanager Lifestyle Moderate Portfolio (Class R6/JULMX) returned 10.20% for the year ended August 31, 2026. Global equities produced sizable gains in the 12-month period that ended on August 31, 2026. Investors were encouraged by the favorable combination of healthy economic growth trends, robust corporate earnings, and generally supportive central bank policies, together with optimism about artificial intelligence. While technology stocks performed very well, the value style outpaced growth on a global basis and contributed meaningfully to the markets’ strong showing. Emerging market equities also posted outsized returns. Bonds registered more modest gains, led by credit-oriented investments. Income was the primary contributor to total returns for fixed income instruments, as prices came under pressure from concerns about persistent inflation, global conflicts, energy prices, and mounting government debt across the developed world.
TOP PERFORMANCE CONTRIBUTORS
Equity allocation | U.S. equities made the most significant contribution to absolute performance, including the fund’s sizable allocation to large caps. International developed market equities further helped results, as did emerging market stocks. The real assets portfolio was an additional contributor with strong returns for the energy and metals & mining sectors.
Bond funds | The fixed-income allocation also contributed, led by intermediate-term bonds, multi-sector bonds, and emerging markets debt. Holdings in high yield bonds, short-term bonds, and bank loans aided returns as well.
TOP PERFORMANCE DETRACTORS
Specific positions | At a time of positive returns for most segments of the financial markets, the majority of the fund’s holdings recorded a gain. However, small positions in U.S. Treasury STRIPS (Separate Trading of Registered Interest and Principal of Securities) were adversely affected by rising yields.
The views expressed in this report are those of the portfolio management team and are subject to change. They are not meant as investment advice.
Fund Performance
The following graph compares the initial and subsequent account values at the end of each of the most recently completed 10 fiscal years of the fund (or for the life of the fund, if shorter). It assumes a $1,000,000 initial investment in the fund and in an appropriate, broad-based securities market index for the same period.
GROWTH OF $1,000,000
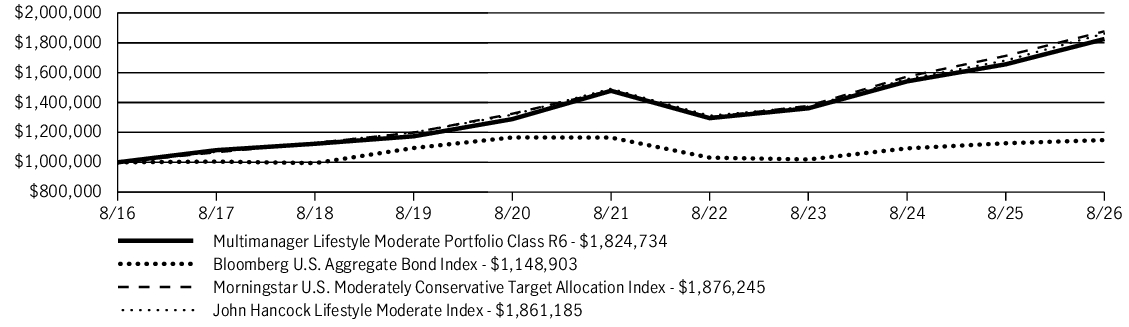
| AVERAGE ANNUAL TOTAL RETURN | 1 Year | 5 Years | 10 Years |
| Multimanager Lifestyle Moderate Portfolio (Class R6/JULMX) | 10.20% | 4.30% | 6.20% |
| Bloomberg U.S. Aggregate Bond Index | 1.89% | (0.29)% | 1.40% |
| Morningstar U.S. Moderately Conservative Target Allocation Index | 9.58% | 4.86% | 6.49% |
| John Hancock Lifestyle Moderate Index | 10.70% | 4.52% | 6.41% |
Fund Statistics
| Fund net assets | $1,931,239,996 |
| Total number of portfolio holdings | 84 |
| Total advisory fees paid (net) | $2,651,643 |
| Portfolio turnover rate | 12% |
Graphical Representation of Holdings
The table below shows the investment makeup of the fund, representing a percentage of the total net assets of the fund.
Asset Allocation
| Affiliated investment companies | 93.3% |
| Equity | 41.3% |
| International equity | 14.1% |
| U.S. large cap | 13.9% |
| Large blend | 4.7% |
| U.S. mid cap | 4.5% |
| Emerging-market equity | 2.8% |
| U.S. small cap | 1.3% |
| Fixed income | 48.7% |
| Intermediate bond | 22.9% |
| Multi-sector bond | 6.9% |
| Short-term bond | 5.7% |
| Emerging-market debt | 5.0% |
| Bank loan | 4.3% |
| High yield bond | 3.9% |
| Alternative and specialty | 3.3% |
| Multi-asset income | 1.5% |
| Sector equity | 1.3% |
| Absolute return | 0.5% |
| U.S. Government | 6.7% |
Holdings may not have been held by the fund for the entire period and are subject to change without notice. Portfolio composition is subject to review in accordance with the fund’s investment strategy and may vary in the future. Current and future portfolio holdings are subject to risk and may change at any time.
What were the fund costs during the last year ?
(Based on a hypothetical $10,000 investment)
| Fund (Class) | Costs of a $10,000 investment | Costs paid as a percentage of a $10,000 investment |
| Multimanager Lifestyle Moderate Portfolio (Class R5/JTLMX) |
$23 | 0.22% |
Management’s Discussion of Fund Performance
SUMMARY OF RESULTS
Multimanager Lifestyle Moderate Portfolio (Class R5/JTLMX) returned 10.12% for the year ended August 31, 2026. Global equities produced sizable gains in the 12-month period that ended on August 31, 2026. Investors were encouraged by the favorable combination of healthy economic growth trends, robust corporate earnings, and generally supportive central bank policies, together with optimism about artificial intelligence. While technology stocks performed very well, the value style outpaced growth on a global basis and contributed meaningfully to the markets’ strong showing. Emerging market equities also posted outsized returns. Bonds registered more modest gains, led by credit-oriented investments. Income was the primary contributor to total returns for fixed income instruments, as prices came under pressure from concerns about persistent inflation, global conflicts, energy prices, and mounting government debt across the developed world.
TOP PERFORMANCE CONTRIBUTORS
Equity allocation | U.S. equities made the most significant contribution to absolute performance, including the fund’s sizable allocation to large caps. International developed market equities further helped results, as did emerging market stocks. The real assets portfolio was an additional contributor with strong returns for the energy and metals & mining sectors.
Bond funds | The fixed-income allocation also contributed, led by intermediate-term bonds, multi-sector bonds, and emerging markets debt. Holdings in high yield bonds, short-term bonds, and bank loans aided returns as well.
TOP PERFORMANCE DETRACTORS
Specific positions | At a time of positive returns for most segments of the financial markets, the majority of the fund’s holdings recorded a gain. However, small positions in U.S. Treasury STRIPS (Separate Trading of Registered Interest and Principal of Securities) were adversely affected by rising yields.
The views expressed in this report are those of the portfolio management team and are subject to change. They are not meant as investment advice.
Fund Performance
The following graph compares the initial and subsequent account values at the end of each of the most recently completed 10 fiscal years of the fund (or for the life of the fund, if shorter). It assumes a $10,000 initial investment in the fund and in an appropriate, broad-based securities market index for the same period.
GROWTH OF $10,000
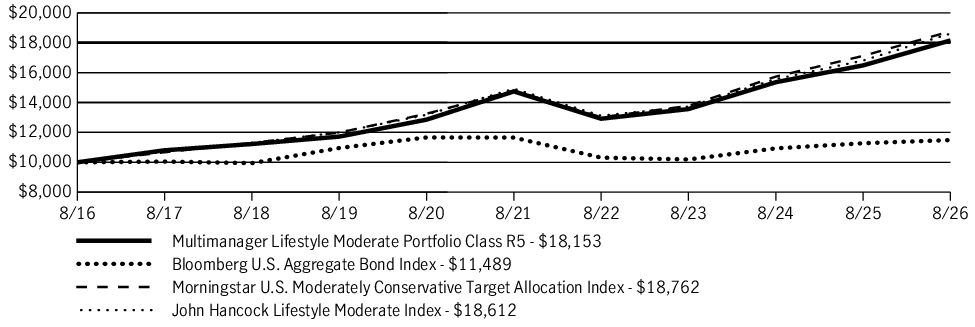
| AVERAGE ANNUAL TOTAL RETURN | 1 Year | 5 Years | 10 Years |
| Multimanager Lifestyle Moderate Portfolio (Class R5/JTLMX) | 10.12% | 4.25% | 6.14% |
| Bloomberg U.S. Aggregate Bond Index | 1.89% | (0.29)% | 1.40% |
| Morningstar U.S. Moderately Conservative Target Allocation Index | 9.58% | 4.86% | 6.49% |
| John Hancock Lifestyle Moderate Index | 10.70% | 4.52% | 6.41% |
Fund Statistics
| Fund net assets | $1,931,239,996 |
| Total number of portfolio holdings | 84 |
| Total advisory fees paid (net) | $2,651,643 |
| Portfolio turnover rate | 12% |
Graphical Representation of Holdings
The table below shows the investment makeup of the fund, representing a percentage of the total net assets of the fund.
Asset Allocation
| Affiliated investment companies | 93.3% |
| Equity | 41.3% |
| International equity | 14.1% |
| U.S. large cap | 13.9% |
| Large blend | 4.7% |
| U.S. mid cap | 4.5% |
| Emerging-market equity | 2.8% |
| U.S. small cap | 1.3% |
| Fixed income | 48.7% |
| Intermediate bond | 22.9% |
| Multi-sector bond | 6.9% |
| Short-term bond | 5.7% |
| Emerging-market debt | 5.0% |
| Bank loan | 4.3% |
| High yield bond | 3.9% |
| Alternative and specialty | 3.3% |
| Multi-asset income | 1.5% |
| Sector equity | 1.3% |
| Absolute return | 0.5% |
| U.S. Government | 6.7% |
Holdings may not have been held by the fund for the entire period and are subject to change without notice. Portfolio composition is subject to review in accordance with the fund’s investment strategy and may vary in the future. Current and future portfolio holdings are subject to risk and may change at any time.
What were the fund costs during the last year ?
(Based on a hypothetical $10,000 investment)
| Fund (Class) | Costs of a $10,000 investment | Costs paid as a percentage of a $10,000 investment |
| Multimanager Lifestyle Moderate Portfolio (Class R4/JSLMX) |
$44 | 0.42% |
Management’s Discussion of Fund Performance
SUMMARY OF RESULTS
Multimanager Lifestyle Moderate Portfolio (Class R4/JSLMX) returned 9.90% for the year ended August 31, 2026. Global equities produced sizable gains in the 12-month period that ended on August 31, 2026. Investors were encouraged by the favorable combination of healthy economic growth trends, robust corporate earnings, and generally supportive central bank policies, together with optimism about artificial intelligence. While technology stocks performed very well, the value style outpaced growth on a global basis and contributed meaningfully to the markets’ strong showing. Emerging market equities also posted outsized returns. Bonds registered more modest gains, led by credit-oriented investments. Income was the primary contributor to total returns for fixed income instruments, as prices came under pressure from concerns about persistent inflation, global conflicts, energy prices, and mounting government debt across the developed world.
TOP PERFORMANCE CONTRIBUTORS
Equity allocation | U.S. equities made the most significant contribution to absolute performance, including the fund’s sizable allocation to large caps. International developed market equities further helped results, as did emerging market stocks. The real assets portfolio was an additional contributor with strong returns for the energy and metals & mining sectors.
Bond funds | The fixed-income allocation also contributed, led by intermediate-term bonds, multi-sector bonds, and emerging markets debt. Holdings in high yield bonds, short-term bonds, and bank loans aided returns as well.
TOP PERFORMANCE DETRACTORS
Specific positions | At a time of positive returns for most segments of the financial markets, the majority of the fund’s holdings recorded a gain. However, small positions in U.S. Treasury STRIPS (Separate Trading of Registered Interest and Principal of Securities) were adversely affected by rising yields.
The views expressed in this report are those of the portfolio management team and are subject to change. They are not meant as investment advice.
Fund Performance
The following graph compares the initial and subsequent account values at the end of each of the most recently completed 10 fiscal years of the fund (or for the life of the fund, if shorter). It assumes a $10,000 initial investment in the fund and in an appropriate, broad-based securities market index for the same period.
GROWTH OF $10,000
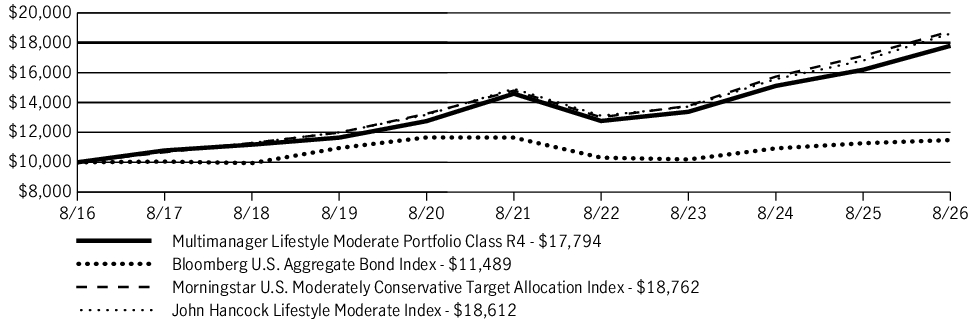
| AVERAGE ANNUAL TOTAL RETURN | 1 Year | 5 Years | 10 Years |
| Multimanager Lifestyle Moderate Portfolio (Class R4/JSLMX) | 9.90% | 4.05% | 5.93% |
| Bloomberg U.S. Aggregate Bond Index | 1.89% | (0.29)% | 1.40% |
| Morningstar U.S. Moderately Conservative Target Allocation Index | 9.58% | 4.86% | 6.49% |
| John Hancock Lifestyle Moderate Index | 10.70% | 4.52% | 6.41% |
Fund Statistics
| Fund net assets | $1,931,239,996 |
| Total number of portfolio holdings | 84 |
| Total advisory fees paid (net) | $2,651,643 |
| Portfolio turnover rate | 12% |
Graphical Representation of Holdings
The table below shows the investment makeup of the fund, representing a percentage of the total net assets of the fund.
Asset Allocation
| Affiliated investment companies | 93.3% |
| Equity | 41.3% |
| International equity | 14.1% |
| U.S. large cap | 13.9% |
| Large blend | 4.7% |
| U.S. mid cap | 4.5% |
| Emerging-market equity | 2.8% |
| U.S. small cap | 1.3% |
| Fixed income | 48.7% |
| Intermediate bond | 22.9% |
| Multi-sector bond | 6.9% |
| Short-term bond | 5.7% |
| Emerging-market debt | 5.0% |
| Bank loan | 4.3% |
| High yield bond | 3.9% |
| Alternative and specialty | 3.3% |
| Multi-asset income | 1.5% |
| Sector equity | 1.3% |
| Absolute return | 0.5% |
| U.S. Government | 6.7% |
Holdings may not have been held by the fund for the entire period and are subject to change without notice. Portfolio composition is subject to review in accordance with the fund’s investment strategy and may vary in the future. Current and future portfolio holdings are subject to risk and may change at any time.
What were the fund costs during the last year ?
(Based on a hypothetical $10,000 investment)
| Fund (Class) | Costs of a $10,000 investment | Costs paid as a percentage of a $10,000 investment |
| Multimanager Lifestyle Moderate Portfolio (Class R2/JQLMX) |
$70 | 0.67% |
Management’s Discussion of Fund Performance
SUMMARY OF RESULTS
Multimanager Lifestyle Moderate Portfolio (Class R2/JQLMX) returned 9.67% for the year ended August 31, 2026. Global equities produced sizable gains in the 12-month period that ended on August 31, 2026. Investors were encouraged by the favorable combination of healthy economic growth trends, robust corporate earnings, and generally supportive central bank policies, together with optimism about artificial intelligence. While technology stocks performed very well, the value style outpaced growth on a global basis and contributed meaningfully to the markets’ strong showing. Emerging market equities also posted outsized returns. Bonds registered more modest gains, led by credit-oriented investments. Income was the primary contributor to total returns for fixed income instruments, as prices came under pressure from concerns about persistent inflation, global conflicts, energy prices, and mounting government debt across the developed world.
TOP PERFORMANCE CONTRIBUTORS
Equity allocation | U.S. equities made the most significant contribution to absolute performance, including the fund’s sizable allocation to large caps. International developed market equities further helped results, as did emerging market stocks. The real assets portfolio was an additional contributor with strong returns for the energy and metals & mining sectors.
Bond funds | The fixed-income allocation also contributed, led by intermediate-term bonds, multi-sector bonds, and emerging markets debt. Holdings in high yield bonds, short-term bonds, and bank loans aided returns as well.
TOP PERFORMANCE DETRACTORS
Specific positions | At a time of positive returns for most segments of the financial markets, the majority of the fund’s holdings recorded a gain. However, small positions in U.S. Treasury STRIPS (Separate Trading of Registered Interest and Principal of Securities) were adversely affected by rising yields.
The views expressed in this report are those of the portfolio management team and are subject to change. They are not meant as investment advice.
Fund Performance
The following graph compares the initial and subsequent account values at the end of each of the most recently completed 10 fiscal years of the fund (or for the life of the fund, if shorter). It assumes a $10,000 initial investment in the fund and in an appropriate, broad-based securities market index for the same period.
GROWTH OF $10,000
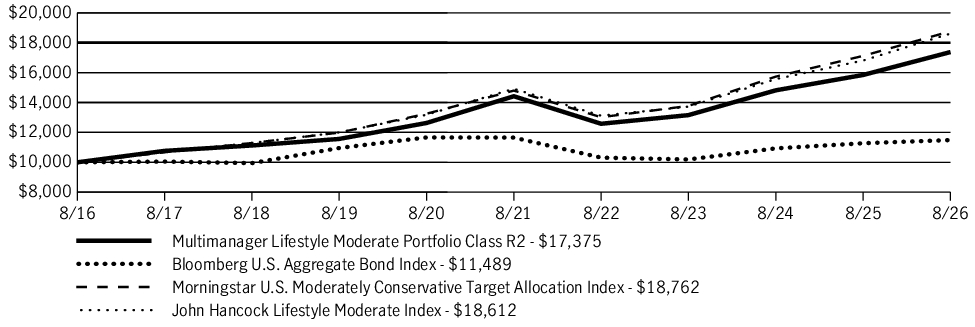
| AVERAGE ANNUAL TOTAL RETURN | 1 Year | 5 Years | 10 Years |
| Multimanager Lifestyle Moderate Portfolio (Class R2/JQLMX) | 9.67% | 3.80% | 5.68% |
| Bloomberg U.S. Aggregate Bond Index | 1.89% | (0.29)% | 1.40% |
| Morningstar U.S. Moderately Conservative Target Allocation Index | 9.58% | 4.86% | 6.49% |
| John Hancock Lifestyle Moderate Index | 10.70% | 4.52% | 6.41% |
Fund Statistics
| Fund net assets | $1,931,239,996 |
| Total number of portfolio holdings | 84 |
| Total advisory fees paid (net) | $2,651,643 |
| Portfolio turnover rate | 12% |
Graphical Representation of Holdings
The table below shows the investment makeup of the fund, representing a percentage of the total net assets of the fund.
Asset Allocation
| Affiliated investment companies | 93.3% |
| Equity | 41.3% |
| International equity | 14.1% |
| U.S. large cap | 13.9% |
| Large blend | 4.7% |
| U.S. mid cap | 4.5% |
| Emerging-market equity | 2.8% |
| U.S. small cap | 1.3% |
| Fixed income | 48.7% |
| Intermediate bond | 22.9% |
| Multi-sector bond | 6.9% |
| Short-term bond | 5.7% |
| Emerging-market debt | 5.0% |
| Bank loan | 4.3% |
| High yield bond | 3.9% |
| Alternative and specialty | 3.3% |
| Multi-asset income | 1.5% |
| Sector equity | 1.3% |
| Absolute return | 0.5% |
| U.S. Government | 6.7% |
Holdings may not have been held by the fund for the entire period and are subject to change without notice. Portfolio composition is subject to review in accordance with the fund’s investment strategy and may vary in the future. Current and future portfolio holdings are subject to risk and may change at any time.
What were the fund costs during the last year ?
(Based on a hypothetical $10,000 investment)
| Fund (Class) | Costs of a $10,000 investment | Costs paid as a percentage of a $10,000 investment |
| Multimanager Lifestyle Moderate Portfolio (Class I/JTMIX) |
$29 | 0.28% |
Management’s Discussion of Fund Performance
SUMMARY OF RESULTS
Multimanager Lifestyle Moderate Portfolio (Class I/JTMIX) returned 9.98% for the year ended August 31, 2026. Global equities produced sizable gains in the 12-month period that ended on August 31, 2026. Investors were encouraged by the favorable combination of healthy economic growth trends, robust corporate earnings, and generally supportive central bank policies, together with optimism about artificial intelligence. While technology stocks performed very well, the value style outpaced growth on a global basis and contributed meaningfully to the markets’ strong showing. Emerging market equities also posted outsized returns. Bonds registered more modest gains, led by credit-oriented investments. Income was the primary contributor to total returns for fixed income instruments, as prices came under pressure from concerns about persistent inflation, global conflicts, energy prices, and mounting government debt across the developed world.
TOP PERFORMANCE CONTRIBUTORS
Equity allocation | U.S. equities made the most significant contribution to absolute performance, including the fund’s sizable allocation to large caps. International developed market equities further helped results, as did emerging market stocks. The real assets portfolio was an additional contributor with strong returns for the energy and metals & mining sectors.
Bond funds | The fixed-income allocation also contributed, led by intermediate-term bonds, multi-sector bonds, and emerging markets debt. Holdings in high yield bonds, short-term bonds, and bank loans aided returns as well.
TOP PERFORMANCE DETRACTORS
Specific positions | At a time of positive returns for most segments of the financial markets, the majority of the fund’s holdings recorded a gain. However, small positions in U.S. Treasury STRIPS (Separate Trading of Registered Interest and Principal of Securities) were adversely affected by rising yields.
The views expressed in this report are those of the portfolio management team and are subject to change. They are not meant as investment advice.
Fund Performance
The following graph compares the initial and subsequent account values at the end of each of the most recently completed 10 fiscal years of the fund (or for the life of the fund, if shorter). It assumes a $250,000 initial investment in the fund and in an appropriate, broad-based securities market index for the same period.
GROWTH OF $250,000
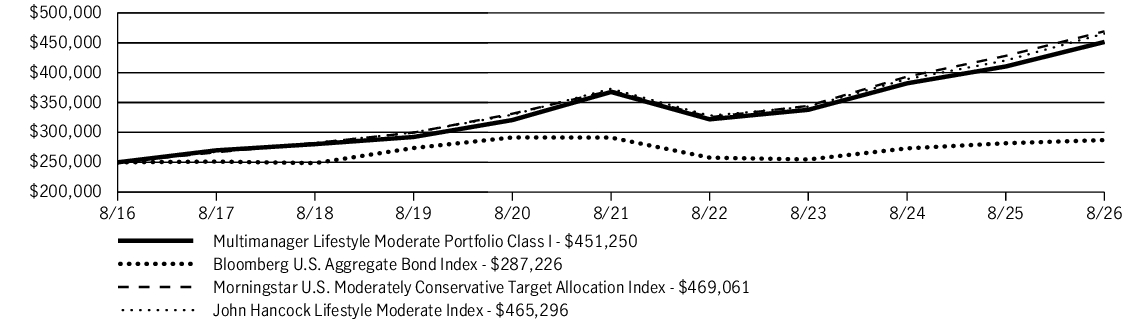
| AVERAGE ANNUAL TOTAL RETURN | 1 Year | 5 Years | 10 Years |
| Multimanager Lifestyle Moderate Portfolio (Class I/JTMIX) | 9.98% | 4.18% | 6.08% |
| Bloomberg U.S. Aggregate Bond Index | 1.89% | (0.29)% | 1.40% |
| Morningstar U.S. Moderately Conservative Target Allocation Index | 9.58% | 4.86% | 6.49% |
| John Hancock Lifestyle Moderate Index | 10.70% | 4.52% | 6.41% |
Fund Statistics
| Fund net assets | $1,931,239,996 |
| Total number of portfolio holdings | 84 |
| Total advisory fees paid (net) | $2,651,643 |
| Portfolio turnover rate | 12% |
Graphical Representation of Holdings
The table below shows the investment makeup of the fund, representing a percentage of the total net assets of the fund.
Asset Allocation
| Affiliated investment companies | 93.3% |
| Equity | 41.3% |
| International equity | 14.1% |
| U.S. large cap | 13.9% |
| Large blend | 4.7% |
| U.S. mid cap | 4.5% |
| Emerging-market equity | 2.8% |
| U.S. small cap | 1.3% |
| Fixed income | 48.7% |
| Intermediate bond | 22.9% |
| Multi-sector bond | 6.9% |
| Short-term bond | 5.7% |
| Emerging-market debt | 5.0% |
| Bank loan | 4.3% |
| High yield bond | 3.9% |
| Alternative and specialty | 3.3% |
| Multi-asset income | 1.5% |
| Sector equity | 1.3% |
| Absolute return | 0.5% |
| U.S. Government | 6.7% |
Holdings may not have been held by the fund for the entire period and are subject to change without notice. Portfolio composition is subject to review in accordance with the fund’s investment strategy and may vary in the future. Current and future portfolio holdings are subject to risk and may change at any time.
What were the fund costs during the last year ?
(Based on a hypothetical $10,000 investment)
| Fund (Class) | Costs of a $10,000 investment | Costs paid as a percentage of a $10,000 investment |
| Multimanager Lifestyle Moderate Portfolio (Class C/JCLMX) |
$134 | 1.28% |
Management’s Discussion of Fund Performance
SUMMARY OF RESULTS
Multimanager Lifestyle Moderate Portfolio (Class C/JCLMX) returned 9.00% (excluding sales charges) for the year ended August 31, 2026. Global equities produced sizable gains in the 12-month period that ended on August 31, 2026. Investors were encouraged by the favorable combination of healthy economic growth trends, robust corporate earnings, and generally supportive central bank policies, together with optimism about artificial intelligence. While technology stocks performed very well, the value style outpaced growth on a global basis and contributed meaningfully to the markets’ strong showing. Emerging market equities also posted outsized returns. Bonds registered more modest gains, led by credit-oriented investments. Income was the primary contributor to total returns for fixed income instruments, as prices came under pressure from concerns about persistent inflation, global conflicts, energy prices, and mounting government debt across the developed world.
TOP PERFORMANCE CONTRIBUTORS
Equity allocation | U.S. equities made the most significant contribution to absolute performance, including the fund’s sizable allocation to large caps. International developed market equities further helped results, as did emerging market stocks. The real assets portfolio was an additional contributor with strong returns for the energy and metals & mining sectors.
Bond funds | The fixed-income allocation also contributed, led by intermediate-term bonds, multi-sector bonds, and emerging markets debt. Holdings in high yield bonds, short-term bonds, and bank loans aided returns as well.
TOP PERFORMANCE DETRACTORS
Specific positions | At a time of positive returns for most segments of the financial markets, the majority of the fund’s holdings recorded a gain. However, small positions in U.S. Treasury STRIPS (Separate Trading of Registered Interest and Principal of Securities) were adversely affected by rising yields.
The views expressed in this report are those of the portfolio management team and are subject to change. They are not meant as investment advice.
Fund Performance
The following graph compares the initial and subsequent account values at the end of each of the most recently completed 10 fiscal years of the fund (or for the life of the fund, if shorter). It assumes a $10,000 initial investment in the fund and in an appropriate, broad-based securities market index for the same period.
GROWTH OF $10,000
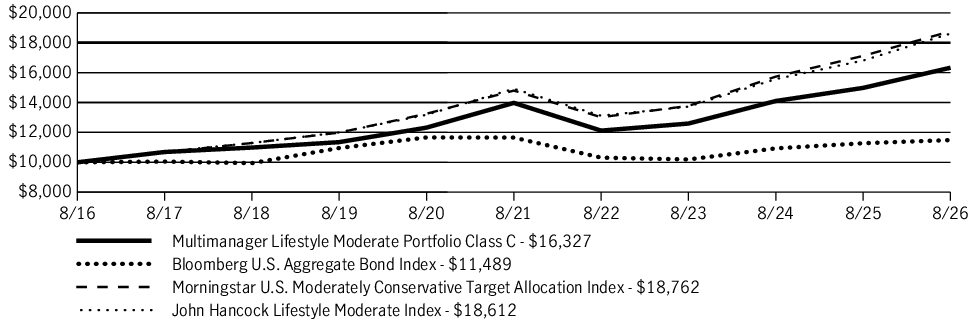
| AVERAGE ANNUAL TOTAL RETURN | 1 Year | 5 Years | 10 Years |
| Multimanager Lifestyle Moderate Portfolio (Class C/JCLMX) | 8.00% | 3.16% | 5.02% |
| Multimanager Lifestyle Moderate Portfolio (Class C/JCLMX)—excluding sales charge | 9.00% | 3.16% | 5.02% |
| Bloomberg U.S. Aggregate Bond Index | 1.89% | (0.29)% | 1.40% |
| Morningstar U.S. Moderately Conservative Target Allocation Index | 9.58% | 4.86% | 6.49% |
| John Hancock Lifestyle Moderate Index | 10.70% | 4.52% | 6.41% |
Fund Statistics
| Fund net assets | $1,931,239,996 |
| Total number of portfolio holdings | 84 |
| Total advisory fees paid (net) | $2,651,643 |
| Portfolio turnover rate | 12% |
Graphical Representation of Holdings
The table below shows the investment makeup of the fund, representing a percentage of the total net assets of the fund.
Asset Allocation
| Affiliated investment companies | 93.3% |
| Equity | 41.3% |
| International equity | 14.1% |
| U.S. large cap | 13.9% |
| Large blend | 4.7% |
| U.S. mid cap | 4.5% |
| Emerging-market equity | 2.8% |
| U.S. small cap | 1.3% |
| Fixed income | 48.7% |
| Intermediate bond | 22.9% |
| Multi-sector bond | 6.9% |
| Short-term bond | 5.7% |
| Emerging-market debt | 5.0% |
| Bank loan | 4.3% |
| High yield bond | 3.9% |
| Alternative and specialty | 3.3% |
| Multi-asset income | 1.5% |
| Sector equity | 1.3% |
| Absolute return | 0.5% |
| U.S. Government | 6.7% |
Holdings may not have been held by the fund for the entire period and are subject to change without notice. Portfolio composition is subject to review in accordance with the fund’s investment strategy and may vary in the future. Current and future portfolio holdings are subject to risk and may change at any time.
What were the fund costs during the last year ?
(Based on a hypothetical $10,000 investment)
| Fund (Class) | Costs of a $10,000 investment | Costs paid as a percentage of a $10,000 investment |
| Multimanager Lifestyle Moderate Portfolio (Class A/JALMX) |
$61 | 0.58% |
Management’s Discussion of Fund Performance
SUMMARY OF RESULTS
Multimanager Lifestyle Moderate Portfolio (Class A/JALMX) returned 9.73% (excluding sales charges) for the year ended August 31, 2026. Global equities produced sizable gains in the 12-month period that ended on August 31, 2026. Investors were encouraged by the favorable combination of healthy economic growth trends, robust corporate earnings, and generally supportive central bank policies, together with optimism about artificial intelligence. While technology stocks performed very well, the value style outpaced growth on a global basis and contributed meaningfully to the markets’ strong showing. Emerging market equities also posted outsized returns. Bonds registered more modest gains, led by credit-oriented investments. Income was the primary contributor to total returns for fixed income instruments, as prices came under pressure from concerns about persistent inflation, global conflicts, energy prices, and mounting government debt across the developed world.
TOP PERFORMANCE CONTRIBUTORS
Equity allocation | U.S. equities made the most significant contribution to absolute performance, including the fund’s sizable allocation to large caps. International developed market equities further helped results, as did emerging market stocks. The real assets portfolio was an additional contributor with strong returns for the energy and metals & mining sectors.
Bond funds | The fixed-income allocation also contributed, led by intermediate-term bonds, multi-sector bonds, and emerging markets debt. Holdings in high yield bonds, short-term bonds, and bank loans aided returns as well.
TOP PERFORMANCE DETRACTORS
Specific positions | At a time of positive returns for most segments of the financial markets, the majority of the fund’s holdings recorded a gain. However, small positions in U.S. Treasury STRIPS (Separate Trading of Registered Interest and Principal of Securities) were adversely affected by rising yields.
The views expressed in this report are those of the portfolio management team and are subject to change. They are not meant as investment advice.
Fund Performance
The following graph compares the initial and subsequent account values at the end of each of the most recently completed 10 fiscal years of the fund (or for the life of the fund, if shorter). It assumes a $10,000 initial investment in the fund and in an appropriate, broad-based securities market index for the same period.
GROWTH OF $10,000
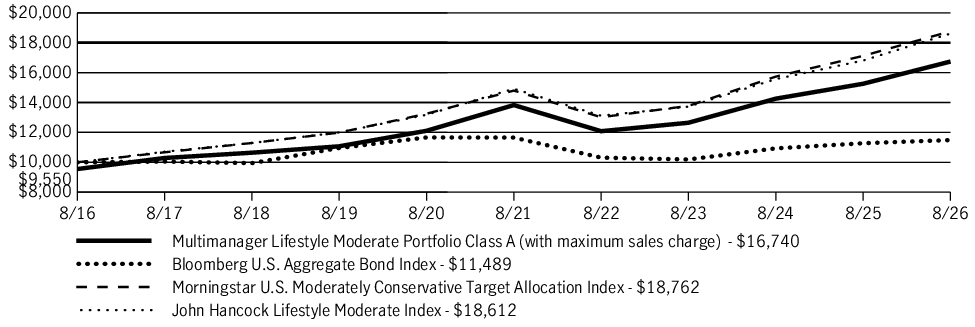
| AVERAGE ANNUAL TOTAL RETURN | 1 Year | 5 Years | 10 Years |
| Multimanager Lifestyle Moderate Portfolio (Class A/JALMX) | 4.83% | 2.94% | 5.29% |
| Multimanager Lifestyle Moderate Portfolio (Class A/JALMX)—excluding sales charge | 9.73% | 3.89% | 5.77% |
| Bloomberg U.S. Aggregate Bond Index | 1.89% | (0.29)% | 1.40% |
| Morningstar U.S. Moderately Conservative Target Allocation Index | 9.58% | 4.86% | 6.49% |
| John Hancock Lifestyle Moderate Index | 10.70% | 4.52% | 6.41% |
Fund Statistics
| Fund net assets | $1,931,239,996 |
| Total number of portfolio holdings | 84 |
| Total advisory fees paid (net) | $2,651,643 |
| Portfolio turnover rate | 12% |
Graphical Representation of Holdings
The table below shows the investment makeup of the fund, representing a percentage of the total net assets of the fund.
Asset Allocation
| Affiliated investment companies | 93.3% |
| Equity | 41.3% |
| International equity | 14.1% |
| U.S. large cap | 13.9% |
| Large blend | 4.7% |
| U.S. mid cap | 4.5% |
| Emerging-market equity | 2.8% |
| U.S. small cap | 1.3% |
| Fixed income | 48.7% |
| Intermediate bond | 22.9% |
| Multi-sector bond | 6.9% |
| Short-term bond | 5.7% |
| Emerging-market debt | 5.0% |
| Bank loan | 4.3% |
| High yield bond | 3.9% |
| Alternative and specialty | 3.3% |
| Multi-asset income | 1.5% |
| Sector equity | 1.3% |
| Absolute return | 0.5% |
| U.S. Government | 6.7% |
Holdings may not have been held by the fund for the entire period and are subject to change without notice. Portfolio composition is subject to review in accordance with the fund’s investment strategy and may vary in the future. Current and future portfolio holdings are subject to risk and may change at any time.
What were the fund costs during the last year ?
(Based on a hypothetical $10,000 investment)
| Fund (Class) | Costs of a $10,000 investment | Costs paid as a percentage of a $10,000 investment |
| Multimanager Lifestyle Moderate Portfolio (Class 5/JHLMX) |
$18 | 0.17% |
Management’s Discussion of Fund Performance
SUMMARY OF RESULTS
Multimanager Lifestyle Moderate Portfolio (Class 5/JHLMX) returned 10.12% for the year ended August 31, 2026. Global equities produced sizable gains in the 12-month period that ended on August 31, 2026. Investors were encouraged by the favorable combination of healthy economic growth trends, robust corporate earnings, and generally supportive central bank policies, together with optimism about artificial intelligence. While technology stocks performed very well, the value style outpaced growth on a global basis and contributed meaningfully to the markets’ strong showing. Emerging market equities also posted outsized returns. Bonds registered more modest gains, led by credit-oriented investments. Income was the primary contributor to total returns for fixed income instruments, as prices came under pressure from concerns about persistent inflation, global conflicts, energy prices, and mounting government debt across the developed world.
TOP PERFORMANCE CONTRIBUTORS
Equity allocation | U.S. equities made the most significant contribution to absolute performance, including the fund’s sizable allocation to large caps. International developed market equities further helped results, as did emerging market stocks. The real assets portfolio was an additional contributor with strong returns for the energy and metals & mining sectors.
Bond funds | The fixed-income allocation also contributed, led by intermediate-term bonds, multi-sector bonds, and emerging markets debt. Holdings in high yield bonds, short-term bonds, and bank loans aided returns as well.
TOP PERFORMANCE DETRACTORS
Specific positions | At a time of positive returns for most segments of the financial markets, the majority of the fund’s holdings recorded a gain. However, small positions in U.S. Treasury STRIPS (Separate Trading of Registered Interest and Principal of Securities) were adversely affected by rising yields.
The views expressed in this report are those of the portfolio management team and are subject to change. They are not meant as investment advice.
Fund Performance
The following graph compares the initial and subsequent account values at the end of each of the most recently completed 10 fiscal years of the fund (or for the life of the fund, if shorter). It assumes a $10,000 initial investment in the fund and in an appropriate, broad-based securities market index for the same period.
GROWTH OF $10,000
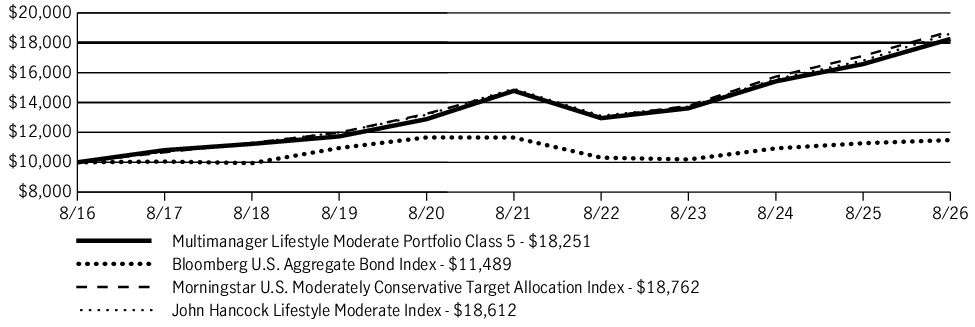
| AVERAGE ANNUAL TOTAL RETURN | 1 Year | 5 Years | 10 Years |
| Multimanager Lifestyle Moderate Portfolio (Class 5/JHLMX) | 10.12% | 4.31% | 6.20% |
| Bloomberg U.S. Aggregate Bond Index | 1.89% | (0.29)% | 1.40% |
| Morningstar U.S. Moderately Conservative Target Allocation Index | 9.58% | 4.86% | 6.49% |
| John Hancock Lifestyle Moderate Index | 10.70% | 4.52% | 6.41% |
Fund Statistics
| Fund net assets | $1,931,239,996 |
| Total number of portfolio holdings | 84 |
| Total advisory fees paid (net) | $2,651,643 |
| Portfolio turnover rate | 12% |
Graphical Representation of Holdings
The table below shows the investment makeup of the fund, representing a percentage of the total net assets of the fund.
Asset Allocation
| Affiliated investment companies | 93.3% |
| Equity | 41.3% |
| International equity | 14.1% |
| U.S. large cap | 13.9% |
| Large blend | 4.7% |
| U.S. mid cap | 4.5% |
| Emerging-market equity | 2.8% |
| U.S. small cap | 1.3% |
| Fixed income | 48.7% |
| Intermediate bond | 22.9% |
| Multi-sector bond | 6.9% |
| Short-term bond | 5.7% |
| Emerging-market debt | 5.0% |
| Bank loan | 4.3% |
| High yield bond | 3.9% |
| Alternative and specialty | 3.3% |
| Multi-asset income | 1.5% |
| Sector equity | 1.3% |
| Absolute return | 0.5% |
| U.S. Government | 6.7% |
Holdings may not have been held by the fund for the entire period and are subject to change without notice. Portfolio composition is subject to review in accordance with the fund’s investment strategy and may vary in the future. Current and future portfolio holdings are subject to risk and may change at any time.
What were the fund costs during the last year ?
(Based on a hypothetical $10,000 investment)
| Fund (Class) | Costs of a $10,000 investment | Costs paid as a percentage of a $10,000 investment |
| Multimanager Lifestyle Moderate Portfolio (Class 1/JILMX) |
$23 | 0.22% |
Management’s Discussion of Fund Performance
SUMMARY OF RESULTS
Multimanager Lifestyle Moderate Portfolio (Class 1/JILMX) returned 10.12% for the year ended August 31, 2026. Global equities produced sizable gains in the 12-month period that ended on August 31, 2026. Investors were encouraged by the favorable combination of healthy economic growth trends, robust corporate earnings, and generally supportive central bank policies, together with optimism about artificial intelligence. While technology stocks performed very well, the value style outpaced growth on a global basis and contributed meaningfully to the markets’ strong showing. Emerging market equities also posted outsized returns. Bonds registered more modest gains, led by credit-oriented investments. Income was the primary contributor to total returns for fixed income instruments, as prices came under pressure from concerns about persistent inflation, global conflicts, energy prices, and mounting government debt across the developed world.
TOP PERFORMANCE CONTRIBUTORS
Equity allocation | U.S. equities made the most significant contribution to absolute performance, including the fund’s sizable allocation to large caps. International developed market equities further helped results, as did emerging market stocks. The real assets portfolio was an additional contributor with strong returns for the energy and metals & mining sectors.
Bond funds | The fixed-income allocation also contributed, led by intermediate-term bonds, multi-sector bonds, and emerging markets debt. Holdings in high yield bonds, short-term bonds, and bank loans aided returns as well.
TOP PERFORMANCE DETRACTORS
Specific positions | At a time of positive returns for most segments of the financial markets, the majority of the fund’s holdings recorded a gain. However, small positions in U.S. Treasury STRIPS (Separate Trading of Registered Interest and Principal of Securities) were adversely affected by rising yields.
The views expressed in this report are those of the portfolio management team and are subject to change. They are not meant as investment advice.
Fund Performance
The following graph compares the initial and subsequent account values at the end of each of the most recently completed 10 fiscal years of the fund (or for the life of the fund, if shorter). It assumes a $10,000 initial investment in the fund and in an appropriate, broad-based securities market index for the same period.
GROWTH OF $10,000
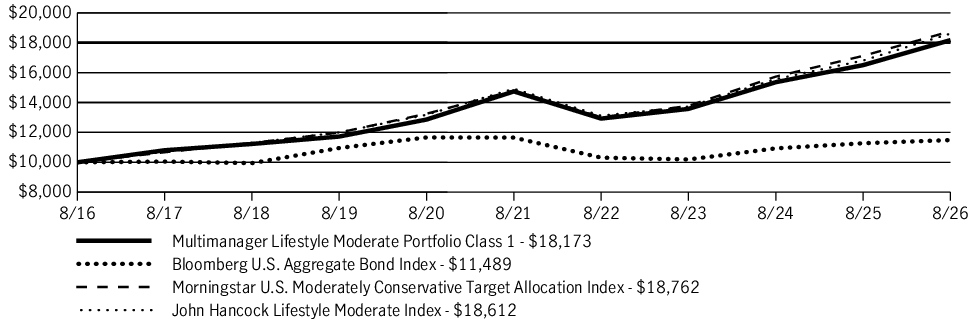
| AVERAGE ANNUAL TOTAL RETURN | 1 Year | 5 Years | 10 Years |
| Multimanager Lifestyle Moderate Portfolio (Class 1/JILMX) | 10.12% | 4.27% | 6.16% |
| Bloomberg U.S. Aggregate Bond Index | 1.89% | (0.29)% | 1.40% |
| Morningstar U.S. Moderately Conservative Target Allocation Index | 9.58% | 4.86% | 6.49% |
| John Hancock Lifestyle Moderate Index | 10.70% | 4.52% | 6.41% |
Fund Statistics
| Fund net assets | $1,931,239,996 |
| Total number of portfolio holdings | 84 |
| Total advisory fees paid (net) | $2,651,643 |
| Portfolio turnover rate | 12% |
Graphical Representation of Holdings
The table below shows the investment makeup of the fund, representing a percentage of the total net assets of the fund.
Asset Allocation
| Affiliated investment companies | 93.3% |
| Equity | 41.3% |
| International equity | 14.1% |
| U.S. large cap | 13.9% |
| Large blend | 4.7% |
| U.S. mid cap | 4.5% |
| Emerging-market equity | 2.8% |
| U.S. small cap | 1.3% |
| Fixed income | 48.7% |
| Intermediate bond | 22.9% |
| Multi-sector bond | 6.9% |
| Short-term bond | 5.7% |
| Emerging-market debt | 5.0% |
| Bank loan | 4.3% |
| High yield bond | 3.9% |
| Alternative and specialty | 3.3% |
| Multi-asset income | 1.5% |
| Sector equity | 1.3% |
| Absolute return | 0.5% |
| U.S. Government | 6.7% |
Holdings may not have been held by the fund for the entire period and are subject to change without notice. Portfolio composition is subject to review in accordance with the fund’s investment strategy and may vary in the future. Current and future portfolio holdings are subject to risk and may change at any time.
What were the fund costs during the last year ?
(Based on a hypothetical $10,000 investment)
| Fund (Class) | Costs of a $10,000 investment | Costs paid as a percentage of a $10,000 investment |
| Multimanager 2010 Lifetime Portfolio (Class 1/JLAOX) |
$5 | 0.05% |
Management’s Discussion of Fund Performance
SUMMARY OF RESULTS
Multimanager 2010 Lifetime Portfolio (Class 1/JLAOX) returned 8.50% for the year ended August 31, 2026. Global equities produced sizable gains in the 12-month period that ended on August 31, 2026. Investors were encouraged by the favorable combination of healthy economic growth trends, robust corporate earnings, and generally supportive central bank policies, together with optimism about artificial intelligence. While technology stocks performed very well, the value style outpaced growth on a global basis and contributed meaningfully to the markets’ strong showing. Emerging market equities also posted outsized returns. Bonds registered more modest gains, led by credit-oriented investments. Income was the primary contributor to total returns for fixed income instruments, as prices came under pressure from concerns about persistent inflation, global conflicts, energy prices, and mounting government debt across the developed world.
TOP PERFORMANCE CONTRIBUTORS
Equity allocation | U.S. equities made a significant contribution to absolute performance, led by large cap equities. International developed market equities further helped results. Defensive equities also generated positive returns. The real assets portfolio was an additional contributor with strong returns for energy stocks and the metals & mining sector.
Bond funds | The fixed-income allocation contributed positively, led by intermediate-term bonds and emerging markets debt. Holdings in short-term bonds, high yield bonds, multi-sector bonds, short-term U.S. Treasury Inflation Protected Securities, and bank loans aided returns as well.
TOP PERFORMANCE DETRACTORS
Specific positions | At a time of positive returns for most segments of the financial markets, the majority of the fund’s holdings recorded a gain. However, small positions in international real estate investment trusts and U.S. Treasury STRIPS (Separate Trading of Registered Interest and Principal of Securities) were adversely affected by rising yields.
The views expressed in this report are those of the portfolio management team and are subject to change. They are not meant as investment advice.
Fund Performance
The following graph compares the initial and subsequent account values at the end of each of the most recently completed 10 fiscal years of the fund (or for the life of the fund, if shorter). It assumes a $10,000 initial investment in the fund and in an appropriate, broad-based securities market index for the same period.
GROWTH OF $10,000
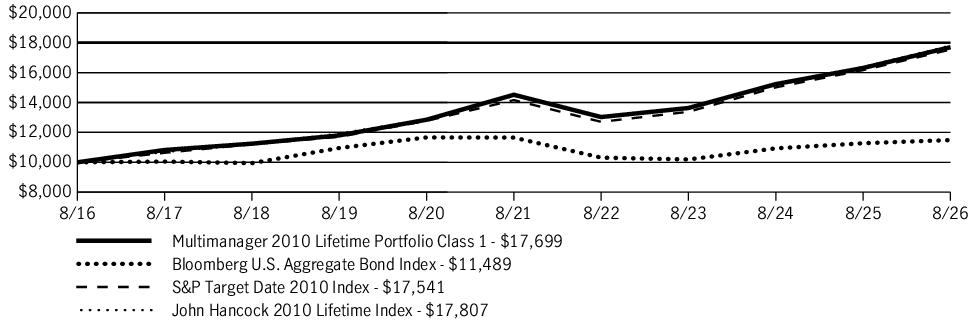
| AVERAGE ANNUAL TOTAL RETURN | 1 Year | 5 Years | 10 Years |
| Multimanager 2010 Lifetime Portfolio (Class 1/JLAOX) | 8.50% | 4.04% | 5.88% |
| Bloomberg U.S. Aggregate Bond Index | 1.89% | (0.29)% | 1.40% |
| S&P Target Date 2010 Index | 8.49% | 4.37% | 5.78% |
| John Hancock 2010 Lifetime Index | 8.78% | 4.27% | 5.94% |
Fund Statistics
| Fund net assets | $103,722,439 |
| Total number of portfolio holdings | 85 |
| Total advisory fees paid (net) | $0 |
| Portfolio turnover rate | 27% |
Graphical Representation of Holdings
The table below shows the investment makeup of the fund, representing a percentage of the total net assets of the fund.
Asset Allocation
| Affiliated investment companies | 87.6% |
| Equity | 22.6% |
| International equity | 9.5% |
| Large blend | 7.6% |
| U.S. large cap | 5.5% |
| Fixed income | 60.3% |
| Intermediate bond | 29.4% |
| Short-term bond | 12.4% |
| Emerging-market debt | 5.3% |
| Multi-sector bond | 5.0% |
| Bank loan | 4.3% |
| High yield bond | 3.9% |
| Alternative and specialty | 4.7% |
| Sector equity | 4.2% |
| Absolute return | 0.5% |
| Unaffiliated investment companies | 2.9% |
| Equity | 2.9% |
| U.S. Government | 9.5% |
Holdings may not have been held by the fund for the entire period and are subject to change without notice. Portfolio composition is subject to review in accordance with the fund’s investment strategy and may vary in the future. Current and future portfolio holdings are subject to risk and may change at any time.
What were the fund costs during the last year ?
(Based on a hypothetical $10,000 investment)
| Fund (Class) | Costs of a $10,000 investment | Costs paid as a percentage of a $10,000 investment |
| Multimanager 2010 Lifetime Portfolio (Class A/JLAAX) |
$43 | 0.41% |
Management’s Discussion of Fund Performance
SUMMARY OF RESULTS
Multimanager 2010 Lifetime Portfolio (Class A/JLAAX) returned 8.13% (excluding sales charges) for the year ended August 31, 2026. Global equities produced sizable gains in the 12-month period that ended on August 31, 2026. Investors were encouraged by the favorable combination of healthy economic growth trends, robust corporate earnings, and generally supportive central bank policies, together with optimism about artificial intelligence. While technology stocks performed very well, the value style outpaced growth on a global basis and contributed meaningfully to the markets’ strong showing. Emerging market equities also posted outsized returns. Bonds registered more modest gains, led by credit-oriented investments. Income was the primary contributor to total returns for fixed income instruments, as prices came under pressure from concerns about persistent inflation, global conflicts, energy prices, and mounting government debt across the developed world.
TOP PERFORMANCE CONTRIBUTORS
Equity allocation | U.S. equities made a significant contribution to absolute performance, led by large cap equities. International developed market equities further helped results. Defensive equities also generated positive returns. The real assets portfolio was an additional contributor with strong returns for energy stocks and the metals & mining sector.
Bond funds | The fixed-income allocation contributed positively, led by intermediate-term bonds and emerging markets debt. Holdings in short-term bonds, high yield bonds, multi-sector bonds, short-term U.S. Treasury Inflation Protected Securities, and bank loans aided returns as well.
TOP PERFORMANCE DETRACTORS
Specific positions | At a time of positive returns for most segments of the financial markets, the majority of the fund’s holdings recorded a gain. However, small positions in international real estate investment trusts and U.S. Treasury STRIPS (Separate Trading of Registered Interest and Principal of Securities) were adversely affected by rising yields.
The views expressed in this report are those of the portfolio management team and are subject to change. They are not meant as investment advice.
Fund Performance
The following graph compares the initial and subsequent account values at the end of each of the most recently completed 10 fiscal years of the fund (or for the life of the fund, if shorter). It assumes a $10,000 initial investment in the fund and in an appropriate, broad-based securities market index for the same period.
GROWTH OF $10,000
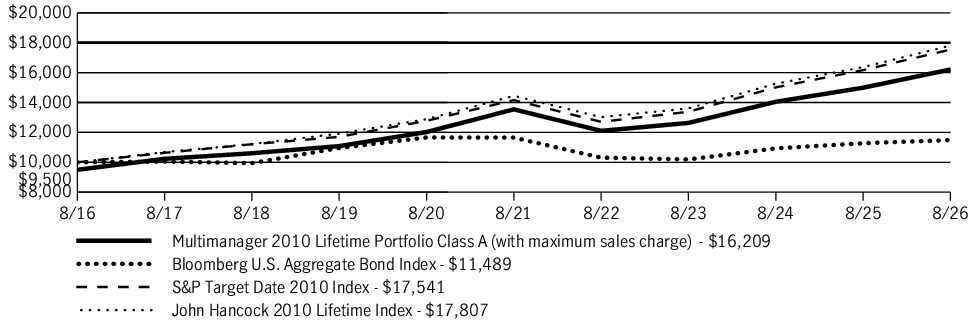
| AVERAGE ANNUAL TOTAL RETURN | 1 Year | 5 Years | 10 Years |
| Multimanager 2010 Lifetime Portfolio (Class A/JLAAX) | 2.68% | 2.59% | 4.95% |
| Multimanager 2010 Lifetime Portfolio (Class A/JLAAX)—excluding sales charge | 8.13% | 3.66% | 5.49% |
| Bloomberg U.S. Aggregate Bond Index | 1.89% | (0.29)% | 1.40% |
| S&P Target Date 2010 Index | 8.49% | 4.37% | 5.78% |
| John Hancock 2010 Lifetime Index | 8.78% | 4.27% | 5.94% |
Fund Statistics
| Fund net assets | $103,722,439 |
| Total number of portfolio holdings | 85 |
| Total advisory fees paid (net) | $0 |
| Portfolio turnover rate | 27% |
Graphical Representation of Holdings
The table below shows the investment makeup of the fund, representing a percentage of the total net assets of the fund.
Asset Allocation
| Affiliated investment companies | 87.6% |
| Equity | 22.6% |
| International equity | 9.5% |
| Large blend | 7.6% |
| U.S. large cap | 5.5% |
| Fixed income | 60.3% |
| Intermediate bond | 29.4% |
| Short-term bond | 12.4% |
| Emerging-market debt | 5.3% |
| Multi-sector bond | 5.0% |
| Bank loan | 4.3% |
| High yield bond | 3.9% |
| Alternative and specialty | 4.7% |
| Sector equity | 4.2% |
| Absolute return | 0.5% |
| Unaffiliated investment companies | 2.9% |
| Equity | 2.9% |
| U.S. Government | 9.5% |
Holdings may not have been held by the fund for the entire period and are subject to change without notice. Portfolio composition is subject to review in accordance with the fund’s investment strategy and may vary in the future. Current and future portfolio holdings are subject to risk and may change at any time.
What were the fund costs during the last year ?
(Based on a hypothetical $10,000 investment)
| Fund (Class) | Costs of a $10,000 investment | Costs paid as a percentage of a $10,000 investment |
| Multimanager 2010 Lifetime Portfolio (Class I/JHRLX) |
$11 | 0.11% |
Management’s Discussion of Fund Performance
SUMMARY OF RESULTS
Multimanager 2010 Lifetime Portfolio (Class I/JHRLX) returned 8.44% for the year ended August 31, 2026. Global equities produced sizable gains in the 12-month period that ended on August 31, 2026. Investors were encouraged by the favorable combination of healthy economic growth trends, robust corporate earnings, and generally supportive central bank policies, together with optimism about artificial intelligence. While technology stocks performed very well, the value style outpaced growth on a global basis and contributed meaningfully to the markets’ strong showing. Emerging market equities also posted outsized returns. Bonds registered more modest gains, led by credit-oriented investments. Income was the primary contributor to total returns for fixed income instruments, as prices came under pressure from concerns about persistent inflation, global conflicts, energy prices, and mounting government debt across the developed world.
TOP PERFORMANCE CONTRIBUTORS
Equity allocation | U.S. equities made a significant contribution to absolute performance, led by large cap equities. International developed market equities further helped results. Defensive equities also generated positive returns. The real assets portfolio was an additional contributor with strong returns for energy stocks and the metals & mining sector.
Bond funds | The fixed-income allocation contributed positively, led by intermediate-term bonds and emerging markets debt. Holdings in short-term bonds, high yield bonds, multi-sector bonds, short-term U.S. Treasury Inflation Protected Securities, and bank loans aided returns as well.
TOP PERFORMANCE DETRACTORS
Specific positions | At a time of positive returns for most segments of the financial markets, the majority of the fund’s holdings recorded a gain. However, small positions in international real estate investment trusts and U.S. Treasury STRIPS (Separate Trading of Registered Interest and Principal of Securities) were adversely affected by rising yields.
The views expressed in this report are those of the portfolio management team and are subject to change. They are not meant as investment advice.
Fund Performance
The following graph compares the initial and subsequent account values at the end of each of the most recently completed 10 fiscal years of the fund (or for the life of the fund, if shorter). It assumes a $250,000 initial investment in the fund and in an appropriate, broad-based securities market index for the same period.
GROWTH OF $250,000
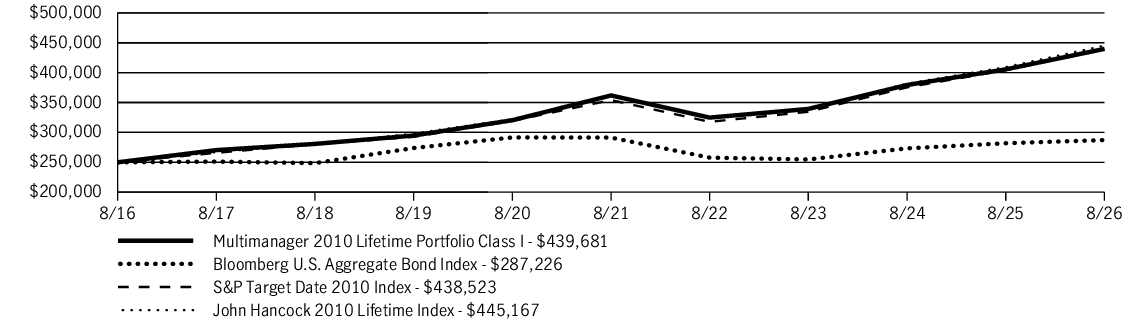
| AVERAGE ANNUAL TOTAL RETURN | 1 Year | 5 Years | 10 Years |
| Multimanager 2010 Lifetime Portfolio (Class I/JHRLX) | 8.44% | 3.97% | 5.81% |
| Bloomberg U.S. Aggregate Bond Index | 1.89% | (0.29)% | 1.40% |
| S&P Target Date 2010 Index | 8.49% | 4.37% | 5.78% |
| John Hancock 2010 Lifetime Index | 8.78% | 4.27% | 5.94% |
Fund Statistics
| Fund net assets | $103,722,439 |
| Total number of portfolio holdings | 85 |
| Total advisory fees paid (net) | $0 |
| Portfolio turnover rate | 27% |
Graphical Representation of Holdings
The table below shows the investment makeup of the fund, representing a percentage of the total net assets of the fund.
Asset Allocation
| Affiliated investment companies | 87.6% |
| Equity | 22.6% |
| International equity | 9.5% |
| Large blend | 7.6% |
| U.S. large cap | 5.5% |
| Fixed income | 60.3% |
| Intermediate bond | 29.4% |
| Short-term bond | 12.4% |
| Emerging-market debt | 5.3% |
| Multi-sector bond | 5.0% |
| Bank loan | 4.3% |
| High yield bond | 3.9% |
| Alternative and specialty | 4.7% |
| Sector equity | 4.2% |
| Absolute return | 0.5% |
| Unaffiliated investment companies | 2.9% |
| Equity | 2.9% |
| U.S. Government | 9.5% |
Holdings may not have been held by the fund for the entire period and are subject to change without notice. Portfolio composition is subject to review in accordance with the fund’s investment strategy and may vary in the future. Current and future portfolio holdings are subject to risk and may change at any time.
What were the fund costs during the last year ?
(Based on a hypothetical $10,000 investment)
| Fund (Class) | Costs of a $10,000 investment | Costs paid as a percentage of a $10,000 investment |
| Multimanager 2010 Lifetime Portfolio (Class R2/JLAEX) |
$53 | 0.51% |
Management’s Discussion of Fund Performance
SUMMARY OF RESULTS
Multimanager 2010 Lifetime Portfolio (Class R2/JLAEX) returned 7.92% for the year ended August 31, 2026. Global equities produced sizable gains in the 12-month period that ended on August 31, 2026. Investors were encouraged by the favorable combination of healthy economic growth trends, robust corporate earnings, and generally supportive central bank policies, together with optimism about artificial intelligence. While technology stocks performed very well, the value style outpaced growth on a global basis and contributed meaningfully to the markets’ strong showing. Emerging market equities also posted outsized returns. Bonds registered more modest gains, led by credit-oriented investments. Income was the primary contributor to total returns for fixed income instruments, as prices came under pressure from concerns about persistent inflation, global conflicts, energy prices, and mounting government debt across the developed world.
TOP PERFORMANCE CONTRIBUTORS
Equity allocation | U.S. equities made a significant contribution to absolute performance, led by large cap equities. International developed market equities further helped results. Defensive equities also generated positive returns. The real assets portfolio was an additional contributor with strong returns for energy stocks and the metals & mining sector.
Bond funds | The fixed-income allocation contributed positively, led by intermediate-term bonds and emerging markets debt. Holdings in short-term bonds, high yield bonds, multi-sector bonds, short-term U.S. Treasury Inflation Protected Securities, and bank loans aided returns as well.
TOP PERFORMANCE DETRACTORS
Specific positions | At a time of positive returns for most segments of the financial markets, the majority of the fund’s holdings recorded a gain. However, small positions in international real estate investment trusts and U.S. Treasury STRIPS (Separate Trading of Registered Interest and Principal of Securities) were adversely affected by rising yields.
The views expressed in this report are those of the portfolio management team and are subject to change. They are not meant as investment advice.
Fund Performance
The following graph compares the initial and subsequent account values at the end of each of the most recently completed 10 fiscal years of the fund (or for the life of the fund, if shorter). It assumes a $10,000 initial investment in the fund and in an appropriate, broad-based securities market index for the same period.
GROWTH OF $10,000
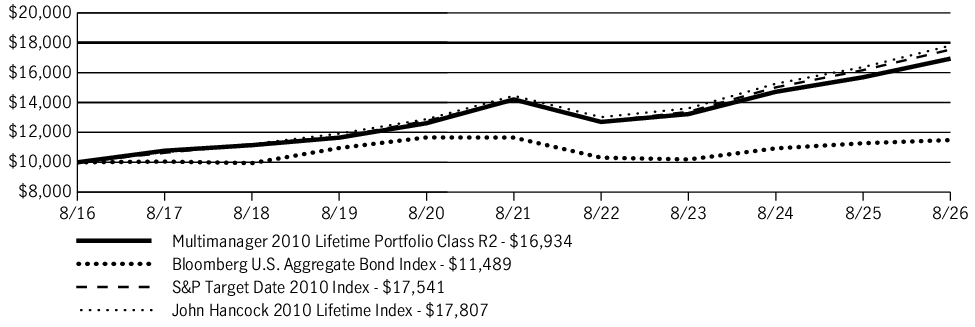
| AVERAGE ANNUAL TOTAL RETURN | 1 Year | 5 Years | 10 Years |
| Multimanager 2010 Lifetime Portfolio (Class R2/JLAEX) | 7.92% | 3.58% | 5.41% |
| Bloomberg U.S. Aggregate Bond Index | 1.89% | (0.29)% | 1.40% |
| S&P Target Date 2010 Index | 8.49% | 4.37% | 5.78% |
| John Hancock 2010 Lifetime Index | 8.78% | 4.27% | 5.94% |
Fund Statistics
| Fund net assets | $103,722,439 |
| Total number of portfolio holdings | 85 |
| Total advisory fees paid (net) | $0 |
| Portfolio turnover rate | 27% |
Graphical Representation of Holdings
The table below shows the investment makeup of the fund, representing a percentage of the total net assets of the fund.
Asset Allocation
| Affiliated investment companies | 87.6% |
| Equity | 22.6% |
| International equity | 9.5% |
| Large blend | 7.6% |
| U.S. large cap | 5.5% |
| Fixed income | 60.3% |
| Intermediate bond | 29.4% |
| Short-term bond | 12.4% |
| Emerging-market debt | 5.3% |
| Multi-sector bond | 5.0% |
| Bank loan | 4.3% |
| High yield bond | 3.9% |
| Alternative and specialty | 4.7% |
| Sector equity | 4.2% |
| Absolute return | 0.5% |
| Unaffiliated investment companies | 2.9% |
| Equity | 2.9% |
| U.S. Government | 9.5% |
Holdings may not have been held by the fund for the entire period and are subject to change without notice. Portfolio composition is subject to review in accordance with the fund’s investment strategy and may vary in the future. Current and future portfolio holdings are subject to risk and may change at any time.
What were the fund costs during the last year ?
(Based on a hypothetical $10,000 investment)
| Fund (Class) | Costs of a $10,000 investment | Costs paid as a percentage of a $10,000 investment |
| Multimanager 2010 Lifetime Portfolio (Class R6/JLAIX) |
$0 | 0.00% |
Management’s Discussion of Fund Performance
SUMMARY OF RESULTS
Multimanager 2010 Lifetime Portfolio (Class R6/JLAIX) returned 8.55% for the year ended August 31, 2026. Global equities produced sizable gains in the 12-month period that ended on August 31, 2026. Investors were encouraged by the favorable combination of healthy economic growth trends, robust corporate earnings, and generally supportive central bank policies, together with optimism about artificial intelligence. While technology stocks performed very well, the value style outpaced growth on a global basis and contributed meaningfully to the markets’ strong showing. Emerging market equities also posted outsized returns. Bonds registered more modest gains, led by credit-oriented investments. Income was the primary contributor to total returns for fixed income instruments, as prices came under pressure from concerns about persistent inflation, global conflicts, energy prices, and mounting government debt across the developed world.
TOP PERFORMANCE CONTRIBUTORS
Equity allocation | U.S. equities made a significant contribution to absolute performance, led by large cap equities. International developed market equities further helped results. Defensive equities also generated positive returns. The real assets portfolio was an additional contributor with strong returns for energy stocks and the metals & mining sector.
Bond funds | The fixed-income allocation contributed positively, led by intermediate-term bonds and emerging markets debt. Holdings in short-term bonds, high yield bonds, multi-sector bonds, short-term U.S. Treasury Inflation Protected Securities, and bank loans aided returns as well.
TOP PERFORMANCE DETRACTORS
Specific positions | At a time of positive returns for most segments of the financial markets, the majority of the fund’s holdings recorded a gain. However, small positions in international real estate investment trusts and U.S. Treasury STRIPS (Separate Trading of Registered Interest and Principal of Securities) were adversely affected by rising yields.
The views expressed in this report are those of the portfolio management team and are subject to change. They are not meant as investment advice.
Fund Performance
The following graph compares the initial and subsequent account values at the end of each of the most recently completed 10 fiscal years of the fund (or for the life of the fund, if shorter). It assumes a $1,000,000 initial investment in the fund and in an appropriate, broad-based securities market index for the same period.
GROWTH OF $1,000,000
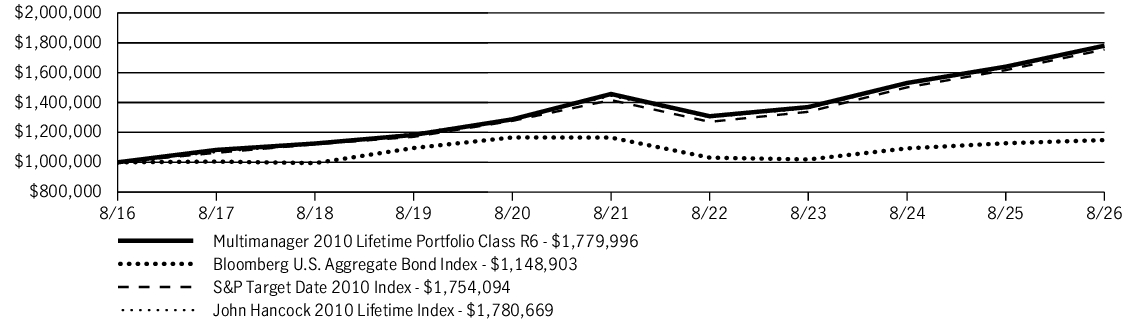
| AVERAGE ANNUAL TOTAL RETURN | 1 Year | 5 Years | 10 Years |
| Multimanager 2010 Lifetime Portfolio (Class R6/JLAIX) | 8.55% | 4.08% | 5.94% |
| Bloomberg U.S. Aggregate Bond Index | 1.89% | (0.29)% | 1.40% |
| S&P Target Date 2010 Index | 8.49% | 4.37% | 5.78% |
| John Hancock 2010 Lifetime Index | 8.78% | 4.27% | 5.94% |
Fund Statistics
| Fund net assets | $103,722,439 |
| Total number of portfolio holdings | 85 |
| Total advisory fees paid (net) | $0 |
| Portfolio turnover rate | 27% |
Graphical Representation of Holdings
The table below shows the investment makeup of the fund, representing a percentage of the total net assets of the fund.
Asset Allocation
| Affiliated investment companies | 87.6% |
| Equity | 22.6% |
| International equity | 9.5% |
| Large blend | 7.6% |
| U.S. large cap | 5.5% |
| Fixed income | 60.3% |
| Intermediate bond | 29.4% |
| Short-term bond | 12.4% |
| Emerging-market debt | 5.3% |
| Multi-sector bond | 5.0% |
| Bank loan | 4.3% |
| High yield bond | 3.9% |
| Alternative and specialty | 4.7% |
| Sector equity | 4.2% |
| Absolute return | 0.5% |
| Unaffiliated investment companies | 2.9% |
| Equity | 2.9% |
| U.S. Government | 9.5% |
Holdings may not have been held by the fund for the entire period and are subject to change without notice. Portfolio composition is subject to review in accordance with the fund’s investment strategy and may vary in the future. Current and future portfolio holdings are subject to risk and may change at any time.
What were the fund costs during the last year ?
(Based on a hypothetical $10,000 investment)
| Fund (Class) | Costs of a $10,000 investment | Costs paid as a percentage of a $10,000 investment |
| Multimanager 2015 Lifetime Portfolio (Class R6/JLBJX) |
$0 | 0.00% |
Management’s Discussion of Fund Performance
SUMMARY OF RESULTS
Multimanager 2015 Lifetime Portfolio (Class R6/JLBJX) returned 9.69% for the year ended August 31, 2026. Global equities produced sizable gains in the 12-month period that ended on August 31, 2026. Investors were encouraged by the favorable combination of healthy economic growth trends, robust corporate earnings, and generally supportive central bank policies, together with optimism about artificial intelligence. While technology stocks performed very well, the value style outpaced growth on a global basis and contributed meaningfully to the markets’ strong showing. Emerging market equities also posted outsized returns. Bonds registered more modest gains, led by credit-oriented investments. Income was the primary contributor to total returns for fixed income instruments, as prices came under pressure from concerns about persistent inflation, global conflicts, energy prices, and mounting government debt across the developed world.
TOP PERFORMANCE CONTRIBUTORS
Equity allocation | U.S. equities made a significant contribution to absolute performance, led by large cap equities. International developed market equities further helped results. Defensive equities also generated positive returns. The real assets portfolio was an additional contributor with strong returns for energy stocks and the metals & mining sector.
Bond funds | The fixed-income allocation contributed positively, led by intermediate-term bonds and emerging markets debt. Holdings in short-term bonds, high yield bonds, multi-sector bonds, short-term U.S. Treasury Inflation Protected Securities, and bank loans aided returns as well.
TOP PERFORMANCE DETRACTORS
Specific positions | At a time of positive returns for most segments of the financial markets, the majority of the fund’s holdings recorded a gain. However, small positions U.S. Treasury STRIPS (Separate Trading of Registered Interest and Principal of Securities) were adversely affected by rising yields.
The views expressed in this report are those of the portfolio management team and are subject to change. They are not meant as investment advice.
Fund Performance
The following graph compares the initial and subsequent account values at the end of each of the most recently completed 10 fiscal years of the fund (or for the life of the fund, if shorter). It assumes a $1,000,000 initial investment in the fund and in an appropriate, broad-based securities market index for the same period.
GROWTH OF $1,000,000
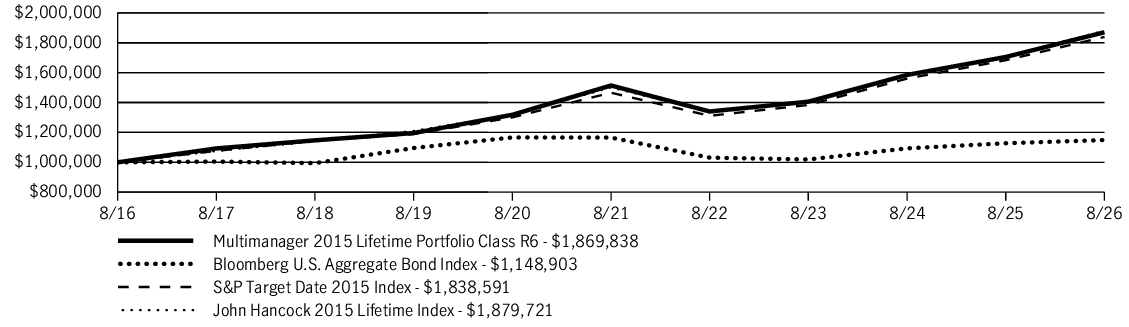
| AVERAGE ANNUAL TOTAL RETURN | 1 Year | 5 Years | 10 Years |
| Multimanager 2015 Lifetime Portfolio (Class R6/JLBJX) | 9.69% | 4.31% | 6.46% |
| Bloomberg U.S. Aggregate Bond Index | 1.89% | (0.29)% | 1.40% |
| S&P Target Date 2015 Index | 9.24% | 4.64% | 6.28% |
| John Hancock 2015 Lifetime Index | 10.13% | 4.60% | 6.51% |
Fund Statistics
| Fund net assets | $156,355,554 |
| Total number of portfolio holdings | 87 |
| Total advisory fees paid (net) | $0 |
| Portfolio turnover rate | 30% |
Graphical Representation of Holdings
The table below shows the investment makeup of the fund, representing a percentage of the total net assets of the fund.
Asset Allocation
| Affiliated investment companies | 89.1% |
| Equity | 29.2% |
| International equity | 11.8% |
| Large blend | 8.8% |
| U.S. large cap | 7.6% |
| U.S. mid cap | 1.0% |
| Fixed income | 55.2% |
| Intermediate bond | 28.1% |
| Short-term bond | 10.2% |
| Emerging-market debt | 5.0% |
| Multi-sector bond | 4.8% |
| High yield bond | 3.6% |
| Bank loan | 3.5% |
| Alternative and specialty | 4.7% |
| Sector equity | 4.2% |
| Absolute return | 0.5% |
| Unaffiliated investment companies | 2.8% |
| Equity | 2.8% |
| U.S. Government | 8.1% |
Holdings may not have been held by the fund for the entire period and are subject to change without notice. Portfolio composition is subject to review in accordance with the fund’s investment strategy and may vary in the future. Current and future portfolio holdings are subject to risk and may change at any time.
What were the fund costs during the last year ?
(Based on a hypothetical $10,000 investment)
| Fund (Class) | Costs of a $10,000 investment | Costs paid as a percentage of a $10,000 investment |
| Multimanager 2015 Lifetime Portfolio (Class R5/JLBHX) |
$6 | 0.06% |
Management’s Discussion of Fund Performance
SUMMARY OF RESULTS
Multimanager 2015 Lifetime Portfolio (Class R5/JLBHX) returned 9.66% for the year ended August 31, 2026. Global equities produced sizable gains in the 12-month period that ended on August 31, 2026. Investors were encouraged by the favorable combination of healthy economic growth trends, robust corporate earnings, and generally supportive central bank policies, together with optimism about artificial intelligence. While technology stocks performed very well, the value style outpaced growth on a global basis and contributed meaningfully to the markets’ strong showing. Emerging market equities also posted outsized returns. Bonds registered more modest gains, led by credit-oriented investments. Income was the primary contributor to total returns for fixed income instruments, as prices came under pressure from concerns about persistent inflation, global conflicts, energy prices, and mounting government debt across the developed world.
TOP PERFORMANCE CONTRIBUTORS
Equity allocation | U.S. equities made a significant contribution to absolute performance, led by large cap equities. International developed market equities further helped results. Defensive equities also generated positive returns. The real assets portfolio was an additional contributor with strong returns for energy stocks and the metals & mining sector.
Bond funds | The fixed-income allocation contributed positively, led by intermediate-term bonds and emerging markets debt. Holdings in short-term bonds, high yield bonds, multi-sector bonds, short-term U.S. Treasury Inflation Protected Securities, and bank loans aided returns as well.
TOP PERFORMANCE DETRACTORS
Specific positions | At a time of positive returns for most segments of the financial markets, the majority of the fund’s holdings recorded a gain. However, small positions U.S. Treasury STRIPS (Separate Trading of Registered Interest and Principal of Securities) were adversely affected by rising yields.
The views expressed in this report are those of the portfolio management team and are subject to change. They are not meant as investment advice.
Fund Performance
The following graph compares the initial and subsequent account values at the end of each of the most recently completed 10 fiscal years of the fund (or for the life of the fund, if shorter). It assumes a $10,000 initial investment in the fund and in an appropriate, broad-based securities market index for the same period.
GROWTH OF $10,000
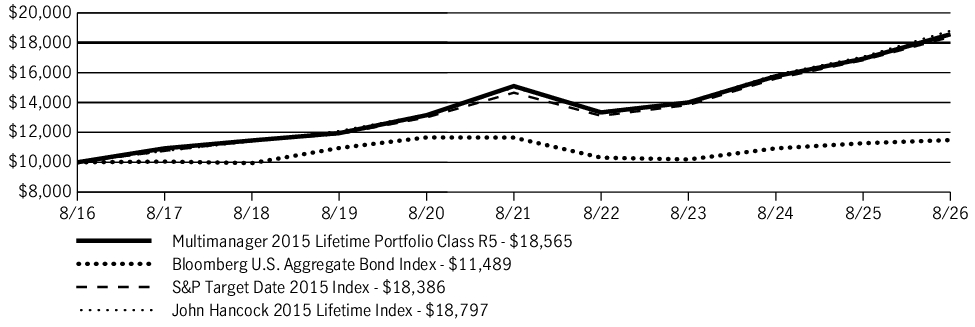
| AVERAGE ANNUAL TOTAL RETURN | 1 Year | 5 Years | 10 Years |
| Multimanager 2015 Lifetime Portfolio (Class R5/JLBHX) | 9.66% | 4.22% | 6.38% |
| Bloomberg U.S. Aggregate Bond Index | 1.89% | (0.29)% | 1.40% |
| S&P Target Date 2015 Index | 9.24% | 4.64% | 6.28% |
| John Hancock 2015 Lifetime Index | 10.13% | 4.60% | 6.51% |
Fund Statistics
| Fund net assets | $156,355,554 |
| Total number of portfolio holdings | 87 |
| Total advisory fees paid (net) | $0 |
| Portfolio turnover rate | 30% |
Graphical Representation of Holdings
The table below shows the investment makeup of the fund, representing a percentage of the total net assets of the fund.
Asset Allocation
| Affiliated investment companies | 89.1% |
| Equity | 29.2% |
| International equity | 11.8% |
| Large blend | 8.8% |
| U.S. large cap | 7.6% |
| U.S. mid cap | 1.0% |
| Fixed income | 55.2% |
| Intermediate bond | 28.1% |
| Short-term bond | 10.2% |
| Emerging-market debt | 5.0% |
| Multi-sector bond | 4.8% |
| High yield bond | 3.6% |
| Bank loan | 3.5% |
| Alternative and specialty | 4.7% |
| Sector equity | 4.2% |
| Absolute return | 0.5% |
| Unaffiliated investment companies | 2.8% |
| Equity | 2.8% |
| U.S. Government | 8.1% |
Holdings may not have been held by the fund for the entire period and are subject to change without notice. Portfolio composition is subject to review in accordance with the fund’s investment strategy and may vary in the future. Current and future portfolio holdings are subject to risk and may change at any time.
What were the fund costs during the last year ?
(Based on a hypothetical $10,000 investment)
| Fund (Class) | Costs of a $10,000 investment | Costs paid as a percentage of a $10,000 investment |
| Multimanager 2015 Lifetime Portfolio (Class R4/JLBGX) |
$17 | 0.16% |
Management’s Discussion of Fund Performance
SUMMARY OF RESULTS
Multimanager 2015 Lifetime Portfolio (Class R4/JLBGX) returned 9.41% for the year ended August 31, 2026. Global equities produced sizable gains in the 12-month period that ended on August 31, 2026. Investors were encouraged by the favorable combination of healthy economic growth trends, robust corporate earnings, and generally supportive central bank policies, together with optimism about artificial intelligence. While technology stocks performed very well, the value style outpaced growth on a global basis and contributed meaningfully to the markets’ strong showing. Emerging market equities also posted outsized returns. Bonds registered more modest gains, led by credit-oriented investments. Income was the primary contributor to total returns for fixed income instruments, as prices came under pressure from concerns about persistent inflation, global conflicts, energy prices, and mounting government debt across the developed world.
TOP PERFORMANCE CONTRIBUTORS
Equity allocation | U.S. equities made a significant contribution to absolute performance, led by large cap equities. International developed market equities further helped results. Defensive equities also generated positive returns. The real assets portfolio was an additional contributor with strong returns for energy stocks and the metals & mining sector.
Bond funds | The fixed-income allocation contributed positively, led by intermediate-term bonds and emerging markets debt. Holdings in short-term bonds, high yield bonds, multi-sector bonds, short-term U.S. Treasury Inflation Protected Securities, and bank loans aided returns as well.
TOP PERFORMANCE DETRACTORS
Specific positions | At a time of positive returns for most segments of the financial markets, the majority of the fund’s holdings recorded a gain. However, small positions U.S. Treasury STRIPS (Separate Trading of Registered Interest and Principal of Securities) were adversely affected by rising yields.
The views expressed in this report are those of the portfolio management team and are subject to change. They are not meant as investment advice.
Fund Performance
The following graph compares the initial and subsequent account values at the end of each of the most recently completed 10 fiscal years of the fund (or for the life of the fund, if shorter). It assumes a $10,000 initial investment in the fund and in an appropriate, broad-based securities market index for the same period.
GROWTH OF $10,000
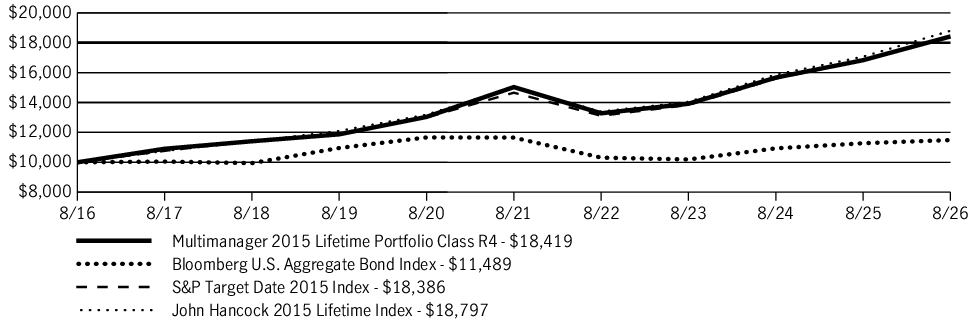
| AVERAGE ANNUAL TOTAL RETURN | 1 Year | 5 Years | 10 Years |
| Multimanager 2015 Lifetime Portfolio (Class R4/JLBGX) | 9.41% | 4.15% | 6.30% |
| Bloomberg U.S. Aggregate Bond Index | 1.89% | (0.29)% | 1.40% |
| S&P Target Date 2015 Index | 9.24% | 4.64% | 6.28% |
| John Hancock 2015 Lifetime Index | 10.13% | 4.60% | 6.51% |
Fund Statistics
| Fund net assets | $156,355,554 |
| Total number of portfolio holdings | 87 |
| Total advisory fees paid (net) | $0 |
| Portfolio turnover rate | 30% |
Graphical Representation of Holdings
The table below shows the investment makeup of the fund, representing a percentage of the total net assets of the fund.
Asset Allocation
| Affiliated investment companies | 89.1% |
| Equity | 29.2% |
| International equity | 11.8% |
| Large blend | 8.8% |
| U.S. large cap | 7.6% |
| U.S. mid cap | 1.0% |
| Fixed income | 55.2% |
| Intermediate bond | 28.1% |
| Short-term bond | 10.2% |
| Emerging-market debt | 5.0% |
| Multi-sector bond | 4.8% |
| High yield bond | 3.6% |
| Bank loan | 3.5% |
| Alternative and specialty | 4.7% |
| Sector equity | 4.2% |
| Absolute return | 0.5% |
| Unaffiliated investment companies | 2.8% |
| Equity | 2.8% |
| U.S. Government | 8.1% |
Holdings may not have been held by the fund for the entire period and are subject to change without notice. Portfolio composition is subject to review in accordance with the fund’s investment strategy and may vary in the future. Current and future portfolio holdings are subject to risk and may change at any time.
What were the fund costs during the last year ?
(Based on a hypothetical $10,000 investment)
| Fund (Class) | Costs of a $10,000 investment | Costs paid as a percentage of a $10,000 investment |
| Multimanager 2015 Lifetime Portfolio (Class R2/JLBKX) |
$52 | 0.50% |
Management’s Discussion of Fund Performance
SUMMARY OF RESULTS
Multimanager 2015 Lifetime Portfolio (Class R2/JLBKX) returned 9.11% for the year ended August 31, 2026. Global equities produced sizable gains in the 12-month period that ended on August 31, 2026. Investors were encouraged by the favorable combination of healthy economic growth trends, robust corporate earnings, and generally supportive central bank policies, together with optimism about artificial intelligence. While technology stocks performed very well, the value style outpaced growth on a global basis and contributed meaningfully to the markets’ strong showing. Emerging market equities also posted outsized returns. Bonds registered more modest gains, led by credit-oriented investments. Income was the primary contributor to total returns for fixed income instruments, as prices came under pressure from concerns about persistent inflation, global conflicts, energy prices, and mounting government debt across the developed world.
TOP PERFORMANCE CONTRIBUTORS
Equity allocation | U.S. equities made a significant contribution to absolute performance, led by large cap equities. International developed market equities further helped results. Defensive equities also generated positive returns. The real assets portfolio was an additional contributor with strong returns for energy stocks and the metals & mining sector.
Bond funds | The fixed-income allocation contributed positively, led by intermediate-term bonds and emerging markets debt. Holdings in short-term bonds, high yield bonds, multi-sector bonds, short-term U.S. Treasury Inflation Protected Securities, and bank loans aided returns as well.
TOP PERFORMANCE DETRACTORS
Specific positions | At a time of positive returns for most segments of the financial markets, the majority of the fund’s holdings recorded a gain. However, small positions U.S. Treasury STRIPS (Separate Trading of Registered Interest and Principal of Securities) were adversely affected by rising yields.
The views expressed in this report are those of the portfolio management team and are subject to change. They are not meant as investment advice.
Fund Performance
The following graph compares the initial and subsequent account values at the end of each of the most recently completed 10 fiscal years of the fund (or for the life of the fund, if shorter). It assumes a $10,000 initial investment in the fund and in an appropriate, broad-based securities market index for the same period.
GROWTH OF $10,000
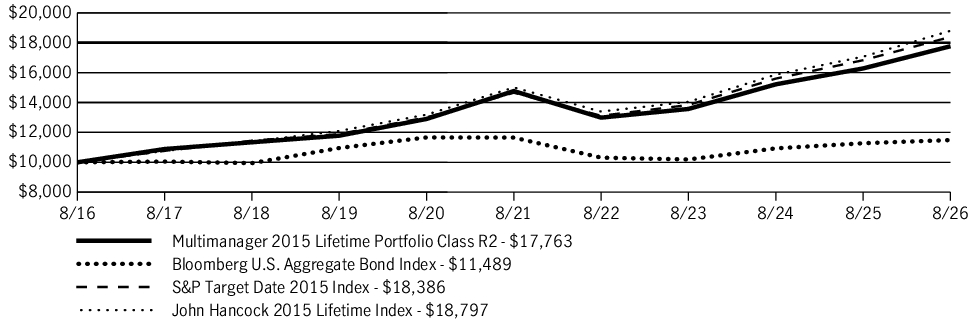
| AVERAGE ANNUAL TOTAL RETURN | 1 Year | 5 Years | 10 Years |
| Multimanager 2015 Lifetime Portfolio (Class R2/JLBKX) | 9.11% | 3.77% | 5.91% |
| Bloomberg U.S. Aggregate Bond Index | 1.89% | (0.29)% | 1.40% |
| S&P Target Date 2015 Index | 9.24% | 4.64% | 6.28% |
| John Hancock 2015 Lifetime Index | 10.13% | 4.60% | 6.51% |
Fund Statistics
| Fund net assets | $156,355,554 |
| Total number of portfolio holdings | 87 |
| Total advisory fees paid (net) | $0 |
| Portfolio turnover rate | 30% |
Graphical Representation of Holdings
The table below shows the investment makeup of the fund, representing a percentage of the total net assets of the fund.
Asset Allocation
| Affiliated investment companies | 89.1% |
| Equity | 29.2% |
| International equity | 11.8% |
| Large blend | 8.8% |
| U.S. large cap | 7.6% |
| U.S. mid cap | 1.0% |
| Fixed income | 55.2% |
| Intermediate bond | 28.1% |
| Short-term bond | 10.2% |
| Emerging-market debt | 5.0% |
| Multi-sector bond | 4.8% |
| High yield bond | 3.6% |
| Bank loan | 3.5% |
| Alternative and specialty | 4.7% |
| Sector equity | 4.2% |
| Absolute return | 0.5% |
| Unaffiliated investment companies | 2.8% |
| Equity | 2.8% |
| U.S. Government | 8.1% |
Holdings may not have been held by the fund for the entire period and are subject to change without notice. Portfolio composition is subject to review in accordance with the fund’s investment strategy and may vary in the future. Current and future portfolio holdings are subject to risk and may change at any time.
What were the fund costs during the last year ?
(Based on a hypothetical $10,000 investment)
| Fund (Class) | Costs of a $10,000 investment | Costs paid as a percentage of a $10,000 investment |
| Multimanager 2015 Lifetime Portfolio (Class I/JHREX) |
$12 | 0.11% |
Management’s Discussion of Fund Performance
SUMMARY OF RESULTS
Multimanager 2015 Lifetime Portfolio (Class I/JHREX) returned 9.46% for the year ended August 31, 2026. Global equities produced sizable gains in the 12-month period that ended on August 31, 2026. Investors were encouraged by the favorable combination of healthy economic growth trends, robust corporate earnings, and generally supportive central bank policies, together with optimism about artificial intelligence. While technology stocks performed very well, the value style outpaced growth on a global basis and contributed meaningfully to the markets’ strong showing. Emerging market equities also posted outsized returns. Bonds registered more modest gains, led by credit-oriented investments. Income was the primary contributor to total returns for fixed income instruments, as prices came under pressure from concerns about persistent inflation, global conflicts, energy prices, and mounting government debt across the developed world.
TOP PERFORMANCE CONTRIBUTORS
Equity allocation | U.S. equities made a significant contribution to absolute performance, led by large cap equities. International developed market equities further helped results. Defensive equities also generated positive returns. The real assets portfolio was an additional contributor with strong returns for energy stocks and the metals & mining sector.
Bond funds | The fixed-income allocation contributed positively, led by intermediate-term bonds and emerging markets debt. Holdings in short-term bonds, high yield bonds, multi-sector bonds, short-term U.S. Treasury Inflation Protected Securities, and bank loans aided returns as well.
TOP PERFORMANCE DETRACTORS
Specific positions | At a time of positive returns for most segments of the financial markets, the majority of the fund’s holdings recorded a gain. However, small positions U.S. Treasury STRIPS (Separate Trading of Registered Interest and Principal of Securities) were adversely affected by rising yields.
The views expressed in this report are those of the portfolio management team and are subject to change. They are not meant as investment advice.
Fund Performance
The following graph compares the initial and subsequent account values at the end of each of the most recently completed 10 fiscal years of the fund (or for the life of the fund, if shorter). It assumes a $250,000 initial investment in the fund and in an appropriate, broad-based securities market index for the same period.
GROWTH OF $250,000
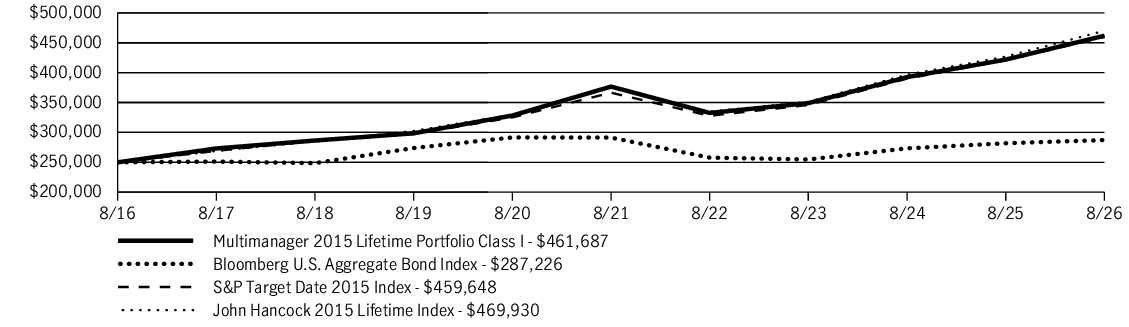
| AVERAGE ANNUAL TOTAL RETURN | 1 Year | 5 Years | 10 Years |
| Multimanager 2015 Lifetime Portfolio (Class I/JHREX) | 9.46% | 4.16% | 6.33% |
| Bloomberg U.S. Aggregate Bond Index | 1.89% | (0.29)% | 1.40% |
| S&P Target Date 2015 Index | 9.24% | 4.64% | 6.28% |
| John Hancock 2015 Lifetime Index | 10.13% | 4.60% | 6.51% |
Fund Statistics
| Fund net assets | $156,355,554 |
| Total number of portfolio holdings | 87 |
| Total advisory fees paid (net) | $0 |
| Portfolio turnover rate | 30% |
Graphical Representation of Holdings
The table below shows the investment makeup of the fund, representing a percentage of the total net assets of the fund.
Asset Allocation
| Affiliated investment companies | 89.1% |
| Equity | 29.2% |
| International equity | 11.8% |
| Large blend | 8.8% |
| U.S. large cap | 7.6% |
| U.S. mid cap | 1.0% |
| Fixed income | 55.2% |
| Intermediate bond | 28.1% |
| Short-term bond | 10.2% |
| Emerging-market debt | 5.0% |
| Multi-sector bond | 4.8% |
| High yield bond | 3.6% |
| Bank loan | 3.5% |
| Alternative and specialty | 4.7% |
| Sector equity | 4.2% |
| Absolute return | 0.5% |
| Unaffiliated investment companies | 2.8% |
| Equity | 2.8% |
| U.S. Government | 8.1% |
Holdings may not have been held by the fund for the entire period and are subject to change without notice. Portfolio composition is subject to review in accordance with the fund’s investment strategy and may vary in the future. Current and future portfolio holdings are subject to risk and may change at any time.
What were the fund costs during the last year ?
(Based on a hypothetical $10,000 investment)
| Fund (Class) | Costs of a $10,000 investment | Costs paid as a percentage of a $10,000 investment |
| Multimanager 2015 Lifetime Portfolio (Class A/JLBAX) |
$43 | 0.41% |
Management’s Discussion of Fund Performance
SUMMARY OF RESULTS
Multimanager 2015 Lifetime Portfolio (Class A/JLBAX) returned 9.26% (excluding sales charges) for the year ended August 31, 2026. Global equities produced sizable gains in the 12-month period that ended on August 31, 2026. Investors were encouraged by the favorable combination of healthy economic growth trends, robust corporate earnings, and generally supportive central bank policies, together with optimism about artificial intelligence. While technology stocks performed very well, the value style outpaced growth on a global basis and contributed meaningfully to the markets’ strong showing. Emerging market equities also posted outsized returns. Bonds registered more modest gains, led by credit-oriented investments. Income was the primary contributor to total returns for fixed income instruments, as prices came under pressure from concerns about persistent inflation, global conflicts, energy prices, and mounting government debt across the developed world.
TOP PERFORMANCE CONTRIBUTORS
Equity allocation | U.S. equities made a significant contribution to absolute performance, led by large cap equities. International developed market equities further helped results. Defensive equities also generated positive returns. The real assets portfolio was an additional contributor with strong returns for energy stocks and the metals & mining sector.
Bond funds | The fixed-income allocation contributed positively, led by intermediate-term bonds and emerging markets debt. Holdings in short-term bonds, high yield bonds, multi-sector bonds, short-term U.S. Treasury Inflation Protected Securities, and bank loans aided returns as well.
TOP PERFORMANCE DETRACTORS
Specific positions | At a time of positive returns for most segments of the financial markets, the majority of the fund’s holdings recorded a gain. However, small positions U.S. Treasury STRIPS (Separate Trading of Registered Interest and Principal of Securities) were adversely affected by rising yields.
The views expressed in this report are those of the portfolio management team and are subject to change. They are not meant as investment advice.
Fund Performance
The following graph compares the initial and subsequent account values at the end of each of the most recently completed 10 fiscal years of the fund (or for the life of the fund, if shorter). It assumes a $10,000 initial investment in the fund and in an appropriate, broad-based securities market index for the same period.
GROWTH OF $10,000
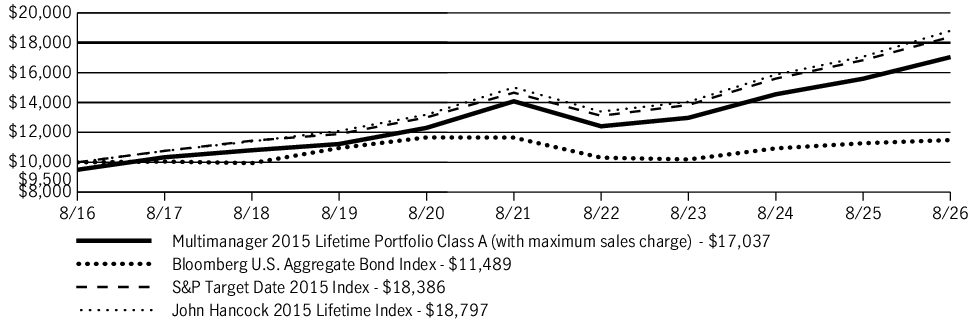
| AVERAGE ANNUAL TOTAL RETURN | 1 Year | 5 Years | 10 Years |
| Multimanager 2015 Lifetime Portfolio (Class A/JLBAX) | 3.77% | 2.83% | 5.47% |
| Multimanager 2015 Lifetime Portfolio (Class A/JLBAX)—excluding sales charge | 9.26% | 3.88% | 6.01% |
| Bloomberg U.S. Aggregate Bond Index | 1.89% | (0.29)% | 1.40% |
| S&P Target Date 2015 Index | 9.24% | 4.64% | 6.28% |
| John Hancock 2015 Lifetime Index | 10.13% | 4.60% | 6.51% |
Fund Statistics
| Fund net assets | $156,355,554 |
| Total number of portfolio holdings | 87 |
| Total advisory fees paid (net) | $0 |
| Portfolio turnover rate | 30% |
Graphical Representation of Holdings
The table below shows the investment makeup of the fund, representing a percentage of the total net assets of the fund.
Asset Allocation
| Affiliated investment companies | 89.1% |
| Equity | 29.2% |
| International equity | 11.8% |
| Large blend | 8.8% |
| U.S. large cap | 7.6% |
| U.S. mid cap | 1.0% |
| Fixed income | 55.2% |
| Intermediate bond | 28.1% |
| Short-term bond | 10.2% |
| Emerging-market debt | 5.0% |
| Multi-sector bond | 4.8% |
| High yield bond | 3.6% |
| Bank loan | 3.5% |
| Alternative and specialty | 4.7% |
| Sector equity | 4.2% |
| Absolute return | 0.5% |
| Unaffiliated investment companies | 2.8% |
| Equity | 2.8% |
| U.S. Government | 8.1% |
Holdings may not have been held by the fund for the entire period and are subject to change without notice. Portfolio composition is subject to review in accordance with the fund’s investment strategy and may vary in the future. Current and future portfolio holdings are subject to risk and may change at any time.
What were the fund costs during the last year ?
(Based on a hypothetical $10,000 investment)
| Fund (Class) | Costs of a $10,000 investment | Costs paid as a percentage of a $10,000 investment |
| Multimanager 2015 Lifetime Portfolio (Class 1/JLBOX) |
$5 | 0.05% |
Management’s Discussion of Fund Performance
SUMMARY OF RESULTS
Multimanager 2015 Lifetime Portfolio (Class 1/JLBOX) returned 9.53% for the year ended August 31, 2026. Global equities produced sizable gains in the 12-month period that ended on August 31, 2026. Investors were encouraged by the favorable combination of healthy economic growth trends, robust corporate earnings, and generally supportive central bank policies, together with optimism about artificial intelligence. While technology stocks performed very well, the value style outpaced growth on a global basis and contributed meaningfully to the markets’ strong showing. Emerging market equities also posted outsized returns. Bonds registered more modest gains, led by credit-oriented investments. Income was the primary contributor to total returns for fixed income instruments, as prices came under pressure from concerns about persistent inflation, global conflicts, energy prices, and mounting government debt across the developed world.
TOP PERFORMANCE CONTRIBUTORS
Equity allocation | U.S. equities made a significant contribution to absolute performance, led by large cap equities. International developed market equities further helped results. Defensive equities also generated positive returns. The real assets portfolio was an additional contributor with strong returns for energy stocks and the metals & mining sector.
Bond funds | The fixed-income allocation contributed positively, led by intermediate-term bonds and emerging markets debt. Holdings in short-term bonds, high yield bonds, multi-sector bonds, short-term U.S. Treasury Inflation Protected Securities, and bank loans aided returns as well.
TOP PERFORMANCE DETRACTORS
Specific positions | At a time of positive returns for most segments of the financial markets, the majority of the fund’s holdings recorded a gain. However, small positions U.S. Treasury STRIPS (Separate Trading of Registered Interest and Principal of Securities) were adversely affected by rising yields.
The views expressed in this report are those of the portfolio management team and are subject to change. They are not meant as investment advice.
Fund Performance
The following graph compares the initial and subsequent account values at the end of each of the most recently completed 10 fiscal years of the fund (or for the life of the fund, if shorter). It assumes a $10,000 initial investment in the fund and in an appropriate, broad-based securities market index for the same period.
GROWTH OF $10,000
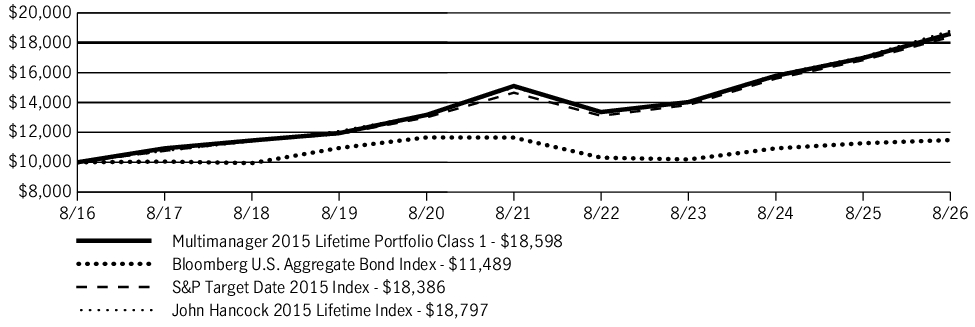
| AVERAGE ANNUAL TOTAL RETURN | 1 Year | 5 Years | 10 Years |
| Multimanager 2015 Lifetime Portfolio (Class 1/JLBOX) | 9.53% | 4.25% | 6.40% |
| Bloomberg U.S. Aggregate Bond Index | 1.89% | (0.29)% | 1.40% |
| S&P Target Date 2015 Index | 9.24% | 4.64% | 6.28% |
| John Hancock 2015 Lifetime Index | 10.13% | 4.60% | 6.51% |
Fund Statistics
| Fund net assets | $156,355,554 |
| Total number of portfolio holdings | 87 |
| Total advisory fees paid (net) | $0 |
| Portfolio turnover rate | 30% |
Graphical Representation of Holdings
The table below shows the investment makeup of the fund, representing a percentage of the total net assets of the fund.
Asset Allocation
| Affiliated investment companies | 89.1% |
| Equity | 29.2% |
| International equity | 11.8% |
| Large blend | 8.8% |
| U.S. large cap | 7.6% |
| U.S. mid cap | 1.0% |
| Fixed income | 55.2% |
| Intermediate bond | 28.1% |
| Short-term bond | 10.2% |
| Emerging-market debt | 5.0% |
| Multi-sector bond | 4.8% |
| High yield bond | 3.6% |
| Bank loan | 3.5% |
| Alternative and specialty | 4.7% |
| Sector equity | 4.2% |
| Absolute return | 0.5% |
| Unaffiliated investment companies | 2.8% |
| Equity | 2.8% |
| U.S. Government | 8.1% |
Holdings may not have been held by the fund for the entire period and are subject to change without notice. Portfolio composition is subject to review in accordance with the fund’s investment strategy and may vary in the future. Current and future portfolio holdings are subject to risk and may change at any time.
What were the fund costs during the last year ?
(Based on a hypothetical $10,000 investment)
| Fund (Class) | Costs of a $10,000 investment | Costs paid as a percentage of a $10,000 investment |
| Multimanager 2020 Lifetime Portfolio (Class 1/JLDOX) |
$5 | 0.05% |
Management’s Discussion of Fund Performance
SUMMARY OF RESULTS
Multimanager 2020 Lifetime Portfolio (Class 1/JLDOX) returned 10.91% for the year ended August 31, 2026. Global equities produced sizable gains in the 12-month period that ended on August 31, 2026. Investors were encouraged by the favorable combination of healthy economic growth trends, robust corporate earnings, and generally supportive central bank policies, together with optimism about artificial intelligence. While technology stocks performed very well, the value style outpaced growth on a global basis and contributed meaningfully to the markets’ strong showing. Emerging market equities also posted outsized returns. Bonds registered more modest gains, led by credit-oriented investments. Income was the primary contributor to total returns for fixed income instruments, as prices came under pressure from concerns about persistent inflation, global conflicts, energy prices, and mounting government debt across the developed world.
TOP PERFORMANCE CONTRIBUTORS
Equity allocation | U.S. equities made a significant contribution to absolute performance, led by large cap equities. International developed market equities further helped results, as did emerging market stocks. Defensive equities also generated positive returns. The real assets portfolio was an additional contributor with strong returns for energy stocks and the metals & mining sector.
Bond funds | The fixed-income allocation contributed positively, led by intermediate-term bonds and emerging markets debt. Holdings in short-term bonds, high yield bonds, multi-sector bonds, short-term U.S. Treasury Inflation Protected Securities, and bank loans aided returns as well.
TOP PERFORMANCE DETRACTORS
Specific positions | At a time of positive returns for most segments of the financial markets, the majority of the fund’s holdings recorded a gain. However, small positions in U.S. Treasury STRIPS (Separate Trading of Registered Interest and Principal of Securities) were adversely affected by rising yields.
The views expressed in this report are those of the portfolio management team and are subject to change. They are not meant as investment advice.
Fund Performance
The following graph compares the initial and subsequent account values at the end of each of the most recently completed 10 fiscal years of the fund (or for the life of the fund, if shorter). It assumes a $10,000 initial investment in the fund and in an appropriate, broad-based securities market index for the same period.
GROWTH OF $10,000
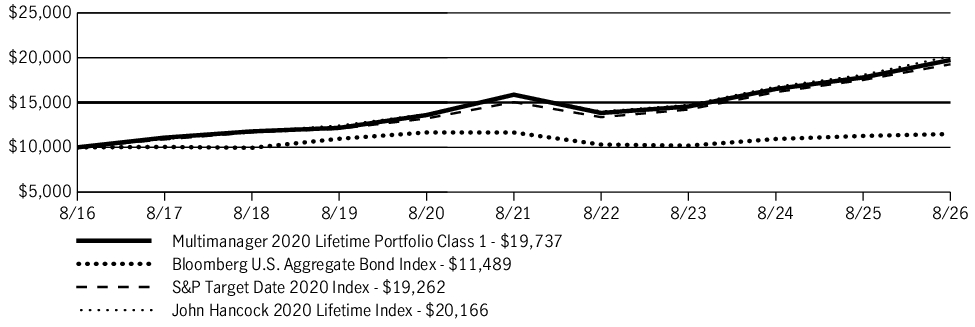
| AVERAGE ANNUAL TOTAL RETURN | 1 Year | 5 Years | 10 Years |
| Multimanager 2020 Lifetime Portfolio (Class 1/JLDOX) | 10.91% | 4.45% | 7.04% |
| Bloomberg U.S. Aggregate Bond Index | 1.89% | (0.29)% | 1.40% |
| S&P Target Date 2020 Index | 9.98% | 5.06% | 6.78% |
| John Hancock 2020 Lifetime Index | 11.51% | 4.94% | 7.26% |
Fund Statistics
| Fund net assets | $334,617,817 |
| Total number of portfolio holdings | 91 |
| Total advisory fees paid (net) | $0 |
| Portfolio turnover rate | 21% |
Graphical Representation of Holdings
The table below shows the investment makeup of the fund, representing a percentage of the total net assets of the fund.
Asset Allocation
| Affiliated investment companies | 90.0% |
| Equity | 35.3% |
| International equity | 13.9% |
| Large blend | 10.8% |
| U.S. large cap | 8.0% |
| U.S. mid cap | 1.8% |
| U.S. small cap | 0.4% |
| Emerging-market equity | 0.4% |
| Fixed income | 50.0% |
| Intermediate bond | 26.0% |
| Short-term bond | 8.5% |
| Emerging-market debt | 4.7% |
| Multi-sector bond | 4.5% |
| High yield bond | 3.5% |
| Bank loan | 2.8% |
| Alternative and specialty | 4.7% |
| Sector equity | 4.2% |
| Absolute return | 0.5% |
| Unaffiliated investment companies | 3.3% |
| Equity | 3.3% |
| U.S. Government | 6.7% |
Holdings may not have been held by the fund for the entire period and are subject to change without notice. Portfolio composition is subject to review in accordance with the fund’s investment strategy and may vary in the future. Current and future portfolio holdings are subject to risk and may change at any time.
What were the fund costs during the last year ?
(Based on a hypothetical $10,000 investment)
| Fund (Class) | Costs of a $10,000 investment | Costs paid as a percentage of a $10,000 investment |
| Multimanager 2020 Lifetime Portfolio (Class A/JLDAX) |
$43 | 0.41% |
Management’s Discussion of Fund Performance
SUMMARY OF RESULTS
Multimanager 2020 Lifetime Portfolio (Class A/JLDAX) returned 10.50% (excluding sales charges) for the year ended August 31, 2026. Global equities produced sizable gains in the 12-month period that ended on August 31, 2026. Investors were encouraged by the favorable combination of healthy economic growth trends, robust corporate earnings, and generally supportive central bank policies, together with optimism about artificial intelligence. While technology stocks performed very well, the value style outpaced growth on a global basis and contributed meaningfully to the markets’ strong showing. Emerging market equities also posted outsized returns. Bonds registered more modest gains, led by credit-oriented investments. Income was the primary contributor to total returns for fixed income instruments, as prices came under pressure from concerns about persistent inflation, global conflicts, energy prices, and mounting government debt across the developed world.
TOP PERFORMANCE CONTRIBUTORS
Equity allocation | U.S. equities made a significant contribution to absolute performance, led by large cap equities. International developed market equities further helped results, as did emerging market stocks. Defensive equities also generated positive returns. The real assets portfolio was an additional contributor with strong returns for energy stocks and the metals & mining sector.
Bond funds | The fixed-income allocation contributed positively, led by intermediate-term bonds and emerging markets debt. Holdings in short-term bonds, high yield bonds, multi-sector bonds, short-term U.S. Treasury Inflation Protected Securities, and bank loans aided returns as well.
TOP PERFORMANCE DETRACTORS
Specific positions | At a time of positive returns for most segments of the financial markets, the majority of the fund’s holdings recorded a gain. However, small positions in U.S. Treasury STRIPS (Separate Trading of Registered Interest and Principal of Securities) were adversely affected by rising yields.
The views expressed in this report are those of the portfolio management team and are subject to change. They are not meant as investment advice.
Fund Performance
The following graph compares the initial and subsequent account values at the end of each of the most recently completed 10 fiscal years of the fund (or for the life of the fund, if shorter). It assumes a $10,000 initial investment in the fund and in an appropriate, broad-based securities market index for the same period.
GROWTH OF $10,000
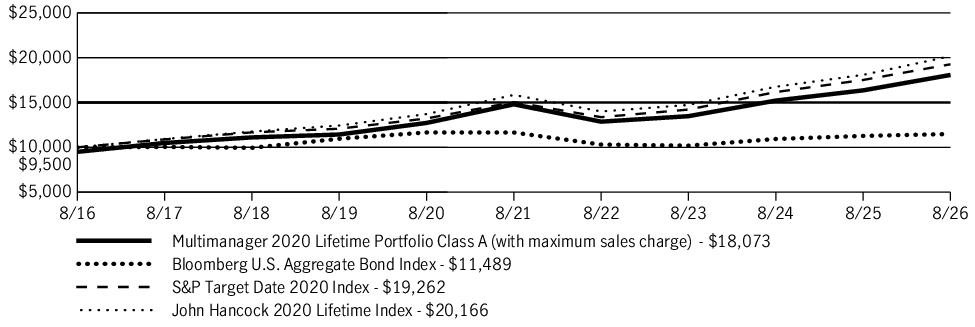
| AVERAGE ANNUAL TOTAL RETURN | 1 Year | 5 Years | 10 Years |
| Multimanager 2020 Lifetime Portfolio (Class A/JLDAX) | 4.94% | 3.02% | 6.10% |
| Multimanager 2020 Lifetime Portfolio (Class A/JLDAX)—excluding sales charge | 10.50% | 4.08% | 6.64% |
| Bloomberg U.S. Aggregate Bond Index | 1.89% | (0.29)% | 1.40% |
| S&P Target Date 2020 Index | 9.98% | 5.06% | 6.78% |
| John Hancock 2020 Lifetime Index | 11.51% | 4.94% | 7.26% |
Fund Statistics
| Fund net assets | $334,617,817 |
| Total number of portfolio holdings | 91 |
| Total advisory fees paid (net) | $0 |
| Portfolio turnover rate | 21% |
Graphical Representation of Holdings
The table below shows the investment makeup of the fund, representing a percentage of the total net assets of the fund.
Asset Allocation
| Affiliated investment companies | 90.0% |
| Equity | 35.3% |
| International equity | 13.9% |
| Large blend | 10.8% |
| U.S. large cap | 8.0% |
| U.S. mid cap | 1.8% |
| U.S. small cap | 0.4% |
| Emerging-market equity | 0.4% |
| Fixed income | 50.0% |
| Intermediate bond | 26.0% |
| Short-term bond | 8.5% |
| Emerging-market debt | 4.7% |
| Multi-sector bond | 4.5% |
| High yield bond | 3.5% |
| Bank loan | 2.8% |
| Alternative and specialty | 4.7% |
| Sector equity | 4.2% |
| Absolute return | 0.5% |
| Unaffiliated investment companies | 3.3% |
| Equity | 3.3% |
| U.S. Government | 6.7% |
Holdings may not have been held by the fund for the entire period and are subject to change without notice. Portfolio composition is subject to review in accordance with the fund’s investment strategy and may vary in the future. Current and future portfolio holdings are subject to risk and may change at any time.
What were the fund costs during the last year ?
(Based on a hypothetical $10,000 investment)
| Fund (Class) | Costs of a $10,000 investment | Costs paid as a percentage of a $10,000 investment |
| Multimanager 2020 Lifetime Portfolio (Class I/JHRVX) |
$12 | 0.11% |
Management’s Discussion of Fund Performance
SUMMARY OF RESULTS
Multimanager 2020 Lifetime Portfolio (Class I/JHRVX) returned 10.80% for the year ended August 31, 2026. Global equities produced sizable gains in the 12-month period that ended on August 31, 2026. Investors were encouraged by the favorable combination of healthy economic growth trends, robust corporate earnings, and generally supportive central bank policies, together with optimism about artificial intelligence. While technology stocks performed very well, the value style outpaced growth on a global basis and contributed meaningfully to the markets’ strong showing. Emerging market equities also posted outsized returns. Bonds registered more modest gains, led by credit-oriented investments. Income was the primary contributor to total returns for fixed income instruments, as prices came under pressure from concerns about persistent inflation, global conflicts, energy prices, and mounting government debt across the developed world.
TOP PERFORMANCE CONTRIBUTORS
Equity allocation | U.S. equities made a significant contribution to absolute performance, led by large cap equities. International developed market equities further helped results, as did emerging market stocks. Defensive equities also generated positive returns. The real assets portfolio was an additional contributor with strong returns for energy stocks and the metals & mining sector.
Bond funds | The fixed-income allocation contributed positively, led by intermediate-term bonds and emerging markets debt. Holdings in short-term bonds, high yield bonds, multi-sector bonds, short-term U.S. Treasury Inflation Protected Securities, and bank loans aided returns as well.
TOP PERFORMANCE DETRACTORS
Specific positions | At a time of positive returns for most segments of the financial markets, the majority of the fund’s holdings recorded a gain. However, small positions in U.S. Treasury STRIPS (Separate Trading of Registered Interest and Principal of Securities) were adversely affected by rising yields.
The views expressed in this report are those of the portfolio management team and are subject to change. They are not meant as investment advice.
Fund Performance
The following graph compares the initial and subsequent account values at the end of each of the most recently completed 10 fiscal years of the fund (or for the life of the fund, if shorter). It assumes a $250,000 initial investment in the fund and in an appropriate, broad-based securities market index for the same period.
GROWTH OF $250,000
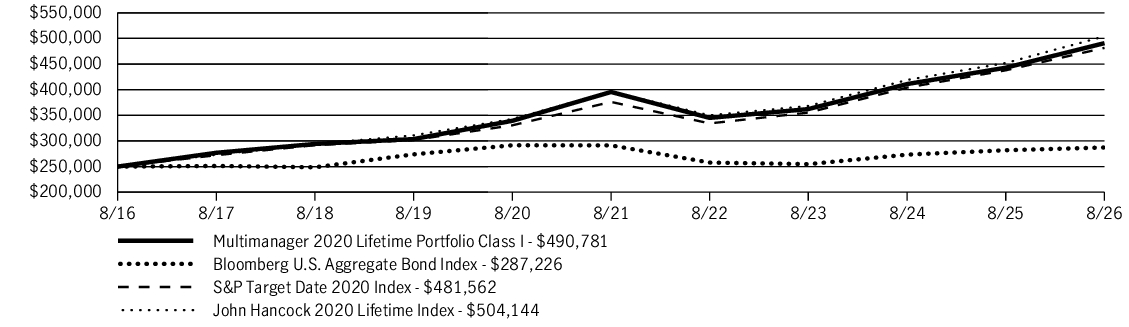
| AVERAGE ANNUAL TOTAL RETURN | 1 Year | 5 Years | 10 Years |
| Multimanager 2020 Lifetime Portfolio (Class I/JHRVX) | 10.80% | 4.41% | 6.98% |
| Bloomberg U.S. Aggregate Bond Index | 1.89% | (0.29)% | 1.40% |
| S&P Target Date 2020 Index | 9.98% | 5.06% | 6.78% |
| John Hancock 2020 Lifetime Index | 11.51% | 4.94% | 7.26% |
Fund Statistics
| Fund net assets | $334,617,817 |
| Total number of portfolio holdings | 91 |
| Total advisory fees paid (net) | $0 |
| Portfolio turnover rate | 21% |
Graphical Representation of Holdings
The table below shows the investment makeup of the fund, representing a percentage of the total net assets of the fund.
Asset Allocation
| Affiliated investment companies | 90.0% |
| Equity | 35.3% |
| International equity | 13.9% |
| Large blend | 10.8% |
| U.S. large cap | 8.0% |
| U.S. mid cap | 1.8% |
| U.S. small cap | 0.4% |
| Emerging-market equity | 0.4% |
| Fixed income | 50.0% |
| Intermediate bond | 26.0% |
| Short-term bond | 8.5% |
| Emerging-market debt | 4.7% |
| Multi-sector bond | 4.5% |
| High yield bond | 3.5% |
| Bank loan | 2.8% |
| Alternative and specialty | 4.7% |
| Sector equity | 4.2% |
| Absolute return | 0.5% |
| Unaffiliated investment companies | 3.3% |
| Equity | 3.3% |
| U.S. Government | 6.7% |
Holdings may not have been held by the fund for the entire period and are subject to change without notice. Portfolio composition is subject to review in accordance with the fund’s investment strategy and may vary in the future. Current and future portfolio holdings are subject to risk and may change at any time.
What were the fund costs during the last year ?
(Based on a hypothetical $10,000 investment)
| Fund (Class) | Costs of a $10,000 investment | Costs paid as a percentage of a $10,000 investment |
| Multimanager 2020 Lifetime Portfolio (Class R2/JLDEX) |
$52 | 0.49% |
Management’s Discussion of Fund Performance
SUMMARY OF RESULTS
Multimanager 2020 Lifetime Portfolio (Class R2/JLDEX) returned 10.36% for the year ended August 31, 2026. Global equities produced sizable gains in the 12-month period that ended on August 31, 2026. Investors were encouraged by the favorable combination of healthy economic growth trends, robust corporate earnings, and generally supportive central bank policies, together with optimism about artificial intelligence. While technology stocks performed very well, the value style outpaced growth on a global basis and contributed meaningfully to the markets’ strong showing. Emerging market equities also posted outsized returns. Bonds registered more modest gains, led by credit-oriented investments. Income was the primary contributor to total returns for fixed income instruments, as prices came under pressure from concerns about persistent inflation, global conflicts, energy prices, and mounting government debt across the developed world.
TOP PERFORMANCE CONTRIBUTORS
Equity allocation | U.S. equities made a significant contribution to absolute performance, led by large cap equities. International developed market equities further helped results, as did emerging market stocks. Defensive equities also generated positive returns. The real assets portfolio was an additional contributor with strong returns for energy stocks and the metals & mining sector.
Bond funds | The fixed-income allocation contributed positively, led by intermediate-term bonds and emerging markets debt. Holdings in short-term bonds, high yield bonds, multi-sector bonds, short-term U.S. Treasury Inflation Protected Securities, and bank loans aided returns as well.
TOP PERFORMANCE DETRACTORS
Specific positions | At a time of positive returns for most segments of the financial markets, the majority of the fund’s holdings recorded a gain. However, small positions in U.S. Treasury STRIPS (Separate Trading of Registered Interest and Principal of Securities) were adversely affected by rising yields.
The views expressed in this report are those of the portfolio management team and are subject to change. They are not meant as investment advice.
Fund Performance
The following graph compares the initial and subsequent account values at the end of each of the most recently completed 10 fiscal years of the fund (or for the life of the fund, if shorter). It assumes a $10,000 initial investment in the fund and in an appropriate, broad-based securities market index for the same period.
GROWTH OF $10,000
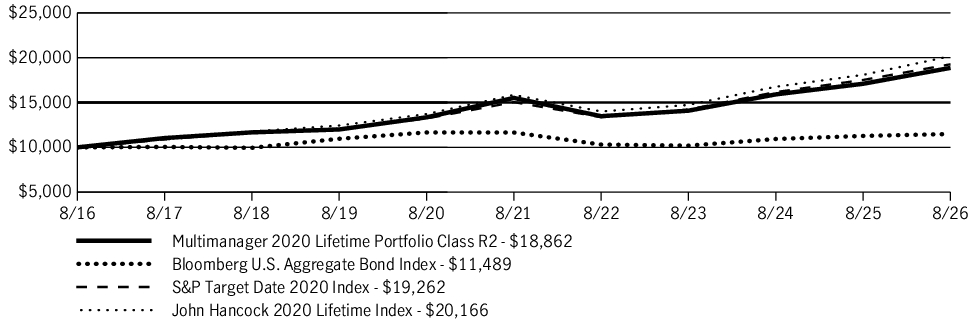
| AVERAGE ANNUAL TOTAL RETURN | 1 Year | 5 Years | 10 Years |
| Multimanager 2020 Lifetime Portfolio (Class R2/JLDEX) | 10.36% | 3.99% | 6.55% |
| Bloomberg U.S. Aggregate Bond Index | 1.89% | (0.29)% | 1.40% |
| S&P Target Date 2020 Index | 9.98% | 5.06% | 6.78% |
| John Hancock 2020 Lifetime Index | 11.51% | 4.94% | 7.26% |
Fund Statistics
| Fund net assets | $334,617,817 |
| Total number of portfolio holdings | 91 |
| Total advisory fees paid (net) | $0 |
| Portfolio turnover rate | 21% |
Graphical Representation of Holdings
The table below shows the investment makeup of the fund, representing a percentage of the total net assets of the fund.
Asset Allocation
| Affiliated investment companies | 90.0% |
| Equity | 35.3% |
| International equity | 13.9% |
| Large blend | 10.8% |
| U.S. large cap | 8.0% |
| U.S. mid cap | 1.8% |
| U.S. small cap | 0.4% |
| Emerging-market equity | 0.4% |
| Fixed income | 50.0% |
| Intermediate bond | 26.0% |
| Short-term bond | 8.5% |
| Emerging-market debt | 4.7% |
| Multi-sector bond | 4.5% |
| High yield bond | 3.5% |
| Bank loan | 2.8% |
| Alternative and specialty | 4.7% |
| Sector equity | 4.2% |
| Absolute return | 0.5% |
| Unaffiliated investment companies | 3.3% |
| Equity | 3.3% |
| U.S. Government | 6.7% |
Holdings may not have been held by the fund for the entire period and are subject to change without notice. Portfolio composition is subject to review in accordance with the fund’s investment strategy and may vary in the future. Current and future portfolio holdings are subject to risk and may change at any time.
What were the fund costs during the last year ?
(Based on a hypothetical $10,000 investment)
| Fund (Class) | Costs of a $10,000 investment | Costs paid as a percentage of a $10,000 investment |
| Multimanager 2020 Lifetime Portfolio (Class R4/JLDGX) |
$27 | 0.26% |
Management’s Discussion of Fund Performance
SUMMARY OF RESULTS
Multimanager 2020 Lifetime Portfolio (Class R4/JLDGX) returned 10.63% for the year ended August 31, 2026. Global equities produced sizable gains in the 12-month period that ended on August 31, 2026. Investors were encouraged by the favorable combination of healthy economic growth trends, robust corporate earnings, and generally supportive central bank policies, together with optimism about artificial intelligence. While technology stocks performed very well, the value style outpaced growth on a global basis and contributed meaningfully to the markets’ strong showing. Emerging market equities also posted outsized returns. Bonds registered more modest gains, led by credit-oriented investments. Income was the primary contributor to total returns for fixed income instruments, as prices came under pressure from concerns about persistent inflation, global conflicts, energy prices, and mounting government debt across the developed world.
TOP PERFORMANCE CONTRIBUTORS
Equity allocation | U.S. equities made a significant contribution to absolute performance, led by large cap equities. International developed market equities further helped results, as did emerging market stocks. Defensive equities also generated positive returns. The real assets portfolio was an additional contributor with strong returns for energy stocks and the metals & mining sector.
Bond funds | The fixed-income allocation contributed positively, led by intermediate-term bonds and emerging markets debt. Holdings in short-term bonds, high yield bonds, multi-sector bonds, short-term U.S. Treasury Inflation Protected Securities, and bank loans aided returns as well.
TOP PERFORMANCE DETRACTORS
Specific positions | At a time of positive returns for most segments of the financial markets, the majority of the fund’s holdings recorded a gain. However, small positions in U.S. Treasury STRIPS (Separate Trading of Registered Interest and Principal of Securities) were adversely affected by rising yields.
The views expressed in this report are those of the portfolio management team and are subject to change. They are not meant as investment advice.
Fund Performance
The following graph compares the initial and subsequent account values at the end of each of the most recently completed 10 fiscal years of the fund (or for the life of the fund, if shorter). It assumes a $10,000 initial investment in the fund and in an appropriate, broad-based securities market index for the same period.
GROWTH OF $10,000
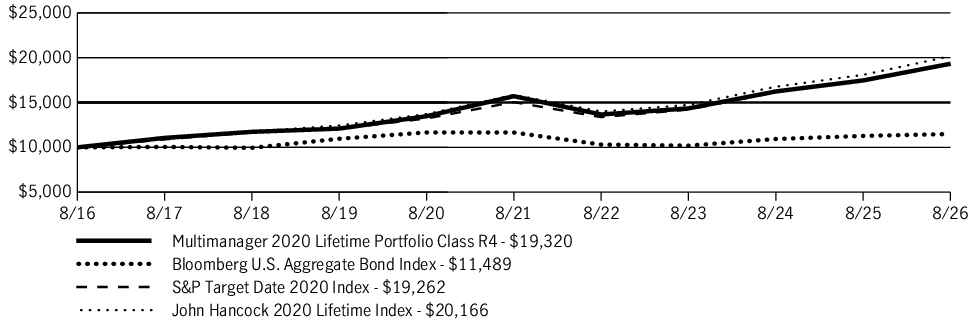
| AVERAGE ANNUAL TOTAL RETURN | 1 Year | 5 Years | 10 Years |
| Multimanager 2020 Lifetime Portfolio (Class R4/JLDGX) | 10.63% | 4.23% | 6.81% |
| Bloomberg U.S. Aggregate Bond Index | 1.89% | (0.29)% | 1.40% |
| S&P Target Date 2020 Index | 9.98% | 5.06% | 6.78% |
| John Hancock 2020 Lifetime Index | 11.51% | 4.94% | 7.26% |
Fund Statistics
| Fund net assets | $334,617,817 |
| Total number of portfolio holdings | 91 |
| Total advisory fees paid (net) | $0 |
| Portfolio turnover rate | 21% |
Graphical Representation of Holdings
The table below shows the investment makeup of the fund, representing a percentage of the total net assets of the fund.
Asset Allocation
| Affiliated investment companies | 90.0% |
| Equity | 35.3% |
| International equity | 13.9% |
| Large blend | 10.8% |
| U.S. large cap | 8.0% |
| U.S. mid cap | 1.8% |
| U.S. small cap | 0.4% |
| Emerging-market equity | 0.4% |
| Fixed income | 50.0% |
| Intermediate bond | 26.0% |
| Short-term bond | 8.5% |
| Emerging-market debt | 4.7% |
| Multi-sector bond | 4.5% |
| High yield bond | 3.5% |
| Bank loan | 2.8% |
| Alternative and specialty | 4.7% |
| Sector equity | 4.2% |
| Absolute return | 0.5% |
| Unaffiliated investment companies | 3.3% |
| Equity | 3.3% |
| U.S. Government | 6.7% |
Holdings may not have been held by the fund for the entire period and are subject to change without notice. Portfolio composition is subject to review in accordance with the fund’s investment strategy and may vary in the future. Current and future portfolio holdings are subject to risk and may change at any time.
What were the fund costs during the last year ?
(Based on a hypothetical $10,000 investment)
| Fund (Class) | Costs of a $10,000 investment | Costs paid as a percentage of a $10,000 investment |
| Multimanager 2020 Lifetime Portfolio (Class R5/JLDHX) |
$5 | 0.05% |
Management’s Discussion of Fund Performance
SUMMARY OF RESULTS
Multimanager 2020 Lifetime Portfolio (Class R5/JLDHX) returned 10.78% for the year ended August 31, 2026. Global equities produced sizable gains in the 12-month period that ended on August 31, 2026. Investors were encouraged by the favorable combination of healthy economic growth trends, robust corporate earnings, and generally supportive central bank policies, together with optimism about artificial intelligence. While technology stocks performed very well, the value style outpaced growth on a global basis and contributed meaningfully to the markets’ strong showing. Emerging market equities also posted outsized returns. Bonds registered more modest gains, led by credit-oriented investments. Income was the primary contributor to total returns for fixed income instruments, as prices came under pressure from concerns about persistent inflation, global conflicts, energy prices, and mounting government debt across the developed world.
TOP PERFORMANCE CONTRIBUTORS
Equity allocation | U.S. equities made a significant contribution to absolute performance, led by large cap equities. International developed market equities further helped results, as did emerging market stocks. Defensive equities also generated positive returns. The real assets portfolio was an additional contributor with strong returns for energy stocks and the metals & mining sector.
Bond funds | The fixed-income allocation contributed positively, led by intermediate-term bonds and emerging markets debt. Holdings in short-term bonds, high yield bonds, multi-sector bonds, short-term U.S. Treasury Inflation Protected Securities, and bank loans aided returns as well.
TOP PERFORMANCE DETRACTORS
Specific positions | At a time of positive returns for most segments of the financial markets, the majority of the fund’s holdings recorded a gain. However, small positions in U.S. Treasury STRIPS (Separate Trading of Registered Interest and Principal of Securities) were adversely affected by rising yields.
The views expressed in this report are those of the portfolio management team and are subject to change. They are not meant as investment advice.
Fund Performance
The following graph compares the initial and subsequent account values at the end of each of the most recently completed 10 fiscal years of the fund (or for the life of the fund, if shorter). It assumes a $10,000 initial investment in the fund and in an appropriate, broad-based securities market index for the same period.
GROWTH OF $10,000
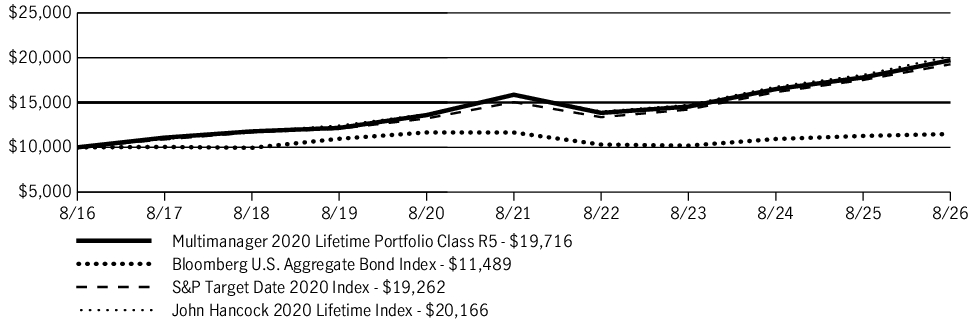
| AVERAGE ANNUAL TOTAL RETURN | 1 Year | 5 Years | 10 Years |
| Multimanager 2020 Lifetime Portfolio (Class R5/JLDHX) | 10.78% | 4.44% | 7.02% |
| Bloomberg U.S. Aggregate Bond Index | 1.89% | (0.29)% | 1.40% |
| S&P Target Date 2020 Index | 9.98% | 5.06% | 6.78% |
| John Hancock 2020 Lifetime Index | 11.51% | 4.94% | 7.26% |
Fund Statistics
| Fund net assets | $334,617,817 |
| Total number of portfolio holdings | 91 |
| Total advisory fees paid (net) | $0 |
| Portfolio turnover rate | 21% |
Graphical Representation of Holdings
The table below shows the investment makeup of the fund, representing a percentage of the total net assets of the fund.
Asset Allocation
| Affiliated investment companies | 90.0% |
| Equity | 35.3% |
| International equity | 13.9% |
| Large blend | 10.8% |
| U.S. large cap | 8.0% |
| U.S. mid cap | 1.8% |
| U.S. small cap | 0.4% |
| Emerging-market equity | 0.4% |
| Fixed income | 50.0% |
| Intermediate bond | 26.0% |
| Short-term bond | 8.5% |
| Emerging-market debt | 4.7% |
| Multi-sector bond | 4.5% |
| High yield bond | 3.5% |
| Bank loan | 2.8% |
| Alternative and specialty | 4.7% |
| Sector equity | 4.2% |
| Absolute return | 0.5% |
| Unaffiliated investment companies | 3.3% |
| Equity | 3.3% |
| U.S. Government | 6.7% |
Holdings may not have been held by the fund for the entire period and are subject to change without notice. Portfolio composition is subject to review in accordance with the fund’s investment strategy and may vary in the future. Current and future portfolio holdings are subject to risk and may change at any time.
What were the fund costs during the last year ?
(Based on a hypothetical $10,000 investment)
| Fund (Class) | Costs of a $10,000 investment | Costs paid as a percentage of a $10,000 investment |
| Multimanager 2020 Lifetime Portfolio (Class R6/JLDIX) |
$0 | 0.00% |
Management’s Discussion of Fund Performance
SUMMARY OF RESULTS
Multimanager 2020 Lifetime Portfolio (Class R6/JLDIX) returned 10.87% for the year ended August 31, 2026. Global equities produced sizable gains in the 12-month period that ended on August 31, 2026. Investors were encouraged by the favorable combination of healthy economic growth trends, robust corporate earnings, and generally supportive central bank policies, together with optimism about artificial intelligence. While technology stocks performed very well, the value style outpaced growth on a global basis and contributed meaningfully to the markets’ strong showing. Emerging market equities also posted outsized returns. Bonds registered more modest gains, led by credit-oriented investments. Income was the primary contributor to total returns for fixed income instruments, as prices came under pressure from concerns about persistent inflation, global conflicts, energy prices, and mounting government debt across the developed world.
TOP PERFORMANCE CONTRIBUTORS
Equity allocation | U.S. equities made a significant contribution to absolute performance, led by large cap equities. International developed market equities further helped results, as did emerging market stocks. Defensive equities also generated positive returns. The real assets portfolio was an additional contributor with strong returns for energy stocks and the metals & mining sector.
Bond funds | The fixed-income allocation contributed positively, led by intermediate-term bonds and emerging markets debt. Holdings in short-term bonds, high yield bonds, multi-sector bonds, short-term U.S. Treasury Inflation Protected Securities, and bank loans aided returns as well.
TOP PERFORMANCE DETRACTORS
Specific positions | At a time of positive returns for most segments of the financial markets, the majority of the fund’s holdings recorded a gain. However, small positions in U.S. Treasury STRIPS (Separate Trading of Registered Interest and Principal of Securities) were adversely affected by rising yields.
The views expressed in this report are those of the portfolio management team and are subject to change. They are not meant as investment advice.
Fund Performance
The following graph compares the initial and subsequent account values at the end of each of the most recently completed 10 fiscal years of the fund (or for the life of the fund, if shorter). It assumes a $1,000,000 initial investment in the fund and in an appropriate, broad-based securities market index for the same period.
GROWTH OF $1,000,000
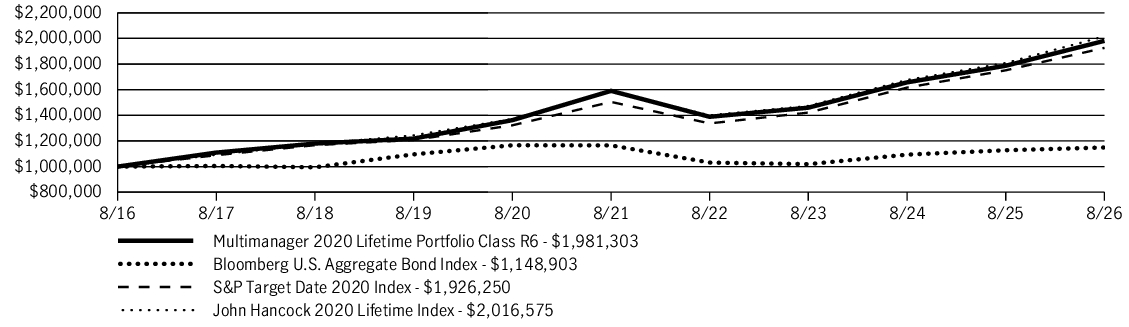
| AVERAGE ANNUAL TOTAL RETURN | 1 Year | 5 Years | 10 Years |
| Multimanager 2020 Lifetime Portfolio (Class R6/JLDIX) | 10.87% | 4.49% | 7.08% |
| Bloomberg U.S. Aggregate Bond Index | 1.89% | (0.29)% | 1.40% |
| S&P Target Date 2020 Index | 9.98% | 5.06% | 6.78% |
| John Hancock 2020 Lifetime Index | 11.51% | 4.94% | 7.26% |
Fund Statistics
| Fund net assets | $334,617,817 |
| Total number of portfolio holdings | 91 |
| Total advisory fees paid (net) | $0 |
| Portfolio turnover rate | 21% |
Graphical Representation of Holdings
The table below shows the investment makeup of the fund, representing a percentage of the total net assets of the fund.
Asset Allocation
| Affiliated investment companies | 90.0% |
| Equity | 35.3% |
| International equity | 13.9% |
| Large blend | 10.8% |
| U.S. large cap | 8.0% |
| U.S. mid cap | 1.8% |
| U.S. small cap | 0.4% |
| Emerging-market equity | 0.4% |
| Fixed income | 50.0% |
| Intermediate bond | 26.0% |
| Short-term bond | 8.5% |
| Emerging-market debt | 4.7% |
| Multi-sector bond | 4.5% |
| High yield bond | 3.5% |
| Bank loan | 2.8% |
| Alternative and specialty | 4.7% |
| Sector equity | 4.2% |
| Absolute return | 0.5% |
| Unaffiliated investment companies | 3.3% |
| Equity | 3.3% |
| U.S. Government | 6.7% |
Holdings may not have been held by the fund for the entire period and are subject to change without notice. Portfolio composition is subject to review in accordance with the fund’s investment strategy and may vary in the future. Current and future portfolio holdings are subject to risk and may change at any time.
What were the fund costs during the last year ?
(Based on a hypothetical $10,000 investment)
| Fund (Class) | Costs of a $10,000 investment | Costs paid as a percentage of a $10,000 investment |
| Multimanager 2025 Lifetime Portfolio (Class R6/JLEIX) |
$0 | 0.00% |
Management’s Discussion of Fund Performance
SUMMARY OF RESULTS
Multimanager 2025 Lifetime Portfolio (Class R6/JLEIX) returned 12.20% for the year ended August 31, 2026. Global equities produced sizable gains in the 12-month period that ended on August 31, 2026. Investors were encouraged by the favorable combination of healthy economic growth trends, robust corporate earnings, and generally supportive central bank policies, together with optimism about artificial intelligence. While technology stocks performed very well, the value style outpaced growth on a global basis and contributed meaningfully to the markets’ strong showing. Emerging market equities also posted outsized returns. Bonds registered more modest gains, led by credit-oriented investments. Income was the primary contributor to total returns for fixed income instruments, as prices came under pressure from concerns about persistent inflation, global conflicts, energy prices, and mounting government debt across the developed world.
TOP PERFORMANCE CONTRIBUTORS
Equity allocation | U.S. equities made a significant contribution to absolute performance, led by large cap equities. International developed market equities further helped results, as did emerging market stocks. Defensive equities also generated positive returns. The real assets portfolio was an additional contributor with strong returns for energy stocks and the metals & mining sector.
Bond funds | The fixed-income allocation contributed positively, led by intermediate-term bonds and emerging markets debt. Holdings in short-term bonds, high yield bonds, multi-sector bonds, short-term U.S. Treasury Inflation Protected Securities, and bank loans aided returns as well.
TOP PERFORMANCE DETRACTORS
Specific positions | At a time of positive returns for most segments of the financial markets, the majority of the fund’s holdings recorded a gain. However, small positions in U.S. Treasury STRIPS (Separate Trading of Registered Interest and Principal of Securities) were adversely affected by rising yields.
The views expressed in this report are those of the portfolio management team and are subject to change. They are not meant as investment advice.
Fund Performance
The following graph compares the initial and subsequent account values at the end of each of the most recently completed 10 fiscal years of the fund (or for the life of the fund, if shorter). It assumes a $1,000,000 initial investment in the fund and in an appropriate, broad-based securities market index for the same period.
GROWTH OF $1,000,000
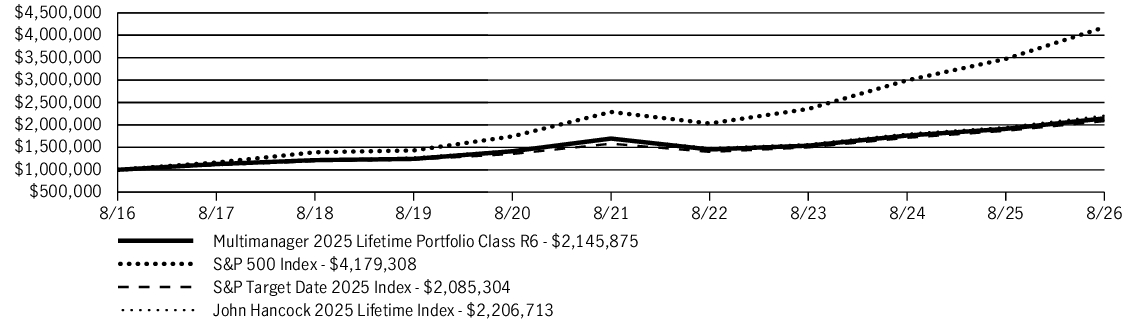
| AVERAGE ANNUAL TOTAL RETURN | 1 Year | 5 Years | 10 Years |
| Multimanager 2025 Lifetime Portfolio (Class R6/JLEIX) | 12.20% | 4.81% | 7.93% |
| S&P 500 Index | 20.38% | 12.79% | 15.37% |
| S&P Target Date 2025 Index | 11.58% | 5.68% | 7.63% |
| John Hancock 2025 Lifetime Index | 12.95% | 5.33% | 8.23% |
Fund Statistics
| Fund net assets | $650,919,838 |
| Total number of portfolio holdings | 92 |
| Total advisory fees paid (net) | $0 |
| Portfolio turnover rate | 19% |
Graphical Representation of Holdings
The table below shows the investment makeup of the fund, representing a percentage of the total net assets of the fund.
Asset Allocation
| Affiliated investment companies | 91.5% |
| Equity | 41.9% |
| International equity | 15.8% |
| U.S. large cap | 11.3% |
| Large blend | 10.5% |
| U.S. mid cap | 2.6% |
| Emerging-market equity | 1.2% |
| U.S. small cap | 0.5% |
| Fixed income | 44.9% |
| Intermediate bond | 24.1% |
| Short-term bond | 6.7% |
| Emerging-market debt | 4.5% |
| Multi-sector bond | 4.3% |
| High yield bond | 3.3% |
| Bank loan | 2.0% |
| Alternative and specialty | 4.7% |
| Sector equity | 4.2% |
| Absolute return | 0.5% |
| Unaffiliated investment companies | 3.3% |
| Equity | 3.3% |
| U.S. Government | 5.2% |
Holdings may not have been held by the fund for the entire period and are subject to change without notice. Portfolio composition is subject to review in accordance with the fund’s investment strategy and may vary in the future. Current and future portfolio holdings are subject to risk and may change at any time.
What were the fund costs during the last year ?
(Based on a hypothetical $10,000 investment)
| Fund (Class) | Costs of a $10,000 investment | Costs paid as a percentage of a $10,000 investment |
| Multimanager 2025 Lifetime Portfolio (Class R5/JLEHX) |
$6 | 0.06% |
Management’s Discussion of Fund Performance
SUMMARY OF RESULTS
Multimanager 2025 Lifetime Portfolio (Class R5/JLEHX) returned 12.13% for the year ended August 31, 2026. Global equities produced sizable gains in the 12-month period that ended on August 31, 2026. Investors were encouraged by the favorable combination of healthy economic growth trends, robust corporate earnings, and generally supportive central bank policies, together with optimism about artificial intelligence. While technology stocks performed very well, the value style outpaced growth on a global basis and contributed meaningfully to the markets’ strong showing. Emerging market equities also posted outsized returns. Bonds registered more modest gains, led by credit-oriented investments. Income was the primary contributor to total returns for fixed income instruments, as prices came under pressure from concerns about persistent inflation, global conflicts, energy prices, and mounting government debt across the developed world.
TOP PERFORMANCE CONTRIBUTORS
Equity allocation | U.S. equities made a significant contribution to absolute performance, led by large cap equities. International developed market equities further helped results, as did emerging market stocks. Defensive equities also generated positive returns. The real assets portfolio was an additional contributor with strong returns for energy stocks and the metals & mining sector.
Bond funds | The fixed-income allocation contributed positively, led by intermediate-term bonds and emerging markets debt. Holdings in short-term bonds, high yield bonds, multi-sector bonds, short-term U.S. Treasury Inflation Protected Securities, and bank loans aided returns as well.
TOP PERFORMANCE DETRACTORS
Specific positions | At a time of positive returns for most segments of the financial markets, the majority of the fund’s holdings recorded a gain. However, small positions in U.S. Treasury STRIPS (Separate Trading of Registered Interest and Principal of Securities) were adversely affected by rising yields.
The views expressed in this report are those of the portfolio management team and are subject to change. They are not meant as investment advice.
Fund Performance
The following graph compares the initial and subsequent account values at the end of each of the most recently completed 10 fiscal years of the fund (or for the life of the fund, if shorter). It assumes a $10,000 initial investment in the fund and in an appropriate, broad-based securities market index for the same period.
GROWTH OF $10,000
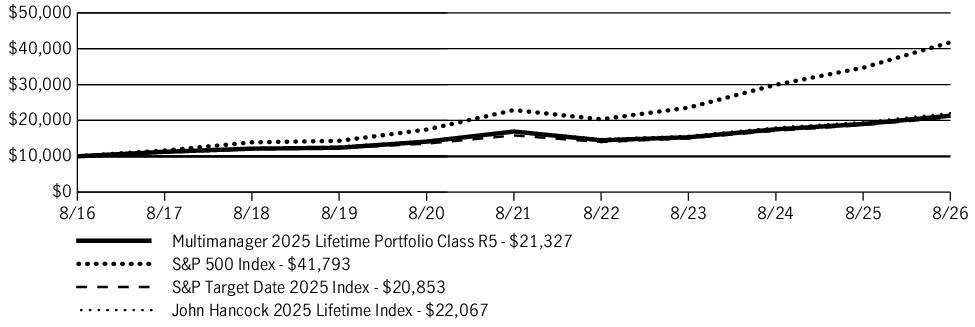
| AVERAGE ANNUAL TOTAL RETURN | 1 Year | 5 Years | 10 Years |
| Multimanager 2025 Lifetime Portfolio (Class R5/JLEHX) | 12.13% | 4.75% | 7.87% |
| S&P 500 Index | 20.38% | 12.79% | 15.37% |
| S&P Target Date 2025 Index | 11.58% | 5.68% | 7.63% |
| John Hancock 2025 Lifetime Index | 12.95% | 5.33% | 8.23% |
Fund Statistics
| Fund net assets | $650,919,838 |
| Total number of portfolio holdings | 92 |
| Total advisory fees paid (net) | $0 |
| Portfolio turnover rate | 19% |
Graphical Representation of Holdings
The table below shows the investment makeup of the fund, representing a percentage of the total net assets of the fund.
Asset Allocation
| Affiliated investment companies | 91.5% |
| Equity | 41.9% |
| International equity | 15.8% |
| U.S. large cap | 11.3% |
| Large blend | 10.5% |
| U.S. mid cap | 2.6% |
| Emerging-market equity | 1.2% |
| U.S. small cap | 0.5% |
| Fixed income | 44.9% |
| Intermediate bond | 24.1% |
| Short-term bond | 6.7% |
| Emerging-market debt | 4.5% |
| Multi-sector bond | 4.3% |
| High yield bond | 3.3% |
| Bank loan | 2.0% |
| Alternative and specialty | 4.7% |
| Sector equity | 4.2% |
| Absolute return | 0.5% |
| Unaffiliated investment companies | 3.3% |
| Equity | 3.3% |
| U.S. Government | 5.2% |
Holdings may not have been held by the fund for the entire period and are subject to change without notice. Portfolio composition is subject to review in accordance with the fund’s investment strategy and may vary in the future. Current and future portfolio holdings are subject to risk and may change at any time.
What were the fund costs during the last year ?
(Based on a hypothetical $10,000 investment)
| Fund (Class) | Costs of a $10,000 investment | Costs paid as a percentage of a $10,000 investment |
| Multimanager 2025 Lifetime Portfolio (Class R4/JLEGX) |
$26 | 0.25% |
Management’s Discussion of Fund Performance
SUMMARY OF RESULTS
Multimanager 2025 Lifetime Portfolio (Class R4/JLEGX) returned 11.88% for the year ended August 31, 2026. Global equities produced sizable gains in the 12-month period that ended on August 31, 2026. Investors were encouraged by the favorable combination of healthy economic growth trends, robust corporate earnings, and generally supportive central bank policies, together with optimism about artificial intelligence. While technology stocks performed very well, the value style outpaced growth on a global basis and contributed meaningfully to the markets’ strong showing. Emerging market equities also posted outsized returns. Bonds registered more modest gains, led by credit-oriented investments. Income was the primary contributor to total returns for fixed income instruments, as prices came under pressure from concerns about persistent inflation, global conflicts, energy prices, and mounting government debt across the developed world.
TOP PERFORMANCE CONTRIBUTORS
Equity allocation | U.S. equities made a significant contribution to absolute performance, led by large cap equities. International developed market equities further helped results, as did emerging market stocks. Defensive equities also generated positive returns. The real assets portfolio was an additional contributor with strong returns for energy stocks and the metals & mining sector.
Bond funds | The fixed-income allocation contributed positively, led by intermediate-term bonds and emerging markets debt. Holdings in short-term bonds, high yield bonds, multi-sector bonds, short-term U.S. Treasury Inflation Protected Securities, and bank loans aided returns as well.
TOP PERFORMANCE DETRACTORS
Specific positions | At a time of positive returns for most segments of the financial markets, the majority of the fund’s holdings recorded a gain. However, small positions in U.S. Treasury STRIPS (Separate Trading of Registered Interest and Principal of Securities) were adversely affected by rising yields.
The views expressed in this report are those of the portfolio management team and are subject to change. They are not meant as investment advice.
Fund Performance
The following graph compares the initial and subsequent account values at the end of each of the most recently completed 10 fiscal years of the fund (or for the life of the fund, if shorter). It assumes a $10,000 initial investment in the fund and in an appropriate, broad-based securities market index for the same period.
GROWTH OF $10,000
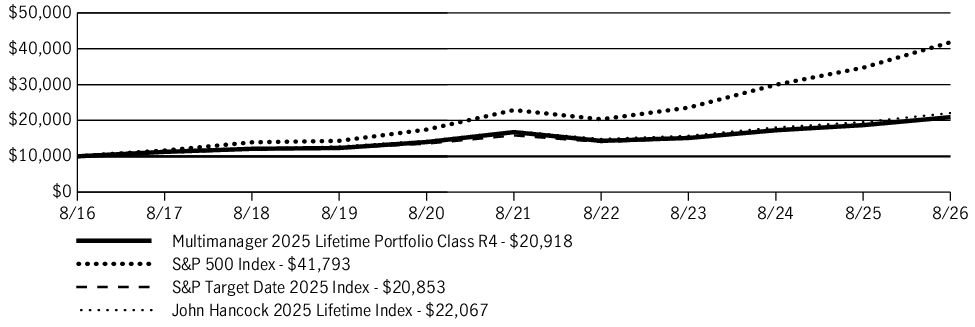
| AVERAGE ANNUAL TOTAL RETURN | 1 Year | 5 Years | 10 Years |
| Multimanager 2025 Lifetime Portfolio (Class R4/JLEGX) | 11.88% | 4.55% | 7.66% |
| S&P 500 Index | 20.38% | 12.79% | 15.37% |
| S&P Target Date 2025 Index | 11.58% | 5.68% | 7.63% |
| John Hancock 2025 Lifetime Index | 12.95% | 5.33% | 8.23% |
Fund Statistics
| Fund net assets | $650,919,838 |
| Total number of portfolio holdings | 92 |
| Total advisory fees paid (net) | $0 |
| Portfolio turnover rate | 19% |
Graphical Representation of Holdings
The table below shows the investment makeup of the fund, representing a percentage of the total net assets of the fund.
Asset Allocation
| Affiliated investment companies | 91.5% |
| Equity | 41.9% |
| International equity | 15.8% |
| U.S. large cap | 11.3% |
| Large blend | 10.5% |
| U.S. mid cap | 2.6% |
| Emerging-market equity | 1.2% |
| U.S. small cap | 0.5% |
| Fixed income | 44.9% |
| Intermediate bond | 24.1% |
| Short-term bond | 6.7% |
| Emerging-market debt | 4.5% |
| Multi-sector bond | 4.3% |
| High yield bond | 3.3% |
| Bank loan | 2.0% |
| Alternative and specialty | 4.7% |
| Sector equity | 4.2% |
| Absolute return | 0.5% |
| Unaffiliated investment companies | 3.3% |
| Equity | 3.3% |
| U.S. Government | 5.2% |
Holdings may not have been held by the fund for the entire period and are subject to change without notice. Portfolio composition is subject to review in accordance with the fund’s investment strategy and may vary in the future. Current and future portfolio holdings are subject to risk and may change at any time.
What were the fund costs during the last year ?
(Based on a hypothetical $10,000 investment)
| Fund (Class) | Costs of a $10,000 investment | Costs paid as a percentage of a $10,000 investment |
| Multimanager 2025 Lifetime Portfolio (Class R2/JLEEX) |
$53 | 0.50% |
Management’s Discussion of Fund Performance
SUMMARY OF RESULTS
Multimanager 2025 Lifetime Portfolio (Class R2/JLEEX) returned 11.69% for the year ended August 31, 2026. Global equities produced sizable gains in the 12-month period that ended on August 31, 2026. Investors were encouraged by the favorable combination of healthy economic growth trends, robust corporate earnings, and generally supportive central bank policies, together with optimism about artificial intelligence. While technology stocks performed very well, the value style outpaced growth on a global basis and contributed meaningfully to the markets’ strong showing. Emerging market equities also posted outsized returns. Bonds registered more modest gains, led by credit-oriented investments. Income was the primary contributor to total returns for fixed income instruments, as prices came under pressure from concerns about persistent inflation, global conflicts, energy prices, and mounting government debt across the developed world.
TOP PERFORMANCE CONTRIBUTORS
Equity allocation | U.S. equities made a significant contribution to absolute performance, led by large cap equities. International developed market equities further helped results, as did emerging market stocks. Defensive equities also generated positive returns. The real assets portfolio was an additional contributor with strong returns for energy stocks and the metals & mining sector.
Bond funds | The fixed-income allocation contributed positively, led by intermediate-term bonds and emerging markets debt. Holdings in short-term bonds, high yield bonds, multi-sector bonds, short-term U.S. Treasury Inflation Protected Securities, and bank loans aided returns as well.
TOP PERFORMANCE DETRACTORS
Specific positions | At a time of positive returns for most segments of the financial markets, the majority of the fund’s holdings recorded a gain. However, small positions in U.S. Treasury STRIPS (Separate Trading of Registered Interest and Principal of Securities) were adversely affected by rising yields.
The views expressed in this report are those of the portfolio management team and are subject to change. They are not meant as investment advice.
Fund Performance
The following graph compares the initial and subsequent account values at the end of each of the most recently completed 10 fiscal years of the fund (or for the life of the fund, if shorter). It assumes a $10,000 initial investment in the fund and in an appropriate, broad-based securities market index for the same period.
GROWTH OF $10,000
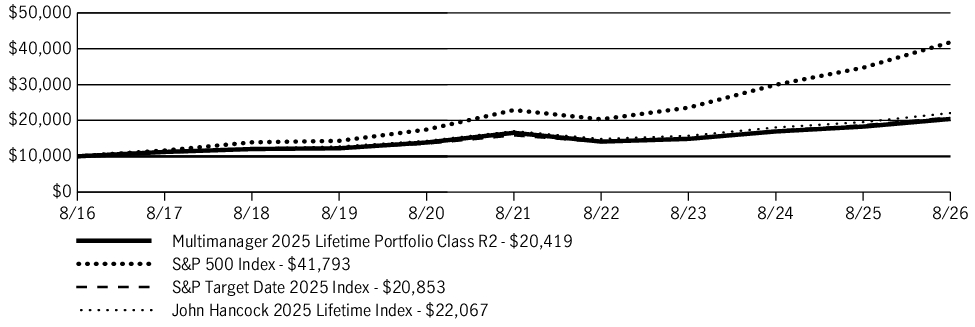
| AVERAGE ANNUAL TOTAL RETURN | 1 Year | 5 Years | 10 Years |
| Multimanager 2025 Lifetime Portfolio (Class R2/JLEEX) | 11.69% | 4.29% | 7.40% |
| S&P 500 Index | 20.38% | 12.79% | 15.37% |
| S&P Target Date 2025 Index | 11.58% | 5.68% | 7.63% |
| John Hancock 2025 Lifetime Index | 12.95% | 5.33% | 8.23% |
Fund Statistics
| Fund net assets | $650,919,838 |
| Total number of portfolio holdings | 92 |
| Total advisory fees paid (net) | $0 |
| Portfolio turnover rate | 19% |
Graphical Representation of Holdings
The table below shows the investment makeup of the fund, representing a percentage of the total net assets of the fund.
Asset Allocation
| Affiliated investment companies | 91.5% |
| Equity | 41.9% |
| International equity | 15.8% |
| U.S. large cap | 11.3% |
| Large blend | 10.5% |
| U.S. mid cap | 2.6% |
| Emerging-market equity | 1.2% |
| U.S. small cap | 0.5% |
| Fixed income | 44.9% |
| Intermediate bond | 24.1% |
| Short-term bond | 6.7% |
| Emerging-market debt | 4.5% |
| Multi-sector bond | 4.3% |
| High yield bond | 3.3% |
| Bank loan | 2.0% |
| Alternative and specialty | 4.7% |
| Sector equity | 4.2% |
| Absolute return | 0.5% |
| Unaffiliated investment companies | 3.3% |
| Equity | 3.3% |
| U.S. Government | 5.2% |
Holdings may not have been held by the fund for the entire period and are subject to change without notice. Portfolio composition is subject to review in accordance with the fund’s investment strategy and may vary in the future. Current and future portfolio holdings are subject to risk and may change at any time.
What were the fund costs during the last year ?
(Based on a hypothetical $10,000 investment)
| Fund (Class) | Costs of a $10,000 investment | Costs paid as a percentage of a $10,000 investment |
| Multimanager 2025 Lifetime Portfolio (Class I/JHRNX) |
$12 | 0.11% |
Management’s Discussion of Fund Performance
SUMMARY OF RESULTS
Multimanager 2025 Lifetime Portfolio (Class I/JHRNX) returned 12.14% for the year ended August 31, 2026. Global equities produced sizable gains in the 12-month period that ended on August 31, 2026. Investors were encouraged by the favorable combination of healthy economic growth trends, robust corporate earnings, and generally supportive central bank policies, together with optimism about artificial intelligence. While technology stocks performed very well, the value style outpaced growth on a global basis and contributed meaningfully to the markets’ strong showing. Emerging market equities also posted outsized returns. Bonds registered more modest gains, led by credit-oriented investments. Income was the primary contributor to total returns for fixed income instruments, as prices came under pressure from concerns about persistent inflation, global conflicts, energy prices, and mounting government debt across the developed world.
TOP PERFORMANCE CONTRIBUTORS
Equity allocation | U.S. equities made a significant contribution to absolute performance, led by large cap equities. International developed market equities further helped results, as did emerging market stocks. Defensive equities also generated positive returns. The real assets portfolio was an additional contributor with strong returns for energy stocks and the metals & mining sector.
Bond funds | The fixed-income allocation contributed positively, led by intermediate-term bonds and emerging markets debt. Holdings in short-term bonds, high yield bonds, multi-sector bonds, short-term U.S. Treasury Inflation Protected Securities, and bank loans aided returns as well.
TOP PERFORMANCE DETRACTORS
Specific positions | At a time of positive returns for most segments of the financial markets, the majority of the fund’s holdings recorded a gain. However, small positions in U.S. Treasury STRIPS (Separate Trading of Registered Interest and Principal of Securities) were adversely affected by rising yields.
The views expressed in this report are those of the portfolio management team and are subject to change. They are not meant as investment advice.
Fund Performance
The following graph compares the initial and subsequent account values at the end of each of the most recently completed 10 fiscal years of the fund (or for the life of the fund, if shorter). It assumes a $250,000 initial investment in the fund and in an appropriate, broad-based securities market index for the same period.
GROWTH OF $250,000
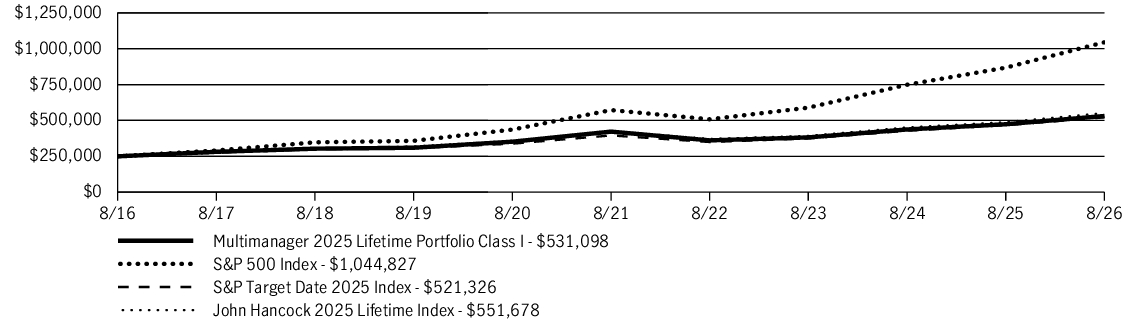
| AVERAGE ANNUAL TOTAL RETURN | 1 Year | 5 Years | 10 Years |
| Multimanager 2025 Lifetime Portfolio (Class I/JHRNX) | 12.14% | 4.70% | 7.83% |
| S&P 500 Index | 20.38% | 12.79% | 15.37% |
| S&P Target Date 2025 Index | 11.58% | 5.68% | 7.63% |
| John Hancock 2025 Lifetime Index | 12.95% | 5.33% | 8.23% |
Fund Statistics
| Fund net assets | $650,919,838 |
| Total number of portfolio holdings | 92 |
| Total advisory fees paid (net) | $0 |
| Portfolio turnover rate | 19% |
Graphical Representation of Holdings
The table below shows the investment makeup of the fund, representing a percentage of the total net assets of the fund.
Asset Allocation
| Affiliated investment companies | 91.5% |
| Equity | 41.9% |
| International equity | 15.8% |
| U.S. large cap | 11.3% |
| Large blend | 10.5% |
| U.S. mid cap | 2.6% |
| Emerging-market equity | 1.2% |
| U.S. small cap | 0.5% |
| Fixed income | 44.9% |
| Intermediate bond | 24.1% |
| Short-term bond | 6.7% |
| Emerging-market debt | 4.5% |
| Multi-sector bond | 4.3% |
| High yield bond | 3.3% |
| Bank loan | 2.0% |
| Alternative and specialty | 4.7% |
| Sector equity | 4.2% |
| Absolute return | 0.5% |
| Unaffiliated investment companies | 3.3% |
| Equity | 3.3% |
| U.S. Government | 5.2% |
Holdings may not have been held by the fund for the entire period and are subject to change without notice. Portfolio composition is subject to review in accordance with the fund’s investment strategy and may vary in the future. Current and future portfolio holdings are subject to risk and may change at any time.
What were the fund costs during the last year ?
(Based on a hypothetical $10,000 investment)
| Fund (Class) | Costs of a $10,000 investment | Costs paid as a percentage of a $10,000 investment |
| Multimanager 2025 Lifetime Portfolio (Class A/JLEAX) |
$43 | 0.41% |
Management’s Discussion of Fund Performance
SUMMARY OF RESULTS
Multimanager 2025 Lifetime Portfolio (Class A/JLEAX) returned 11.65% (excluding sales charges) for the year ended August 31, 2026. Global equities produced sizable gains in the 12-month period that ended on August 31, 2026. Investors were encouraged by the favorable combination of healthy economic growth trends, robust corporate earnings, and generally supportive central bank policies, together with optimism about artificial intelligence. While technology stocks performed very well, the value style outpaced growth on a global basis and contributed meaningfully to the markets’ strong showing. Emerging market equities also posted outsized returns. Bonds registered more modest gains, led by credit-oriented investments. Income was the primary contributor to total returns for fixed income instruments, as prices came under pressure from concerns about persistent inflation, global conflicts, energy prices, and mounting government debt across the developed world.
TOP PERFORMANCE CONTRIBUTORS
Equity allocation | U.S. equities made a significant contribution to absolute performance, led by large cap equities. International developed market equities further helped results, as did emerging market stocks. Defensive equities also generated positive returns. The real assets portfolio was an additional contributor with strong returns for energy stocks and the metals & mining sector.
Bond funds | The fixed-income allocation contributed positively, led by intermediate-term bonds and emerging markets debt. Holdings in short-term bonds, high yield bonds, multi-sector bonds, short-term U.S. Treasury Inflation Protected Securities, and bank loans aided returns as well.
TOP PERFORMANCE DETRACTORS
Specific positions | At a time of positive returns for most segments of the financial markets, the majority of the fund’s holdings recorded a gain. However, small positions in U.S. Treasury STRIPS (Separate Trading of Registered Interest and Principal of Securities) were adversely affected by rising yields.
The views expressed in this report are those of the portfolio management team and are subject to change. They are not meant as investment advice.
Fund Performance
The following graph compares the initial and subsequent account values at the end of each of the most recently completed 10 fiscal years of the fund (or for the life of the fund, if shorter). It assumes a $10,000 initial investment in the fund and in an appropriate, broad-based securities market index for the same period.
GROWTH OF $10,000
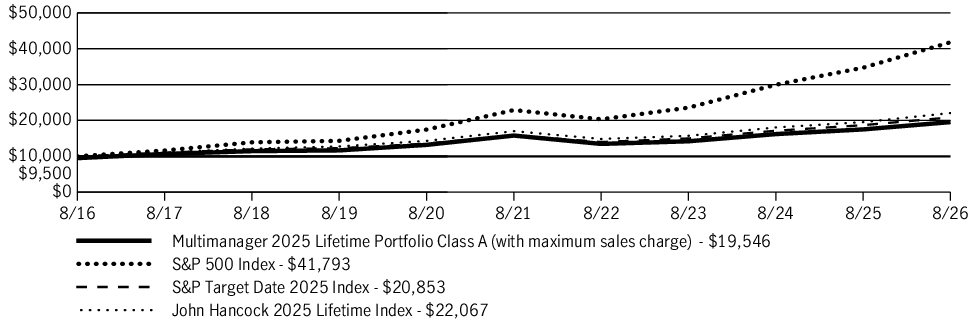
| AVERAGE ANNUAL TOTAL RETURN | 1 Year | 5 Years | 10 Years |
| Multimanager 2025 Lifetime Portfolio (Class A/JLEAX) | 6.06% | 3.30% | 6.93% |
| Multimanager 2025 Lifetime Portfolio (Class A/JLEAX)—excluding sales charge | 11.65% | 4.36% | 7.48% |
| S&P 500 Index | 20.38% | 12.79% | 15.37% |
| S&P Target Date 2025 Index | 11.58% | 5.68% | 7.63% |
| John Hancock 2025 Lifetime Index | 12.95% | 5.33% | 8.23% |
Fund Statistics
| Fund net assets | $650,919,838 |
| Total number of portfolio holdings | 92 |
| Total advisory fees paid (net) | $0 |
| Portfolio turnover rate | 19% |
Graphical Representation of Holdings
The table below shows the investment makeup of the fund, representing a percentage of the total net assets of the fund.
Asset Allocation
| Affiliated investment companies | 91.5% |
| Equity | 41.9% |
| International equity | 15.8% |
| U.S. large cap | 11.3% |
| Large blend | 10.5% |
| U.S. mid cap | 2.6% |
| Emerging-market equity | 1.2% |
| U.S. small cap | 0.5% |
| Fixed income | 44.9% |
| Intermediate bond | 24.1% |
| Short-term bond | 6.7% |
| Emerging-market debt | 4.5% |
| Multi-sector bond | 4.3% |
| High yield bond | 3.3% |
| Bank loan | 2.0% |
| Alternative and specialty | 4.7% |
| Sector equity | 4.2% |
| Absolute return | 0.5% |
| Unaffiliated investment companies | 3.3% |
| Equity | 3.3% |
| U.S. Government | 5.2% |
Holdings may not have been held by the fund for the entire period and are subject to change without notice. Portfolio composition is subject to review in accordance with the fund’s investment strategy and may vary in the future. Current and future portfolio holdings are subject to risk and may change at any time.
What were the fund costs during the last year ?
(Based on a hypothetical $10,000 investment)
| Fund (Class) | Costs of a $10,000 investment | Costs paid as a percentage of a $10,000 investment |
| Multimanager 2025 Lifetime Portfolio (Class 1/JLEOX) |
$5 | 0.05% |
Management’s Discussion of Fund Performance
SUMMARY OF RESULTS
Multimanager 2025 Lifetime Portfolio (Class 1/JLEOX) returned 12.13% for the year ended August 31, 2026. Global equities produced sizable gains in the 12-month period that ended on August 31, 2026. Investors were encouraged by the favorable combination of healthy economic growth trends, robust corporate earnings, and generally supportive central bank policies, together with optimism about artificial intelligence. While technology stocks performed very well, the value style outpaced growth on a global basis and contributed meaningfully to the markets’ strong showing. Emerging market equities also posted outsized returns. Bonds registered more modest gains, led by credit-oriented investments. Income was the primary contributor to total returns for fixed income instruments, as prices came under pressure from concerns about persistent inflation, global conflicts, energy prices, and mounting government debt across the developed world.
TOP PERFORMANCE CONTRIBUTORS
Equity allocation | U.S. equities made a significant contribution to absolute performance, led by large cap equities. International developed market equities further helped results, as did emerging market stocks. Defensive equities also generated positive returns. The real assets portfolio was an additional contributor with strong returns for energy stocks and the metals & mining sector.
Bond funds | The fixed-income allocation contributed positively, led by intermediate-term bonds and emerging markets debt. Holdings in short-term bonds, high yield bonds, multi-sector bonds, short-term U.S. Treasury Inflation Protected Securities, and bank loans aided returns as well.
TOP PERFORMANCE DETRACTORS
Specific positions | At a time of positive returns for most segments of the financial markets, the majority of the fund’s holdings recorded a gain. However, small positions in U.S. Treasury STRIPS (Separate Trading of Registered Interest and Principal of Securities) were adversely affected by rising yields.
The views expressed in this report are those of the portfolio management team and are subject to change. They are not meant as investment advice.
Fund Performance
The following graph compares the initial and subsequent account values at the end of each of the most recently completed 10 fiscal years of the fund (or for the life of the fund, if shorter). It assumes a $10,000 initial investment in the fund and in an appropriate, broad-based securities market index for the same period.
GROWTH OF $10,000
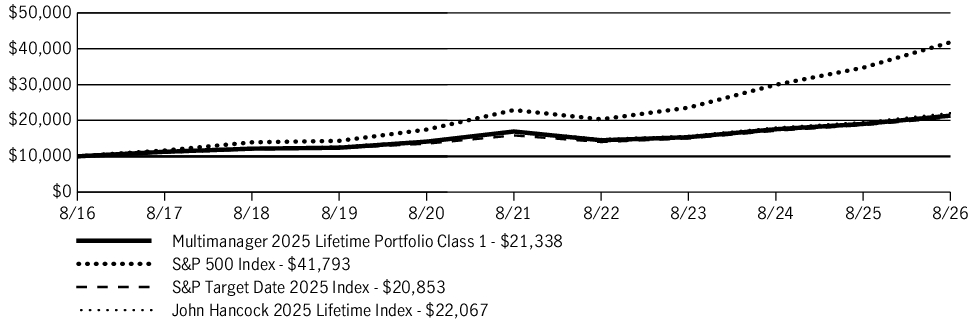
| AVERAGE ANNUAL TOTAL RETURN | 1 Year | 5 Years | 10 Years |
| Multimanager 2025 Lifetime Portfolio (Class 1/JLEOX) | 12.13% | 4.76% | 7.87% |
| S&P 500 Index | 20.38% | 12.79% | 15.37% |
| S&P Target Date 2025 Index | 11.58% | 5.68% | 7.63% |
| John Hancock 2025 Lifetime Index | 12.95% | 5.33% | 8.23% |
Fund Statistics
| Fund net assets | $650,919,838 |
| Total number of portfolio holdings | 92 |
| Total advisory fees paid (net) | $0 |
| Portfolio turnover rate | 19% |
Graphical Representation of Holdings
The table below shows the investment makeup of the fund, representing a percentage of the total net assets of the fund.
Asset Allocation
| Affiliated investment companies | 91.5% |
| Equity | 41.9% |
| International equity | 15.8% |
| U.S. large cap | 11.3% |
| Large blend | 10.5% |
| U.S. mid cap | 2.6% |
| Emerging-market equity | 1.2% |
| U.S. small cap | 0.5% |
| Fixed income | 44.9% |
| Intermediate bond | 24.1% |
| Short-term bond | 6.7% |
| Emerging-market debt | 4.5% |
| Multi-sector bond | 4.3% |
| High yield bond | 3.3% |
| Bank loan | 2.0% |
| Alternative and specialty | 4.7% |
| Sector equity | 4.2% |
| Absolute return | 0.5% |
| Unaffiliated investment companies | 3.3% |
| Equity | 3.3% |
| U.S. Government | 5.2% |
Holdings may not have been held by the fund for the entire period and are subject to change without notice. Portfolio composition is subject to review in accordance with the fund’s investment strategy and may vary in the future. Current and future portfolio holdings are subject to risk and may change at any time.
What were the fund costs during the last year ?
(Based on a hypothetical $10,000 investment)
| Fund (Class) | Costs of a $10,000 investment | Costs paid as a percentage of a $10,000 investment |
| Multimanager 2030 Lifetime Portfolio (Class 1/JLFOX) |
$5 | 0.05% |
Management’s Discussion of Fund Performance
SUMMARY OF RESULTS
Multimanager 2030 Lifetime Portfolio (Class 1/JLFOX) returned 14.21% for the year ended August 31, 2026. Global equities produced sizable gains in the 12-month period that ended on August 31, 2026. Investors were encouraged by the favorable combination of healthy economic growth trends, robust corporate earnings, and generally supportive central bank policies, together with optimism about artificial intelligence. While technology stocks performed very well, the value style outpaced growth on a global basis and contributed meaningfully to the markets’ strong showing. Emerging market equities also posted outsized returns. Bonds registered more modest gains, led by credit-oriented investments. Income was the primary contributor to total returns for fixed income instruments, as prices came under pressure from concerns about persistent inflation, global conflicts, energy prices, and mounting government debt across the developed world.
TOP PERFORMANCE CONTRIBUTORS
Equity allocation | U.S. equities made a significant contribution to absolute performance, led by large cap equities. International developed market equities further helped results, as did emerging market stocks. Defensive equities also generated positive returns. The real assets portfolio was an additional contributor with strong returns for energy stocks and the metals & mining sector.
Bond funds | The fixed-income allocation contributed positively, led by intermediate-term bonds and emerging markets debt. Holdings in short-term bonds, high yield bonds, multi-sector bonds, short-term U.S. Treasury Inflation Protected Securities, and bank loans aided returns as well.
TOP PERFORMANCE DETRACTORS
Specific positions | At a time of positive returns for most segments of the financial markets, the majority of the fund’s holdings recorded a gain. However, small positions in U.S. Treasury STRIPS (Separate Trading of Registered Interest and Principal of Securities) were adversely affected by rising yields.
The views expressed in this report are those of the portfolio management team and are subject to change. They are not meant as investment advice.
Fund Performance
The following graph compares the initial and subsequent account values at the end of each of the most recently completed 10 fiscal years of the fund (or for the life of the fund, if shorter). It assumes a $10,000 initial investment in the fund and in an appropriate, broad-based securities market index for the same period.
GROWTH OF $10,000
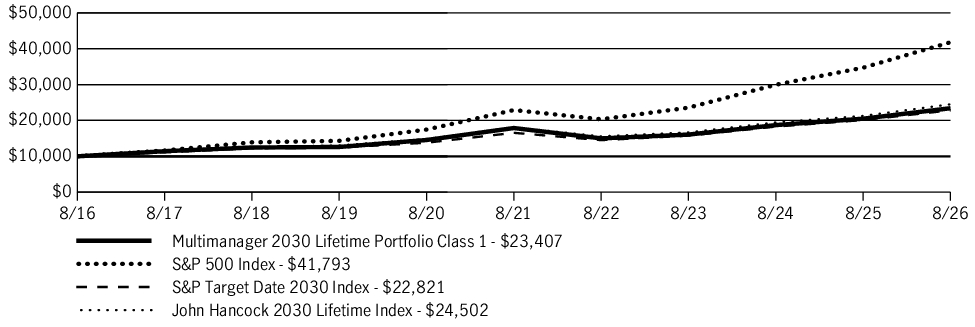
| AVERAGE ANNUAL TOTAL RETURN | 1 Year | 5 Years | 10 Years |
| Multimanager 2030 Lifetime Portfolio (Class 1/JLFOX) | 14.21% | 5.53% | 8.88% |
| S&P 500 Index | 20.38% | 12.79% | 15.37% |
| S&P Target Date 2030 Index | 13.47% | 6.63% | 8.60% |
| John Hancock 2030 Lifetime Index | 15.22% | 6.27% | 9.37% |
Fund Statistics
| Fund net assets | $1,086,197,376 |
| Total number of portfolio holdings | 92 |
| Total advisory fees paid (net) | $0 |
| Portfolio turnover rate | 21% |
Graphical Representation of Holdings
The table below shows the investment makeup of the fund, representing a percentage of the total net assets of the fund.
Asset Allocation
| Affiliated investment companies | 92.4% |
| Equity | 51.6% |
| International equity | 19.7% |
| U.S. large cap | 15.1% |
| Large blend | 10.6% |
| U.S. mid cap | 3.7% |
| Emerging-market equity | 2.1% |
| U.S. small cap | 0.4% |
| Fixed income | 36.6% |
| Intermediate bond | 20.6% |
| Short-term bond | 5.5% |
| Emerging-market debt | 3.7% |
| Multi-sector bond | 2.8% |
| High yield bond | 2.7% |
| Bank loan | 1.3% |
| Alternative and specialty | 4.2% |
| Sector equity | 3.7% |
| Absolute return | 0.5% |
| Unaffiliated investment companies | 3.9% |
| Equity | 3.9% |
| U.S. Government | 3.7% |
Holdings may not have been held by the fund for the entire period and are subject to change without notice. Portfolio composition is subject to review in accordance with the fund’s investment strategy and may vary in the future. Current and future portfolio holdings are subject to risk and may change at any time.
What were the fund costs during the last year ?
(Based on a hypothetical $10,000 investment)
| Fund (Class) | Costs of a $10,000 investment | Costs paid as a percentage of a $10,000 investment |
| Multimanager 2030 Lifetime Portfolio (Class A/JLFAX) |
$44 | 0.41% |
Management’s Discussion of Fund Performance
SUMMARY OF RESULTS
Multimanager 2030 Lifetime Portfolio (Class A/JLFAX) returned 13.75% (excluding sales charges) for the year ended August 31, 2026. Global equities produced sizable gains in the 12-month period that ended on August 31, 2026. Investors were encouraged by the favorable combination of healthy economic growth trends, robust corporate earnings, and generally supportive central bank policies, together with optimism about artificial intelligence. While technology stocks performed very well, the value style outpaced growth on a global basis and contributed meaningfully to the markets’ strong showing. Emerging market equities also posted outsized returns. Bonds registered more modest gains, led by credit-oriented investments. Income was the primary contributor to total returns for fixed income instruments, as prices came under pressure from concerns about persistent inflation, global conflicts, energy prices, and mounting government debt across the developed world.
TOP PERFORMANCE CONTRIBUTORS
Equity allocation | U.S. equities made a significant contribution to absolute performance, led by large cap equities. International developed market equities further helped results, as did emerging market stocks. Defensive equities also generated positive returns. The real assets portfolio was an additional contributor with strong returns for energy stocks and the metals & mining sector.
Bond funds | The fixed-income allocation contributed positively, led by intermediate-term bonds and emerging markets debt. Holdings in short-term bonds, high yield bonds, multi-sector bonds, short-term U.S. Treasury Inflation Protected Securities, and bank loans aided returns as well.
TOP PERFORMANCE DETRACTORS
Specific positions | At a time of positive returns for most segments of the financial markets, the majority of the fund’s holdings recorded a gain. However, small positions in U.S. Treasury STRIPS (Separate Trading of Registered Interest and Principal of Securities) were adversely affected by rising yields.
The views expressed in this report are those of the portfolio management team and are subject to change. They are not meant as investment advice.
Fund Performance
The following graph compares the initial and subsequent account values at the end of each of the most recently completed 10 fiscal years of the fund (or for the life of the fund, if shorter). It assumes a $10,000 initial investment in the fund and in an appropriate, broad-based securities market index for the same period.
GROWTH OF $10,000
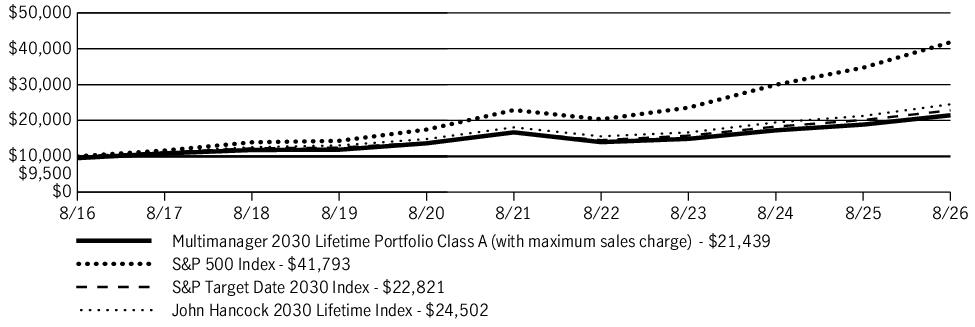
| AVERAGE ANNUAL TOTAL RETURN | 1 Year | 5 Years | 10 Years |
| Multimanager 2030 Lifetime Portfolio (Class A/JLFAX) | 8.10% | 4.07% | 7.92% |
| Multimanager 2030 Lifetime Portfolio (Class A/JLFAX)—excluding sales charge | 13.75% | 5.15% | 8.48% |
| S&P 500 Index | 20.38% | 12.79% | 15.37% |
| S&P Target Date 2030 Index | 13.47% | 6.63% | 8.60% |
| John Hancock 2030 Lifetime Index | 15.22% | 6.27% | 9.37% |
Fund Statistics
| Fund net assets | $1,086,197,376 |
| Total number of portfolio holdings | 92 |
| Total advisory fees paid (net) | $0 |
| Portfolio turnover rate | 21% |
Graphical Representation of Holdings
The table below shows the investment makeup of the fund, representing a percentage of the total net assets of the fund.
Asset Allocation
| Affiliated investment companies | 92.4% |
| Equity | 51.6% |
| International equity | 19.7% |
| U.S. large cap | 15.1% |
| Large blend | 10.6% |
| U.S. mid cap | 3.7% |
| Emerging-market equity | 2.1% |
| U.S. small cap | 0.4% |
| Fixed income | 36.6% |
| Intermediate bond | 20.6% |
| Short-term bond | 5.5% |
| Emerging-market debt | 3.7% |
| Multi-sector bond | 2.8% |
| High yield bond | 2.7% |
| Bank loan | 1.3% |
| Alternative and specialty | 4.2% |
| Sector equity | 3.7% |
| Absolute return | 0.5% |
| Unaffiliated investment companies | 3.9% |
| Equity | 3.9% |
| U.S. Government | 3.7% |
Holdings may not have been held by the fund for the entire period and are subject to change without notice. Portfolio composition is subject to review in accordance with the fund’s investment strategy and may vary in the future. Current and future portfolio holdings are subject to risk and may change at any time.
What were the fund costs during the last year ?
(Based on a hypothetical $10,000 investment)
| Fund (Class) | Costs of a $10,000 investment | Costs paid as a percentage of a $10,000 investment |
| Multimanager 2030 Lifetime Portfolio (Class I/JHRGX) |
$12 | 0.11% |
Management’s Discussion of Fund Performance
SUMMARY OF RESULTS
Multimanager 2030 Lifetime Portfolio (Class I/JHRGX) returned 14.11% for the year ended August 31, 2026. Global equities produced sizable gains in the 12-month period that ended on August 31, 2026. Investors were encouraged by the favorable combination of healthy economic growth trends, robust corporate earnings, and generally supportive central bank policies, together with optimism about artificial intelligence. While technology stocks performed very well, the value style outpaced growth on a global basis and contributed meaningfully to the markets’ strong showing. Emerging market equities also posted outsized returns. Bonds registered more modest gains, led by credit-oriented investments. Income was the primary contributor to total returns for fixed income instruments, as prices came under pressure from concerns about persistent inflation, global conflicts, energy prices, and mounting government debt across the developed world.
TOP PERFORMANCE CONTRIBUTORS
Equity allocation | U.S. equities made a significant contribution to absolute performance, led by large cap equities. International developed market equities further helped results, as did emerging market stocks. Defensive equities also generated positive returns. The real assets portfolio was an additional contributor with strong returns for energy stocks and the metals & mining sector.
Bond funds | The fixed-income allocation contributed positively, led by intermediate-term bonds and emerging markets debt. Holdings in short-term bonds, high yield bonds, multi-sector bonds, short-term U.S. Treasury Inflation Protected Securities, and bank loans aided returns as well.
TOP PERFORMANCE DETRACTORS
Specific positions | At a time of positive returns for most segments of the financial markets, the majority of the fund’s holdings recorded a gain. However, small positions in U.S. Treasury STRIPS (Separate Trading of Registered Interest and Principal of Securities) were adversely affected by rising yields.
The views expressed in this report are those of the portfolio management team and are subject to change. They are not meant as investment advice.
Fund Performance
The following graph compares the initial and subsequent account values at the end of each of the most recently completed 10 fiscal years of the fund (or for the life of the fund, if shorter). It assumes a $250,000 initial investment in the fund and in an appropriate, broad-based securities market index for the same period.
GROWTH OF $250,000
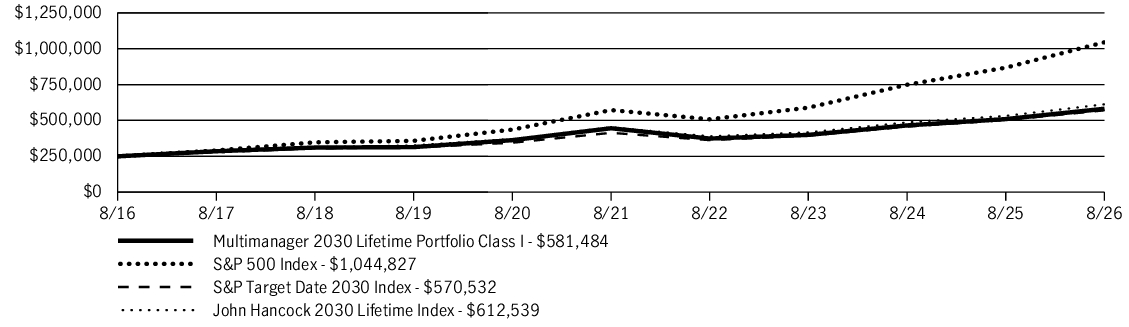
| AVERAGE ANNUAL TOTAL RETURN | 1 Year | 5 Years | 10 Years |
| Multimanager 2030 Lifetime Portfolio (Class I/JHRGX) | 14.11% | 5.46% | 8.81% |
| S&P 500 Index | 20.38% | 12.79% | 15.37% |
| S&P Target Date 2030 Index | 13.47% | 6.63% | 8.60% |
| John Hancock 2030 Lifetime Index | 15.22% | 6.27% | 9.37% |
Fund Statistics
| Fund net assets | $1,086,197,376 |
| Total number of portfolio holdings | 92 |
| Total advisory fees paid (net) | $0 |
| Portfolio turnover rate | 21% |
Graphical Representation of Holdings
The table below shows the investment makeup of the fund, representing a percentage of the total net assets of the fund.
Asset Allocation
| Affiliated investment companies | 92.4% |
| Equity | 51.6% |
| International equity | 19.7% |
| U.S. large cap | 15.1% |
| Large blend | 10.6% |
| U.S. mid cap | 3.7% |
| Emerging-market equity | 2.1% |
| U.S. small cap | 0.4% |
| Fixed income | 36.6% |
| Intermediate bond | 20.6% |
| Short-term bond | 5.5% |
| Emerging-market debt | 3.7% |
| Multi-sector bond | 2.8% |
| High yield bond | 2.7% |
| Bank loan | 1.3% |
| Alternative and specialty | 4.2% |
| Sector equity | 3.7% |
| Absolute return | 0.5% |
| Unaffiliated investment companies | 3.9% |
| Equity | 3.9% |
| U.S. Government | 3.7% |
Holdings may not have been held by the fund for the entire period and are subject to change without notice. Portfolio composition is subject to review in accordance with the fund’s investment strategy and may vary in the future. Current and future portfolio holdings are subject to risk and may change at any time.
What were the fund costs during the last year ?
(Based on a hypothetical $10,000 investment)
| Fund (Class) | Costs of a $10,000 investment | Costs paid as a percentage of a $10,000 investment |
| Multimanager 2030 Lifetime Portfolio (Class R2/JLFEX) |
$53 | 0.50% |
Management’s Discussion of Fund Performance
SUMMARY OF RESULTS
Multimanager 2030 Lifetime Portfolio (Class R2/JLFEX) returned 13.61% for the year ended August 31, 2026. Global equities produced sizable gains in the 12-month period that ended on August 31, 2026. Investors were encouraged by the favorable combination of healthy economic growth trends, robust corporate earnings, and generally supportive central bank policies, together with optimism about artificial intelligence. While technology stocks performed very well, the value style outpaced growth on a global basis and contributed meaningfully to the markets’ strong showing. Emerging market equities also posted outsized returns. Bonds registered more modest gains, led by credit-oriented investments. Income was the primary contributor to total returns for fixed income instruments, as prices came under pressure from concerns about persistent inflation, global conflicts, energy prices, and mounting government debt across the developed world.
TOP PERFORMANCE CONTRIBUTORS
Equity allocation | U.S. equities made a significant contribution to absolute performance, led by large cap equities. International developed market equities further helped results, as did emerging market stocks. Defensive equities also generated positive returns. The real assets portfolio was an additional contributor with strong returns for energy stocks and the metals & mining sector.
Bond funds | The fixed-income allocation contributed positively, led by intermediate-term bonds and emerging markets debt. Holdings in short-term bonds, high yield bonds, multi-sector bonds, short-term U.S. Treasury Inflation Protected Securities, and bank loans aided returns as well.
TOP PERFORMANCE DETRACTORS
Specific positions | At a time of positive returns for most segments of the financial markets, the majority of the fund’s holdings recorded a gain. However, small positions in U.S. Treasury STRIPS (Separate Trading of Registered Interest and Principal of Securities) were adversely affected by rising yields.
The views expressed in this report are those of the portfolio management team and are subject to change. They are not meant as investment advice.
Fund Performance
The following graph compares the initial and subsequent account values at the end of each of the most recently completed 10 fiscal years of the fund (or for the life of the fund, if shorter). It assumes a $10,000 initial investment in the fund and in an appropriate, broad-based securities market index for the same period.
GROWTH OF $10,000
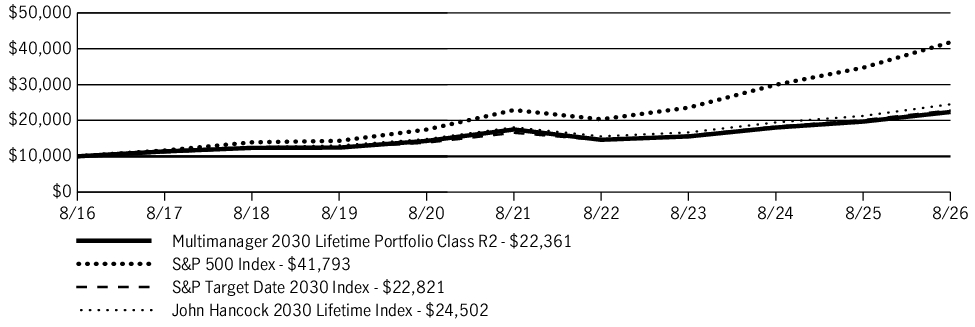
| AVERAGE ANNUAL TOTAL RETURN | 1 Year | 5 Years | 10 Years |
| Multimanager 2030 Lifetime Portfolio (Class R2/JLFEX) | 13.61% | 5.05% | 8.38% |
| S&P 500 Index | 20.38% | 12.79% | 15.37% |
| S&P Target Date 2030 Index | 13.47% | 6.63% | 8.60% |
| John Hancock 2030 Lifetime Index | 15.22% | 6.27% | 9.37% |
Fund Statistics
| Fund net assets | $1,086,197,376 |
| Total number of portfolio holdings | 92 |
| Total advisory fees paid (net) | $0 |
| Portfolio turnover rate | 21% |
Graphical Representation of Holdings
The table below shows the investment makeup of the fund, representing a percentage of the total net assets of the fund.
Asset Allocation
| Affiliated investment companies | 92.4% |
| Equity | 51.6% |
| International equity | 19.7% |
| U.S. large cap | 15.1% |
| Large blend | 10.6% |
| U.S. mid cap | 3.7% |
| Emerging-market equity | 2.1% |
| U.S. small cap | 0.4% |
| Fixed income | 36.6% |
| Intermediate bond | 20.6% |
| Short-term bond | 5.5% |
| Emerging-market debt | 3.7% |
| Multi-sector bond | 2.8% |
| High yield bond | 2.7% |
| Bank loan | 1.3% |
| Alternative and specialty | 4.2% |
| Sector equity | 3.7% |
| Absolute return | 0.5% |
| Unaffiliated investment companies | 3.9% |
| Equity | 3.9% |
| U.S. Government | 3.7% |
Holdings may not have been held by the fund for the entire period and are subject to change without notice. Portfolio composition is subject to review in accordance with the fund’s investment strategy and may vary in the future. Current and future portfolio holdings are subject to risk and may change at any time.
What were the fund costs during the last year ?
(Based on a hypothetical $10,000 investment)
| Fund (Class) | Costs of a $10,000 investment | Costs paid as a percentage of a $10,000 investment |
| Multimanager 2030 Lifetime Portfolio (Class R4/JLFGX) |
$27 | 0.25% |
Management’s Discussion of Fund Performance
SUMMARY OF RESULTS
Multimanager 2030 Lifetime Portfolio (Class R4/JLFGX) returned 13.93% for the year ended August 31, 2026. Global equities produced sizable gains in the 12-month period that ended on August 31, 2026. Investors were encouraged by the favorable combination of healthy economic growth trends, robust corporate earnings, and generally supportive central bank policies, together with optimism about artificial intelligence. While technology stocks performed very well, the value style outpaced growth on a global basis and contributed meaningfully to the markets’ strong showing. Emerging market equities also posted outsized returns. Bonds registered more modest gains, led by credit-oriented investments. Income was the primary contributor to total returns for fixed income instruments, as prices came under pressure from concerns about persistent inflation, global conflicts, energy prices, and mounting government debt across the developed world.
TOP PERFORMANCE CONTRIBUTORS
Equity allocation | U.S. equities made a significant contribution to absolute performance, led by large cap equities. International developed market equities further helped results, as did emerging market stocks. Defensive equities also generated positive returns. The real assets portfolio was an additional contributor with strong returns for energy stocks and the metals & mining sector.
Bond funds | The fixed-income allocation contributed positively, led by intermediate-term bonds and emerging markets debt. Holdings in short-term bonds, high yield bonds, multi-sector bonds, short-term U.S. Treasury Inflation Protected Securities, and bank loans aided returns as well.
TOP PERFORMANCE DETRACTORS
Specific positions | At a time of positive returns for most segments of the financial markets, the majority of the fund’s holdings recorded a gain. However, small positions in U.S. Treasury STRIPS (Separate Trading of Registered Interest and Principal of Securities) were adversely affected by rising yields.
The views expressed in this report are those of the portfolio management team and are subject to change. They are not meant as investment advice.
Fund Performance
The following graph compares the initial and subsequent account values at the end of each of the most recently completed 10 fiscal years of the fund (or for the life of the fund, if shorter). It assumes a $10,000 initial investment in the fund and in an appropriate, broad-based securities market index for the same period.
GROWTH OF $10,000
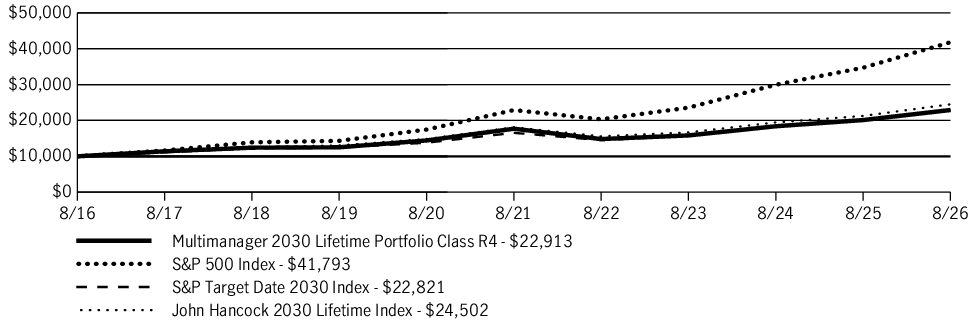
| AVERAGE ANNUAL TOTAL RETURN | 1 Year | 5 Years | 10 Years |
| Multimanager 2030 Lifetime Portfolio (Class R4/JLFGX) | 13.93% | 5.30% | 8.64% |
| S&P 500 Index | 20.38% | 12.79% | 15.37% |
| S&P Target Date 2030 Index | 13.47% | 6.63% | 8.60% |
| John Hancock 2030 Lifetime Index | 15.22% | 6.27% | 9.37% |
Fund Statistics
| Fund net assets | $1,086,197,376 |
| Total number of portfolio holdings | 92 |
| Total advisory fees paid (net) | $0 |
| Portfolio turnover rate | 21% |
Graphical Representation of Holdings
The table below shows the investment makeup of the fund, representing a percentage of the total net assets of the fund.
Asset Allocation
| Affiliated investment companies | 92.4% |
| Equity | 51.6% |
| International equity | 19.7% |
| U.S. large cap | 15.1% |
| Large blend | 10.6% |
| U.S. mid cap | 3.7% |
| Emerging-market equity | 2.1% |
| U.S. small cap | 0.4% |
| Fixed income | 36.6% |
| Intermediate bond | 20.6% |
| Short-term bond | 5.5% |
| Emerging-market debt | 3.7% |
| Multi-sector bond | 2.8% |
| High yield bond | 2.7% |
| Bank loan | 1.3% |
| Alternative and specialty | 4.2% |
| Sector equity | 3.7% |
| Absolute return | 0.5% |
| Unaffiliated investment companies | 3.9% |
| Equity | 3.9% |
| U.S. Government | 3.7% |
Holdings may not have been held by the fund for the entire period and are subject to change without notice. Portfolio composition is subject to review in accordance with the fund’s investment strategy and may vary in the future. Current and future portfolio holdings are subject to risk and may change at any time.
What were the fund costs during the last year ?
(Based on a hypothetical $10,000 investment)
| Fund (Class) | Costs of a $10,000 investment | Costs paid as a percentage of a $10,000 investment |
| Multimanager 2030 Lifetime Portfolio (Class R5/JLFHX) |
$5 | 0.05% |
Management’s Discussion of Fund Performance
SUMMARY OF RESULTS
Multimanager 2030 Lifetime Portfolio (Class R5/JLFHX) returned 14.11% for the year ended August 31, 2026. Global equities produced sizable gains in the 12-month period that ended on August 31, 2026. Investors were encouraged by the favorable combination of healthy economic growth trends, robust corporate earnings, and generally supportive central bank policies, together with optimism about artificial intelligence. While technology stocks performed very well, the value style outpaced growth on a global basis and contributed meaningfully to the markets’ strong showing. Emerging market equities also posted outsized returns. Bonds registered more modest gains, led by credit-oriented investments. Income was the primary contributor to total returns for fixed income instruments, as prices came under pressure from concerns about persistent inflation, global conflicts, energy prices, and mounting government debt across the developed world.
TOP PERFORMANCE CONTRIBUTORS
Equity allocation | U.S. equities made a significant contribution to absolute performance, led by large cap equities. International developed market equities further helped results, as did emerging market stocks. Defensive equities also generated positive returns. The real assets portfolio was an additional contributor with strong returns for energy stocks and the metals & mining sector.
Bond funds | The fixed-income allocation contributed positively, led by intermediate-term bonds and emerging markets debt. Holdings in short-term bonds, high yield bonds, multi-sector bonds, short-term U.S. Treasury Inflation Protected Securities, and bank loans aided returns as well.
TOP PERFORMANCE DETRACTORS
Specific positions | At a time of positive returns for most segments of the financial markets, the majority of the fund’s holdings recorded a gain. However, small positions in U.S. Treasury STRIPS (Separate Trading of Registered Interest and Principal of Securities) were adversely affected by rising yields.
The views expressed in this report are those of the portfolio management team and are subject to change. They are not meant as investment advice.
Fund Performance
The following graph compares the initial and subsequent account values at the end of each of the most recently completed 10 fiscal years of the fund (or for the life of the fund, if shorter). It assumes a $10,000 initial investment in the fund and in an appropriate, broad-based securities market index for the same period.
GROWTH OF $10,000
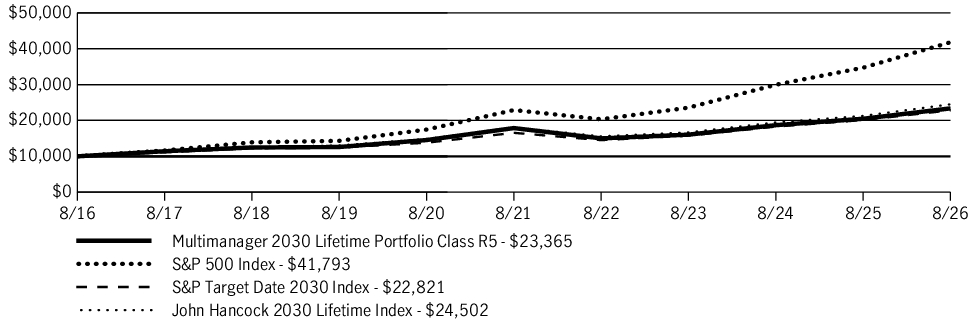
| AVERAGE ANNUAL TOTAL RETURN | 1 Year | 5 Years | 10 Years |
| Multimanager 2030 Lifetime Portfolio (Class R5/JLFHX) | 14.11% | 5.50% | 8.86% |
| S&P 500 Index | 20.38% | 12.79% | 15.37% |
| S&P Target Date 2030 Index | 13.47% | 6.63% | 8.60% |
| John Hancock 2030 Lifetime Index | 15.22% | 6.27% | 9.37% |
Fund Statistics
| Fund net assets | $1,086,197,376 |
| Total number of portfolio holdings | 92 |
| Total advisory fees paid (net) | $0 |
| Portfolio turnover rate | 21% |
Graphical Representation of Holdings
The table below shows the investment makeup of the fund, representing a percentage of the total net assets of the fund.
Asset Allocation
| Affiliated investment companies | 92.4% |
| Equity | 51.6% |
| International equity | 19.7% |
| U.S. large cap | 15.1% |
| Large blend | 10.6% |
| U.S. mid cap | 3.7% |
| Emerging-market equity | 2.1% |
| U.S. small cap | 0.4% |
| Fixed income | 36.6% |
| Intermediate bond | 20.6% |
| Short-term bond | 5.5% |
| Emerging-market debt | 3.7% |
| Multi-sector bond | 2.8% |
| High yield bond | 2.7% |
| Bank loan | 1.3% |
| Alternative and specialty | 4.2% |
| Sector equity | 3.7% |
| Absolute return | 0.5% |
| Unaffiliated investment companies | 3.9% |
| Equity | 3.9% |
| U.S. Government | 3.7% |
Holdings may not have been held by the fund for the entire period and are subject to change without notice. Portfolio composition is subject to review in accordance with the fund’s investment strategy and may vary in the future. Current and future portfolio holdings are subject to risk and may change at any time.
What were the fund costs during the last year ?
(Based on a hypothetical $10,000 investment)
| Fund (Class) | Costs of a $10,000 investment | Costs paid as a percentage of a $10,000 investment |
| Multimanager 2030 Lifetime Portfolio (Class R6/JLFIX) |
$0 | 0.00% |
Management’s Discussion of Fund Performance
SUMMARY OF RESULTS
Multimanager 2030 Lifetime Portfolio (Class R6/JLFIX) returned 14.27% for the year ended August 31, 2026. Global equities produced sizable gains in the 12-month period that ended on August 31, 2026. Investors were encouraged by the favorable combination of healthy economic growth trends, robust corporate earnings, and generally supportive central bank policies, together with optimism about artificial intelligence. While technology stocks performed very well, the value style outpaced growth on a global basis and contributed meaningfully to the markets’ strong showing. Emerging market equities also posted outsized returns. Bonds registered more modest gains, led by credit-oriented investments. Income was the primary contributor to total returns for fixed income instruments, as prices came under pressure from concerns about persistent inflation, global conflicts, energy prices, and mounting government debt across the developed world.
TOP PERFORMANCE CONTRIBUTORS
Equity allocation | U.S. equities made a significant contribution to absolute performance, led by large cap equities. International developed market equities further helped results, as did emerging market stocks. Defensive equities also generated positive returns. The real assets portfolio was an additional contributor with strong returns for energy stocks and the metals & mining sector.
Bond funds | The fixed-income allocation contributed positively, led by intermediate-term bonds and emerging markets debt. Holdings in short-term bonds, high yield bonds, multi-sector bonds, short-term U.S. Treasury Inflation Protected Securities, and bank loans aided returns as well.
TOP PERFORMANCE DETRACTORS
Specific positions | At a time of positive returns for most segments of the financial markets, the majority of the fund’s holdings recorded a gain. However, small positions in U.S. Treasury STRIPS (Separate Trading of Registered Interest and Principal of Securities) were adversely affected by rising yields.
The views expressed in this report are those of the portfolio management team and are subject to change. They are not meant as investment advice.
Fund Performance
The following graph compares the initial and subsequent account values at the end of each of the most recently completed 10 fiscal years of the fund (or for the life of the fund, if shorter). It assumes a $1,000,000 initial investment in the fund and in an appropriate, broad-based securities market index for the same period.
GROWTH OF $1,000,000
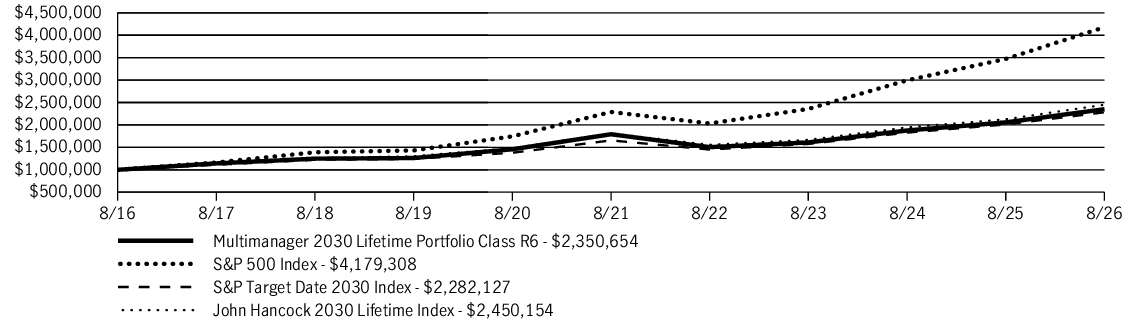
| AVERAGE ANNUAL TOTAL RETURN | 1 Year | 5 Years | 10 Years |
| Multimanager 2030 Lifetime Portfolio (Class R6/JLFIX) | 14.27% | 5.57% | 8.92% |
| S&P 500 Index | 20.38% | 12.79% | 15.37% |
| S&P Target Date 2030 Index | 13.47% | 6.63% | 8.60% |
| John Hancock 2030 Lifetime Index | 15.22% | 6.27% | 9.37% |
Fund Statistics
| Fund net assets | $1,086,197,376 |
| Total number of portfolio holdings | 92 |
| Total advisory fees paid (net) | $0 |
| Portfolio turnover rate | 21% |
Graphical Representation of Holdings
The table below shows the investment makeup of the fund, representing a percentage of the total net assets of the fund.
Asset Allocation
| Affiliated investment companies | 92.4% |
| Equity | 51.6% |
| International equity | 19.7% |
| U.S. large cap | 15.1% |
| Large blend | 10.6% |
| U.S. mid cap | 3.7% |
| Emerging-market equity | 2.1% |
| U.S. small cap | 0.4% |
| Fixed income | 36.6% |
| Intermediate bond | 20.6% |
| Short-term bond | 5.5% |
| Emerging-market debt | 3.7% |
| Multi-sector bond | 2.8% |
| High yield bond | 2.7% |
| Bank loan | 1.3% |
| Alternative and specialty | 4.2% |
| Sector equity | 3.7% |
| Absolute return | 0.5% |
| Unaffiliated investment companies | 3.9% |
| Equity | 3.9% |
| U.S. Government | 3.7% |
Holdings may not have been held by the fund for the entire period and are subject to change without notice. Portfolio composition is subject to review in accordance with the fund’s investment strategy and may vary in the future. Current and future portfolio holdings are subject to risk and may change at any time.
What were the fund costs during the last year ?
(Based on a hypothetical $10,000 investment)
| Fund (Class) | Costs of a $10,000 investment | Costs paid as a percentage of a $10,000 investment |
| Multimanager 2035 Lifetime Portfolio (Class R6/JLHIX) |
$0 | 0.00% |
Management’s Discussion of Fund Performance
SUMMARY OF RESULTS
Multimanager 2035 Lifetime Portfolio (Class R6/JLHIX) returned 16.23% for the year ended August 31, 2026. Global equities produced sizable gains in the 12-month period that ended on August 31, 2026. Investors were encouraged by the favorable combination of healthy economic growth trends, robust corporate earnings, and generally supportive central bank policies, together with optimism about artificial intelligence. While technology stocks performed very well, the value style outpaced growth on a global basis and contributed meaningfully to the markets’ strong showing. Emerging market equities also posted outsized returns. Bonds registered more modest gains, led by credit-oriented investments. Income was the primary contributor to total returns for fixed income instruments, as prices came under pressure from concerns about persistent inflation, global conflicts, energy prices, and mounting government debt across the developed world.
TOP PERFORMANCE CONTRIBUTORS
Equity allocation | U.S. equities made a significant contribution to absolute performance, led by large cap equities. International developed market equities further helped results, as did emerging market stocks. Defensive equities also generated positive returns. The real assets portfolio was an additional contributor with strong returns for energy stocks and the metals & mining sector.
Bond funds | The fixed-income allocation contributed positively, led by intermediate-term bonds and emerging markets debt. Holdings in high yield bonds and short-term bonds aided returns as well.
TOP PERFORMANCE DETRACTORS
Specific positions | At a time of positive returns for most segments of the financial markets, the majority of the fund’s holdings recorded a gain. However, small positions in international real estate investment trusts and U.S. Treasury STRIPS (Separate Trading of Registered Interest and Principal of Securities) were adversely affected by rising yields.
The views expressed in this report are those of the portfolio management team and are subject to change. They are not meant as investment advice.
Fund Performance
The following graph compares the initial and subsequent account values at the end of each of the most recently completed 10 fiscal years of the fund (or for the life of the fund, if shorter). It assumes a $1,000,000 initial investment in the fund and in an appropriate, broad-based securities market index for the same period.
GROWTH OF $1,000,000
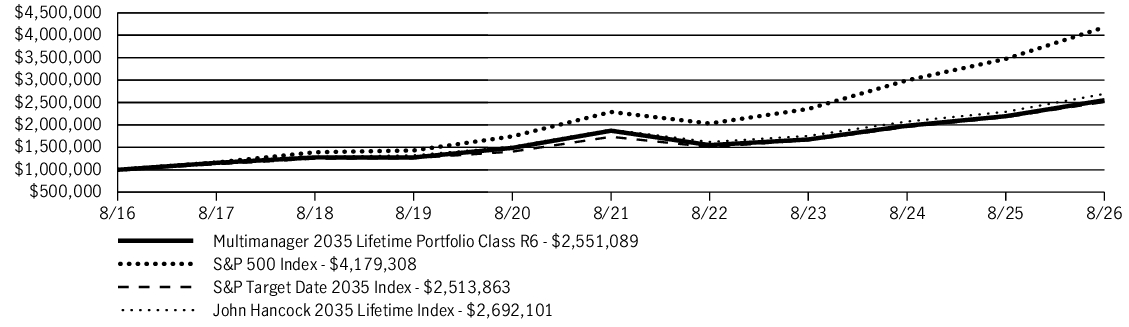
| AVERAGE ANNUAL TOTAL RETURN | 1 Year | 5 Years | 10 Years |
| Multimanager 2035 Lifetime Portfolio (Class R6/JLHIX) | 16.23% | 6.40% | 9.82% |
| S&P 500 Index | 20.38% | 12.79% | 15.37% |
| S&P Target Date 2035 Index | 15.65% | 7.70% | 9.66% |
| John Hancock 2035 Lifetime Index | 17.40% | 7.26% | 10.41% |
Fund Statistics
| Fund net assets | $1,190,623,703 |
| Total number of portfolio holdings | 92 |
| Total advisory fees paid (net) | $0 |
| Portfolio turnover rate | 22% |
Graphical Representation of Holdings
The table below shows the investment makeup of the fund, representing a percentage of the total net assets of the fund.
Asset Allocation
| Affiliated investment companies | 93.0% |
| Equity | 62.5% |
| International equity | 22.5% |
| U.S. large cap | 19.4% |
| Large blend | 12.5% |
| U.S. mid cap | 4.8% |
| Emerging-market equity | 2.7% |
| U.S. small cap | 0.6% |
| Fixed income | 27.1% |
| Intermediate bond | 17.3% |
| Short-term bond | 3.5% |
| Emerging-market debt | 3.0% |
| High yield bond | 2.1% |
| Multi-sector bond | 0.7% |
| Bank loan | 0.5% |
| Alternative and specialty | 3.4% |
| Sector equity | 2.9% |
| Absolute return | 0.5% |
| Unaffiliated investment companies | 5.0% |
| Equity | 5.0% |
| U.S. Government | 2.0% |
Holdings may not have been held by the fund for the entire period and are subject to change without notice. Portfolio composition is subject to review in accordance with the fund’s investment strategy and may vary in the future. Current and future portfolio holdings are subject to risk and may change at any time.
What were the fund costs during the last year ?
(Based on a hypothetical $10,000 investment)
| Fund (Class) | Costs of a $10,000 investment | Costs paid as a percentage of a $10,000 investment |
| Multimanager 2035 Lifetime Portfolio (Class R5/JLHHX) |
$5 | 0.05% |
Management’s Discussion of Fund Performance
SUMMARY OF RESULTS
Multimanager 2035 Lifetime Portfolio (Class R5/JLHHX) returned 16.25% for the year ended August 31, 2026. Global equities produced sizable gains in the 12-month period that ended on August 31, 2026. Investors were encouraged by the favorable combination of healthy economic growth trends, robust corporate earnings, and generally supportive central bank policies, together with optimism about artificial intelligence. While technology stocks performed very well, the value style outpaced growth on a global basis and contributed meaningfully to the markets’ strong showing. Emerging market equities also posted outsized returns. Bonds registered more modest gains, led by credit-oriented investments. Income was the primary contributor to total returns for fixed income instruments, as prices came under pressure from concerns about persistent inflation, global conflicts, energy prices, and mounting government debt across the developed world.
TOP PERFORMANCE CONTRIBUTORS
Equity allocation | U.S. equities made a significant contribution to absolute performance, led by large cap equities. International developed market equities further helped results, as did emerging market stocks. Defensive equities also generated positive returns. The real assets portfolio was an additional contributor with strong returns for energy stocks and the metals & mining sector.
Bond funds | The fixed-income allocation contributed positively, led by intermediate-term bonds and emerging markets debt. Holdings in high yield bonds and short-term bonds aided returns as well.
TOP PERFORMANCE DETRACTORS
Specific positions | At a time of positive returns for most segments of the financial markets, the majority of the fund’s holdings recorded a gain. However, small positions in international real estate investment trusts and U.S. Treasury STRIPS (Separate Trading of Registered Interest and Principal of Securities) were adversely affected by rising yields.
The views expressed in this report are those of the portfolio management team and are subject to change. They are not meant as investment advice.
Fund Performance
The following graph compares the initial and subsequent account values at the end of each of the most recently completed 10 fiscal years of the fund (or for the life of the fund, if shorter). It assumes a $10,000 initial investment in the fund and in an appropriate, broad-based securities market index for the same period.
GROWTH OF $10,000
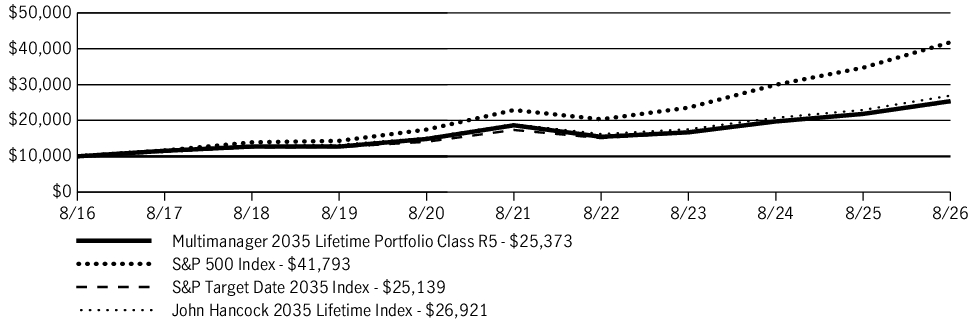
| AVERAGE ANNUAL TOTAL RETURN | 1 Year | 5 Years | 10 Years |
| Multimanager 2035 Lifetime Portfolio (Class R5/JLHHX) | 16.25% | 6.35% | 9.76% |
| S&P 500 Index | 20.38% | 12.79% | 15.37% |
| S&P Target Date 2035 Index | 15.65% | 7.70% | 9.66% |
| John Hancock 2035 Lifetime Index | 17.40% | 7.26% | 10.41% |
Fund Statistics
| Fund net assets | $1,190,623,703 |
| Total number of portfolio holdings | 92 |
| Total advisory fees paid (net) | $0 |
| Portfolio turnover rate | 22% |
Graphical Representation of Holdings
The table below shows the investment makeup of the fund, representing a percentage of the total net assets of the fund.
Asset Allocation
| Affiliated investment companies | 93.0% |
| Equity | 62.5% |
| International equity | 22.5% |
| U.S. large cap | 19.4% |
| Large blend | 12.5% |
| U.S. mid cap | 4.8% |
| Emerging-market equity | 2.7% |
| U.S. small cap | 0.6% |
| Fixed income | 27.1% |
| Intermediate bond | 17.3% |
| Short-term bond | 3.5% |
| Emerging-market debt | 3.0% |
| High yield bond | 2.1% |
| Multi-sector bond | 0.7% |
| Bank loan | 0.5% |
| Alternative and specialty | 3.4% |
| Sector equity | 2.9% |
| Absolute return | 0.5% |
| Unaffiliated investment companies | 5.0% |
| Equity | 5.0% |
| U.S. Government | 2.0% |
Holdings may not have been held by the fund for the entire period and are subject to change without notice. Portfolio composition is subject to review in accordance with the fund’s investment strategy and may vary in the future. Current and future portfolio holdings are subject to risk and may change at any time.
What were the fund costs during the last year ?
(Based on a hypothetical $10,000 investment)
| Fund (Class) | Costs of a $10,000 investment | Costs paid as a percentage of a $10,000 investment |
| Multimanager 2035 Lifetime Portfolio (Class R4/JLHGX) |
$28 | 0.26% |
Management’s Discussion of Fund Performance
SUMMARY OF RESULTS
Multimanager 2035 Lifetime Portfolio (Class R4/JLHGX) returned 16.00% for the year ended August 31, 2026. Global equities produced sizable gains in the 12-month period that ended on August 31, 2026. Investors were encouraged by the favorable combination of healthy economic growth trends, robust corporate earnings, and generally supportive central bank policies, together with optimism about artificial intelligence. While technology stocks performed very well, the value style outpaced growth on a global basis and contributed meaningfully to the markets’ strong showing. Emerging market equities also posted outsized returns. Bonds registered more modest gains, led by credit-oriented investments. Income was the primary contributor to total returns for fixed income instruments, as prices came under pressure from concerns about persistent inflation, global conflicts, energy prices, and mounting government debt across the developed world.
TOP PERFORMANCE CONTRIBUTORS
Equity allocation | U.S. equities made a significant contribution to absolute performance, led by large cap equities. International developed market equities further helped results, as did emerging market stocks. Defensive equities also generated positive returns. The real assets portfolio was an additional contributor with strong returns for energy stocks and the metals & mining sector.
Bond funds | The fixed-income allocation contributed positively, led by intermediate-term bonds and emerging markets debt. Holdings in high yield bonds and short-term bonds aided returns as well.
TOP PERFORMANCE DETRACTORS
Specific positions | At a time of positive returns for most segments of the financial markets, the majority of the fund’s holdings recorded a gain. However, small positions in international real estate investment trusts and U.S. Treasury STRIPS (Separate Trading of Registered Interest and Principal of Securities) were adversely affected by rising yields.
The views expressed in this report are those of the portfolio management team and are subject to change. They are not meant as investment advice.
Fund Performance
The following graph compares the initial and subsequent account values at the end of each of the most recently completed 10 fiscal years of the fund (or for the life of the fund, if shorter). It assumes a $10,000 initial investment in the fund and in an appropriate, broad-based securities market index for the same period.
GROWTH OF $10,000
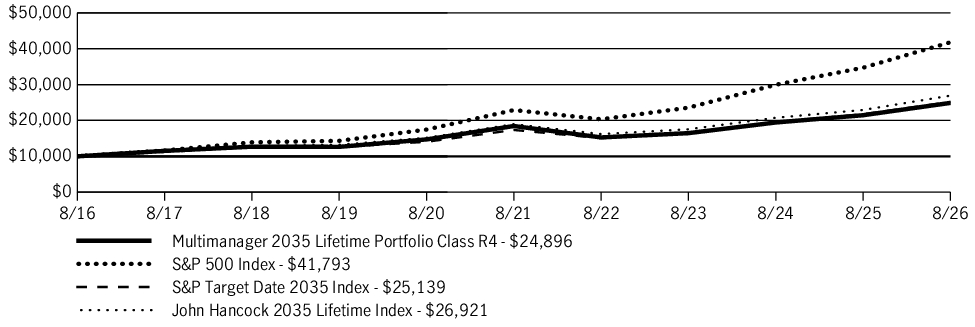
| AVERAGE ANNUAL TOTAL RETURN | 1 Year | 5 Years | 10 Years |
| Multimanager 2035 Lifetime Portfolio (Class R4/JLHGX) | 16.00% | 6.18% | 9.55% |
| S&P 500 Index | 20.38% | 12.79% | 15.37% |
| S&P Target Date 2035 Index | 15.65% | 7.70% | 9.66% |
| John Hancock 2035 Lifetime Index | 17.40% | 7.26% | 10.41% |
Fund Statistics
| Fund net assets | $1,190,623,703 |
| Total number of portfolio holdings | 92 |
| Total advisory fees paid (net) | $0 |
| Portfolio turnover rate | 22% |
Graphical Representation of Holdings
The table below shows the investment makeup of the fund, representing a percentage of the total net assets of the fund.
Asset Allocation
| Affiliated investment companies | 93.0% |
| Equity | 62.5% |
| International equity | 22.5% |
| U.S. large cap | 19.4% |
| Large blend | 12.5% |
| U.S. mid cap | 4.8% |
| Emerging-market equity | 2.7% |
| U.S. small cap | 0.6% |
| Fixed income | 27.1% |
| Intermediate bond | 17.3% |
| Short-term bond | 3.5% |
| Emerging-market debt | 3.0% |
| High yield bond | 2.1% |
| Multi-sector bond | 0.7% |
| Bank loan | 0.5% |
| Alternative and specialty | 3.4% |
| Sector equity | 2.9% |
| Absolute return | 0.5% |
| Unaffiliated investment companies | 5.0% |
| Equity | 5.0% |
| U.S. Government | 2.0% |
Holdings may not have been held by the fund for the entire period and are subject to change without notice. Portfolio composition is subject to review in accordance with the fund’s investment strategy and may vary in the future. Current and future portfolio holdings are subject to risk and may change at any time.
What were the fund costs during the last year ?
(Based on a hypothetical $10,000 investment)
| Fund (Class) | Costs of a $10,000 investment | Costs paid as a percentage of a $10,000 investment |
| Multimanager 2035 Lifetime Portfolio (Class R2/JLHEX) |
$54 | 0.50% |
Management’s Discussion of Fund Performance
SUMMARY OF RESULTS
Multimanager 2035 Lifetime Portfolio (Class R2/JLHEX) returned 15.74% for the year ended August 31, 2026. Global equities produced sizable gains in the 12-month period that ended on August 31, 2026. Investors were encouraged by the favorable combination of healthy economic growth trends, robust corporate earnings, and generally supportive central bank policies, together with optimism about artificial intelligence. While technology stocks performed very well, the value style outpaced growth on a global basis and contributed meaningfully to the markets’ strong showing. Emerging market equities also posted outsized returns. Bonds registered more modest gains, led by credit-oriented investments. Income was the primary contributor to total returns for fixed income instruments, as prices came under pressure from concerns about persistent inflation, global conflicts, energy prices, and mounting government debt across the developed world.
TOP PERFORMANCE CONTRIBUTORS
Equity allocation | U.S. equities made a significant contribution to absolute performance, led by large cap equities. International developed market equities further helped results, as did emerging market stocks. Defensive equities also generated positive returns. The real assets portfolio was an additional contributor with strong returns for energy stocks and the metals & mining sector.
Bond funds | The fixed-income allocation contributed positively, led by intermediate-term bonds and emerging markets debt. Holdings in high yield bonds and short-term bonds aided returns as well.
TOP PERFORMANCE DETRACTORS
Specific positions | At a time of positive returns for most segments of the financial markets, the majority of the fund’s holdings recorded a gain. However, small positions in international real estate investment trusts and U.S. Treasury STRIPS (Separate Trading of Registered Interest and Principal of Securities) were adversely affected by rising yields.
The views expressed in this report are those of the portfolio management team and are subject to change. They are not meant as investment advice.
Fund Performance
The following graph compares the initial and subsequent account values at the end of each of the most recently completed 10 fiscal years of the fund (or for the life of the fund, if shorter). It assumes a $10,000 initial investment in the fund and in an appropriate, broad-based securities market index for the same period.
GROWTH OF $10,000
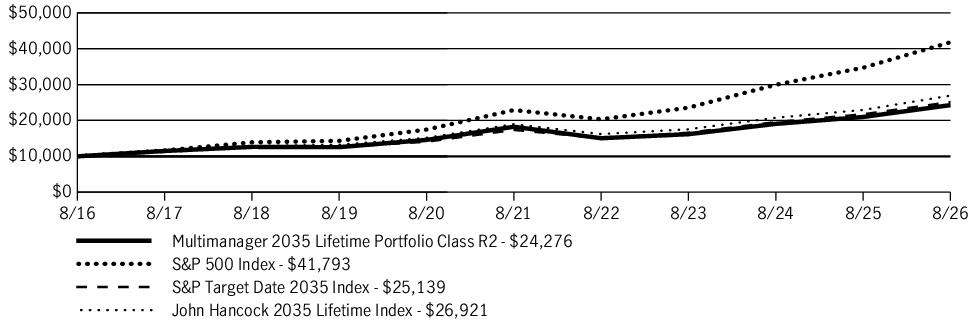
| AVERAGE ANNUAL TOTAL RETURN | 1 Year | 5 Years | 10 Years |
| Multimanager 2035 Lifetime Portfolio (Class R2/JLHEX) | 15.74% | 5.88% | 9.27% |
| S&P 500 Index | 20.38% | 12.79% | 15.37% |
| S&P Target Date 2035 Index | 15.65% | 7.70% | 9.66% |
| John Hancock 2035 Lifetime Index | 17.40% | 7.26% | 10.41% |
Fund Statistics
| Fund net assets | $1,190,623,703 |
| Total number of portfolio holdings | 92 |
| Total advisory fees paid (net) | $0 |
| Portfolio turnover rate | 22% |
Graphical Representation of Holdings
The table below shows the investment makeup of the fund, representing a percentage of the total net assets of the fund.
Asset Allocation
| Affiliated investment companies | 93.0% |
| Equity | 62.5% |
| International equity | 22.5% |
| U.S. large cap | 19.4% |
| Large blend | 12.5% |
| U.S. mid cap | 4.8% |
| Emerging-market equity | 2.7% |
| U.S. small cap | 0.6% |
| Fixed income | 27.1% |
| Intermediate bond | 17.3% |
| Short-term bond | 3.5% |
| Emerging-market debt | 3.0% |
| High yield bond | 2.1% |
| Multi-sector bond | 0.7% |
| Bank loan | 0.5% |
| Alternative and specialty | 3.4% |
| Sector equity | 2.9% |
| Absolute return | 0.5% |
| Unaffiliated investment companies | 5.0% |
| Equity | 5.0% |
| U.S. Government | 2.0% |
Holdings may not have been held by the fund for the entire period and are subject to change without notice. Portfolio composition is subject to review in accordance with the fund’s investment strategy and may vary in the future. Current and future portfolio holdings are subject to risk and may change at any time.
What were the fund costs during the last year ?
(Based on a hypothetical $10,000 investment)
| Fund (Class) | Costs of a $10,000 investment | Costs paid as a percentage of a $10,000 investment |
| Multimanager 2035 Lifetime Portfolio (Class I/JHRMX) |
$12 | 0.11% |
Management’s Discussion of Fund Performance
SUMMARY OF RESULTS
Multimanager 2035 Lifetime Portfolio (Class I/JHRMX) returned 16.20% for the year ended August 31, 2026. Global equities produced sizable gains in the 12-month period that ended on August 31, 2026. Investors were encouraged by the favorable combination of healthy economic growth trends, robust corporate earnings, and generally supportive central bank policies, together with optimism about artificial intelligence. While technology stocks performed very well, the value style outpaced growth on a global basis and contributed meaningfully to the markets’ strong showing. Emerging market equities also posted outsized returns. Bonds registered more modest gains, led by credit-oriented investments. Income was the primary contributor to total returns for fixed income instruments, as prices came under pressure from concerns about persistent inflation, global conflicts, energy prices, and mounting government debt across the developed world.
TOP PERFORMANCE CONTRIBUTORS
Equity allocation | U.S. equities made a significant contribution to absolute performance, led by large cap equities. International developed market equities further helped results, as did emerging market stocks. Defensive equities also generated positive returns. The real assets portfolio was an additional contributor with strong returns for energy stocks and the metals & mining sector.
Bond funds | The fixed-income allocation contributed positively, led by intermediate-term bonds and emerging markets debt. Holdings in high yield bonds and short-term bonds aided returns as well.
TOP PERFORMANCE DETRACTORS
Specific positions | At a time of positive returns for most segments of the financial markets, the majority of the fund’s holdings recorded a gain. However, small positions in international real estate investment trusts and U.S. Treasury STRIPS (Separate Trading of Registered Interest and Principal of Securities) were adversely affected by rising yields.
The views expressed in this report are those of the portfolio management team and are subject to change. They are not meant as investment advice.
Fund Performance
The following graph compares the initial and subsequent account values at the end of each of the most recently completed 10 fiscal years of the fund (or for the life of the fund, if shorter). It assumes a $250,000 initial investment in the fund and in an appropriate, broad-based securities market index for the same period.
GROWTH OF $250,000
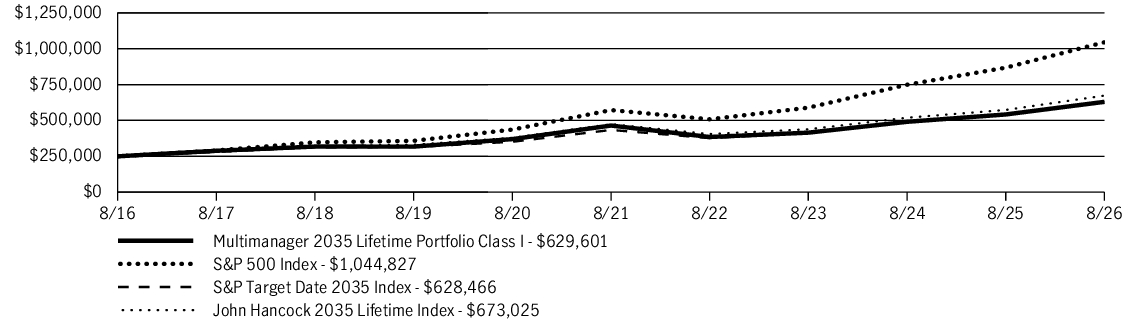
| AVERAGE ANNUAL TOTAL RETURN | 1 Year | 5 Years | 10 Years |
| Multimanager 2035 Lifetime Portfolio (Class I/JHRMX) | 16.20% | 6.27% | 9.68% |
| S&P 500 Index | 20.38% | 12.79% | 15.37% |
| S&P Target Date 2035 Index | 15.65% | 7.70% | 9.66% |
| John Hancock 2035 Lifetime Index | 17.40% | 7.26% | 10.41% |
Fund Statistics
| Fund net assets | $1,190,623,703 |
| Total number of portfolio holdings | 92 |
| Total advisory fees paid (net) | $0 |
| Portfolio turnover rate | 22% |
Graphical Representation of Holdings
The table below shows the investment makeup of the fund, representing a percentage of the total net assets of the fund.
Asset Allocation
| Affiliated investment companies | 93.0% |
| Equity | 62.5% |
| International equity | 22.5% |
| U.S. large cap | 19.4% |
| Large blend | 12.5% |
| U.S. mid cap | 4.8% |
| Emerging-market equity | 2.7% |
| U.S. small cap | 0.6% |
| Fixed income | 27.1% |
| Intermediate bond | 17.3% |
| Short-term bond | 3.5% |
| Emerging-market debt | 3.0% |
| High yield bond | 2.1% |
| Multi-sector bond | 0.7% |
| Bank loan | 0.5% |
| Alternative and specialty | 3.4% |
| Sector equity | 2.9% |
| Absolute return | 0.5% |
| Unaffiliated investment companies | 5.0% |
| Equity | 5.0% |
| U.S. Government | 2.0% |
Holdings may not have been held by the fund for the entire period and are subject to change without notice. Portfolio composition is subject to review in accordance with the fund’s investment strategy and may vary in the future. Current and future portfolio holdings are subject to risk and may change at any time.
What were the fund costs during the last year ?
(Based on a hypothetical $10,000 investment)
| Fund (Class) | Costs of a $10,000 investment | Costs paid as a percentage of a $10,000 investment |
| Multimanager 2035 Lifetime Portfolio (Class A/JLHAX) |
$44 | 0.41% |
Management’s Discussion of Fund Performance
SUMMARY OF RESULTS
Multimanager 2035 Lifetime Portfolio (Class A/JLHAX) returned 15.77% (excluding sales charges) for the year ended August 31, 2026. Global equities produced sizable gains in the 12-month period that ended on August 31, 2026. Investors were encouraged by the favorable combination of healthy economic growth trends, robust corporate earnings, and generally supportive central bank policies, together with optimism about artificial intelligence. While technology stocks performed very well, the value style outpaced growth on a global basis and contributed meaningfully to the markets’ strong showing. Emerging market equities also posted outsized returns. Bonds registered more modest gains, led by credit-oriented investments. Income was the primary contributor to total returns for fixed income instruments, as prices came under pressure from concerns about persistent inflation, global conflicts, energy prices, and mounting government debt across the developed world.
TOP PERFORMANCE CONTRIBUTORS
Equity allocation | U.S. equities made a significant contribution to absolute performance, led by large cap equities. International developed market equities further helped results, as did emerging market stocks. Defensive equities also generated positive returns. The real assets portfolio was an additional contributor with strong returns for energy stocks and the metals & mining sector.
Bond funds | The fixed-income allocation contributed positively, led by intermediate-term bonds and emerging markets debt. Holdings in high yield bonds and short-term bonds aided returns as well.
TOP PERFORMANCE DETRACTORS
Specific positions | At a time of positive returns for most segments of the financial markets, the majority of the fund’s holdings recorded a gain. However, small positions in international real estate investment trusts and U.S. Treasury STRIPS (Separate Trading of Registered Interest and Principal of Securities) were adversely affected by rising yields.
The views expressed in this report are those of the portfolio management team and are subject to change. They are not meant as investment advice.
Fund Performance
The following graph compares the initial and subsequent account values at the end of each of the most recently completed 10 fiscal years of the fund (or for the life of the fund, if shorter). It assumes a $10,000 initial investment in the fund and in an appropriate, broad-based securities market index for the same period.
GROWTH OF $10,000
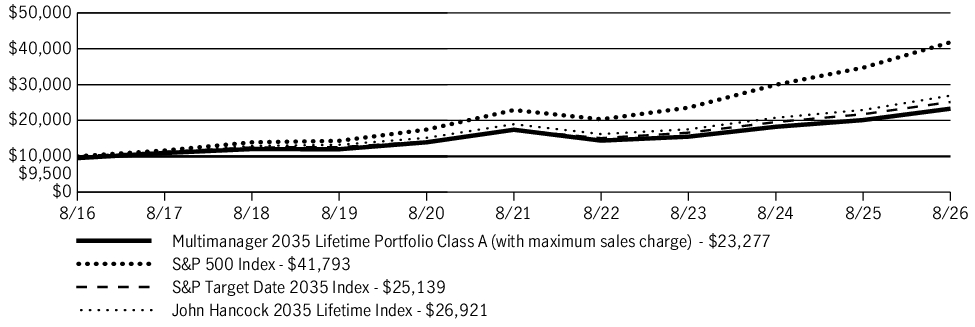
| AVERAGE ANNUAL TOTAL RETURN | 1 Year | 5 Years | 10 Years |
| Multimanager 2035 Lifetime Portfolio (Class A/JLHAX) | 9.97% | 4.90% | 8.82% |
| Multimanager 2035 Lifetime Portfolio (Class A/JLHAX)—excluding sales charge | 15.77% | 5.99% | 9.38% |
| S&P 500 Index | 20.38% | 12.79% | 15.37% |
| S&P Target Date 2035 Index | 15.65% | 7.70% | 9.66% |
| John Hancock 2035 Lifetime Index | 17.40% | 7.26% | 10.41% |
Fund Statistics
| Fund net assets | $1,190,623,703 |
| Total number of portfolio holdings | 92 |
| Total advisory fees paid (net) | $0 |
| Portfolio turnover rate | 22% |
Graphical Representation of Holdings
The table below shows the investment makeup of the fund, representing a percentage of the total net assets of the fund.
Asset Allocation
| Affiliated investment companies | 93.0% |
| Equity | 62.5% |
| International equity | 22.5% |
| U.S. large cap | 19.4% |
| Large blend | 12.5% |
| U.S. mid cap | 4.8% |
| Emerging-market equity | 2.7% |
| U.S. small cap | 0.6% |
| Fixed income | 27.1% |
| Intermediate bond | 17.3% |
| Short-term bond | 3.5% |
| Emerging-market debt | 3.0% |
| High yield bond | 2.1% |
| Multi-sector bond | 0.7% |
| Bank loan | 0.5% |
| Alternative and specialty | 3.4% |
| Sector equity | 2.9% |
| Absolute return | 0.5% |
| Unaffiliated investment companies | 5.0% |
| Equity | 5.0% |
| U.S. Government | 2.0% |
Holdings may not have been held by the fund for the entire period and are subject to change without notice. Portfolio composition is subject to review in accordance with the fund’s investment strategy and may vary in the future. Current and future portfolio holdings are subject to risk and may change at any time.
What were the fund costs during the last year ?
(Based on a hypothetical $10,000 investment)
| Fund (Class) | Costs of a $10,000 investment | Costs paid as a percentage of a $10,000 investment |
| Multimanager 2035 Lifetime Portfolio (Class 1/JLHOX) |
$5 | 0.05% |
Management’s Discussion of Fund Performance
SUMMARY OF RESULTS
Multimanager 2035 Lifetime Portfolio (Class 1/JLHOX) returned 16.25% for the year ended August 31, 2026. Global equities produced sizable gains in the 12-month period that ended on August 31, 2026. Investors were encouraged by the favorable combination of healthy economic growth trends, robust corporate earnings, and generally supportive central bank policies, together with optimism about artificial intelligence. While technology stocks performed very well, the value style outpaced growth on a global basis and contributed meaningfully to the markets’ strong showing. Emerging market equities also posted outsized returns. Bonds registered more modest gains, led by credit-oriented investments. Income was the primary contributor to total returns for fixed income instruments, as prices came under pressure from concerns about persistent inflation, global conflicts, energy prices, and mounting government debt across the developed world.
TOP PERFORMANCE CONTRIBUTORS
Equity allocation | U.S. equities made a significant contribution to absolute performance, led by large cap equities. International developed market equities further helped results, as did emerging market stocks. Defensive equities also generated positive returns. The real assets portfolio was an additional contributor with strong returns for energy stocks and the metals & mining sector.
Bond funds | The fixed-income allocation contributed positively, led by intermediate-term bonds and emerging markets debt. Holdings in high yield bonds and short-term bonds aided returns as well.
TOP PERFORMANCE DETRACTORS
Specific positions | At a time of positive returns for most segments of the financial markets, the majority of the fund’s holdings recorded a gain. However, small positions in international real estate investment trusts and U.S. Treasury STRIPS (Separate Trading of Registered Interest and Principal of Securities) were adversely affected by rising yields.
The views expressed in this report are those of the portfolio management team and are subject to change. They are not meant as investment advice.
Fund Performance
The following graph compares the initial and subsequent account values at the end of each of the most recently completed 10 fiscal years of the fund (or for the life of the fund, if shorter). It assumes a $10,000 initial investment in the fund and in an appropriate, broad-based securities market index for the same period.
GROWTH OF $10,000
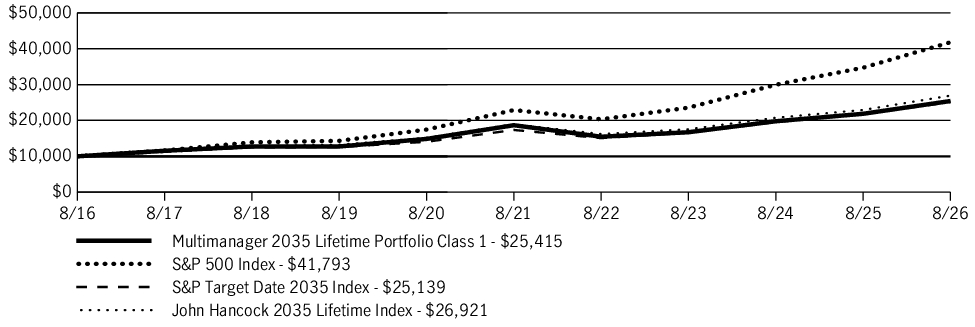
| AVERAGE ANNUAL TOTAL RETURN | 1 Year | 5 Years | 10 Years |
| Multimanager 2035 Lifetime Portfolio (Class 1/JLHOX) | 16.25% | 6.36% | 9.78% |
| S&P 500 Index | 20.38% | 12.79% | 15.37% |
| S&P Target Date 2035 Index | 15.65% | 7.70% | 9.66% |
| John Hancock 2035 Lifetime Index | 17.40% | 7.26% | 10.41% |
Fund Statistics
| Fund net assets | $1,190,623,703 |
| Total number of portfolio holdings | 92 |
| Total advisory fees paid (net) | $0 |
| Portfolio turnover rate | 22% |
Graphical Representation of Holdings
The table below shows the investment makeup of the fund, representing a percentage of the total net assets of the fund.
Asset Allocation
| Affiliated investment companies | 93.0% |
| Equity | 62.5% |
| International equity | 22.5% |
| U.S. large cap | 19.4% |
| Large blend | 12.5% |
| U.S. mid cap | 4.8% |
| Emerging-market equity | 2.7% |
| U.S. small cap | 0.6% |
| Fixed income | 27.1% |
| Intermediate bond | 17.3% |
| Short-term bond | 3.5% |
| Emerging-market debt | 3.0% |
| High yield bond | 2.1% |
| Multi-sector bond | 0.7% |
| Bank loan | 0.5% |
| Alternative and specialty | 3.4% |
| Sector equity | 2.9% |
| Absolute return | 0.5% |
| Unaffiliated investment companies | 5.0% |
| Equity | 5.0% |
| U.S. Government | 2.0% |
Holdings may not have been held by the fund for the entire period and are subject to change without notice. Portfolio composition is subject to review in accordance with the fund’s investment strategy and may vary in the future. Current and future portfolio holdings are subject to risk and may change at any time.
What were the fund costs during the last year ?
(Based on a hypothetical $10,000 investment)
| Fund (Class) | Costs of a $10,000 investment | Costs paid as a percentage of a $10,000 investment |
| Multimanager 2040 Lifetime Portfolio (Class 1/JLIOX) |
$5 | 0.05% |
Management’s Discussion of Fund Performance
SUMMARY OF RESULTS
Multimanager 2040 Lifetime Portfolio (Class 1/JLIOX) returned 17.89% for the year ended August 31, 2026. Global equities produced sizable gains in the 12-month period that ended on August 31, 2026. Investors were encouraged by the favorable combination of healthy economic growth trends, robust corporate earnings, and generally supportive central bank policies, together with optimism about artificial intelligence. While technology stocks performed very well, the value style outpaced growth on a global basis and contributed meaningfully to the markets’ strong showing. Emerging market equities also posted outsized returns. Bonds registered more modest gains, led by credit-oriented investments. Income was the primary contributor to total returns for fixed income instruments, as prices came under pressure from concerns about persistent inflation, global conflicts, energy prices, and mounting government debt across the developed world.
TOP PERFORMANCE CONTRIBUTORS
Equity allocation | U.S. equities made a significant contribution to absolute performance, led by large cap equities. International developed market equities further helped results, as did emerging market stocks. Defensive equities also generated positive returns. The real assets portfolio was an additional contributor with strong returns for energy stocks and the metals & mining sector.
Bond funds | The fixed-income allocation contributed positively, led by intermediate-term bonds and emerging markets debt. Holdings in high yield bonds and short-term bonds aided returns as well.
TOP PERFORMANCE DETRACTORS
Specific positions | At a time of positive returns for most segments of the financial markets, the majority of the fund’s holdings recorded a gain. However, small positions in international real estate investment trusts and U.S. Treasury STRIPS (Separate Trading of Registered Interest and Principal of Securities) were adversely affected by rising yields.
The views expressed in this report are those of the portfolio management team and are subject to change. They are not meant as investment advice.
Fund Performance
The following graph compares the initial and subsequent account values at the end of each of the most recently completed 10 fiscal years of the fund (or for the life of the fund, if shorter). It assumes a $10,000 initial investment in the fund and in an appropriate, broad-based securities market index for the same period.
GROWTH OF $10,000
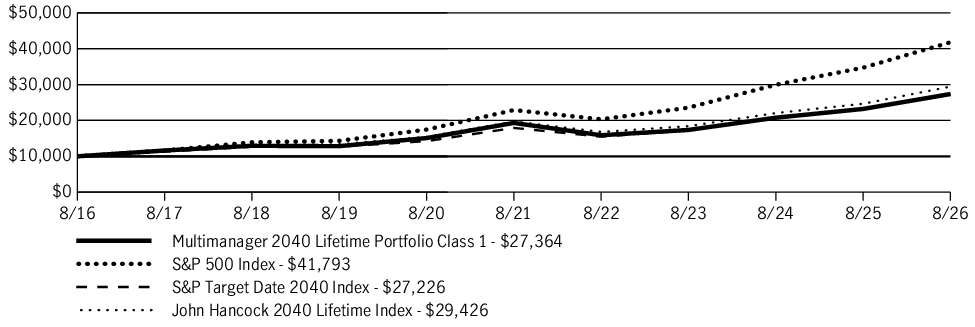
| AVERAGE ANNUAL TOTAL RETURN | 1 Year | 5 Years | 10 Years |
| Multimanager 2040 Lifetime Portfolio (Class 1/JLIOX) | 17.89% | 7.22% | 10.59% |
| S&P 500 Index | 20.38% | 12.79% | 15.37% |
| S&P Target Date 2040 Index | 17.78% | 8.72% | 10.53% |
| John Hancock 2040 Lifetime Index | 19.30% | 8.33% | 11.39% |
Fund Statistics
| Fund net assets | $1,058,913,843 |
| Total number of portfolio holdings | 87 |
| Total advisory fees paid (net) | $0 |
| Portfolio turnover rate | 22% |
Graphical Representation of Holdings
The table below shows the investment makeup of the fund, representing a percentage of the total net assets of the fund.
Asset Allocation
| Affiliated investment companies | 93.8% |
| Equity | 72.4% |
| International equity | 25.2% |
| U.S. large cap | 22.7% |
| Large blend | 14.5% |
| U.S. mid cap | 6.0% |
| Emerging-market equity | 3.1% |
| U.S. small cap | 0.9% |
| Fixed income | 19.0% |
| Intermediate bond | 11.9% |
| Short-term bond | 2.7% |
| Emerging-market debt | 2.3% |
| High yield bond | 1.6% |
| Multi-sector bond | 0.5% |
| Alternative and specialty | 2.4% |
| Sector equity | 1.9% |
| Absolute return | 0.5% |
| Unaffiliated investment companies | 5.4% |
| Equity | 5.4% |
| U.S. Government | 0.8% |
Holdings may not have been held by the fund for the entire period and are subject to change without notice. Portfolio composition is subject to review in accordance with the fund’s investment strategy and may vary in the future. Current and future portfolio holdings are subject to risk and may change at any time.
What were the fund costs during the last year ?
(Based on a hypothetical $10,000 investment)
| Fund (Class) | Costs of a $10,000 investment | Costs paid as a percentage of a $10,000 investment |
| Multimanager 2040 Lifetime Portfolio (Class A/JLIAX) |
$45 | 0.41% |
Management’s Discussion of Fund Performance
SUMMARY OF RESULTS
Multimanager 2040 Lifetime Portfolio (Class A/JLIAX) returned 17.49% (excluding sales charges) for the year ended August 31, 2026. Global equities produced sizable gains in the 12-month period that ended on August 31, 2026. Investors were encouraged by the favorable combination of healthy economic growth trends, robust corporate earnings, and generally supportive central bank policies, together with optimism about artificial intelligence. While technology stocks performed very well, the value style outpaced growth on a global basis and contributed meaningfully to the markets’ strong showing. Emerging market equities also posted outsized returns. Bonds registered more modest gains, led by credit-oriented investments. Income was the primary contributor to total returns for fixed income instruments, as prices came under pressure from concerns about persistent inflation, global conflicts, energy prices, and mounting government debt across the developed world.
TOP PERFORMANCE CONTRIBUTORS
Equity allocation | U.S. equities made a significant contribution to absolute performance, led by large cap equities. International developed market equities further helped results, as did emerging market stocks. Defensive equities also generated positive returns. The real assets portfolio was an additional contributor with strong returns for energy stocks and the metals & mining sector.
Bond funds | The fixed-income allocation contributed positively, led by intermediate-term bonds and emerging markets debt. Holdings in high yield bonds and short-term bonds aided returns as well.
TOP PERFORMANCE DETRACTORS
Specific positions | At a time of positive returns for most segments of the financial markets, the majority of the fund’s holdings recorded a gain. However, small positions in international real estate investment trusts and U.S. Treasury STRIPS (Separate Trading of Registered Interest and Principal of Securities) were adversely affected by rising yields.
The views expressed in this report are those of the portfolio management team and are subject to change. They are not meant as investment advice.
Fund Performance
The following graph compares the initial and subsequent account values at the end of each of the most recently completed 10 fiscal years of the fund (or for the life of the fund, if shorter). It assumes a $10,000 initial investment in the fund and in an appropriate, broad-based securities market index for the same period.
GROWTH OF $10,000
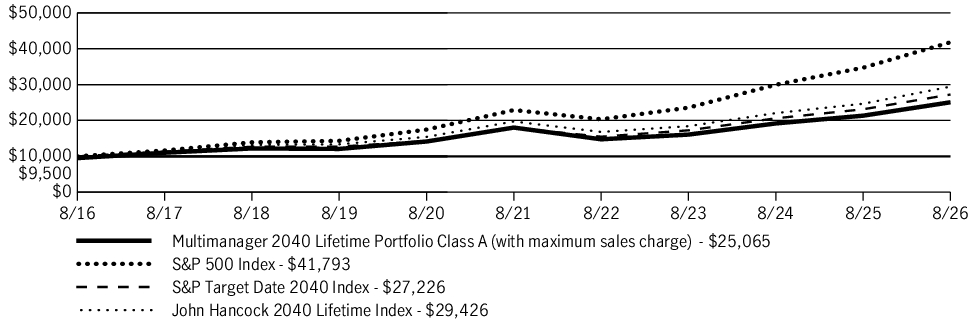
| AVERAGE ANNUAL TOTAL RETURN | 1 Year | 5 Years | 10 Years |
| Multimanager 2040 Lifetime Portfolio (Class A/JLIAX) | 11.63% | 5.74% | 9.62% |
| Multimanager 2040 Lifetime Portfolio (Class A/JLIAX)—excluding sales charge | 17.49% | 6.83% | 10.19% |
| S&P 500 Index | 20.38% | 12.79% | 15.37% |
| S&P Target Date 2040 Index | 17.78% | 8.72% | 10.53% |
| John Hancock 2040 Lifetime Index | 19.30% | 8.33% | 11.39% |
Fund Statistics
| Fund net assets | $1,058,913,843 |
| Total number of portfolio holdings | 87 |
| Total advisory fees paid (net) | $0 |
| Portfolio turnover rate | 22% |
Graphical Representation of Holdings
The table below shows the investment makeup of the fund, representing a percentage of the total net assets of the fund.
Asset Allocation
| Affiliated investment companies | 93.8% |
| Equity | 72.4% |
| International equity | 25.2% |
| U.S. large cap | 22.7% |
| Large blend | 14.5% |
| U.S. mid cap | 6.0% |
| Emerging-market equity | 3.1% |
| U.S. small cap | 0.9% |
| Fixed income | 19.0% |
| Intermediate bond | 11.9% |
| Short-term bond | 2.7% |
| Emerging-market debt | 2.3% |
| High yield bond | 1.6% |
| Multi-sector bond | 0.5% |
| Alternative and specialty | 2.4% |
| Sector equity | 1.9% |
| Absolute return | 0.5% |
| Unaffiliated investment companies | 5.4% |
| Equity | 5.4% |
| U.S. Government | 0.8% |
Holdings may not have been held by the fund for the entire period and are subject to change without notice. Portfolio composition is subject to review in accordance with the fund’s investment strategy and may vary in the future. Current and future portfolio holdings are subject to risk and may change at any time.
What were the fund costs during the last year ?
(Based on a hypothetical $10,000 investment)
| Fund (Class) | Costs of a $10,000 investment | Costs paid as a percentage of a $10,000 investment |
| Multimanager 2040 Lifetime Portfolio (Class I/JHRDX) |
$12 | 0.11% |
Management’s Discussion of Fund Performance
SUMMARY OF RESULTS
Multimanager 2040 Lifetime Portfolio (Class I/JHRDX) returned 17.90% for the year ended August 31, 2026. Global equities produced sizable gains in the 12-month period that ended on August 31, 2026. Investors were encouraged by the favorable combination of healthy economic growth trends, robust corporate earnings, and generally supportive central bank policies, together with optimism about artificial intelligence. While technology stocks performed very well, the value style outpaced growth on a global basis and contributed meaningfully to the markets’ strong showing. Emerging market equities also posted outsized returns. Bonds registered more modest gains, led by credit-oriented investments. Income was the primary contributor to total returns for fixed income instruments, as prices came under pressure from concerns about persistent inflation, global conflicts, energy prices, and mounting government debt across the developed world.
TOP PERFORMANCE CONTRIBUTORS
Equity allocation | U.S. equities made a significant contribution to absolute performance, led by large cap equities. International developed market equities further helped results, as did emerging market stocks. Defensive equities also generated positive returns. The real assets portfolio was an additional contributor with strong returns for energy stocks and the metals & mining sector.
Bond funds | The fixed-income allocation contributed positively, led by intermediate-term bonds and emerging markets debt. Holdings in high yield bonds and short-term bonds aided returns as well.
TOP PERFORMANCE DETRACTORS
Specific positions | At a time of positive returns for most segments of the financial markets, the majority of the fund’s holdings recorded a gain. However, small positions in international real estate investment trusts and U.S. Treasury STRIPS (Separate Trading of Registered Interest and Principal of Securities) were adversely affected by rising yields.
The views expressed in this report are those of the portfolio management team and are subject to change. They are not meant as investment advice.
Fund Performance
The following graph compares the initial and subsequent account values at the end of each of the most recently completed 10 fiscal years of the fund (or for the life of the fund, if shorter). It assumes a $250,000 initial investment in the fund and in an appropriate, broad-based securities market index for the same period.
GROWTH OF $250,000
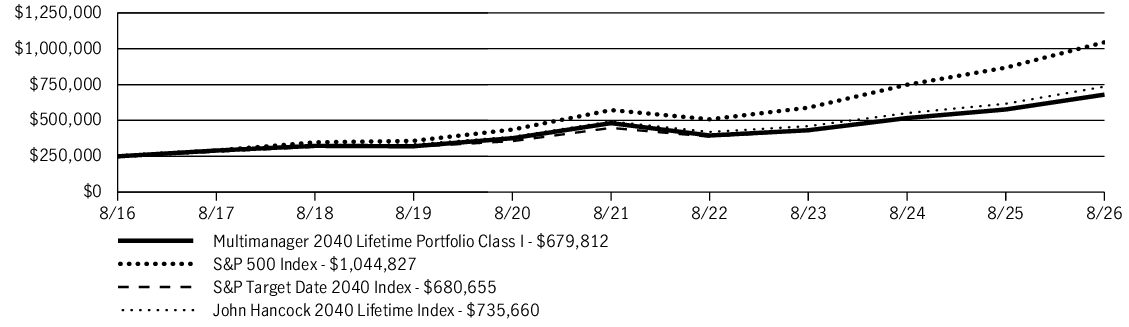
| AVERAGE ANNUAL TOTAL RETURN | 1 Year | 5 Years | 10 Years |
| Multimanager 2040 Lifetime Portfolio (Class I/JHRDX) | 17.90% | 7.15% | 10.52% |
| S&P 500 Index | 20.38% | 12.79% | 15.37% |
| S&P Target Date 2040 Index | 17.78% | 8.72% | 10.53% |
| John Hancock 2040 Lifetime Index | 19.30% | 8.33% | 11.39% |
Fund Statistics
| Fund net assets | $1,058,913,843 |
| Total number of portfolio holdings | 87 |
| Total advisory fees paid (net) | $0 |
| Portfolio turnover rate | 22% |
Graphical Representation of Holdings
The table below shows the investment makeup of the fund, representing a percentage of the total net assets of the fund.
Asset Allocation
| Affiliated investment companies | 93.8% |
| Equity | 72.4% |
| International equity | 25.2% |
| U.S. large cap | 22.7% |
| Large blend | 14.5% |
| U.S. mid cap | 6.0% |
| Emerging-market equity | 3.1% |
| U.S. small cap | 0.9% |
| Fixed income | 19.0% |
| Intermediate bond | 11.9% |
| Short-term bond | 2.7% |
| Emerging-market debt | 2.3% |
| High yield bond | 1.6% |
| Multi-sector bond | 0.5% |
| Alternative and specialty | 2.4% |
| Sector equity | 1.9% |
| Absolute return | 0.5% |
| Unaffiliated investment companies | 5.4% |
| Equity | 5.4% |
| U.S. Government | 0.8% |
Holdings may not have been held by the fund for the entire period and are subject to change without notice. Portfolio composition is subject to review in accordance with the fund’s investment strategy and may vary in the future. Current and future portfolio holdings are subject to risk and may change at any time.
What were the fund costs during the last year ?
(Based on a hypothetical $10,000 investment)
| Fund (Class) | Costs of a $10,000 investment | Costs paid as a percentage of a $10,000 investment |
| Multimanager 2040 Lifetime Portfolio (Class R2/JLIEX) |
$54 | 0.50% |
Management’s Discussion of Fund Performance
SUMMARY OF RESULTS
Multimanager 2040 Lifetime Portfolio (Class R2/JLIEX) returned 17.51% for the year ended August 31, 2026. Global equities produced sizable gains in the 12-month period that ended on August 31, 2026. Investors were encouraged by the favorable combination of healthy economic growth trends, robust corporate earnings, and generally supportive central bank policies, together with optimism about artificial intelligence. While technology stocks performed very well, the value style outpaced growth on a global basis and contributed meaningfully to the markets’ strong showing. Emerging market equities also posted outsized returns. Bonds registered more modest gains, led by credit-oriented investments. Income was the primary contributor to total returns for fixed income instruments, as prices came under pressure from concerns about persistent inflation, global conflicts, energy prices, and mounting government debt across the developed world.
TOP PERFORMANCE CONTRIBUTORS
Equity allocation | U.S. equities made a significant contribution to absolute performance, led by large cap equities. International developed market equities further helped results, as did emerging market stocks. Defensive equities also generated positive returns. The real assets portfolio was an additional contributor with strong returns for energy stocks and the metals & mining sector.
Bond funds | The fixed-income allocation contributed positively, led by intermediate-term bonds and emerging markets debt. Holdings in high yield bonds and short-term bonds aided returns as well.
TOP PERFORMANCE DETRACTORS
Specific positions | At a time of positive returns for most segments of the financial markets, the majority of the fund’s holdings recorded a gain. However, small positions in international real estate investment trusts and U.S. Treasury STRIPS (Separate Trading of Registered Interest and Principal of Securities) were adversely affected by rising yields.
The views expressed in this report are those of the portfolio management team and are subject to change. They are not meant as investment advice.
Fund Performance
The following graph compares the initial and subsequent account values at the end of each of the most recently completed 10 fiscal years of the fund (or for the life of the fund, if shorter). It assumes a $10,000 initial investment in the fund and in an appropriate, broad-based securities market index for the same period.
GROWTH OF $10,000
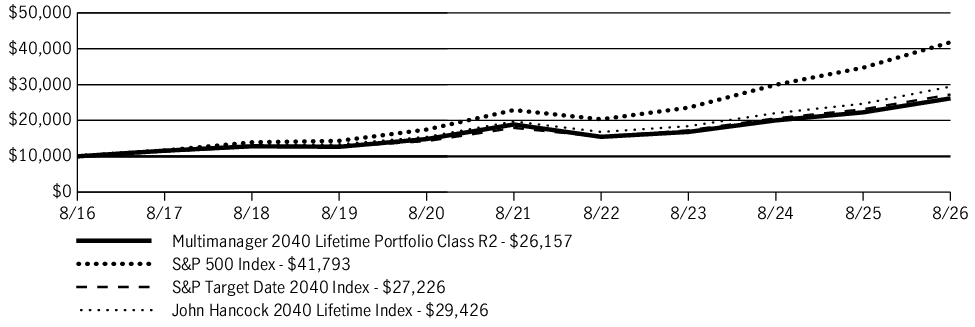
| AVERAGE ANNUAL TOTAL RETURN | 1 Year | 5 Years | 10 Years |
| Multimanager 2040 Lifetime Portfolio (Class R2/JLIEX) | 17.51% | 6.74% | 10.09% |
| S&P 500 Index | 20.38% | 12.79% | 15.37% |
| S&P Target Date 2040 Index | 17.78% | 8.72% | 10.53% |
| John Hancock 2040 Lifetime Index | 19.30% | 8.33% | 11.39% |
Fund Statistics
| Fund net assets | $1,058,913,843 |
| Total number of portfolio holdings | 87 |
| Total advisory fees paid (net) | $0 |
| Portfolio turnover rate | 22% |
Graphical Representation of Holdings
The table below shows the investment makeup of the fund, representing a percentage of the total net assets of the fund.
Asset Allocation
| Affiliated investment companies | 93.8% |
| Equity | 72.4% |
| International equity | 25.2% |
| U.S. large cap | 22.7% |
| Large blend | 14.5% |
| U.S. mid cap | 6.0% |
| Emerging-market equity | 3.1% |
| U.S. small cap | 0.9% |
| Fixed income | 19.0% |
| Intermediate bond | 11.9% |
| Short-term bond | 2.7% |
| Emerging-market debt | 2.3% |
| High yield bond | 1.6% |
| Multi-sector bond | 0.5% |
| Alternative and specialty | 2.4% |
| Sector equity | 1.9% |
| Absolute return | 0.5% |
| Unaffiliated investment companies | 5.4% |
| Equity | 5.4% |
| U.S. Government | 0.8% |
Holdings may not have been held by the fund for the entire period and are subject to change without notice. Portfolio composition is subject to review in accordance with the fund’s investment strategy and may vary in the future. Current and future portfolio holdings are subject to risk and may change at any time.
What were the fund costs during the last year ?
(Based on a hypothetical $10,000 investment)
| Fund (Class) | Costs of a $10,000 investment | Costs paid as a percentage of a $10,000 investment |
| Multimanager 2040 Lifetime Portfolio (Class R4/JLIGX) |
$27 | 0.25% |
Management’s Discussion of Fund Performance
SUMMARY OF RESULTS
Multimanager 2040 Lifetime Portfolio (Class R4/JLIGX) returned 17.74% for the year ended August 31, 2026. Global equities produced sizable gains in the 12-month period that ended on August 31, 2026. Investors were encouraged by the favorable combination of healthy economic growth trends, robust corporate earnings, and generally supportive central bank policies, together with optimism about artificial intelligence. While technology stocks performed very well, the value style outpaced growth on a global basis and contributed meaningfully to the markets’ strong showing. Emerging market equities also posted outsized returns. Bonds registered more modest gains, led by credit-oriented investments. Income was the primary contributor to total returns for fixed income instruments, as prices came under pressure from concerns about persistent inflation, global conflicts, energy prices, and mounting government debt across the developed world.
TOP PERFORMANCE CONTRIBUTORS
Equity allocation | U.S. equities made a significant contribution to absolute performance, led by large cap equities. International developed market equities further helped results, as did emerging market stocks. Defensive equities also generated positive returns. The real assets portfolio was an additional contributor with strong returns for energy stocks and the metals & mining sector.
Bond funds | The fixed-income allocation contributed positively, led by intermediate-term bonds and emerging markets debt. Holdings in high yield bonds and short-term bonds aided returns as well.
TOP PERFORMANCE DETRACTORS
Specific positions | At a time of positive returns for most segments of the financial markets, the majority of the fund’s holdings recorded a gain. However, small positions in international real estate investment trusts and U.S. Treasury STRIPS (Separate Trading of Registered Interest and Principal of Securities) were adversely affected by rising yields.
The views expressed in this report are those of the portfolio management team and are subject to change. They are not meant as investment advice.
Fund Performance
The following graph compares the initial and subsequent account values at the end of each of the most recently completed 10 fiscal years of the fund (or for the life of the fund, if shorter). It assumes a $10,000 initial investment in the fund and in an appropriate, broad-based securities market index for the same period.
GROWTH OF $10,000
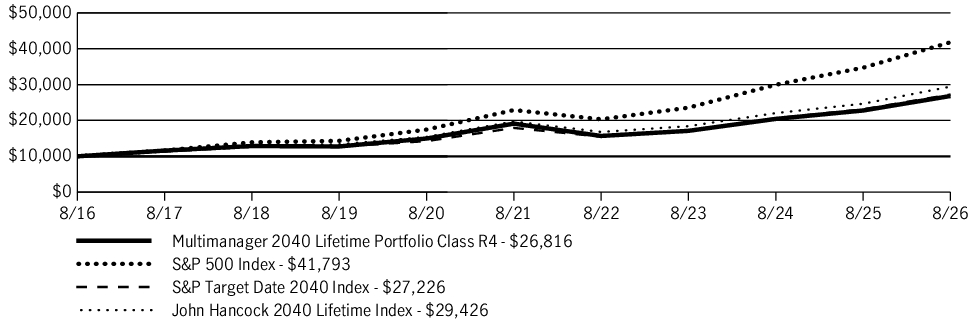
| AVERAGE ANNUAL TOTAL RETURN | 1 Year | 5 Years | 10 Years |
| Multimanager 2040 Lifetime Portfolio (Class R4/JLIGX) | 17.74% | 7.01% | 10.37% |
| S&P 500 Index | 20.38% | 12.79% | 15.37% |
| S&P Target Date 2040 Index | 17.78% | 8.72% | 10.53% |
| John Hancock 2040 Lifetime Index | 19.30% | 8.33% | 11.39% |
Fund Statistics
| Fund net assets | $1,058,913,843 |
| Total number of portfolio holdings | 87 |
| Total advisory fees paid (net) | $0 |
| Portfolio turnover rate | 22% |
Graphical Representation of Holdings
The table below shows the investment makeup of the fund, representing a percentage of the total net assets of the fund.
Asset Allocation
| Affiliated investment companies | 93.8% |
| Equity | 72.4% |
| International equity | 25.2% |
| U.S. large cap | 22.7% |
| Large blend | 14.5% |
| U.S. mid cap | 6.0% |
| Emerging-market equity | 3.1% |
| U.S. small cap | 0.9% |
| Fixed income | 19.0% |
| Intermediate bond | 11.9% |
| Short-term bond | 2.7% |
| Emerging-market debt | 2.3% |
| High yield bond | 1.6% |
| Multi-sector bond | 0.5% |
| Alternative and specialty | 2.4% |
| Sector equity | 1.9% |
| Absolute return | 0.5% |
| Unaffiliated investment companies | 5.4% |
| Equity | 5.4% |
| U.S. Government | 0.8% |
Holdings may not have been held by the fund for the entire period and are subject to change without notice. Portfolio composition is subject to review in accordance with the fund’s investment strategy and may vary in the future. Current and future portfolio holdings are subject to risk and may change at any time.
What were the fund costs during the last year ?
(Based on a hypothetical $10,000 investment)
| Fund (Class) | Costs of a $10,000 investment | Costs paid as a percentage of a $10,000 investment |
| Multimanager 2040 Lifetime Portfolio (Class R5/JLIHX) |
$5 | 0.05% |
Management’s Discussion of Fund Performance
SUMMARY OF RESULTS
Multimanager 2040 Lifetime Portfolio (Class R5/JLIHX) returned 17.94% for the year ended August 31, 2026. Global equities produced sizable gains in the 12-month period that ended on August 31, 2026. Investors were encouraged by the favorable combination of healthy economic growth trends, robust corporate earnings, and generally supportive central bank policies, together with optimism about artificial intelligence. While technology stocks performed very well, the value style outpaced growth on a global basis and contributed meaningfully to the markets’ strong showing. Emerging market equities also posted outsized returns. Bonds registered more modest gains, led by credit-oriented investments. Income was the primary contributor to total returns for fixed income instruments, as prices came under pressure from concerns about persistent inflation, global conflicts, energy prices, and mounting government debt across the developed world.
TOP PERFORMANCE CONTRIBUTORS
Equity allocation | U.S. equities made a significant contribution to absolute performance, led by large cap equities. International developed market equities further helped results, as did emerging market stocks. Defensive equities also generated positive returns. The real assets portfolio was an additional contributor with strong returns for energy stocks and the metals & mining sector.
Bond funds | The fixed-income allocation contributed positively, led by intermediate-term bonds and emerging markets debt. Holdings in high yield bonds and short-term bonds aided returns as well.
TOP PERFORMANCE DETRACTORS
Specific positions | At a time of positive returns for most segments of the financial markets, the majority of the fund’s holdings recorded a gain. However, small positions in international real estate investment trusts and U.S. Treasury STRIPS (Separate Trading of Registered Interest and Principal of Securities) were adversely affected by rising yields.
The views expressed in this report are those of the portfolio management team and are subject to change. They are not meant as investment advice.
Fund Performance
The following graph compares the initial and subsequent account values at the end of each of the most recently completed 10 fiscal years of the fund (or for the life of the fund, if shorter). It assumes a $10,000 initial investment in the fund and in an appropriate, broad-based securities market index for the same period.
GROWTH OF $10,000
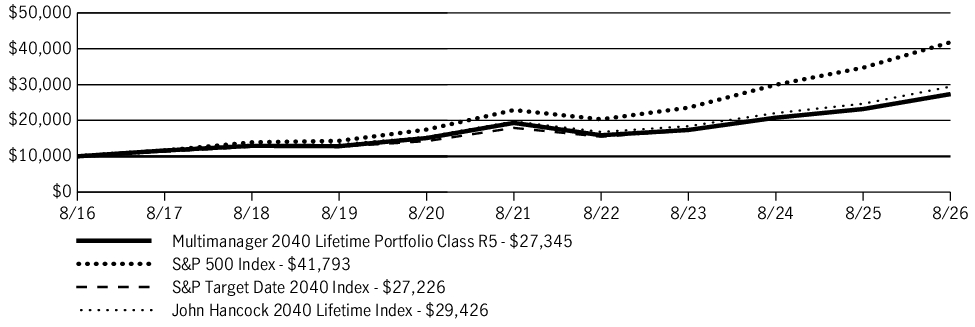
| AVERAGE ANNUAL TOTAL RETURN | 1 Year | 5 Years | 10 Years |
| Multimanager 2040 Lifetime Portfolio (Class R5/JLIHX) | 17.94% | 7.20% | 10.58% |
| S&P 500 Index | 20.38% | 12.79% | 15.37% |
| S&P Target Date 2040 Index | 17.78% | 8.72% | 10.53% |
| John Hancock 2040 Lifetime Index | 19.30% | 8.33% | 11.39% |
Fund Statistics
| Fund net assets | $1,058,913,843 |
| Total number of portfolio holdings | 87 |
| Total advisory fees paid (net) | $0 |
| Portfolio turnover rate | 22% |
Graphical Representation of Holdings
The table below shows the investment makeup of the fund, representing a percentage of the total net assets of the fund.
Asset Allocation
| Affiliated investment companies | 93.8% |
| Equity | 72.4% |
| International equity | 25.2% |
| U.S. large cap | 22.7% |
| Large blend | 14.5% |
| U.S. mid cap | 6.0% |
| Emerging-market equity | 3.1% |
| U.S. small cap | 0.9% |
| Fixed income | 19.0% |
| Intermediate bond | 11.9% |
| Short-term bond | 2.7% |
| Emerging-market debt | 2.3% |
| High yield bond | 1.6% |
| Multi-sector bond | 0.5% |
| Alternative and specialty | 2.4% |
| Sector equity | 1.9% |
| Absolute return | 0.5% |
| Unaffiliated investment companies | 5.4% |
| Equity | 5.4% |
| U.S. Government | 0.8% |
Holdings may not have been held by the fund for the entire period and are subject to change without notice. Portfolio composition is subject to review in accordance with the fund’s investment strategy and may vary in the future. Current and future portfolio holdings are subject to risk and may change at any time.
What were the fund costs during the last year ?
(Based on a hypothetical $10,000 investment)
| Fund (Class) | Costs of a $10,000 investment | Costs paid as a percentage of a $10,000 investment |
| Multimanager 2040 Lifetime Portfolio (Class R6/JLIIX) |
$0 | 0.00% |
Management’s Discussion of Fund Performance
SUMMARY OF RESULTS
Multimanager 2040 Lifetime Portfolio (Class R6/JLIIX) returned 17.97% for the year ended August 31, 2026. Global equities produced sizable gains in the 12-month period that ended on August 31, 2026. Investors were encouraged by the favorable combination of healthy economic growth trends, robust corporate earnings, and generally supportive central bank policies, together with optimism about artificial intelligence. While technology stocks performed very well, the value style outpaced growth on a global basis and contributed meaningfully to the markets’ strong showing. Emerging market equities also posted outsized returns. Bonds registered more modest gains, led by credit-oriented investments. Income was the primary contributor to total returns for fixed income instruments, as prices came under pressure from concerns about persistent inflation, global conflicts, energy prices, and mounting government debt across the developed world.
TOP PERFORMANCE CONTRIBUTORS
Equity allocation | U.S. equities made a significant contribution to absolute performance, led by large cap equities. International developed market equities further helped results, as did emerging market stocks. Defensive equities also generated positive returns. The real assets portfolio was an additional contributor with strong returns for energy stocks and the metals & mining sector.
Bond funds | The fixed-income allocation contributed positively, led by intermediate-term bonds and emerging markets debt. Holdings in high yield bonds and short-term bonds aided returns as well.
TOP PERFORMANCE DETRACTORS
Specific positions | At a time of positive returns for most segments of the financial markets, the majority of the fund’s holdings recorded a gain. However, small positions in international real estate investment trusts and U.S. Treasury STRIPS (Separate Trading of Registered Interest and Principal of Securities) were adversely affected by rising yields.
The views expressed in this report are those of the portfolio management team and are subject to change. They are not meant as investment advice.
Fund Performance
The following graph compares the initial and subsequent account values at the end of each of the most recently completed 10 fiscal years of the fund (or for the life of the fund, if shorter). It assumes a $1,000,000 initial investment in the fund and in an appropriate, broad-based securities market index for the same period.
GROWTH OF $1,000,000
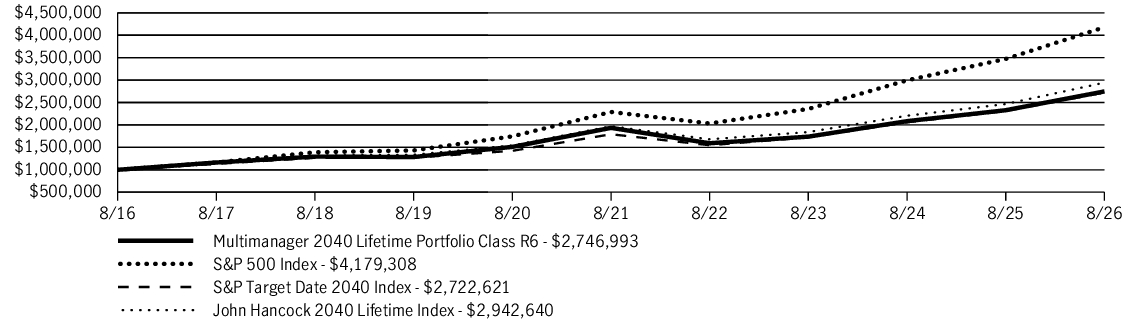
| AVERAGE ANNUAL TOTAL RETURN | 1 Year | 5 Years | 10 Years |
| Multimanager 2040 Lifetime Portfolio (Class R6/JLIIX) | 17.97% | 7.26% | 10.63% |
| S&P 500 Index | 20.38% | 12.79% | 15.37% |
| S&P Target Date 2040 Index | 17.78% | 8.72% | 10.53% |
| John Hancock 2040 Lifetime Index | 19.30% | 8.33% | 11.39% |
Fund Statistics
| Fund net assets | $1,058,913,843 |
| Total number of portfolio holdings | 87 |
| Total advisory fees paid (net) | $0 |
| Portfolio turnover rate | 22% |
Graphical Representation of Holdings
The table below shows the investment makeup of the fund, representing a percentage of the total net assets of the fund.
Asset Allocation
| Affiliated investment companies | 93.8% |
| Equity | 72.4% |
| International equity | 25.2% |
| U.S. large cap | 22.7% |
| Large blend | 14.5% |
| U.S. mid cap | 6.0% |
| Emerging-market equity | 3.1% |
| U.S. small cap | 0.9% |
| Fixed income | 19.0% |
| Intermediate bond | 11.9% |
| Short-term bond | 2.7% |
| Emerging-market debt | 2.3% |
| High yield bond | 1.6% |
| Multi-sector bond | 0.5% |
| Alternative and specialty | 2.4% |
| Sector equity | 1.9% |
| Absolute return | 0.5% |
| Unaffiliated investment companies | 5.4% |
| Equity | 5.4% |
| U.S. Government | 0.8% |
Holdings may not have been held by the fund for the entire period and are subject to change without notice. Portfolio composition is subject to review in accordance with the fund’s investment strategy and may vary in the future. Current and future portfolio holdings are subject to risk and may change at any time.
What were the fund costs during the last year ?
(Based on a hypothetical $10,000 investment)
| Fund (Class) | Costs of a $10,000 investment | Costs paid as a percentage of a $10,000 investment |
| Multimanager 2045 Lifetime Portfolio (Class R6/JLJIX) |
$0 | 0.00% |
Management’s Discussion of Fund Performance
SUMMARY OF RESULTS
Multimanager 2045 Lifetime Portfolio (Class R6/JLJIX) returned 19.41% for the year ended August 31, 2026. Global equities produced sizable gains in the 12-month period that ended on August 31, 2026. Investors were encouraged by the favorable combination of healthy economic growth trends, robust corporate earnings, and generally supportive central bank policies, together with optimism about artificial intelligence. While technology stocks performed very well, the value style outpaced growth on a global basis and contributed meaningfully to the markets’ strong showing. Emerging market equities also posted outsized returns. Bonds registered more modest gains, led by credit-oriented investments. Income was the primary contributor to total returns for fixed income instruments, as prices came under pressure from concerns about persistent inflation, global conflicts, energy prices, and mounting government debt across the developed world.
TOP PERFORMANCE CONTRIBUTORS
Equity allocation | U.S. equities made a significant contribution to absolute performance, led by large cap equities. International developed market equities further helped results, as did emerging market stocks. Defensive equities also generated positive returns. The real assets portfolio was an additional contributor with strong returns for energy stocks and the metals & mining sector.
Bond funds | The fixed-income allocation contributed positively, led by intermediate-term bonds and emerging markets debt. Holdings in high yield bonds and short-term bonds aided returns as well.
TOP PERFORMANCE DETRACTORS
Specific positions | At a time of positive returns for most segments of the financial markets, the majority of the fund’s holdings recorded a gain. However, small positions in U.S. Treasury STRIPS (Separate Trading of Registered Interest and Principal of Securities) were adversely affected by rising yields.
The views expressed in this report are those of the portfolio management team and are subject to change. They are not meant as investment advice.
Fund Performance
The following graph compares the initial and subsequent account values at the end of each of the most recently completed 10 fiscal years of the fund (or for the life of the fund, if shorter). It assumes a $1,000,000 initial investment in the fund and in an appropriate, broad-based securities market index for the same period.
GROWTH OF $1,000,000
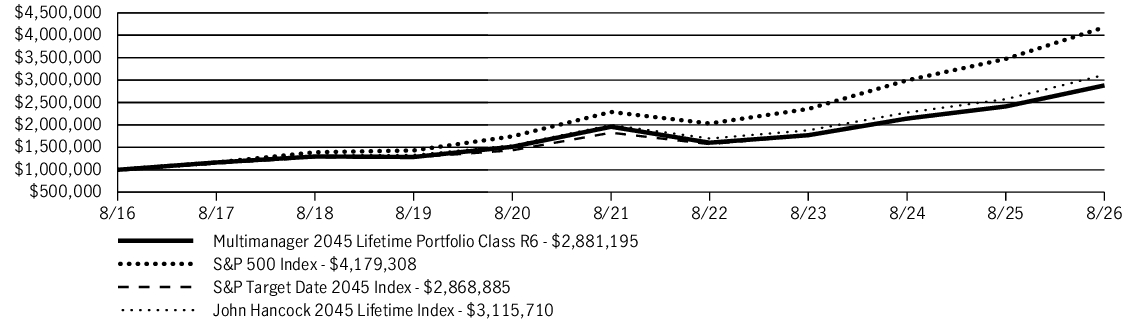
| AVERAGE ANNUAL TOTAL RETURN | 1 Year | 5 Years | 10 Years |
| Multimanager 2045 Lifetime Portfolio (Class R6/JLJIX) | 19.41% | 8.02% | 11.16% |
| S&P 500 Index | 20.38% | 12.79% | 15.37% |
| S&P Target Date 2045 Index | 19.33% | 9.45% | 11.11% |
| John Hancock 2045 Lifetime Index | 21.02% | 9.28% | 12.03% |
Fund Statistics
| Fund net assets | $1,024,345,141 |
| Total number of portfolio holdings | 85 |
| Total advisory fees paid (net) | $0 |
| Portfolio turnover rate | 20% |
Graphical Representation of Holdings
The table below shows the investment makeup of the fund, representing a percentage of the total net assets of the fund.
Asset Allocation
| Affiliated investment companies | 93.6% |
| Equity | 81.1% |
| International equity | 26.9% |
| U.S. large cap | 26.0% |
| Large blend | 15.3% |
| U.S. mid cap | 7.4% |
| Emerging-market equity | 4.3% |
| U.S. small cap | 1.2% |
| Fixed income | 11.0% |
| Intermediate bond | 6.3% |
| Short-term bond | 2.3% |
| Emerging-market debt | 1.4% |
| High yield bond | 1.0% |
| Alternative and specialty | 1.5% |
| Sector equity | 1.0% |
| Absolute return | 0.5% |
| Unaffiliated investment companies | 5.8% |
| Equity | 5.8% |
| U.S. Government | 0.6% |
Holdings may not have been held by the fund for the entire period and are subject to change without notice. Portfolio composition is subject to review in accordance with the fund’s investment strategy and may vary in the future. Current and future portfolio holdings are subject to risk and may change at any time.
What were the fund costs during the last year ?
(Based on a hypothetical $10,000 investment)
| Fund (Class) | Costs of a $10,000 investment | Costs paid as a percentage of a $10,000 investment |
| Multimanager 2045 Lifetime Portfolio (Class R5/JLJHX) |
$5 | 0.05% |
Management’s Discussion of Fund Performance
SUMMARY OF RESULTS
Multimanager 2045 Lifetime Portfolio (Class R5/JLJHX) returned 19.36% for the year ended August 31, 2026. Global equities produced sizable gains in the 12-month period that ended on August 31, 2026. Investors were encouraged by the favorable combination of healthy economic growth trends, robust corporate earnings, and generally supportive central bank policies, together with optimism about artificial intelligence. While technology stocks performed very well, the value style outpaced growth on a global basis and contributed meaningfully to the markets’ strong showing. Emerging market equities also posted outsized returns. Bonds registered more modest gains, led by credit-oriented investments. Income was the primary contributor to total returns for fixed income instruments, as prices came under pressure from concerns about persistent inflation, global conflicts, energy prices, and mounting government debt across the developed world.
TOP PERFORMANCE CONTRIBUTORS
Equity allocation | U.S. equities made a significant contribution to absolute performance, led by large cap equities. International developed market equities further helped results, as did emerging market stocks. Defensive equities also generated positive returns. The real assets portfolio was an additional contributor with strong returns for energy stocks and the metals & mining sector.
Bond funds | The fixed-income allocation contributed positively, led by intermediate-term bonds and emerging markets debt. Holdings in high yield bonds and short-term bonds aided returns as well.
TOP PERFORMANCE DETRACTORS
Specific positions | At a time of positive returns for most segments of the financial markets, the majority of the fund’s holdings recorded a gain. However, small positions in U.S. Treasury STRIPS (Separate Trading of Registered Interest and Principal of Securities) were adversely affected by rising yields.
The views expressed in this report are those of the portfolio management team and are subject to change. They are not meant as investment advice.
Fund Performance
The following graph compares the initial and subsequent account values at the end of each of the most recently completed 10 fiscal years of the fund (or for the life of the fund, if shorter). It assumes a $10,000 initial investment in the fund and in an appropriate, broad-based securities market index for the same period.
GROWTH OF $10,000
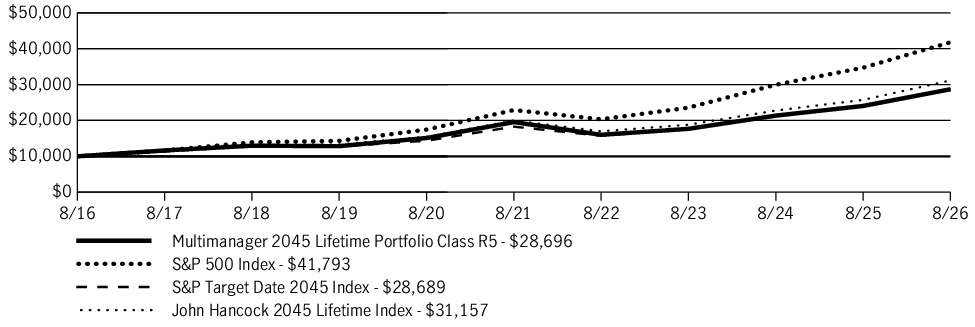
| AVERAGE ANNUAL TOTAL RETURN | 1 Year | 5 Years | 10 Years |
| Multimanager 2045 Lifetime Portfolio (Class R5/JLJHX) | 19.36% | 7.98% | 11.12% |
| S&P 500 Index | 20.38% | 12.79% | 15.37% |
| S&P Target Date 2045 Index | 19.33% | 9.45% | 11.11% |
| John Hancock 2045 Lifetime Index | 21.02% | 9.28% | 12.03% |
Fund Statistics
| Fund net assets | $1,024,345,141 |
| Total number of portfolio holdings | 85 |
| Total advisory fees paid (net) | $0 |
| Portfolio turnover rate | 20% |
Graphical Representation of Holdings
The table below shows the investment makeup of the fund, representing a percentage of the total net assets of the fund.
Asset Allocation
| Affiliated investment companies | 93.6% |
| Equity | 81.1% |
| International equity | 26.9% |
| U.S. large cap | 26.0% |
| Large blend | 15.3% |
| U.S. mid cap | 7.4% |
| Emerging-market equity | 4.3% |
| U.S. small cap | 1.2% |
| Fixed income | 11.0% |
| Intermediate bond | 6.3% |
| Short-term bond | 2.3% |
| Emerging-market debt | 1.4% |
| High yield bond | 1.0% |
| Alternative and specialty | 1.5% |
| Sector equity | 1.0% |
| Absolute return | 0.5% |
| Unaffiliated investment companies | 5.8% |
| Equity | 5.8% |
| U.S. Government | 0.6% |
Holdings may not have been held by the fund for the entire period and are subject to change without notice. Portfolio composition is subject to review in accordance with the fund’s investment strategy and may vary in the future. Current and future portfolio holdings are subject to risk and may change at any time.
What were the fund costs during the last year ?
(Based on a hypothetical $10,000 investment)
| Fund (Class) | Costs of a $10,000 investment | Costs paid as a percentage of a $10,000 investment |
| Multimanager 2045 Lifetime Portfolio (Class R4/JLJGX) |
$27 | 0.25% |
Management’s Discussion of Fund Performance
SUMMARY OF RESULTS
Multimanager 2045 Lifetime Portfolio (Class R4/JLJGX) returned 19.18% for the year ended August 31, 2026. Global equities produced sizable gains in the 12-month period that ended on August 31, 2026. Investors were encouraged by the favorable combination of healthy economic growth trends, robust corporate earnings, and generally supportive central bank policies, together with optimism about artificial intelligence. While technology stocks performed very well, the value style outpaced growth on a global basis and contributed meaningfully to the markets’ strong showing. Emerging market equities also posted outsized returns. Bonds registered more modest gains, led by credit-oriented investments. Income was the primary contributor to total returns for fixed income instruments, as prices came under pressure from concerns about persistent inflation, global conflicts, energy prices, and mounting government debt across the developed world.
TOP PERFORMANCE CONTRIBUTORS
Equity allocation | U.S. equities made a significant contribution to absolute performance, led by large cap equities. International developed market equities further helped results, as did emerging market stocks. Defensive equities also generated positive returns. The real assets portfolio was an additional contributor with strong returns for energy stocks and the metals & mining sector.
Bond funds | The fixed-income allocation contributed positively, led by intermediate-term bonds and emerging markets debt. Holdings in high yield bonds and short-term bonds aided returns as well.
TOP PERFORMANCE DETRACTORS
Specific positions | At a time of positive returns for most segments of the financial markets, the majority of the fund’s holdings recorded a gain. However, small positions in U.S. Treasury STRIPS (Separate Trading of Registered Interest and Principal of Securities) were adversely affected by rising yields.
The views expressed in this report are those of the portfolio management team and are subject to change. They are not meant as investment advice.
Fund Performance
The following graph compares the initial and subsequent account values at the end of each of the most recently completed 10 fiscal years of the fund (or for the life of the fund, if shorter). It assumes a $10,000 initial investment in the fund and in an appropriate, broad-based securities market index for the same period.
GROWTH OF $10,000
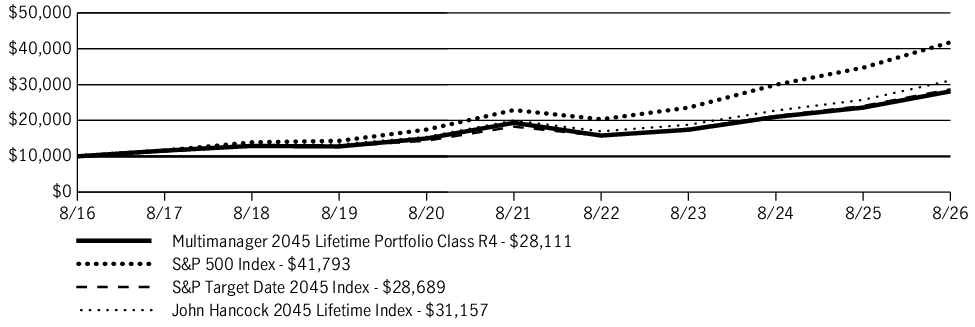
| AVERAGE ANNUAL TOTAL RETURN | 1 Year | 5 Years | 10 Years |
| Multimanager 2045 Lifetime Portfolio (Class R4/JLJGX) | 19.18% | 7.76% | 10.89% |
| S&P 500 Index | 20.38% | 12.79% | 15.37% |
| S&P Target Date 2045 Index | 19.33% | 9.45% | 11.11% |
| John Hancock 2045 Lifetime Index | 21.02% | 9.28% | 12.03% |
Fund Statistics
| Fund net assets | $1,024,345,141 |
| Total number of portfolio holdings | 85 |
| Total advisory fees paid (net) | $0 |
| Portfolio turnover rate | 20% |
Graphical Representation of Holdings
The table below shows the investment makeup of the fund, representing a percentage of the total net assets of the fund.
Asset Allocation
| Affiliated investment companies | 93.6% |
| Equity | 81.1% |
| International equity | 26.9% |
| U.S. large cap | 26.0% |
| Large blend | 15.3% |
| U.S. mid cap | 7.4% |
| Emerging-market equity | 4.3% |
| U.S. small cap | 1.2% |
| Fixed income | 11.0% |
| Intermediate bond | 6.3% |
| Short-term bond | 2.3% |
| Emerging-market debt | 1.4% |
| High yield bond | 1.0% |
| Alternative and specialty | 1.5% |
| Sector equity | 1.0% |
| Absolute return | 0.5% |
| Unaffiliated investment companies | 5.8% |
| Equity | 5.8% |
| U.S. Government | 0.6% |
Holdings may not have been held by the fund for the entire period and are subject to change without notice. Portfolio composition is subject to review in accordance with the fund’s investment strategy and may vary in the future. Current and future portfolio holdings are subject to risk and may change at any time.
What were the fund costs during the last year ?
(Based on a hypothetical $10,000 investment)
| Fund (Class) | Costs of a $10,000 investment | Costs paid as a percentage of a $10,000 investment |
| Multimanager 2045 Lifetime Portfolio (Class R2/JLJEX) |
$55 | 0.50% |
Management’s Discussion of Fund Performance
SUMMARY OF RESULTS
Multimanager 2045 Lifetime Portfolio (Class R2/JLJEX) returned 18.87% for the year ended August 31, 2026. Global equities produced sizable gains in the 12-month period that ended on August 31, 2026. Investors were encouraged by the favorable combination of healthy economic growth trends, robust corporate earnings, and generally supportive central bank policies, together with optimism about artificial intelligence. While technology stocks performed very well, the value style outpaced growth on a global basis and contributed meaningfully to the markets’ strong showing. Emerging market equities also posted outsized returns. Bonds registered more modest gains, led by credit-oriented investments. Income was the primary contributor to total returns for fixed income instruments, as prices came under pressure from concerns about persistent inflation, global conflicts, energy prices, and mounting government debt across the developed world.
TOP PERFORMANCE CONTRIBUTORS
Equity allocation | U.S. equities made a significant contribution to absolute performance, led by large cap equities. International developed market equities further helped results, as did emerging market stocks. Defensive equities also generated positive returns. The real assets portfolio was an additional contributor with strong returns for energy stocks and the metals & mining sector.
Bond funds | The fixed-income allocation contributed positively, led by intermediate-term bonds and emerging markets debt. Holdings in high yield bonds and short-term bonds aided returns as well.
TOP PERFORMANCE DETRACTORS
Specific positions | At a time of positive returns for most segments of the financial markets, the majority of the fund’s holdings recorded a gain. However, small positions in U.S. Treasury STRIPS (Separate Trading of Registered Interest and Principal of Securities) were adversely affected by rising yields.
The views expressed in this report are those of the portfolio management team and are subject to change. They are not meant as investment advice.
Fund Performance
The following graph compares the initial and subsequent account values at the end of each of the most recently completed 10 fiscal years of the fund (or for the life of the fund, if shorter). It assumes a $10,000 initial investment in the fund and in an appropriate, broad-based securities market index for the same period.
GROWTH OF $10,000
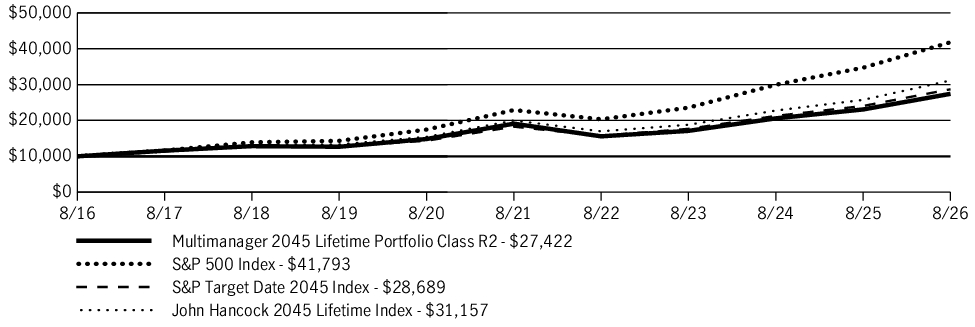
| AVERAGE ANNUAL TOTAL RETURN | 1 Year | 5 Years | 10 Years |
| Multimanager 2045 Lifetime Portfolio (Class R2/JLJEX) | 18.87% | 7.50% | 10.61% |
| S&P 500 Index | 20.38% | 12.79% | 15.37% |
| S&P Target Date 2045 Index | 19.33% | 9.45% | 11.11% |
| John Hancock 2045 Lifetime Index | 21.02% | 9.28% | 12.03% |
Fund Statistics
| Fund net assets | $1,024,345,141 |
| Total number of portfolio holdings | 85 |
| Total advisory fees paid (net) | $0 |
| Portfolio turnover rate | 20% |
Graphical Representation of Holdings
The table below shows the investment makeup of the fund, representing a percentage of the total net assets of the fund.
Asset Allocation
| Affiliated investment companies | 93.6% |
| Equity | 81.1% |
| International equity | 26.9% |
| U.S. large cap | 26.0% |
| Large blend | 15.3% |
| U.S. mid cap | 7.4% |
| Emerging-market equity | 4.3% |
| U.S. small cap | 1.2% |
| Fixed income | 11.0% |
| Intermediate bond | 6.3% |
| Short-term bond | 2.3% |
| Emerging-market debt | 1.4% |
| High yield bond | 1.0% |
| Alternative and specialty | 1.5% |
| Sector equity | 1.0% |
| Absolute return | 0.5% |
| Unaffiliated investment companies | 5.8% |
| Equity | 5.8% |
| U.S. Government | 0.6% |
Holdings may not have been held by the fund for the entire period and are subject to change without notice. Portfolio composition is subject to review in accordance with the fund’s investment strategy and may vary in the future. Current and future portfolio holdings are subject to risk and may change at any time.
What were the fund costs during the last year ?
(Based on a hypothetical $10,000 investment)
| Fund (Class) | Costs of a $10,000 investment | Costs paid as a percentage of a $10,000 investment |
| Multimanager 2045 Lifetime Portfolio (Class I/JHROX) |
$12 | 0.11% |
Management’s Discussion of Fund Performance
SUMMARY OF RESULTS
Multimanager 2045 Lifetime Portfolio (Class I/JHROX) returned 19.30% for the year ended August 31, 2026. Global equities produced sizable gains in the 12-month period that ended on August 31, 2026. Investors were encouraged by the favorable combination of healthy economic growth trends, robust corporate earnings, and generally supportive central bank policies, together with optimism about artificial intelligence. While technology stocks performed very well, the value style outpaced growth on a global basis and contributed meaningfully to the markets’ strong showing. Emerging market equities also posted outsized returns. Bonds registered more modest gains, led by credit-oriented investments. Income was the primary contributor to total returns for fixed income instruments, as prices came under pressure from concerns about persistent inflation, global conflicts, energy prices, and mounting government debt across the developed world.
TOP PERFORMANCE CONTRIBUTORS
Equity allocation | U.S. equities made a significant contribution to absolute performance, led by large cap equities. International developed market equities further helped results, as did emerging market stocks. Defensive equities also generated positive returns. The real assets portfolio was an additional contributor with strong returns for energy stocks and the metals & mining sector.
Bond funds | The fixed-income allocation contributed positively, led by intermediate-term bonds and emerging markets debt. Holdings in high yield bonds and short-term bonds aided returns as well.
TOP PERFORMANCE DETRACTORS
Specific positions | At a time of positive returns for most segments of the financial markets, the majority of the fund’s holdings recorded a gain. However, small positions in U.S. Treasury STRIPS (Separate Trading of Registered Interest and Principal of Securities) were adversely affected by rising yields.
The views expressed in this report are those of the portfolio management team and are subject to change. They are not meant as investment advice.
Fund Performance
The following graph compares the initial and subsequent account values at the end of each of the most recently completed 10 fiscal years of the fund (or for the life of the fund, if shorter). It assumes a $250,000 initial investment in the fund and in an appropriate, broad-based securities market index for the same period.
GROWTH OF $250,000
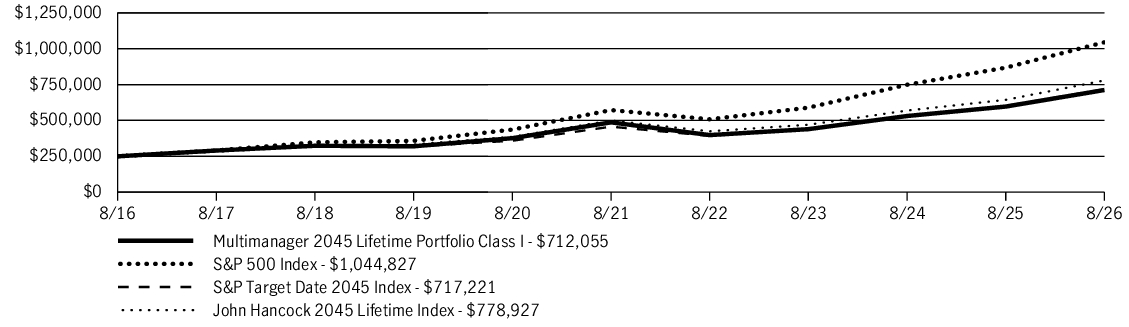
| AVERAGE ANNUAL TOTAL RETURN | 1 Year | 5 Years | 10 Years |
| Multimanager 2045 Lifetime Portfolio (Class I/JHROX) | 19.30% | 7.90% | 11.03% |
| S&P 500 Index | 20.38% | 12.79% | 15.37% |
| S&P Target Date 2045 Index | 19.33% | 9.45% | 11.11% |
| John Hancock 2045 Lifetime Index | 21.02% | 9.28% | 12.03% |
Fund Statistics
| Fund net assets | $1,024,345,141 |
| Total number of portfolio holdings | 85 |
| Total advisory fees paid (net) | $0 |
| Portfolio turnover rate | 20% |
Graphical Representation of Holdings
The table below shows the investment makeup of the fund, representing a percentage of the total net assets of the fund.
Asset Allocation
| Affiliated investment companies | 93.6% |
| Equity | 81.1% |
| International equity | 26.9% |
| U.S. large cap | 26.0% |
| Large blend | 15.3% |
| U.S. mid cap | 7.4% |
| Emerging-market equity | 4.3% |
| U.S. small cap | 1.2% |
| Fixed income | 11.0% |
| Intermediate bond | 6.3% |
| Short-term bond | 2.3% |
| Emerging-market debt | 1.4% |
| High yield bond | 1.0% |
| Alternative and specialty | 1.5% |
| Sector equity | 1.0% |
| Absolute return | 0.5% |
| Unaffiliated investment companies | 5.8% |
| Equity | 5.8% |
| U.S. Government | 0.6% |
Holdings may not have been held by the fund for the entire period and are subject to change without notice. Portfolio composition is subject to review in accordance with the fund’s investment strategy and may vary in the future. Current and future portfolio holdings are subject to risk and may change at any time.
What were the fund costs during the last year ?
(Based on a hypothetical $10,000 investment)
| Fund (Class) | Costs of a $10,000 investment | Costs paid as a percentage of a $10,000 investment |
| Multimanager 2045 Lifetime Portfolio (Class A/JLJAX) |
$45 | 0.41% |
Management’s Discussion of Fund Performance
SUMMARY OF RESULTS
Multimanager 2045 Lifetime Portfolio (Class A/JLJAX) returned 18.91% (excluding sales charges) for the year ended August 31, 2026. Global equities produced sizable gains in the 12-month period that ended on August 31, 2026. Investors were encouraged by the favorable combination of healthy economic growth trends, robust corporate earnings, and generally supportive central bank policies, together with optimism about artificial intelligence. While technology stocks performed very well, the value style outpaced growth on a global basis and contributed meaningfully to the markets’ strong showing. Emerging market equities also posted outsized returns. Bonds registered more modest gains, led by credit-oriented investments. Income was the primary contributor to total returns for fixed income instruments, as prices came under pressure from concerns about persistent inflation, global conflicts, energy prices, and mounting government debt across the developed world.
TOP PERFORMANCE CONTRIBUTORS
Equity allocation | U.S. equities made a significant contribution to absolute performance, led by large cap equities. International developed market equities further helped results, as did emerging market stocks. Defensive equities also generated positive returns. The real assets portfolio was an additional contributor with strong returns for energy stocks and the metals & mining sector.
Bond funds | The fixed-income allocation contributed positively, led by intermediate-term bonds and emerging markets debt. Holdings in high yield bonds and short-term bonds aided returns as well.
TOP PERFORMANCE DETRACTORS
Specific positions | At a time of positive returns for most segments of the financial markets, the majority of the fund’s holdings recorded a gain. However, small positions in U.S. Treasury STRIPS (Separate Trading of Registered Interest and Principal of Securities) were adversely affected by rising yields.
The views expressed in this report are those of the portfolio management team and are subject to change. They are not meant as investment advice.
Fund Performance
The following graph compares the initial and subsequent account values at the end of each of the most recently completed 10 fiscal years of the fund (or for the life of the fund, if shorter). It assumes a $10,000 initial investment in the fund and in an appropriate, broad-based securities market index for the same period.
GROWTH OF $10,000
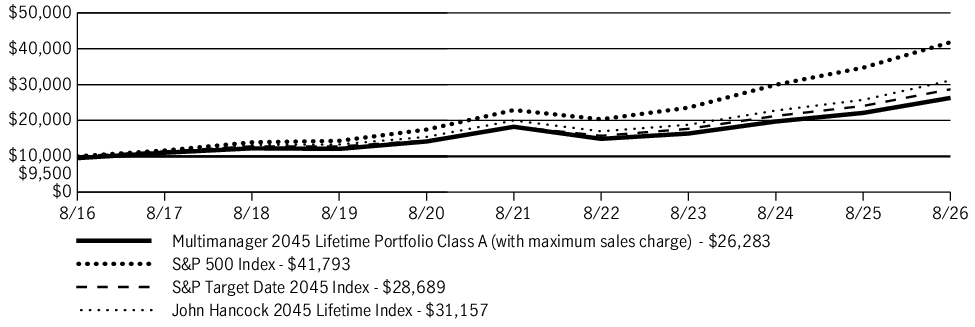
| AVERAGE ANNUAL TOTAL RETURN | 1 Year | 5 Years | 10 Years |
| Multimanager 2045 Lifetime Portfolio (Class A/JLJAX) | 12.96% | 6.49% | 10.15% |
| Multimanager 2045 Lifetime Portfolio (Class A/JLJAX)—excluding sales charge | 18.91% | 7.59% | 10.71% |
| S&P 500 Index | 20.38% | 12.79% | 15.37% |
| S&P Target Date 2045 Index | 19.33% | 9.45% | 11.11% |
| John Hancock 2045 Lifetime Index | 21.02% | 9.28% | 12.03% |
Fund Statistics
| Fund net assets | $1,024,345,141 |
| Total number of portfolio holdings | 85 |
| Total advisory fees paid (net) | $0 |
| Portfolio turnover rate | 20% |
Graphical Representation of Holdings
The table below shows the investment makeup of the fund, representing a percentage of the total net assets of the fund.
Asset Allocation
| Affiliated investment companies | 93.6% |
| Equity | 81.1% |
| International equity | 26.9% |
| U.S. large cap | 26.0% |
| Large blend | 15.3% |
| U.S. mid cap | 7.4% |
| Emerging-market equity | 4.3% |
| U.S. small cap | 1.2% |
| Fixed income | 11.0% |
| Intermediate bond | 6.3% |
| Short-term bond | 2.3% |
| Emerging-market debt | 1.4% |
| High yield bond | 1.0% |
| Alternative and specialty | 1.5% |
| Sector equity | 1.0% |
| Absolute return | 0.5% |
| Unaffiliated investment companies | 5.8% |
| Equity | 5.8% |
| U.S. Government | 0.6% |
Holdings may not have been held by the fund for the entire period and are subject to change without notice. Portfolio composition is subject to review in accordance with the fund’s investment strategy and may vary in the future. Current and future portfolio holdings are subject to risk and may change at any time.
What were the fund costs during the last year ?
(Based on a hypothetical $10,000 investment)
| Fund (Class) | Costs of a $10,000 investment | Costs paid as a percentage of a $10,000 investment |
| Multimanager 2045 Lifetime Portfolio (Class 1/JLJOX) |
$5 | 0.05% |
Management’s Discussion of Fund Performance
SUMMARY OF RESULTS
Multimanager 2045 Lifetime Portfolio (Class 1/JLJOX) returned 19.43% for the year ended August 31, 2026. Global equities produced sizable gains in the 12-month period that ended on August 31, 2026. Investors were encouraged by the favorable combination of healthy economic growth trends, robust corporate earnings, and generally supportive central bank policies, together with optimism about artificial intelligence. While technology stocks performed very well, the value style outpaced growth on a global basis and contributed meaningfully to the markets’ strong showing. Emerging market equities also posted outsized returns. Bonds registered more modest gains, led by credit-oriented investments. Income was the primary contributor to total returns for fixed income instruments, as prices came under pressure from concerns about persistent inflation, global conflicts, energy prices, and mounting government debt across the developed world.
TOP PERFORMANCE CONTRIBUTORS
Equity allocation | U.S. equities made a significant contribution to absolute performance, led by large cap equities. International developed market equities further helped results, as did emerging market stocks. Defensive equities also generated positive returns. The real assets portfolio was an additional contributor with strong returns for energy stocks and the metals & mining sector.
Bond funds | The fixed-income allocation contributed positively, led by intermediate-term bonds and emerging markets debt. Holdings in high yield bonds and short-term bonds aided returns as well.
TOP PERFORMANCE DETRACTORS
Specific positions | At a time of positive returns for most segments of the financial markets, the majority of the fund’s holdings recorded a gain. However, small positions in U.S. Treasury STRIPS (Separate Trading of Registered Interest and Principal of Securities) were adversely affected by rising yields.
The views expressed in this report are those of the portfolio management team and are subject to change. They are not meant as investment advice.
Fund Performance
The following graph compares the initial and subsequent account values at the end of each of the most recently completed 10 fiscal years of the fund (or for the life of the fund, if shorter). It assumes a $10,000 initial investment in the fund and in an appropriate, broad-based securities market index for the same period.
GROWTH OF $10,000
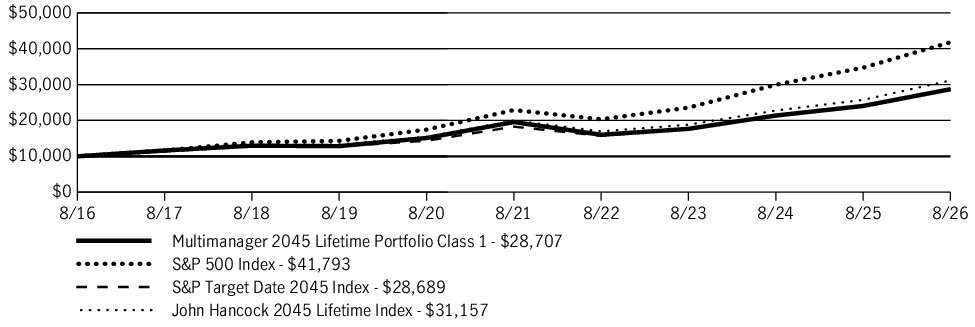
| AVERAGE ANNUAL TOTAL RETURN | 1 Year | 5 Years | 10 Years |
| Multimanager 2045 Lifetime Portfolio (Class 1/JLJOX) | 19.43% | 7.98% | 11.12% |
| S&P 500 Index | 20.38% | 12.79% | 15.37% |
| S&P Target Date 2045 Index | 19.33% | 9.45% | 11.11% |
| John Hancock 2045 Lifetime Index | 21.02% | 9.28% | 12.03% |
Fund Statistics
| Fund net assets | $1,024,345,141 |
| Total number of portfolio holdings | 85 |
| Total advisory fees paid (net) | $0 |
| Portfolio turnover rate | 20% |
Graphical Representation of Holdings
The table below shows the investment makeup of the fund, representing a percentage of the total net assets of the fund.
Asset Allocation
| Affiliated investment companies | 93.6% |
| Equity | 81.1% |
| International equity | 26.9% |
| U.S. large cap | 26.0% |
| Large blend | 15.3% |
| U.S. mid cap | 7.4% |
| Emerging-market equity | 4.3% |
| U.S. small cap | 1.2% |
| Fixed income | 11.0% |
| Intermediate bond | 6.3% |
| Short-term bond | 2.3% |
| Emerging-market debt | 1.4% |
| High yield bond | 1.0% |
| Alternative and specialty | 1.5% |
| Sector equity | 1.0% |
| Absolute return | 0.5% |
| Unaffiliated investment companies | 5.8% |
| Equity | 5.8% |
| U.S. Government | 0.6% |
Holdings may not have been held by the fund for the entire period and are subject to change without notice. Portfolio composition is subject to review in accordance with the fund’s investment strategy and may vary in the future. Current and future portfolio holdings are subject to risk and may change at any time.
What were the fund costs during the last year ?
(Based on a hypothetical $10,000 investment)
| Fund (Class) | Costs of a $10,000 investment | Costs paid as a percentage of a $10,000 investment |
| Multimanager 2050 Lifetime Portfolio (Class 1/JLKOX) |
$6 | 0.05% |
Management’s Discussion of Fund Performance
SUMMARY OF RESULTS
Multimanager 2050 Lifetime Portfolio (Class 1/JLKOX) returned 20.46% for the year ended August 31, 2026. Global equities produced sizable gains in the 12-month period that ended on August 31, 2026. Investors were encouraged by the favorable combination of healthy economic growth trends, robust corporate earnings, and generally supportive central bank policies, together with optimism about artificial intelligence. While technology stocks performed very well, the value style outpaced growth on a global basis and contributed meaningfully to the markets’ strong showing. Emerging market equities also posted outsized returns. Bonds registered more modest gains, led by credit-oriented investments. Income was the primary contributor to total returns for fixed income instruments, as prices came under pressure from concerns about persistent inflation, global conflicts, energy prices, and mounting government debt across the developed world.
TOP PERFORMANCE CONTRIBUTORS
Equity allocation | U.S. equities made a significant contribution to absolute performance, led by large cap equities. International developed market equities further helped results, as did emerging market stocks. Defensive equities also generated positive returns. The real assets portfolio was an additional contributor with strong returns for energy stocks and the metals & mining sector.
Bond funds | The fixed-income allocation contributed positively, led by short-term bonds and emerging market debt.
TOP PERFORMANCE DETRACTORS
Specific positions | At a time of positive returns for most segments of the financial markets, the majority of the fund’s holdings recorded a gain. However, small positions in U.S. Treasury STRIPS (Separate Trading of Registered Interest and Principal of Securities) were adversely affected by rising yields.
The views expressed in this report are those of the portfolio management team and are subject to change. They are not meant as investment advice.
Fund Performance
The following graph compares the initial and subsequent account values at the end of each of the most recently completed 10 fiscal years of the fund (or for the life of the fund, if shorter). It assumes a $10,000 initial investment in the fund and in an appropriate, broad-based securities market index for the same period.
GROWTH OF $10,000
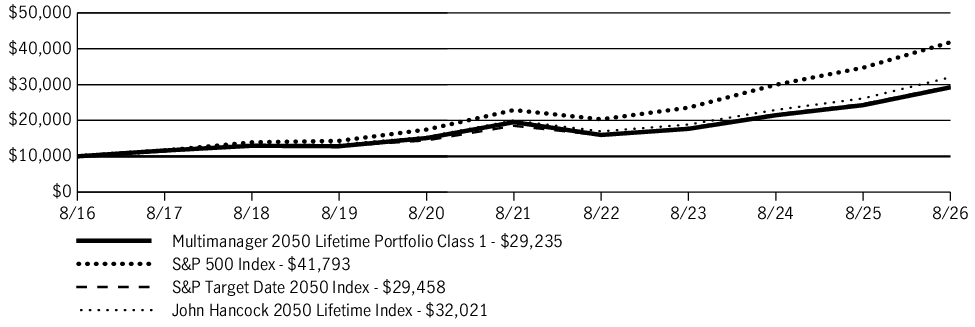
| AVERAGE ANNUAL TOTAL RETURN | 1 Year | 5 Years | 10 Years |
| Multimanager 2050 Lifetime Portfolio (Class 1/JLKOX) | 20.46% | 8.41% | 11.32% |
| S&P 500 Index | 20.38% | 12.79% | 15.37% |
| S&P Target Date 2050 Index | 19.92% | 9.75% | 11.41% |
| John Hancock 2050 Lifetime Index | 22.43% | 9.89% | 12.34% |
Fund Statistics
| Fund net assets | $697,641,979 |
| Total number of portfolio holdings | 84 |
| Total advisory fees paid (net) | $0 |
| Portfolio turnover rate | 21% |
Graphical Representation of Holdings
The table below shows the investment makeup of the fund, representing a percentage of the total net assets of the fund.
Asset Allocation
| Affiliated investment companies | 93.3% |
| Equity | 88.4% |
| U.S. large cap | 29.3% |
| International equity | 27.1% |
| Large blend | 16.2% |
| U.S. mid cap | 8.6% |
| Emerging-market equity | 5.8% |
| U.S. small cap | 1.4% |
| Fixed income | 4.2% |
| Short-term bond | 2.4% |
| Intermediate bond | 0.9% |
| Emerging-market debt | 0.6% |
| High yield bond | 0.3% |
| Alternative and specialty | 0.7% |
| Absolute return | 0.4% |
| Sector equity | 0.3% |
| Unaffiliated investment companies | 6.2% |
| Equity | 6.2% |
| U.S. Government | 0.5% |
Holdings may not have been held by the fund for the entire period and are subject to change without notice. Portfolio composition is subject to review in accordance with the fund’s investment strategy and may vary in the future. Current and future portfolio holdings are subject to risk and may change at any time.
What were the fund costs during the last year ?
(Based on a hypothetical $10,000 investment)
| Fund (Class) | Costs of a $10,000 investment | Costs paid as a percentage of a $10,000 investment |
| Multimanager 2050 Lifetime Portfolio (Class A/JLKAX) |
$45 | 0.41% |
Management’s Discussion of Fund Performance
SUMMARY OF RESULTS
Multimanager 2050 Lifetime Portfolio (Class A/JLKAX) returned 19.97% (excluding sales charges) for the year ended August 31, 2026. Global equities produced sizable gains in the 12-month period that ended on August 31, 2026. Investors were encouraged by the favorable combination of healthy economic growth trends, robust corporate earnings, and generally supportive central bank policies, together with optimism about artificial intelligence. While technology stocks performed very well, the value style outpaced growth on a global basis and contributed meaningfully to the markets’ strong showing. Emerging market equities also posted outsized returns. Bonds registered more modest gains, led by credit-oriented investments. Income was the primary contributor to total returns for fixed income instruments, as prices came under pressure from concerns about persistent inflation, global conflicts, energy prices, and mounting government debt across the developed world.
TOP PERFORMANCE CONTRIBUTORS
Equity allocation | U.S. equities made a significant contribution to absolute performance, led by large cap equities. International developed market equities further helped results, as did emerging market stocks. Defensive equities also generated positive returns. The real assets portfolio was an additional contributor with strong returns for energy stocks and the metals & mining sector.
Bond funds | The fixed-income allocation contributed positively, led by short-term bonds and emerging market debt.
TOP PERFORMANCE DETRACTORS
Specific positions | At a time of positive returns for most segments of the financial markets, the majority of the fund’s holdings recorded a gain. However, small positions in U.S. Treasury STRIPS (Separate Trading of Registered Interest and Principal of Securities) were adversely affected by rising yields.
The views expressed in this report are those of the portfolio management team and are subject to change. They are not meant as investment advice.
Fund Performance
The following graph compares the initial and subsequent account values at the end of each of the most recently completed 10 fiscal years of the fund (or for the life of the fund, if shorter). It assumes a $10,000 initial investment in the fund and in an appropriate, broad-based securities market index for the same period.
GROWTH OF $10,000
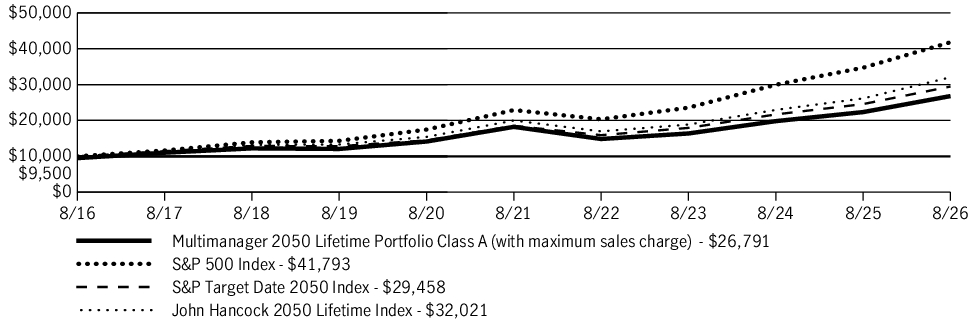
| AVERAGE ANNUAL TOTAL RETURN | 1 Year | 5 Years | 10 Years |
| Multimanager 2050 Lifetime Portfolio (Class A/JLKAX) | 13.94% | 6.92% | 10.36% |
| Multimanager 2050 Lifetime Portfolio (Class A/JLKAX)—excluding sales charge | 19.97% | 8.02% | 10.92% |
| S&P 500 Index | 20.38% | 12.79% | 15.37% |
| S&P Target Date 2050 Index | 19.92% | 9.75% | 11.41% |
| John Hancock 2050 Lifetime Index | 22.43% | 9.89% | 12.34% |
Fund Statistics
| Fund net assets | $697,641,979 |
| Total number of portfolio holdings | 84 |
| Total advisory fees paid (net) | $0 |
| Portfolio turnover rate | 21% |
Graphical Representation of Holdings
The table below shows the investment makeup of the fund, representing a percentage of the total net assets of the fund.
Asset Allocation
| Affiliated investment companies | 93.3% |
| Equity | 88.4% |
| U.S. large cap | 29.3% |
| International equity | 27.1% |
| Large blend | 16.2% |
| U.S. mid cap | 8.6% |
| Emerging-market equity | 5.8% |
| U.S. small cap | 1.4% |
| Fixed income | 4.2% |
| Short-term bond | 2.4% |
| Intermediate bond | 0.9% |
| Emerging-market debt | 0.6% |
| High yield bond | 0.3% |
| Alternative and specialty | 0.7% |
| Absolute return | 0.4% |
| Sector equity | 0.3% |
| Unaffiliated investment companies | 6.2% |
| Equity | 6.2% |
| U.S. Government | 0.5% |
Holdings may not have been held by the fund for the entire period and are subject to change without notice. Portfolio composition is subject to review in accordance with the fund’s investment strategy and may vary in the future. Current and future portfolio holdings are subject to risk and may change at any time.
What were the fund costs during the last year ?
(Based on a hypothetical $10,000 investment)
| Fund (Class) | Costs of a $10,000 investment | Costs paid as a percentage of a $10,000 investment |
| Multimanager 2050 Lifetime Portfolio (Class I/JHRPX) |
$12 | 0.11% |
Management’s Discussion of Fund Performance
SUMMARY OF RESULTS
Multimanager 2050 Lifetime Portfolio (Class I/JHRPX) returned 20.38% for the year ended August 31, 2026. Global equities produced sizable gains in the 12-month period that ended on August 31, 2026. Investors were encouraged by the favorable combination of healthy economic growth trends, robust corporate earnings, and generally supportive central bank policies, together with optimism about artificial intelligence. While technology stocks performed very well, the value style outpaced growth on a global basis and contributed meaningfully to the markets’ strong showing. Emerging market equities also posted outsized returns. Bonds registered more modest gains, led by credit-oriented investments. Income was the primary contributor to total returns for fixed income instruments, as prices came under pressure from concerns about persistent inflation, global conflicts, energy prices, and mounting government debt across the developed world.
TOP PERFORMANCE CONTRIBUTORS
Equity allocation | U.S. equities made a significant contribution to absolute performance, led by large cap equities. International developed market equities further helped results, as did emerging market stocks. Defensive equities also generated positive returns. The real assets portfolio was an additional contributor with strong returns for energy stocks and the metals & mining sector.
Bond funds | The fixed-income allocation contributed positively, led by short-term bonds and emerging market debt.
TOP PERFORMANCE DETRACTORS
Specific positions | At a time of positive returns for most segments of the financial markets, the majority of the fund’s holdings recorded a gain. However, small positions in U.S. Treasury STRIPS (Separate Trading of Registered Interest and Principal of Securities) were adversely affected by rising yields.
The views expressed in this report are those of the portfolio management team and are subject to change. They are not meant as investment advice.
Fund Performance
The following graph compares the initial and subsequent account values at the end of each of the most recently completed 10 fiscal years of the fund (or for the life of the fund, if shorter). It assumes a $250,000 initial investment in the fund and in an appropriate, broad-based securities market index for the same period.
GROWTH OF $250,000
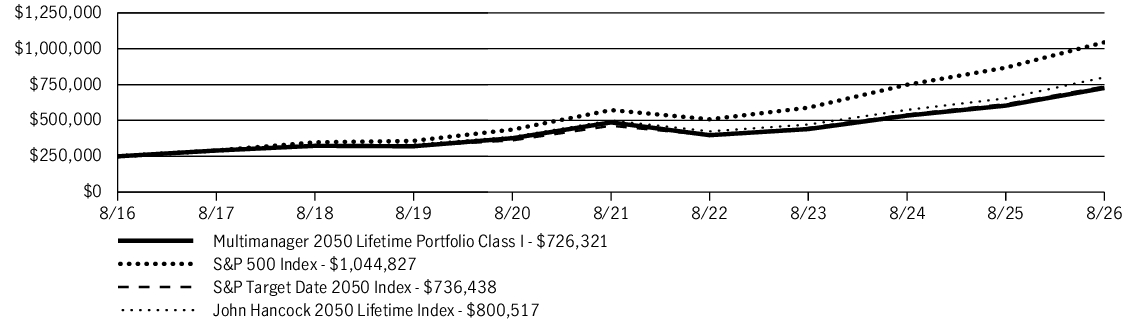
| AVERAGE ANNUAL TOTAL RETURN | 1 Year | 5 Years | 10 Years |
| Multimanager 2050 Lifetime Portfolio (Class I/JHRPX) | 20.38% | 8.35% | 11.25% |
| S&P 500 Index | 20.38% | 12.79% | 15.37% |
| S&P Target Date 2050 Index | 19.92% | 9.75% | 11.41% |
| John Hancock 2050 Lifetime Index | 22.43% | 9.89% | 12.34% |
Fund Statistics
| Fund net assets | $697,641,979 |
| Total number of portfolio holdings | 84 |
| Total advisory fees paid (net) | $0 |
| Portfolio turnover rate | 21% |
Graphical Representation of Holdings
The table below shows the investment makeup of the fund, representing a percentage of the total net assets of the fund.
Asset Allocation
| Affiliated investment companies | 93.3% |
| Equity | 88.4% |
| U.S. large cap | 29.3% |
| International equity | 27.1% |
| Large blend | 16.2% |
| U.S. mid cap | 8.6% |
| Emerging-market equity | 5.8% |
| U.S. small cap | 1.4% |
| Fixed income | 4.2% |
| Short-term bond | 2.4% |
| Intermediate bond | 0.9% |
| Emerging-market debt | 0.6% |
| High yield bond | 0.3% |
| Alternative and specialty | 0.7% |
| Absolute return | 0.4% |
| Sector equity | 0.3% |
| Unaffiliated investment companies | 6.2% |
| Equity | 6.2% |
| U.S. Government | 0.5% |
Holdings may not have been held by the fund for the entire period and are subject to change without notice. Portfolio composition is subject to review in accordance with the fund’s investment strategy and may vary in the future. Current and future portfolio holdings are subject to risk and may change at any time.
What were the fund costs during the last year ?
(Based on a hypothetical $10,000 investment)
| Fund (Class) | Costs of a $10,000 investment | Costs paid as a percentage of a $10,000 investment |
| Multimanager 2050 Lifetime Portfolio (Class R2/JLKEX) |
$55 | 0.50% |
Management’s Discussion of Fund Performance
SUMMARY OF RESULTS
Multimanager 2050 Lifetime Portfolio (Class R2/JLKEX) returned 19.89% for the year ended August 31, 2026. Global equities produced sizable gains in the 12-month period that ended on August 31, 2026. Investors were encouraged by the favorable combination of healthy economic growth trends, robust corporate earnings, and generally supportive central bank policies, together with optimism about artificial intelligence. While technology stocks performed very well, the value style outpaced growth on a global basis and contributed meaningfully to the markets’ strong showing. Emerging market equities also posted outsized returns. Bonds registered more modest gains, led by credit-oriented investments. Income was the primary contributor to total returns for fixed income instruments, as prices came under pressure from concerns about persistent inflation, global conflicts, energy prices, and mounting government debt across the developed world.
TOP PERFORMANCE CONTRIBUTORS
Equity allocation | U.S. equities made a significant contribution to absolute performance, led by large cap equities. International developed market equities further helped results, as did emerging market stocks. Defensive equities also generated positive returns. The real assets portfolio was an additional contributor with strong returns for energy stocks and the metals & mining sector.
Bond funds | The fixed-income allocation contributed positively, led by short-term bonds and emerging market debt.
TOP PERFORMANCE DETRACTORS
Specific positions | At a time of positive returns for most segments of the financial markets, the majority of the fund’s holdings recorded a gain. However, small positions in U.S. Treasury STRIPS (Separate Trading of Registered Interest and Principal of Securities) were adversely affected by rising yields.
The views expressed in this report are those of the portfolio management team and are subject to change. They are not meant as investment advice.
Fund Performance
The following graph compares the initial and subsequent account values at the end of each of the most recently completed 10 fiscal years of the fund (or for the life of the fund, if shorter). It assumes a $10,000 initial investment in the fund and in an appropriate, broad-based securities market index for the same period.
GROWTH OF $10,000
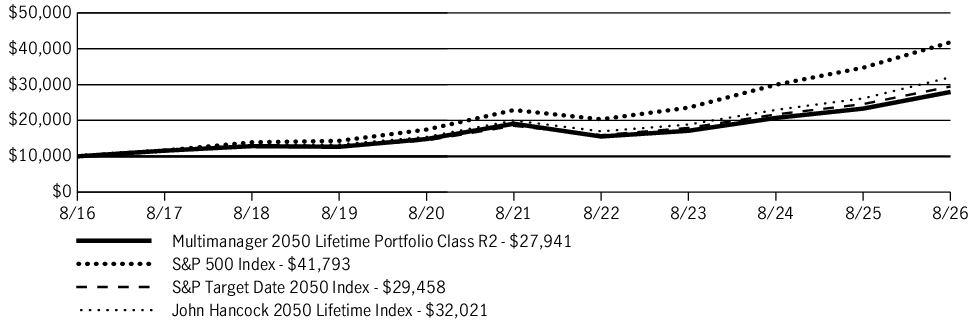
| AVERAGE ANNUAL TOTAL RETURN | 1 Year | 5 Years | 10 Years |
| Multimanager 2050 Lifetime Portfolio (Class R2/JLKEX) | 19.89% | 7.92% | 10.82% |
| S&P 500 Index | 20.38% | 12.79% | 15.37% |
| S&P Target Date 2050 Index | 19.92% | 9.75% | 11.41% |
| John Hancock 2050 Lifetime Index | 22.43% | 9.89% | 12.34% |
Fund Statistics
| Fund net assets | $697,641,979 |
| Total number of portfolio holdings | 84 |
| Total advisory fees paid (net) | $0 |
| Portfolio turnover rate | 21% |
Graphical Representation of Holdings
The table below shows the investment makeup of the fund, representing a percentage of the total net assets of the fund.
Asset Allocation
| Affiliated investment companies | 93.3% |
| Equity | 88.4% |
| U.S. large cap | 29.3% |
| International equity | 27.1% |
| Large blend | 16.2% |
| U.S. mid cap | 8.6% |
| Emerging-market equity | 5.8% |
| U.S. small cap | 1.4% |
| Fixed income | 4.2% |
| Short-term bond | 2.4% |
| Intermediate bond | 0.9% |
| Emerging-market debt | 0.6% |
| High yield bond | 0.3% |
| Alternative and specialty | 0.7% |
| Absolute return | 0.4% |
| Sector equity | 0.3% |
| Unaffiliated investment companies | 6.2% |
| Equity | 6.2% |
| U.S. Government | 0.5% |
Holdings may not have been held by the fund for the entire period and are subject to change without notice. Portfolio composition is subject to review in accordance with the fund’s investment strategy and may vary in the future. Current and future portfolio holdings are subject to risk and may change at any time.
What were the fund costs during the last year ?
(Based on a hypothetical $10,000 investment)
| Fund (Class) | Costs of a $10,000 investment | Costs paid as a percentage of a $10,000 investment |
| Multimanager 2050 Lifetime Portfolio (Class R4/JLKGX) |
$28 | 0.25% |
Management’s Discussion of Fund Performance
SUMMARY OF RESULTS
Multimanager 2050 Lifetime Portfolio (Class R4/JLKGX) returned 20.13% for the year ended August 31, 2026. Global equities produced sizable gains in the 12-month period that ended on August 31, 2026. Investors were encouraged by the favorable combination of healthy economic growth trends, robust corporate earnings, and generally supportive central bank policies, together with optimism about artificial intelligence. While technology stocks performed very well, the value style outpaced growth on a global basis and contributed meaningfully to the markets’ strong showing. Emerging market equities also posted outsized returns. Bonds registered more modest gains, led by credit-oriented investments. Income was the primary contributor to total returns for fixed income instruments, as prices came under pressure from concerns about persistent inflation, global conflicts, energy prices, and mounting government debt across the developed world.
TOP PERFORMANCE CONTRIBUTORS
Equity allocation | U.S. equities made a significant contribution to absolute performance, led by large cap equities. International developed market equities further helped results, as did emerging market stocks. Defensive equities also generated positive returns. The real assets portfolio was an additional contributor with strong returns for energy stocks and the metals & mining sector.
Bond funds | The fixed-income allocation contributed positively, led by short-term bonds and emerging market debt.
TOP PERFORMANCE DETRACTORS
Specific positions | At a time of positive returns for most segments of the financial markets, the majority of the fund’s holdings recorded a gain. However, small positions in U.S. Treasury STRIPS (Separate Trading of Registered Interest and Principal of Securities) were adversely affected by rising yields.
The views expressed in this report are those of the portfolio management team and are subject to change. They are not meant as investment advice.
Fund Performance
The following graph compares the initial and subsequent account values at the end of each of the most recently completed 10 fiscal years of the fund (or for the life of the fund, if shorter). It assumes a $10,000 initial investment in the fund and in an appropriate, broad-based securities market index for the same period.
GROWTH OF $10,000
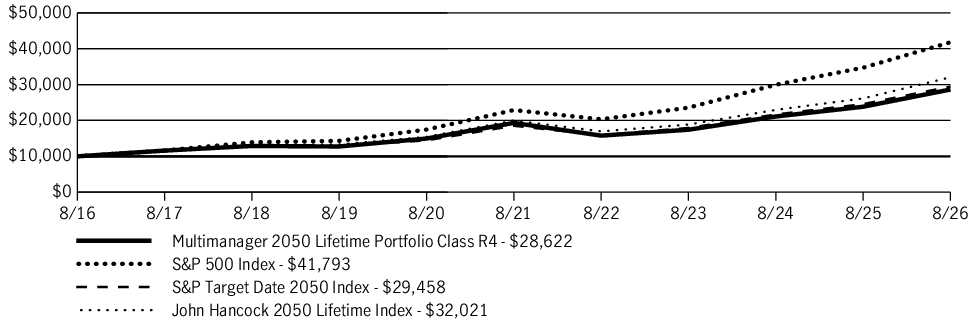
| AVERAGE ANNUAL TOTAL RETURN | 1 Year | 5 Years | 10 Years |
| Multimanager 2050 Lifetime Portfolio (Class R4/JLKGX) | 20.13% | 8.18% | 11.09% |
| S&P 500 Index | 20.38% | 12.79% | 15.37% |
| S&P Target Date 2050 Index | 19.92% | 9.75% | 11.41% |
| John Hancock 2050 Lifetime Index | 22.43% | 9.89% | 12.34% |
Fund Statistics
| Fund net assets | $697,641,979 |
| Total number of portfolio holdings | 84 |
| Total advisory fees paid (net) | $0 |
| Portfolio turnover rate | 21% |
Graphical Representation of Holdings
The table below shows the investment makeup of the fund, representing a percentage of the total net assets of the fund.
Asset Allocation
| Affiliated investment companies | 93.3% |
| Equity | 88.4% |
| U.S. large cap | 29.3% |
| International equity | 27.1% |
| Large blend | 16.2% |
| U.S. mid cap | 8.6% |
| Emerging-market equity | 5.8% |
| U.S. small cap | 1.4% |
| Fixed income | 4.2% |
| Short-term bond | 2.4% |
| Intermediate bond | 0.9% |
| Emerging-market debt | 0.6% |
| High yield bond | 0.3% |
| Alternative and specialty | 0.7% |
| Absolute return | 0.4% |
| Sector equity | 0.3% |
| Unaffiliated investment companies | 6.2% |
| Equity | 6.2% |
| U.S. Government | 0.5% |
Holdings may not have been held by the fund for the entire period and are subject to change without notice. Portfolio composition is subject to review in accordance with the fund’s investment strategy and may vary in the future. Current and future portfolio holdings are subject to risk and may change at any time.
What were the fund costs during the last year ?
(Based on a hypothetical $10,000 investment)
| Fund (Class) | Costs of a $10,000 investment | Costs paid as a percentage of a $10,000 investment |
| Multimanager 2050 Lifetime Portfolio (Class R5/JLKHX) |
$6 | 0.05% |
Management’s Discussion of Fund Performance
SUMMARY OF RESULTS
Multimanager 2050 Lifetime Portfolio (Class R5/JLKHX) returned 20.42% for the year ended August 31, 2026. Global equities produced sizable gains in the 12-month period that ended on August 31, 2026. Investors were encouraged by the favorable combination of healthy economic growth trends, robust corporate earnings, and generally supportive central bank policies, together with optimism about artificial intelligence. While technology stocks performed very well, the value style outpaced growth on a global basis and contributed meaningfully to the markets’ strong showing. Emerging market equities also posted outsized returns. Bonds registered more modest gains, led by credit-oriented investments. Income was the primary contributor to total returns for fixed income instruments, as prices came under pressure from concerns about persistent inflation, global conflicts, energy prices, and mounting government debt across the developed world.
TOP PERFORMANCE CONTRIBUTORS
Equity allocation | U.S. equities made a significant contribution to absolute performance, led by large cap equities. International developed market equities further helped results, as did emerging market stocks. Defensive equities also generated positive returns. The real assets portfolio was an additional contributor with strong returns for energy stocks and the metals & mining sector.
Bond funds | The fixed-income allocation contributed positively, led by short-term bonds and emerging market debt.
TOP PERFORMANCE DETRACTORS
Specific positions | At a time of positive returns for most segments of the financial markets, the majority of the fund’s holdings recorded a gain. However, small positions in U.S. Treasury STRIPS (Separate Trading of Registered Interest and Principal of Securities) were adversely affected by rising yields.
The views expressed in this report are those of the portfolio management team and are subject to change. They are not meant as investment advice.
Fund Performance
The following graph compares the initial and subsequent account values at the end of each of the most recently completed 10 fiscal years of the fund (or for the life of the fund, if shorter). It assumes a $10,000 initial investment in the fund and in an appropriate, broad-based securities market index for the same period.
GROWTH OF $10,000
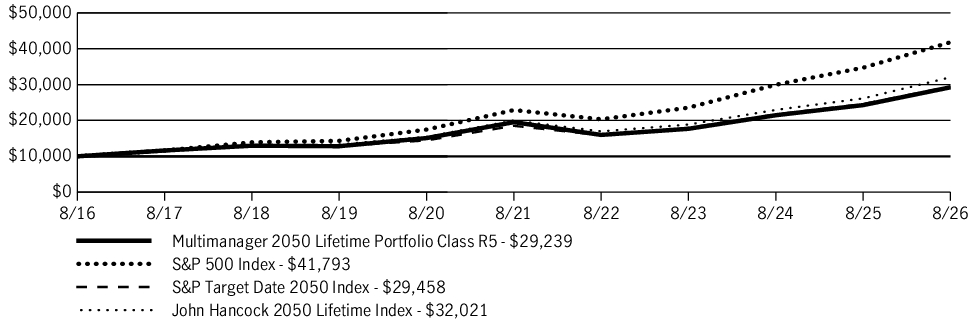
| AVERAGE ANNUAL TOTAL RETURN | 1 Year | 5 Years | 10 Years |
| Multimanager 2050 Lifetime Portfolio (Class R5/JLKHX) | 20.42% | 8.42% | 11.33% |
| S&P 500 Index | 20.38% | 12.79% | 15.37% |
| S&P Target Date 2050 Index | 19.92% | 9.75% | 11.41% |
| John Hancock 2050 Lifetime Index | 22.43% | 9.89% | 12.34% |
Fund Statistics
| Fund net assets | $697,641,979 |
| Total number of portfolio holdings | 84 |
| Total advisory fees paid (net) | $0 |
| Portfolio turnover rate | 21% |
Graphical Representation of Holdings
The table below shows the investment makeup of the fund, representing a percentage of the total net assets of the fund.
Asset Allocation
| Affiliated investment companies | 93.3% |
| Equity | 88.4% |
| U.S. large cap | 29.3% |
| International equity | 27.1% |
| Large blend | 16.2% |
| U.S. mid cap | 8.6% |
| Emerging-market equity | 5.8% |
| U.S. small cap | 1.4% |
| Fixed income | 4.2% |
| Short-term bond | 2.4% |
| Intermediate bond | 0.9% |
| Emerging-market debt | 0.6% |
| High yield bond | 0.3% |
| Alternative and specialty | 0.7% |
| Absolute return | 0.4% |
| Sector equity | 0.3% |
| Unaffiliated investment companies | 6.2% |
| Equity | 6.2% |
| U.S. Government | 0.5% |
Holdings may not have been held by the fund for the entire period and are subject to change without notice. Portfolio composition is subject to review in accordance with the fund’s investment strategy and may vary in the future. Current and future portfolio holdings are subject to risk and may change at any time.
What were the fund costs during the last year ?
(Based on a hypothetical $10,000 investment)
| Fund (Class) | Costs of a $10,000 investment | Costs paid as a percentage of a $10,000 investment |
| Multimanager 2050 Lifetime Portfolio (Class R6/JLKRX) |
$0 | 0.00% |
Management’s Discussion of Fund Performance
SUMMARY OF RESULTS
Multimanager 2050 Lifetime Portfolio (Class R6/JLKRX) returned 20.46% for the year ended August 31, 2026. Global equities produced sizable gains in the 12-month period that ended on August 31, 2026. Investors were encouraged by the favorable combination of healthy economic growth trends, robust corporate earnings, and generally supportive central bank policies, together with optimism about artificial intelligence. While technology stocks performed very well, the value style outpaced growth on a global basis and contributed meaningfully to the markets’ strong showing. Emerging market equities also posted outsized returns. Bonds registered more modest gains, led by credit-oriented investments. Income was the primary contributor to total returns for fixed income instruments, as prices came under pressure from concerns about persistent inflation, global conflicts, energy prices, and mounting government debt across the developed world.
TOP PERFORMANCE CONTRIBUTORS
Equity allocation | U.S. equities made a significant contribution to absolute performance, led by large cap equities. International developed market equities further helped results, as did emerging market stocks. Defensive equities also generated positive returns. The real assets portfolio was an additional contributor with strong returns for energy stocks and the metals & mining sector.
Bond funds | The fixed-income allocation contributed positively, led by short-term bonds and emerging market debt.
TOP PERFORMANCE DETRACTORS
Specific positions | At a time of positive returns for most segments of the financial markets, the majority of the fund’s holdings recorded a gain. However, small positions in U.S. Treasury STRIPS (Separate Trading of Registered Interest and Principal of Securities) were adversely affected by rising yields.
The views expressed in this report are those of the portfolio management team and are subject to change. They are not meant as investment advice.
Fund Performance
The following graph compares the initial and subsequent account values at the end of each of the most recently completed 10 fiscal years of the fund (or for the life of the fund, if shorter). It assumes a $1,000,000 initial investment in the fund and in an appropriate, broad-based securities market index for the same period.
GROWTH OF $1,000,000
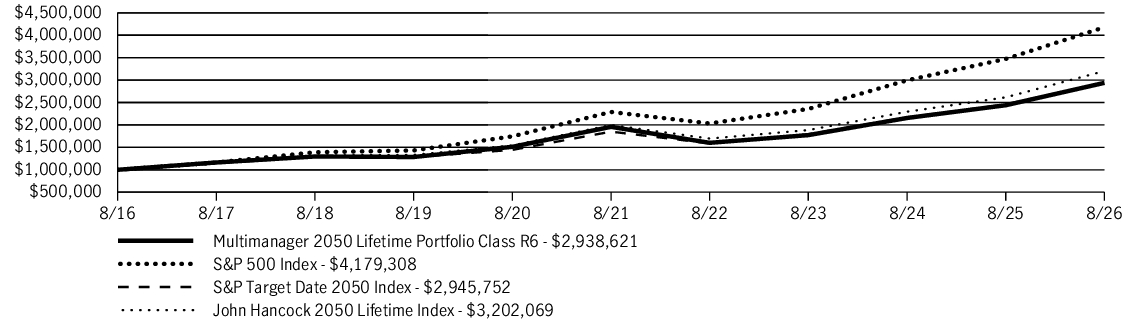
| AVERAGE ANNUAL TOTAL RETURN | 1 Year | 5 Years | 10 Years |
| Multimanager 2050 Lifetime Portfolio (Class R6/JLKRX) | 20.46% | 8.47% | 11.38% |
| S&P 500 Index | 20.38% | 12.79% | 15.37% |
| S&P Target Date 2050 Index | 19.92% | 9.75% | 11.41% |
| John Hancock 2050 Lifetime Index | 22.43% | 9.89% | 12.34% |
Fund Statistics
| Fund net assets | $697,641,979 |
| Total number of portfolio holdings | 84 |
| Total advisory fees paid (net) | $0 |
| Portfolio turnover rate | 21% |
Graphical Representation of Holdings
The table below shows the investment makeup of the fund, representing a percentage of the total net assets of the fund.
Asset Allocation
| Affiliated investment companies | 93.3% |
| Equity | 88.4% |
| U.S. large cap | 29.3% |
| International equity | 27.1% |
| Large blend | 16.2% |
| U.S. mid cap | 8.6% |
| Emerging-market equity | 5.8% |
| U.S. small cap | 1.4% |
| Fixed income | 4.2% |
| Short-term bond | 2.4% |
| Intermediate bond | 0.9% |
| Emerging-market debt | 0.6% |
| High yield bond | 0.3% |
| Alternative and specialty | 0.7% |
| Absolute return | 0.4% |
| Sector equity | 0.3% |
| Unaffiliated investment companies | 6.2% |
| Equity | 6.2% |
| U.S. Government | 0.5% |
Holdings may not have been held by the fund for the entire period and are subject to change without notice. Portfolio composition is subject to review in accordance with the fund’s investment strategy and may vary in the future. Current and future portfolio holdings are subject to risk and may change at any time.
What were the fund costs during the last year ?
(Based on a hypothetical $10,000 investment)
| Fund (Class) | Costs of a $10,000 investment | Costs paid as a percentage of a $10,000 investment |
| Multimanager 2055 Lifetime Portfolio (Class R6/JLKTX) |
$0 | 0.00% |
Management’s Discussion of Fund Performance
SUMMARY OF RESULTS
Multimanager 2055 Lifetime Portfolio (Class R6/JLKTX) returned 20.41% for the year ended August 31, 2026. Global equities produced sizable gains in the 12-month period that ended on August 31, 2026. Investors were encouraged by the favorable combination of healthy economic growth trends, robust corporate earnings, and generally supportive central bank policies, together with optimism about artificial intelligence. While technology stocks performed very well, the value style outpaced growth on a global basis and contributed meaningfully to the markets’ strong showing. Emerging market equities also posted outsized returns. Bonds registered more modest gains, led by credit-oriented investments. Income was the primary contributor to total returns for fixed income instruments, as prices came under pressure from concerns about persistent inflation, global conflicts, energy prices, and mounting government debt across the developed world.
TOP PERFORMANCE CONTRIBUTORS
Equity allocation | U.S. equities made a significant contribution to absolute performance, led by large cap equities. International developed market equities further helped results, as did emerging market stocks. Defensive equities also generated positive returns.
Bond funds | The fixed-income allocation contributed positively, led by short-term bonds and emerging market debt.
TOP PERFORMANCE DETRACTORS
Specific positions | At a time of positive returns for most segments of the financial markets, the majority of the fund’s holdings recorded a gain. However, a small position in U.S. Treasury STRIPS (Separate Trading of Registered Interest and Principal of Securities) was adversely affected by rising yields.
The views expressed in this report are those of the portfolio management team and are subject to change. They are not meant as investment advice.
Fund Performance
The following graph compares the initial and subsequent account values at the end of each of the most recently completed 10 fiscal years of the fund (or for the life of the fund, if shorter). It assumes a $1,000,000 initial investment in the fund and in an appropriate, broad-based securities market index for the same period.
GROWTH OF $1,000,000
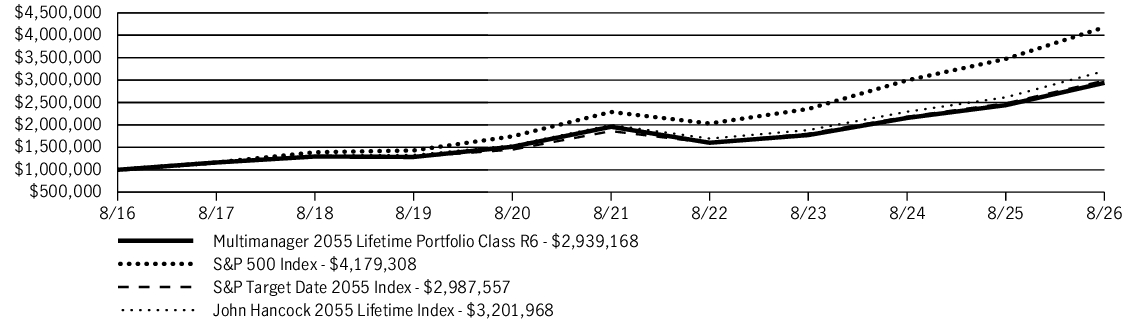
| AVERAGE ANNUAL TOTAL RETURN | 1 Year | 5 Years | 10 Years |
| Multimanager 2055 Lifetime Portfolio (Class R6/JLKTX) | 20.41% | 8.45% | 11.38% |
| S&P 500 Index | 20.38% | 12.79% | 15.37% |
| S&P Target Date 2055 Index | 20.42% | 9.92% | 11.57% |
| John Hancock 2055 Lifetime Index | 22.43% | 9.89% | 12.34% |
Fund Statistics
| Fund net assets | $482,927,299 |
| Total number of portfolio holdings | 83 |
| Total advisory fees paid (net) | $0 |
| Portfolio turnover rate | 20% |
Graphical Representation of Holdings
The table below shows the investment makeup of the fund, representing a percentage of the total net assets of the fund.
Asset Allocation
| Affiliated investment companies | 93.2% |
| Equity | 89.0% |
| U.S. large cap | 29.5% |
| International equity | 27.1% |
| Large blend | 16.3% |
| U.S. mid cap | 8.9% |
| Emerging-market equity | 5.8% |
| U.S. small cap | 1.4% |
| Fixed income | 3.7% |
| Short-term bond | 2.4% |
| Emerging-market debt | 0.5% |
| Intermediate bond | 0.5% |
| High yield bond | 0.3% |
| Alternative and specialty | 0.5% |
| Absolute return | 0.5% |
| Unaffiliated investment companies | 6.3% |
| Equity | 6.3% |
| U.S. Government | 0.5% |
Holdings may not have been held by the fund for the entire period and are subject to change without notice. Portfolio composition is subject to review in accordance with the fund’s investment strategy and may vary in the future. Current and future portfolio holdings are subject to risk and may change at any time.
What were the fund costs during the last year ?
(Based on a hypothetical $10,000 investment)
| Fund (Class) | Costs of a $10,000 investment | Costs paid as a percentage of a $10,000 investment |
| Multimanager 2055 Lifetime Portfolio (Class R5/JLKSX) |
$6 | 0.05% |
Management’s Discussion of Fund Performance
SUMMARY OF RESULTS
Multimanager 2055 Lifetime Portfolio (Class R5/JLKSX) returned 20.35% for the year ended August 31, 2026. Global equities produced sizable gains in the 12-month period that ended on August 31, 2026. Investors were encouraged by the favorable combination of healthy economic growth trends, robust corporate earnings, and generally supportive central bank policies, together with optimism about artificial intelligence. While technology stocks performed very well, the value style outpaced growth on a global basis and contributed meaningfully to the markets’ strong showing. Emerging market equities also posted outsized returns. Bonds registered more modest gains, led by credit-oriented investments. Income was the primary contributor to total returns for fixed income instruments, as prices came under pressure from concerns about persistent inflation, global conflicts, energy prices, and mounting government debt across the developed world.
TOP PERFORMANCE CONTRIBUTORS
Equity allocation | U.S. equities made a significant contribution to absolute performance, led by large cap equities. International developed market equities further helped results, as did emerging market stocks. Defensive equities also generated positive returns.
Bond funds | The fixed-income allocation contributed positively, led by short-term bonds and emerging market debt.
TOP PERFORMANCE DETRACTORS
Specific positions | At a time of positive returns for most segments of the financial markets, the majority of the fund’s holdings recorded a gain. However, a small position in U.S. Treasury STRIPS (Separate Trading of Registered Interest and Principal of Securities) was adversely affected by rising yields.
The views expressed in this report are those of the portfolio management team and are subject to change. They are not meant as investment advice.
Fund Performance
The following graph compares the initial and subsequent account values at the end of each of the most recently completed 10 fiscal years of the fund (or for the life of the fund, if shorter). It assumes a $10,000 initial investment in the fund and in an appropriate, broad-based securities market index for the same period.
GROWTH OF $10,000
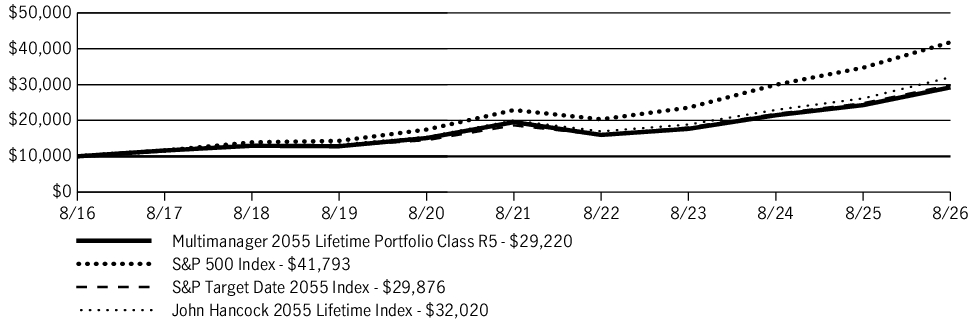
| AVERAGE ANNUAL TOTAL RETURN | 1 Year | 5 Years | 10 Years |
| Multimanager 2055 Lifetime Portfolio (Class R5/JLKSX) | 20.35% | 8.39% | 11.32% |
| S&P 500 Index | 20.38% | 12.79% | 15.37% |
| S&P Target Date 2055 Index | 20.42% | 9.92% | 11.57% |
| John Hancock 2055 Lifetime Index | 22.43% | 9.89% | 12.34% |
Fund Statistics
| Fund net assets | $482,927,299 |
| Total number of portfolio holdings | 83 |
| Total advisory fees paid (net) | $0 |
| Portfolio turnover rate | 20% |
Graphical Representation of Holdings
The table below shows the investment makeup of the fund, representing a percentage of the total net assets of the fund.
Asset Allocation
| Affiliated investment companies | 93.2% |
| Equity | 89.0% |
| U.S. large cap | 29.5% |
| International equity | 27.1% |
| Large blend | 16.3% |
| U.S. mid cap | 8.9% |
| Emerging-market equity | 5.8% |
| U.S. small cap | 1.4% |
| Fixed income | 3.7% |
| Short-term bond | 2.4% |
| Emerging-market debt | 0.5% |
| Intermediate bond | 0.5% |
| High yield bond | 0.3% |
| Alternative and specialty | 0.5% |
| Absolute return | 0.5% |
| Unaffiliated investment companies | 6.3% |
| Equity | 6.3% |
| U.S. Government | 0.5% |
Holdings may not have been held by the fund for the entire period and are subject to change without notice. Portfolio composition is subject to review in accordance with the fund’s investment strategy and may vary in the future. Current and future portfolio holdings are subject to risk and may change at any time.
What were the fund costs during the last year ?
(Based on a hypothetical $10,000 investment)
| Fund (Class) | Costs of a $10,000 investment | Costs paid as a percentage of a $10,000 investment |
| Multimanager 2055 Lifetime Portfolio (Class R4/JLKQX) |
$19 | 0.17% |
Management’s Discussion of Fund Performance
SUMMARY OF RESULTS
Multimanager 2055 Lifetime Portfolio (Class R4/JLKQX) returned 20.32% for the year ended August 31, 2026. Global equities produced sizable gains in the 12-month period that ended on August 31, 2026. Investors were encouraged by the favorable combination of healthy economic growth trends, robust corporate earnings, and generally supportive central bank policies, together with optimism about artificial intelligence. While technology stocks performed very well, the value style outpaced growth on a global basis and contributed meaningfully to the markets’ strong showing. Emerging market equities also posted outsized returns. Bonds registered more modest gains, led by credit-oriented investments. Income was the primary contributor to total returns for fixed income instruments, as prices came under pressure from concerns about persistent inflation, global conflicts, energy prices, and mounting government debt across the developed world.
TOP PERFORMANCE CONTRIBUTORS
Equity allocation | U.S. equities made a significant contribution to absolute performance, led by large cap equities. International developed market equities further helped results, as did emerging market stocks. Defensive equities also generated positive returns.
Bond funds | The fixed-income allocation contributed positively, led by short-term bonds and emerging market debt.
TOP PERFORMANCE DETRACTORS
Specific positions | At a time of positive returns for most segments of the financial markets, the majority of the fund’s holdings recorded a gain. However, a small position in U.S. Treasury STRIPS (Separate Trading of Registered Interest and Principal of Securities) was adversely affected by rising yields.
The views expressed in this report are those of the portfolio management team and are subject to change. They are not meant as investment advice.
Fund Performance
The following graph compares the initial and subsequent account values at the end of each of the most recently completed 10 fiscal years of the fund (or for the life of the fund, if shorter). It assumes a $10,000 initial investment in the fund and in an appropriate, broad-based securities market index for the same period.
GROWTH OF $10,000
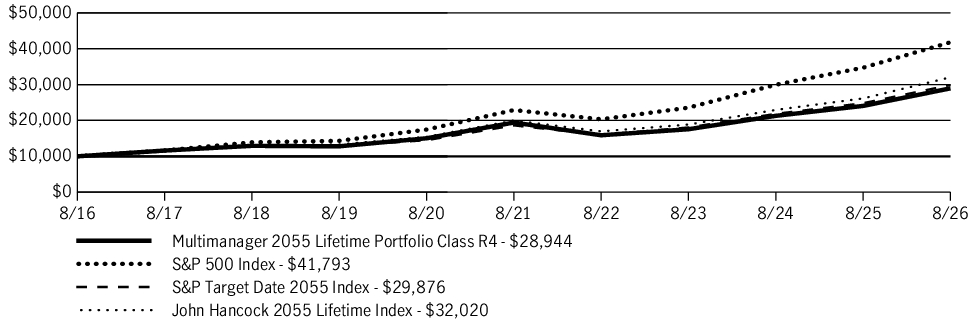
| AVERAGE ANNUAL TOTAL RETURN | 1 Year | 5 Years | 10 Years |
| Multimanager 2055 Lifetime Portfolio (Class R4/JLKQX) | 20.32% | 8.31% | 11.21% |
| S&P 500 Index | 20.38% | 12.79% | 15.37% |
| S&P Target Date 2055 Index | 20.42% | 9.92% | 11.57% |
| John Hancock 2055 Lifetime Index | 22.43% | 9.89% | 12.34% |
Fund Statistics
| Fund net assets | $482,927,299 |
| Total number of portfolio holdings | 83 |
| Total advisory fees paid (net) | $0 |
| Portfolio turnover rate | 20% |
Graphical Representation of Holdings
The table below shows the investment makeup of the fund, representing a percentage of the total net assets of the fund.
Asset Allocation
| Affiliated investment companies | 93.2% |
| Equity | 89.0% |
| U.S. large cap | 29.5% |
| International equity | 27.1% |
| Large blend | 16.3% |
| U.S. mid cap | 8.9% |
| Emerging-market equity | 5.8% |
| U.S. small cap | 1.4% |
| Fixed income | 3.7% |
| Short-term bond | 2.4% |
| Emerging-market debt | 0.5% |
| Intermediate bond | 0.5% |
| High yield bond | 0.3% |
| Alternative and specialty | 0.5% |
| Absolute return | 0.5% |
| Unaffiliated investment companies | 6.3% |
| Equity | 6.3% |
| U.S. Government | 0.5% |
Holdings may not have been held by the fund for the entire period and are subject to change without notice. Portfolio composition is subject to review in accordance with the fund’s investment strategy and may vary in the future. Current and future portfolio holdings are subject to risk and may change at any time.
What were the fund costs during the last year ?
(Based on a hypothetical $10,000 investment)
| Fund (Class) | Costs of a $10,000 investment | Costs paid as a percentage of a $10,000 investment |
| Multimanager 2055 Lifetime Portfolio (Class R2/JLKNX) |
$55 | 0.50% |
Management’s Discussion of Fund Performance
SUMMARY OF RESULTS
Multimanager 2055 Lifetime Portfolio (Class R2/JLKNX) returned 19.84% for the year ended August 31, 2026. Global equities produced sizable gains in the 12-month period that ended on August 31, 2026. Investors were encouraged by the favorable combination of healthy economic growth trends, robust corporate earnings, and generally supportive central bank policies, together with optimism about artificial intelligence. While technology stocks performed very well, the value style outpaced growth on a global basis and contributed meaningfully to the markets’ strong showing. Emerging market equities also posted outsized returns. Bonds registered more modest gains, led by credit-oriented investments. Income was the primary contributor to total returns for fixed income instruments, as prices came under pressure from concerns about persistent inflation, global conflicts, energy prices, and mounting government debt across the developed world.
TOP PERFORMANCE CONTRIBUTORS
Equity allocation | U.S. equities made a significant contribution to absolute performance, led by large cap equities. International developed market equities further helped results, as did emerging market stocks. Defensive equities also generated positive returns.
Bond funds | The fixed-income allocation contributed positively, led by short-term bonds and emerging market debt.
TOP PERFORMANCE DETRACTORS
Specific positions | At a time of positive returns for most segments of the financial markets, the majority of the fund’s holdings recorded a gain. However, a small position in U.S. Treasury STRIPS (Separate Trading of Registered Interest and Principal of Securities) was adversely affected by rising yields.
The views expressed in this report are those of the portfolio management team and are subject to change. They are not meant as investment advice.
Fund Performance
The following graph compares the initial and subsequent account values at the end of each of the most recently completed 10 fiscal years of the fund (or for the life of the fund, if shorter). It assumes a $10,000 initial investment in the fund and in an appropriate, broad-based securities market index for the same period.
GROWTH OF $10,000
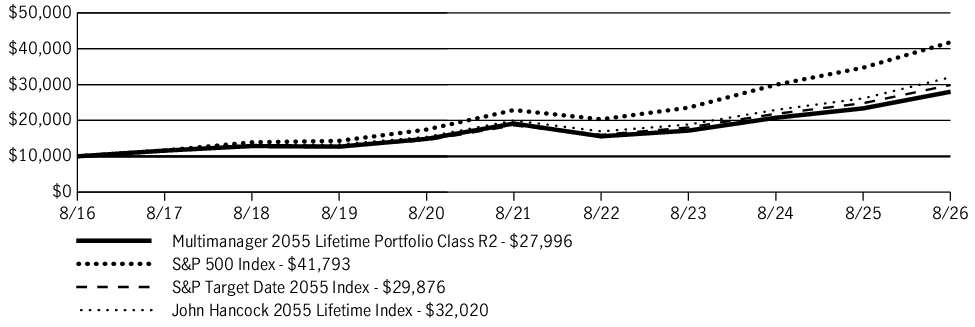
| AVERAGE ANNUAL TOTAL RETURN | 1 Year | 5 Years | 10 Years |
| Multimanager 2055 Lifetime Portfolio (Class R2/JLKNX) | 19.84% | 7.90% | 10.84% |
| S&P 500 Index | 20.38% | 12.79% | 15.37% |
| S&P Target Date 2055 Index | 20.42% | 9.92% | 11.57% |
| John Hancock 2055 Lifetime Index | 22.43% | 9.89% | 12.34% |
Fund Statistics
| Fund net assets | $482,927,299 |
| Total number of portfolio holdings | 83 |
| Total advisory fees paid (net) | $0 |
| Portfolio turnover rate | 20% |
Graphical Representation of Holdings
The table below shows the investment makeup of the fund, representing a percentage of the total net assets of the fund.
Asset Allocation
| Affiliated investment companies | 93.2% |
| Equity | 89.0% |
| U.S. large cap | 29.5% |
| International equity | 27.1% |
| Large blend | 16.3% |
| U.S. mid cap | 8.9% |
| Emerging-market equity | 5.8% |
| U.S. small cap | 1.4% |
| Fixed income | 3.7% |
| Short-term bond | 2.4% |
| Emerging-market debt | 0.5% |
| Intermediate bond | 0.5% |
| High yield bond | 0.3% |
| Alternative and specialty | 0.5% |
| Absolute return | 0.5% |
| Unaffiliated investment companies | 6.3% |
| Equity | 6.3% |
| U.S. Government | 0.5% |
Holdings may not have been held by the fund for the entire period and are subject to change without notice. Portfolio composition is subject to review in accordance with the fund’s investment strategy and may vary in the future. Current and future portfolio holdings are subject to risk and may change at any time.
What were the fund costs during the last year ?
(Based on a hypothetical $10,000 investment)
| Fund (Class) | Costs of a $10,000 investment | Costs paid as a percentage of a $10,000 investment |
| Multimanager 2055 Lifetime Portfolio (Class I/JHRTX) |
$12 | 0.11% |
Management’s Discussion of Fund Performance
SUMMARY OF RESULTS
Multimanager 2055 Lifetime Portfolio (Class I/JHRTX) returned 20.40% for the year ended August 31, 2026. Global equities produced sizable gains in the 12-month period that ended on August 31, 2026. Investors were encouraged by the favorable combination of healthy economic growth trends, robust corporate earnings, and generally supportive central bank policies, together with optimism about artificial intelligence. While technology stocks performed very well, the value style outpaced growth on a global basis and contributed meaningfully to the markets’ strong showing. Emerging market equities also posted outsized returns. Bonds registered more modest gains, led by credit-oriented investments. Income was the primary contributor to total returns for fixed income instruments, as prices came under pressure from concerns about persistent inflation, global conflicts, energy prices, and mounting government debt across the developed world.
TOP PERFORMANCE CONTRIBUTORS
Equity allocation | U.S. equities made a significant contribution to absolute performance, led by large cap equities. International developed market equities further helped results, as did emerging market stocks. Defensive equities also generated positive returns.
Bond funds | The fixed-income allocation contributed positively, led by short-term bonds and emerging market debt.
TOP PERFORMANCE DETRACTORS
Specific positions | At a time of positive returns for most segments of the financial markets, the majority of the fund’s holdings recorded a gain. However, a small position in U.S. Treasury STRIPS (Separate Trading of Registered Interest and Principal of Securities) was adversely affected by rising yields.
The views expressed in this report are those of the portfolio management team and are subject to change. They are not meant as investment advice.
Fund Performance
The following graph compares the initial and subsequent account values at the end of each of the most recently completed 10 fiscal years of the fund (or for the life of the fund, if shorter). It assumes a $250,000 initial investment in the fund and in an appropriate, broad-based securities market index for the same period.
GROWTH OF $250,000
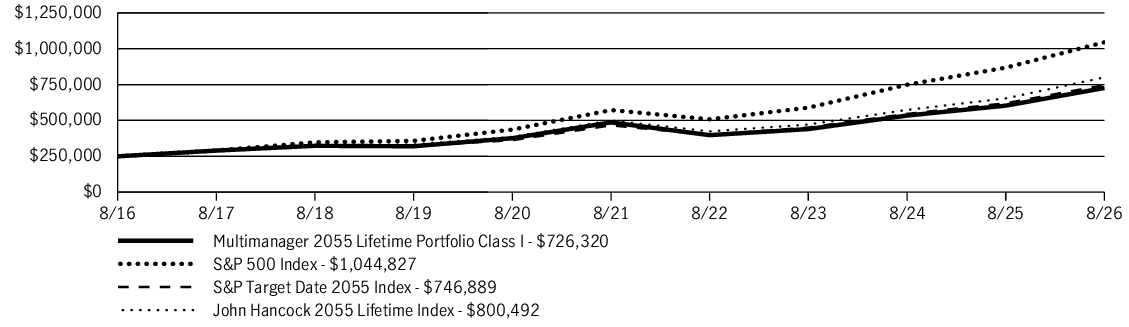
| AVERAGE ANNUAL TOTAL RETURN | 1 Year | 5 Years | 10 Years |
| Multimanager 2055 Lifetime Portfolio (Class I/JHRTX) | 20.40% | 8.34% | 11.25% |
| S&P 500 Index | 20.38% | 12.79% | 15.37% |
| S&P Target Date 2055 Index | 20.42% | 9.92% | 11.57% |
| John Hancock 2055 Lifetime Index | 22.43% | 9.89% | 12.34% |
Fund Statistics
| Fund net assets | $482,927,299 |
| Total number of portfolio holdings | 83 |
| Total advisory fees paid (net) | $0 |
| Portfolio turnover rate | 20% |
Graphical Representation of Holdings
The table below shows the investment makeup of the fund, representing a percentage of the total net assets of the fund.
Asset Allocation
| Affiliated investment companies | 93.2% |
| Equity | 89.0% |
| U.S. large cap | 29.5% |
| International equity | 27.1% |
| Large blend | 16.3% |
| U.S. mid cap | 8.9% |
| Emerging-market equity | 5.8% |
| U.S. small cap | 1.4% |
| Fixed income | 3.7% |
| Short-term bond | 2.4% |
| Emerging-market debt | 0.5% |
| Intermediate bond | 0.5% |
| High yield bond | 0.3% |
| Alternative and specialty | 0.5% |
| Absolute return | 0.5% |
| Unaffiliated investment companies | 6.3% |
| Equity | 6.3% |
| U.S. Government | 0.5% |
Holdings may not have been held by the fund for the entire period and are subject to change without notice. Portfolio composition is subject to review in accordance with the fund’s investment strategy and may vary in the future. Current and future portfolio holdings are subject to risk and may change at any time.
What were the fund costs during the last year ?
(Based on a hypothetical $10,000 investment)
| Fund (Class) | Costs of a $10,000 investment | Costs paid as a percentage of a $10,000 investment |
| Multimanager 2055 Lifetime Portfolio (Class A/JLKLX) |
$45 | 0.41% |
Management’s Discussion of Fund Performance
SUMMARY OF RESULTS
Multimanager 2055 Lifetime Portfolio (Class A/JLKLX) returned 19.99% (excluding sales charges) for the year ended August 31, 2026. Global equities produced sizable gains in the 12-month period that ended on August 31, 2026. Investors were encouraged by the favorable combination of healthy economic growth trends, robust corporate earnings, and generally supportive central bank policies, together with optimism about artificial intelligence. While technology stocks performed very well, the value style outpaced growth on a global basis and contributed meaningfully to the markets’ strong showing. Emerging market equities also posted outsized returns. Bonds registered more modest gains, led by credit-oriented investments. Income was the primary contributor to total returns for fixed income instruments, as prices came under pressure from concerns about persistent inflation, global conflicts, energy prices, and mounting government debt across the developed world.
TOP PERFORMANCE CONTRIBUTORS
Equity allocation | U.S. equities made a significant contribution to absolute performance, led by large cap equities. International developed market equities further helped results, as did emerging market stocks. Defensive equities also generated positive returns.
Bond funds | The fixed-income allocation contributed positively, led by short-term bonds and emerging market debt.
TOP PERFORMANCE DETRACTORS
Specific positions | At a time of positive returns for most segments of the financial markets, the majority of the fund’s holdings recorded a gain. However, a small position in U.S. Treasury STRIPS (Separate Trading of Registered Interest and Principal of Securities) was adversely affected by rising yields.
The views expressed in this report are those of the portfolio management team and are subject to change. They are not meant as investment advice.
Fund Performance
The following graph compares the initial and subsequent account values at the end of each of the most recently completed 10 fiscal years of the fund (or for the life of the fund, if shorter). It assumes a $10,000 initial investment in the fund and in an appropriate, broad-based securities market index for the same period.
GROWTH OF $10,000
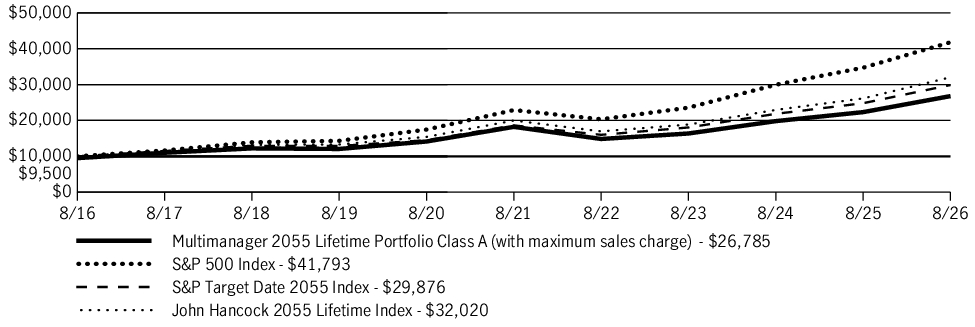
| AVERAGE ANNUAL TOTAL RETURN | 1 Year | 5 Years | 10 Years |
| Multimanager 2055 Lifetime Portfolio (Class A/JLKLX) | 14.01% | 6.92% | 10.35% |
| Multimanager 2055 Lifetime Portfolio (Class A/JLKLX)—excluding sales charge | 19.99% | 8.02% | 10.92% |
| S&P 500 Index | 20.38% | 12.79% | 15.37% |
| S&P Target Date 2055 Index | 20.42% | 9.92% | 11.57% |
| John Hancock 2055 Lifetime Index | 22.43% | 9.89% | 12.34% |
Fund Statistics
| Fund net assets | $482,927,299 |
| Total number of portfolio holdings | 83 |
| Total advisory fees paid (net) | $0 |
| Portfolio turnover rate | 20% |
Graphical Representation of Holdings
The table below shows the investment makeup of the fund, representing a percentage of the total net assets of the fund.
Asset Allocation
| Affiliated investment companies | 93.2% |
| Equity | 89.0% |
| U.S. large cap | 29.5% |
| International equity | 27.1% |
| Large blend | 16.3% |
| U.S. mid cap | 8.9% |
| Emerging-market equity | 5.8% |
| U.S. small cap | 1.4% |
| Fixed income | 3.7% |
| Short-term bond | 2.4% |
| Emerging-market debt | 0.5% |
| Intermediate bond | 0.5% |
| High yield bond | 0.3% |
| Alternative and specialty | 0.5% |
| Absolute return | 0.5% |
| Unaffiliated investment companies | 6.3% |
| Equity | 6.3% |
| U.S. Government | 0.5% |
Holdings may not have been held by the fund for the entire period and are subject to change without notice. Portfolio composition is subject to review in accordance with the fund’s investment strategy and may vary in the future. Current and future portfolio holdings are subject to risk and may change at any time.
What were the fund costs during the last year ?
(Based on a hypothetical $10,000 investment)
| Fund (Class) | Costs of a $10,000 investment | Costs paid as a percentage of a $10,000 investment |
| Multimanager 2055 Lifetime Portfolio (Class 1/JLKUX) |
$6 | 0.05% |
Management’s Discussion of Fund Performance
SUMMARY OF RESULTS
Multimanager 2055 Lifetime Portfolio (Class 1/JLKUX) returned 20.47% for the year ended August 31, 2026. Global equities produced sizable gains in the 12-month period that ended on August 31, 2026. Investors were encouraged by the favorable combination of healthy economic growth trends, robust corporate earnings, and generally supportive central bank policies, together with optimism about artificial intelligence. While technology stocks performed very well, the value style outpaced growth on a global basis and contributed meaningfully to the markets’ strong showing. Emerging market equities also posted outsized returns. Bonds registered more modest gains, led by credit-oriented investments. Income was the primary contributor to total returns for fixed income instruments, as prices came under pressure from concerns about persistent inflation, global conflicts, energy prices, and mounting government debt across the developed world.
TOP PERFORMANCE CONTRIBUTORS
Equity allocation | U.S. equities made a significant contribution to absolute performance, led by large cap equities. International developed market equities further helped results, as did emerging market stocks. Defensive equities also generated positive returns.
Bond funds | The fixed-income allocation contributed positively, led by short-term bonds and emerging market debt.
TOP PERFORMANCE DETRACTORS
Specific positions | At a time of positive returns for most segments of the financial markets, the majority of the fund’s holdings recorded a gain. However, a small position in U.S. Treasury STRIPS (Separate Trading of Registered Interest and Principal of Securities) was adversely affected by rising yields.
The views expressed in this report are those of the portfolio management team and are subject to change. They are not meant as investment advice.
Fund Performance
The following graph compares the initial and subsequent account values at the end of each of the most recently completed 10 fiscal years of the fund (or for the life of the fund, if shorter). It assumes a $10,000 initial investment in the fund and in an appropriate, broad-based securities market index for the same period.
GROWTH OF $10,000
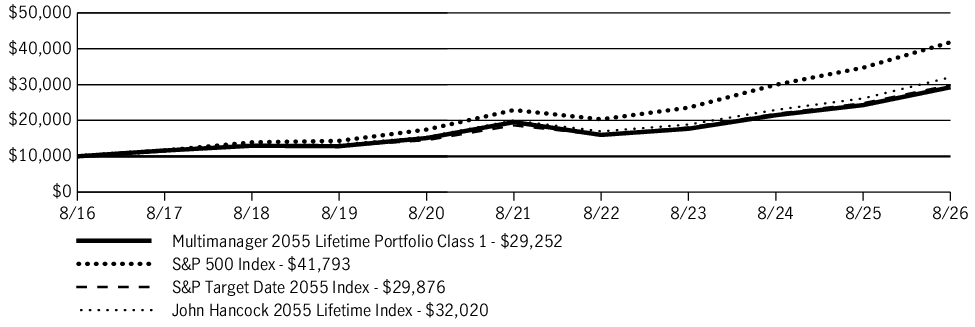
| AVERAGE ANNUAL TOTAL RETURN | 1 Year | 5 Years | 10 Years |
| Multimanager 2055 Lifetime Portfolio (Class 1/JLKUX) | 20.47% | 8.41% | 11.33% |
| S&P 500 Index | 20.38% | 12.79% | 15.37% |
| S&P Target Date 2055 Index | 20.42% | 9.92% | 11.57% |
| John Hancock 2055 Lifetime Index | 22.43% | 9.89% | 12.34% |
Fund Statistics
| Fund net assets | $482,927,299 |
| Total number of portfolio holdings | 83 |
| Total advisory fees paid (net) | $0 |
| Portfolio turnover rate | 20% |
Graphical Representation of Holdings
The table below shows the investment makeup of the fund, representing a percentage of the total net assets of the fund.
Asset Allocation
| Affiliated investment companies | 93.2% |
| Equity | 89.0% |
| U.S. large cap | 29.5% |
| International equity | 27.1% |
| Large blend | 16.3% |
| U.S. mid cap | 8.9% |
| Emerging-market equity | 5.8% |
| U.S. small cap | 1.4% |
| Fixed income | 3.7% |
| Short-term bond | 2.4% |
| Emerging-market debt | 0.5% |
| Intermediate bond | 0.5% |
| High yield bond | 0.3% |
| Alternative and specialty | 0.5% |
| Absolute return | 0.5% |
| Unaffiliated investment companies | 6.3% |
| Equity | 6.3% |
| U.S. Government | 0.5% |
Holdings may not have been held by the fund for the entire period and are subject to change without notice. Portfolio composition is subject to review in accordance with the fund’s investment strategy and may vary in the future. Current and future portfolio holdings are subject to risk and may change at any time.
What were the fund costs during the last year ?
(Based on a hypothetical $10,000 investment)
| Fund (Class) | Costs of a $10,000 investment | Costs paid as a percentage of a $10,000 investment |
| Multimanager 2060 Lifetime Portfolio (Class 1/JRETX) |
$6 | 0.05% |
Management’s Discussion of Fund Performance
SUMMARY OF RESULTS
Multimanager 2060 Lifetime Portfolio (Class 1/JRETX) returned 20.42% for the year ended August 31, 2026. Global equities produced sizable gains in the 12-month period that ended on August 31, 2026. Investors were encouraged by the favorable combination of healthy economic growth trends, robust corporate earnings, and generally supportive central bank policies, together with optimism about artificial intelligence. While technology stocks performed very well, the value style outpaced growth on a global basis and contributed meaningfully to the markets’ strong showing. Emerging market equities also posted outsized returns. Bonds registered more modest gains, led by credit-oriented investments. Income was the primary contributor to total returns for fixed income instruments, as prices came under pressure from concerns about persistent inflation, global conflicts, energy prices, and mounting government debt across the developed world.
TOP PERFORMANCE CONTRIBUTORS
Equity allocation | U.S. equities made a significant contribution to absolute performance, led by large cap equities. International developed market equities further helped results, as did emerging market stocks. Defensive equities also generated positive returns.
Bond funds | The fixed-income allocation contributed positively, led by short-term bonds and emerging market debt.
TOP PERFORMANCE DETRACTORS
Specific positions | At a time of positive returns for most segments of the financial markets, the majority of the fund’s holdings recorded a gain. However, a small position in U.S. Treasury STRIPS (Separate Trading of Registered Interest and Principal of Securities) was adversely affected by rising yields.
The views expressed in this report are those of the portfolio management team and are subject to change. They are not meant as investment advice.
Fund Performance
The following graph compares the initial and subsequent account values at the end of each of the most recently completed 10 fiscal years of the fund (or for the life of the fund, if shorter). It assumes a $10,000 initial investment in the fund and in an appropriate, broad-based securities market index for the same period.
GROWTH OF $10,000
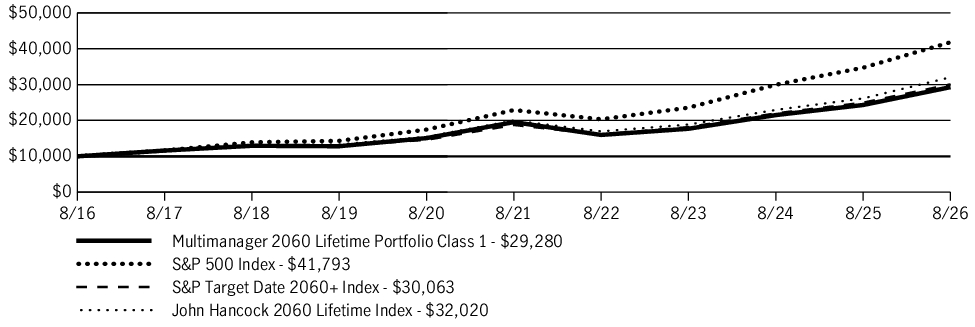
| AVERAGE ANNUAL TOTAL RETURN | 1 Year | 5 Years | 10 Years |
| Multimanager 2060 Lifetime Portfolio (Class 1/JRETX) | 20.42% | 8.43% | 11.34% |
| S&P 500 Index | 20.38% | 12.79% | 15.37% |
| S&P Target Date 2060+ Index | 20.42% | 9.93% | 11.64% |
| John Hancock 2060 Lifetime Index | 22.43% | 9.89% | 12.34% |
Fund Statistics
| Fund net assets | $358,277,199 |
| Total number of portfolio holdings | 83 |
| Total advisory fees paid (net) | $0 |
| Portfolio turnover rate | 19% |
Graphical Representation of Holdings
The table below shows the investment makeup of the fund, representing a percentage of the total net assets of the fund.
Asset Allocation
| Affiliated investment companies | 93.2% |
| Equity | 89.0% |
| U.S. large cap | 29.5% |
| International equity | 27.1% |
| Large blend | 16.2% |
| U.S. mid cap | 8.9% |
| Emerging-market equity | 5.9% |
| U.S. small cap | 1.4% |
| Fixed income | 3.7% |
| Short-term bond | 2.4% |
| Emerging-market debt | 0.5% |
| Intermediate bond | 0.5% |
| High yield bond | 0.3% |
| Alternative and specialty | 0.5% |
| Absolute return | 0.5% |
| Unaffiliated investment companies | 6.3% |
| Equity | 6.3% |
| U.S. Government | 0.5% |
Holdings may not have been held by the fund for the entire period and are subject to change without notice. Portfolio composition is subject to review in accordance with the fund’s investment strategy and may vary in the future. Current and future portfolio holdings are subject to risk and may change at any time.
What were the fund costs during the last year ?
(Based on a hypothetical $10,000 investment)
| Fund (Class) | Costs of a $10,000 investment | Costs paid as a percentage of a $10,000 investment |
| Multimanager 2060 Lifetime Portfolio (Class A/JJERX) |
$45 | 0.41% |
Management’s Discussion of Fund Performance
SUMMARY OF RESULTS
Multimanager 2060 Lifetime Portfolio (Class A/JJERX) returned 19.98% (excluding sales charges) for the year ended August 31, 2026. Global equities produced sizable gains in the 12-month period that ended on August 31, 2026. Investors were encouraged by the favorable combination of healthy economic growth trends, robust corporate earnings, and generally supportive central bank policies, together with optimism about artificial intelligence. While technology stocks performed very well, the value style outpaced growth on a global basis and contributed meaningfully to the markets’ strong showing. Emerging market equities also posted outsized returns. Bonds registered more modest gains, led by credit-oriented investments. Income was the primary contributor to total returns for fixed income instruments, as prices came under pressure from concerns about persistent inflation, global conflicts, energy prices, and mounting government debt across the developed world.
TOP PERFORMANCE CONTRIBUTORS
Equity allocation | U.S. equities made a significant contribution to absolute performance, led by large cap equities. International developed market equities further helped results, as did emerging market stocks. Defensive equities also generated positive returns.
Bond funds | The fixed-income allocation contributed positively, led by short-term bonds and emerging market debt.
TOP PERFORMANCE DETRACTORS
Specific positions | At a time of positive returns for most segments of the financial markets, the majority of the fund’s holdings recorded a gain. However, a small position in U.S. Treasury STRIPS (Separate Trading of Registered Interest and Principal of Securities) was adversely affected by rising yields.
The views expressed in this report are those of the portfolio management team and are subject to change. They are not meant as investment advice.
Fund Performance
The following graph compares the initial and subsequent account values at the end of each of the most recently completed 10 fiscal years of the fund (or for the life of the fund, if shorter). It assumes a $10,000 initial investment in the fund and in an appropriate, broad-based securities market index for the same period.
GROWTH OF $10,000
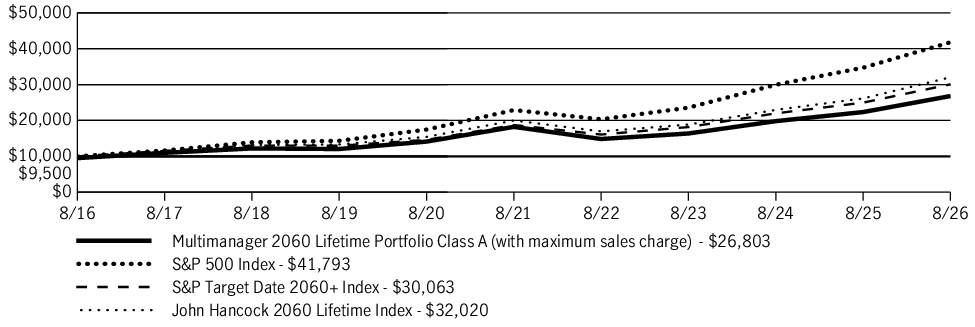
| AVERAGE ANNUAL TOTAL RETURN | 1 Year | 5 Years | 10 Years |
| Multimanager 2060 Lifetime Portfolio (Class A/JJERX) | 13.98% | 6.93% | 10.36% |
| Multimanager 2060 Lifetime Portfolio (Class A/JJERX)—excluding sales charge | 19.98% | 8.03% | 10.93% |
| S&P 500 Index | 20.38% | 12.79% | 15.37% |
| S&P Target Date 2060+ Index | 20.42% | 9.93% | 11.64% |
| John Hancock 2060 Lifetime Index | 22.43% | 9.89% | 12.34% |
Fund Statistics
| Fund net assets | $358,277,199 |
| Total number of portfolio holdings | 83 |
| Total advisory fees paid (net) | $0 |
| Portfolio turnover rate | 19% |
Graphical Representation of Holdings
The table below shows the investment makeup of the fund, representing a percentage of the total net assets of the fund.
Asset Allocation
| Affiliated investment companies | 93.2% |
| Equity | 89.0% |
| U.S. large cap | 29.5% |
| International equity | 27.1% |
| Large blend | 16.2% |
| U.S. mid cap | 8.9% |
| Emerging-market equity | 5.9% |
| U.S. small cap | 1.4% |
| Fixed income | 3.7% |
| Short-term bond | 2.4% |
| Emerging-market debt | 0.5% |
| Intermediate bond | 0.5% |
| High yield bond | 0.3% |
| Alternative and specialty | 0.5% |
| Absolute return | 0.5% |
| Unaffiliated investment companies | 6.3% |
| Equity | 6.3% |
| U.S. Government | 0.5% |
Holdings may not have been held by the fund for the entire period and are subject to change without notice. Portfolio composition is subject to review in accordance with the fund’s investment strategy and may vary in the future. Current and future portfolio holdings are subject to risk and may change at any time.
What were the fund costs during the last year ?
(Based on a hypothetical $10,000 investment)
| Fund (Class) | Costs of a $10,000 investment | Costs paid as a percentage of a $10,000 investment |
| Multimanager 2060 Lifetime Portfolio (Class I/JMENX) |
$12 | 0.11% |
Management’s Discussion of Fund Performance
SUMMARY OF RESULTS
Multimanager 2060 Lifetime Portfolio (Class I/JMENX) returned 20.42% for the year ended August 31, 2026. Global equities produced sizable gains in the 12-month period that ended on August 31, 2026. Investors were encouraged by the favorable combination of healthy economic growth trends, robust corporate earnings, and generally supportive central bank policies, together with optimism about artificial intelligence. While technology stocks performed very well, the value style outpaced growth on a global basis and contributed meaningfully to the markets’ strong showing. Emerging market equities also posted outsized returns. Bonds registered more modest gains, led by credit-oriented investments. Income was the primary contributor to total returns for fixed income instruments, as prices came under pressure from concerns about persistent inflation, global conflicts, energy prices, and mounting government debt across the developed world.
TOP PERFORMANCE CONTRIBUTORS
Equity allocation | U.S. equities made a significant contribution to absolute performance, led by large cap equities. International developed market equities further helped results, as did emerging market stocks. Defensive equities also generated positive returns.
Bond funds | The fixed-income allocation contributed positively, led by short-term bonds and emerging market debt.
TOP PERFORMANCE DETRACTORS
Specific positions | At a time of positive returns for most segments of the financial markets, the majority of the fund’s holdings recorded a gain. However, a small position in U.S. Treasury STRIPS (Separate Trading of Registered Interest and Principal of Securities) was adversely affected by rising yields.
The views expressed in this report are those of the portfolio management team and are subject to change. They are not meant as investment advice.
Fund Performance
The following graph compares the initial and subsequent account values at the end of each of the most recently completed 10 fiscal years of the fund (or for the life of the fund, if shorter). It assumes a $250,000 initial investment in the fund and in an appropriate, broad-based securities market index for the same period.
GROWTH OF $250,000
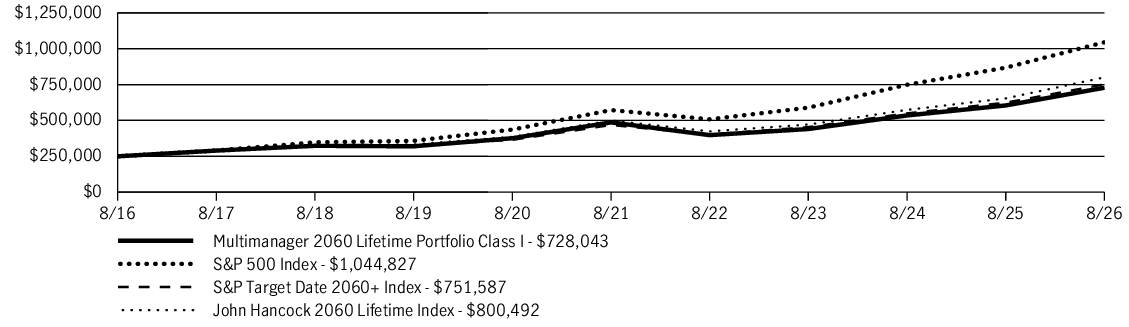
| AVERAGE ANNUAL TOTAL RETURN | 1 Year | 5 Years | 10 Years |
| Multimanager 2060 Lifetime Portfolio (Class I/JMENX) | 20.42% | 8.39% | 11.28% |
| S&P 500 Index | 20.38% | 12.79% | 15.37% |
| S&P Target Date 2060+ Index | 20.42% | 9.93% | 11.64% |
| John Hancock 2060 Lifetime Index | 22.43% | 9.89% | 12.34% |
Fund Statistics
| Fund net assets | $358,277,199 |
| Total number of portfolio holdings | 83 |
| Total advisory fees paid (net) | $0 |
| Portfolio turnover rate | 19% |
Graphical Representation of Holdings
The table below shows the investment makeup of the fund, representing a percentage of the total net assets of the fund.
Asset Allocation
| Affiliated investment companies | 93.2% |
| Equity | 89.0% |
| U.S. large cap | 29.5% |
| International equity | 27.1% |
| Large blend | 16.2% |
| U.S. mid cap | 8.9% |
| Emerging-market equity | 5.9% |
| U.S. small cap | 1.4% |
| Fixed income | 3.7% |
| Short-term bond | 2.4% |
| Emerging-market debt | 0.5% |
| Intermediate bond | 0.5% |
| High yield bond | 0.3% |
| Alternative and specialty | 0.5% |
| Absolute return | 0.5% |
| Unaffiliated investment companies | 6.3% |
| Equity | 6.3% |
| U.S. Government | 0.5% |
Holdings may not have been held by the fund for the entire period and are subject to change without notice. Portfolio composition is subject to review in accordance with the fund’s investment strategy and may vary in the future. Current and future portfolio holdings are subject to risk and may change at any time.
What were the fund costs during the last year ?
(Based on a hypothetical $10,000 investment)
| Fund (Class) | Costs of a $10,000 investment | Costs paid as a percentage of a $10,000 investment |
| Multimanager 2060 Lifetime Portfolio (Class R2/JVIMX) |
$55 | 0.50% |
Management’s Discussion of Fund Performance
SUMMARY OF RESULTS
Multimanager 2060 Lifetime Portfolio (Class R2/JVIMX) returned 19.89% for the year ended August 31, 2026. Global equities produced sizable gains in the 12-month period that ended on August 31, 2026. Investors were encouraged by the favorable combination of healthy economic growth trends, robust corporate earnings, and generally supportive central bank policies, together with optimism about artificial intelligence. While technology stocks performed very well, the value style outpaced growth on a global basis and contributed meaningfully to the markets’ strong showing. Emerging market equities also posted outsized returns. Bonds registered more modest gains, led by credit-oriented investments. Income was the primary contributor to total returns for fixed income instruments, as prices came under pressure from concerns about persistent inflation, global conflicts, energy prices, and mounting government debt across the developed world.
TOP PERFORMANCE CONTRIBUTORS
Equity allocation | U.S. equities made a significant contribution to absolute performance, led by large cap equities. International developed market equities further helped results, as did emerging market stocks. Defensive equities also generated positive returns.
Bond funds | The fixed-income allocation contributed positively, led by short-term bonds and emerging market debt.
TOP PERFORMANCE DETRACTORS
Specific positions | At a time of positive returns for most segments of the financial markets, the majority of the fund’s holdings recorded a gain. However, a small position in U.S. Treasury STRIPS (Separate Trading of Registered Interest and Principal of Securities) was adversely affected by rising yields.
The views expressed in this report are those of the portfolio management team and are subject to change. They are not meant as investment advice.
Fund Performance
The following graph compares the initial and subsequent account values at the end of each of the most recently completed 10 fiscal years of the fund (or for the life of the fund, if shorter). It assumes a $10,000 initial investment in the fund and in an appropriate, broad-based securities market index for the same period.
GROWTH OF $10,000
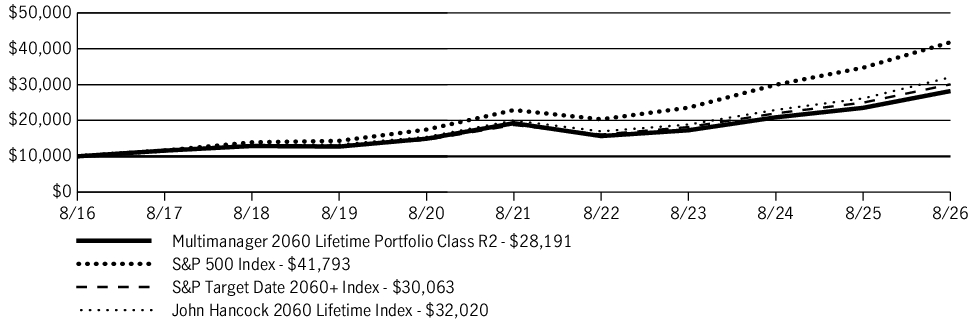
| AVERAGE ANNUAL TOTAL RETURN | 1 Year | 5 Years | 10 Years |
| Multimanager 2060 Lifetime Portfolio (Class R2/JVIMX) | 19.89% | 7.94% | 10.92% |
| S&P 500 Index | 20.38% | 12.79% | 15.37% |
| S&P Target Date 2060+ Index | 20.42% | 9.93% | 11.64% |
| John Hancock 2060 Lifetime Index | 22.43% | 9.89% | 12.34% |
Fund Statistics
| Fund net assets | $358,277,199 |
| Total number of portfolio holdings | 83 |
| Total advisory fees paid (net) | $0 |
| Portfolio turnover rate | 19% |
Graphical Representation of Holdings
The table below shows the investment makeup of the fund, representing a percentage of the total net assets of the fund.
Asset Allocation
| Affiliated investment companies | 93.2% |
| Equity | 89.0% |
| U.S. large cap | 29.5% |
| International equity | 27.1% |
| Large blend | 16.2% |
| U.S. mid cap | 8.9% |
| Emerging-market equity | 5.9% |
| U.S. small cap | 1.4% |
| Fixed income | 3.7% |
| Short-term bond | 2.4% |
| Emerging-market debt | 0.5% |
| Intermediate bond | 0.5% |
| High yield bond | 0.3% |
| Alternative and specialty | 0.5% |
| Absolute return | 0.5% |
| Unaffiliated investment companies | 6.3% |
| Equity | 6.3% |
| U.S. Government | 0.5% |
Holdings may not have been held by the fund for the entire period and are subject to change without notice. Portfolio composition is subject to review in accordance with the fund’s investment strategy and may vary in the future. Current and future portfolio holdings are subject to risk and may change at any time.
What were the fund costs during the last year ?
(Based on a hypothetical $10,000 investment)
| Fund (Class) | Costs of a $10,000 investment | Costs paid as a percentage of a $10,000 investment |
| Multimanager 2060 Lifetime Portfolio (Class R4/JROUX) |
$28 | 0.25% |
Management’s Discussion of Fund Performance
SUMMARY OF RESULTS
Multimanager 2060 Lifetime Portfolio (Class R4/JROUX) returned 20.17% for the year ended August 31, 2026. Global equities produced sizable gains in the 12-month period that ended on August 31, 2026. Investors were encouraged by the favorable combination of healthy economic growth trends, robust corporate earnings, and generally supportive central bank policies, together with optimism about artificial intelligence. While technology stocks performed very well, the value style outpaced growth on a global basis and contributed meaningfully to the markets’ strong showing. Emerging market equities also posted outsized returns. Bonds registered more modest gains, led by credit-oriented investments. Income was the primary contributor to total returns for fixed income instruments, as prices came under pressure from concerns about persistent inflation, global conflicts, energy prices, and mounting government debt across the developed world.
TOP PERFORMANCE CONTRIBUTORS
Equity allocation | U.S. equities made a significant contribution to absolute performance, led by large cap equities. International developed market equities further helped results, as did emerging market stocks. Defensive equities also generated positive returns.
Bond funds | The fixed-income allocation contributed positively, led by short-term bonds and emerging market debt.
TOP PERFORMANCE DETRACTORS
Specific positions | At a time of positive returns for most segments of the financial markets, the majority of the fund’s holdings recorded a gain. However, a small position in U.S. Treasury STRIPS (Separate Trading of Registered Interest and Principal of Securities) was adversely affected by rising yields.
The views expressed in this report are those of the portfolio management team and are subject to change. They are not meant as investment advice.
Fund Performance
The following graph compares the initial and subsequent account values at the end of each of the most recently completed 10 fiscal years of the fund (or for the life of the fund, if shorter). It assumes a $10,000 initial investment in the fund and in an appropriate, broad-based securities market index for the same period.
GROWTH OF $10,000
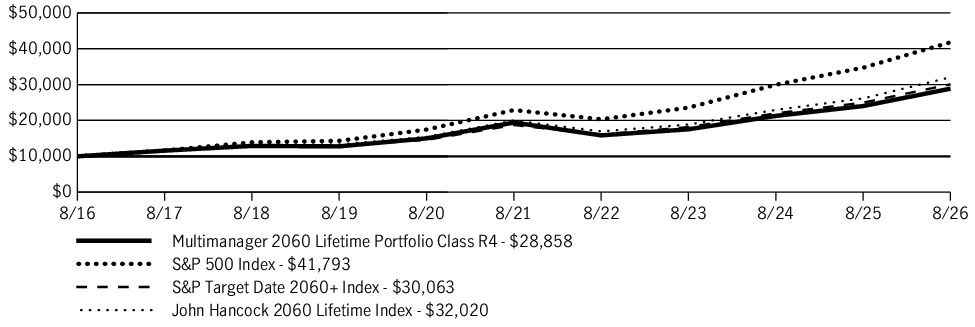
| AVERAGE ANNUAL TOTAL RETURN | 1 Year | 5 Years | 10 Years |
| Multimanager 2060 Lifetime Portfolio (Class R4/JROUX) | 20.17% | 8.25% | 11.18% |
| S&P 500 Index | 20.38% | 12.79% | 15.37% |
| S&P Target Date 2060+ Index | 20.42% | 9.93% | 11.64% |
| John Hancock 2060 Lifetime Index | 22.43% | 9.89% | 12.34% |
Fund Statistics
| Fund net assets | $358,277,199 |
| Total number of portfolio holdings | 83 |
| Total advisory fees paid (net) | $0 |
| Portfolio turnover rate | 19% |
Graphical Representation of Holdings
The table below shows the investment makeup of the fund, representing a percentage of the total net assets of the fund.
Asset Allocation
| Affiliated investment companies | 93.2% |
| Equity | 89.0% |
| U.S. large cap | 29.5% |
| International equity | 27.1% |
| Large blend | 16.2% |
| U.S. mid cap | 8.9% |
| Emerging-market equity | 5.9% |
| U.S. small cap | 1.4% |
| Fixed income | 3.7% |
| Short-term bond | 2.4% |
| Emerging-market debt | 0.5% |
| Intermediate bond | 0.5% |
| High yield bond | 0.3% |
| Alternative and specialty | 0.5% |
| Absolute return | 0.5% |
| Unaffiliated investment companies | 6.3% |
| Equity | 6.3% |
| U.S. Government | 0.5% |
Holdings may not have been held by the fund for the entire period and are subject to change without notice. Portfolio composition is subject to review in accordance with the fund’s investment strategy and may vary in the future. Current and future portfolio holdings are subject to risk and may change at any time.
What were the fund costs during the last year ?
(Based on a hypothetical $10,000 investment)
| Fund (Class) | Costs of a $10,000 investment | Costs paid as a percentage of a $10,000 investment |
| Multimanager 2060 Lifetime Portfolio (Class R5/JGHTX) |
$6 | 0.05% |
Management’s Discussion of Fund Performance
SUMMARY OF RESULTS
Multimanager 2060 Lifetime Portfolio (Class R5/JGHTX) returned 20.37% for the year ended August 31, 2026. Global equities produced sizable gains in the 12-month period that ended on August 31, 2026. Investors were encouraged by the favorable combination of healthy economic growth trends, robust corporate earnings, and generally supportive central bank policies, together with optimism about artificial intelligence. While technology stocks performed very well, the value style outpaced growth on a global basis and contributed meaningfully to the markets’ strong showing. Emerging market equities also posted outsized returns. Bonds registered more modest gains, led by credit-oriented investments. Income was the primary contributor to total returns for fixed income instruments, as prices came under pressure from concerns about persistent inflation, global conflicts, energy prices, and mounting government debt across the developed world.
TOP PERFORMANCE CONTRIBUTORS
Equity allocation | U.S. equities made a significant contribution to absolute performance, led by large cap equities. International developed market equities further helped results, as did emerging market stocks. Defensive equities also generated positive returns.
Bond funds | The fixed-income allocation contributed positively, led by short-term bonds and emerging market debt.
TOP PERFORMANCE DETRACTORS
Specific positions | At a time of positive returns for most segments of the financial markets, the majority of the fund’s holdings recorded a gain. However, a small position in U.S. Treasury STRIPS (Separate Trading of Registered Interest and Principal of Securities) was adversely affected by rising yields.
The views expressed in this report are those of the portfolio management team and are subject to change. They are not meant as investment advice.
Fund Performance
The following graph compares the initial and subsequent account values at the end of each of the most recently completed 10 fiscal years of the fund (or for the life of the fund, if shorter). It assumes a $10,000 initial investment in the fund and in an appropriate, broad-based securities market index for the same period.
GROWTH OF $10,000
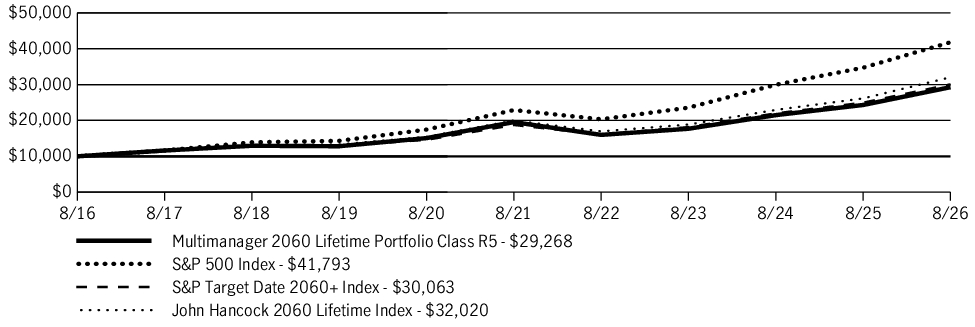
| AVERAGE ANNUAL TOTAL RETURN | 1 Year | 5 Years | 10 Years |
| Multimanager 2060 Lifetime Portfolio (Class R5/JGHTX) | 20.37% | 8.42% | 11.34% |
| S&P 500 Index | 20.38% | 12.79% | 15.37% |
| S&P Target Date 2060+ Index | 20.42% | 9.93% | 11.64% |
| John Hancock 2060 Lifetime Index | 22.43% | 9.89% | 12.34% |
Fund Statistics
| Fund net assets | $358,277,199 |
| Total number of portfolio holdings | 83 |
| Total advisory fees paid (net) | $0 |
| Portfolio turnover rate | 19% |
Graphical Representation of Holdings
The table below shows the investment makeup of the fund, representing a percentage of the total net assets of the fund.
Asset Allocation
| Affiliated investment companies | 93.2% |
| Equity | 89.0% |
| U.S. large cap | 29.5% |
| International equity | 27.1% |
| Large blend | 16.2% |
| U.S. mid cap | 8.9% |
| Emerging-market equity | 5.9% |
| U.S. small cap | 1.4% |
| Fixed income | 3.7% |
| Short-term bond | 2.4% |
| Emerging-market debt | 0.5% |
| Intermediate bond | 0.5% |
| High yield bond | 0.3% |
| Alternative and specialty | 0.5% |
| Absolute return | 0.5% |
| Unaffiliated investment companies | 6.3% |
| Equity | 6.3% |
| U.S. Government | 0.5% |
Holdings may not have been held by the fund for the entire period and are subject to change without notice. Portfolio composition is subject to review in accordance with the fund’s investment strategy and may vary in the future. Current and future portfolio holdings are subject to risk and may change at any time.
What were the fund costs during the last year ?
(Based on a hypothetical $10,000 investment)
| Fund (Class) | Costs of a $10,000 investment | Costs paid as a percentage of a $10,000 investment |
| Multimanager 2060 Lifetime Portfolio (Class R6/JESRX) |
$0 | 0.00% |
Management’s Discussion of Fund Performance
SUMMARY OF RESULTS
Multimanager 2060 Lifetime Portfolio (Class R6/JESRX) returned 20.46% for the year ended August 31, 2026. Global equities produced sizable gains in the 12-month period that ended on August 31, 2026. Investors were encouraged by the favorable combination of healthy economic growth trends, robust corporate earnings, and generally supportive central bank policies, together with optimism about artificial intelligence. While technology stocks performed very well, the value style outpaced growth on a global basis and contributed meaningfully to the markets’ strong showing. Emerging market equities also posted outsized returns. Bonds registered more modest gains, led by credit-oriented investments. Income was the primary contributor to total returns for fixed income instruments, as prices came under pressure from concerns about persistent inflation, global conflicts, energy prices, and mounting government debt across the developed world.
TOP PERFORMANCE CONTRIBUTORS
Equity allocation | U.S. equities made a significant contribution to absolute performance, led by large cap equities. International developed market equities further helped results, as did emerging market stocks. Defensive equities also generated positive returns.
Bond funds | The fixed-income allocation contributed positively, led by short-term bonds and emerging market debt.
TOP PERFORMANCE DETRACTORS
Specific positions | At a time of positive returns for most segments of the financial markets, the majority of the fund’s holdings recorded a gain. However, a small position in U.S. Treasury STRIPS (Separate Trading of Registered Interest and Principal of Securities) was adversely affected by rising yields.
The views expressed in this report are those of the portfolio management team and are subject to change. They are not meant as investment advice.
Fund Performance
The following graph compares the initial and subsequent account values at the end of each of the most recently completed 10 fiscal years of the fund (or for the life of the fund, if shorter). It assumes a $1,000,000 initial investment in the fund and in an appropriate, broad-based securities market index for the same period.
GROWTH OF $1,000,000
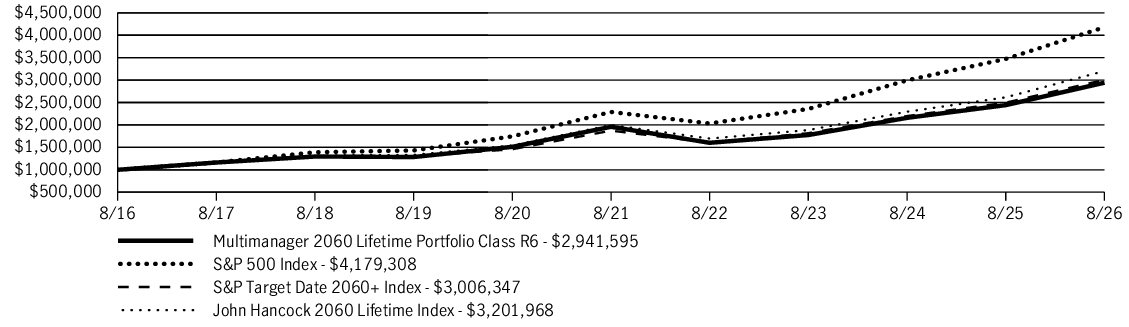
| AVERAGE ANNUAL TOTAL RETURN | 1 Year | 5 Years | 10 Years |
| Multimanager 2060 Lifetime Portfolio (Class R6/JESRX) | 20.46% | 8.47% | 11.39% |
| S&P 500 Index | 20.38% | 12.79% | 15.37% |
| S&P Target Date 2060+ Index | 20.42% | 9.93% | 11.64% |
| John Hancock 2060 Lifetime Index | 22.43% | 9.89% | 12.34% |
Fund Statistics
| Fund net assets | $358,277,199 |
| Total number of portfolio holdings | 83 |
| Total advisory fees paid (net) | $0 |
| Portfolio turnover rate | 19% |
Graphical Representation of Holdings
The table below shows the investment makeup of the fund, representing a percentage of the total net assets of the fund.
Asset Allocation
| Affiliated investment companies | 93.2% |
| Equity | 89.0% |
| U.S. large cap | 29.5% |
| International equity | 27.1% |
| Large blend | 16.2% |
| U.S. mid cap | 8.9% |
| Emerging-market equity | 5.9% |
| U.S. small cap | 1.4% |
| Fixed income | 3.7% |
| Short-term bond | 2.4% |
| Emerging-market debt | 0.5% |
| Intermediate bond | 0.5% |
| High yield bond | 0.3% |
| Alternative and specialty | 0.5% |
| Absolute return | 0.5% |
| Unaffiliated investment companies | 6.3% |
| Equity | 6.3% |
| U.S. Government | 0.5% |
Holdings may not have been held by the fund for the entire period and are subject to change without notice. Portfolio composition is subject to review in accordance with the fund’s investment strategy and may vary in the future. Current and future portfolio holdings are subject to risk and may change at any time.
What were the fund costs during the last year ?
(Based on a hypothetical $10,000 investment)
| Fund (Class) | Costs of a $10,000 investment | Costs paid as a percentage of a $10,000 investment |
| Multimanager 2065 Lifetime Portfolio (Class R6/JABEX) |
$0 | 0.00% |
Management’s Discussion of Fund Performance
SUMMARY OF RESULTS
Multimanager 2065 Lifetime Portfolio (Class R6/JABEX) returned 20.49% for the year ended August 31, 2026. Global equities produced sizable gains in the 12-month period that ended on August 31, 2026. Investors were encouraged by the favorable combination of healthy economic growth trends, robust corporate earnings, and generally supportive central bank policies, together with optimism about artificial intelligence. While technology stocks performed very well, the value style outpaced growth on a global basis and contributed meaningfully to the markets’ strong showing. Emerging market equities also posted outsized returns. Bonds registered more modest gains, led by credit-oriented investments. Income was the primary contributor to total returns for fixed income instruments, as prices came under pressure from concerns about persistent inflation, global conflicts, energy prices, and mounting government debt across the developed world.
TOP PERFORMANCE CONTRIBUTORS
Equity allocation | U.S. equities made a significant contribution to absolute performance, led by large cap equities. International developed market equities further helped results, as did emerging market stocks. Defensive equities also generated positive returns.
Bond funds | The fixed-income allocation contributed positively, led by short-term bonds and emerging market debt.
TOP PERFORMANCE DETRACTORS
Specific positions | At a time of positive returns for most segments of the financial markets, the majority of the fund’s holdings recorded a gain. However, a small position in U.S. Treasury STRIPS (Separate Trading of Registered Interest and Principal of Securities) was adversely affected by rising yields.
The views expressed in this report are those of the portfolio management team and are subject to change. They are not meant as investment advice.
Fund Performance
The following graph compares the initial and subsequent account values at the end of each of the most recently completed 10 fiscal years of the fund (or for the life of the fund, if shorter). It assumes a $1,000,000 initial investment in the fund and in an appropriate, broad-based securities market index for the same period.
GROWTH OF $1,000,000
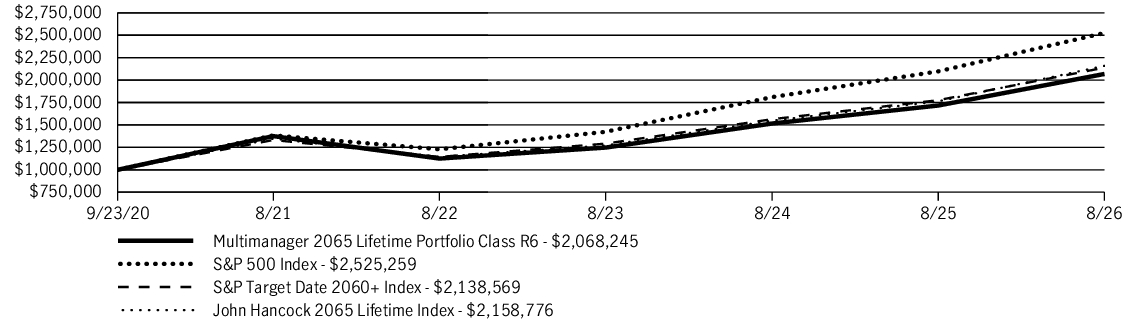
| AVERAGE ANNUAL TOTAL RETURN | 1 Year | 5 Years | Since inception |
| Multimanager 2065 Lifetime Portfolio (Class R6/JABEX) | 20.49% | 8.50% | 13.01% |
| S&P 500 Index | 20.38% | 12.79% | 16.88% |
| S&P Target Date 2060+ Index | 20.42% | 9.93% | 13.65% |
| John Hancock 2065 Lifetime Index | 22.43% | 9.89% | 13.83% |
Fund Statistics
| Fund net assets | $169,983,197 |
| Total number of portfolio holdings | 82 |
| Total advisory fees paid (net) | $0 |
| Portfolio turnover rate | 19% |
Graphical Representation of Holdings
The table below shows the investment makeup of the fund, representing a percentage of the total net assets of the fund.
Asset Allocation
| Affiliated investment companies | 93.3% |
| Equity | 89.0% |
| U.S. large cap | 29.4% |
| International equity | 27.1% |
| Large blend | 16.3% |
| U.S. mid cap | 8.9% |
| Emerging-market equity | 5.8% |
| U.S. small cap | 1.5% |
| Fixed income | 3.8% |
| Short-term bond | 2.4% |
| Emerging-market debt | 0.6% |
| Intermediate bond | 0.5% |
| High yield bond | 0.3% |
| Alternative and specialty | 0.5% |
| Absolute return | 0.5% |
| Unaffiliated investment companies | 6.3% |
| Equity | 6.3% |
| U.S. Government | 0.4% |
Holdings may not have been held by the fund for the entire period and are subject to change without notice. Portfolio composition is subject to review in accordance with the fund’s investment strategy and may vary in the future. Current and future portfolio holdings are subject to risk and may change at any time.
What were the fund costs during the last year ?
(Based on a hypothetical $10,000 investment)
| Fund (Class) | Costs of a $10,000 investment | Costs paid as a percentage of a $10,000 investment |
| Multimanager 2065 Lifetime Portfolio (Class R5/JABDX) |
$6 | 0.05% |
Management’s Discussion of Fund Performance
SUMMARY OF RESULTS
Multimanager 2065 Lifetime Portfolio (Class R5/JABDX) returned 20.44% for the year ended August 31, 2026. Global equities produced sizable gains in the 12-month period that ended on August 31, 2026. Investors were encouraged by the favorable combination of healthy economic growth trends, robust corporate earnings, and generally supportive central bank policies, together with optimism about artificial intelligence. While technology stocks performed very well, the value style outpaced growth on a global basis and contributed meaningfully to the markets’ strong showing. Emerging market equities also posted outsized returns. Bonds registered more modest gains, led by credit-oriented investments. Income was the primary contributor to total returns for fixed income instruments, as prices came under pressure from concerns about persistent inflation, global conflicts, energy prices, and mounting government debt across the developed world.
TOP PERFORMANCE CONTRIBUTORS
Equity allocation | U.S. equities made a significant contribution to absolute performance, led by large cap equities. International developed market equities further helped results, as did emerging market stocks. Defensive equities also generated positive returns.
Bond funds | The fixed-income allocation contributed positively, led by short-term bonds and emerging market debt.
TOP PERFORMANCE DETRACTORS
Specific positions | At a time of positive returns for most segments of the financial markets, the majority of the fund’s holdings recorded a gain. However, a small position in U.S. Treasury STRIPS (Separate Trading of Registered Interest and Principal of Securities) was adversely affected by rising yields.
The views expressed in this report are those of the portfolio management team and are subject to change. They are not meant as investment advice.
Fund Performance
The following graph compares the initial and subsequent account values at the end of each of the most recently completed 10 fiscal years of the fund (or for the life of the fund, if shorter). It assumes a $10,000 initial investment in the fund and in an appropriate, broad-based securities market index for the same period.
GROWTH OF $10,000
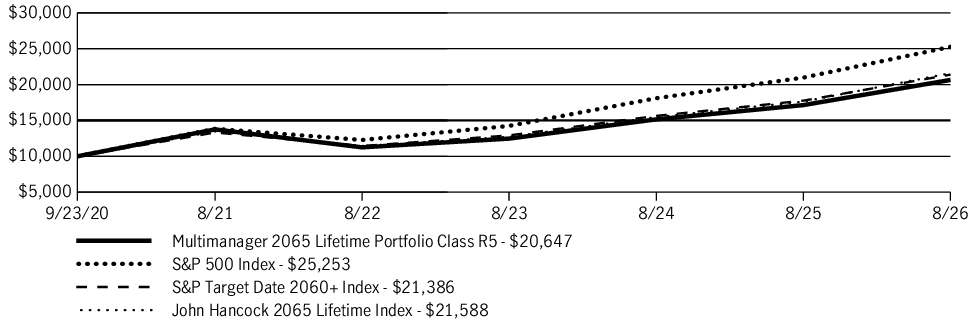
| AVERAGE ANNUAL TOTAL RETURN | 1 Year | 5 Years | Since inception |
| Multimanager 2065 Lifetime Portfolio (Class R5/JABDX) | 20.44% | 8.47% | 12.98% |
| S&P 500 Index | 20.38% | 12.79% | 16.88% |
| S&P Target Date 2060+ Index | 20.42% | 9.93% | 13.65% |
| John Hancock 2065 Lifetime Index | 22.43% | 9.89% | 13.83% |
Fund Statistics
| Fund net assets | $169,983,197 |
| Total number of portfolio holdings | 82 |
| Total advisory fees paid (net) | $0 |
| Portfolio turnover rate | 19% |
Graphical Representation of Holdings
The table below shows the investment makeup of the fund, representing a percentage of the total net assets of the fund.
Asset Allocation
| Affiliated investment companies | 93.3% |
| Equity | 89.0% |
| U.S. large cap | 29.4% |
| International equity | 27.1% |
| Large blend | 16.3% |
| U.S. mid cap | 8.9% |
| Emerging-market equity | 5.8% |
| U.S. small cap | 1.5% |
| Fixed income | 3.8% |
| Short-term bond | 2.4% |
| Emerging-market debt | 0.6% |
| Intermediate bond | 0.5% |
| High yield bond | 0.3% |
| Alternative and specialty | 0.5% |
| Absolute return | 0.5% |
| Unaffiliated investment companies | 6.3% |
| Equity | 6.3% |
| U.S. Government | 0.4% |
Holdings may not have been held by the fund for the entire period and are subject to change without notice. Portfolio composition is subject to review in accordance with the fund’s investment strategy and may vary in the future. Current and future portfolio holdings are subject to risk and may change at any time.
What were the fund costs during the last year ?
(Based on a hypothetical $10,000 investment)
| Fund (Class) | Costs of a $10,000 investment | Costs paid as a percentage of a $10,000 investment |
| Multimanager 2065 Lifetime Portfolio (Class R4/JABBX) |
$19 | 0.17% |
Management’s Discussion of Fund Performance
SUMMARY OF RESULTS
Multimanager 2065 Lifetime Portfolio (Class R4/JABBX) returned 20.24% for the year ended August 31, 2026. Global equities produced sizable gains in the 12-month period that ended on August 31, 2026. Investors were encouraged by the favorable combination of healthy economic growth trends, robust corporate earnings, and generally supportive central bank policies, together with optimism about artificial intelligence. While technology stocks performed very well, the value style outpaced growth on a global basis and contributed meaningfully to the markets’ strong showing. Emerging market equities also posted outsized returns. Bonds registered more modest gains, led by credit-oriented investments. Income was the primary contributor to total returns for fixed income instruments, as prices came under pressure from concerns about persistent inflation, global conflicts, energy prices, and mounting government debt across the developed world.
TOP PERFORMANCE CONTRIBUTORS
Equity allocation | U.S. equities made a significant contribution to absolute performance, led by large cap equities. International developed market equities further helped results, as did emerging market stocks. Defensive equities also generated positive returns.
Bond funds | The fixed-income allocation contributed positively, led by short-term bonds and emerging market debt.
TOP PERFORMANCE DETRACTORS
Specific positions | At a time of positive returns for most segments of the financial markets, the majority of the fund’s holdings recorded a gain. However, a small position in U.S. Treasury STRIPS (Separate Trading of Registered Interest and Principal of Securities) was adversely affected by rising yields.
The views expressed in this report are those of the portfolio management team and are subject to change. They are not meant as investment advice.
Fund Performance
The following graph compares the initial and subsequent account values at the end of each of the most recently completed 10 fiscal years of the fund (or for the life of the fund, if shorter). It assumes a $10,000 initial investment in the fund and in an appropriate, broad-based securities market index for the same period.
GROWTH OF $10,000
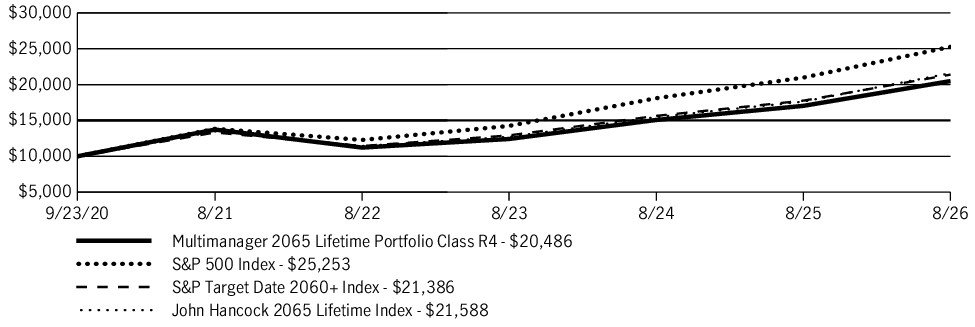
| AVERAGE ANNUAL TOTAL RETURN | 1 Year | 5 Years | Since inception |
| Multimanager 2065 Lifetime Portfolio (Class R4/JABBX) | 20.24% | 8.34% | 12.83% |
| S&P 500 Index | 20.38% | 12.79% | 16.88% |
| S&P Target Date 2060+ Index | 20.42% | 9.93% | 13.65% |
| John Hancock 2065 Lifetime Index | 22.43% | 9.89% | 13.83% |
Fund Statistics
| Fund net assets | $169,983,197 |
| Total number of portfolio holdings | 82 |
| Total advisory fees paid (net) | $0 |
| Portfolio turnover rate | 19% |
Graphical Representation of Holdings
The table below shows the investment makeup of the fund, representing a percentage of the total net assets of the fund.
Asset Allocation
| Affiliated investment companies | 93.3% |
| Equity | 89.0% |
| U.S. large cap | 29.4% |
| International equity | 27.1% |
| Large blend | 16.3% |
| U.S. mid cap | 8.9% |
| Emerging-market equity | 5.8% |
| U.S. small cap | 1.5% |
| Fixed income | 3.8% |
| Short-term bond | 2.4% |
| Emerging-market debt | 0.6% |
| Intermediate bond | 0.5% |
| High yield bond | 0.3% |
| Alternative and specialty | 0.5% |
| Absolute return | 0.5% |
| Unaffiliated investment companies | 6.3% |
| Equity | 6.3% |
| U.S. Government | 0.4% |
Holdings may not have been held by the fund for the entire period and are subject to change without notice. Portfolio composition is subject to review in accordance with the fund’s investment strategy and may vary in the future. Current and future portfolio holdings are subject to risk and may change at any time.
What were the fund costs during the last year ?
(Based on a hypothetical $10,000 investment)
| Fund (Class) | Costs of a $10,000 investment | Costs paid as a percentage of a $10,000 investment |
| Multimanager 2065 Lifetime Portfolio (Class R2/JAAZX) |
$55 | 0.50% |
Management’s Discussion of Fund Performance
SUMMARY OF RESULTS
Multimanager 2065 Lifetime Portfolio (Class R2/JAAZX) returned 20.02% for the year ended August 31, 2026. Global equities produced sizable gains in the 12-month period that ended on August 31, 2026. Investors were encouraged by the favorable combination of healthy economic growth trends, robust corporate earnings, and generally supportive central bank policies, together with optimism about artificial intelligence. While technology stocks performed very well, the value style outpaced growth on a global basis and contributed meaningfully to the markets’ strong showing. Emerging market equities also posted outsized returns. Bonds registered more modest gains, led by credit-oriented investments. Income was the primary contributor to total returns for fixed income instruments, as prices came under pressure from concerns about persistent inflation, global conflicts, energy prices, and mounting government debt across the developed world.
TOP PERFORMANCE CONTRIBUTORS
Equity allocation | U.S. equities made a significant contribution to absolute performance, led by large cap equities. International developed market equities further helped results, as did emerging market stocks. Defensive equities also generated positive returns.
Bond funds | The fixed-income allocation contributed positively, led by short-term bonds and emerging market debt.
TOP PERFORMANCE DETRACTORS
Specific positions | At a time of positive returns for most segments of the financial markets, the majority of the fund’s holdings recorded a gain. However, a small position in U.S. Treasury STRIPS (Separate Trading of Registered Interest and Principal of Securities) was adversely affected by rising yields.
The views expressed in this report are those of the portfolio management team and are subject to change. They are not meant as investment advice.
Fund Performance
The following graph compares the initial and subsequent account values at the end of each of the most recently completed 10 fiscal years of the fund (or for the life of the fund, if shorter). It assumes a $10,000 initial investment in the fund and in an appropriate, broad-based securities market index for the same period.
GROWTH OF $10,000
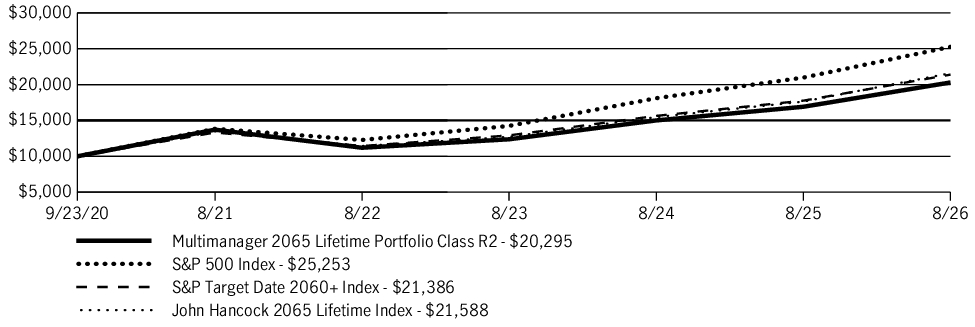
| AVERAGE ANNUAL TOTAL RETURN | 1 Year | 5 Years | Since inception |
| Multimanager 2065 Lifetime Portfolio (Class R2/JAAZX) | 20.02% | 8.15% | 12.65% |
| S&P 500 Index | 20.38% | 12.79% | 16.88% |
| S&P Target Date 2060+ Index | 20.42% | 9.93% | 13.65% |
| John Hancock 2065 Lifetime Index | 22.43% | 9.89% | 13.83% |
Fund Statistics
| Fund net assets | $169,983,197 |
| Total number of portfolio holdings | 82 |
| Total advisory fees paid (net) | $0 |
| Portfolio turnover rate | 19% |
Graphical Representation of Holdings
The table below shows the investment makeup of the fund, representing a percentage of the total net assets of the fund.
Asset Allocation
| Affiliated investment companies | 93.3% |
| Equity | 89.0% |
| U.S. large cap | 29.4% |
| International equity | 27.1% |
| Large blend | 16.3% |
| U.S. mid cap | 8.9% |
| Emerging-market equity | 5.8% |
| U.S. small cap | 1.5% |
| Fixed income | 3.8% |
| Short-term bond | 2.4% |
| Emerging-market debt | 0.6% |
| Intermediate bond | 0.5% |
| High yield bond | 0.3% |
| Alternative and specialty | 0.5% |
| Absolute return | 0.5% |
| Unaffiliated investment companies | 6.3% |
| Equity | 6.3% |
| U.S. Government | 0.4% |
Holdings may not have been held by the fund for the entire period and are subject to change without notice. Portfolio composition is subject to review in accordance with the fund’s investment strategy and may vary in the future. Current and future portfolio holdings are subject to risk and may change at any time.
What were the fund costs during the last year ?
(Based on a hypothetical $10,000 investment)
| Fund (Class) | Costs of a $10,000 investment | Costs paid as a percentage of a $10,000 investment |
| Multimanager 2065 Lifetime Portfolio (Class I/JABSX) |
$12 | 0.11% |
Management’s Discussion of Fund Performance
SUMMARY OF RESULTS
Multimanager 2065 Lifetime Portfolio (Class I/JABSX) returned 20.32% for the year ended August 31, 2026. Global equities produced sizable gains in the 12-month period that ended on August 31, 2026. Investors were encouraged by the favorable combination of healthy economic growth trends, robust corporate earnings, and generally supportive central bank policies, together with optimism about artificial intelligence. While technology stocks performed very well, the value style outpaced growth on a global basis and contributed meaningfully to the markets’ strong showing. Emerging market equities also posted outsized returns. Bonds registered more modest gains, led by credit-oriented investments. Income was the primary contributor to total returns for fixed income instruments, as prices came under pressure from concerns about persistent inflation, global conflicts, energy prices, and mounting government debt across the developed world.
TOP PERFORMANCE CONTRIBUTORS
Equity allocation | U.S. equities made a significant contribution to absolute performance, led by large cap equities. International developed market equities further helped results, as did emerging market stocks. Defensive equities also generated positive returns.
Bond funds | The fixed-income allocation contributed positively, led by short-term bonds and emerging market debt.
TOP PERFORMANCE DETRACTORS
Specific positions | At a time of positive returns for most segments of the financial markets, the majority of the fund’s holdings recorded a gain. However, a small position in U.S. Treasury STRIPS (Separate Trading of Registered Interest and Principal of Securities) was adversely affected by rising yields.
The views expressed in this report are those of the portfolio management team and are subject to change. They are not meant as investment advice.
Fund Performance
The following graph compares the initial and subsequent account values at the end of each of the most recently completed 10 fiscal years of the fund (or for the life of the fund, if shorter). It assumes a $250,000 initial investment in the fund and in an appropriate, broad-based securities market index for the same period.
GROWTH OF $250,000
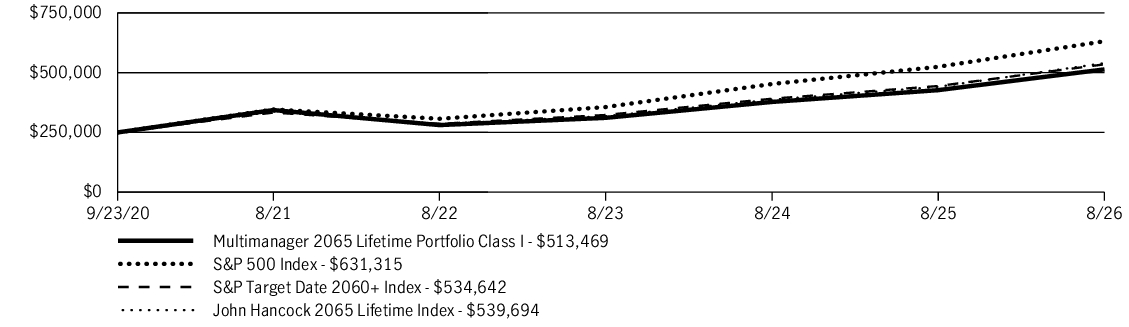
| AVERAGE ANNUAL TOTAL RETURN | 1 Year | 5 Years | Since inception |
| Multimanager 2065 Lifetime Portfolio (Class I/JABSX) | 20.32% | 8.37% | 12.88% |
| S&P 500 Index | 20.38% | 12.79% | 16.88% |
| S&P Target Date 2060+ Index | 20.42% | 9.93% | 13.65% |
| John Hancock 2065 Lifetime Index | 22.43% | 9.89% | 13.83% |
Fund Statistics
| Fund net assets | $169,983,197 |
| Total number of portfolio holdings | 82 |
| Total advisory fees paid (net) | $0 |
| Portfolio turnover rate | 19% |
Graphical Representation of Holdings
The table below shows the investment makeup of the fund, representing a percentage of the total net assets of the fund.
Asset Allocation
| Affiliated investment companies | 93.3% |
| Equity | 89.0% |
| U.S. large cap | 29.4% |
| International equity | 27.1% |
| Large blend | 16.3% |
| U.S. mid cap | 8.9% |
| Emerging-market equity | 5.8% |
| U.S. small cap | 1.5% |
| Fixed income | 3.8% |
| Short-term bond | 2.4% |
| Emerging-market debt | 0.6% |
| Intermediate bond | 0.5% |
| High yield bond | 0.3% |
| Alternative and specialty | 0.5% |
| Absolute return | 0.5% |
| Unaffiliated investment companies | 6.3% |
| Equity | 6.3% |
| U.S. Government | 0.4% |
Holdings may not have been held by the fund for the entire period and are subject to change without notice. Portfolio composition is subject to review in accordance with the fund’s investment strategy and may vary in the future. Current and future portfolio holdings are subject to risk and may change at any time.
What were the fund costs during the last year ?
(Based on a hypothetical $10,000 investment)
| Fund (Class) | Costs of a $10,000 investment | Costs paid as a percentage of a $10,000 investment |
| Multimanager 2065 Lifetime Portfolio (Class A/JAAWX) |
$45 | 0.41% |
Management’s Discussion of Fund Performance
SUMMARY OF RESULTS
Multimanager 2065 Lifetime Portfolio (Class A/JAAWX) returned 20.04% (excluding sales charges) for the year ended August 31, 2026. Global equities produced sizable gains in the 12-month period that ended on August 31, 2026. Investors were encouraged by the favorable combination of healthy economic growth trends, robust corporate earnings, and generally supportive central bank policies, together with optimism about artificial intelligence. While technology stocks performed very well, the value style outpaced growth on a global basis and contributed meaningfully to the markets’ strong showing. Emerging market equities also posted outsized returns. Bonds registered more modest gains, led by credit-oriented investments. Income was the primary contributor to total returns for fixed income instruments, as prices came under pressure from concerns about persistent inflation, global conflicts, energy prices, and mounting government debt across the developed world.
TOP PERFORMANCE CONTRIBUTORS
Equity allocation | U.S. equities made a significant contribution to absolute performance, led by large cap equities. International developed market equities further helped results, as did emerging market stocks. Defensive equities also generated positive returns.
Bond funds | The fixed-income allocation contributed positively, led by short-term bonds and emerging market debt.
TOP PERFORMANCE DETRACTORS
Specific positions | At a time of positive returns for most segments of the financial markets, the majority of the fund’s holdings recorded a gain. However, a small position in U.S. Treasury STRIPS (Separate Trading of Registered Interest and Principal of Securities) was adversely affected by rising yields.
The views expressed in this report are those of the portfolio management team and are subject to change. They are not meant as investment advice.
Fund Performance
The following graph compares the initial and subsequent account values at the end of each of the most recently completed 10 fiscal years of the fund (or for the life of the fund, if shorter). It assumes a $10,000 initial investment in the fund and in an appropriate, broad-based securities market index for the same period.
GROWTH OF $10,000
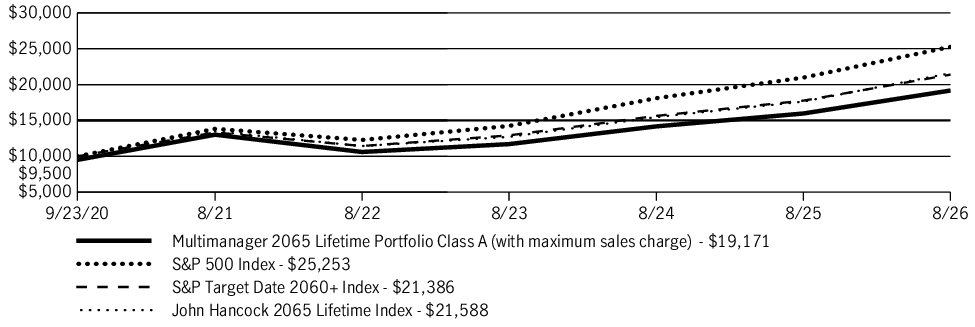
| AVERAGE ANNUAL TOTAL RETURN | 1 Year | 5 Years | Since inception |
| Multimanager 2065 Lifetime Portfolio (Class A/JAAWX) | 14.07% | 6.96% | 11.57% |
| Multimanager 2065 Lifetime Portfolio (Class A/JAAWX)—excluding sales charge | 20.04% | 8.06% | 12.55% |
| S&P 500 Index | 20.38% | 12.79% | 16.88% |
| S&P Target Date 2060+ Index | 20.42% | 9.93% | 13.65% |
| John Hancock 2065 Lifetime Index | 22.43% | 9.89% | 13.83% |
Fund Statistics
| Fund net assets | $169,983,197 |
| Total number of portfolio holdings | 82 |
| Total advisory fees paid (net) | $0 |
| Portfolio turnover rate | 19% |
Graphical Representation of Holdings
The table below shows the investment makeup of the fund, representing a percentage of the total net assets of the fund.
Asset Allocation
| Affiliated investment companies | 93.3% |
| Equity | 89.0% |
| U.S. large cap | 29.4% |
| International equity | 27.1% |
| Large blend | 16.3% |
| U.S. mid cap | 8.9% |
| Emerging-market equity | 5.8% |
| U.S. small cap | 1.5% |
| Fixed income | 3.8% |
| Short-term bond | 2.4% |
| Emerging-market debt | 0.6% |
| Intermediate bond | 0.5% |
| High yield bond | 0.3% |
| Alternative and specialty | 0.5% |
| Absolute return | 0.5% |
| Unaffiliated investment companies | 6.3% |
| Equity | 6.3% |
| U.S. Government | 0.4% |
Holdings may not have been held by the fund for the entire period and are subject to change without notice. Portfolio composition is subject to review in accordance with the fund’s investment strategy and may vary in the future. Current and future portfolio holdings are subject to risk and may change at any time.
What were the fund costs during the last year ?
(Based on a hypothetical $10,000 investment)
| Fund (Class) | Costs of a $10,000 investment | Costs paid as a percentage of a $10,000 investment |
| Multimanager 2065 Lifetime Portfolio (Class 1/JAAVX) |
$6 | 0.05% |
Management’s Discussion of Fund Performance
SUMMARY OF RESULTS
Multimanager 2065 Lifetime Portfolio (Class 1/JAAVX) returned 20.46% for the year ended August 31, 2026. Global equities produced sizable gains in the 12-month period that ended on August 31, 2026. Investors were encouraged by the favorable combination of healthy economic growth trends, robust corporate earnings, and generally supportive central bank policies, together with optimism about artificial intelligence. While technology stocks performed very well, the value style outpaced growth on a global basis and contributed meaningfully to the markets’ strong showing. Emerging market equities also posted outsized returns. Bonds registered more modest gains, led by credit-oriented investments. Income was the primary contributor to total returns for fixed income instruments, as prices came under pressure from concerns about persistent inflation, global conflicts, energy prices, and mounting government debt across the developed world.
TOP PERFORMANCE CONTRIBUTORS
Equity allocation | U.S. equities made a significant contribution to absolute performance, led by large cap equities. International developed market equities further helped results, as did emerging market stocks. Defensive equities also generated positive returns.
Bond funds | The fixed-income allocation contributed positively, led by short-term bonds and emerging market debt.
TOP PERFORMANCE DETRACTORS
Specific positions | At a time of positive returns for most segments of the financial markets, the majority of the fund’s holdings recorded a gain. However, a small position in U.S. Treasury STRIPS (Separate Trading of Registered Interest and Principal of Securities) was adversely affected by rising yields.
The views expressed in this report are those of the portfolio management team and are subject to change. They are not meant as investment advice.
Fund Performance
The following graph compares the initial and subsequent account values at the end of each of the most recently completed 10 fiscal years of the fund (or for the life of the fund, if shorter). It assumes a $10,000 initial investment in the fund and in an appropriate, broad-based securities market index for the same period.
GROWTH OF $10,000
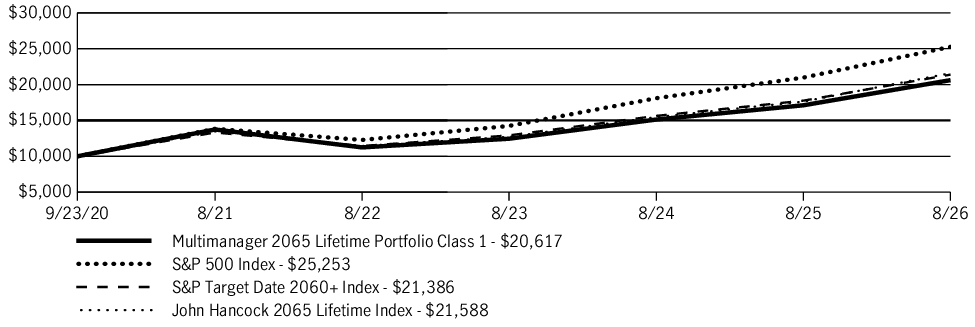
| AVERAGE ANNUAL TOTAL RETURN | 1 Year | 5 Years | Since inception |
| Multimanager 2065 Lifetime Portfolio (Class 1/JAAVX) | 20.46% | 8.45% | 12.95% |
| S&P 500 Index | 20.38% | 12.79% | 16.88% |
| S&P Target Date 2060+ Index | 20.42% | 9.93% | 13.65% |
| John Hancock 2065 Lifetime Index | 22.43% | 9.89% | 13.83% |
Fund Statistics
| Fund net assets | $169,983,197 |
| Total number of portfolio holdings | 82 |
| Total advisory fees paid (net) | $0 |
| Portfolio turnover rate | 19% |
Graphical Representation of Holdings
The table below shows the investment makeup of the fund, representing a percentage of the total net assets of the fund.
Asset Allocation
| Affiliated investment companies | 93.3% |
| Equity | 89.0% |
| U.S. large cap | 29.4% |
| International equity | 27.1% |
| Large blend | 16.3% |
| U.S. mid cap | 8.9% |
| Emerging-market equity | 5.8% |
| U.S. small cap | 1.5% |
| Fixed income | 3.8% |
| Short-term bond | 2.4% |
| Emerging-market debt | 0.6% |
| Intermediate bond | 0.5% |
| High yield bond | 0.3% |
| Alternative and specialty | 0.5% |
| Absolute return | 0.5% |
| Unaffiliated investment companies | 6.3% |
| Equity | 6.3% |
| U.S. Government | 0.4% |
Holdings may not have been held by the fund for the entire period and are subject to change without notice. Portfolio composition is subject to review in accordance with the fund’s investment strategy and may vary in the future. Current and future portfolio holdings are subject to risk and may change at any time.
What were the fund costs during the last year ?
(Based on a hypothetical $10,000 investment)
| Fund (Class) | Costs of a $10,000 investment | Costs paid as a percentage of a $10,000 investment |
| Multimanager 2070 Lifetime Portfolio (Class 1/JHOPX) |
$6 | 0.05% |
Management’s Discussion of Fund Performance
SUMMARY OF RESULTS
Multimanager 2070 Lifetime Portfolio (Class 1/JHOPX) returned 20.68% for the year ended August 31, 2026. Global equities produced sizable gains in the 12-month period that ended on August 31, 2026. Investors were encouraged by the favorable combination of healthy economic growth trends, robust corporate earnings, and generally supportive central bank policies, together with optimism about artificial intelligence. While technology stocks performed very well, the value style outpaced growth on a global basis and contributed meaningfully to the markets’ strong showing. Emerging market equities also posted outsized returns. Bonds registered more modest gains, led by credit-oriented investments. Income was the primary contributor to total returns for fixed income instruments, as prices came under pressure from concerns about persistent inflation, global conflicts, energy prices, and mounting government debt across the developed world.
TOP PERFORMANCE CONTRIBUTORS
Equity allocation | U.S. equities made a significant contribution to absolute performance, led by large cap equities. International developed market equities further helped results, as did emerging market stocks. Defensive equities also generated positive returns.
Bond funds | The fixed-income allocation contributed positively, led by short-term bonds and emerging market debt.
TOP PERFORMANCE DETRACTORS
Specific positions | At a time of positive returns for most segments of the financial markets, the majority of the fund’s holdings recorded a gain. However, a small position in U.S. Treasury STRIPS (Separate Trading of Registered Interest and Principal of Securities) was adversely affected by rising yields.
The views expressed in this report are those of the portfolio management team and are subject to change. They are not meant as investment advice.
Fund Performance
The following graph compares the initial and subsequent account values at the end of each of the most recently completed 10 fiscal years of the fund (or for the life of the fund, if shorter). It assumes a $10,000 initial investment in the fund and in an appropriate, broad-based securities market index for the same period.
GROWTH OF $10,000
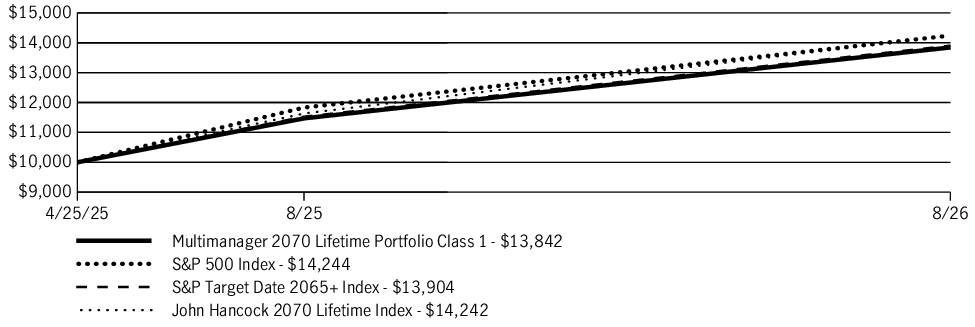
| AVERAGE ANNUAL TOTAL RETURN | 1 Year | Since inception |
| Multimanager 2070 Lifetime Portfolio (Class 1/JHOPX) | 20.68% | 27.16% |
| S&P 500 Index | 20.38% | 29.87% |
| S&P Target Date 2065+ Index | 20.62% | 27.57% |
| John Hancock 2070 Lifetime Index | 22.43% | 29.86% |
Fund Statistics
| Fund net assets | $12,753,053 |
| Total number of portfolio holdings | 29 |
| Total advisory fees paid (net) | $0 |
| Portfolio turnover rate | 25% |
Graphical Representation of Holdings
The table below shows the investment makeup of the fund, representing a percentage of the total net assets of the fund.
Asset Allocation
| Affiliated investment companies | 93.2% |
| Equity | 89.1% |
| U.S. large cap | 29.4% |
| International equity | 27.2% |
| Large blend | 16.2% |
| U.S. mid cap | 8.9% |
| Emerging-market equity | 5.9% |
| U.S. small cap | 1.5% |
| Fixed income | 3.8% |
| Short-term bond | 2.4% |
| Emerging-market debt | 0.6% |
| Intermediate bond | 0.5% |
| High yield bond | 0.3% |
| Alternative and specialty | 0.3% |
| Absolute return | 0.3% |
| Unaffiliated investment companies | 6.4% |
| Equity | 6.4% |
| U.S. Government | 0.4% |
Holdings may not have been held by the fund for the entire period and are subject to change without notice. Portfolio composition is subject to review in accordance with the fund’s investment strategy and may vary in the future. Current and future portfolio holdings are subject to risk and may change at any time.
What were the fund costs during the last year ?
(Based on a hypothetical $10,000 investment)
| Fund (Class) | Costs of a $10,000 investment | Costs paid as a percentage of a $10,000 investment |
| Multimanager 2070 Lifetime Portfolio (Class A/JHOQX) |
$45 | 0.41% |
Management’s Discussion of Fund Performance
SUMMARY OF RESULTS
Multimanager 2070 Lifetime Portfolio (Class A/JHOQX) returned 20.24% (excluding sales charges) for the year ended August 31, 2026. Global equities produced sizable gains in the 12-month period that ended on August 31, 2026. Investors were encouraged by the favorable combination of healthy economic growth trends, robust corporate earnings, and generally supportive central bank policies, together with optimism about artificial intelligence. While technology stocks performed very well, the value style outpaced growth on a global basis and contributed meaningfully to the markets’ strong showing. Emerging market equities also posted outsized returns. Bonds registered more modest gains, led by credit-oriented investments. Income was the primary contributor to total returns for fixed income instruments, as prices came under pressure from concerns about persistent inflation, global conflicts, energy prices, and mounting government debt across the developed world.
TOP PERFORMANCE CONTRIBUTORS
Equity allocation | U.S. equities made a significant contribution to absolute performance, led by large cap equities. International developed market equities further helped results, as did emerging market stocks. Defensive equities also generated positive returns.
Bond funds | The fixed-income allocation contributed positively, led by short-term bonds and emerging market debt.
TOP PERFORMANCE DETRACTORS
Specific positions | At a time of positive returns for most segments of the financial markets, the majority of the fund’s holdings recorded a gain. However, a small position in U.S. Treasury STRIPS (Separate Trading of Registered Interest and Principal of Securities) was adversely affected by rising yields.
The views expressed in this report are those of the portfolio management team and are subject to change. They are not meant as investment advice.
Fund Performance
The following graph compares the initial and subsequent account values at the end of each of the most recently completed 10 fiscal years of the fund (or for the life of the fund, if shorter). It assumes a $10,000 initial investment in the fund and in an appropriate, broad-based securities market index for the same period.
GROWTH OF $10,000
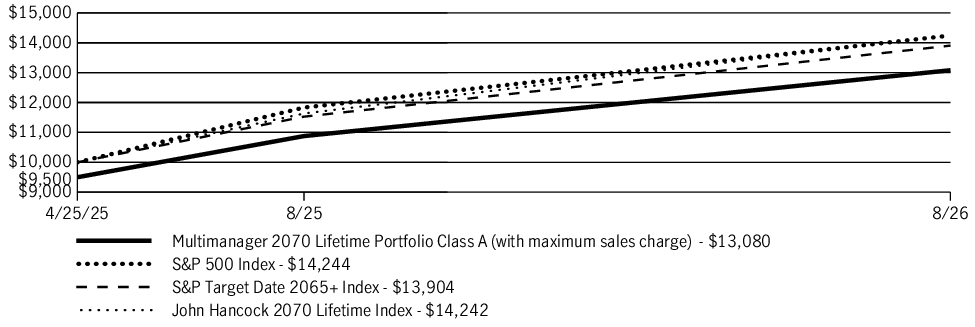
| AVERAGE ANNUAL TOTAL RETURN | 1 Year | Since inception |
| Multimanager 2070 Lifetime Portfolio (Class A/JHOQX) | 14.26% | 21.91% |
| Multimanager 2070 Lifetime Portfolio (Class A/JHOQX)—excluding sales charge | 20.24% | 26.65% |
| S&P 500 Index | 20.38% | 29.87% |
| S&P Target Date 2065+ Index | 20.62% | 27.57% |
| John Hancock 2070 Lifetime Index | 22.43% | 29.86% |
Fund Statistics
| Fund net assets | $12,753,053 |
| Total number of portfolio holdings | 29 |
| Total advisory fees paid (net) | $0 |
| Portfolio turnover rate | 25% |
Graphical Representation of Holdings
The table below shows the investment makeup of the fund, representing a percentage of the total net assets of the fund.
Asset Allocation
| Affiliated investment companies | 93.2% |
| Equity | 89.1% |
| U.S. large cap | 29.4% |
| International equity | 27.2% |
| Large blend | 16.2% |
| U.S. mid cap | 8.9% |
| Emerging-market equity | 5.9% |
| U.S. small cap | 1.5% |
| Fixed income | 3.8% |
| Short-term bond | 2.4% |
| Emerging-market debt | 0.6% |
| Intermediate bond | 0.5% |
| High yield bond | 0.3% |
| Alternative and specialty | 0.3% |
| Absolute return | 0.3% |
| Unaffiliated investment companies | 6.4% |
| Equity | 6.4% |
| U.S. Government | 0.4% |
Holdings may not have been held by the fund for the entire period and are subject to change without notice. Portfolio composition is subject to review in accordance with the fund’s investment strategy and may vary in the future. Current and future portfolio holdings are subject to risk and may change at any time.
What were the fund costs during the last year ?
(Based on a hypothetical $10,000 investment)
| Fund (Class) | Costs of a $10,000 investment | Costs paid as a percentage of a $10,000 investment |
| Multimanager 2070 Lifetime Portfolio (Class R6/JHBZX) |
$1 | 0.01% |
Management’s Discussion of Fund Performance
SUMMARY OF RESULTS
Multimanager 2070 Lifetime Portfolio (Class R6/JHBZX) returned 20.72% for the year ended August 31, 2026. Global equities produced sizable gains in the 12-month period that ended on August 31, 2026. Investors were encouraged by the favorable combination of healthy economic growth trends, robust corporate earnings, and generally supportive central bank policies, together with optimism about artificial intelligence. While technology stocks performed very well, the value style outpaced growth on a global basis and contributed meaningfully to the markets’ strong showing. Emerging market equities also posted outsized returns. Bonds registered more modest gains, led by credit-oriented investments. Income was the primary contributor to total returns for fixed income instruments, as prices came under pressure from concerns about persistent inflation, global conflicts, energy prices, and mounting government debt across the developed world.
TOP PERFORMANCE CONTRIBUTORS
Equity allocation | U.S. equities made a significant contribution to absolute performance, led by large cap equities. International developed market equities further helped results, as did emerging market stocks. Defensive equities also generated positive returns.
Bond funds | The fixed-income allocation contributed positively, led by short-term bonds and emerging market debt.
TOP PERFORMANCE DETRACTORS
Specific positions | At a time of positive returns for most segments of the financial markets, the majority of the fund’s holdings recorded a gain. However, a small position in U.S. Treasury STRIPS (Separate Trading of Registered Interest and Principal of Securities) was adversely affected by rising yields.
The views expressed in this report are those of the portfolio management team and are subject to change. They are not meant as investment advice.
Fund Performance
The following graph compares the initial and subsequent account values at the end of each of the most recently completed 10 fiscal years of the fund (or for the life of the fund, if shorter). It assumes a $1,000,000 initial investment in the fund and in an appropriate, broad-based securities market index for the same period.
GROWTH OF $1,000,000
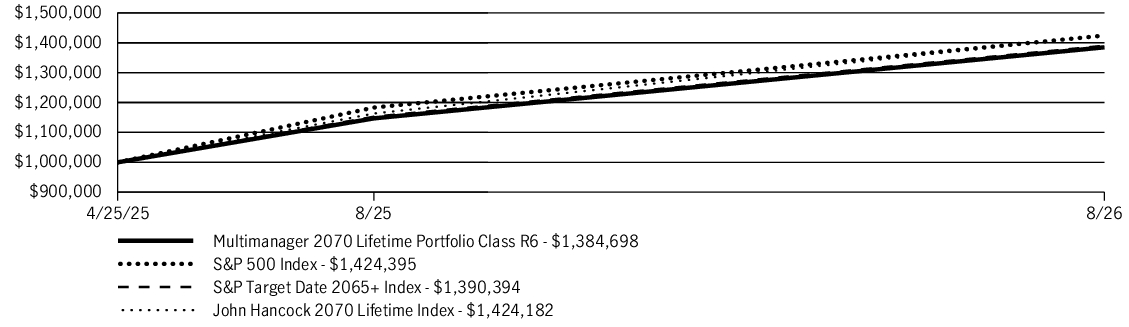
| AVERAGE ANNUAL TOTAL RETURN | 1 Year | Since inception |
| Multimanager 2070 Lifetime Portfolio (Class R6/JHBZX) | 20.72% | 27.19% |
| S&P 500 Index | 20.38% | 29.87% |
| S&P Target Date 2065+ Index | 20.62% | 27.57% |
| John Hancock 2070 Lifetime Index | 22.43% | 29.86% |
Fund Statistics
| Fund net assets | $12,753,053 |
| Total number of portfolio holdings | 29 |
| Total advisory fees paid (net) | $0 |
| Portfolio turnover rate | 25% |
Graphical Representation of Holdings
The table below shows the investment makeup of the fund, representing a percentage of the total net assets of the fund.
Asset Allocation
| Affiliated investment companies | 93.2% |
| Equity | 89.1% |
| U.S. large cap | 29.4% |
| International equity | 27.2% |
| Large blend | 16.2% |
| U.S. mid cap | 8.9% |
| Emerging-market equity | 5.9% |
| U.S. small cap | 1.5% |
| Fixed income | 3.8% |
| Short-term bond | 2.4% |
| Emerging-market debt | 0.6% |
| Intermediate bond | 0.5% |
| High yield bond | 0.3% |
| Alternative and specialty | 0.3% |
| Absolute return | 0.3% |
| Unaffiliated investment companies | 6.4% |
| Equity | 6.4% |
| U.S. Government | 0.4% |
Holdings may not have been held by the fund for the entire period and are subject to change without notice. Portfolio composition is subject to review in accordance with the fund’s investment strategy and may vary in the future. Current and future portfolio holdings are subject to risk and may change at any time.