| Fiscal Year | Summary Compensation Table Total for PEO ($) (1) | Compensation Actually Paid to PEO ($) (3) | Average Summary Compensation Table Total for Non-PEO NEOs ($) (2) | Average Compensation Actually Paid to Non-PEO NEOs ($) (3) | Value of Initial Fixed $100 Investment Based On: Total Shareholder Return ($) (4) | Net Income (Loss) ($) (5) | ||||||||||||||||||||
| (a) | (b) | (c) | (d) | (e) | (f) | (g) | ||||||||||||||||||||
| 2026 | 285,450 | 241,208 | $ | 276,027 | 173,150 | 21.81 | (3,775,000 | ) | ||||||||||||||||||
| 2025 | 201,034 | 177,700 | $ | 219,848 | 198,218 | 27.83 | (4,973,000 | ) | ||||||||||||||||||
| 2024 | 360,103 | 199,836 | $ | 314,810 | 238,393 | 42.38 | (5,978,000 | ) | ||||||||||||||||||
| (1) | The dollar amounts reported in column (b) are the amounts of total compensation reported for our chief executive officer, Mr. Zackary Irani (our PEO), for each corresponding year in the “Total” column of the SCT. Refer to “Executive Compensation – Summary Compensation Table.” |
The 2026 CAP to our PEO and the average CAP to our non-PEO NEOs reflects the following adjustments required by the applicable SEC rules from the total compensation reported in the SCT:
| PEO | Average of Non-PEO NEOs | |||||||
| Total Reported in 2026 SCT | 285,450 | 276,027 | ||||||
| Less: value of equity awards reported in SCT | (135,450 | ) | (90,300 | ) | ||||
| Add: year-end value of equity awards granted in 2026 that are unvested and outstanding | 125,475 | 35,850 | ||||||
| Add: change in fair value (from prior year-end) of prior year equity awards that are unvested and outstanding | (24,610 | ) | ||||||
| Add: fair market value of equity awards granted in 2026 and that vested in 2026 | ||||||||
| Add: change in fair value (from prior year-end) of prior year equity awards that vested in 2026 | (9,657 | ) | (6,898 | ) | ||||
| Less: fair market value of equity awards deemed to fail to meet the applicable vesting conditions during 2026 | (41,529 | ) | ||||||
| Compensation Actually Paid for 2026 | 241,208 | 173,150 | ||||||
The 2025 CAP to our PEO and the average CAP to our non-PEO NEOs reflects the following adjustments required by the applicable SEC rules from the total compensation reported in the SCT:
| PEO | Average of Non-PEO NEOs | |||||||
| Total Reported in 2025 SCT | 201,034 | 219,848 | ||||||
| Less: value of equity awards reported in SCT | (78,438 | ) | (43,141 | ) | ||||
| Add: year-end value of equity awards granted in 2025 that are unvested and outstanding | 95,313 | 52,422 | ||||||
| Add: change in fair value (from prior year-end) of prior year equity awards that are unvested and outstanding | (16,608 | ) | (7,945 | ) | ||||
| Add: fair market value of equity awards granted in 2025 and that vested in 2025 | ||||||||
| Add: change in fair value (from prior year-end) of prior year equity awards that vested in 2025 | (23,601 | ) | (22,966 | ) | ||||
| Less: fair market value of equity awards deemed to fail to meet the applicable vesting conditions during 2025 | ||||||||
| Compensation Actually Paid for 2025 | 177,700 | 198,218 | ||||||
The 2024 CAP to our PEO and the average CAP to our non-PEO NEOs reflects the following adjustments required by the applicable SEC rules from the total compensation reported in the SCT:
| PEO | Average of Non-PEO NEOs | |||||||
| Total Reported in 2024 SCT | 360,103 | 314,810 | ||||||
| Less: value of equity awards reported in SCT | (210,103 | ) | (122,518 | ) | ||||
| Add: year-end value of equity awards granted in 2024 that are unvested and outstanding | 102,614 | 57,148 | ||||||
| Add: change in fair value (from prior year-end) of prior year equity awards that are unvested and outstanding | (47,169 | ) | (25,380 | ) | ||||
| Add: fair market value of equity awards granted in 2024 and that vested in 2024 | 20,914 | 19,918 | ||||||
| Add: change in fair value (from prior year-end) of prior year equity awards that vested in 2024 | (26,523 | ) | (5,585 | ) | ||||
| Less: fair market value of equity awards deemed to fail to meet the applicable vesting conditions during 2024 | ||||||||
| Compensation Actually Paid for 2024 | 199,836 | 238,393 | ||||||
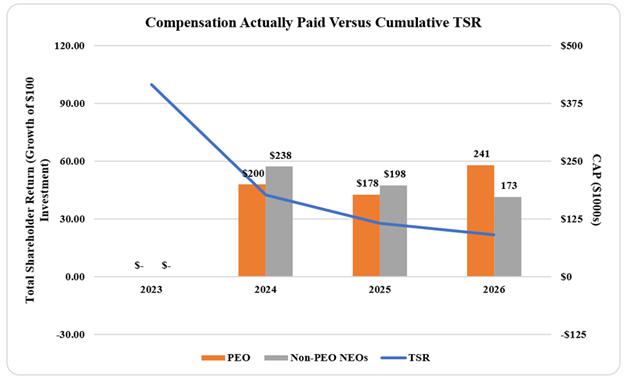
The following graph sets forth the relationship between CAP to our PEO, the average CAP for our Non-PEOs, and the Company’s TSR over the period covering 2026, 2025, and 2024.
Compensation Actually Paid and Net Income (Loss)
Due to the nature of the Company’s consolidated financial results and primary focus on research and development of diagnostic-guided therapy products to treat gastrointestinal diseases, our Company has not historically utilized net income (loss) as a performance measure for our executive compensation program. However, as the inFoods product has now launched, the Board will evaluate the relationship between our total revenues and net income (loss) and CAP to our PEO and Non-PEO NEOs going forward.
| (3) | The dollar amounts reported in columns (c) and (e) represent the CAP to Mr. Zackary Irani, and the average CAP to our non-PEO NEOs, respectively, as computed in accordance with Item 402(v) of Regulation S-K. The dollar amounts do not reflect the actual amount of compensation earned by or paid to our NEOs during the applicable year. In accordance with the requirements of Item 402(v) of Regulation S-K, to calculate CAP, compensation related to equity awards was remeasured based on the following: For stock options, a Black-Scholes (“BSM”) option-pricing model was used as of the applicable year-end date, or, in the case of vested options, the vesting date. The BSM model requires us to make assumptions and judgments regarding the variables used in the calculation, including the expected remaining term, expected volatility, and the expected risk-free rate. For restricted stock awards, the closing market price of the Company’s common stock was used as of the applicable year-end date, or in the case of vested restricted stock awards, the vesting date. The valuation assumptions used to calculate the CAP shown in the table were materially consistent with those used to calculate our share-based compensation expense, as disclosed in our Annual Report. |
| [1] | The dollar amounts reported in columns (c) and (e) represent the CAP to Mr. Zackary Irani, and the average CAP to our non-PEO NEOs, respectively, as computed in accordance with Item 402(v) of Regulation S-K. The dollar amounts do not reflect the actual amount of compensation earned by or paid to our NEOs during the applicable year. In accordance with the requirements of Item 402(v) of Regulation S-K, to calculate CAP, compensation related to equity awards were remeasured based on the following: For stock options, a Black-Scholes (“BSM”) option-pricing model was used as of the applicable year-end date, or, in the case of vested options, the vesting date. The BSM model requires us to make assumptions and judgments regarding the variables used in the calculation, including the expected remaining term, expected volatility, and the expected risk-free rate. For restricted stock awards, the closing market price of the Company’s common stock was used as of the applicable year-end date, or in the case of vested restricted stock awards, the vesting date. The valuation assumptions used to calculate the CAP shown in the table were materially consistent with those used to calculate our share-based compensation expense, as disclosed in our 2026 Annual Report on Form 10-K. |
| [2] | The dollar amounts reported in column (d) represent the average of the amounts reported for the Non-PEO NEOs (excluding our PEO) in the “Total” column of the SCT. The Non-PEO NEOs included in the table above were as follows: |
| [3] | TSR is determined based on the value of an initial fixed investment of $100 on May 31, 2023. Cumulative TSR is calculated by dividing the sum of the cumulative amount of dividends for the measurement period, assuming dividend reinvestment, and the difference between the Company’s share price at the end of the measurement period and the Company’s share price at the beginning of the measurement period. |
| [4] | The dollar amounts reported in column (g) represent the amount of net loss reflected in the Company’s audited financial statements for the applicable year. |
| [5] | The dollar amounts reported in column (b) are the amounts of total compensation reported for our chief executive officer, Mr. Zackary Irani, (our PEO) for each corresponding year in the “Total” column of the SCT. Refer to “Executive Compensation – Summary Compensation Table” |