Pay vs Performance Disclosure - USD ($)
Oct. 15, 2024
Sep. 02, 2024
Oct. 19, 2025
Jun. 30, 2026
Jun. 30, 2025
Jun. 30, 2026
Jun. 30, 2025
Jun. 30, 2024
Pay Versus Performance
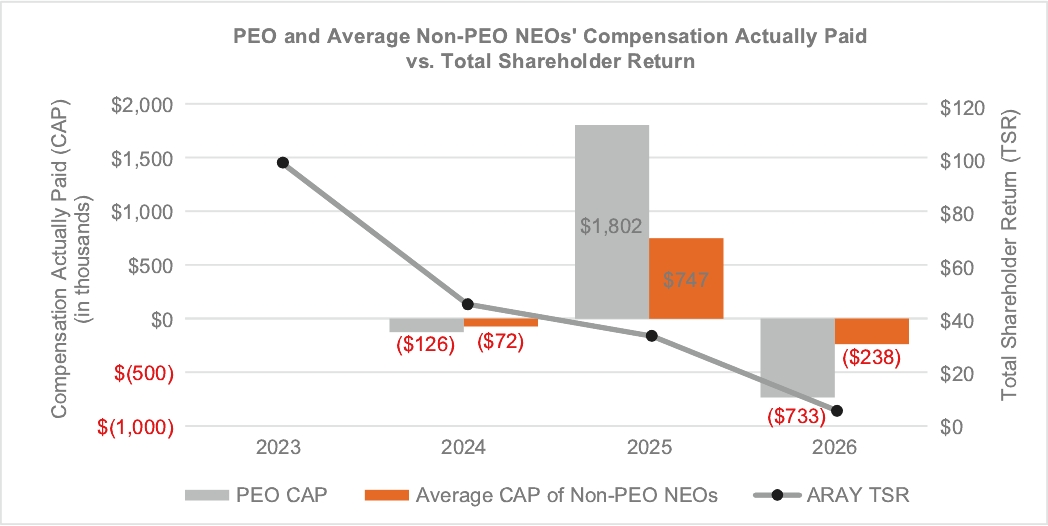
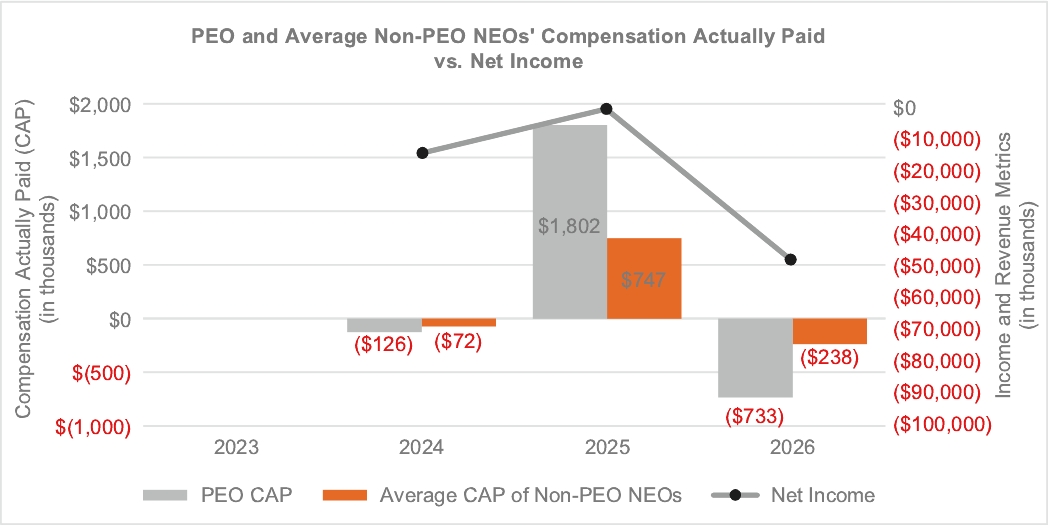
As required by Section 953(a) of the Dodd-Frank Wall Street Reform and Consumer Protection Act and Item 402(v) of Regulation S-K, the table below includes information to demonstrate the relationship, for fiscal years 2026, 2025, and 2024 between certain financial performance measures and the compensation of each of our principal executive officers (each, a “PEO”) or the average compensation of our named executive officers other than the PEO (the “non-PEO NEOs”). For additional information about our performance-based pay philosophy and how we align executive compensation with our performance, refer to the section entitled “Compensation Discussion and Analysis.”
Fiscal Year(1) | Summary Compensation Table Total for PEO#1 ($)(2) | Compensation Actually Paid to PEO#1 ($)(3)(4) | Summary Compensation Table Total for PEO#2 ($)(2) | Compensation Actually Paid to PEO#2 ($)(3)(4) | Average Summary Compensation Table Total for Non-PEO NEOs ($)(5) | Average Compensation Actually Paid to Non-PEO NEOs ($)(6) | Value of Initial Fixed $100 Investment based on: | |||||||||||||||||
Total Shareholder Return ($)(7) | Net Income (Loss)(8) ($) | |||||||||||||||||||||||
2026 | 1,114,423 | (2,622,849) | 5,226,966 | 1,890,069 | 737,600 | (237,584) | 7 | (49.194 million) | ||||||||||||||||
2025 | 3,042,119 | 1,199,375 | 1,199,334 | 602,265 | 1,233,163 | 746,671 | 35 | (1.591 million) | ||||||||||||||||
2024 | 3,516,039 | (125,703) | 1,173,971 | (72,097) | 47 | (15.545 million) | ||||||||||||||||||
(1) | The Company’s named executive officers, including its PEO for the applicable years, were as follows: |
2026: Suzanne Winter (PEO#1); Steve La Neve (PEO#2); and Ali Pervaiz, Sandeep Chalke and Paul Miele (non-PEO NEOs).
2025: Suzanne Winter (PEO#1); Sandeep Chalke (PEO#2); and Ali Pervaiz and Jesse Chew (non-PEO NEOs).
2024: Suzanne Winter (PEO); and Ali Pervaiz, Sandeep Chalke, Jesse Chew, and Michael Hoge (non-PEO NEOs).
(2) | The dollar amounts reported are the total compensation reported for each PEO (as specified in Footnote 1 above) for each fiscal year in the “Total” column of the Summary Compensation Table. |
(3) | Compensation actually paid does not necessarily reflect the amounts of compensation actually earned, realized, or received by our named executive officers in each fiscal year. Rather, compensation actually paid is calculated by making certain adjustments to the amount of compensation reported in the “Total” column of the Summary Compensation Table for each PEO (or the average of the non-PEO NEOs) in accordance with the requirements of Item 402(v) of Regulation S K. We have not reported any amounts in our Summary Compensation Table with respect to, and we do not maintain and have not maintained for the fiscal years shown in the table, any defined benefit or actuarial pension plans for our named executive officers, and accordingly, no adjustments are shown in footnotes (4) and (6) below for any such compensation. |
(4) | Compensation actually paid to each PEO for the respective fiscal years reported is calculated as follows: |
2026 PEO#1 ($) | 2026 PEO#2 ($) | 2025 PEO#1 ($) | 2025 PEO#2 ($) | 2024 ($) | |||||||||||
Total compensation reported in Summary Compensation Table | 1,114,423 | 5,226,966 | 3,042,119 | 1,199,334 | 3,516,039 | ||||||||||
Less: Grant date fair value of equity awarded in the covered fiscal year(a) | — | 4,263,749 | 2,314,147 | 673,206 | 2,708,486 | ||||||||||
Plus: | |||||||||||||||
Fair value as of June 30th of awards granted during and outstanding and unvested at the end of the covered fiscal year(b) | — | 926,852 | 1,421,696 | 413,584 | 1,888,676 | ||||||||||
Change in fair value as of the end of the covered fiscal year of outstanding awards granted in prior fiscal years that are vested(c) | — | — | (666,436) | (328,063) | (2,353,594) | ||||||||||
Vesting date fair value of equity awards granted and vested during the covered fiscal year(d) | — | — | — | — | — | ||||||||||
Change in fair value of awards granted in prior fiscal years and vested during the covered fiscal year(e) | (43,921) | — | 56,355 | (9,383) | (468,338) | ||||||||||
Earnings paid on unvested awards for dividends or other earnings (not otherwise reflected in total compensation for the covered fiscal year) | — | — | — | — | — | ||||||||||
Less: Fair value as of June 30th at end of immediately prior fiscal year of awards granted in prior fiscal years that were forfeited during the covered fiscal year(f) | 3,693,350 | — | 340,212 | — | — | ||||||||||
Compensation Actually Paid to PEO | (2,622,849) | 1,890,069 | 1,199,375 | 602,265 | (125,703) | ||||||||||
(a) | The grant date fair value of equity awards represents the total of the amounts reported in the “Stock Awards” and “Option Awards” columns in the Summary Compensation Table for the applicable year. See the notes to the Summary Compensation Table and Grants of Plan-Based Awards table for more information on how we determine fair value for equity awards. |
(b) | Represents the fair value as of the indicated fiscal year-end of the outstanding and unvested option awards and stock awards granted during such fiscal year, computed in accordance with the methodology used for financial reporting purposes. |
(c) | Represents the change in fair value, measured from the prior fiscal year-end to the last day of the indicated fiscal year, of each option award and stock award that was granted in a prior fiscal year and that remained outstanding and unvested as of the last day of the indicated fiscal year, computed in accordance with the methodology used for financial reporting purposes and, for awards subject to performance-based vesting conditions, based on the probable outcome of such performance-based vesting conditions as of the last day of the fiscal year. |
(d) | Our PEOs did not have any option or stock awards that were granted and vested during the covered fiscal year. |
(e) | Represents the change in fair value, measured from the prior fiscal year-end to the vesting date, of each option award and stock award that was granted in a prior fiscal year and which vested during the indicated fiscal year, computed in accordance with the methodology used for financial reporting purposes. |
(f) | Represents the fair value as of the last day of the prior fiscal year of the option award and stock awards that were granted in a prior fiscal year and which were forfeited or failed to meet the applicable vesting conditions in the indicated fiscal year, computed in accordance with the methodology used for financial reporting purposes. |
(5) | The dollar amounts reported are average of the total compensation reported our non-PEO NEOs for the respective fiscal year (as specified in Footnote 1 above) in the “Total” column of the Summary Compensation Table. |
(6) | Compensation actually paid on average to our non-PEO NEOs (as specified in Footnote 1 above) for the respective fiscal years reported is calculated as follows: |
2026 ($) | 2025 ($) | 2024 ($) | |||||||
Average total compensation reported in Summary Compensation Table | 737,600 | 1,233,163 | 1,173,971 | ||||||
Less: Average grant date fair value of equity awarded in the covered fiscal year(a) | 247,325 | 712,653 | 689,432 | ||||||
Plus: | |||||||||
Average fair value as of June 30th of awards granted during and outstanding and unvested at the end of the covered fiscal year(b) | 128,267 | 437,818 | 480,753 | ||||||
Average change in fair value as of the end of the covered fiscal year of outstanding awards granted in prior fiscal years that are unvested(c) | (146,603) | (173,881) | (895,539) | ||||||
Average vesting date fair value of equity awards granted and vested during the covered fiscal year(d) | — | — | — | ||||||
Average change in fair value of awards granted in prior fiscal years and vested during the covered fiscal year(e) | (104,547) | 29,060 | (141,850) | ||||||
Earnings paid on unvested awards for dividends or other earnings (not otherwise reflected in total compensation for the covered fiscal year) | — | — | — | ||||||
Less: Fair value as of June 30th at end of immediately prior fiscal year of awards granted in prior fiscal years that were forfeited during the covered fiscal year(f) | 604,975 | 66,835 | — | ||||||
Average Compensation Actually Paid to Non-PEO NEOs | (237,584) | 746,671 | (72,097) | ||||||
(a) | The grant date fair value of equity awards represents the total of the amounts reported in the “Stock Awards” and “Option Awards” columns in the Summary Compensation Table for the applicable year. See the notes to the Summary Compensation Table and Grants of Plan-Based Awards table for more information on how we determine fair value for equity awards. |
(b) | Represents the fair value as of the indicated fiscal year-end of the outstanding and unvested option awards and stock awards granted during such fiscal year, computed in accordance with the methodology used for financial reporting purposes. |
(c) | Represents the change in fair value, measured from the prior fiscal year-end to the last day of the indicated fiscal year of each option award and stock award that was granted in a prior fiscal year and that remained outstanding and unvested as of the last day of the indicated fiscal year, computed in accordance with the methodology used for financial reporting purposes and, for awards subject to performance-based vesting conditions, based on the probable outcome of such performance-based vesting conditions as of the last day of the fiscal year. |
(d) | Our non-PEO NEOs did not have any option or stock awards that were granted and vested during the covered fiscal year. |
(e) | Represents the change in fair value, measured from the prior fiscal year-end to the vesting date, of each option award and stock award that was granted in a prior fiscal year and which vested during the indicated fiscal year, computed in accordance with the methodology used for financial reporting purposes. |
(f) | Represents the fair value as of the last day of the prior fiscal year of the option award and stock awards that were granted in a prior fiscal year and which were forfeited or failed to meet the applicable vesting conditions in the indicated fiscal year, computed in accordance with the methodology used for financial reporting purposes. |
(7) | As calculated in the manner prescribed by Item 201(e) of Regulation S-K. Represents the cumulative total stockholder return of the Company over the applicable measurement period. |
(8) | The dollar amounts reported represent the amount of net income (loss) reflected in the Company’s audited financial statements for the applicable year. |
(1) | The Company’s named executive officers, including its PEO for the applicable years, were as follows: |
2026: Suzanne Winter (PEO#1); Steve La Neve (PEO#2); and Ali Pervaiz, Sandeep Chalke and Paul Miele (non-PEO NEOs).
2025: Suzanne Winter (PEO#1); Sandeep Chalke (PEO#2); and Ali Pervaiz and Jesse Chew (non-PEO NEOs).
2024: Suzanne Winter (PEO); and Ali Pervaiz, Sandeep Chalke, Jesse Chew, and Michael Hoge (non-PEO NEOs).
(4) | Compensation actually paid to each PEO for the respective fiscal years reported is calculated as follows: |
2026 PEO#1 ($) | 2026 PEO#2 ($) | 2025 PEO#1 ($) | 2025 PEO#2 ($) | 2024 ($) | |||||||||||
Total compensation reported in Summary Compensation Table | 1,114,423 | 5,226,966 | 3,042,119 | 1,199,334 | 3,516,039 | ||||||||||
Less: Grant date fair value of equity awarded in the covered fiscal year(a) | — | 4,263,749 | 2,314,147 | 673,206 | 2,708,486 | ||||||||||
Plus: | |||||||||||||||
Fair value as of June 30th of awards granted during and outstanding and unvested at the end of the covered fiscal year(b) | — | 926,852 | 1,421,696 | 413,584 | 1,888,676 | ||||||||||
Change in fair value as of the end of the covered fiscal year of outstanding awards granted in prior fiscal years that are vested(c) | — | — | (666,436) | (328,063) | (2,353,594) | ||||||||||
Vesting date fair value of equity awards granted and vested during the covered fiscal year(d) | — | — | — | — | — | ||||||||||
Change in fair value of awards granted in prior fiscal years and vested during the covered fiscal year(e) | (43,921) | — | 56,355 | (9,383) | (468,338) | ||||||||||
Earnings paid on unvested awards for dividends or other earnings (not otherwise reflected in total compensation for the covered fiscal year) | — | — | — | — | — | ||||||||||
Less: Fair value as of June 30th at end of immediately prior fiscal year of awards granted in prior fiscal years that were forfeited during the covered fiscal year(f) | 3,693,350 | — | 340,212 | — | — | ||||||||||
Compensation Actually Paid to PEO | (2,622,849) | 1,890,069 | 1,199,375 | 602,265 | (125,703) | ||||||||||
(a) | The grant date fair value of equity awards represents the total of the amounts reported in the “Stock Awards” and “Option Awards” columns in the Summary Compensation Table for the applicable year. See the notes to the Summary Compensation Table and Grants of Plan-Based Awards table for more information on how we determine fair value for equity awards. |
(b) | Represents the fair value as of the indicated fiscal year-end of the outstanding and unvested option awards and stock awards granted during such fiscal year, computed in accordance with the methodology used for financial reporting purposes. |
(c) | Represents the change in fair value, measured from the prior fiscal year-end to the last day of the indicated fiscal year, of each option award and stock award that was granted in a prior fiscal year and that remained outstanding and unvested as of the last day of the indicated fiscal year, computed in accordance with the methodology used for financial reporting purposes and, for awards subject to performance-based vesting conditions, based on the probable outcome of such performance-based vesting conditions as of the last day of the fiscal year. |
(d) | Our PEOs did not have any option or stock awards that were granted and vested during the covered fiscal year. |
(e) | Represents the change in fair value, measured from the prior fiscal year-end to the vesting date, of each option award and stock award that was granted in a prior fiscal year and which vested during the indicated fiscal year, computed in accordance with the methodology used for financial reporting purposes. |
(f) | Represents the fair value as of the last day of the prior fiscal year of the option award and stock awards that were granted in a prior fiscal year and which were forfeited or failed to meet the applicable vesting conditions in the indicated fiscal year, computed in accordance with the methodology used for financial reporting purposes. |
(6) | Compensation actually paid on average to our non-PEO NEOs (as specified in Footnote 1 above) for the respective fiscal years reported is calculated as follows: |
2026 ($) | 2025 ($) | 2024 ($) | |||||||
Average total compensation reported in Summary Compensation Table | 737,600 | 1,233,163 | 1,173,971 | ||||||
Less: Average grant date fair value of equity awarded in the covered fiscal year(a) | 247,325 | 712,653 | 689,432 | ||||||
Plus: | |||||||||
Average fair value as of June 30th of awards granted during and outstanding and unvested at the end of the covered fiscal year(b) | 128,267 | 437,818 | 480,753 | ||||||
Average change in fair value as of the end of the covered fiscal year of outstanding awards granted in prior fiscal years that are unvested(c) | (146,603) | (173,881) | (895,539) | ||||||
Average vesting date fair value of equity awards granted and vested during the covered fiscal year(d) | — | — | — | ||||||
Average change in fair value of awards granted in prior fiscal years and vested during the covered fiscal year(e) | (104,547) | 29,060 | (141,850) | ||||||
Earnings paid on unvested awards for dividends or other earnings (not otherwise reflected in total compensation for the covered fiscal year) | — | — | — | ||||||
Less: Fair value as of June 30th at end of immediately prior fiscal year of awards granted in prior fiscal years that were forfeited during the covered fiscal year(f) | 604,975 | 66,835 | — | ||||||
Average Compensation Actually Paid to Non-PEO NEOs | (237,584) | 746,671 | (72,097) | ||||||
(a) | The grant date fair value of equity awards represents the total of the amounts reported in the “Stock Awards” and “Option Awards” columns in the Summary Compensation Table for the applicable year. See the notes to the Summary Compensation Table and Grants of Plan-Based Awards table for more information on how we determine fair value for equity awards. |
(b) | Represents the fair value as of the indicated fiscal year-end of the outstanding and unvested option awards and stock awards granted during such fiscal year, computed in accordance with the methodology used for financial reporting purposes. |
(c) | Represents the change in fair value, measured from the prior fiscal year-end to the last day of the indicated fiscal year of each option award and stock award that was granted in a prior fiscal year and that remained outstanding and unvested as of the last day of the indicated fiscal year, computed in accordance with the methodology used for financial reporting purposes and, for awards subject to performance-based vesting conditions, based on the probable outcome of such performance-based vesting conditions as of the last day of the fiscal year. |
(d) | Our non-PEO NEOs did not have any option or stock awards that were granted and vested during the covered fiscal year. |
(e) | Represents the change in fair value, measured from the prior fiscal year-end to the vesting date, of each option award and stock award that was granted in a prior fiscal year and which vested during the indicated fiscal year, computed in accordance with the methodology used for financial reporting purposes. |
(f) | Represents the fair value as of the last day of the prior fiscal year of the option award and stock awards that were granted in a prior fiscal year and which were forfeited or failed to meet the applicable vesting conditions in the indicated fiscal year, computed in accordance with the methodology used for financial reporting purposes. |