Forward-Looking Statements 2 © 2026, Galaxy Gaming, Inc. All rights reserved. This presentation contains, and oral statements made from time to time by our representatives may contain, forward-looking statements based on management's current expectations and projections, which are intended to qualify for the safe harbor of Section 27A of the Securities Act of 1933, as amended, and Section 21E of the Securities Exchange Act of 1934, as amended. Forward-looking statements include statements identified by words such as "believe," "will," "expected to," "may," "might," "likely," "expect," "anticipates," "intends," "plans," "seeks," "estimates," "continues," "projects" and similar references to future periods, or by the inclusion of forecasts or projections. These forward-looking statements reflect the current views, models, and assumptions of Galaxy Gaming, and are subject to various risks and uncertainties that cannot be predicted or quantified and could cause actual results to differ materially from those expressed or implied. These risks and uncertainties include, but are not limited to, the ability of Galaxy Gaming to enter and maintain strategic alliances, product placements or installations in land-based casinos or grow its iGaming business, garner new market share, secure licenses in new jurisdictions or maintain existing licenses, successfully develop or acquire and sell proprietary products, comply with regulations, and have its games approved by relevant jurisdictions. All forward-looking statements made herein are expressly qualified in their entirety by these cautionary statements, and there can be no assurance that the actual results, events or developments referenced herein will occur or be realized. Readers are cautioned that all forward-looking statements speak only to the facts and circumstances present as of the date of this presentation. Galaxy Gaming expressly disclaims any obligation to update or revise any forward-looking statements, whether because of new information, future events or otherwise. Non-GAAP measures: This presentation references Adjusted EBITDA, Adjusted EBITDA Margin, and Free Cash Flow, all non-GAAP financial measures. See the appendix for definitions and a reconciliation to the most directly comparable GAAP measure.
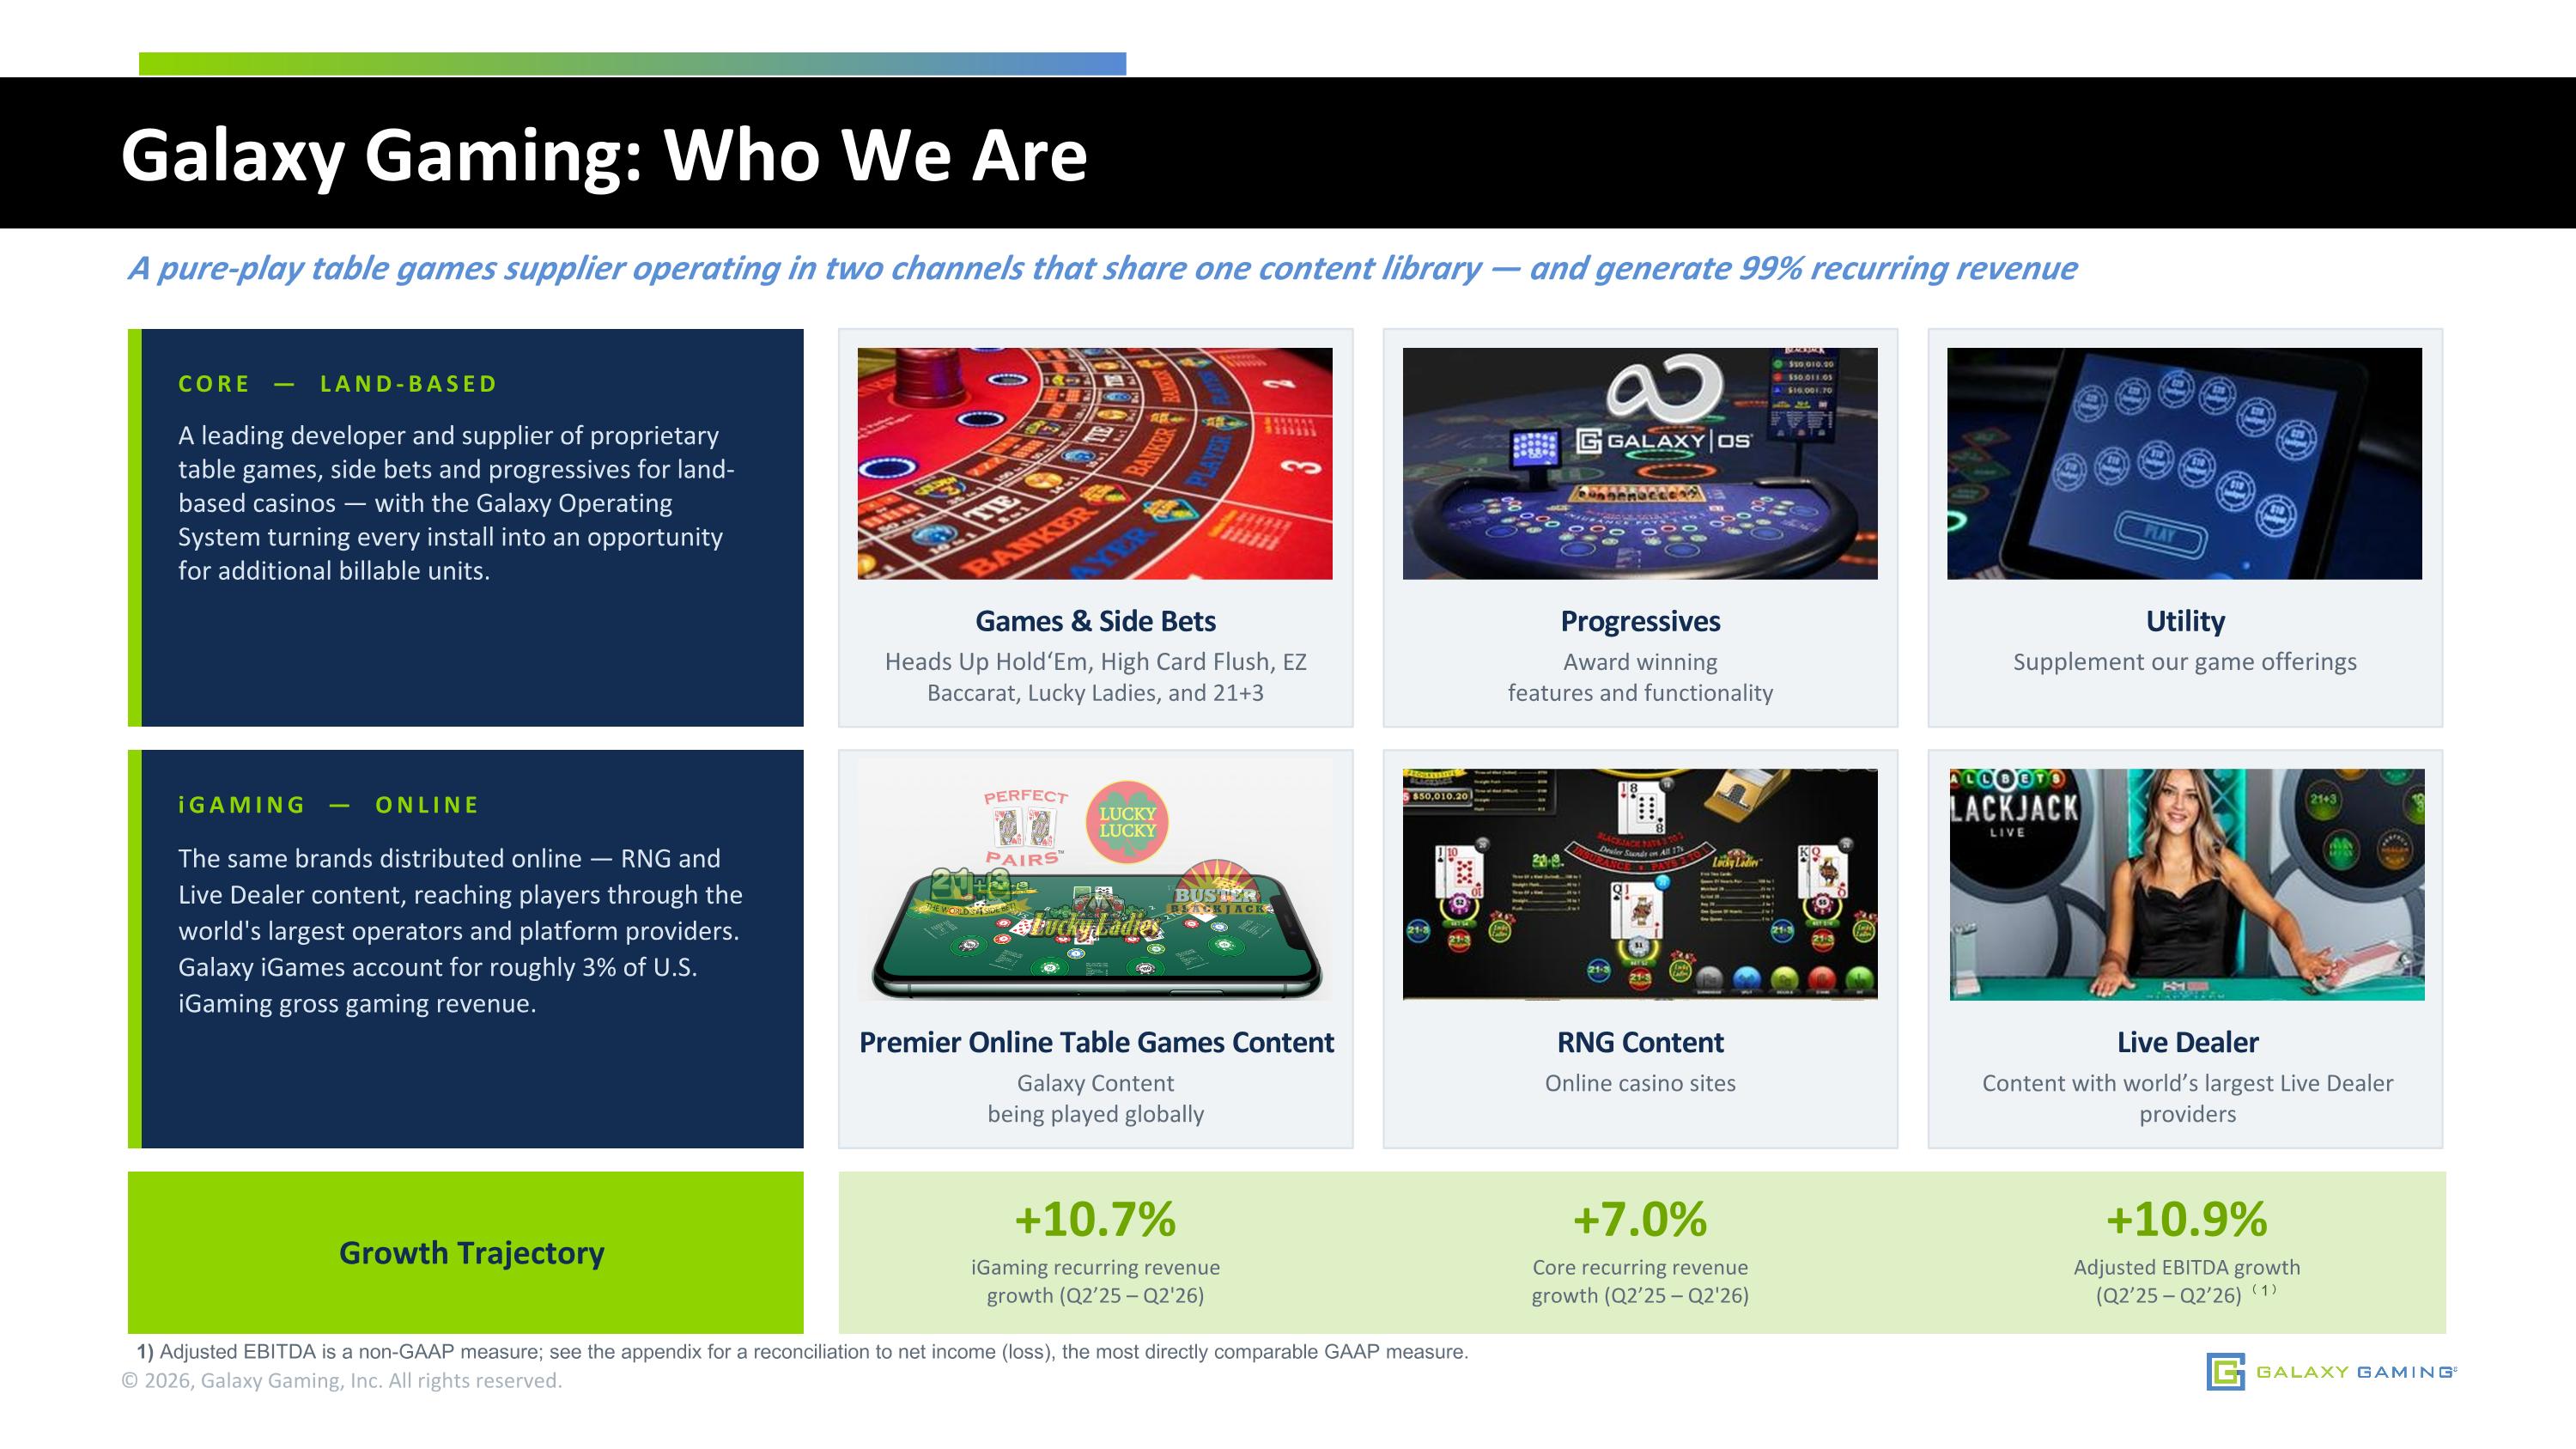
Galaxy Gaming: Who We Are A pure-play table games supplier operating in two channels that share one content library — and generate 99% recurring revenue © 2026, Galaxy Gaming, Inc. All rights reserved. CORE — LAND-BASED A leading developer and supplier of proprietary table games, side bets and progressives for land-based casinos — with the Galaxy Operating System turning every install into an opportunity for additional billable units. Games & Side Bets Heads Up Hold‘Em, High Card Flush, EZ Baccarat, Lucky Ladies, and 21+3 Progressives Award winning features and functionality Utility Supplement our game offerings iGAMING — ONLINE The same brands distributed online — RNG and Live Dealer content, reaching players through the world's largest operators and platform providers. Galaxy iGames account for roughly 3% of U.S. iGaming gross gaming revenue. Premier Online Table Games Content Galaxy Content being played globally RNG Content Online casino sites Growth Trajectory +10.7% iGaming recurring revenue growth (Q2’25 – Q2'26) +7.0% Core recurring revenue growth (Q2’25 – Q2'26) +10.9% Adjusted EBITDA growth (Q2’25 – Q2’26) ⁽1⁾ Live Dealer Content with world’s largest Live Dealer providers 1) Adjusted EBITDA is a non-GAAP measure; see the appendix for a reconciliation to net income (loss), the most directly comparable GAAP measure.
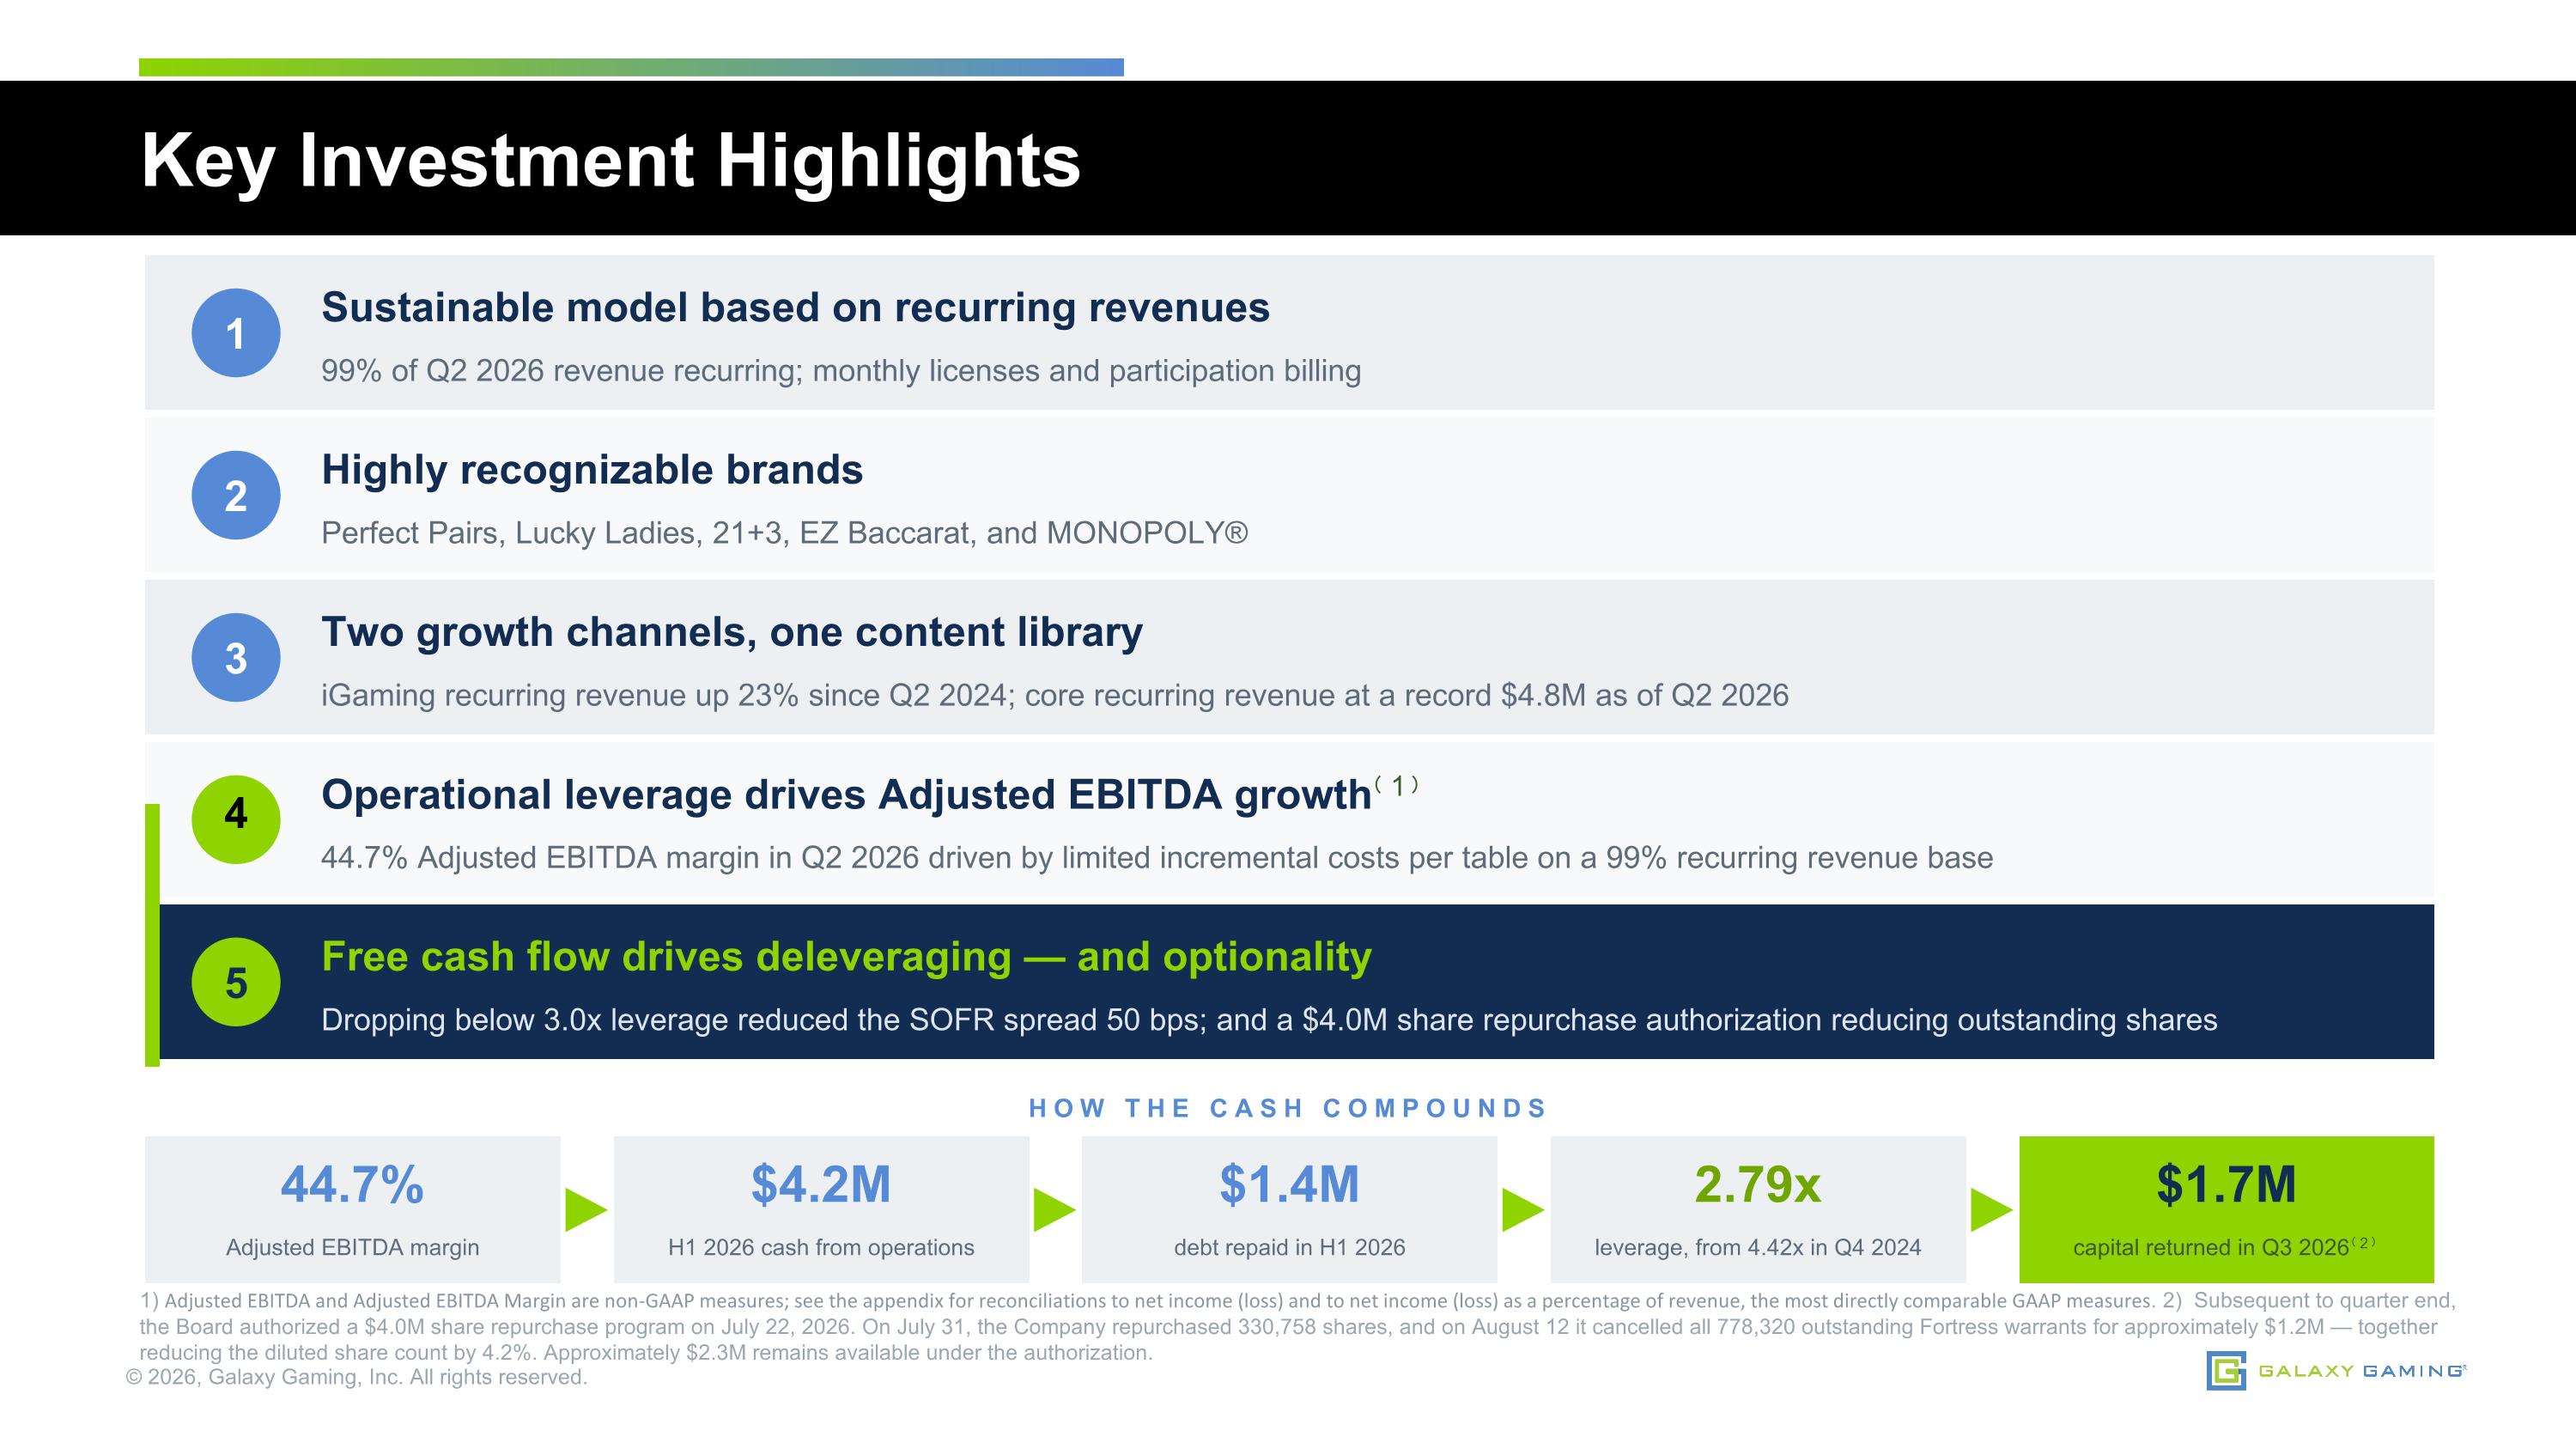
Key Investment Highlights © 2026, Galaxy Gaming, Inc. All rights reserved. 1 Sustainable model based on recurring revenues 99% of Q2 2026 revenue recurring; monthly licenses and participation billing 2 Highly recognizable brands Perfect Pairs, Lucky Ladies, 21+3, EZ Baccarat, and MONOPOLY® 3 Two growth channels, one content library iGaming recurring revenue up 23% since Q2 2024; core recurring revenue at a record $4.8M as of Q2 2026 Operational leverage drives Adjusted EBITDA growth⁽1⁾ 44.7% Adjusted EBITDA margin in Q2 2026 driven by limited incremental costs per table on a 99% recurring revenue base 5 Free cash flow drives deleveraging — and optionality Dropping below 3.0x leverage reduced the SOFR spread 50 bps; and a $4.0M share repurchase authorization reducing outstanding shares HOW THE CASH COMPOUNDS 44.7% Adjusted EBITDA margin $4.2M H1 2026 cash from operations $1.4M debt repaid in H1 2026 2.79x leverage, from 4.42x in Q4 2024 $1.7M capital returned in Q3 2026⁽2⁾ 1) Adjusted EBITDA and Adjusted EBITDA Margin are non-GAAP measures; see the appendix for reconciliations to net income (loss) and to net income (loss) as a percentage of revenue, the most directly comparable GAAP measures. 2) Subsequent to quarter end, the Board authorized a $4.0M share repurchase program on July 22, 2026. On July 31, the Company repurchased 330,758 shares, and on August 12 it cancelled all 778,320 outstanding Fortress warrants for approximately $1.2M — together reducing the diluted share count by 4.2%. Approximately $2.3M remains available under the authorization. 4
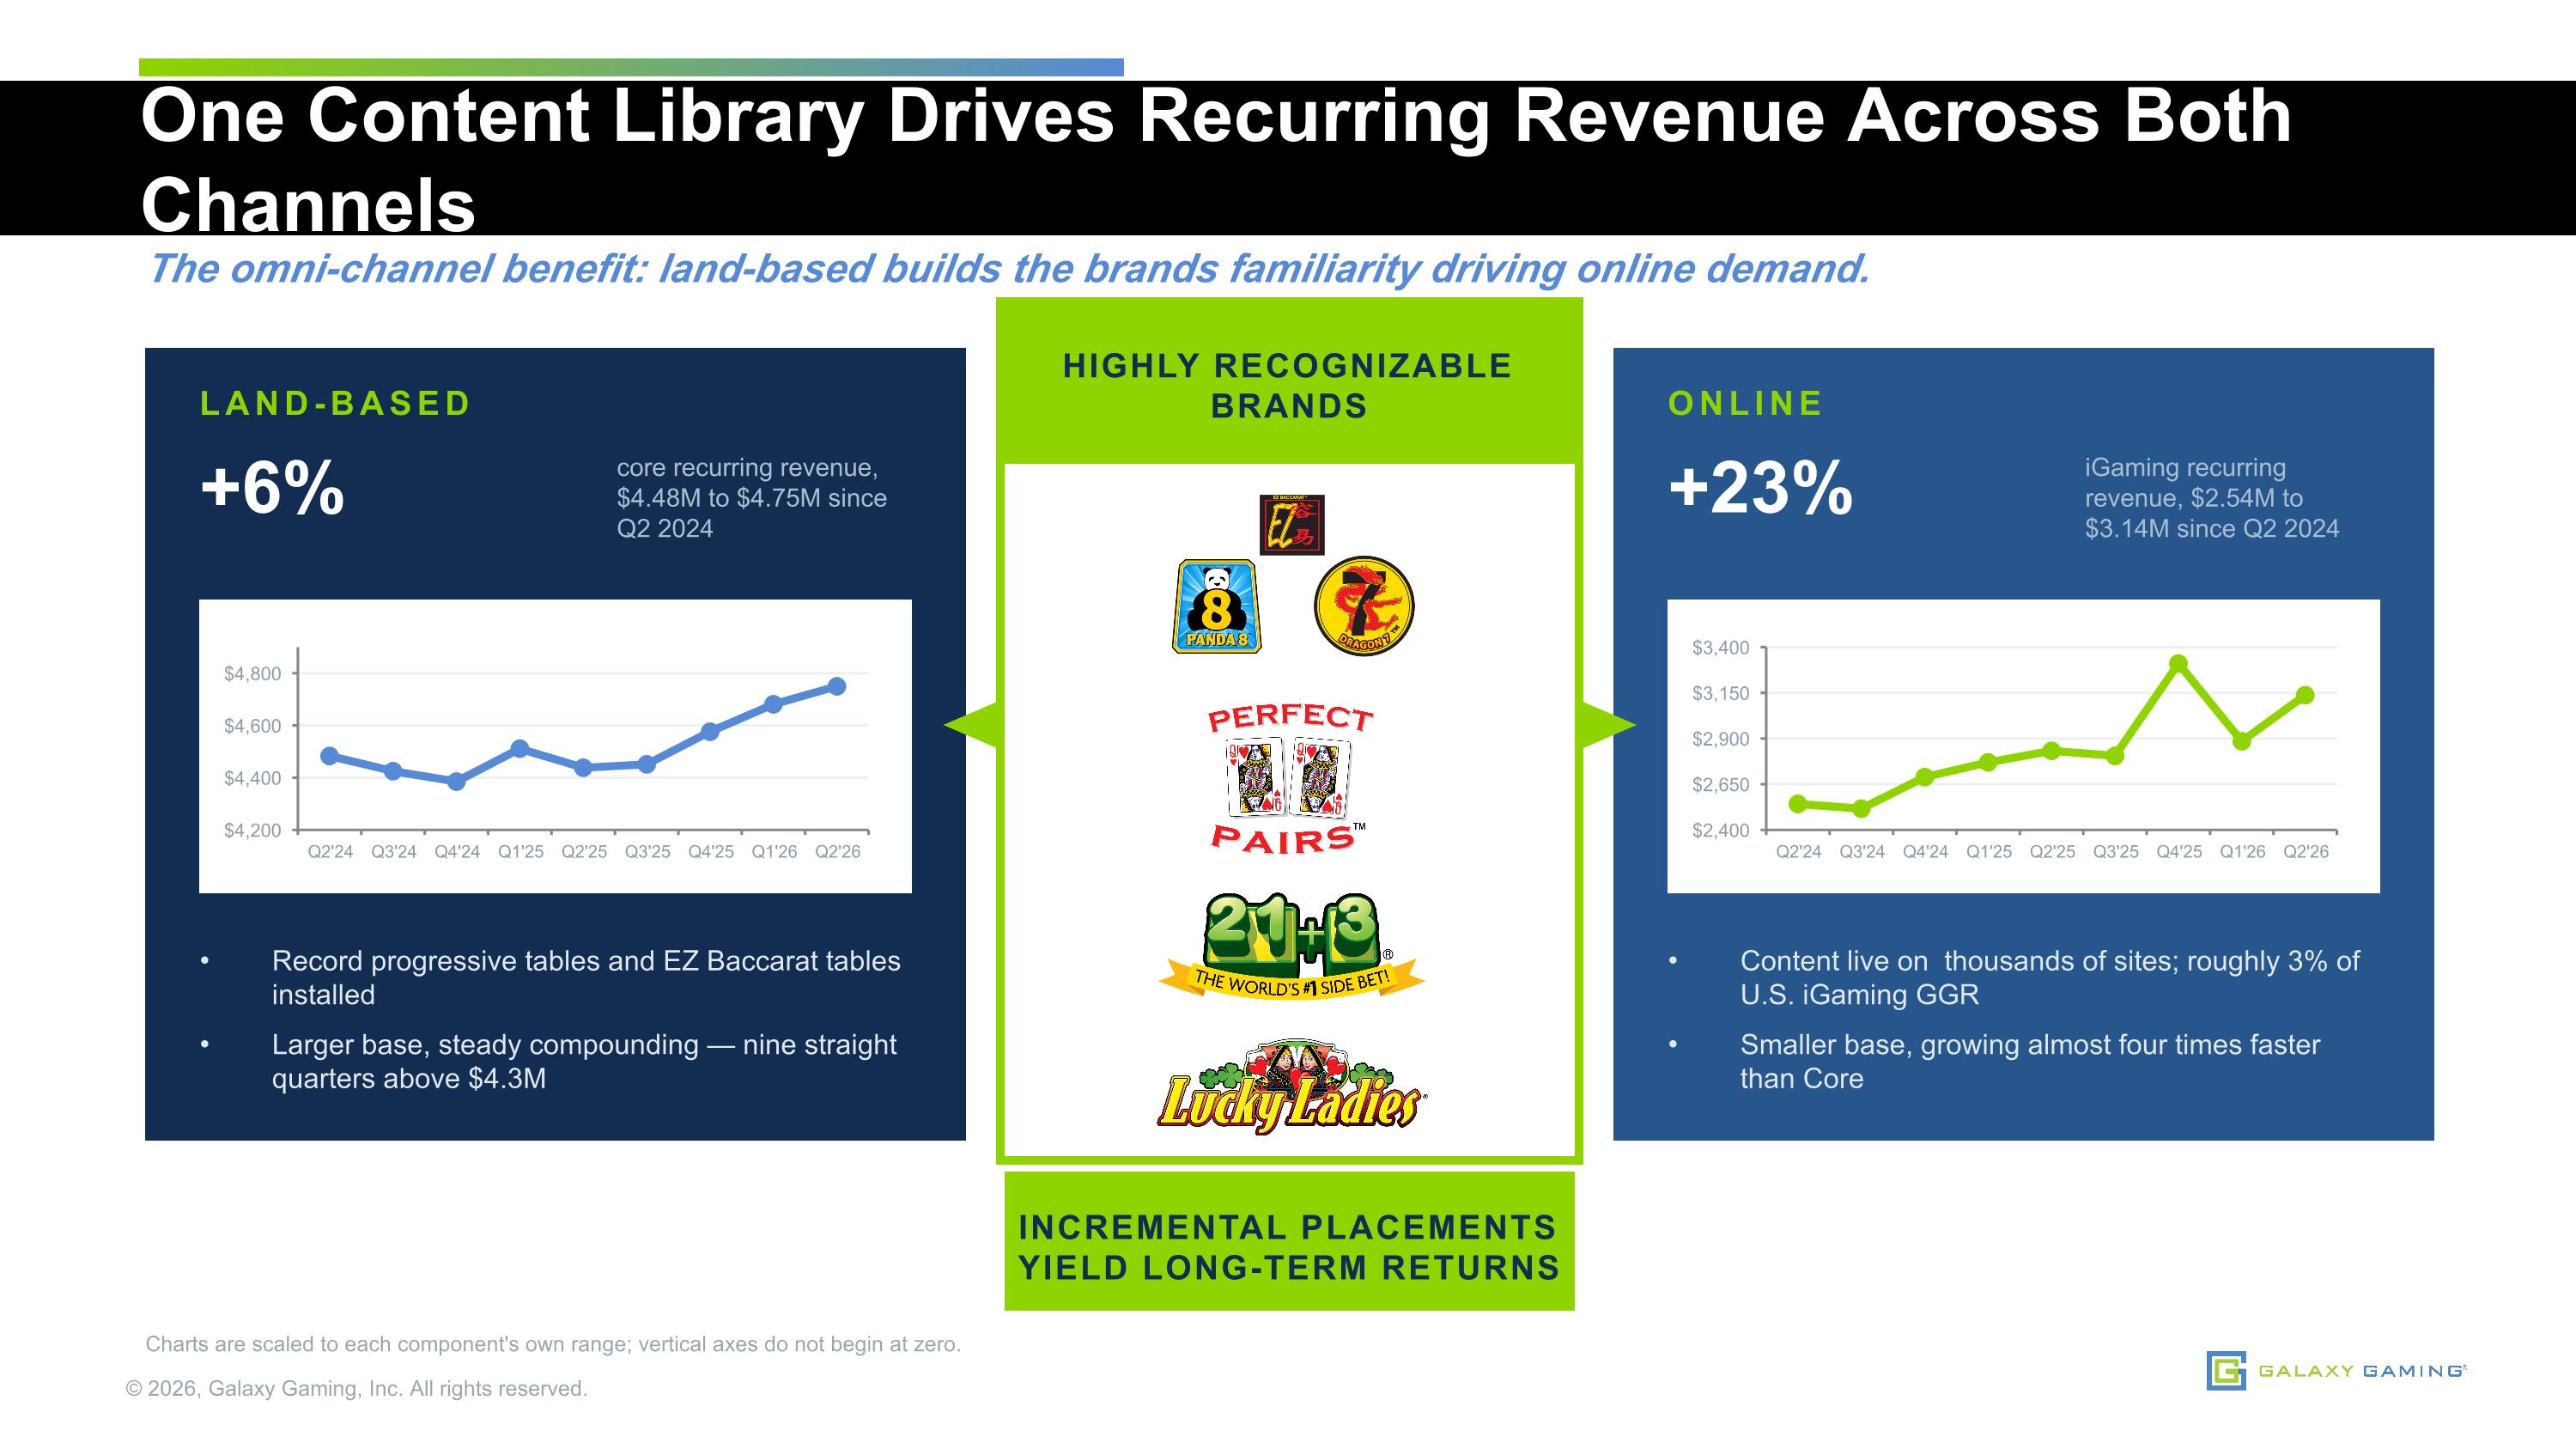
One Content Library Drives Recurring Revenue Across Both Channels © 2026, Galaxy Gaming, Inc. All rights reserved. The omni-channel benefit: land-based builds the brands familiarity driving online demand. LAND-BASED +6% core recurring revenue, $4.48M to $4.75M since Q2 2024 Record progressive tables and EZ Baccarat tables installed Larger base, steady compounding — nine straight quarters above $4.3M ONLINE +23% iGaming recurring revenue, $2.54M to $3.14M since Q2 2024 Content live on thousands of sites; roughly 3% of U.S. iGaming GGR Smaller base, growing almost four times faster than Core HIGHLY RECOGNIZABLE BRANDS Charts are scaled to each component's own range; vertical axes do not begin at zero. INCREMENTAL PLACEMENTS YIELD LONG-TERM RETURNS
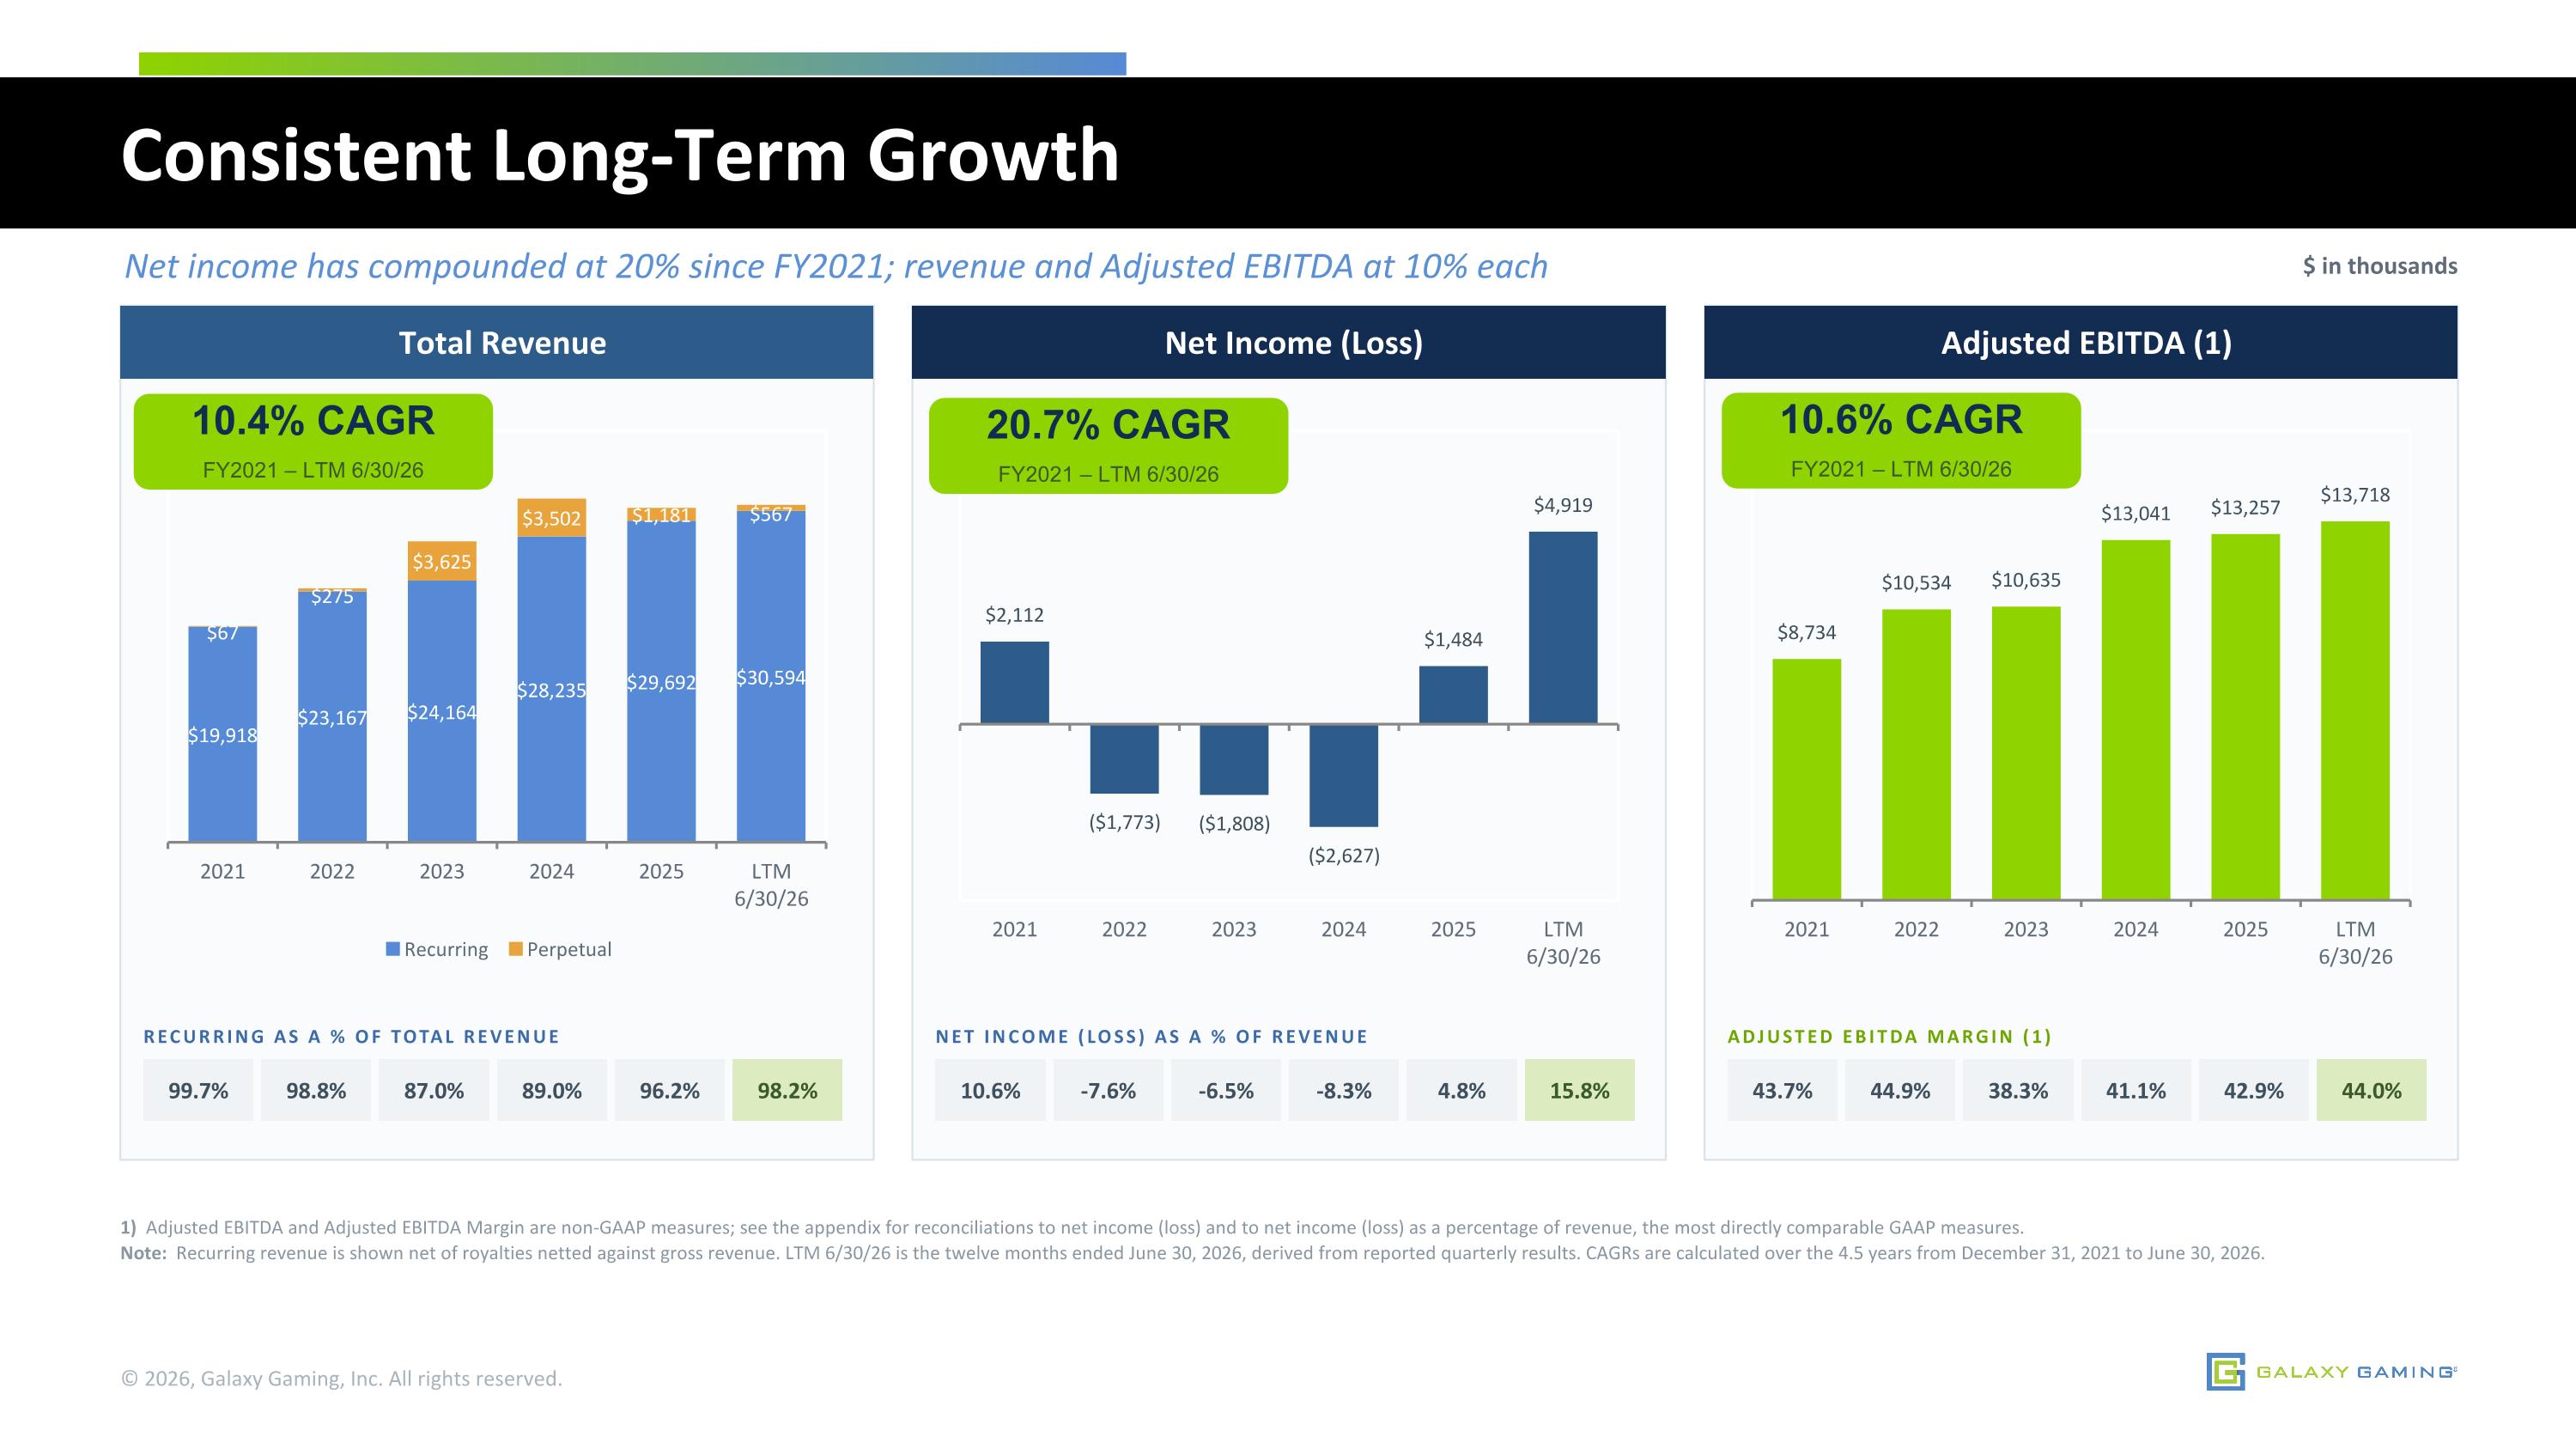
Consistent Long-Term Growth Net income has compounded at 20% since FY2021; revenue and Adjusted EBITDA at 10% each $ in thousands 1) Adjusted EBITDA and Adjusted EBITDA Margin are non-GAAP measures; see the appendix for reconciliations to net income (loss) and to net income (loss) as a percentage of revenue, the most directly comparable GAAP measures.
Note: Recurring revenue is shown net of royalties netted against gross revenue. LTM 6/30/26 is the twelve months ended June 30, 2026, derived from reported quarterly results. CAGRs are calculated over the 4.5 years from December 31, 2021 to June 30, 2026. © 2026, Galaxy Gaming, Inc. All rights reserved. Total Revenue RECURRING AS A % OF TOTAL REVENUE 99.7% 98.8% 87.0% 89.0% 96.2% 98.2% Net Income (Loss) NET INCOME (LOSS) AS A % OF REVENUE 10.6% -7.6% -6.5% -8.3% 4.8% 15.8% Adjusted EBITDA (1) ADJUSTED EBITDA MARGIN (1) 43.7% 44.9% 38.3% 41.1% 42.9% 44.0% 10.4% CAGR FY2021 – LTM 6/30/26 20.7% CAGR FY2021 – LTM 6/30/26 10.6% CAGR FY2021 – LTM 6/30/26
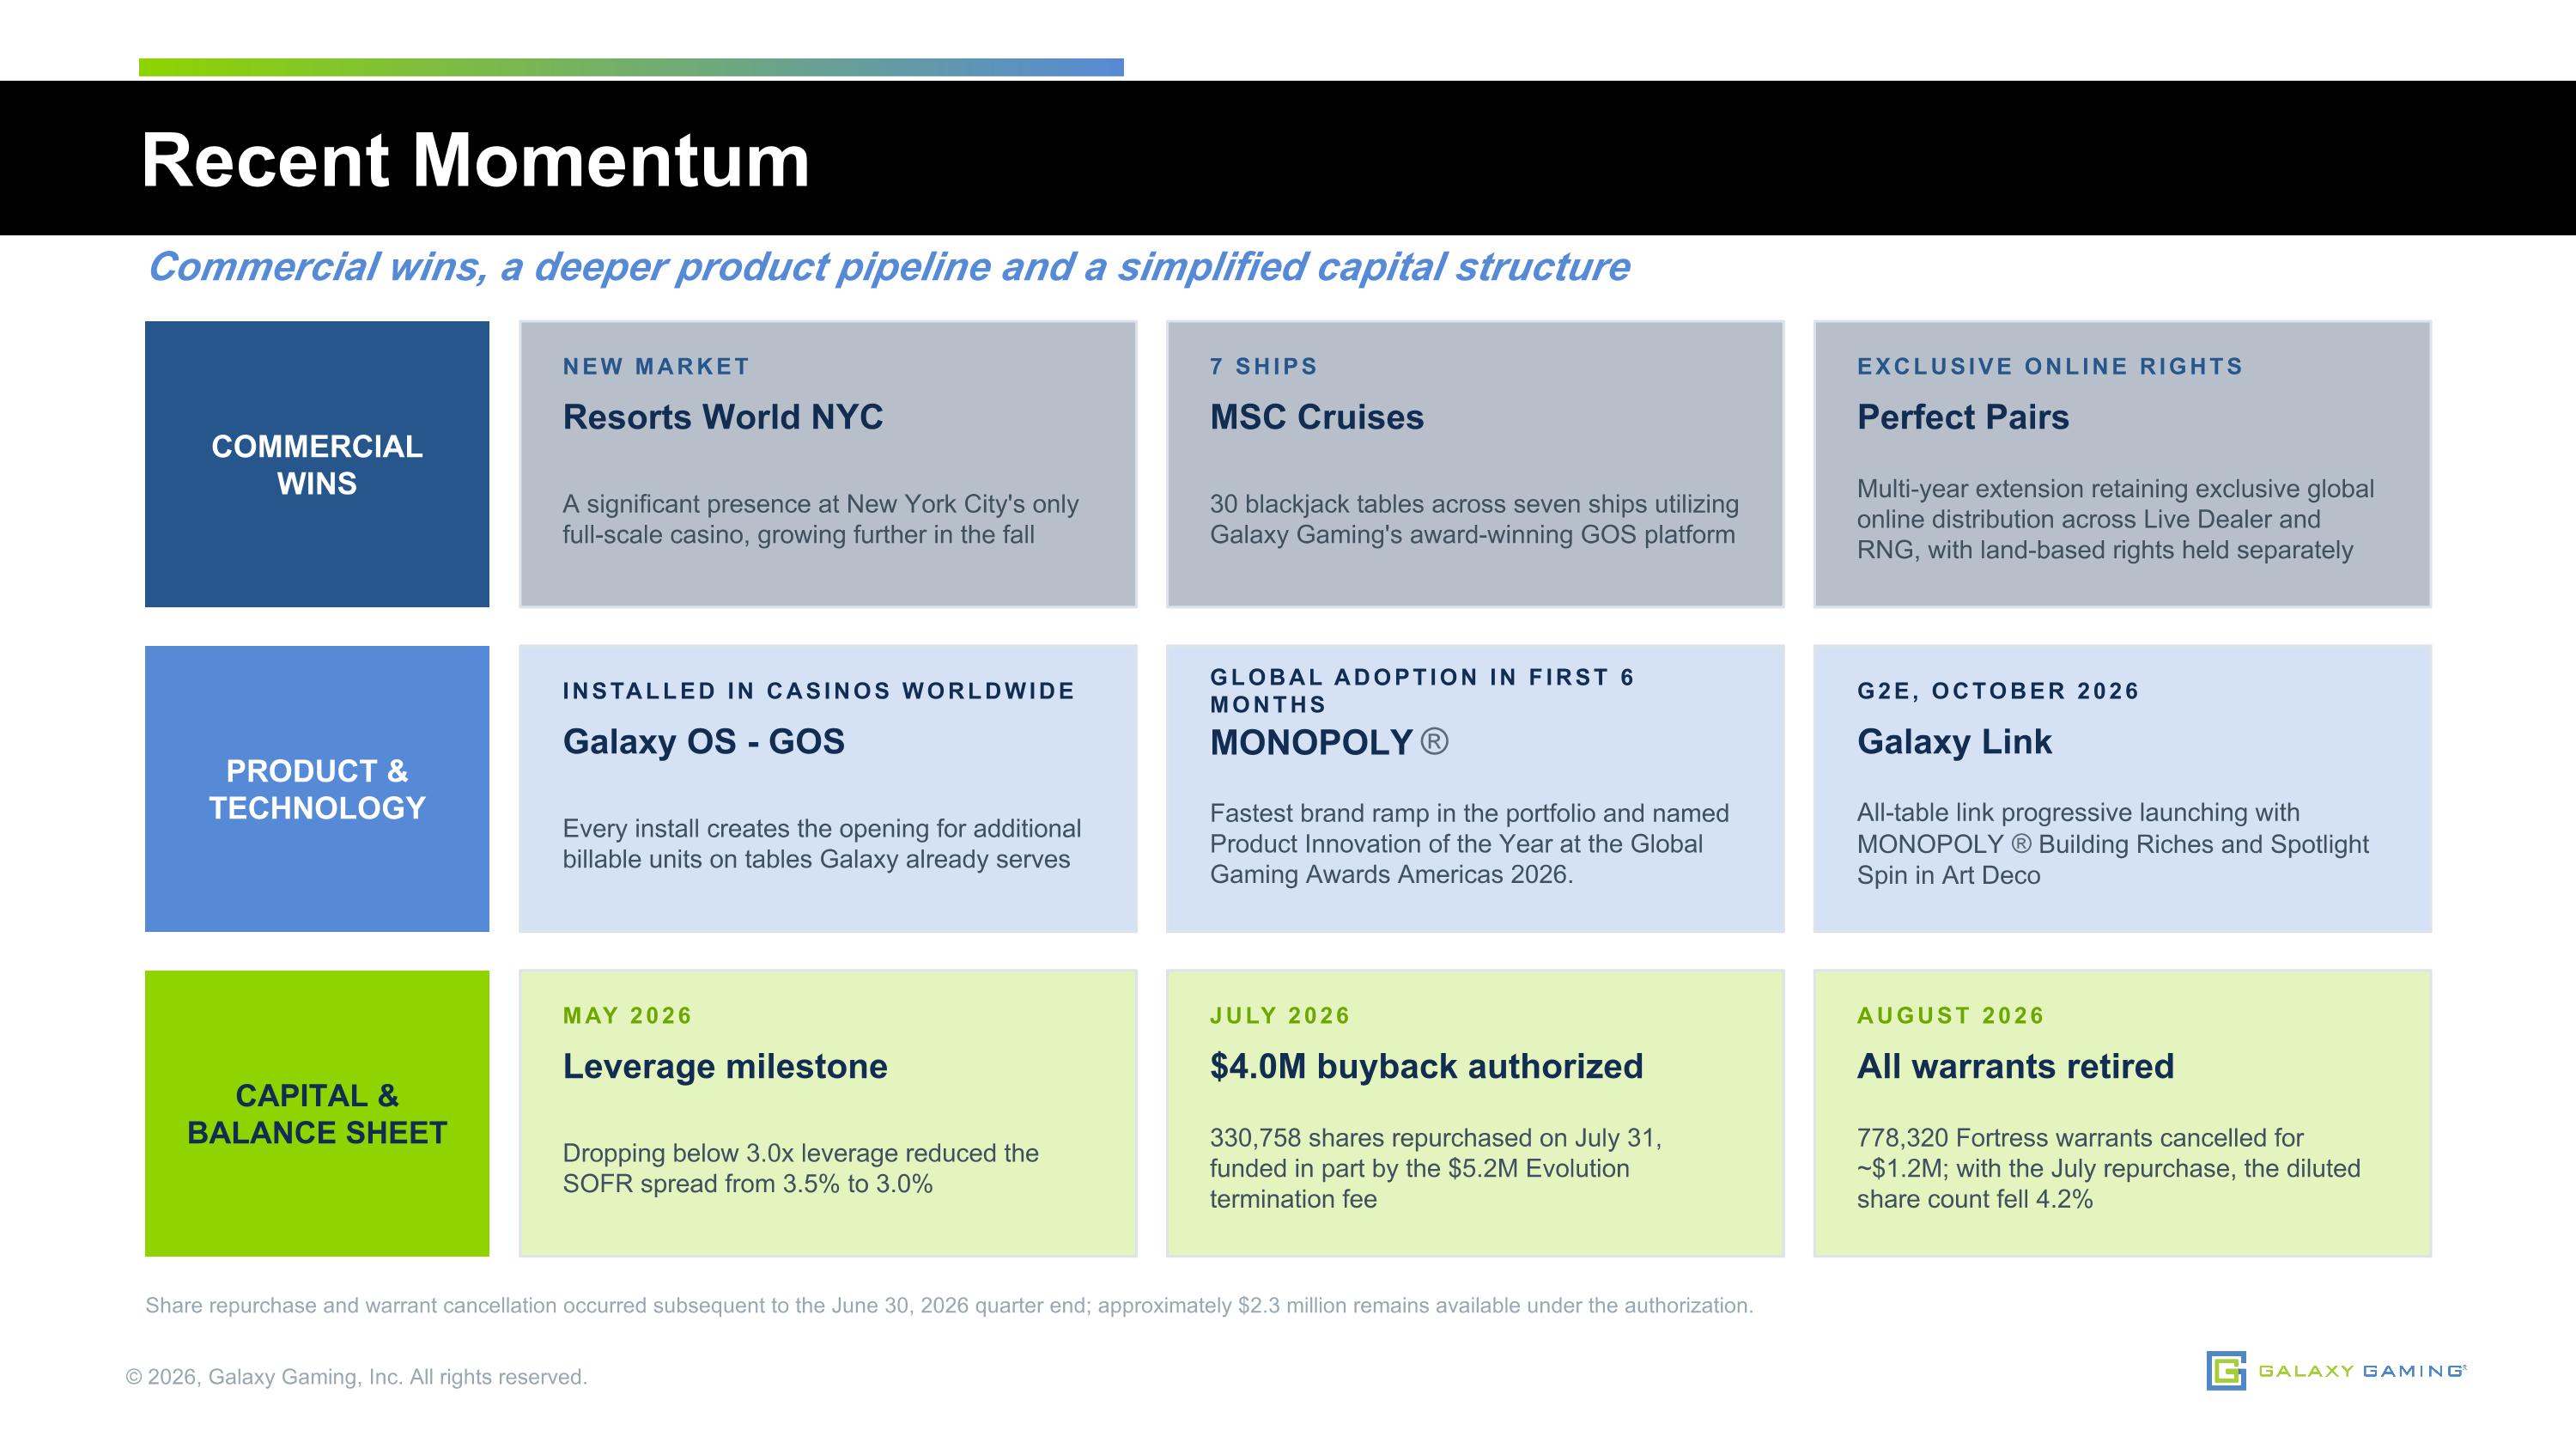
Recent Momentum © 2026, Galaxy Gaming, Inc. All rights reserved. Commercial wins, a deeper product pipeline and a simplified capital structure COMMERCIAL WINS NEW MARKET Resorts World NYC A significant presence at New York City's only full-scale casino, growing further in the fall 7 SHIPS MSC Cruises 30 blackjack tables across seven ships utilizing Galaxy Gaming's award-winning GOS platform EXCLUSIVE ONLINE RIGHTS Perfect Pairs Multi-year extension retaining exclusive global online distribution across Live Dealer and RNG, with land-based rights held separately PRODUCT & TECHNOLOGY INSTALLED IN CASINOS WORLDWIDE Galaxy OS - GOS Every install creates the opening for additional billable units on tables Galaxy already serves GLOBAL ADOPTION IN FIRST 6 MONTHS MONOPOLY ® Fastest brand ramp in the portfolio and named Product Innovation of the Year at the Global Gaming Awards Americas 2026. G2E, OCTOBER 2026 Galaxy Link All-table link progressive launching with MONOPOLY ® Building Riches and Spotlight Spin in Art Deco CAPITAL & BALANCE SHEET MAY 2026 Leverage milestone Dropping below 3.0x leverage reduced the SOFR spread from 3.5% to 3.0% JULY 2026 $4.0M buyback authorized 330,758 shares repurchased on July 31, funded in part by the $5.2M Evolution termination fee AUGUST 2026 All warrants retired 778,320 Fortress warrants cancelled for ~$1.2M; with the July repurchase, the diluted share count fell 4.2% Share repurchase and warrant cancellation occurred subsequent to the June 30, 2026 quarter end; approximately $2.3 million remains available under the authorization.
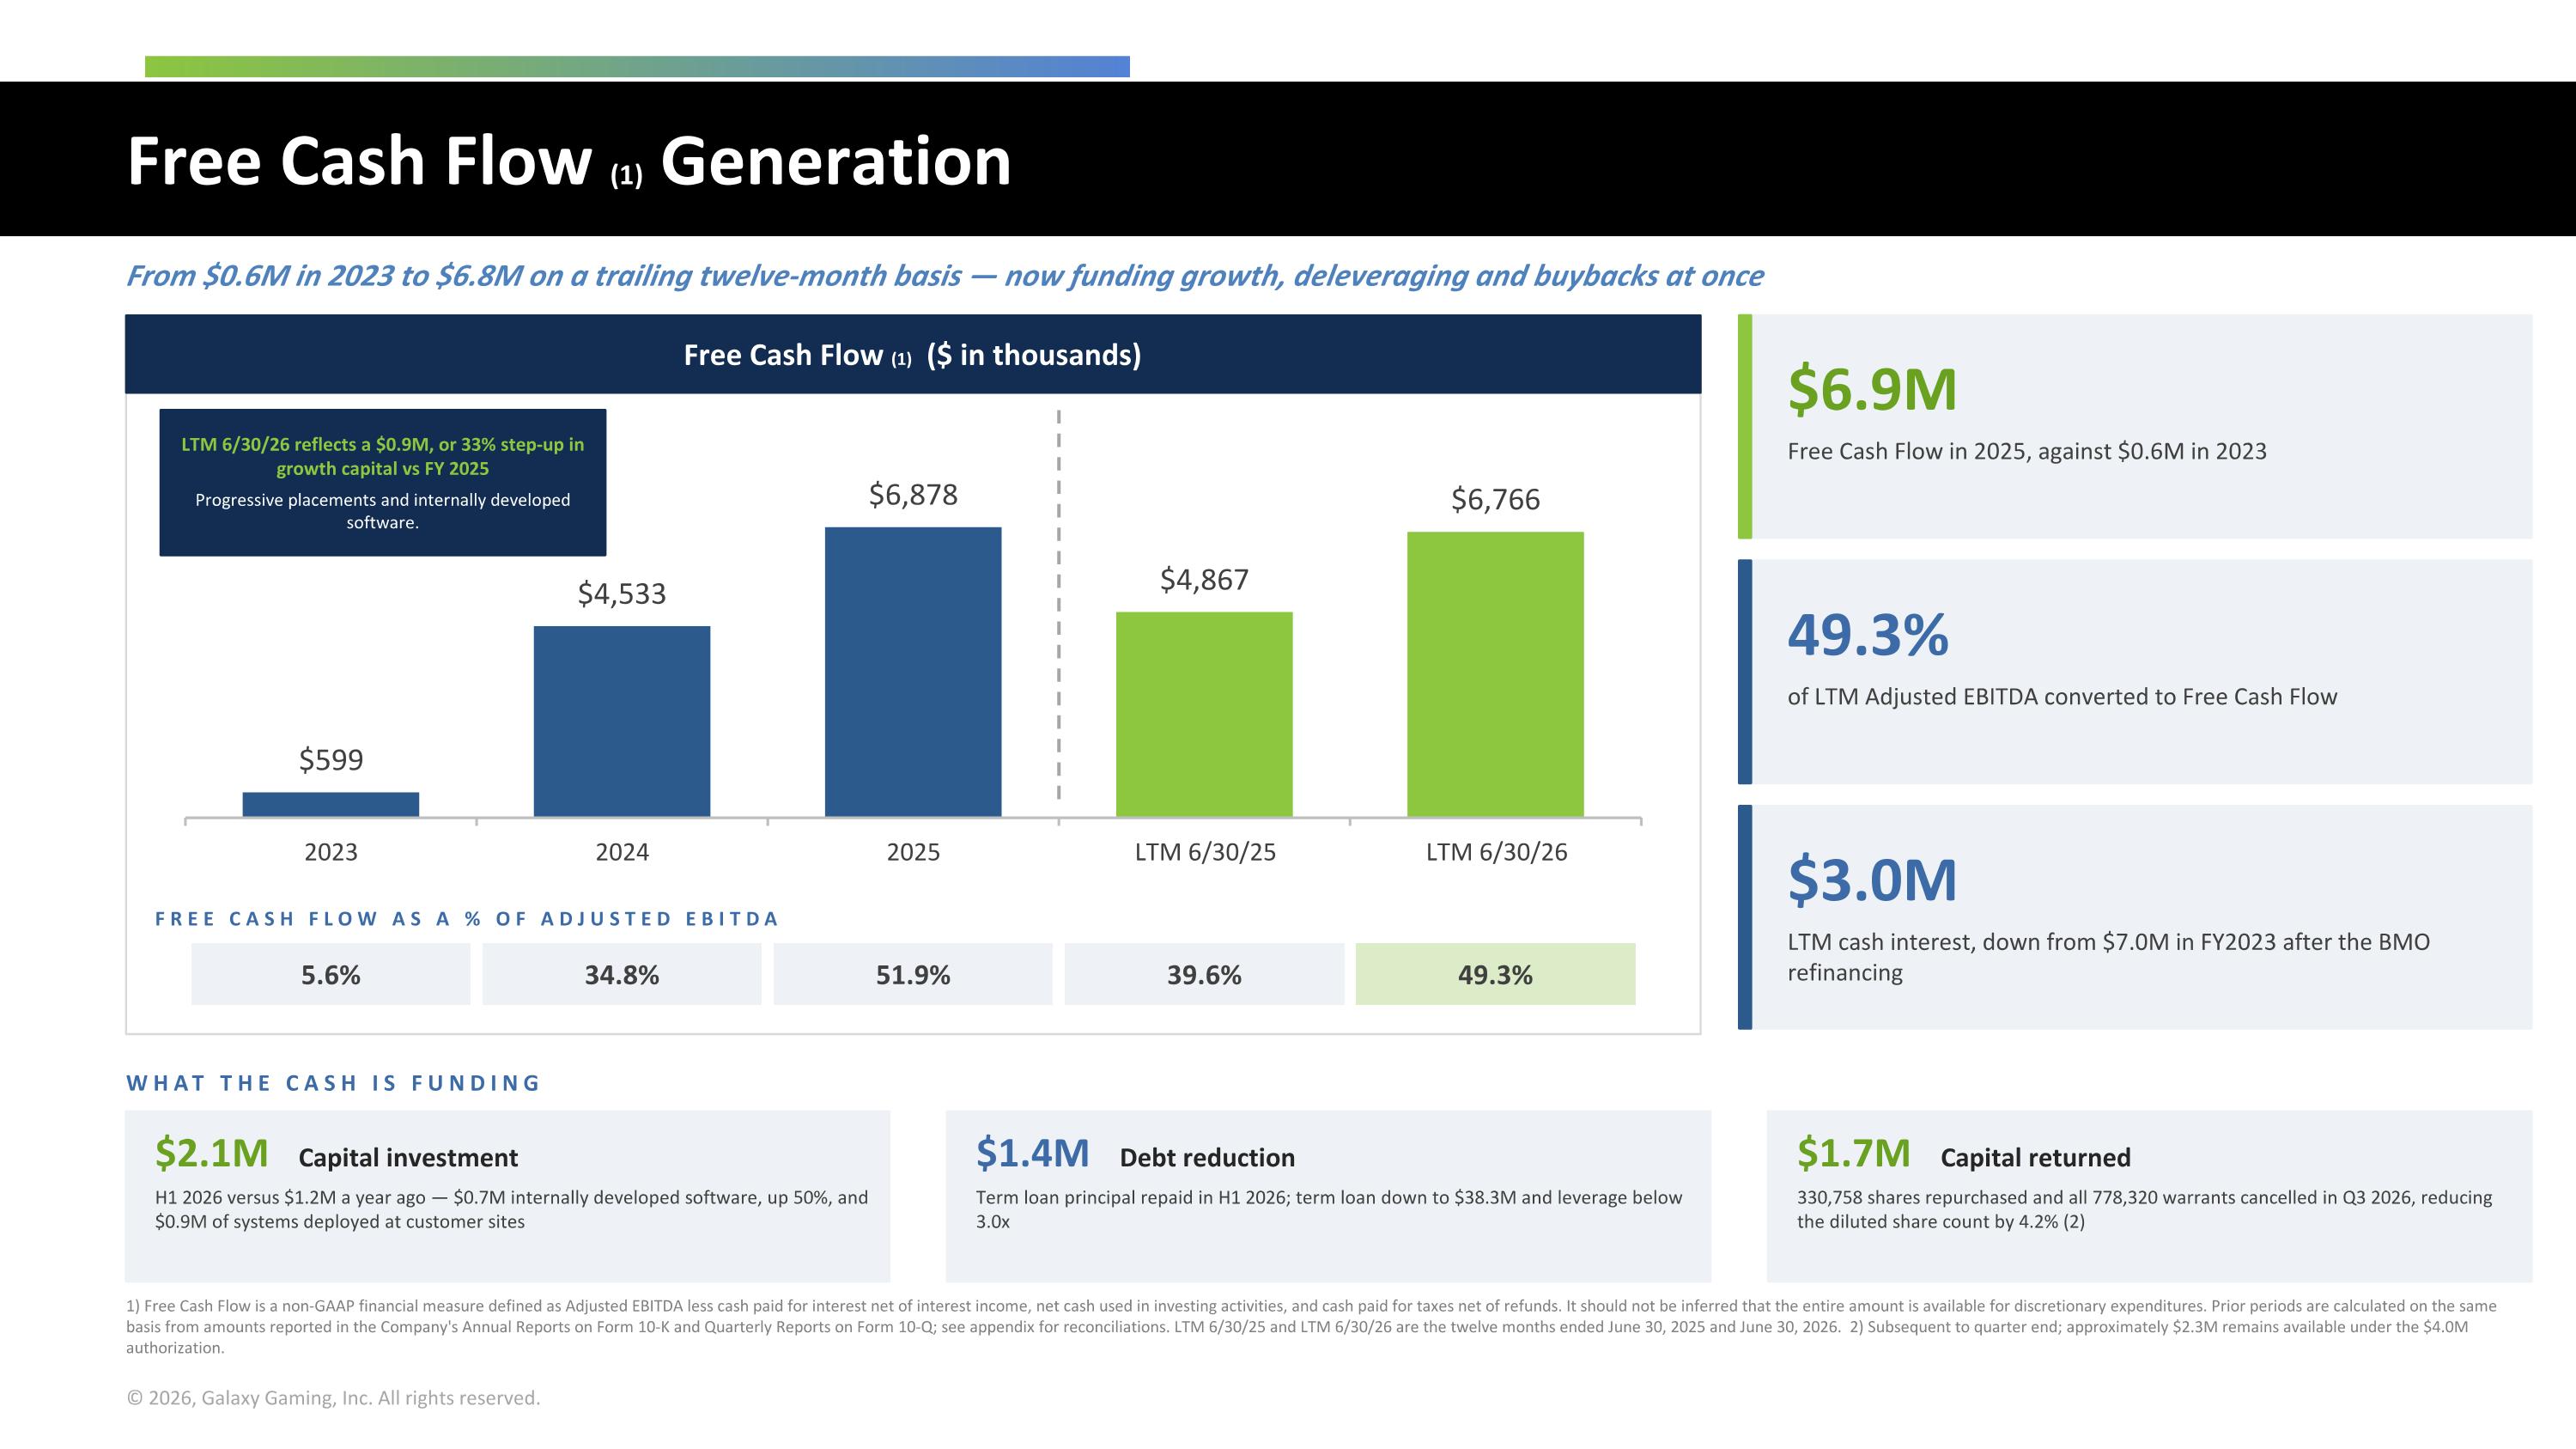
Free Cash Flow (1) Generation From $0.6M in 2023 to $6.8M on a trailing twelve-month basis — now funding growth, deleveraging and buybacks at once Free Cash Flow (1) ($ in thousands) LTM 6/30/26 reflects a $0.9M, or 33% step-up in growth capital vs FY 2025 Progressive placements and internally developed software. FREE CASH FLOW AS A % OF ADJUSTED EBITDA 5.6% 34.8% 51.9% 39.6% 49.3% $6.9M Free Cash Flow in 2025, against $0.6M in 2023 49.3% of LTM Adjusted EBITDA converted to Free Cash Flow $3.0M LTM cash interest, down from $7.0M in FY2023 after the BMO refinancing WHAT THE CASH IS FUNDING $2.1M Capital investment H1 2026 versus $1.2M a year ago — $0.7M internally developed software, up 50%, and $0.9M of systems deployed at customer sites $1.4M Debt reduction Term loan principal repaid in H1 2026; term loan down to $38.3M and leverage below 3.0x $1.7M Capital returned 330,758 shares repurchased and all 778,320 warrants cancelled in Q3 2026, reducing the diluted share count by 4.2% (2) 1) Free Cash Flow is a non-GAAP financial measure defined as Adjusted EBITDA less cash paid for interest net of interest income, net cash used in investing activities, and cash paid for taxes net of refunds. It should not be inferred that the entire amount is available for discretionary expenditures. Prior periods are calculated on the same basis from amounts reported in the Company's Annual Reports on Form 10-K and Quarterly Reports on Form 10-Q; see appendix for reconciliations. LTM 6/30/25 and LTM 6/30/26 are the twelve months ended June 30, 2025 and June 30, 2026. 2) Subsequent to quarter end; approximately $2.3M remains available under the $4.0M authorization.
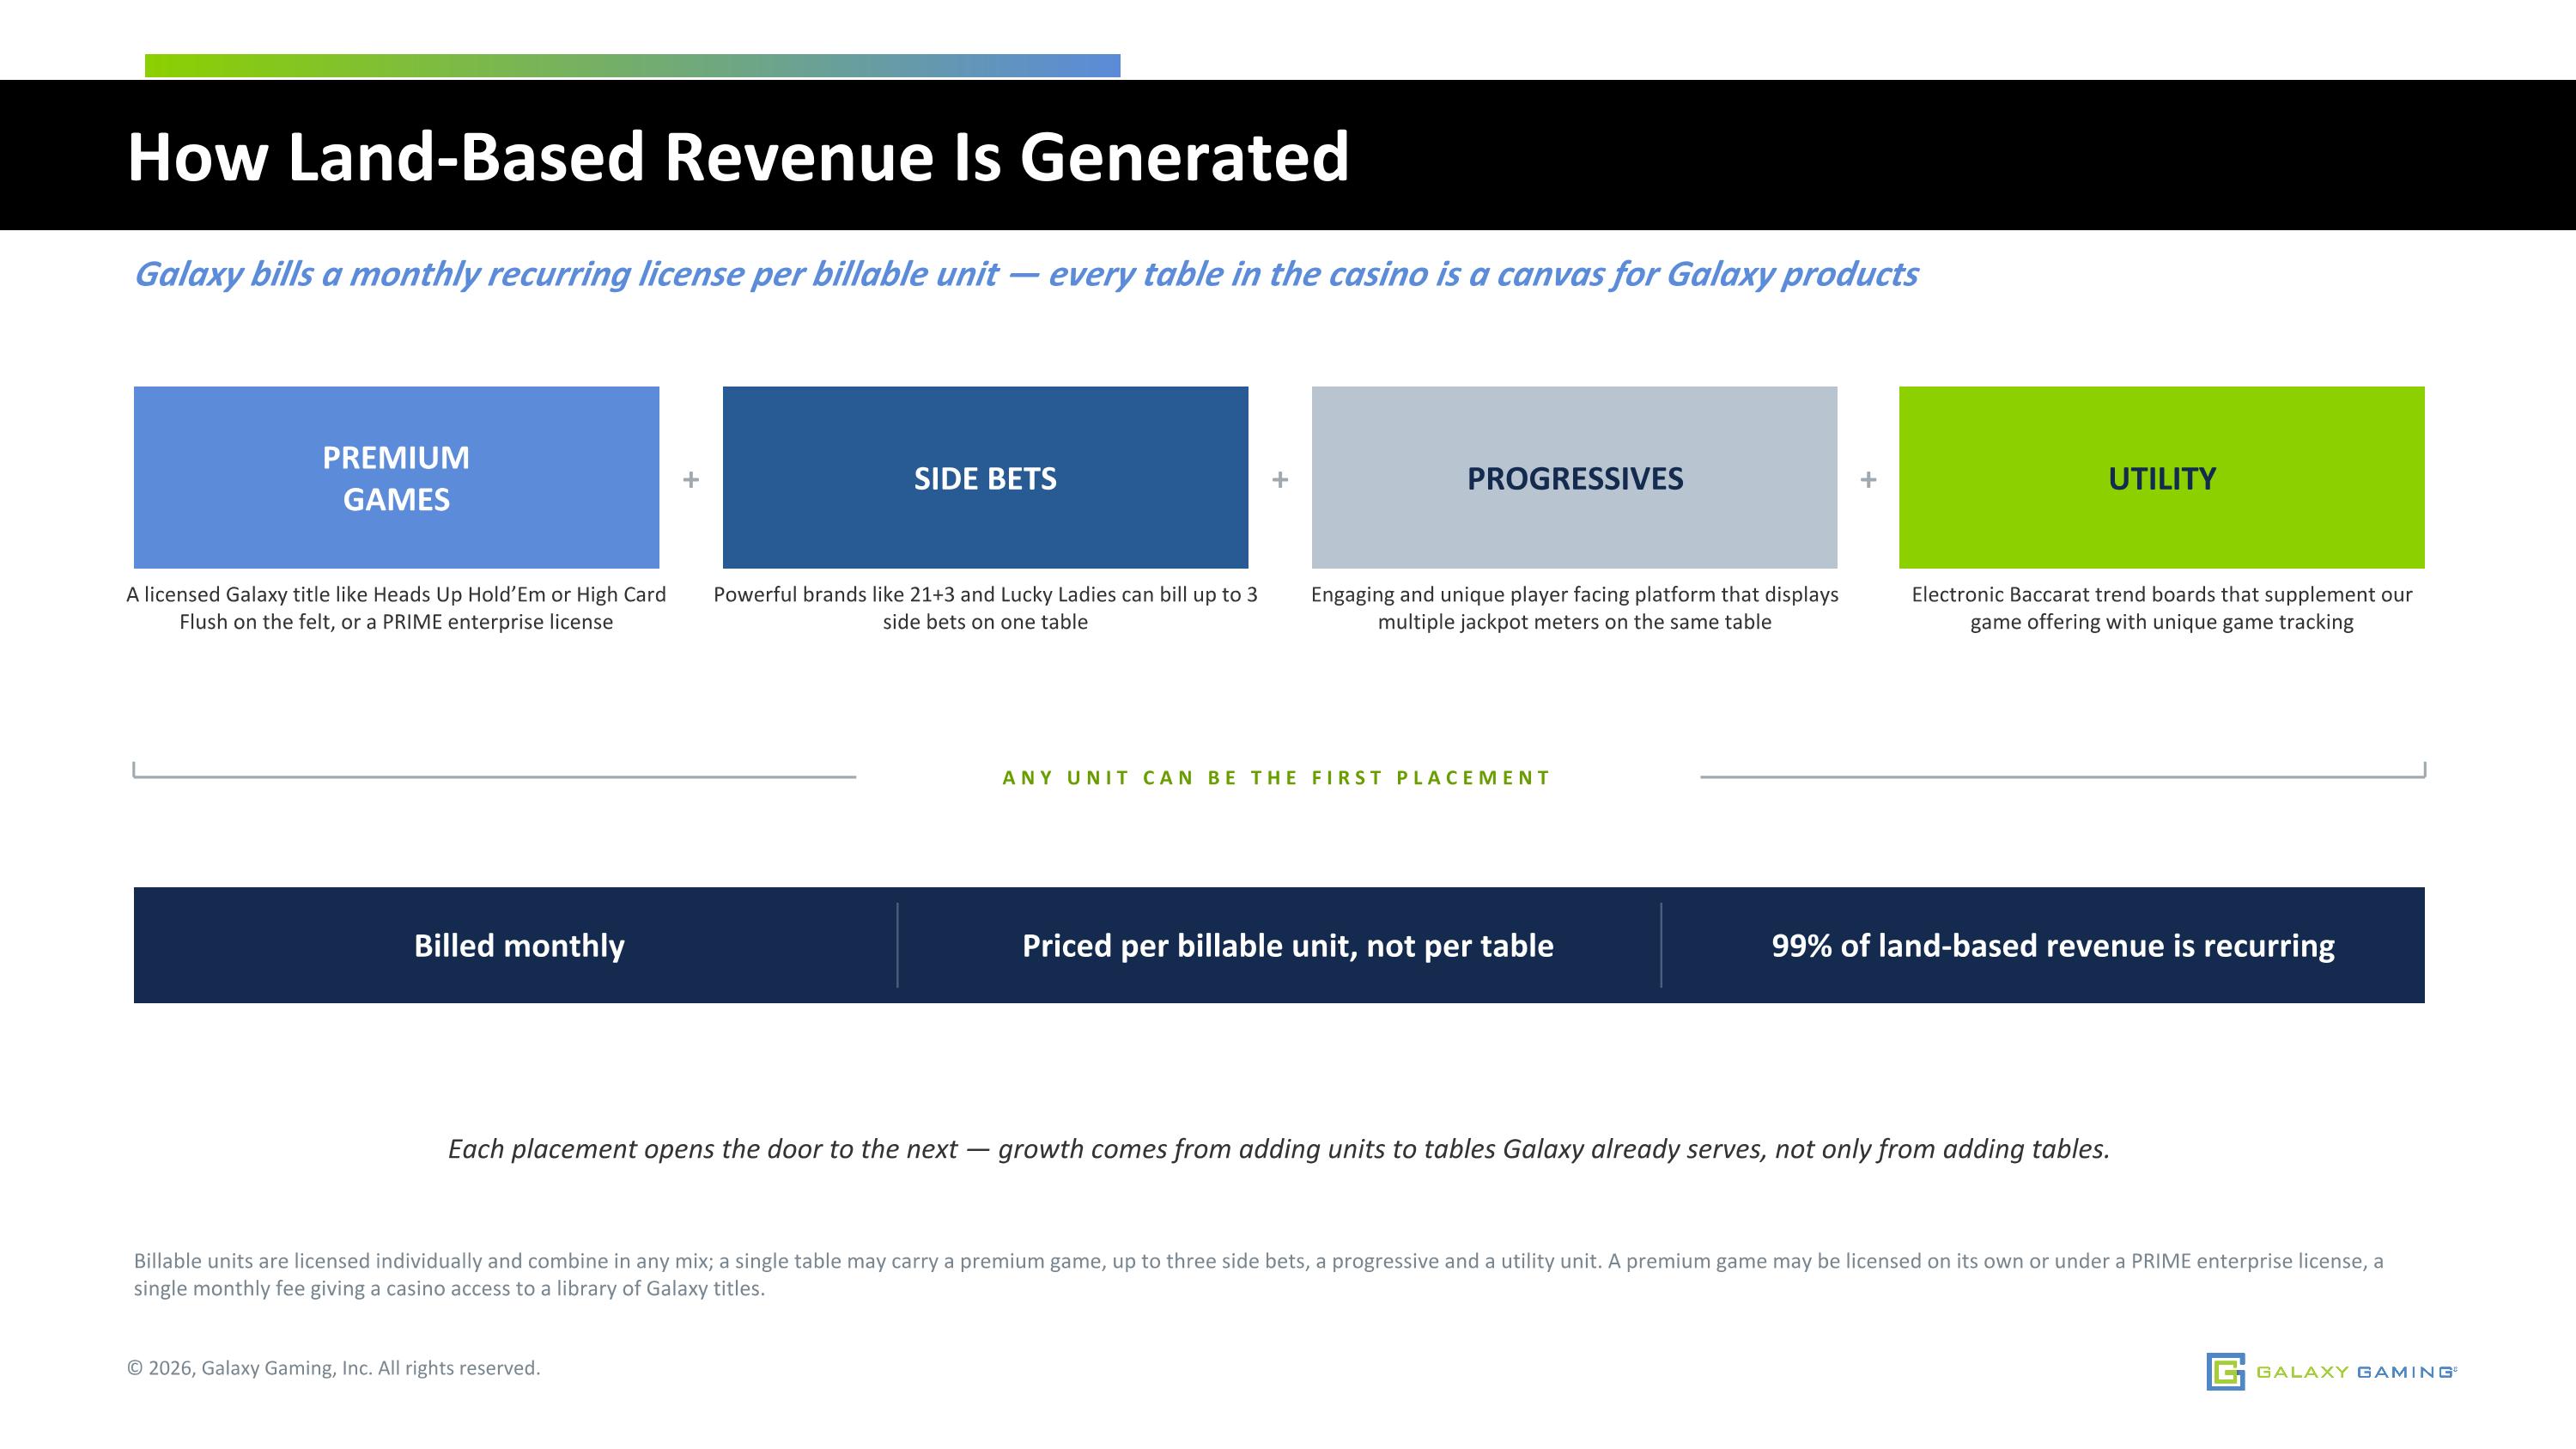
How Land-Based Revenue Is Generated Galaxy bills a monthly recurring license per billable unit — every table in the casino is a canvas for Galaxy products PREMIUM GAMES A licensed Galaxy title like Heads Up Hold’Em or High Card Flush on the felt, or a PRIME enterprise license + SIDE BETS Powerful brands like 21+3 and Lucky Ladies can bill up to 3 side bets on one table + PROGRESSIVES Engaging and unique player facing platform that displays multiple jackpot meters on the same table + UTILITY Electronic Baccarat trend boards that supplement our game offering with unique game tracking ANY UNIT CAN BE THE FIRST PLACEMENT Billed monthly Priced per billable unit, not per table 99% of land-based revenue is recurring Each placement opens the door to the next — growth comes from adding units to tables Galaxy already serves, not only from adding tables. Billable units are licensed individually and combine in any mix; a single table may carry a premium game, up to three side bets, a progressive and a utility unit. A premium game may be licensed on its own or under a PRIME enterprise license, a single monthly fee giving a casino access to a library of Galaxy titles.
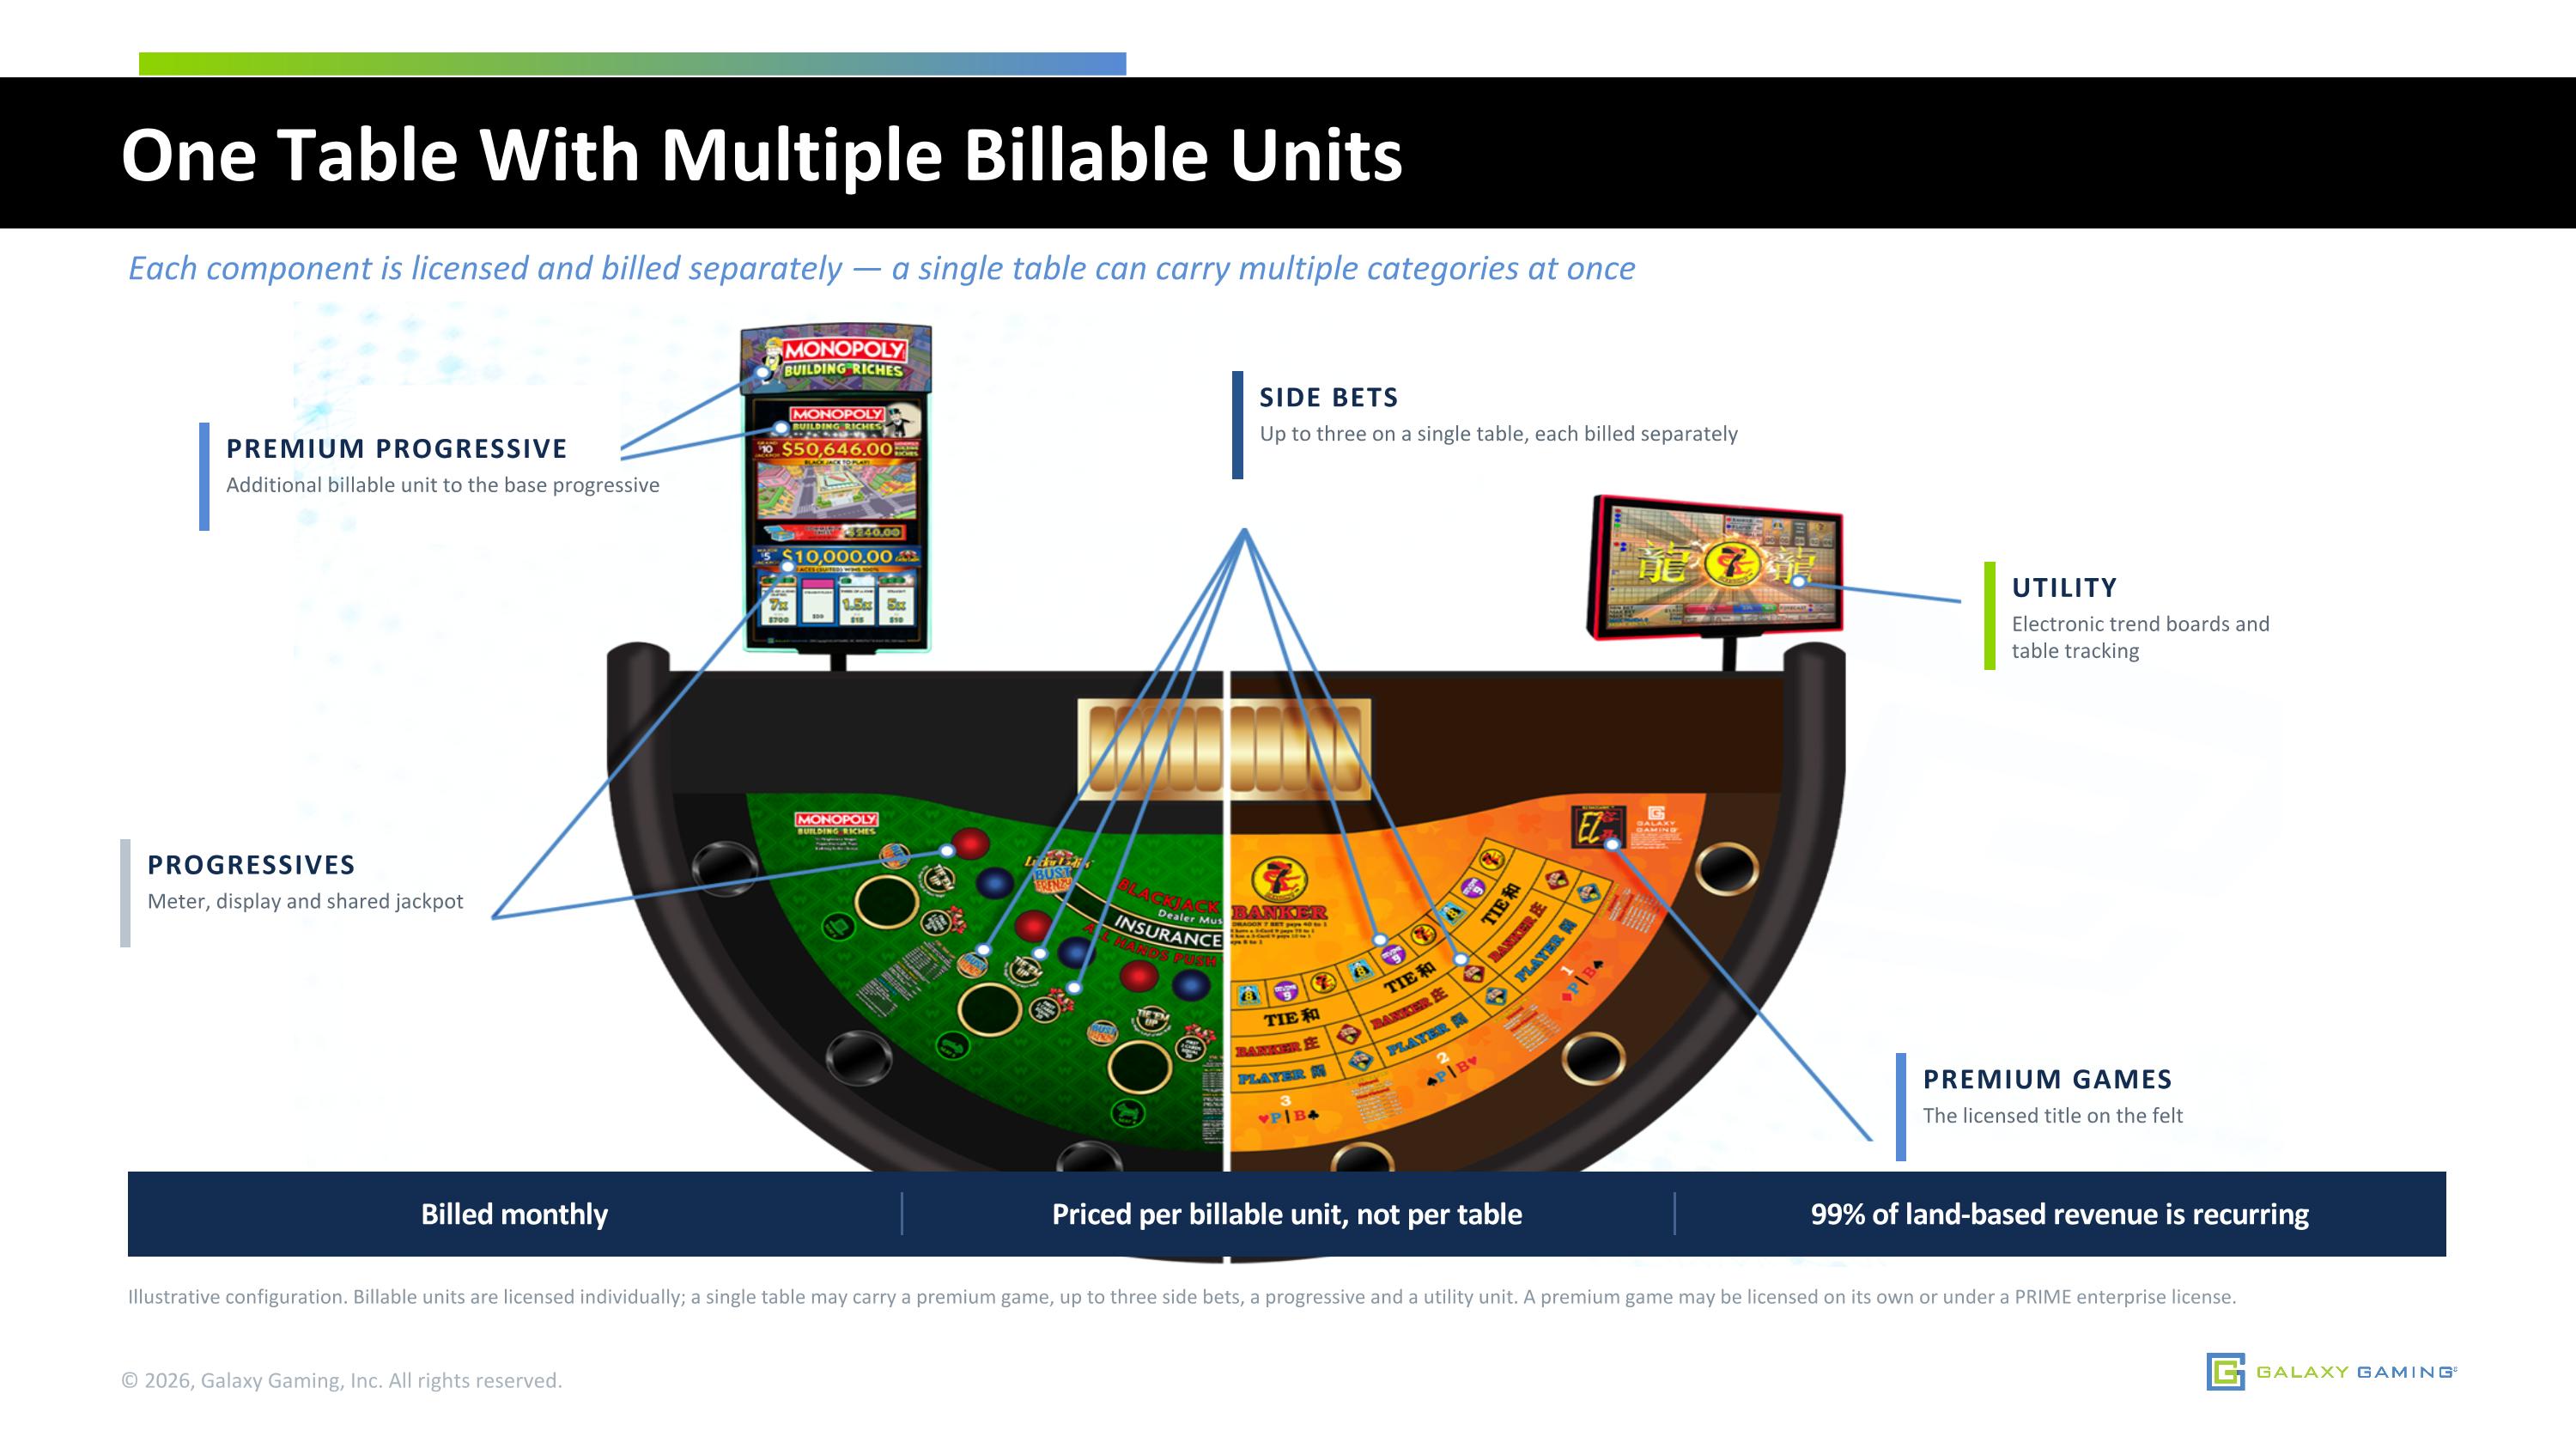
One Table With Multiple Billable Units Each component is licensed and billed separately — a single table can carry multiple categories at once Illustrative configuration. Billable units are licensed individually; a single table may carry a premium game, up to three side bets, a progressive and a utility unit. A premium game may be licensed on its own or under a PRIME enterprise license. © 2026, Galaxy Gaming, Inc. All rights reserved. PREMIUM PROGRESSIVE Additional billable unit to the base progressive PROGRESSIVES Meter, display and shared jackpot SIDE BETS Up to three on a single table, each billed separately UTILITY Electronic trend boards and table tracking Billed monthly Priced per billable unit, not per table 99% of land-based revenue is recurring PREMIUM GAMES The licensed title on the felt
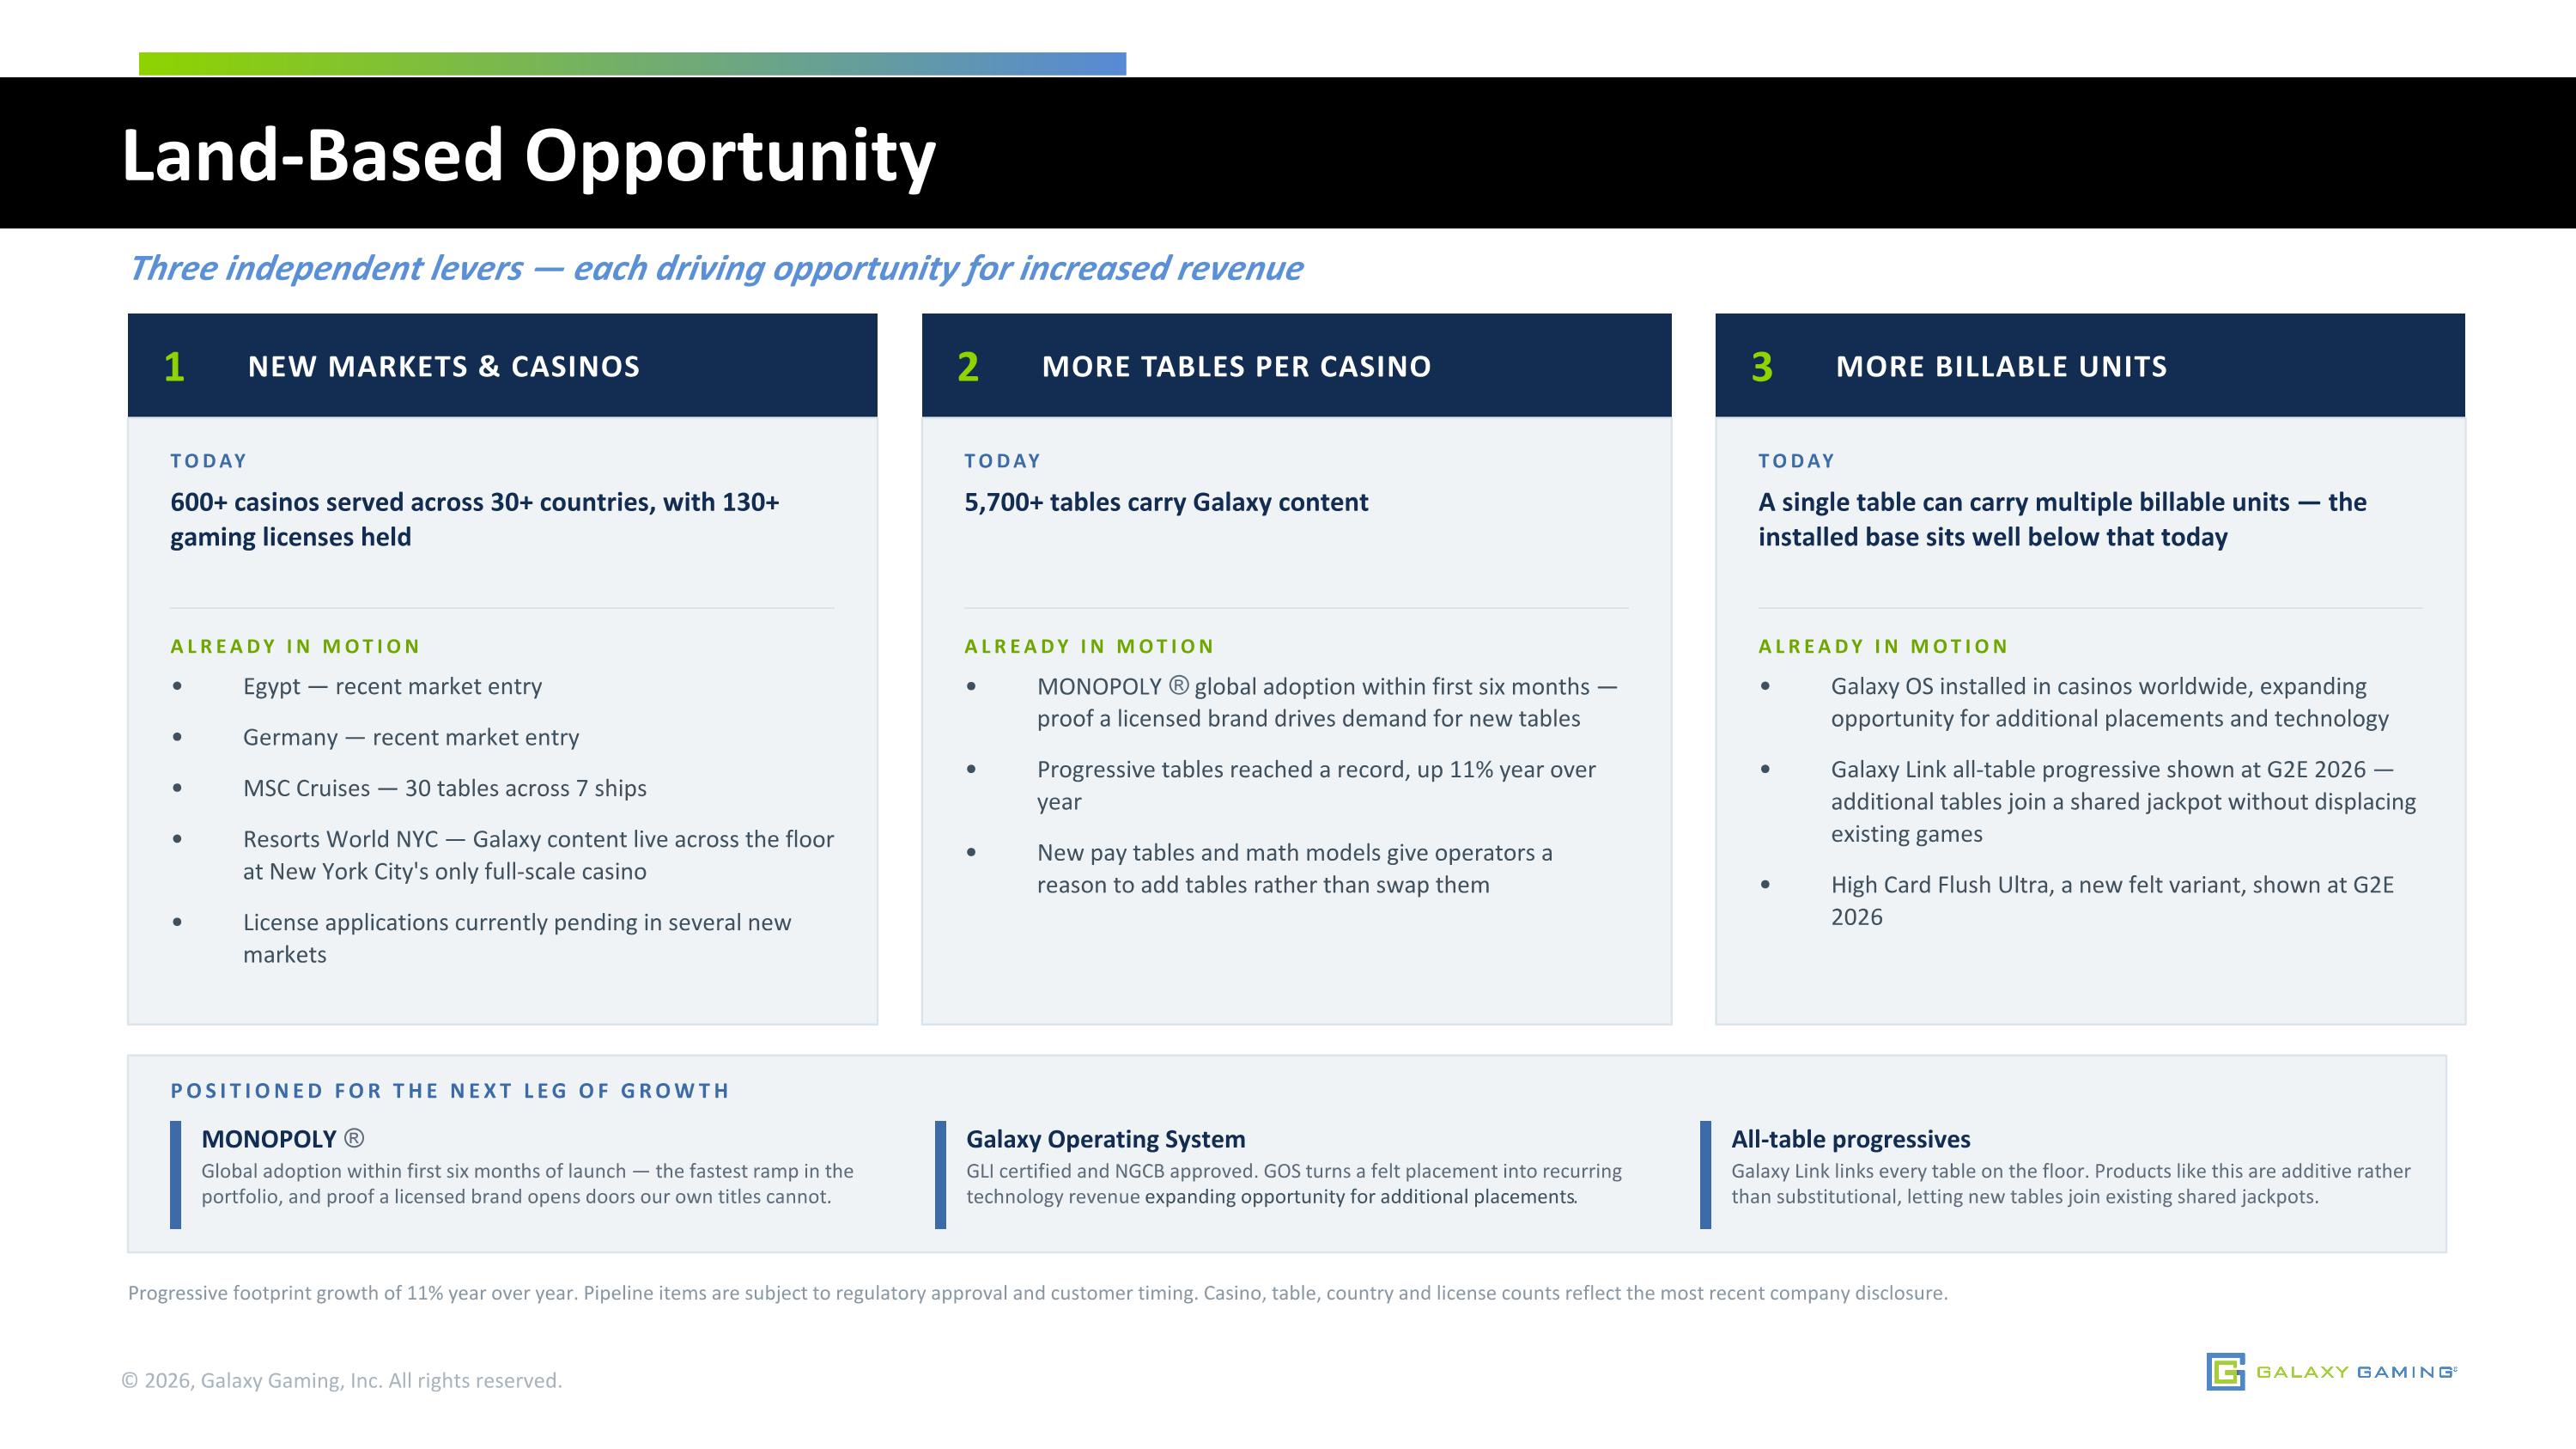
Land-Based Opportunity Three independent levers — each driving opportunity for increased revenue Progressive footprint growth of 11% year over year. Pipeline items are subject to regulatory approval and customer timing. Casino, table, country and license counts reflect the most recent company disclosure. © 2026, Galaxy Gaming, Inc. All rights reserved. 1 NEW MARKETS & CASINOS TODAY 600+ casinos served across 30+ countries, with 130+ gaming licenses held ALREADY IN MOTION Egypt — recent market entry Germany — recent market entry MSC Cruises — 30 tables across 7 ships Resorts World NYC — Galaxy content live across the floor at New York City's only full-scale casino License applications currently pending in several new markets 2 MORE TABLES PER CASINO TODAY 5,700+ tables carry Galaxy content ALREADY IN MOTION MONOPOLY ® global adoption within first six months — proof a licensed brand drives demand for new tables Progressive tables reached a record, up 11% year over year New pay tables and math models give operators a reason to add tables rather than swap them 3 MORE BILLABLE UNITS TODAY A single table can carry multiple billable units — the installed base sits well below that today ALREADY IN MOTION Galaxy OS installed in casinos worldwide, expanding opportunity for additional placements and technology Galaxy Link all-table progressive shown at G2E 2026 — additional tables join a shared jackpot without displacing existing games High Card Flush Ultra, a new felt variant, shown at G2E 2026 POSITIONED FOR THE NEXT LEG OF GROWTH MONOPOLY ® Global adoption within first six months of launch — the fastest ramp in the portfolio, and proof a licensed brand opens doors our own titles cannot. Galaxy Operating System GLI certified and NGCB approved. GOS turns a felt placement into recurring technology revenue expanding opportunity for additional placements. All-table progressives Galaxy Link links every table on the floor. Products like this are additive rather than substitutional, letting new tables join existing shared jackpots.
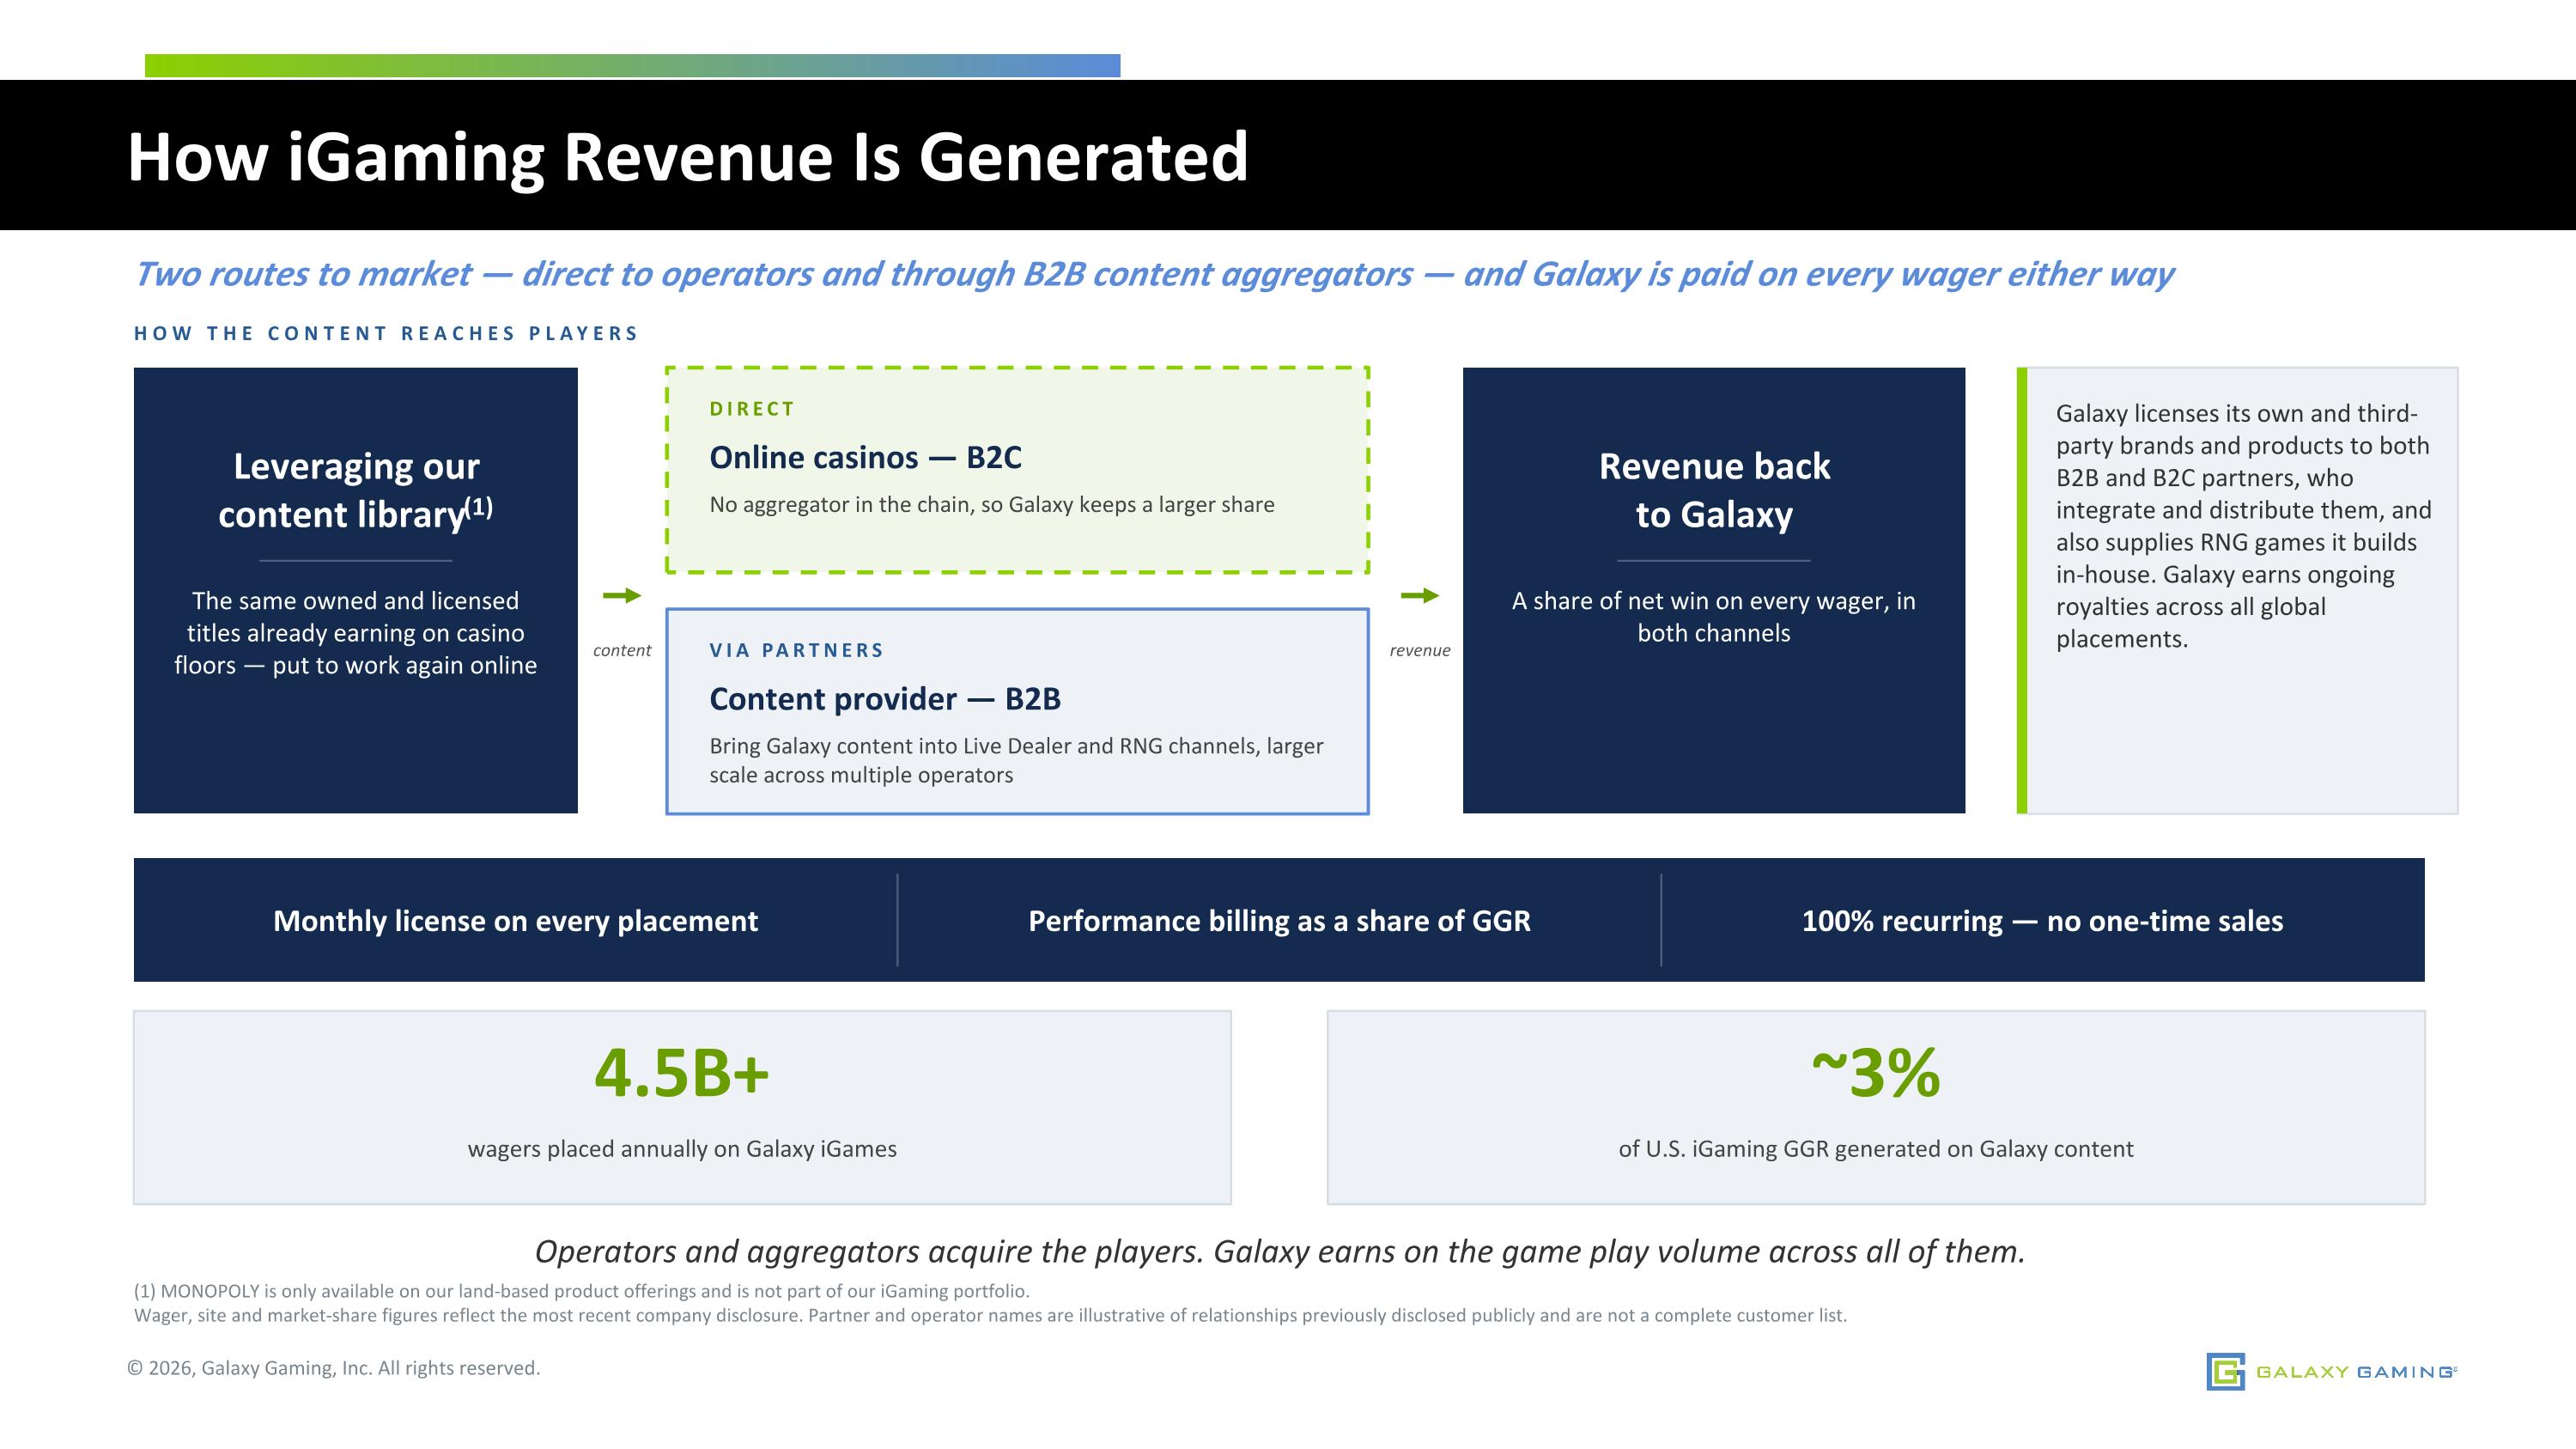
How iGaming Revenue Is Generated Two routes to market — direct to operators and through B2B content aggregators — and Galaxy is paid on every wager either way HOW THE CONTENT REACHES PLAYERS Leveraging our content library(1) The same owned and licensed titles already earning on casino floors — put to work again online Revenue back to Galaxy A share of net win on every wager, in both channels content revenue DIRECT Online casinos — B2C No aggregator in the chain, so Galaxy keeps a larger share VIA PARTNERS Content provider — B2B Bring Galaxy content into Live Dealer and RNG channels, larger scale across multiple operators Galaxy licenses its own and third-party brands and products to both B2B and B2C partners, who integrate and distribute them, and also supplies RNG games it builds in-house. Galaxy earns ongoing royalties across all global placements. Monthly license on every placement Performance billing as a share of GGR 100% recurring — no one-time sales 4.5B+ wagers placed annually on Galaxy iGames ~3% of U.S. iGaming GGR generated on Galaxy content Operators and aggregators acquire the players. Galaxy earns on the game play volume across all of them. (1) MONOPOLY is only available on our land-based product offerings and is not part of our iGaming portfolio. Wager, site and market-share figures reflect the most recent company disclosure. Partner and operator names are illustrative of relationships previously disclosed publicly and are not a complete customer list.
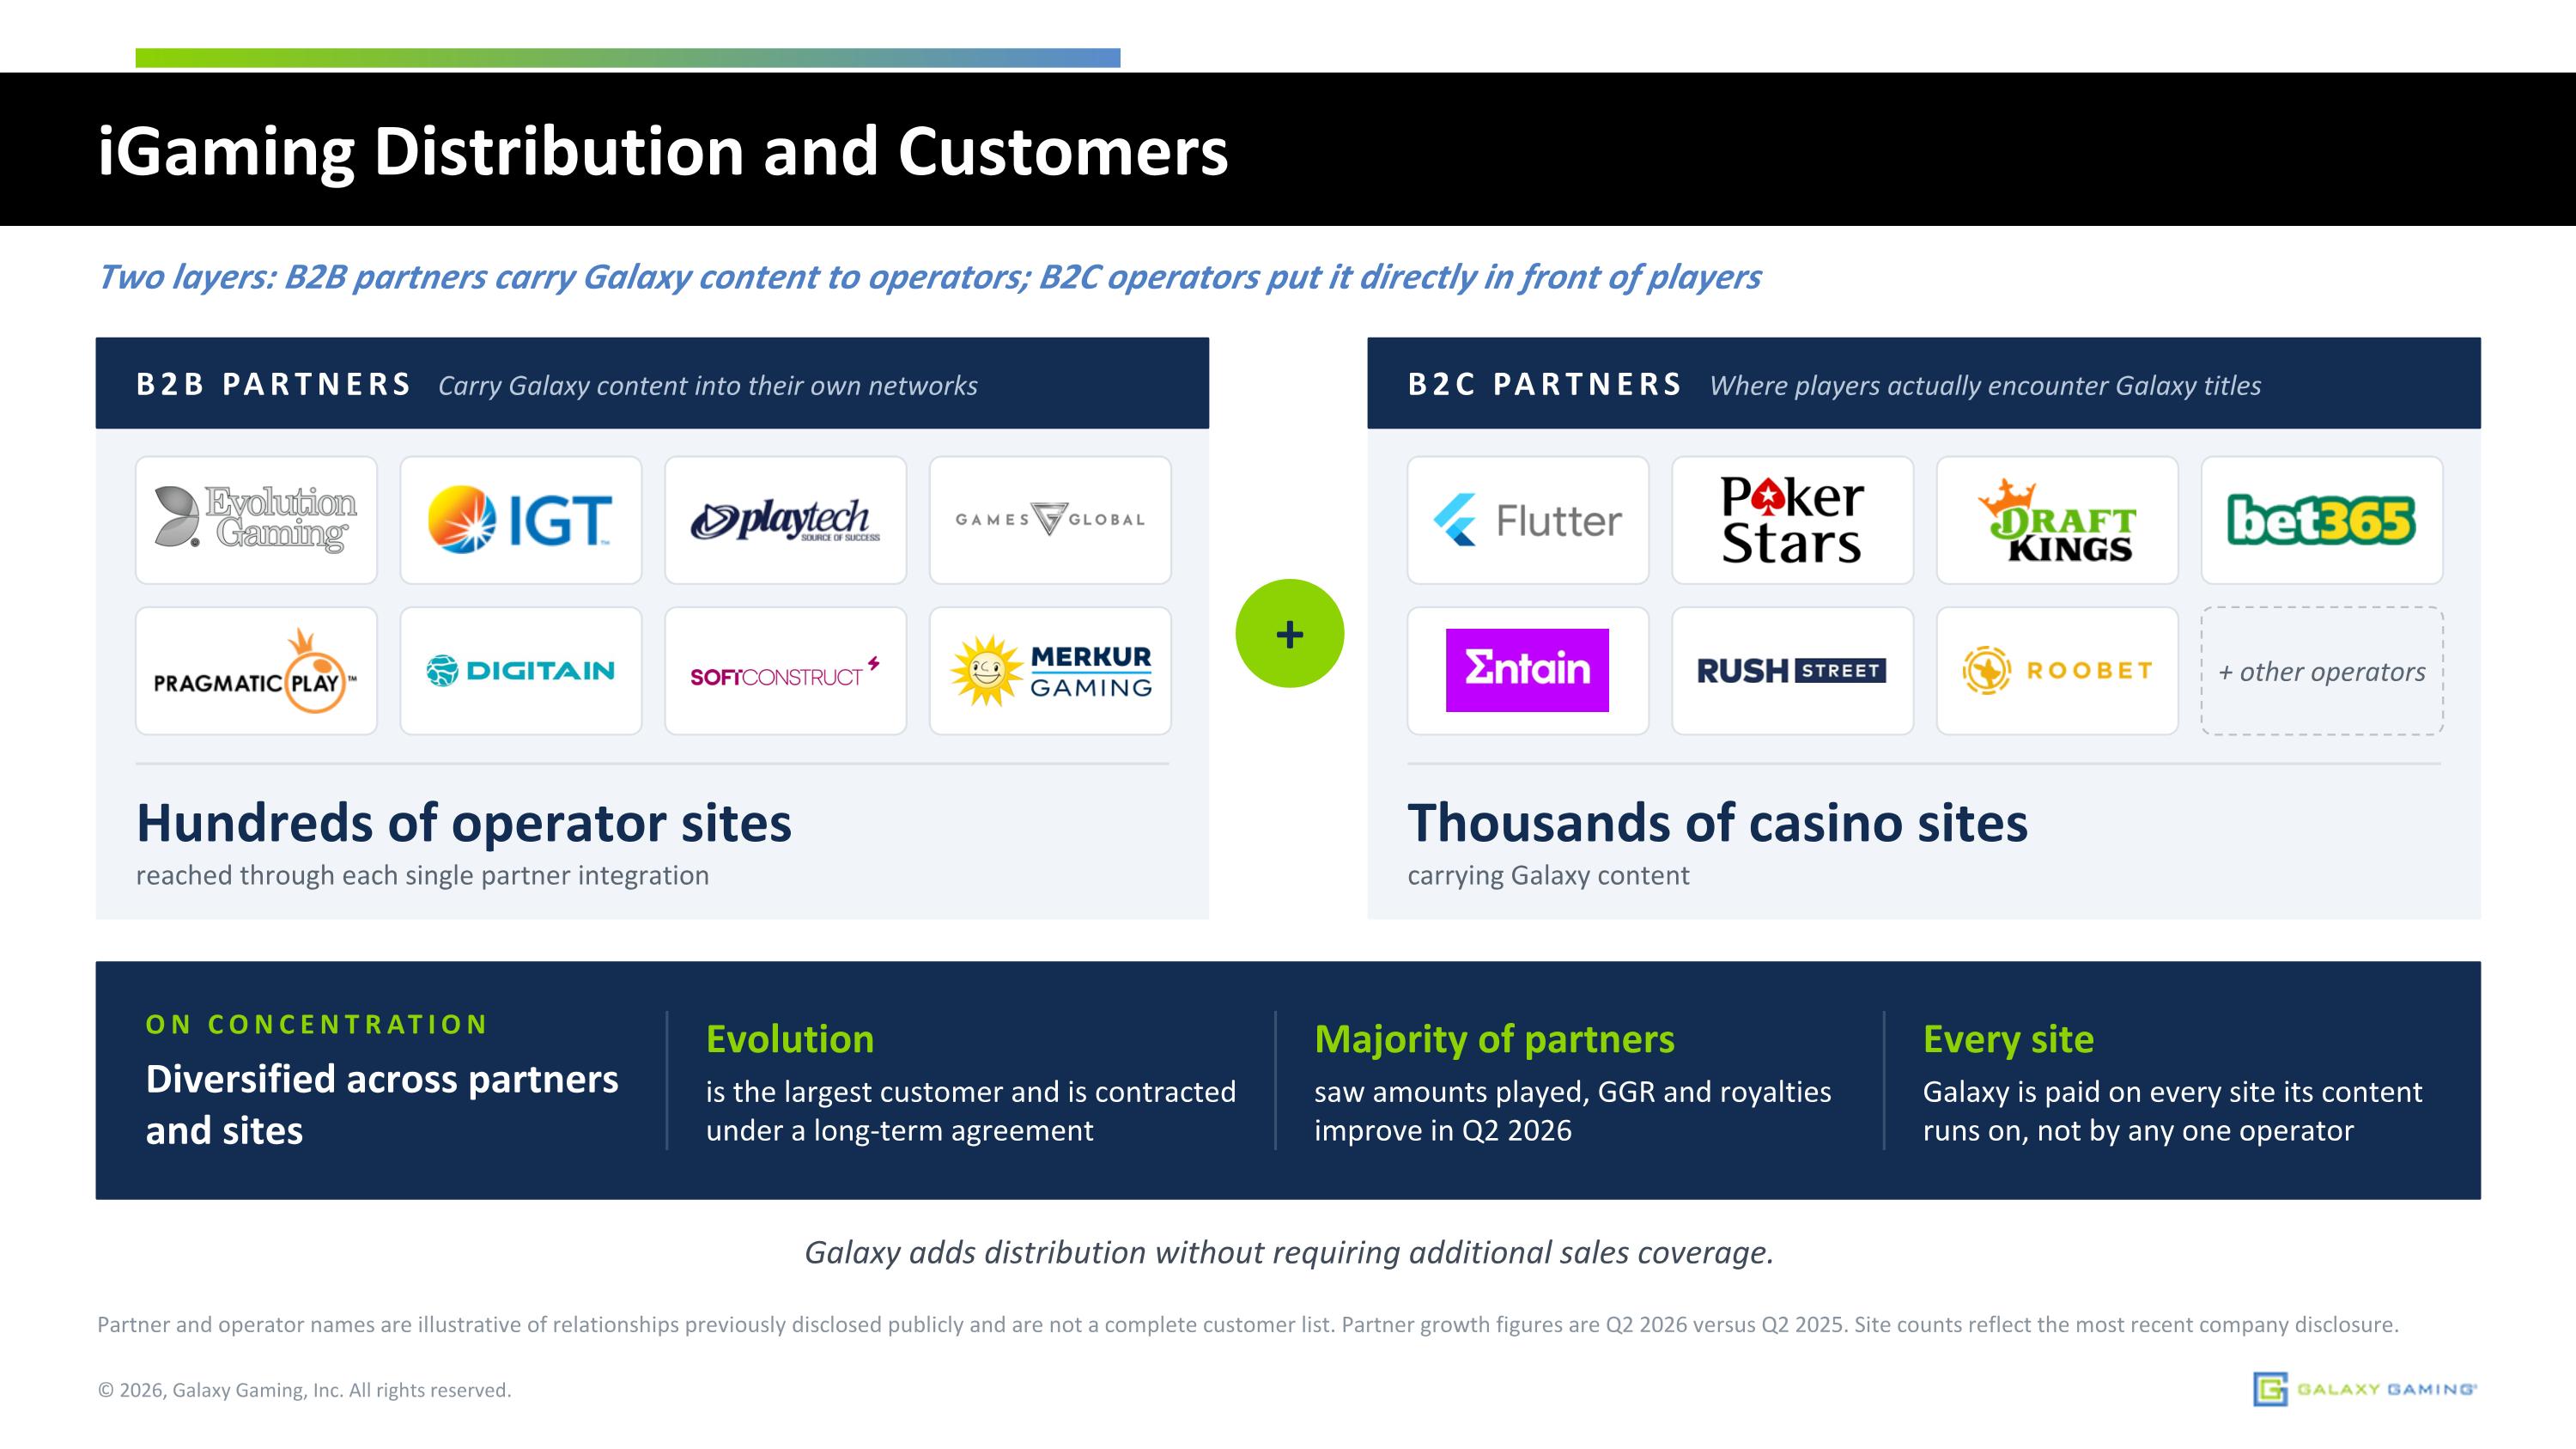
iGaming Distribution and Customers Two layers: B2B partners carry Galaxy content to operators; B2C operators put it directly in front of players B2B PARTNERS Carry Galaxy content into their own networks Hundreds of operator sites reached through each single partner integration + B2C PARTNERS Where players actually encounter Galaxy titles + other operators Thousands of casino sites carrying Galaxy content ON CONCENTRATION Diversified across partners and sites Evolution is the largest customer and is contracted under a long-term agreement Majority of partners saw amounts played, GGR and royalties improve in Q2 2026 Every site Galaxy is paid on every site its content runs on, not by any one operator Galaxy adds distribution without requiring additional sales coverage. Partner and operator names are illustrative of relationships previously disclosed publicly and are not a complete customer list. Partner growth figures are Q2 2026 versus Q2 2025. Site counts reflect the most recent company disclosure. © 2026, Galaxy Gaming, Inc. All rights reserved.
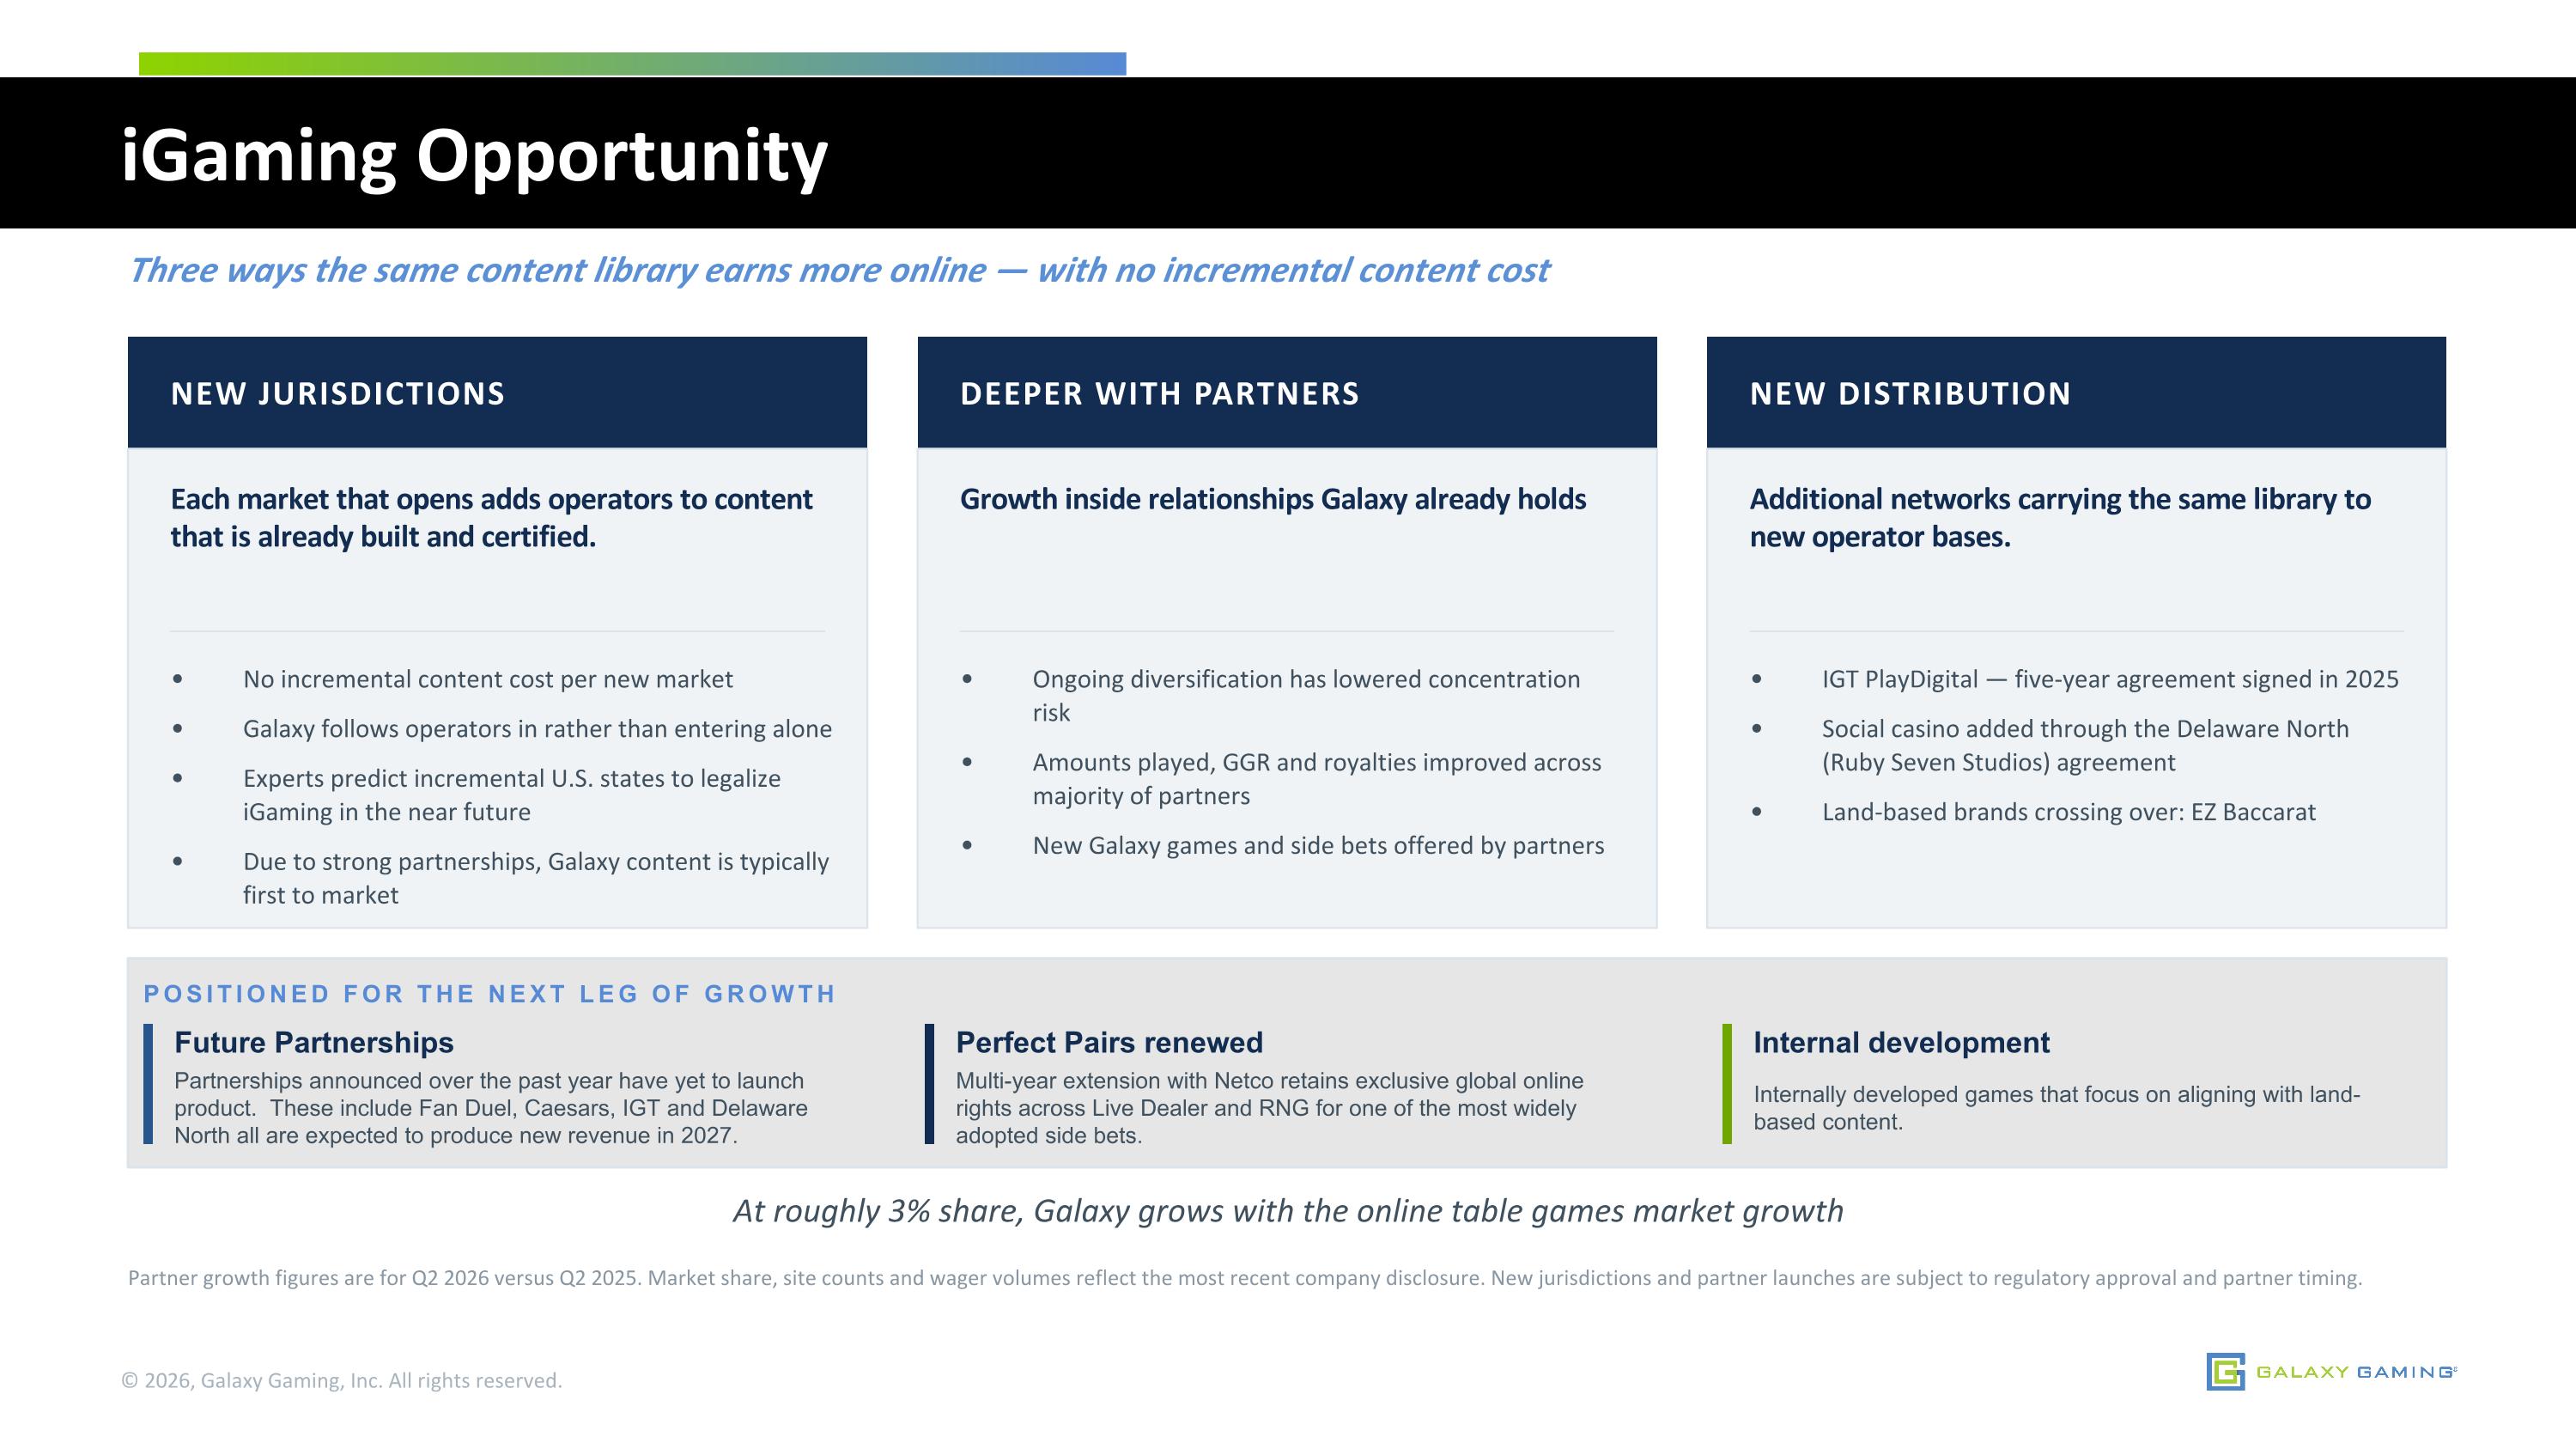
iGaming Opportunity Three ways the same content library earns more online — with no incremental content cost Partner growth figures are for Q2 2026 versus Q2 2025. Market share, site counts and wager volumes reflect the most recent company disclosure. New jurisdictions and partner launches are subject to regulatory approval and partner timing. © 2026, Galaxy Gaming, Inc. All rights reserved. NEW JURISDICTIONS Each market that opens adds operators to content that is already built and certified. No incremental content cost per new market Galaxy follows operators in rather than entering alone Experts predict incremental U.S. states to legalize iGaming in the near future Due to strong partnerships, Galaxy content is typically first to market DEEPER WITH PARTNERS Growth inside relationships Galaxy already holds Ongoing diversification has lowered concentration risk Amounts played, GGR and royalties improved across majority of partners New Galaxy games and side bets offered by partners NEW DISTRIBUTION Additional networks carrying the same library to new operator bases. IGT PlayDigital — five-year agreement signed in 2025 Social casino added through the Delaware North (Ruby Seven Studios) agreement Land-based brands crossing over: EZ Baccarat At roughly 3% share, Galaxy grows with the online table games market growth POSITIONED FOR THE NEXT LEG OF GROWTH Future Partnerships Partnerships announced over the past year have yet to launch product. These include Fan Duel, Caesars, IGT and Delaware North all are expected to produce new revenue in 2027. Perfect Pairs renewed Multi-year extension with Netco retains exclusive global online rights across Live Dealer and RNG for one of the most widely adopted side bets. Internal development Internally developed games that focus on aligning with land-based content.
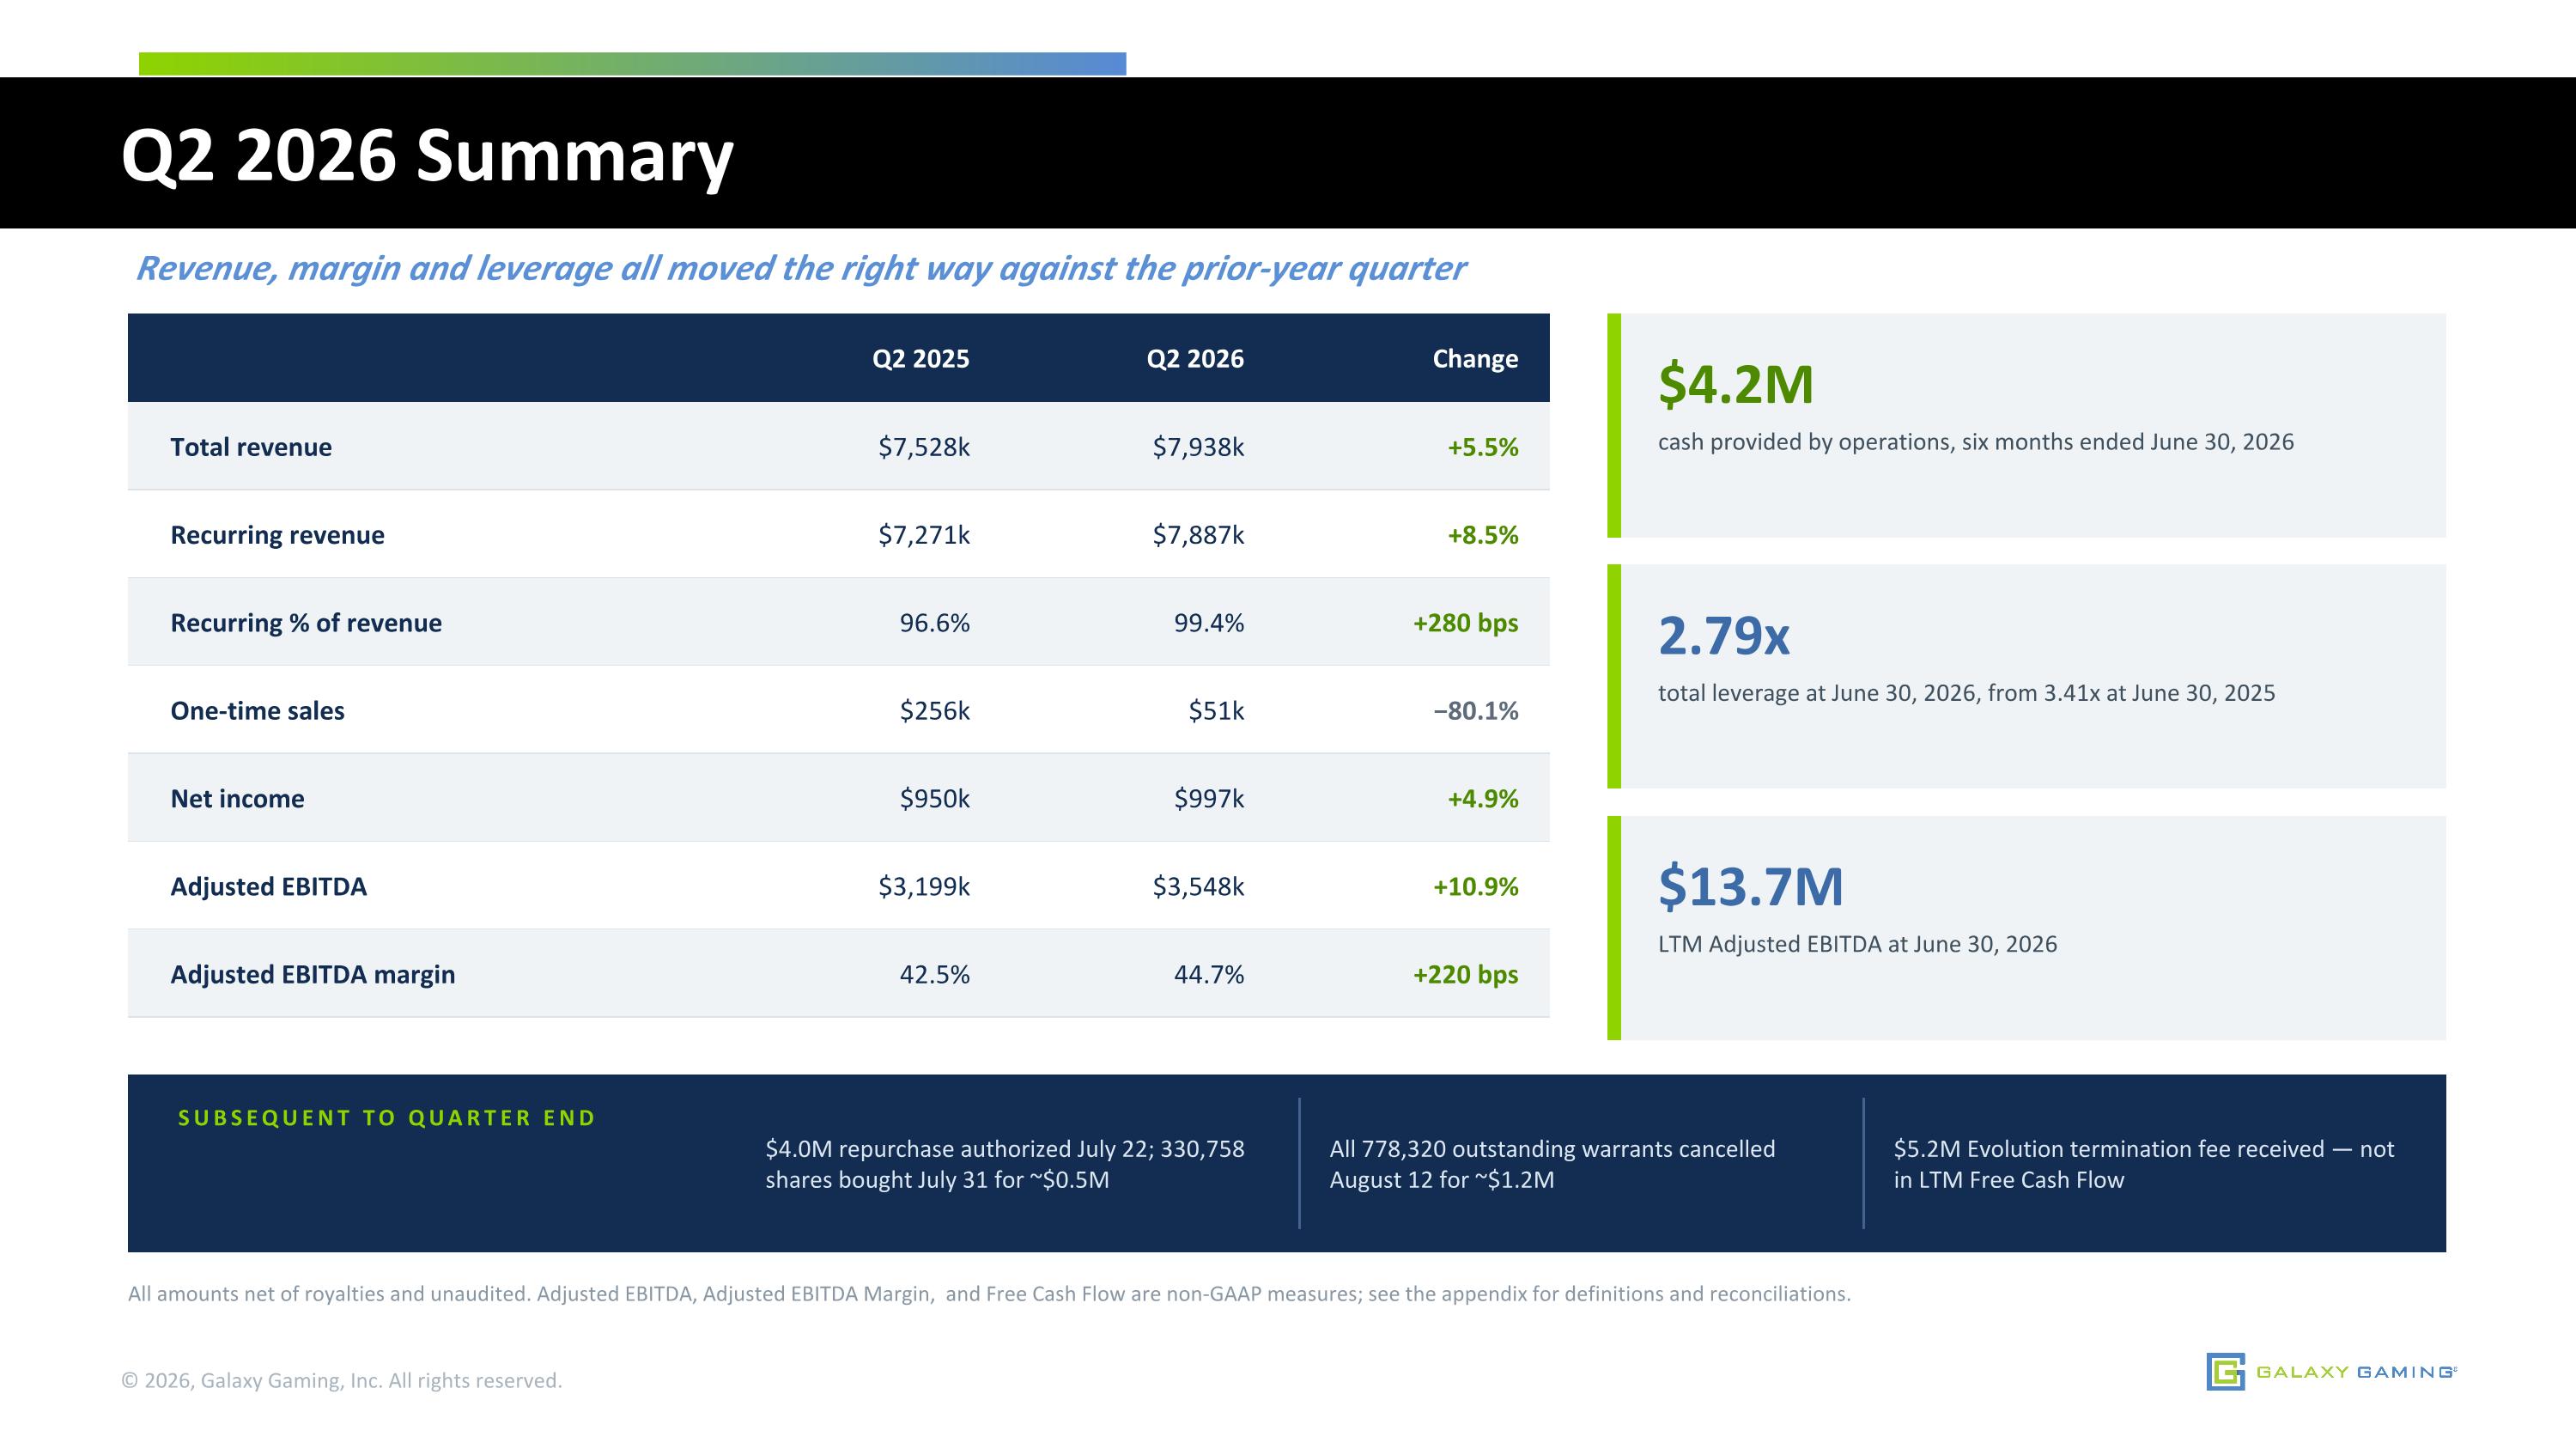
Q2 2026 Summary Revenue, margin and leverage all moved the right way against the prior-year quarter All amounts net of royalties and unaudited. Adjusted EBITDA, Adjusted EBITDA Margin, and Free Cash Flow are non-GAAP measures; see the appendix for definitions and reconciliations. © 2026, Galaxy Gaming, Inc. All rights reserved. Q2 2025 Q2 2026 Change Total revenue $7,528k $7,938k +5.5% Recurring revenue $7,271k $7,887k +8.5% Recurring % of revenue 96.6% 99.4% +280 bps One-time sales $256k $51k −80.1% Net income $950k $997k +4.9% Adjusted EBITDA $3,199k $3,548k +10.9% Adjusted EBITDA margin 42.5% 44.7% +220 bps $4.2M cash provided by operations, six months ended June 30, 2026 2.79x total leverage at June 30, 2026, from 3.41x at June 30, 2025 $13.7M LTM Adjusted EBITDA at June 30, 2026 SUBSEQUENT TO QUARTER END $4.0M repurchase authorized July 22; 330,758 shares bought July 31 for ~$0.5M All 778,320 outstanding warrants cancelled August 12 for ~$1.2M $5.2M Evolution termination fee received — not in LTM Free Cash Flow
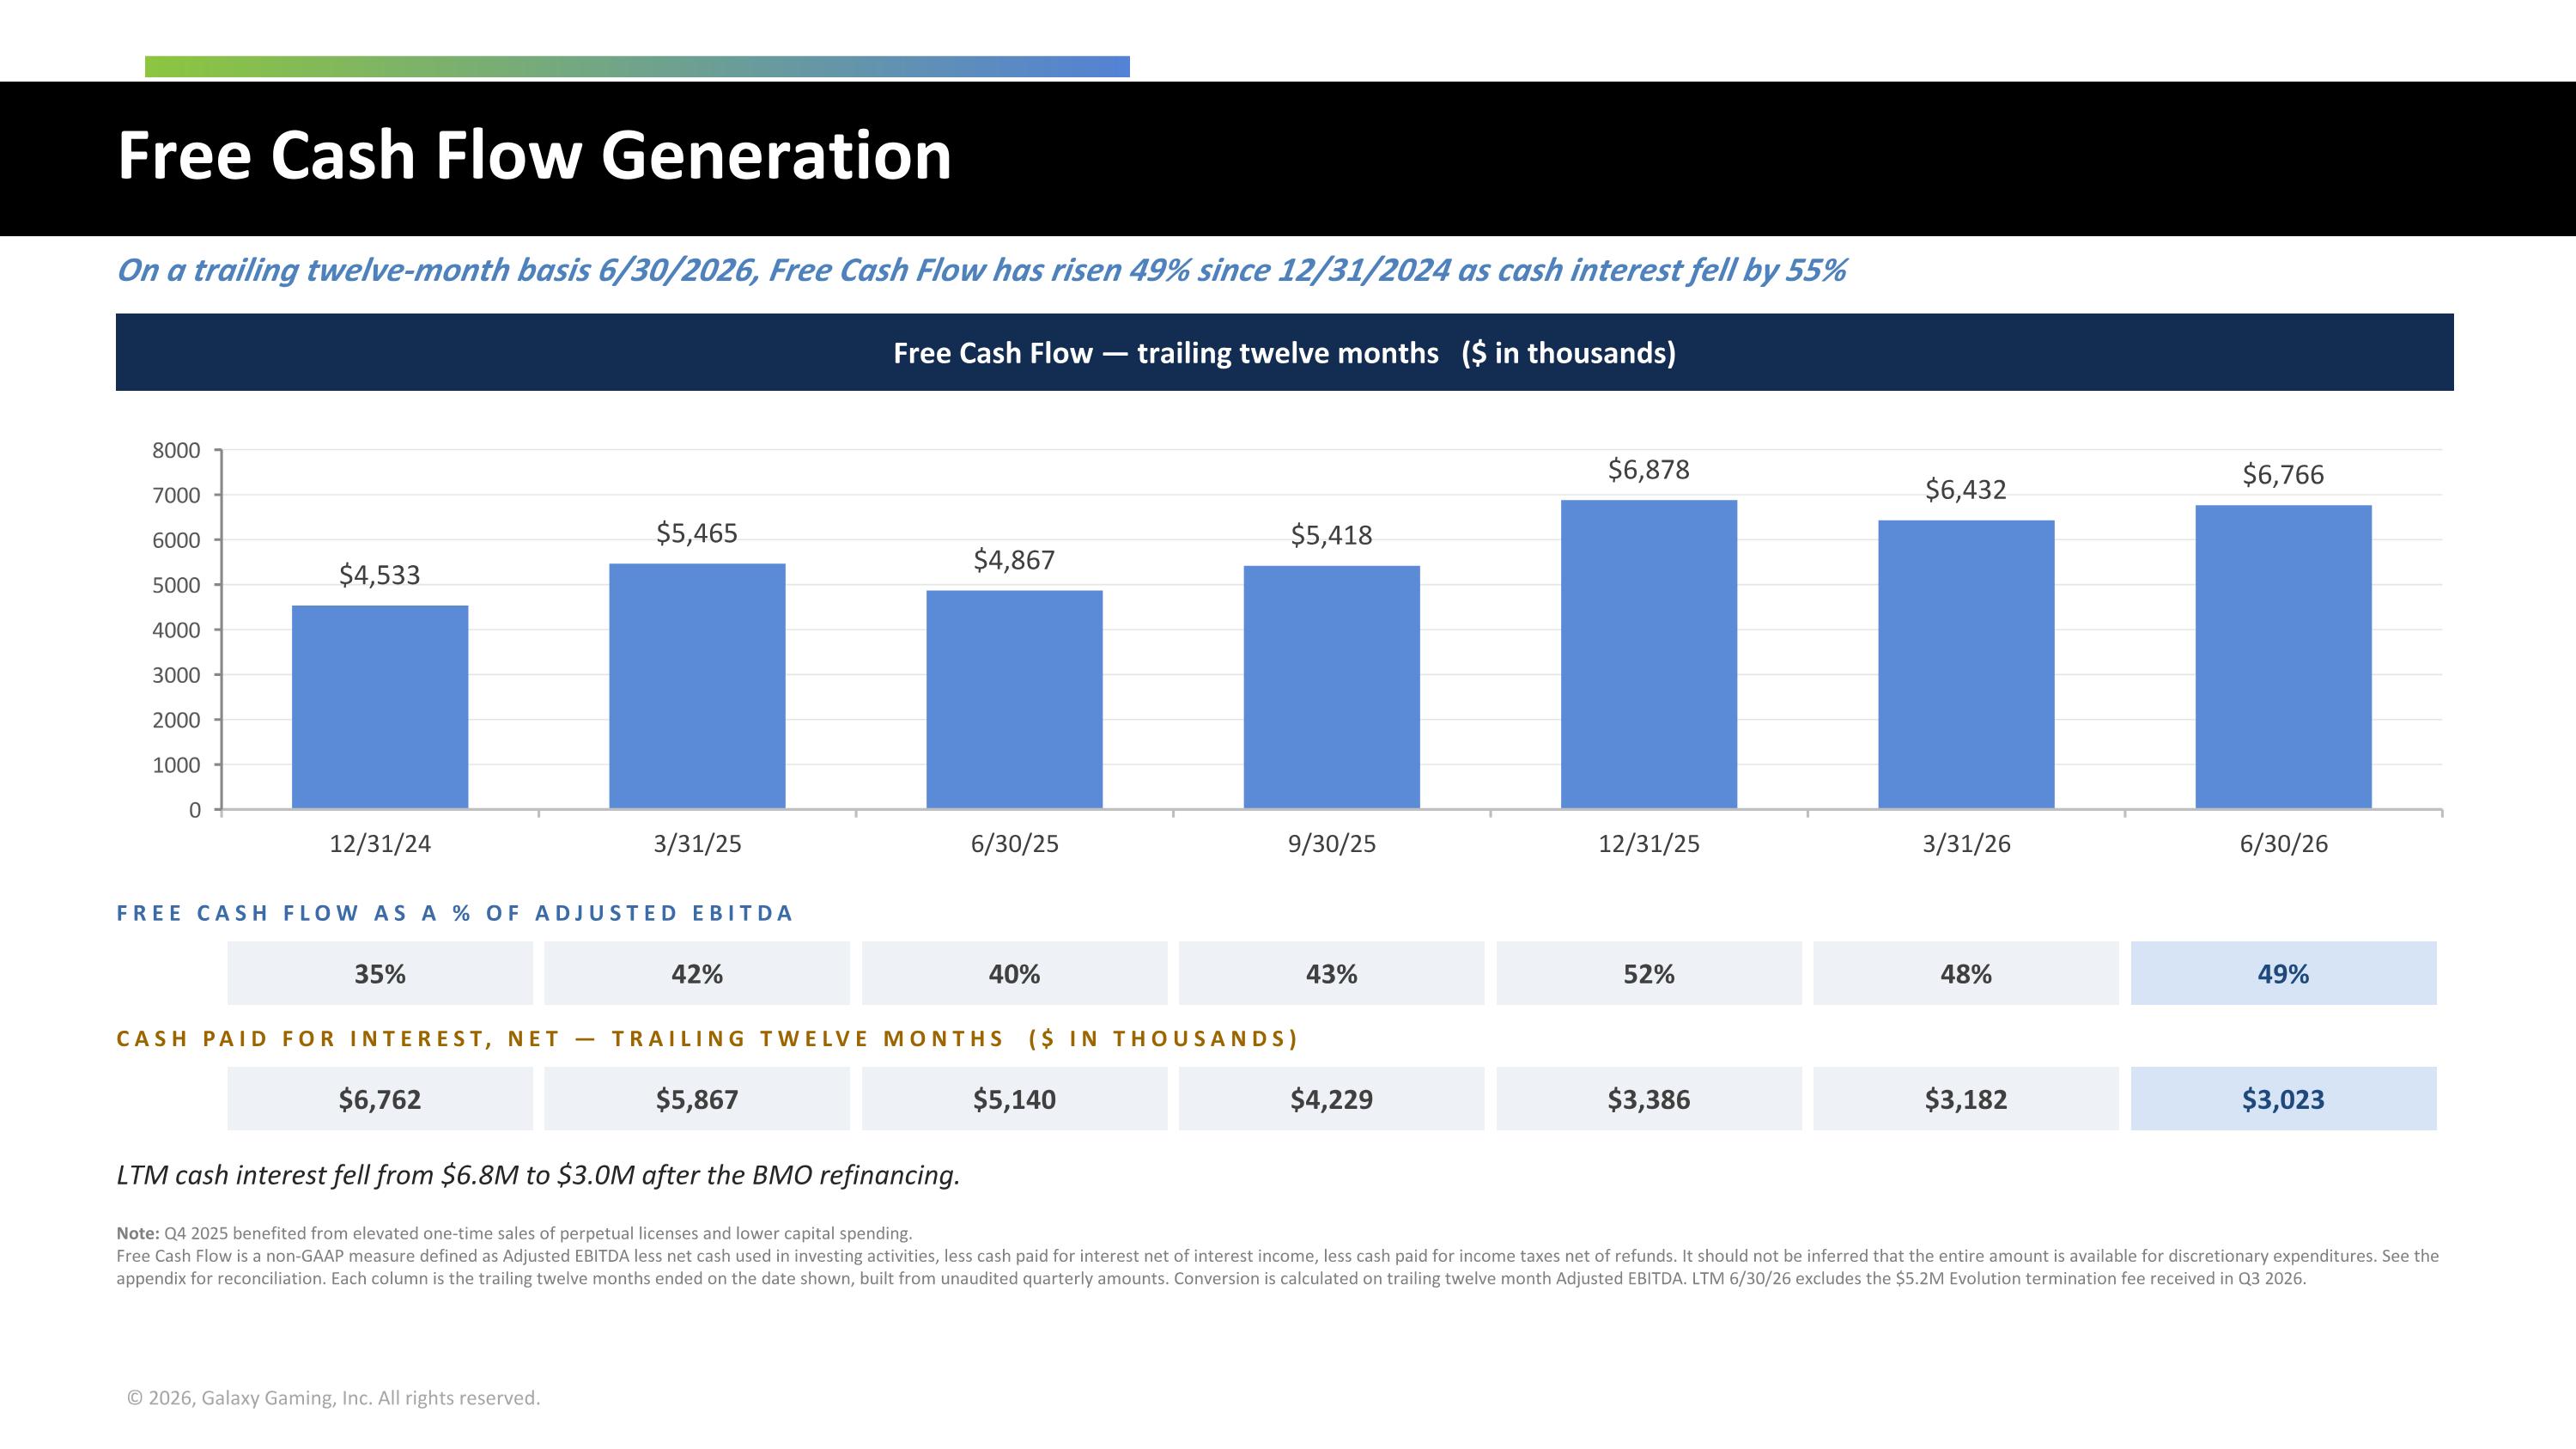
Free Cash Flow Generation On a trailing twelve-month basis 6/30/2026, Free Cash Flow has risen 49% since 12/31/2024 as cash interest fell by 55% Free Cash Flow — trailing twelve months ($ in thousands) FREE CASH FLOW AS A % OF ADJUSTED EBITDA 35% 42% 40% 43% 52% 48% 49% CASH PAID FOR INTEREST, NET — TRAILING TWELVE MONTHS ($ IN THOUSANDS) $6,762 $5,867 $5,140 $4,229 $3,386 $3,182 $3,023 LTM cash interest fell from $6.8M to $3.0M after the BMO refinancing. Note: Q4 2025 benefited from elevated one-time sales of perpetual licenses and lower capital spending. Free Cash Flow is a non-GAAP measure defined as Adjusted EBITDA less net cash used in investing activities, less cash paid for interest net of interest income, less cash paid for income taxes net of refunds. It should not be inferred that the entire amount is available for discretionary expenditures. See the appendix for reconciliation. Each column is the trailing twelve months ended on the date shown, built from unaudited quarterly amounts. Conversion is calculated on trailing twelve month Adjusted EBITDA. LTM 6/30/26 excludes the $5.2M Evolution termination fee received in Q3 2026.
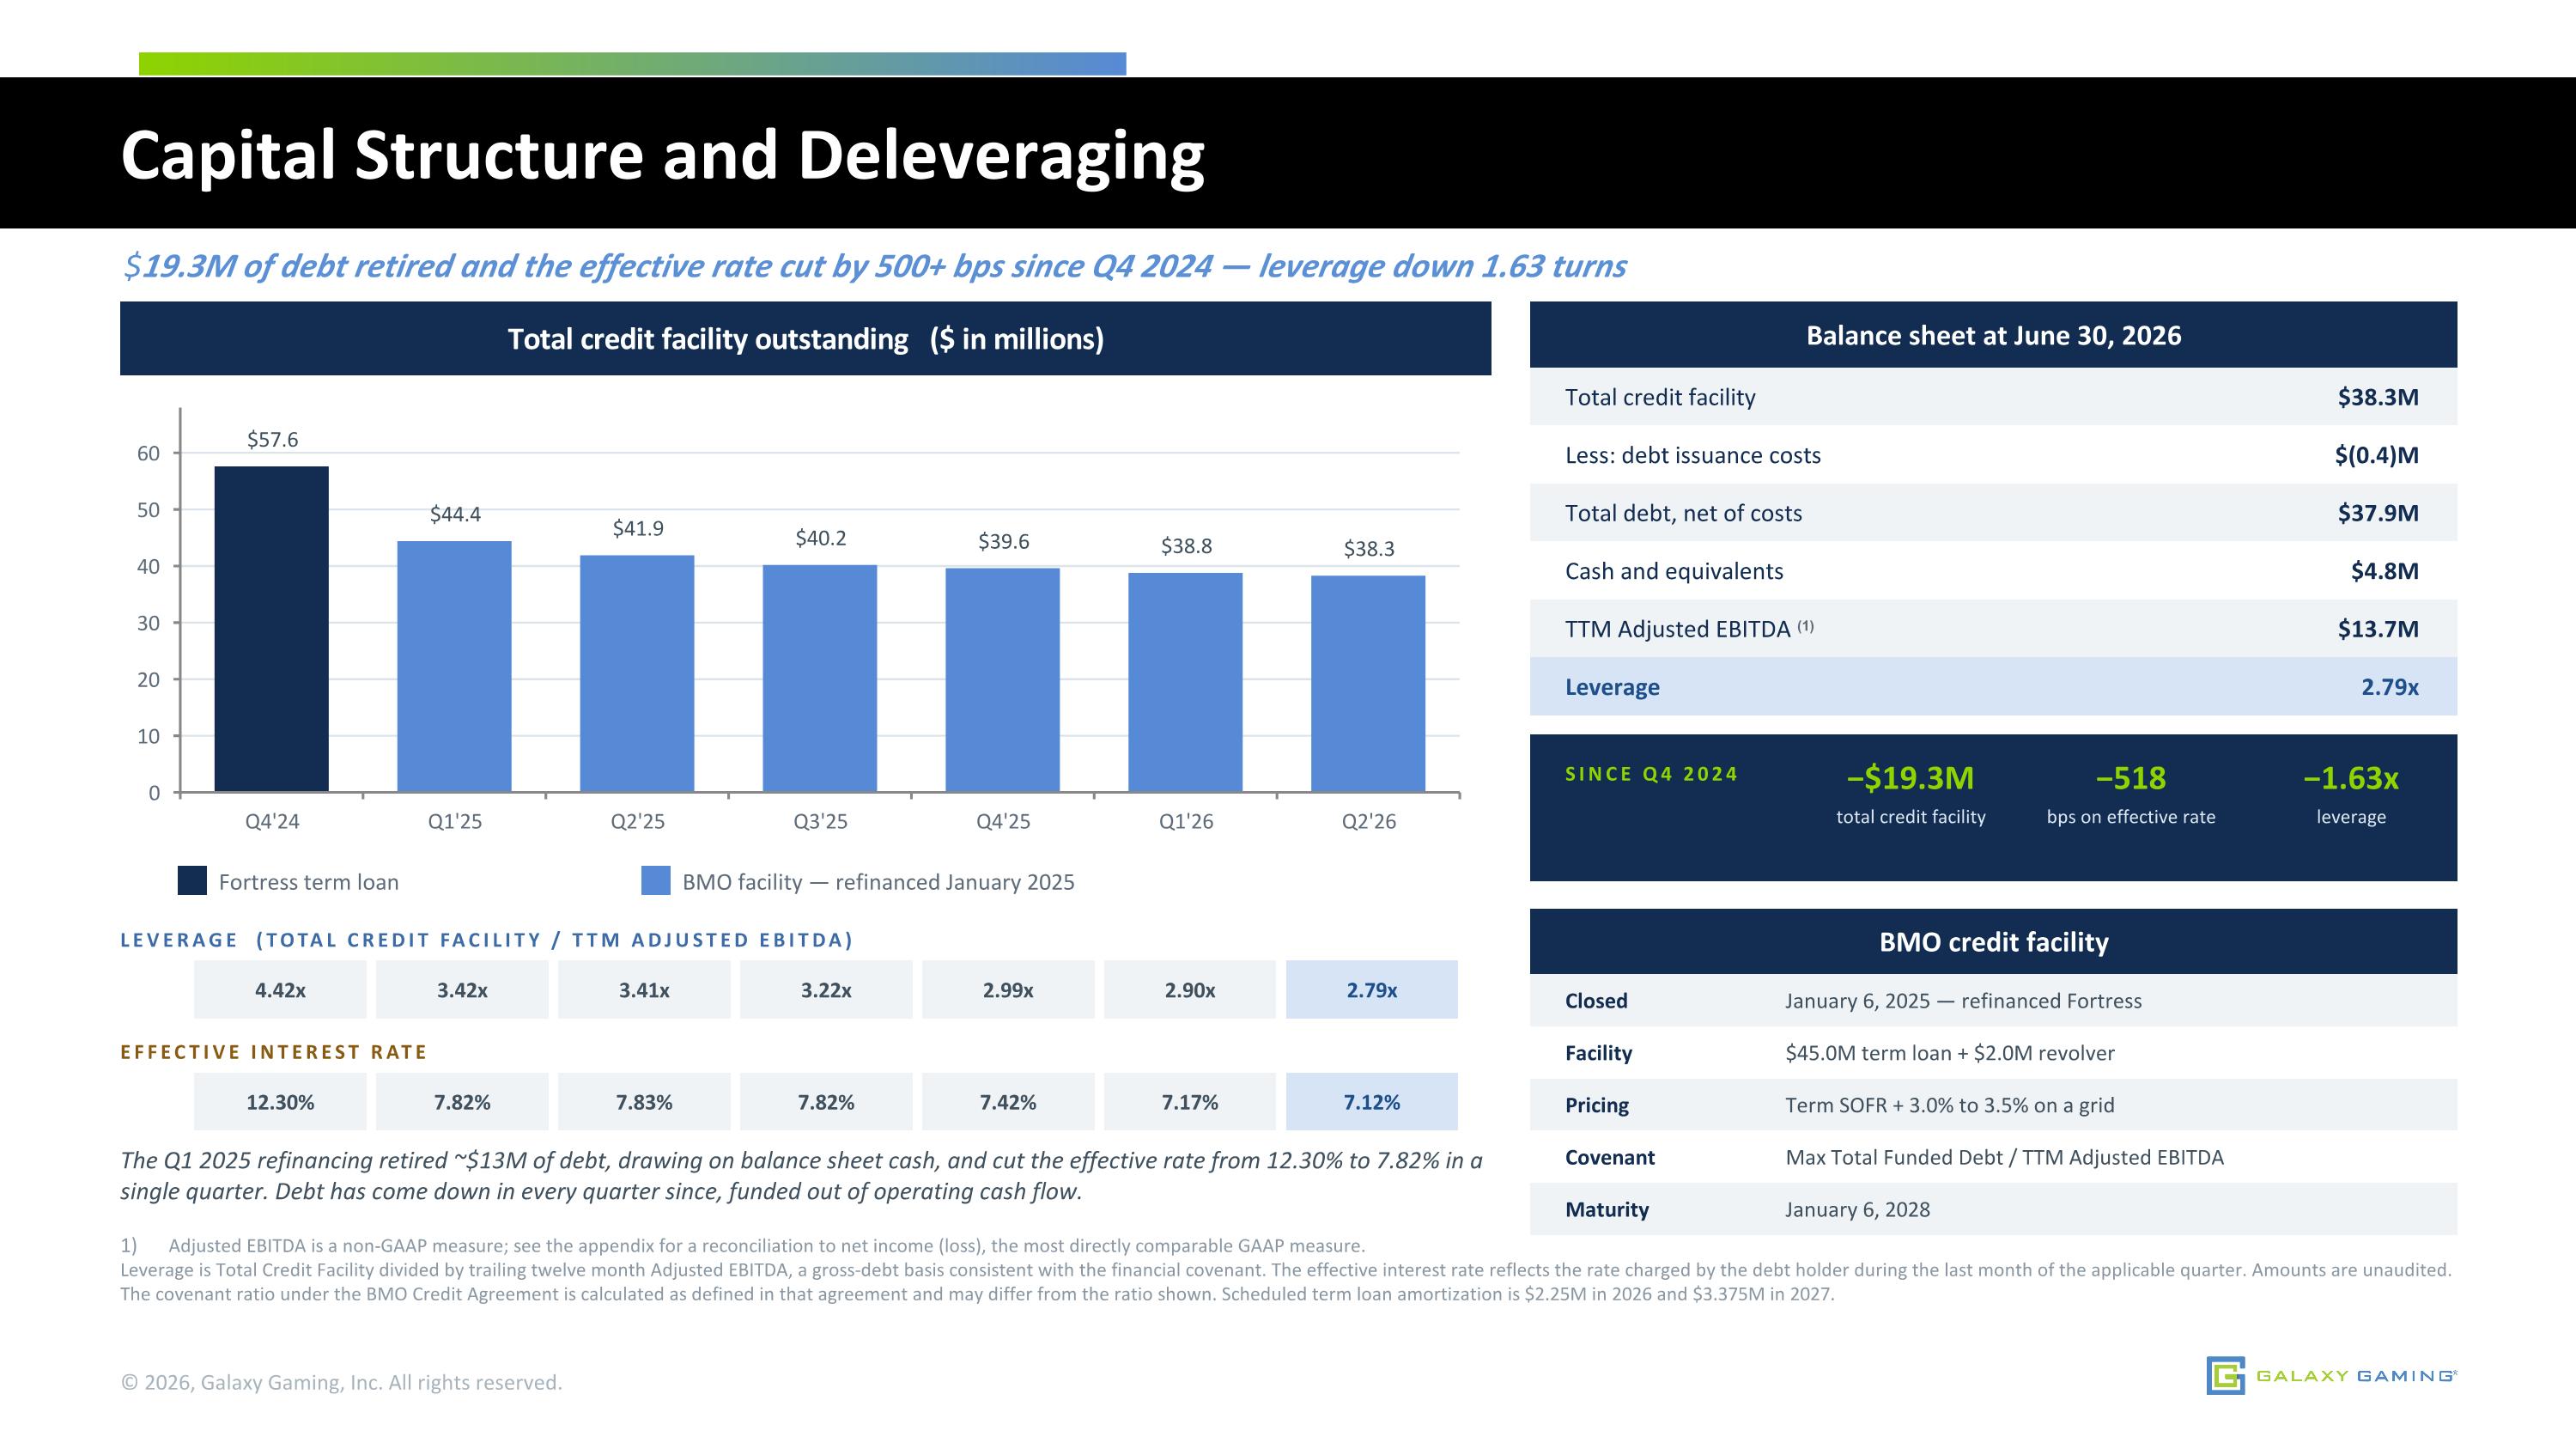
Capital Structure and Deleveraging $19.3M of debt retired and the effective rate cut by 500+ bps since Q4 2024 — leverage down 1.63 turns Adjusted EBITDA is a non-GAAP measure; see the appendix for a reconciliation to net income (loss), the most directly comparable GAAP measure. Leverage is Total Credit Facility divided by trailing twelve month Adjusted EBITDA, a gross-debt basis consistent with the financial covenant. The effective interest rate reflects the rate charged by the debt holder during the last month of the applicable quarter. Amounts are unaudited. The covenant ratio under the BMO Credit Agreement is calculated as defined in that agreement and may differ from the ratio shown. Scheduled term loan amortization is $2.25M in 2026 and $3.375M in 2027. © 2026, Galaxy Gaming, Inc. All rights reserved. Total credit facility outstanding ($ in millions) Fortress term loan BMO facility — refinanced January 2025 LEVERAGE (TOTAL CREDIT FACILITY / TTM ADJUSTED EBITDA) 4.42x 3.42x 3.41x 3.22x 2.99x 2.90x 2.79x EFFECTIVE INTEREST RATE 12.30% 7.82% 7.83% 7.82% 7.42% 7.17% 7.12% The Q1 2025 refinancing retired ~$13M of debt, drawing on balance sheet cash, and cut the effective rate from 12.30% to 7.82% in a single quarter. Debt has come down in every quarter since, funded out of operating cash flow. Balance sheet at June 30, 2026 Total credit facility $38.3M Less: debt issuance costs $(0.4)M Total debt, net of costs $37.9M Cash and equivalents $4.8M TTM Adjusted EBITDA (1) $13.7M Leverage 2.79x SINCE Q4 2024 −$19.3M total credit facility −518 bps on effective rate −1.63x leverage BMO credit facility Closed January 6, 2025 — refinanced Fortress Facility $45.0M term loan + $2.0M revolver Pricing Term SOFR + 3.0% to 3.5% on a grid Covenant Max Total Funded Debt / TTM Adjusted EBITDA Maturity January 6, 2028
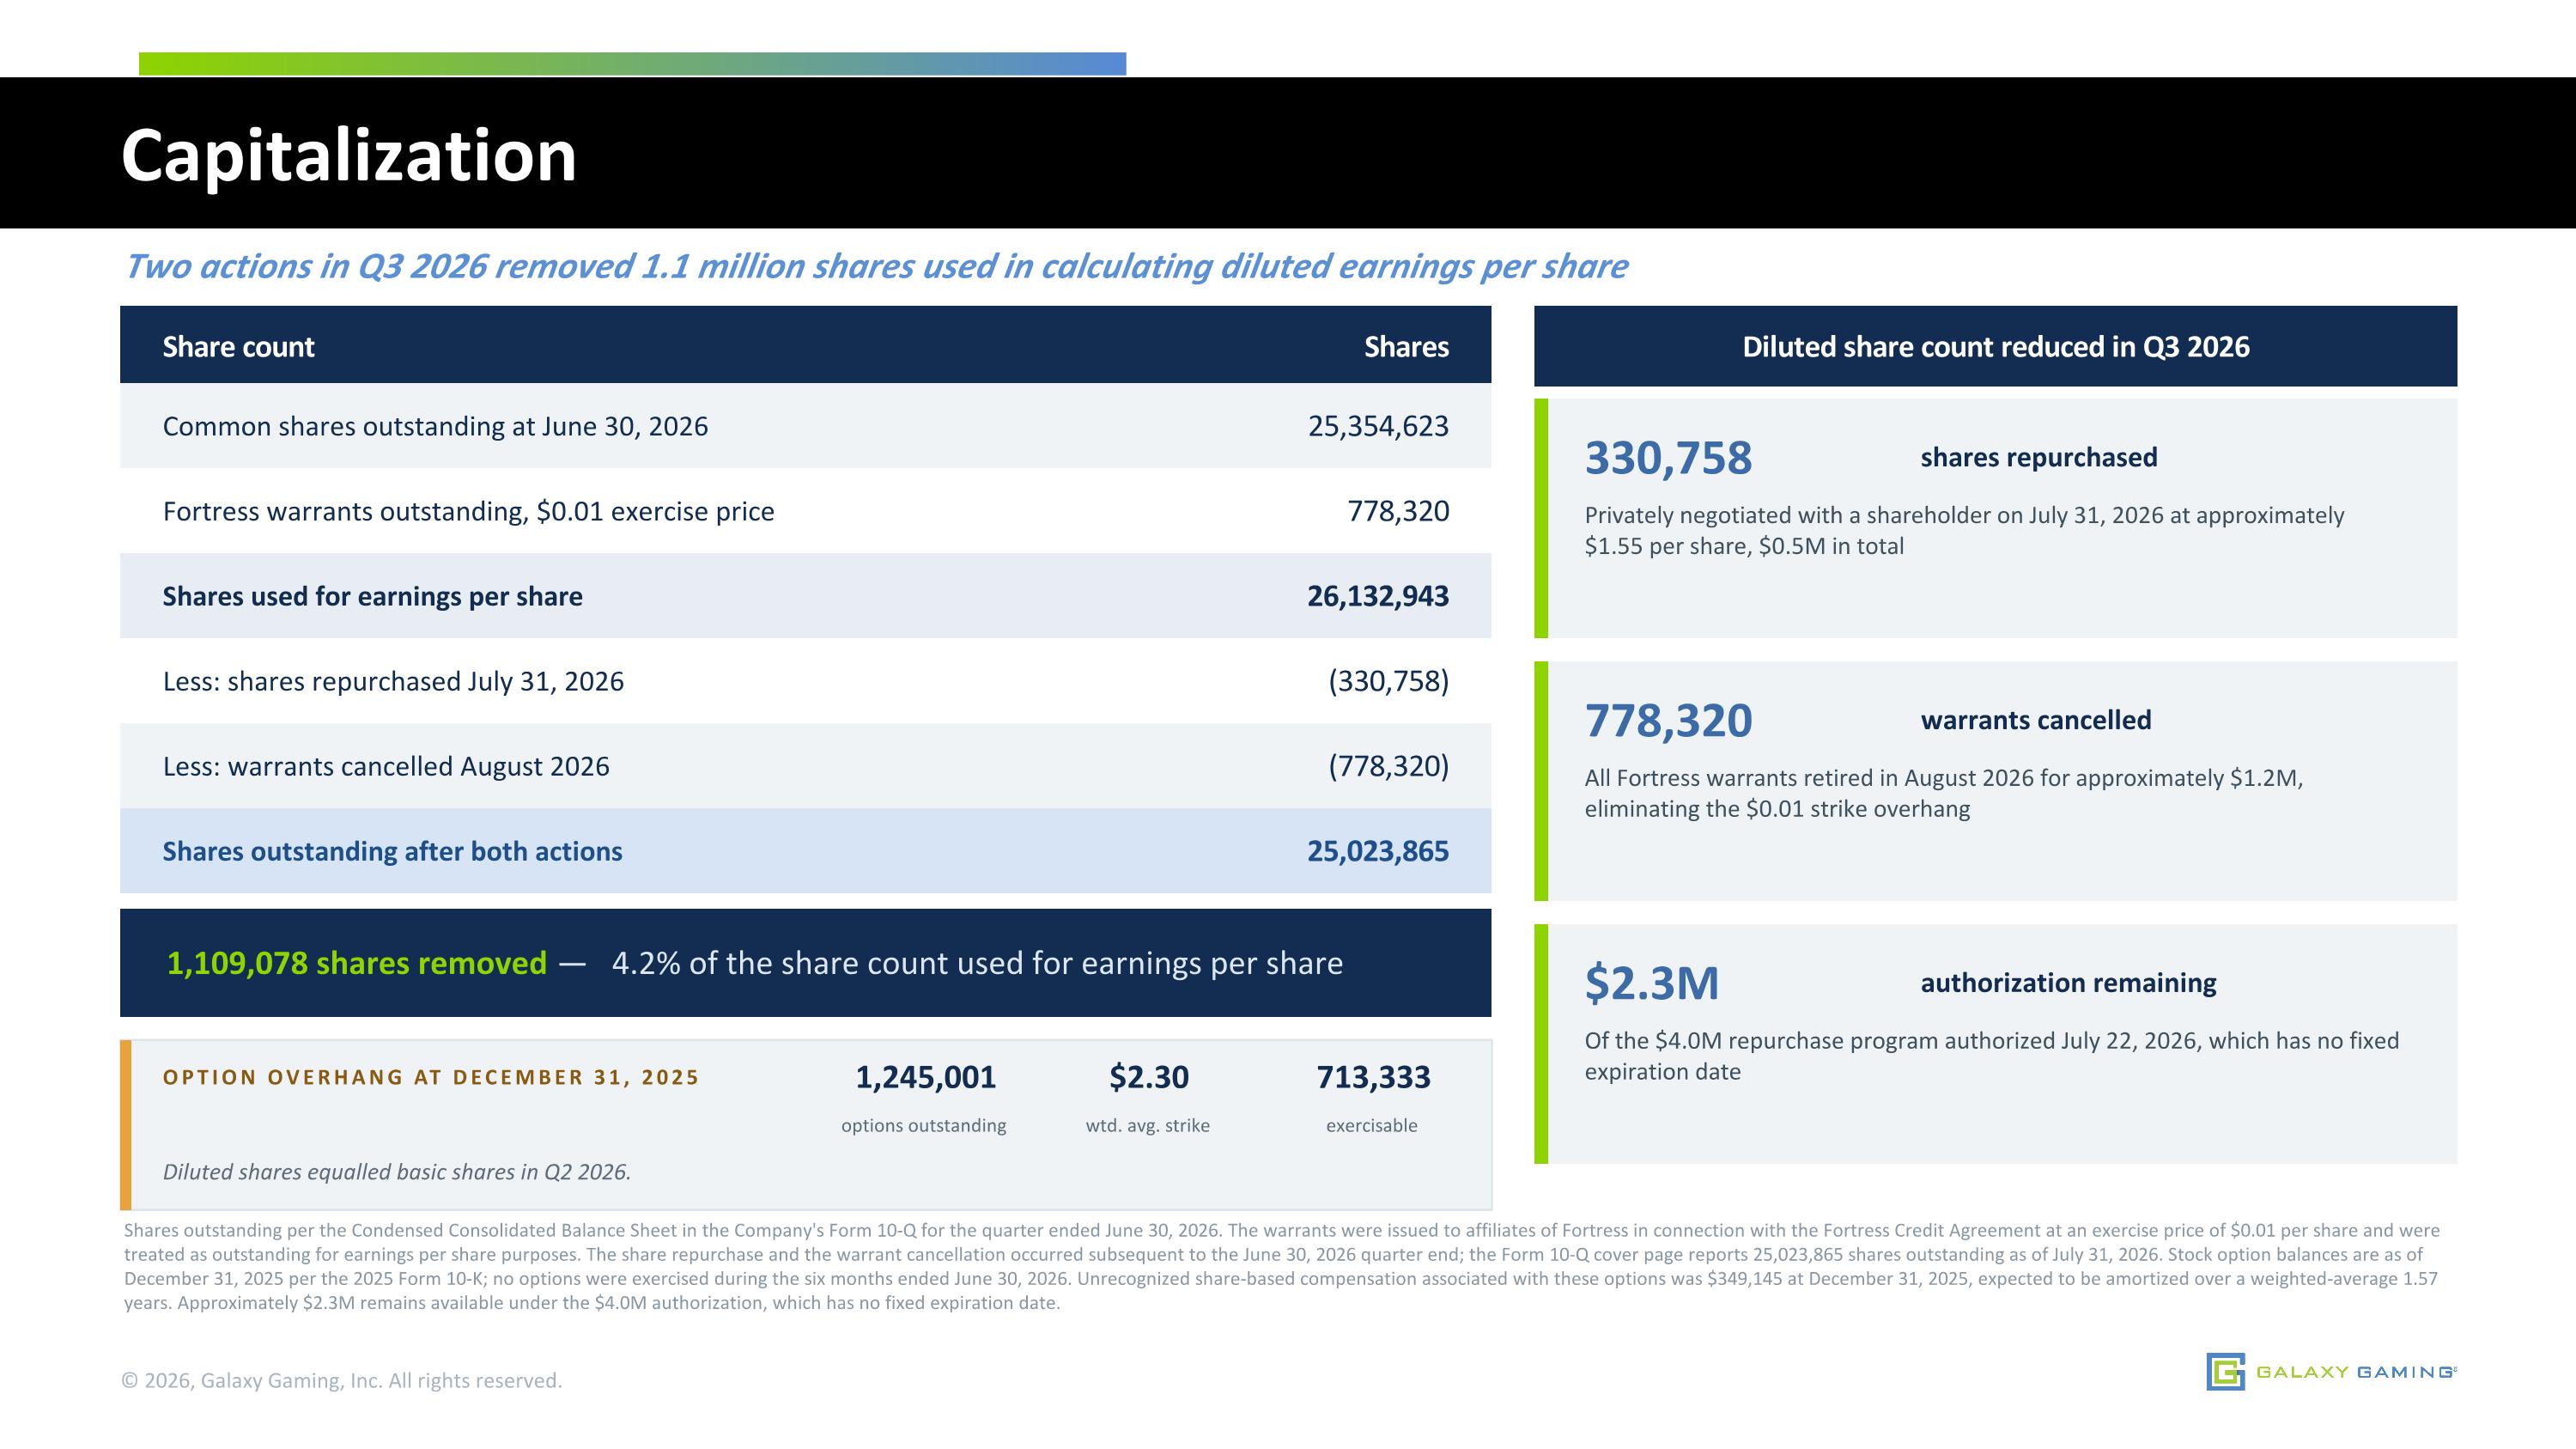
Capitalization Two actions in Q3 2026 removed 1.1 million shares used in calculating diluted earnings per share Shares outstanding per the Condensed Consolidated Balance Sheet in the Company's Form 10-Q for the quarter ended June 30, 2026. The warrants were issued to affiliates of Fortress in connection with the Fortress Credit Agreement at an exercise price of $0.01 per share and were treated as outstanding for earnings per share purposes. The share repurchase and the warrant cancellation occurred subsequent to the June 30, 2026 quarter end; the Form 10-Q cover page reports 25,023,865 shares outstanding as of July 31, 2026. Stock option balances are as of December 31, 2025 per the 2025 Form 10-K; no options were exercised during the six months ended June 30, 2026. Unrecognized share-based compensation associated with these options was $349,145 at December 31, 2025, expected to be amortized over a weighted-average 1.57 years. Approximately $2.3M remains available under the $4.0M authorization, which has no fixed expiration date. © 2026, Galaxy Gaming, Inc. All rights reserved. Share count Shares Common shares outstanding at June 30, 2026 25,354,623 Fortress warrants outstanding, $0.01 exercise price 778,320 Shares used for earnings per share 26,132,943 Less: shares repurchased July 31, 2026 (330,758) Less: warrants cancelled August 2026 (778,320) Shares outstanding after both actions 25,023,865 1,109,078 shares removed — 4.2% of the share count used for earnings per share OPTION OVERHANG AT DECEMBER 31, 2025 1,245,001 options outstanding $2.30 wtd. avg. strike 713,333 exercisable Diluted shares equalled basic shares in Q2 2026. Diluted share count reduced in Q3 2026 330,758 shares repurchased Privately negotiated with a shareholder on July 31, 2026 at approximately $1.55 per share, $0.5M in total 778,320 warrants cancelled All Fortress warrants retired in August 2026 for approximately $1.2M, eliminating the $0.01 strike overhang $2.3M authorization remaining Of the $4.0M repurchase program authorized July 22, 2026, which has no fixed expiration date
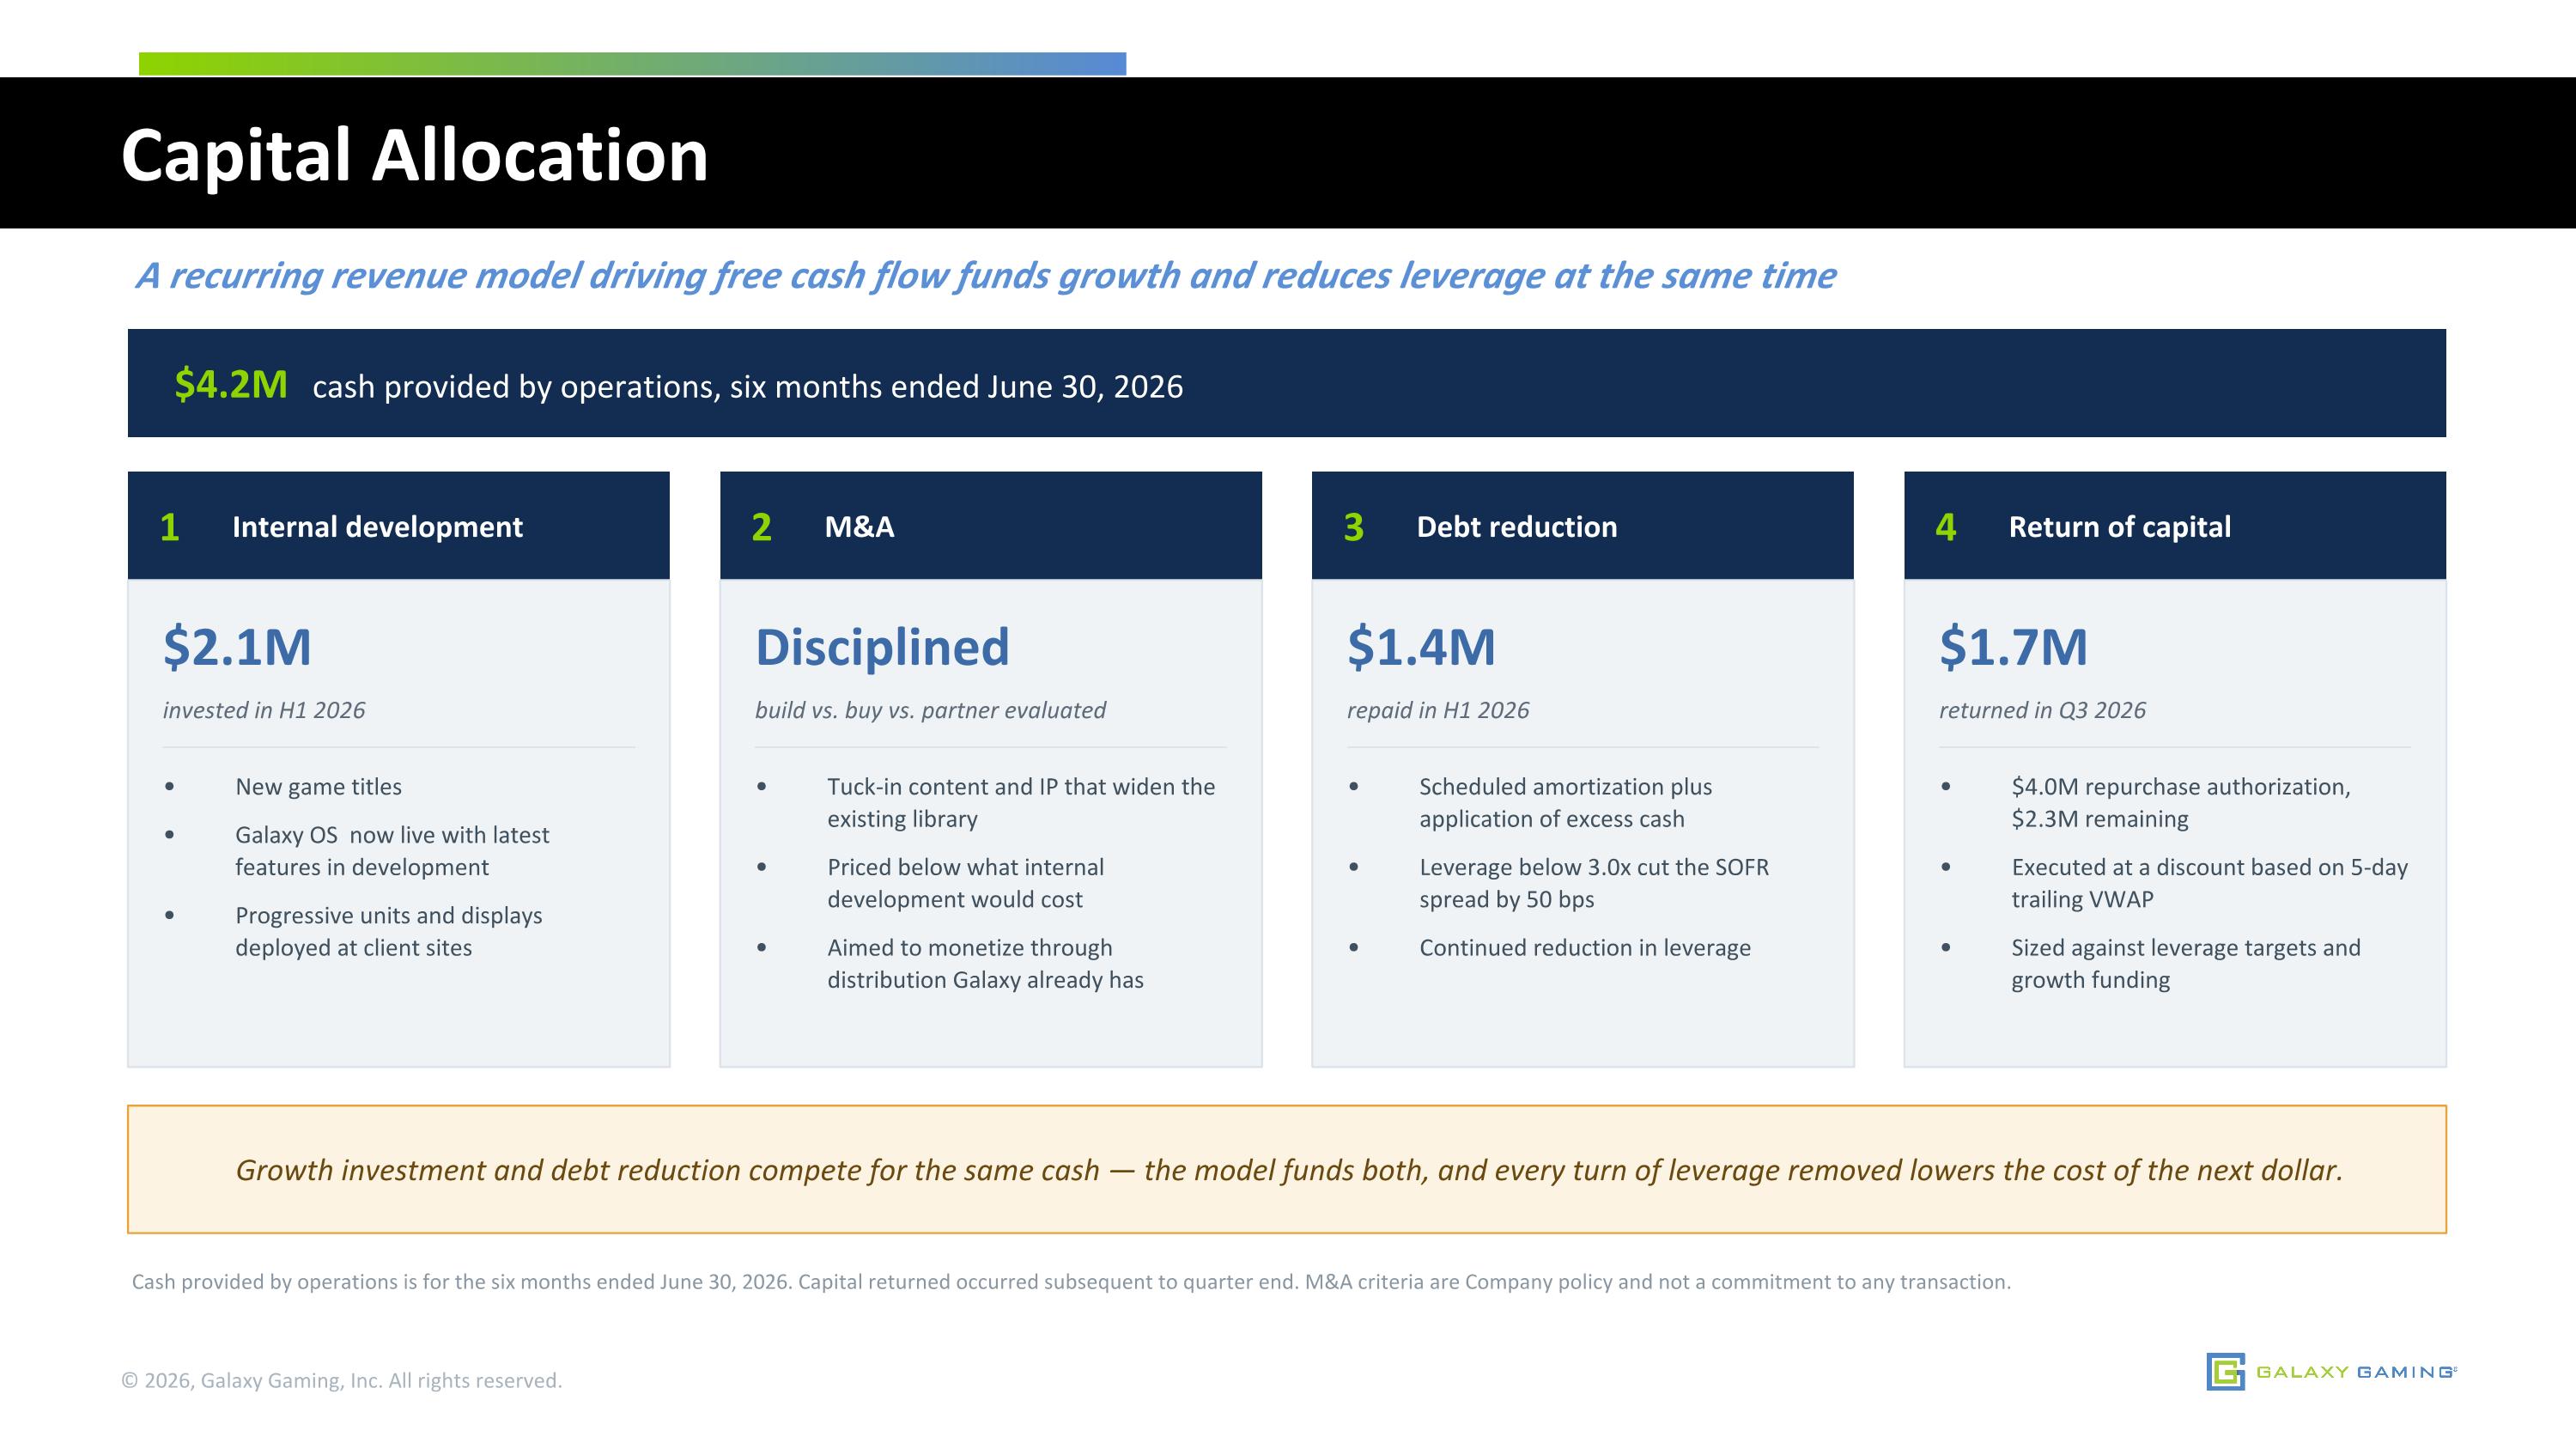
Capital Allocation A recurring revenue model driving free cash flow funds growth and reduces leverage at the same time Cash provided by operations is for the six months ended June 30, 2026. Capital returned occurred subsequent to quarter end. M&A criteria are Company policy and not a commitment to any transaction. © 2026, Galaxy Gaming, Inc. All rights reserved. $4.2M cash provided by operations, six months ended June 30, 2026 1 Internal development $2.1M invested in H1 2026 New game titles Galaxy OS now live with latest features in development Progressive units and displays deployed at client sites 2 M&A Disciplined build vs. buy vs. partner evaluated Tuck-in content and IP that widen the existing library Priced below what internal development would cost Aimed to monetize through distribution Galaxy already has 3 Debt reduction $1.4M repaid in H1 2026 Scheduled amortization plus application of excess cash Leverage below 3.0x cut the SOFR spread by 50 bps Continued reduction in leverage 4 Return of capital $1.7M returned in Q3 2026 $4.0M repurchase authorization, $2.3M remaining Executed at a discount based on 5-day trailing VWAP Sized against leverage targets and growth funding Growth investment and debt reduction compete for the same cash — the model funds both, and every turn of leverage removed lowers the cost of the next dollar.
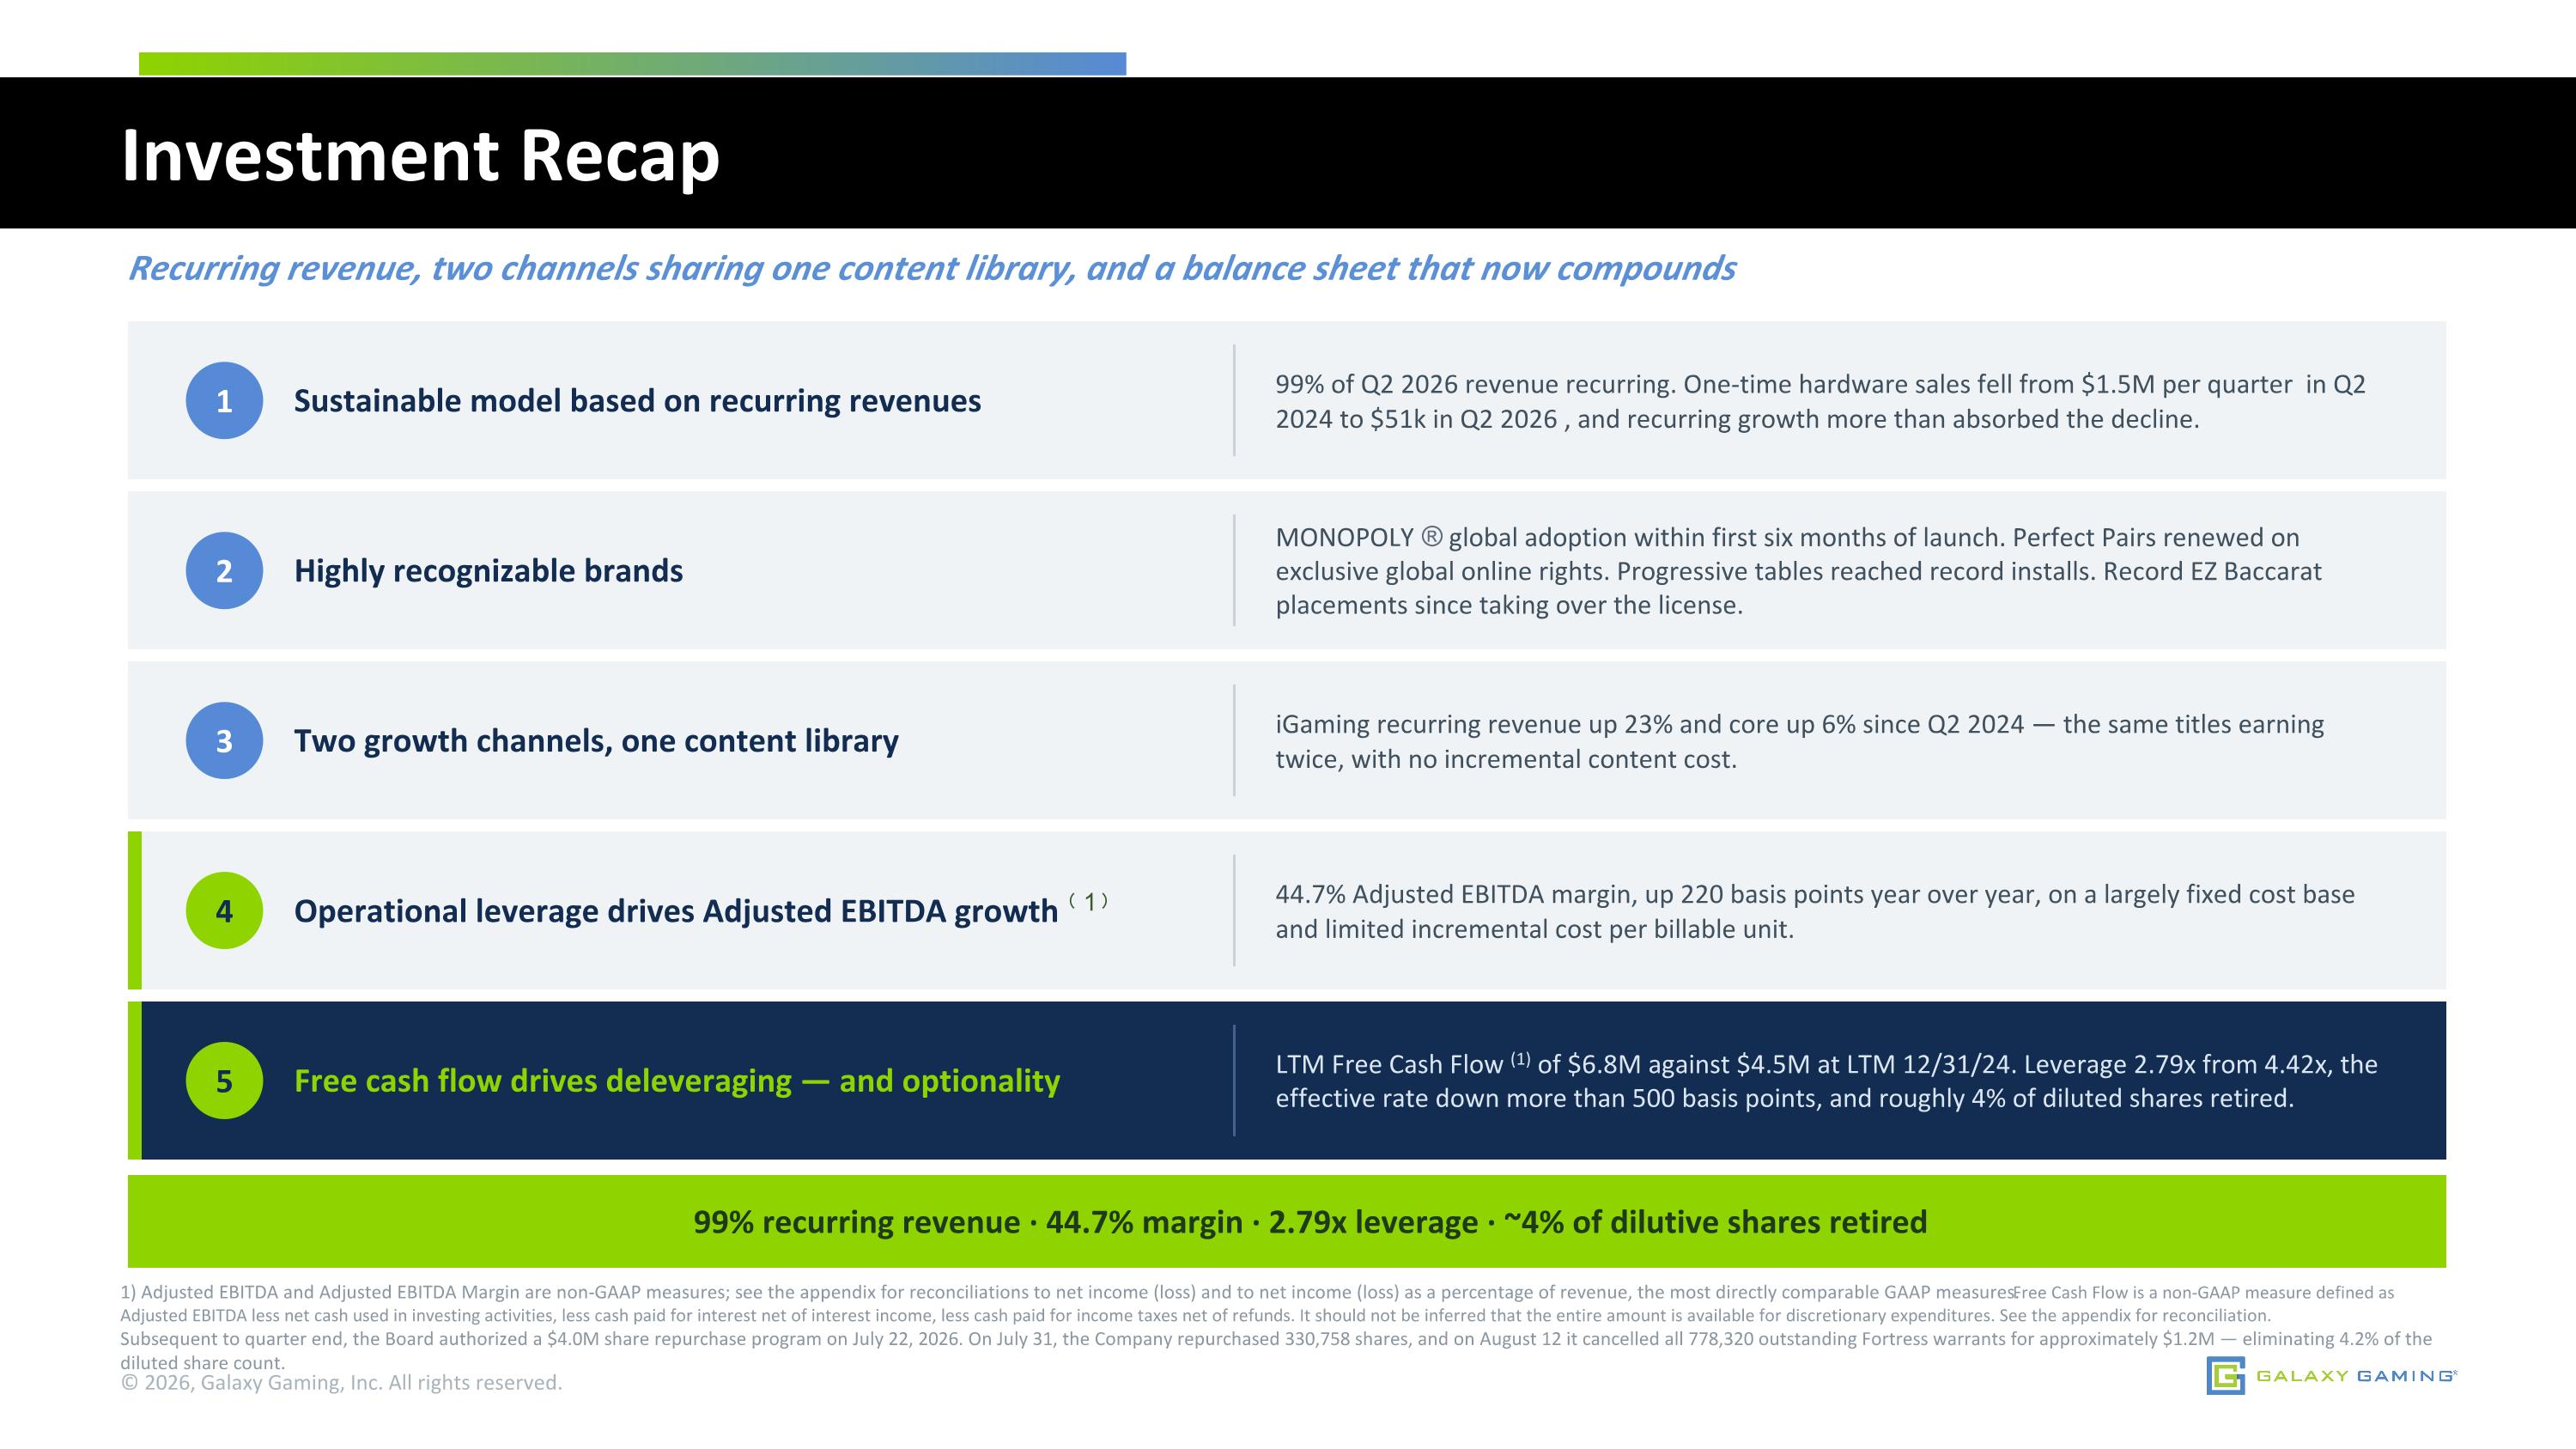
Investment Recap Recurring revenue, two channels sharing one content library, and a balance sheet that now compounds 1) Adjusted EBITDA and Adjusted EBITDA Margin are non-GAAP measures; see the appendix for reconciliations to net income (loss) and to net income (loss) as a percentage of revenue, the most directly comparable GAAP measures. Free Cash Flow is a non-GAAP measure defined as Adjusted EBITDA less net cash used in investing activities, less cash paid for interest net of interest income, less cash paid for income taxes net of refunds. It should not be inferred that the entire amount is available for discretionary expenditures. See the appendix for reconciliation. Subsequent to quarter end, the Board authorized a $4.0M share repurchase program on July 22, 2026. On July 31, the Company repurchased 330,758 shares, and on August 12 it cancelled all 778,320 outstanding Fortress warrants for approximately $1.2M — eliminating 4.2% of the diluted share count. © 2026, Galaxy Gaming, Inc. All rights reserved. 1 Sustainable model based on recurring revenues 99% of Q2 2026 revenue recurring. One-time hardware sales fell from $1.5M per quarter in Q2 2024 to $51k in Q2 2026 , and recurring growth more than absorbed the decline. 2 Highly recognizable brands MONOPOLY ® global adoption within first six months of launch. Perfect Pairs renewed on exclusive global online rights. Progressive tables reached record installs. Record EZ Baccarat placements since taking over the license. 3 Two growth channels, one content library iGaming recurring revenue up 23% and core up 6% since Q2 2024 — the same titles earning twice, with no incremental content cost. 4 Operational leverage drives Adjusted EBITDA growth ⁽1⁾ 44.7% Adjusted EBITDA margin, up 220 basis points year over year, on a largely fixed cost base and limited incremental cost per billable unit. 5 Free cash flow drives deleveraging — and optionality LTM Free Cash Flow (1) of $6.8M against $4.5M at LTM 12/31/24. Leverage 2.79x from 4.42x, the effective rate down more than 500 basis points, and roughly 4% of diluted shares retired. 99% recurring revenue · 44.7% margin · 2.79x leverage · ~4% of dilutive shares retired
Non-GAAP Financial Measures © 2026, Galaxy Gaming, Inc. All rights reserved. In order to enhance investor understanding of the underlying trends in our business, we present in this presentation Adjusted Earnings Before Interest, Taxes, Depreciation and Amortization (“Adjusted EBITDA”), Adjusted EBITDA Margin and Free Cash Flow (“FCF”), which are not measures of our financial performance or position under United States Generally Accepted Accounting Principles (“U.S. GAAP”). These measures should be read in conjunction with our net income (loss), operating income, and cash flow data prepared in accordance with U.S. GAAP. Adjusted EBITDA includes adjustments to U.S. GAAP net income (loss) to exclude interest, income taxes, depreciation, amortization, stock-based compensation, foreign currency exchange loss (gain), and severance and other expenses related to litigation, non-income tax assessments, and other adjustments to reflect changes that occur in our business but do not represent ongoing operations, including loss on extinguishment of debt, each of which is identified and defined in the reconciliations that follow. Adjusted EBITDA is used by management to evaluate our operating performance. Management believes that disclosure of the Adjusted EBITDA metric offers investors, regulators and other stakeholders a view of our operations in the same manner management evaluates our performance. When combined with U.S. GAAP results, management believes Adjusted EBITDA provides a comprehensive understanding of our financial results. Adjusted EBITDA should not be considered as an alternative to net income or (loss) to net cash provided by operating activities as a measure of operating results or of liquidity. It may not be comparable to similarly titled measures used by other companies, and it excludes financial information that some may consider important in evaluating our performance. We define Adjusted EBITDA Margin as Adjusted EBITDA divided by revenue. Adjusted EBITDA Margin is not a measure of performance defined in accordance with U.S. GAAP. The most directly comparable U.S. GAAP measure is net income (loss) as a percentage of revenue. Management uses Adjusted EBITDA Margin to evaluate the operating leverage in the business across periods, and believes disclosure of the measure provides investors, regulators and other stakeholders with useful information for the same purpose. Adjusted EBITDA Margin should not be considered as an alternative to net income (loss) as a percentage of revenue as a measure of operating performance. It may not be comparable to similarly titled measures used by other companies. We define Free Cash Flow as Adjusted EBITDA less cash paid for interest, net of interest income received, cash used in investing activities, and cash paid for income taxes, net of refunds. Management uses Free Cash Flow to evaluate the cash generated by our operations that is available to service and repay indebtedness and to reinvest in the business, and believes disclosure of Free Cash Flow provides investors, regulators and other stakeholders with useful information for the same purpose. Free Cash Flow should not be considered an alternative to net income (loss) as a measure of operating performance, or to net cash provided by operating activities as a measure of liquidity. It should not be inferred that the entire Free Cash Flow amount is available for discretionary expenditures. Free Cash Flow may not be comparable to similarly titled measures used by other companies. A reconciliation of U.S. GAAP net income (loss) to Adjusted EBITDA and to Free Cash Flow, and of net income (loss) as a percentage of revenue to Adjusted EBITDA Margin, is presented in the appendix.
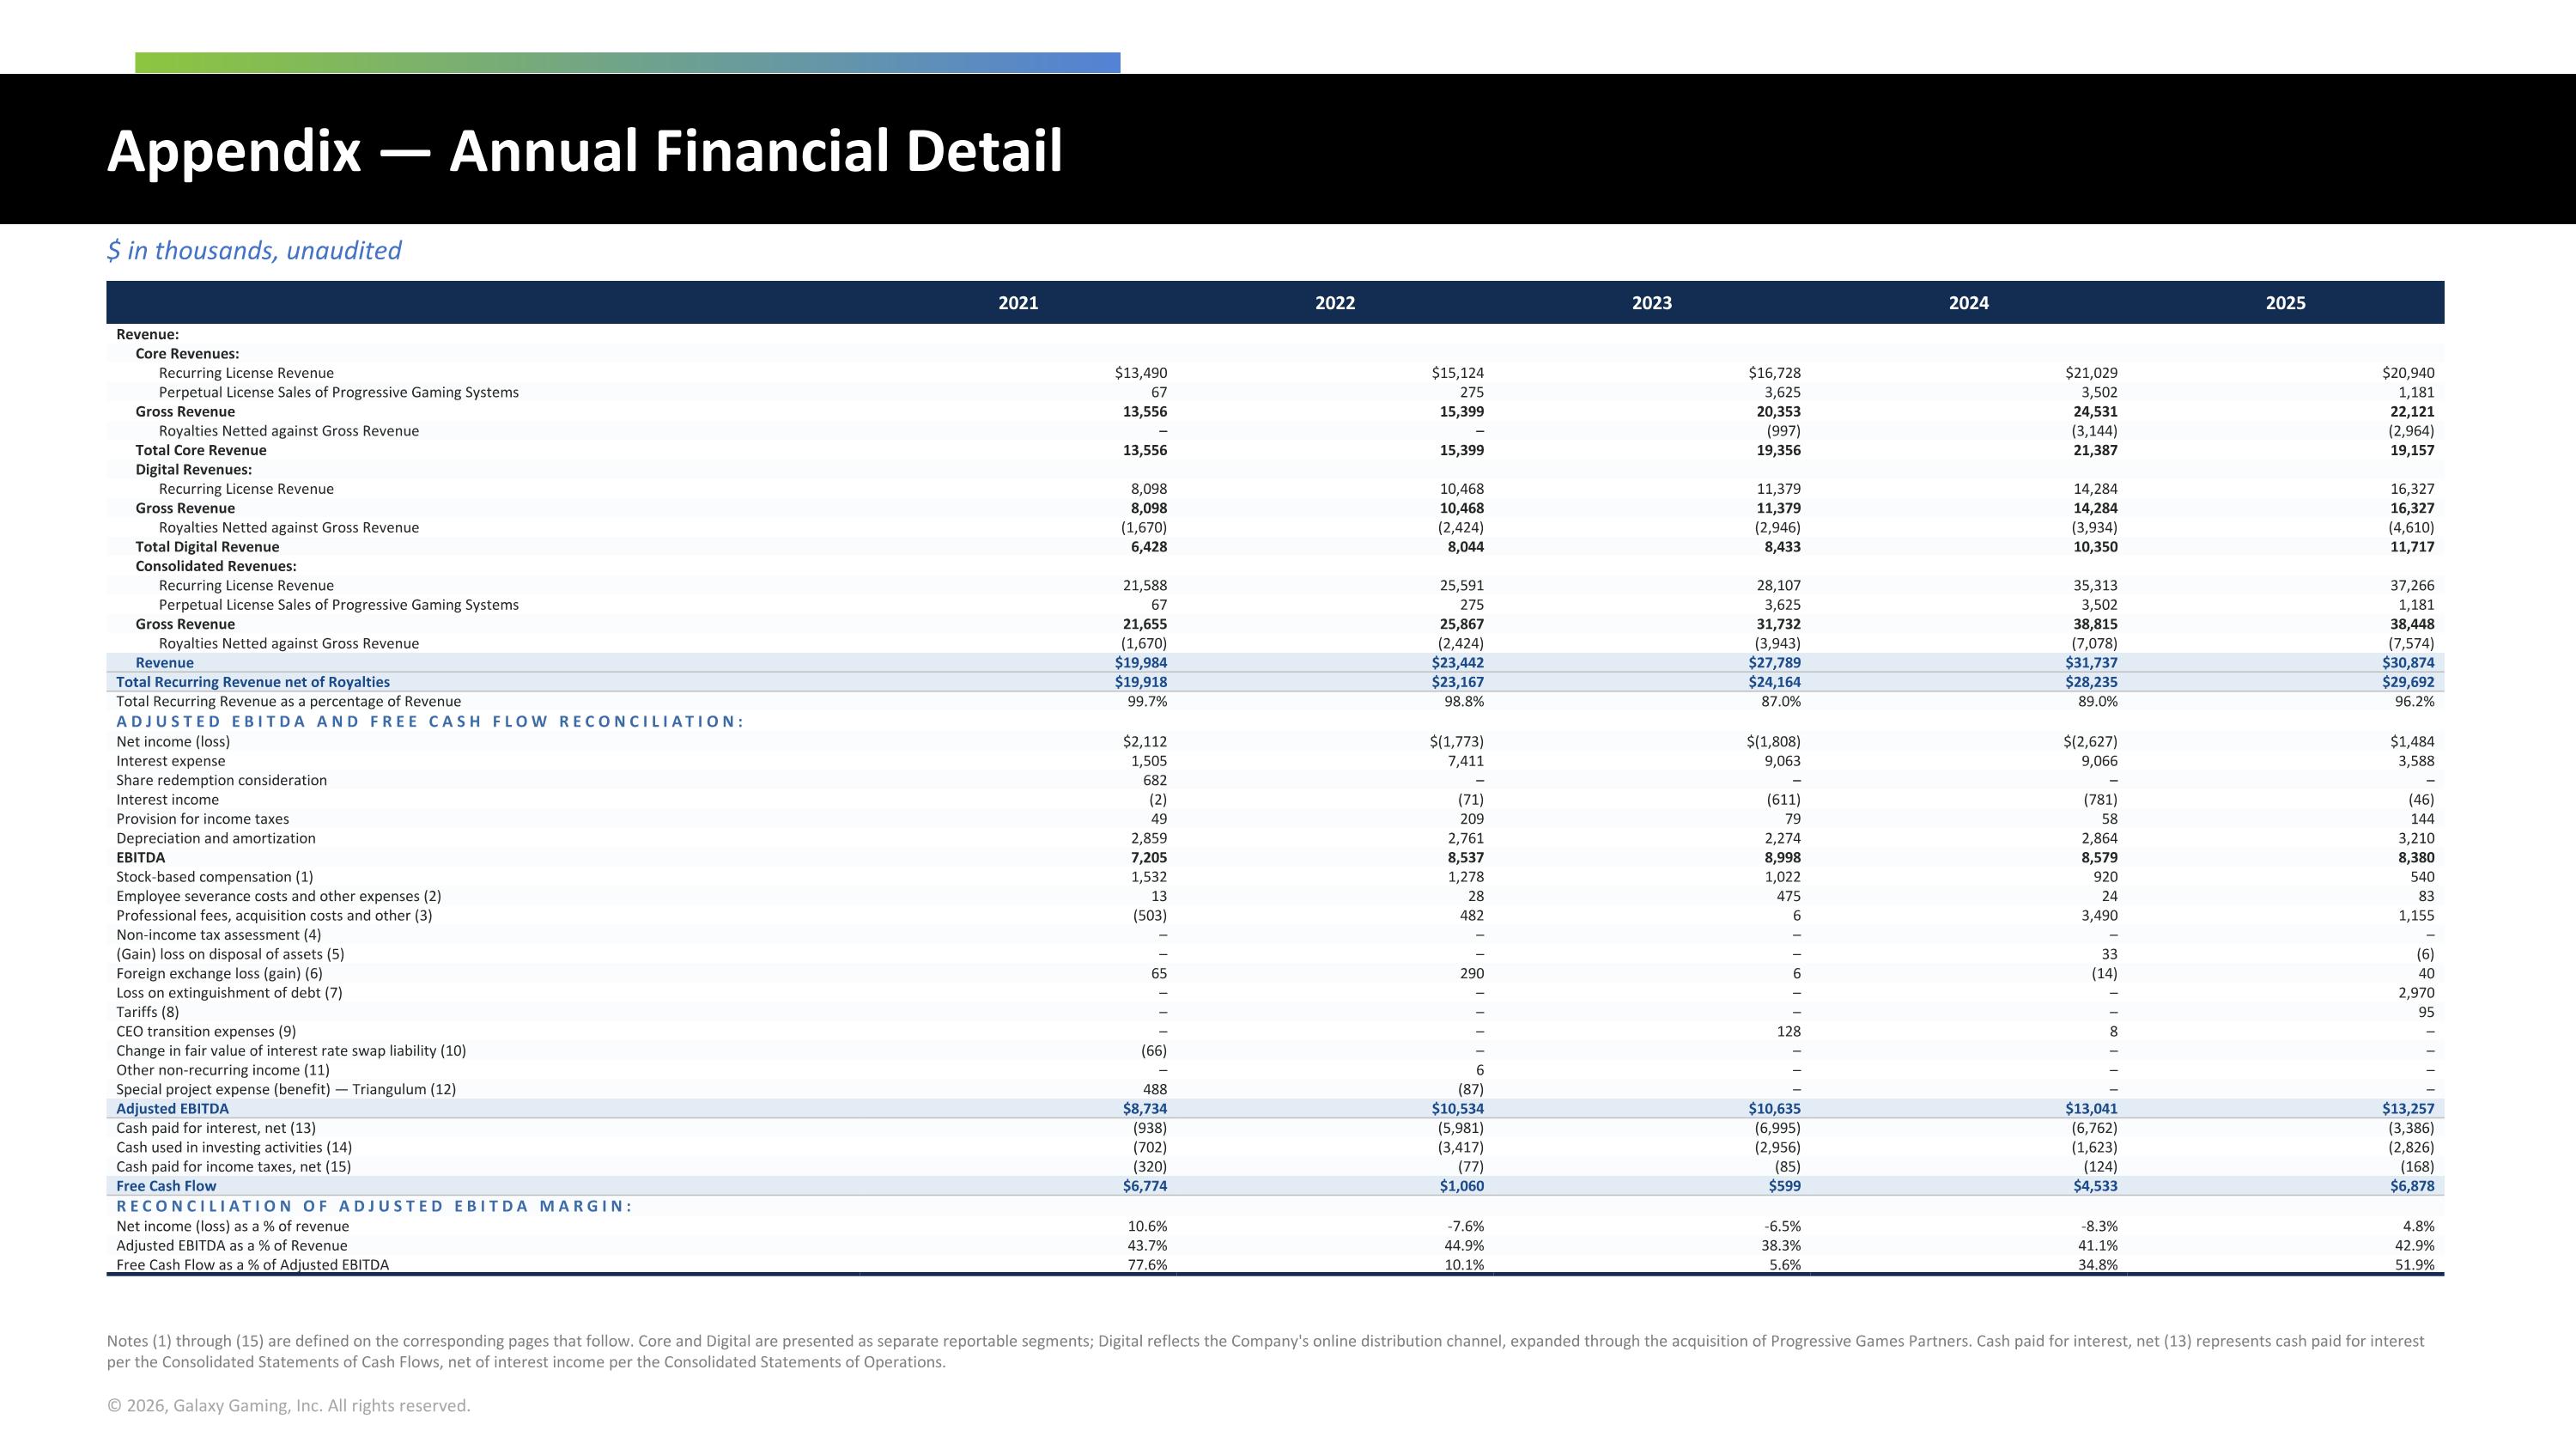
Appendix — Annual Financial Detail $ in thousands, unaudited 2021 2022 2023 2024 2025 Revenue: Core Revenues: Recurring License Revenue $13,490 $15,124 $16,728 $21,029 $20,940 Perpetual License Sales of Progressive Gaming Systems 67 275 3,625 3,502 1,181 Gross Revenue 13,556 15,399 20,353 24,531 22,121 Royalties Netted against Gross Revenue – – (997) (3,144) (2,964) Total Core Revenue 13,556 15,399 19,356 21,387 19,157 Digital Revenues: Recurring License Revenue 8,098 10,468 11,379 14,284 16,327 Gross Revenue 8,098 10,468 11,379 14,284 16,327 Royalties Netted against Gross Revenue (1,670) (2,424) (2,946) (3,934) (4,610) Total Digital Revenue 6,428 8,044 8,433 10,350 11,717 Consolidated Revenues: Recurring License Revenue 21,588 25,591 28,107 35,313 37,266 Perpetual License Sales of Progressive Gaming Systems 67 275 3,625 3,502 1,181 Gross Revenue 21,655 25,867 31,732 38,815 38,448 Royalties Netted against Gross Revenue (1,670) (2,424) (3,943) (7,078) (7,574) Revenue $19,984 $23,442 $27,789 $31,737 $30,874 Total Recurring Revenue net of Royalties $19,918 $23,167 $24,164 $28,235 $29,692 Total Recurring Revenue as a percentage of Revenue 99.7% 98.8% 87.0% 89.0% 96.2% ADJUSTED EBITDA AND FREE CASH FLOW RECONCILIATION: Net income (loss) $2,112 $(1,773) $(1,808) $(2,627) $1,484 Interest expense 1,505 7,411 9,063 9,066 3,588 Share redemption consideration 682 – – – – Interest income (2) (71) (611) (781) (46) Provision for income taxes 49 209 79 58 144 Depreciation and amortization 2,859 2,761 2,274 2,864 3,210 EBITDA 7,205 8,537 8,998 8,579 8,380 Stock-based compensation (1) 1,532 1,278 1,022 920 540 Employee severance costs and other expenses (2) 13 28 475 24 83 Professional fees, acquisition costs and other (3) (503) 482 6 3,490 1,155 Non-income tax assessment (4) – – – – – (Gain) loss on disposal of assets (5) – – – 33 (6) Foreign exchange loss (gain) (6) 65 290 6 (14) 40 Loss on extinguishment of debt (7) – – – – 2,970 Tariffs (8) – – – – 95 CEO transition expenses (9) – – 128 8 – Change in fair value of interest rate swap liability (10) (66) – – – – Other non-recurring income (11) – 6 – – – Special project expense (benefit) — Triangulum (12) 488 (87) – – – Adjusted EBITDA $8,734 $10,534 $10,635 $13,041 $13,257 Cash paid for interest, net (13) (938) (5,981) (6,995) (6,762) (3,386) Cash used in investing activities (14) (702) (3,417) (2,956) (1,623) (2,826) Cash paid for income taxes, net (15) (320) (77) (85) (124) (168) Free Cash Flow $6,774 $1,060 $599 $4,533 $6,878 RECONCILIATION OF ADJUSTED EBITDA MARGIN: Net income (loss) as a % of revenue 10.6% -7.6% -6.5% -8.3% 4.8% Adjusted EBITDA as a % of Revenue 43.7% 44.9% 38.3% 41.1% 42.9% Free Cash Flow as a % of Adjusted EBITDA 77.6% 10.1% 5.6% 34.8% 51.9% Notes (1) through (15) are defined on the corresponding pages that follow. Core and Digital are presented as separate reportable segments; Digital reflects the Company's online distribution channel, expanded through the acquisition of Progressive Games Partners. Cash paid for interest, net (13) represents cash paid for interest per the Consolidated Statements of Cash Flows, net of interest income per the Consolidated Statements of Operations.
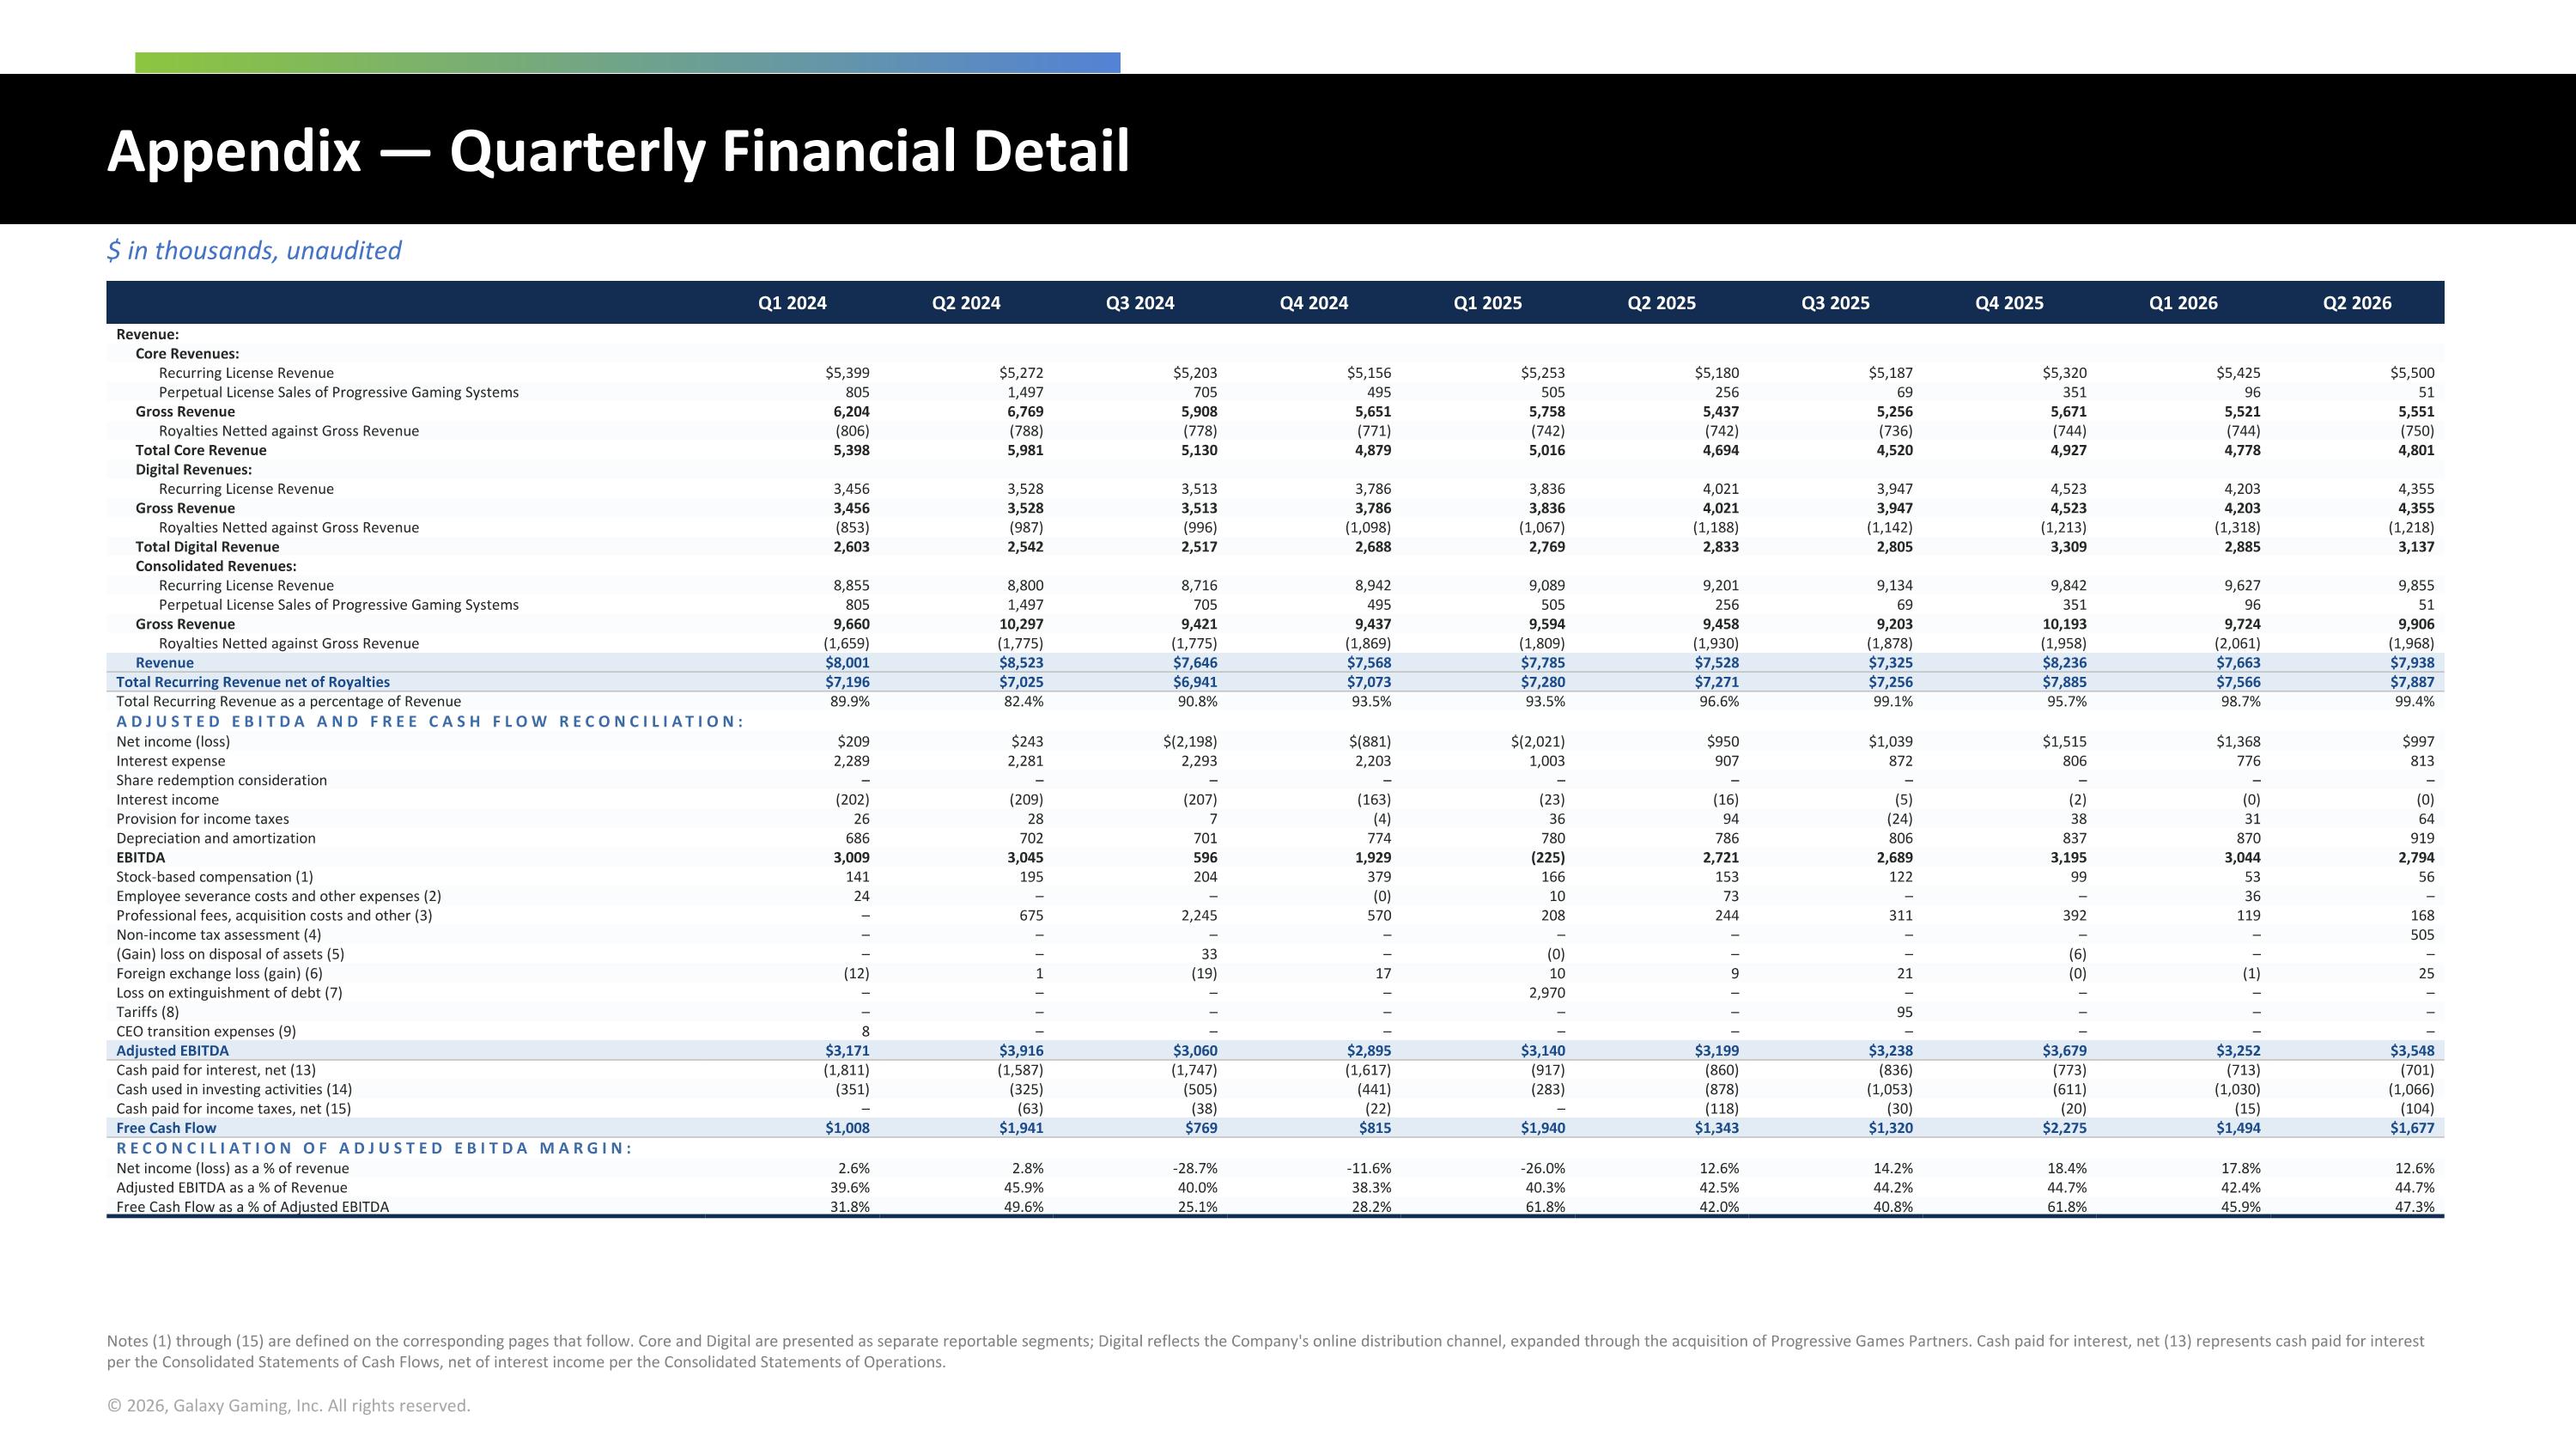
Appendix — Quarterly Financial Detail $ in thousands, unaudited Q1 2024 Q2 2024 Q3 2024 Q4 2024 Q1 2025 Q2 2025 Q3 2025 Q4 2025 Q1 2026 Q2 2026 Revenue: Core Revenues: Recurring License Revenue $5,399 $5,272 $5,203 $5,156 $5,253 $5,180 $5,187 $5,320 $5,425 $5,500 Perpetual License Sales of Progressive Gaming Systems 805 1,497 705 495 505 256 69 351 96 51 Gross Revenue 6,204 6,769 5,908 5,651 5,758 5,437 5,256 5,671 5,521 5,551 Royalties Netted against Gross Revenue (806) (788) (778) (771) (742) (742) (736) (744) (744) (750) Total Core Revenue 5,398 5,981 5,130 4,879 5,016 4,694 4,520 4,927 4,778 4,801 Digital Revenues: Recurring License Revenue 3,456 3,528 3,513 3,786 3,836 4,021 3,947 4,523 4,203 4,355 Gross Revenue 3,456 3,528 3,513 3,786 3,836 4,021 3,947 4,523 4,203 4,355 Royalties Netted against Gross Revenue (853) (987) (996) (1,098) (1,067) (1,188) (1,142) (1,213) (1,318) (1,218) Total Digital Revenue 2,603 2,542 2,517 2,688 2,769 2,833 2,805 3,309 2,885 3,137 Consolidated Revenues: Recurring License Revenue 8,855 8,800 8,716 8,942 9,089 9,201 9,134 9,842 9,627 9,855 Perpetual License Sales of Progressive Gaming Systems 805 1,497 705 495 505 256 69 351 96 51 Gross Revenue 9,660 10,297 9,421 9,437 9,594 9,458 9,203 10,193 9,724 9,906 Royalties Netted against Gross Revenue (1,659) (1,775) (1,775) (1,869) (1,809) (1,930) (1,878) (1,958) (2,061) (1,968) Revenue $8,001 $8,523 $7,646 $7,568 $7,785 $7,528 $7,325 $8,236 $7,663 $7,938 Total Recurring Revenue net of Royalties $7,196 $7,025 $6,941 $7,073 $7,280 $7,271 $7,256 $7,885 $7,566 $7,887 Total Recurring Revenue as a percentage of Revenue 89.9% 82.4% 90.8% 93.5% 93.5% 96.6% 99.1% 95.7% 98.7% 99.4% ADJUSTED EBITDA AND FREE CASH FLOW RECONCILIATION: Net income (loss) $209 $243 $(2,198) $(881) $(2,021) $950 $1,039 $1,515 $1,368 $997 Interest expense 2,289 2,281 2,293 2,203 1,003 907 872 806 776 813 Share redemption consideration – – – – – – – – – – Interest income (202) (209) (207) (163) (23) (16) (5) (2) (0) (0) Provision for income taxes 26 28 7 (4) 36 94 (24) 38 31 64 Depreciation and amortization 686 702 701 774 780 786 806 837 870 919 EBITDA 3,009 3,045 596 1,929 (225) 2,721 2,689 3,195 3,044 2,794 Stock-based compensation (1) 141 195 204 379 166 153 122 99 53 56 Employee severance costs and other expenses (2) 24 – – (0) 10 73 – – 36 – Professional fees, acquisition costs and other (3) – 675 2,245 570 208 244 311 392 119 168 Non-income tax assessment (4) – – – – – – – – – 505 (Gain) loss on disposal of assets (5) – – 33 – (0) – – (6) – – Foreign exchange loss (gain) (6) (12) 1 (19) 17 10 9 21 (0) (1) 25 Loss on extinguishment of debt (7) – – – – 2,970 – – – – – Tariffs (8) – – – – – – 95 – – – CEO transition expenses (9) 8 – – – – – – – – – Adjusted EBITDA $3,171 $3,916 $3,060 $2,895 $3,140 $3,199 $3,238 $3,679 $3,252 $3,548 Cash paid for interest, net (13) (1,811) (1,587) (1,747) (1,617) (917) (860) (836) (773) (713) (701) Cash used in investing activities (14) (351) (325) (505) (441) (283) (878) (1,053) (611) (1,030) (1,066) Cash paid for income taxes, net (15) – (63) (38) (22) – (118) (30) (20) (15) (104) Free Cash Flow $1,008 $1,941 $769 $815 $1,940 $1,343 $1,320 $2,275 $1,494 $1,677 RECONCILIATION OF ADJUSTED EBITDA MARGIN: Net income (loss) as a % of revenue 2.6% 2.8% -28.7% -11.6% -26.0% 12.6% 14.2% 18.4% 17.8% 12.6% Adjusted EBITDA as a % of Revenue 39.6% 45.9% 40.0% 38.3% 40.3% 42.5% 44.2% 44.7% 42.4% 44.7% Free Cash Flow as a % of Adjusted EBITDA 31.8% 49.6% 25.1% 28.2% 61.8% 42.0% 40.8% 61.8% 45.9% 47.3% Notes (1) through (15) are defined on the corresponding pages that follow. Core and Digital are presented as separate reportable segments; Digital reflects the Company's online distribution channel, expanded through the acquisition of Progressive Games Partners. Cash paid for interest, net (13) represents cash paid for interest per the Consolidated Statements of Cash Flows, net of interest income per the Consolidated Statements of Operations.
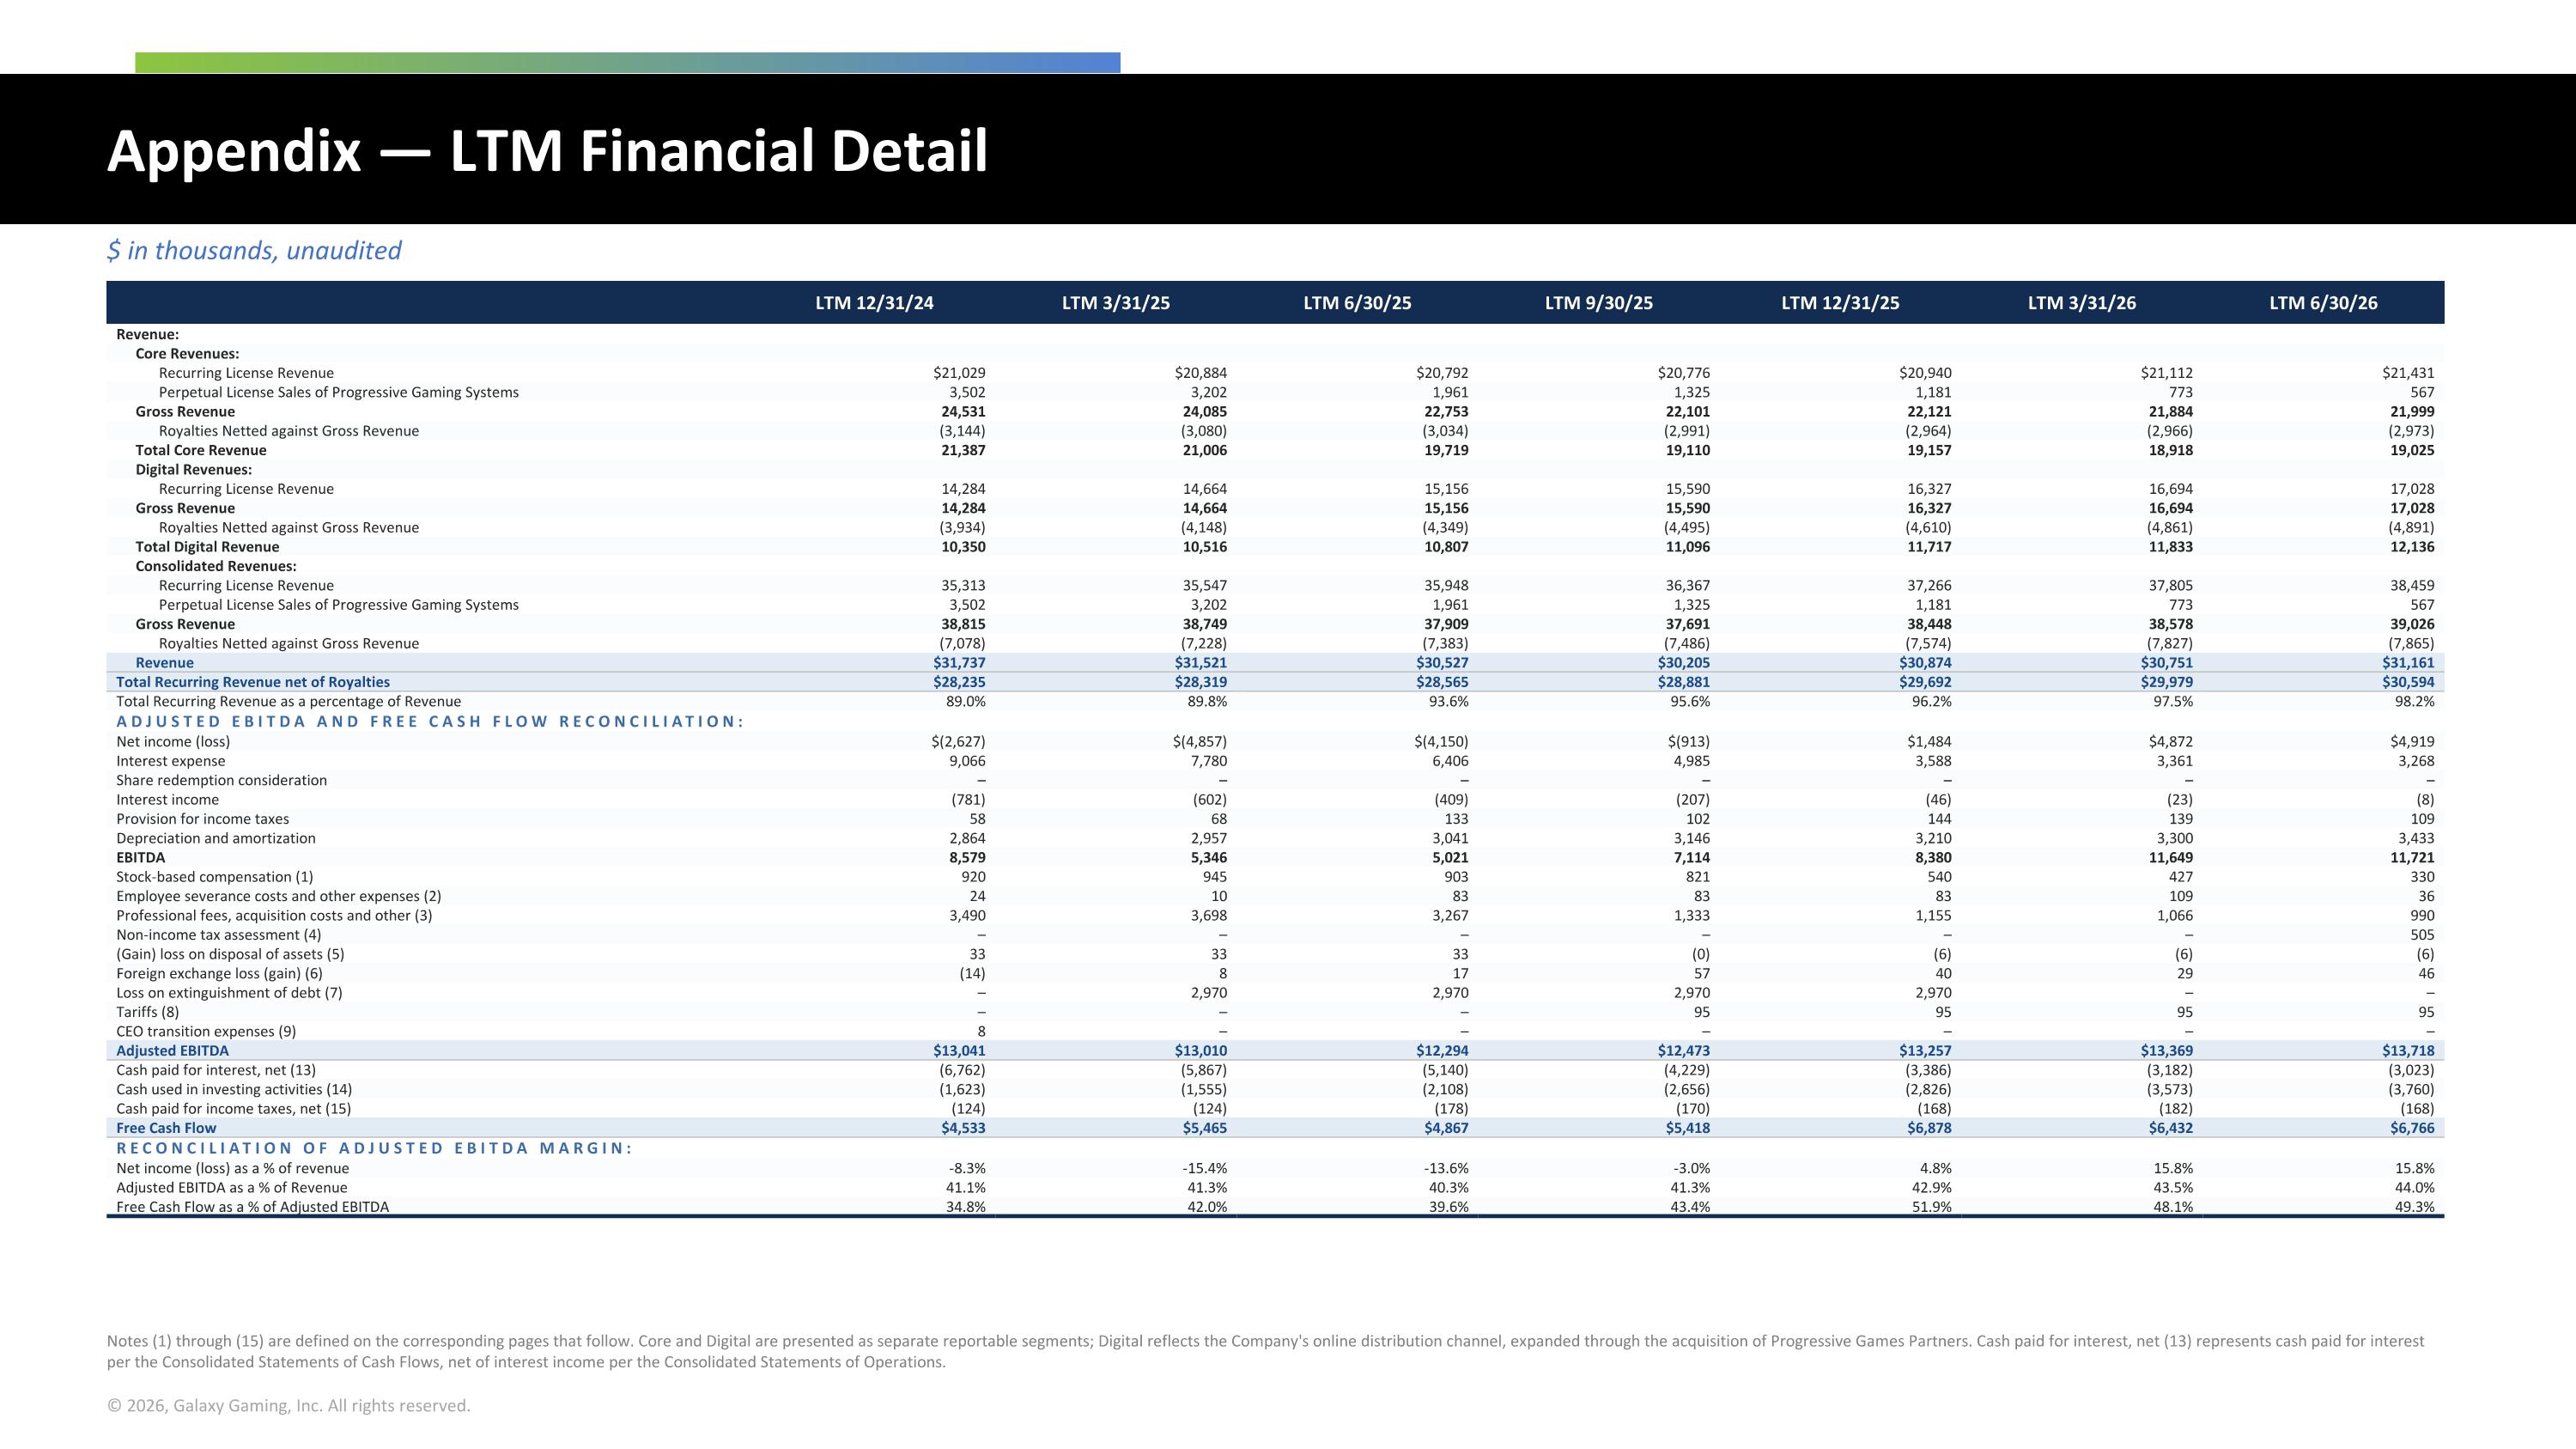
Appendix — LTM Financial Detail $ in thousands, unaudited LTM 12/31/24 LTM 3/31/25 LTM 6/30/25 LTM 9/30/25 LTM 12/31/25 LTM 3/31/26 LTM 6/30/26 Revenue: Core Revenues: Recurring License Revenue $21,029 $20,884 $20,792 $20,776 $20,940 $21,112 $21,431 Perpetual License Sales of Progressive Gaming Systems 3,502 3,202 1,961 1,325 1,181 773 567 Gross Revenue 24,531 24,085 22,753 22,101 22,121 21,884 21,999 Royalties Netted against Gross Revenue (3,144) (3,080) (3,034) (2,991) (2,964) (2,966) (2,973) Total Core Revenue 21,387 21,006 19,719 19,110 19,157 18,918 19,025 Digital Revenues: Recurring License Revenue 14,284 14,664 15,156 15,590 16,327 16,694 17,028 Gross Revenue 14,284 14,664 15,156 15,590 16,327 16,694 17,028 Royalties Netted against Gross Revenue (3,934) (4,148) (4,349) (4,495) (4,610) (4,861) (4,891) Total Digital Revenue 10,350 10,516 10,807 11,096 11,717 11,833 12,136 Consolidated Revenues: Recurring License Revenue 35,313 35,547 35,948 36,367 37,266 37,805 38,459 Perpetual License Sales of Progressive Gaming Systems 3,502 3,202 1,961 1,325 1,181 773 567 Gross Revenue 38,815 38,749 37,909 37,691 38,448 38,578 39,026 Royalties Netted against Gross Revenue (7,078) (7,228) (7,383) (7,486) (7,574) (7,827) (7,865) Revenue $31,737 $31,521 $30,527 $30,205 $30,874 $30,751 $31,161 Total Recurring Revenue net of Royalties $28,235 $28,319 $28,565 $28,881 $29,692 $29,979 $30,594 Total Recurring Revenue as a percentage of Revenue 89.0% 89.8% 93.6% 95.6% 96.2% 97.5% 98.2% ADJUSTED EBITDA AND FREE CASH FLOW RECONCILIATION: Net income (loss) $(2,627) $(4,857) $(4,150) $(913) $1,484 $4,872 $4,919 Interest expense 9,066 7,780 6,406 4,985 3,588 3,361 3,268 Share redemption consideration – – – – – – – Interest income (781) (602) (409) (207) (46) (23) (8) Provision for income taxes 58 68 133 102 144 139 109 Depreciation and amortization 2,864 2,957 3,041 3,146 3,210 3,300 3,433 EBITDA 8,579 5,346 5,021 7,114 8,380 11,649 11,721 Stock-based compensation (1) 920 945 903 821 540 427 330 Employee severance costs and other expenses (2) 24 10 83 83 83 109 36 Professional fees, acquisition costs and other (3) 3,490 3,698 3,267 1,333 1,155 1,066 990 Non-income tax assessment (4) – – – – – – 505 (Gain) loss on disposal of assets (5) 33 33 33 (0) (6) (6) (6) Foreign exchange loss (gain) (6) (14) 8 17 57 40 29 46 Loss on extinguishment of debt (7) – 2,970 2,970 2,970 2,970 – – Tariffs (8) – – – 95 95 95 95 CEO transition expenses (9) 8 – – – – – – Adjusted EBITDA $13,041 $13,010 $12,294 $12,473 $13,257 $13,369 $13,718 Cash paid for interest, net (13) (6,762) (5,867) (5,140) (4,229) (3,386) (3,182) (3,023) Cash used in investing activities (14) (1,623) (1,555) (2,108) (2,656) (2,826) (3,573) (3,760) Cash paid for income taxes, net (15) (124) (124) (178) (170) (168) (182) (168) Free Cash Flow $4,533 $5,465 $4,867 $5,418 $6,878 $6,432 $6,766 RECONCILIATION OF ADJUSTED EBITDA MARGIN: Net income (loss) as a % of revenue -8.3% -15.4% -13.6% -3.0% 4.8% 15.8% 15.8% Adjusted EBITDA as a % of Revenue 41.1% 41.3% 40.3% 41.3% 42.9% 43.5% 44.0% Free Cash Flow as a % of Adjusted EBITDA 34.8% 42.0% 39.6% 43.4% 51.9% 48.1% 49.3% Notes (1) through (15) are defined on the corresponding pages that follow. Core and Digital are presented as separate reportable segments; Digital reflects the Company's online distribution channel, expanded through the acquisition of Progressive Games Partners. Cash paid for interest, net (13) represents cash paid for interest per the Consolidated Statements of Cash Flows, net of interest income per the Consolidated Statements of Operations.
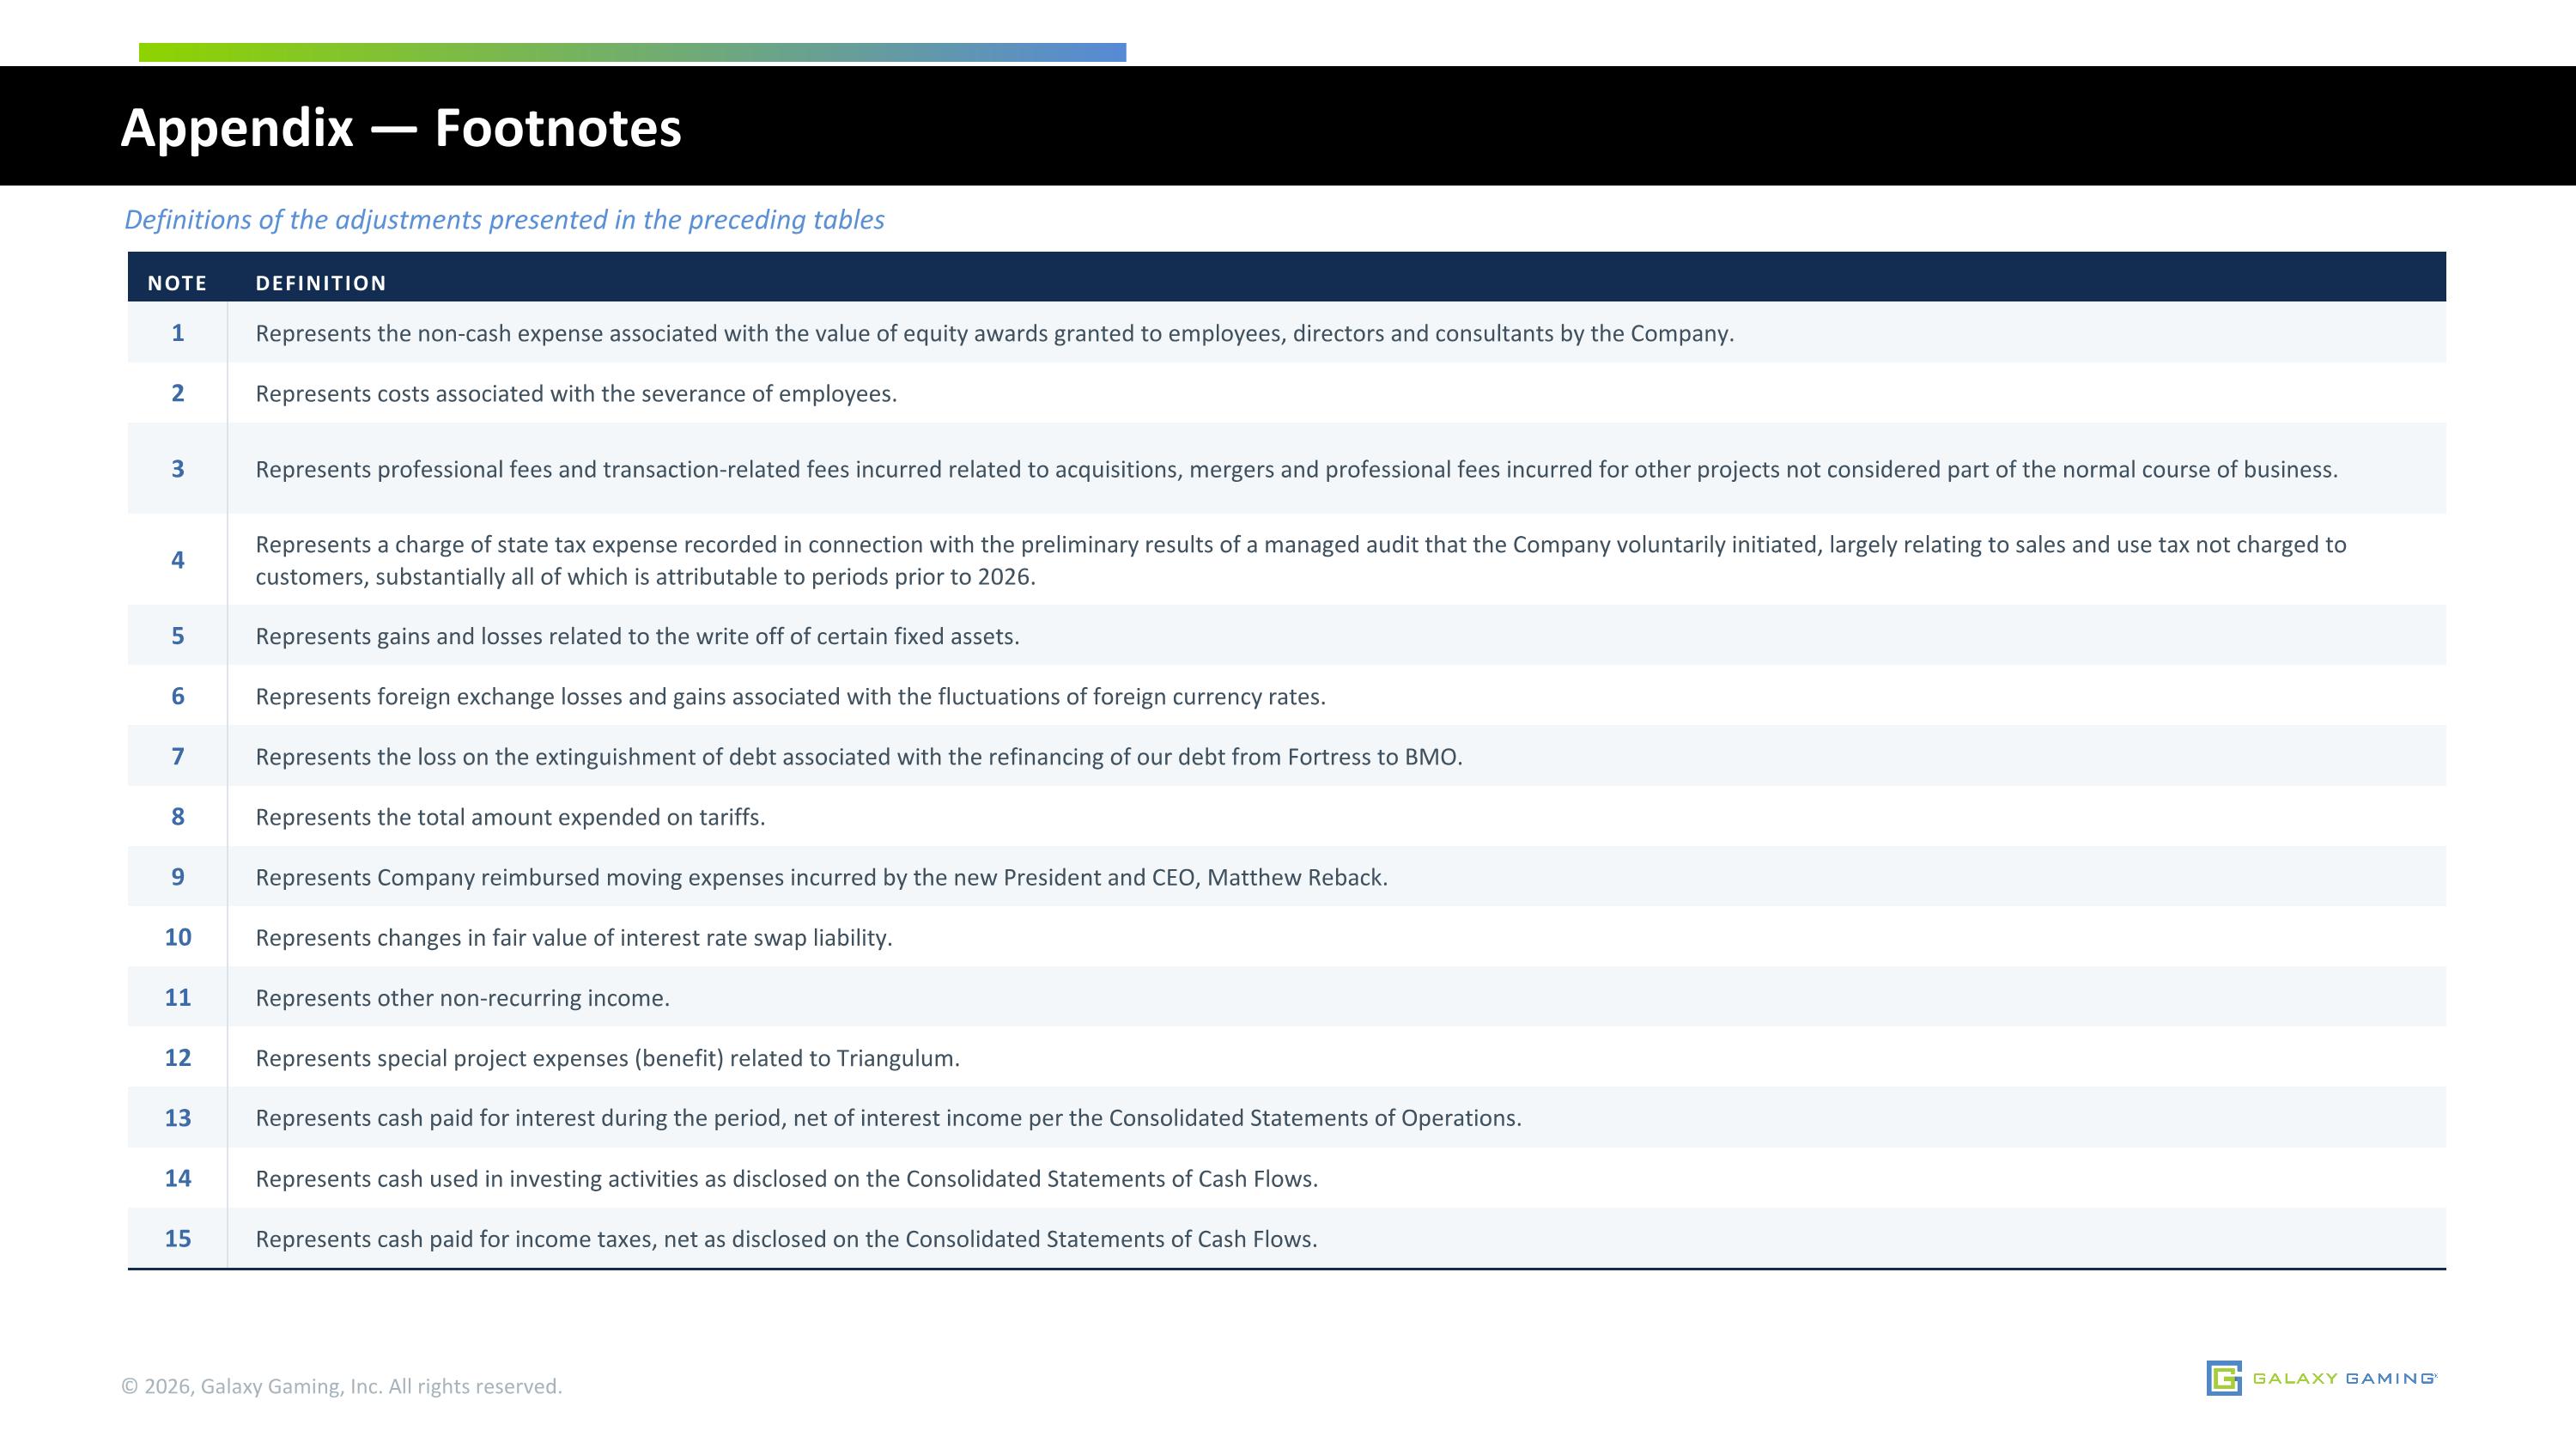
Appendix — Footnotes Definitions of the adjustments presented in the preceding tables © 2026, Galaxy Gaming, Inc. All rights reserved. NOTE DEFINITION 1 Represents the non-cash expense associated with the value of equity awards granted to employees, directors and consultants by the Company. 2 Represents costs associated with the severance of employees. 3 Represents professional fees and transaction-related fees incurred related to acquisitions, mergers and professional fees incurred for other projects not considered part of the normal course of business. 4 Represents a charge of state tax expense recorded in connection with the preliminary results of a managed audit that the Company voluntarily initiated, largely relating to sales and use tax not charged to customers, substantially all of which is attributable to periods prior to 2026. 5 Represents gains and losses related to the write off of certain fixed assets. 6 Represents foreign exchange losses and gains associated with the fluctuations of foreign currency rates. 7 Represents the loss on the extinguishment of debt associated with the refinancing of our debt from Fortress to BMO. 8 Represents the total amount expended on tariffs. 9 Represents Company reimbursed moving expenses incurred by the new President and CEO, Matthew Reback. 10 Represents changes in fair value of interest rate swap liability. 11 Represents other non-recurring income. 12 Represents special project expenses (benefit) related to Triangulum. 13 Represents cash paid for interest during the period, net of interest income per the Consolidated Statements of Operations. 14 Represents cash used in investing activities as disclosed on the Consolidated Statements of Cash Flows. 15 Represents cash paid for income taxes, net as disclosed on the Consolidated Statements of Cash Flows.