Pay vs Performance Disclosure - USD ($)
Dec. 12, 2023
Dec. 31, 2025
Dec. 31, 2024
Dec. 31, 2023
Apr. 13, 2023
Dec. 31, 2024
| Fiscal Year | Summary Compensation Table Total for PEO 1 | Compensation Actually Paid to PEO 1 | Summary Compensation Table Total for PEO 2 | Compensation Actually Paid to PEO 2 | Summary Compensation Table Total for PEO 3 | Compensation Actually Paid to PEO 3 | Average Summary Compensation Table Total for non-PEO NEOs | Average Compensation Actually Paid to non-PEO NEOS | Value of Initial $100 Investment Based on Total Shareholder Return | Net Loss ($) (Thousands) | ||||||||||||||||||||||||||||||
| (1) | (4) | (2) | (4) | (3) | (4) | (5) | (6) | |||||||||||||||||||||||||||||||||
| 2025 | $ | 1,404,918 | $ | 2,314,075 | $ | 0 | $ | 0 | $ | 0 | $ | 0 | $ | 862,393 | $ | 866,132 | $ | 140.83 | $ | (10,335 | ) | |||||||||||||||||||
| 2024 | $ | 1,959,493 | $ | (643,239 | ) | $ | 0 | $ | 0 | $ | 0 | $ | 0 | $ | 222,525 | $ | (723,422 | ) | $ | 125.44 | $ | (5,875 | ) | |||||||||||||||||
| 2023 | $ | 2,515,855 | $ | 5,904,147 | $ | 450,000 | $ | 1,600,958 | $ | 601,338 | $ | (953,925 | ) | $ | 336,138 | $ | 419,090 | $ | 183.43 | $ | (30,220 | ) | ||||||||||||||||||
| (1) | Scot Cohen (PEO 1) served as our PEO starting December 12, 2023. |
| (2) | Kevin Mullins (PEO 2) served as our PEO from April 13, 2023 to December 12, 2023. |
| (3) | TJ Kennedy (PEO 3) served as our PEO from April 18, 2022 to April 13, 2023. |
| (4) | For each of the PEOs in the table above, the following amounts were added and deducted to the Summary Compensation Table (“SCT”) amount to determine the compensation actually paid as determined in accordance with SEC regulations. |
| PEO 1 | ||||
| Fiscal Year | 2025 | |||
| SCT Total | $ | 1,404,918 | ||
| - Change in Pension Value and Above Market Non-Qualified Deferred Compensation | $ | 0 | ||
| - Grant Date Fair Value of Option Awards and Stock Awards Granted in Fiscal Year | $ | (1,204,918 | ) | |
| + Fair Value at Fiscal Year-End of Outstanding and Unvested Option Awards and Stock Awards Granted in Fiscal Year | $ | 891,855 | ||
| + Change in Fair Value of Outstanding and Unvested Option Awards and Stock Awards Granted in Prior Fiscal Years | $ | 753,262 | ||
| + Fair Value at Vesting of Option Awards and Stock Awards Granted in Fiscal Year That Vested During Fiscal Year | $ | 405,000 | ||
| + Change in Fair Value as of Vesting Date of Option Awards and Stock Awards Granted in Prior Fiscal Years For Which Applicable Vesting Conditions Were Satisfied During Fiscal Year | $ | 63,957 | ||
| - Fair Value as of Prior Fiscal Year-End of Option Awards and Stock Awards Granted in Prior Fiscal Years That Failed to Meet Applicable Vesting Conditions During Fiscal Year | $ | 0 | ||
| + Value of Dividends or other Earnings Paid on Stock or Option Awards not Otherwise Reflected in Fair Value or Total Compensation | $ | 0 | ||
| Compensation Actually Paid | $ | 2,314,075 | ||
| NEO | ||||
| Fiscal Year | 2025 | |||
| SCT Total | $ | 862,393 | ||
| - Change in Pension Value and Above Market Non-Qualified Deferred Compensation | $ | 0 | ||
| - Grant Date Fair Value of Option Awards and Stock Awards Granted in Fiscal Year | $ | (699,546 | ) | |
| + Fair Value at Fiscal Year-End of Outstanding and Unvested Option Awards and Stock Awards Granted in Fiscal Year | $ | 445,928 | ||
| + Change in Fair Value of Outstanding and Unvested Option Awards and Stock Awards Granted in Prior Fiscal Years | $ | 27,429 | ||
| + Fair Value at Vesting of Option Awards and Stock Awards Granted in Fiscal Year That Vested During Fiscal Year | $ | 202,500 | ||
| + Change in Fair Value as of Vesting Date of Option Awards and Stock Awards Granted in Prior Fiscal Years For Which Applicable Vesting Conditions Were Satisfied During Fiscal Year | $ | 27,429 | ||
| - Fair Value as of Prior Fiscal Year-End of Option Awards and Stock Awards Granted in Prior Fiscal Years That Failed to Meet Applicable Vesting Conditions During Fiscal Year | $ | 0 | ||
| + Value of Dividends or other Earnings Paid on Stock or Option Awards not Otherwise Reflected in Fair Value or Total Compensation | $ | 0 | ||
| Compensation Actually Paid | $ | 866,132 | ||
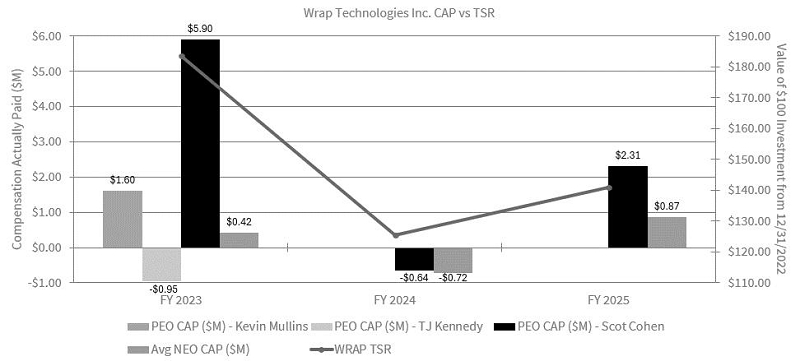
The following graph compares the compensation actually paid to our PEO(s), the average of the compensation actually paid to our remaining NEOs and the TSR performance of our stock price.
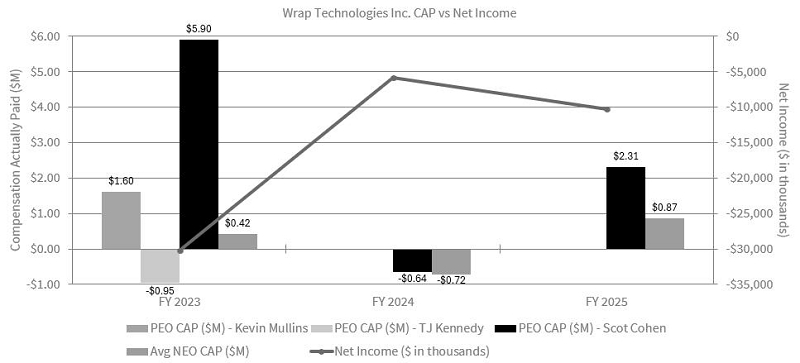
The following graph compares the compensation actually paid to our PEO(s) and the average of the compensation actually paid to our remaining NEOs with Net Loss.
| [1] | For the year ended December 31, 2025, Jared Novick and Gerald Ratigan were our other Named Executive Officers. |
| [2] | For our other Named Executive Officers, the following amounts were added and deducted to the Summary Compensation Table amount to determine the compensation actually paid as determined in accordance with SEC regulations. |
| [3] | Scot Cohen (PEO 1) served as our PEO starting December 12, 2023. |
| [4] | For each of the PEOs in the table above, the following amounts were added and deducted to the Summary Compensation Table (“SCT”) amount to determine the compensation actually paid as determined in accordance with SEC regulations. |
| [5] | Kevin Mullins (PEO 2) served as our PEO from April 13, 2023 to December 12, 2023. |
| [6] | TJ Kennedy (PEO 3) served as our PEO from April 18, 2022 to April 13, 2023. |