
Third Quarter 2026 Earnings Conference Call October 15, 2026 Exhibit 99.1
2 Cautionary Statement Regarding Forward-Looking and non-GAAP Financial Information Our earnings conference call presentation is not intended as a full business or financial review and should be viewed in the context of all of the information made available by PNC in its SEC filings and on our corporate website. The presentation contains forward-looking statements regarding our outlook for financial performance, such as earnings, revenues, expenses, tax rates, capital and liquidity levels and ratios, asset levels, asset quality, financial position, and other matters regarding or affecting PNC and its future business and operations, including its sustainability strategy. Forward-looking statements are necessarily subject to numerous assumptions, risks and uncertainties, which change over time. The forward-looking statements in this presentation are qualified by the factors affecting forward- looking statements identified in the more detailed Cautionary Statement included in the Appendix. We provide greater detail regarding these as well as other factors in our most recent Form 10-K, any subsequent Form 10-Qs, and any other subsequent SEC filings. Our forward-looking statements may also be subject to risks and uncertainties including those we may discuss in this presentation or in our SEC filings. Future events or circumstances may change our outlook and may also affect the nature of the assumptions, risks and uncertainties to which our forward-looking statements are subject. Forward-looking statements in this presentation speak only as of the date of this presentation. We do not assume any duty and do not undertake any obligation to update those statements. Actual results or future events could differ, possibly materially, from those anticipated in forward-looking statements, as well as from historical performance. As a result, we caution against placing undue reliance on any forward-looking statements. We include non-GAAP financial information in this presentation. Reconciliations for such financial information may be found in our presentation, in these slides, including the Appendix, in other materials on our corporate website, and in our SEC filings. This information supplements our results as reported in accordance with GAAP and should not be viewed in isolation from, or as a substitute for, our GAAP results. We believe that this information and the related reconciliations may be useful to investors, analysts, regulators and others to help understand and evaluate our financial results, and with respect to adjusted metrics, because we believe they better reflect the ongoing financial results and trends of our businesses and increase comparability of period-to-period results. We may also use annualized, pro forma, estimated or third party numbers for illustrative or comparative purposes only. These may not reflect actual results. References to our corporate website are to www.pnc.com under “About - Investor Relations.” Our SEC filings are available both on our corporate website and on the SEC’s website at www.sec.gov. We include web addresses here as inactive textual references only. Information on these websites is not part of this presentation.
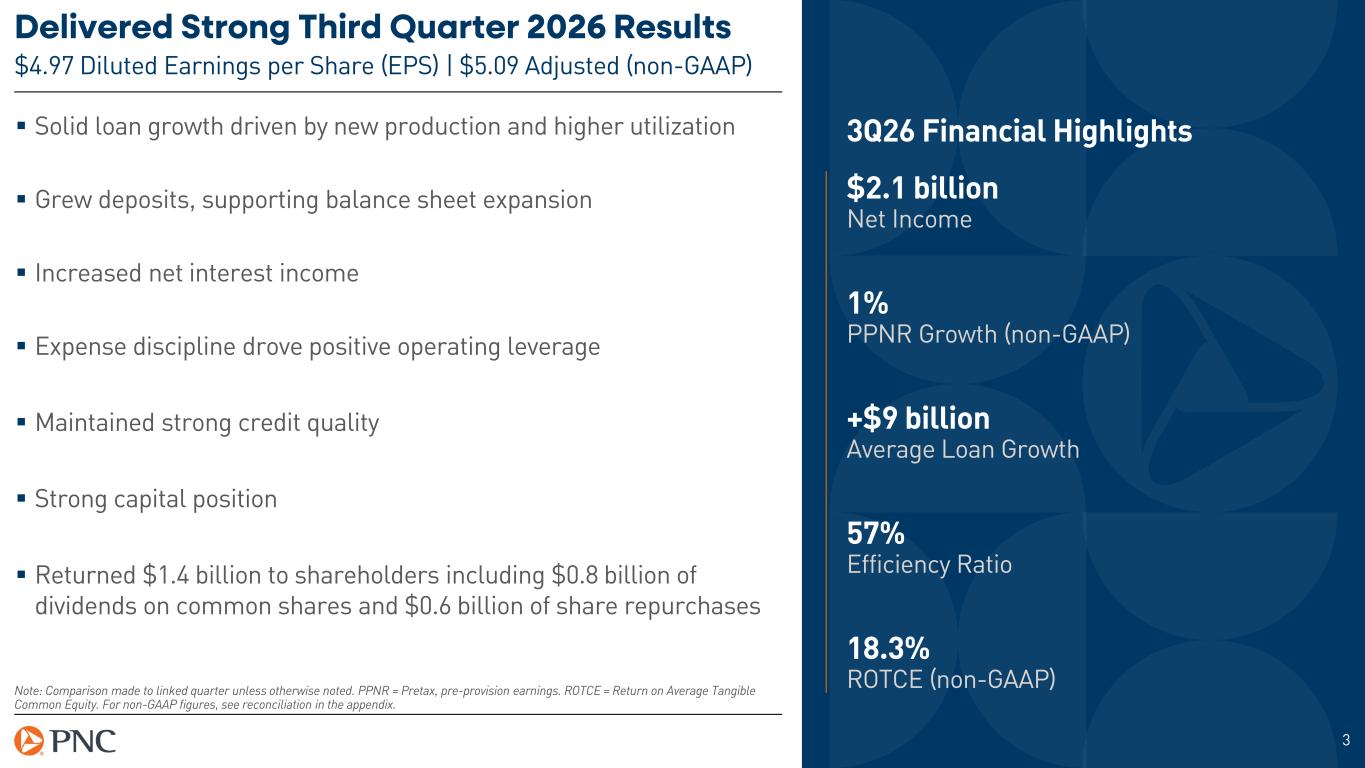
3 Delivered Strong Third Quarter 2026 Results $4.97 Diluted Earnings per Share (EPS) | $5.09 Adjusted (non-GAAP) Solid loan growth driven by new production and higher utilization Grew deposits, supporting balance sheet expansion Increased net interest income Expense discipline drove positive operating leverage Maintained strong credit quality Strong capital position Returned $1.4 billion to shareholders including $0.8 billion of dividends on common shares and $0.6 billion of share repurchases Note: Comparison made to linked quarter unless otherwise noted. PPNR = Pretax, pre-provision earnings. ROTCE = Return on Average Tangible Common Equity. For non-GAAP figures, see reconciliation in the appendix. $2.1 billion Net Income 1% PPNR Growth (non-GAAP) 57% Efficiency Ratio 18.3% ROTCE (non-GAAP) 3Q26 Financial Highlights +$9 billion Average Loan Growth
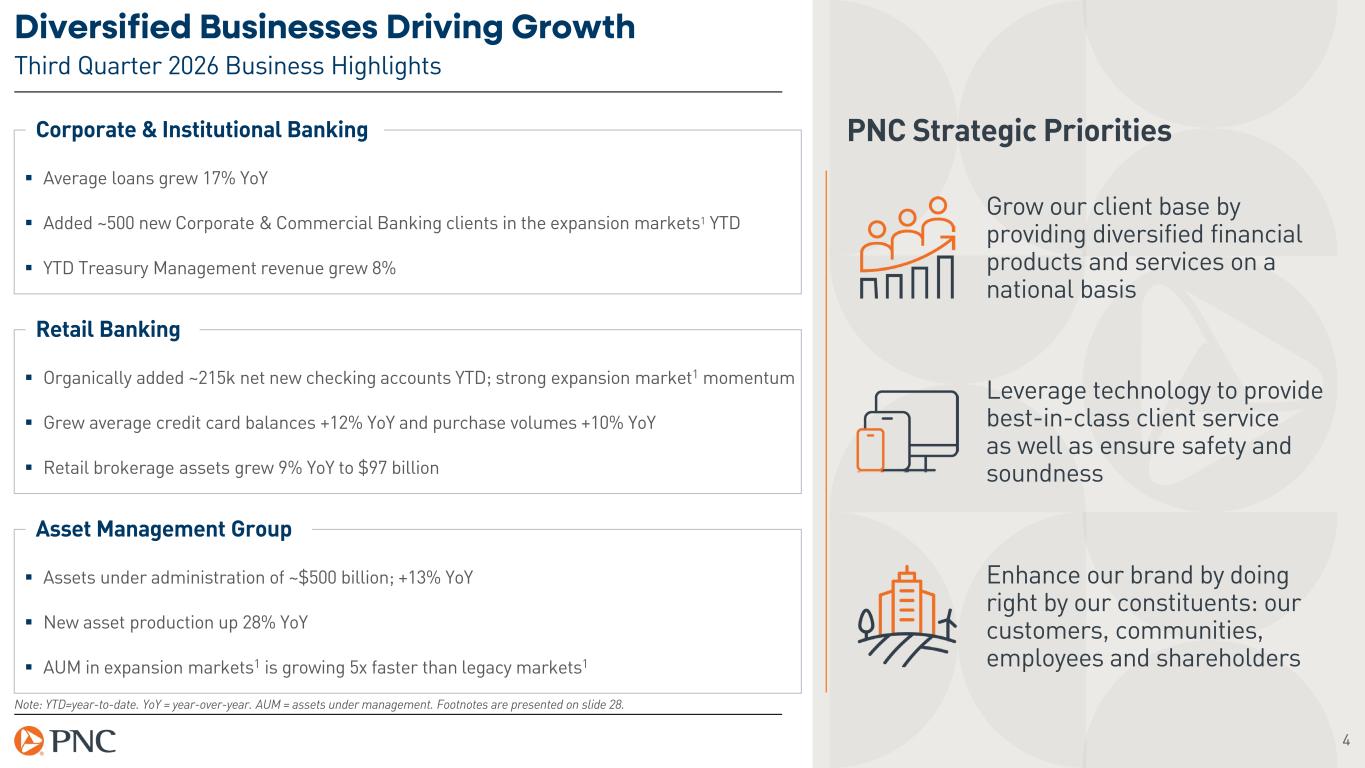
4 Diversified Businesses Driving Growth Third Quarter 2026 Business Highlights Note: YTD=year-to-date. YoY = year-over-year. AUM = assets under management. Footnotes are presented on slide 28. Grow our client base by providing diversified financial products and services on a national basis PNC Strategic Priorities Leverage technology to provide best-in-class client service as well as ensure safety and soundness Enhance our brand by doing right by our constituents: our customers, communities, employees and shareholders Retail Banking Organically added ~215k net new checking accounts YTD; strong expansion market1 momentum Grew average credit card balances +12% YoY and purchase volumes +10% YoY Retail brokerage assets grew 9% YoY to $97 billion Corporate & Institutional Banking Average loans grew 17% YoY Added ~500 new Corporate & Commercial Banking clients in the expansion markets1 YTD YTD Treasury Management revenue grew 8% Asset Management Group Assets under administration of ~$500 billion; +13% YoY New asset production up 28% YoY AUM in expansion markets1 is growing 5x faster than legacy markets1
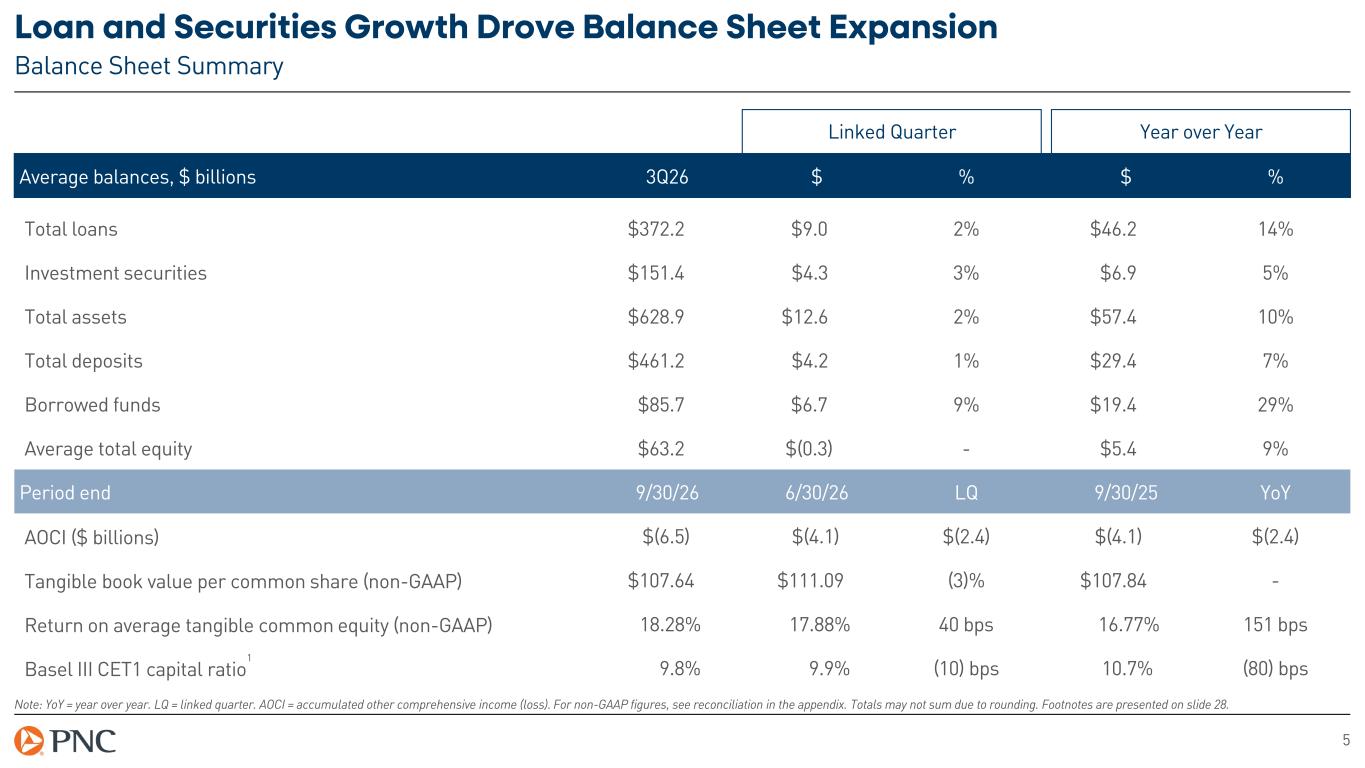
5 Loan and Securities Growth Drove Balance Sheet Expansion Balance Sheet Summary Linked Quarter Year over Year Average balances, $ billions 3Q26 $ % $ % Total loans $372.2 $9.0 2% $46.2 14% Investment securities $151.4 $4.3 3% $6.9 5% Total assets $628.9 $12.6 2% $57.4 10% Total deposits $461.2 $4.2 1% $29.4 7% Borrowed funds $85.7 $6.7 9% $19.4 29% Average total equity $63.2 $(0.3) - $5.4 9% Period end 9/30/26 6/30/26 LQ 9/30/25 YoY AOCI ($ billions) $(6.5) $(4.1) $(2.4) $(4.1) $(2.4) Tangible book value per common share (non-GAAP) $107.64 $111.09 (3)% $107.84 - Return on average tangible common equity (non-GAAP) 18.28% 17.88% 40 bps 16.77% 151 bps Basel III CET1 capital ratio 1 9.8% 9.9% (10) bps 10.7% (80) bps Note: YoY = year over year. LQ = linked quarter. AOCI = accumulated other comprehensive income (loss). For non-GAAP figures, see reconciliation in the appendix. Totals may not sum due to rounding. Footnotes are presented on slide 28.
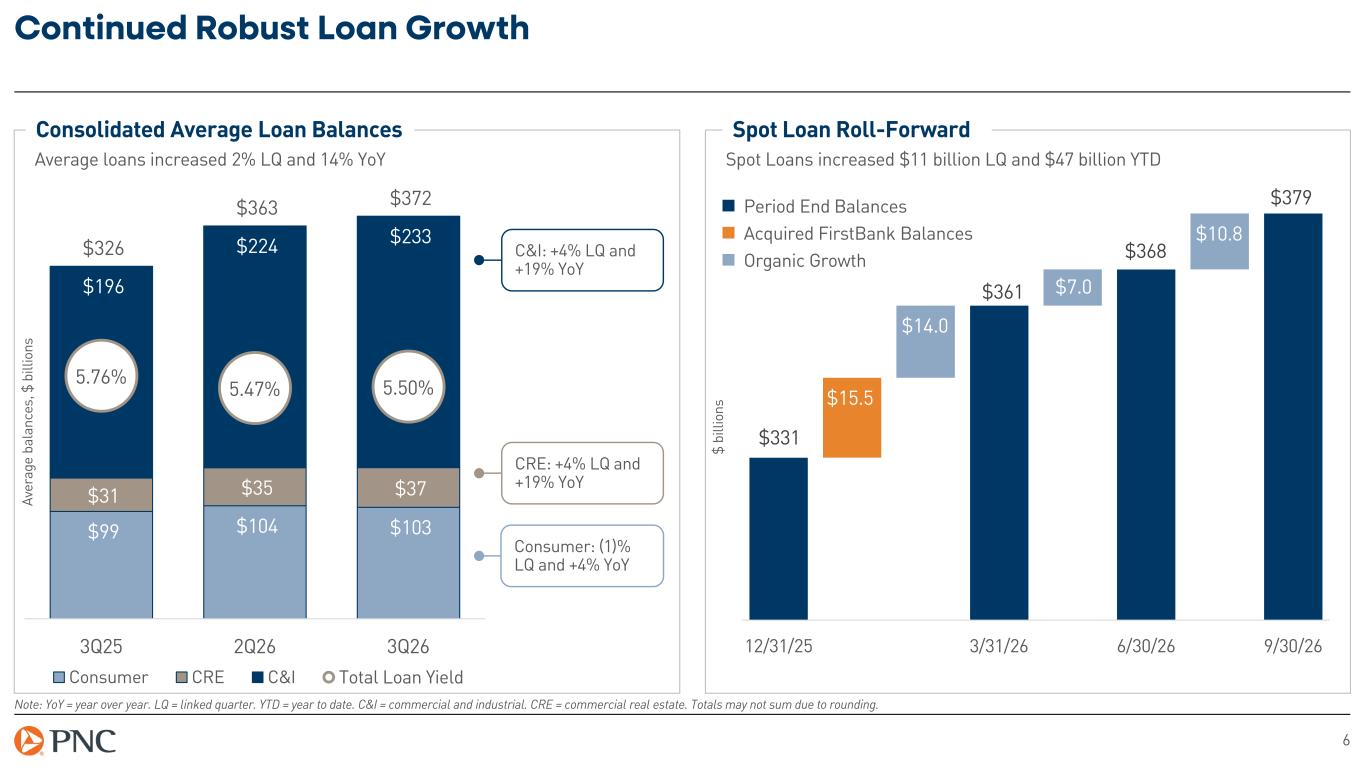
6 Continued Robust Loan Growth Note: YoY = year over year. LQ = linked quarter. YTD = year to date. C&I = commercial and industrial. CRE = commercial real estate. Totals may not sum due to rounding. Consolidated Average Loan Balances Average loans increased 2% LQ and 14% YoY Av er ag e ba la nc es , $ b ill io ns Consumer: (1)% LQ and +4% YoY C&I: +4% LQ and +19% YoY CRE: +4% LQ and +19% YoY Spot Loan Roll-Forward $99 $104 $103 $31 $35 $37 $196 $224 $233 $326 $363 $372 5.76% 5.47% 5.50% 3Q25 2Q26 3Q26 Consumer CRE C&I Total Loan Yield Spot Loans increased $11 billion LQ and $47 billion YTD $ bi lli on s $331 $361 $368 $379 $15.5 $14.0 $7.0 $10.8 12/31/25 3/31/26 6/30/26 9/30/26 Period End Balances Acquired FirstBank Balances Organic Growth
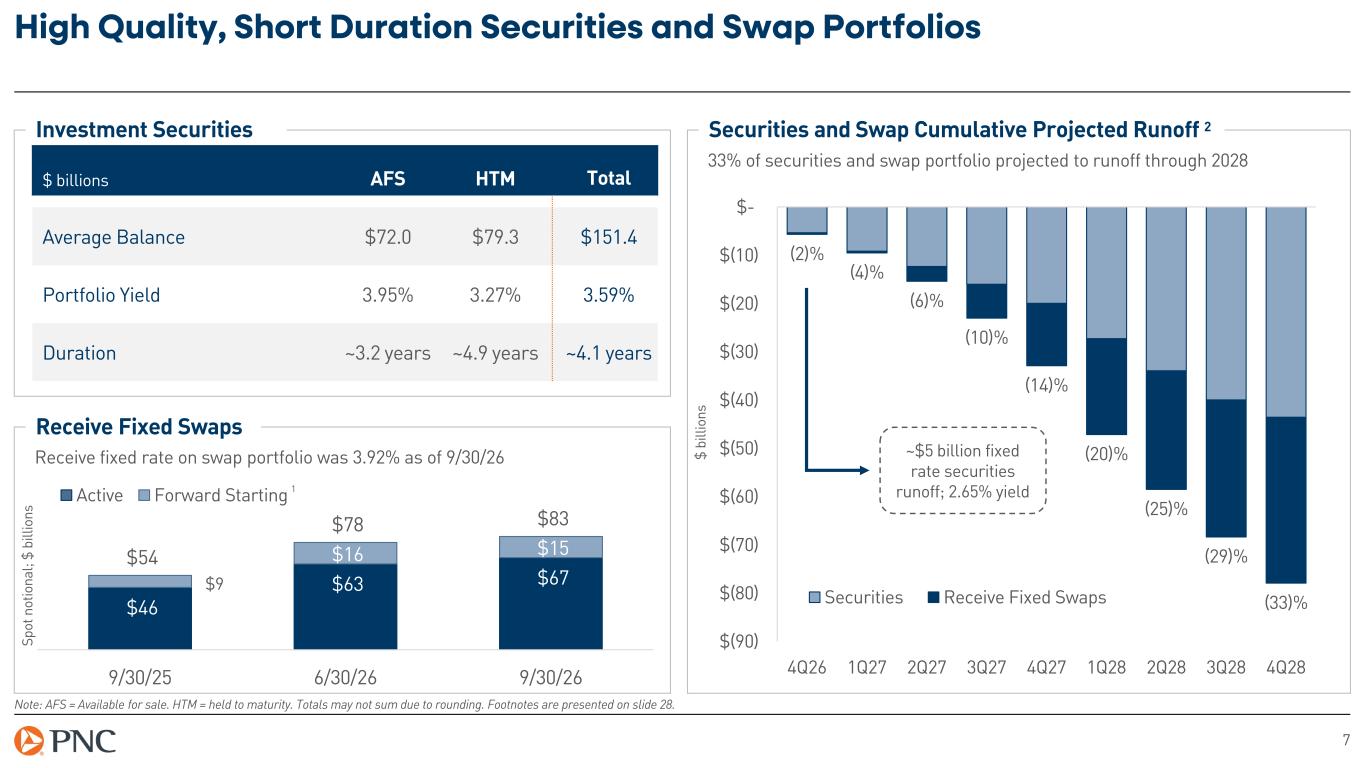
7 High Quality, Short Duration Securities and Swap Portfolios Note: AFS = Available for sale. HTM = held to maturity. Totals may not sum due to rounding. Footnotes are presented on slide 28. Investment Securities $ billions AFS HTM Total Average Balance $72.0 $79.3 $151.4 Portfolio Yield 3.95% 3.27% 3.59% Duration ~3.2 years ~4.9 years ~4.1 years Receive Fixed Swaps $46 $63 $67 $9 $16 $15 $54 $78 $83 9/30/25 6/30/26 9/30/26 Active Forward Starting Sp ot n ot io na l; $ bi lli on s Receive fixed rate on swap portfolio was 3.92% as of 9/30/26 1 Securities and Swap Cumulative Projected Runoff 2 33% of securities and swap portfolio projected to runoff through 2028 (2)% (4)% (6)% (10)% (14)% (20)% (25)% (29)% (33)% $(90) $(80) $(70) $(60) $(50) $(40) $(30) $(20) $(10) $- 4Q26 1Q27 2Q27 3Q27 4Q27 1Q28 2Q28 3Q28 4Q28 Securities Receive Fixed Swaps $ bi lli on s ~$5 billion fixed rate securities runoff; 2.65% yield
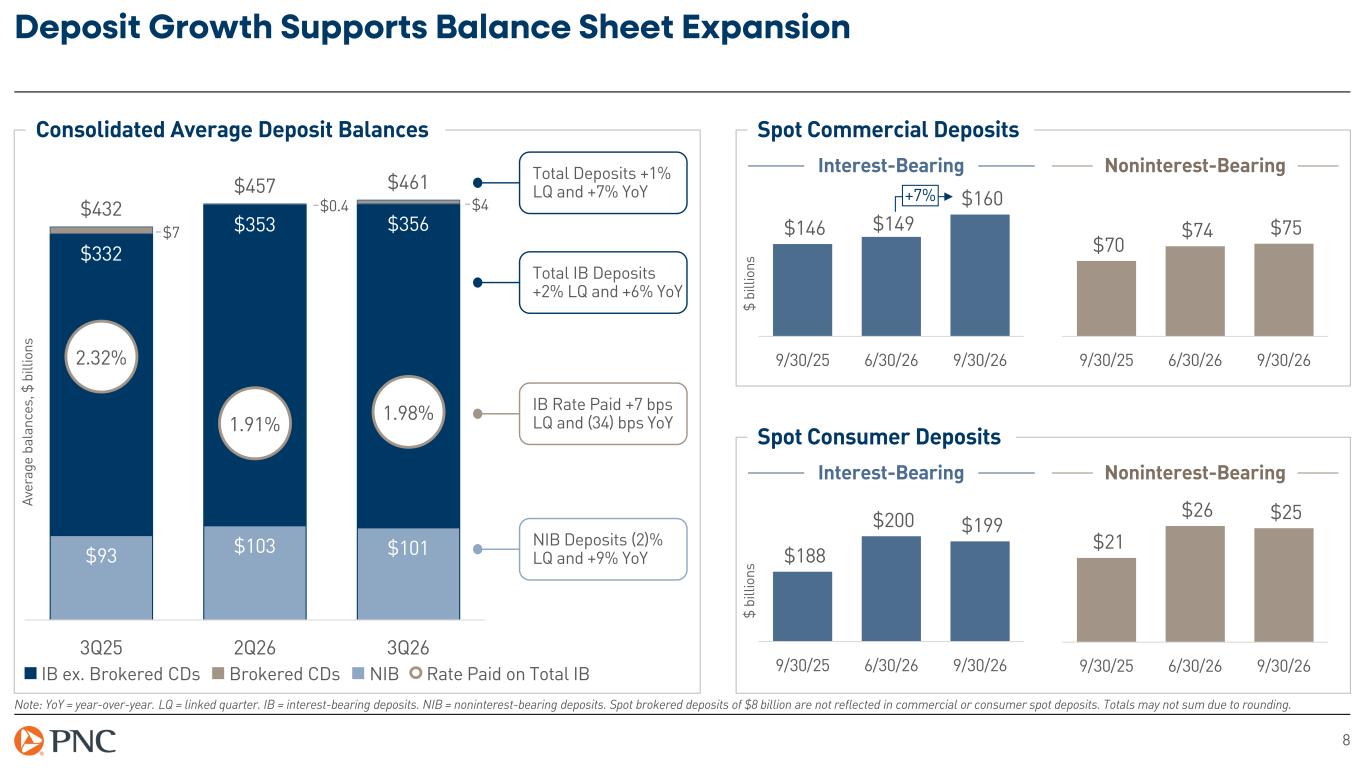
$93 $103 $101 $332 $353 $356 $432 $457 $461 2.32% 1.91% 1.98% 3Q25 2Q26 3Q26 8 Deposit Growth Supports Balance Sheet Expansion Note: YoY = year-over-year. LQ = linked quarter. IB = interest-bearing deposits. NIB = noninterest-bearing deposits. Spot brokered deposits of $8 billion are not reflected in commercial or consumer spot deposits. Totals may not sum due to rounding. Consolidated Average Deposit Balances Av er ag e ba la nc es , $ b ill io ns Spot Consumer Deposits $ bi lli on s Spot Commercial Deposits $ bi lli on s $146 $149 $160 9/30/25 6/30/26 9/30/26 $70 $74 $75 9/30/25 6/30/26 9/30/26 Interest-Bearing Noninterest-Bearing $188 $200 $199 9/30/25 6/30/26 9/30/26 $21 $26 $25 9/30/25 6/30/26 9/30/26 Interest-Bearing Noninterest-Bearing IB Rate Paid +7 bps LQ and (34) bps YoY Total Deposits +1% LQ and +7% YoY NIB Deposits (2)% LQ and +9% YoY Total IB Deposits +2% LQ and +6% YoY +7% $7 $4$0.4 IB ex. Brokered CDs NIBBrokered CDs Rate Paid on Total IB
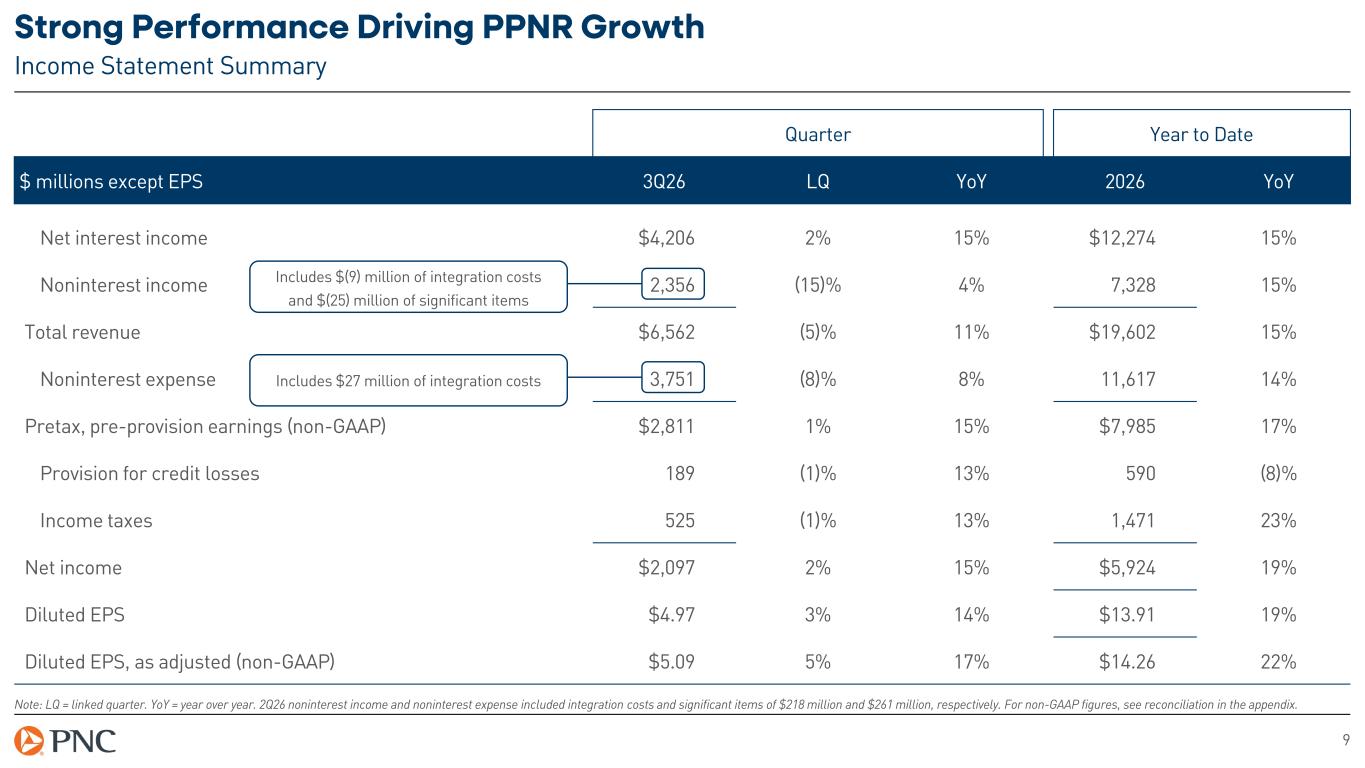
Quarter Year to Date $ millions except EPS 3Q26 LQ YoY 2026 YoY Net interest income $4,206 2% 15% $12,274 15% Noninterest income 2,356 (15)% 4% 7,328 15% Total revenue $6,562 (5)% 11% $19,602 15% Noninterest expense 3,751 (8)% 8% 11,617 14% Pretax, pre-provision earnings (non-GAAP) $2,811 1% 15% $7,985 17% Provision for credit losses 189 (1)% 13% 590 (8)% Income taxes 525 (1)% 13% 1,471 23% Net income $2,097 2% 15% $5,924 19% Diluted EPS $4.97 3% 14% $13.91 19% Diluted EPS, as adjusted (non-GAAP) $5.09 5% 17% $14.26 22% 9 Strong Performance Driving PPNR Growth Income Statement Summary Note: LQ = linked quarter. YoY = year over year. 2Q26 noninterest income and noninterest expense included integration costs and significant items of $218 million and $261 million, respectively. For non-GAAP figures, see reconciliation in the appendix. Includes $(9) million of integration costs and $(25) million of significant items Includes $27 million of integration costs
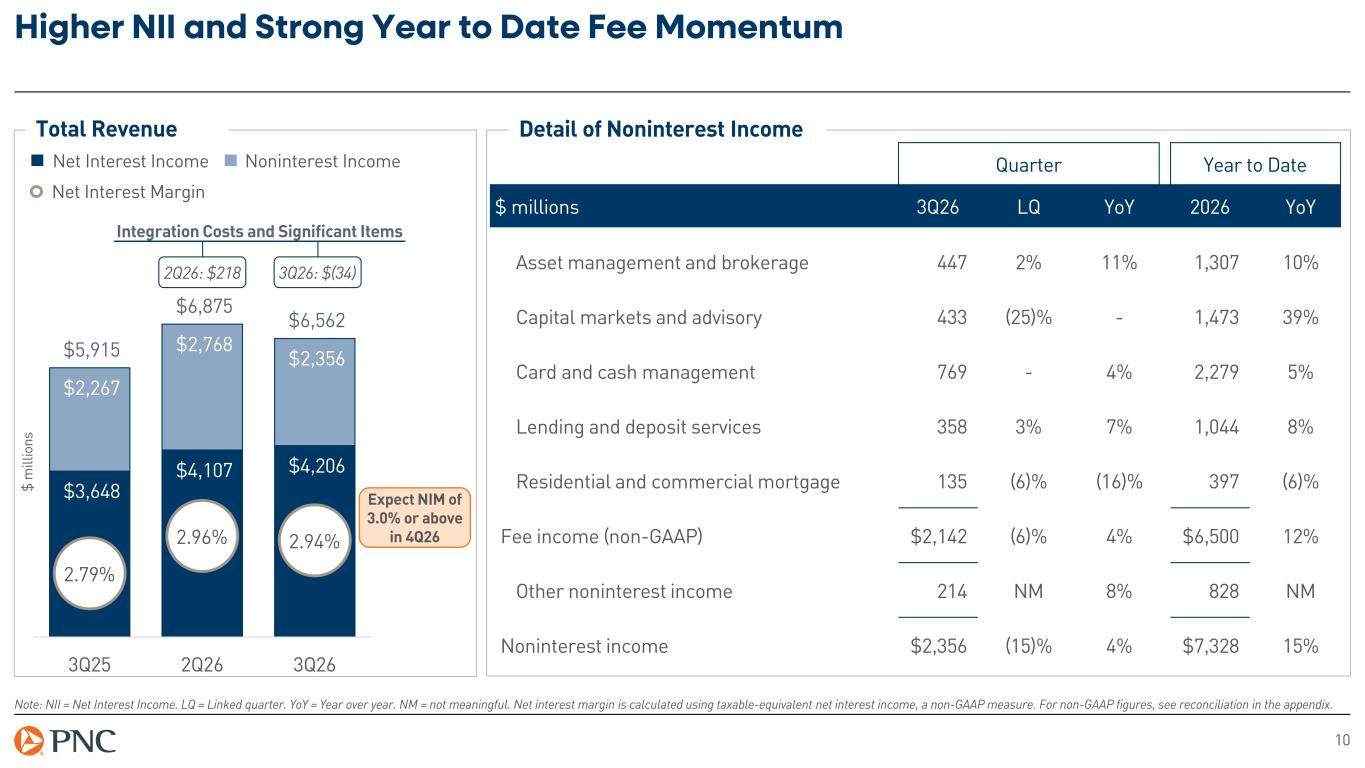
10 Higher NII and Strong Year to Date Fee Momentum Note: NII = Net Interest Income. LQ = Linked quarter. YoY = Year over year. NM = not meaningful. Net interest margin is calculated using taxable-equivalent net interest income, a non-GAAP measure. For non-GAAP figures, see reconciliation in the appendix. Detail of Noninterest IncomeTotal Revenue $3,648 $4,107 $4,206 $2,267 $2,768 $2,356 $5,915 $6,875 $6,562 2.79% 2.96% 2.94% 3Q25 2Q26 3Q26 $ m ill io ns Net Interest Income Net Interest Margin Noninterest Income Quarter Year to Date $ millions 3Q26 LQ YoY 2026 YoY Asset management and brokerage 447 2% 11% 1,307 10% Capital markets and advisory 433 (25)% - 1,473 39% Card and cash management 769 - 4% 2,279 5% Lending and deposit services 358 3% 7% 1,044 8% Residential and commercial mortgage 135 (6)% (16)% 397 (6)% Fee income (non-GAAP) $2,142 (6)% 4% $6,500 12% Other noninterest income 214 NM 8% 828 NM Noninterest income $2,356 (15)% 4% $7,328 15% 2Q26: $218 Integration Costs and Significant Items 3Q26: $(34) Expect NIM of 3.0% or above in 4Q26
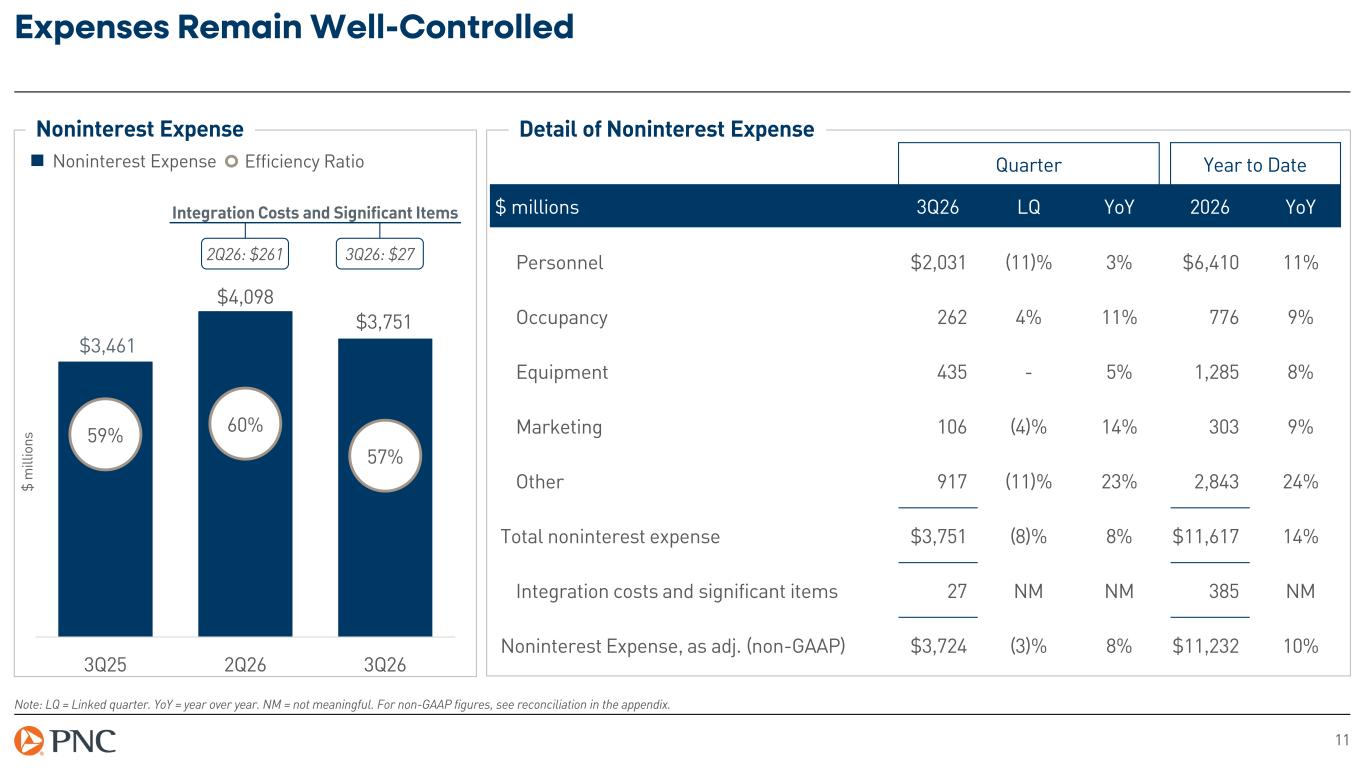
11 Expenses Remain Well-Controlled Detail of Noninterest ExpenseNoninterest Expense $ m ill io ns Note: LQ = Linked quarter. YoY = year over year. NM = not meaningful. For non-GAAP figures, see reconciliation in the appendix. Quarter Year to Date $ millions 3Q26 LQ YoY 2026 YoY Personnel $2,031 (11)% 3% $6,410 11% Occupancy 262 4% 11% 776 9% Equipment 435 - 5% 1,285 8% Marketing 106 (4)% 14% 303 9% Other 917 (11)% 23% 2,843 24% Total noninterest expense $3,751 (8)% 8% $11,617 14% Integration costs and significant items 27 NM NM 385 NM Noninterest Expense, as adj. (non-GAAP) $3,724 (3)% 8% $11,232 10% $3,461 59% 60% 57% 3Q25 2Q26 3Q26 $3,751 $4,098 Noninterest Expense Efficiency Ratio 2Q26: $261 Integration Costs and Significant Items 3Q26: $27
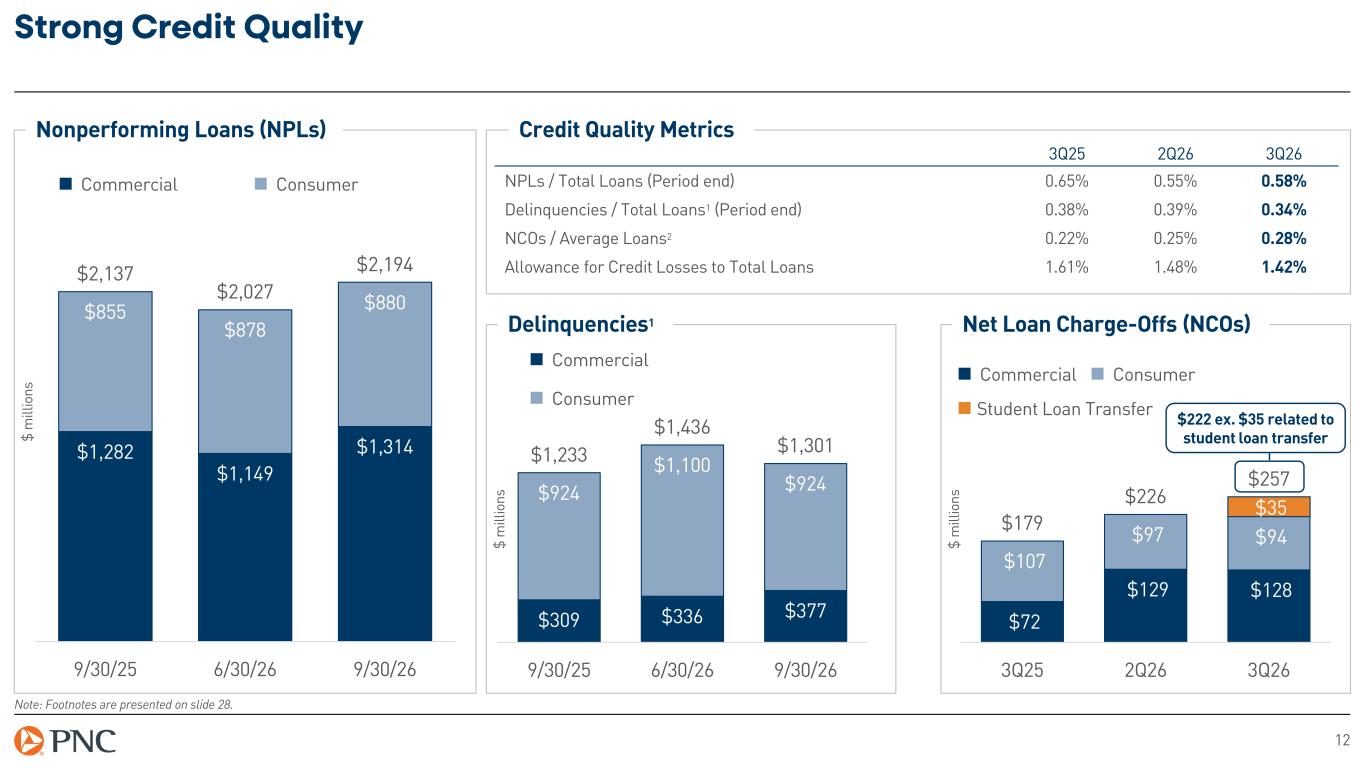
$72 $129 $128 $107 $97 $94 $35 $179 $226 $257 3Q25 2Q26 3Q26 12 Strong Credit Quality Note: Footnotes are presented on slide 28. Nonperforming Loans (NPLs) Net Loan Charge-Offs (NCOs) Credit Quality Metrics $1,282 $1,149 $1,314 $855 $878 $880 $2,137 $2,027 $2,194 9/30/25 6/30/26 9/30/26 $309 $336 $377 $924 $1,100 $924 $1,233 $1,436 $1,301 9/30/25 6/30/26 9/30/26 $ m ill io ns $ m ill io ns 3Q25 2Q26 3Q26 NPLs / Total Loans (Period end) 0.65% 0.55% 0.58% Delinquencies / Total Loans1 (Period end) 0.38% 0.39% 0.34% NCOs / Average Loans2 0.22% 0.25% 0.28% Allowance for Credit Losses to Total Loans 1.61% 1.48% 1.42% Commercial Consumer Delinquencies1 $ m ill io ns Commercial Consumer Commercial Consumer $222 ex. $35 related to student loan transfer Student Loan Transfer
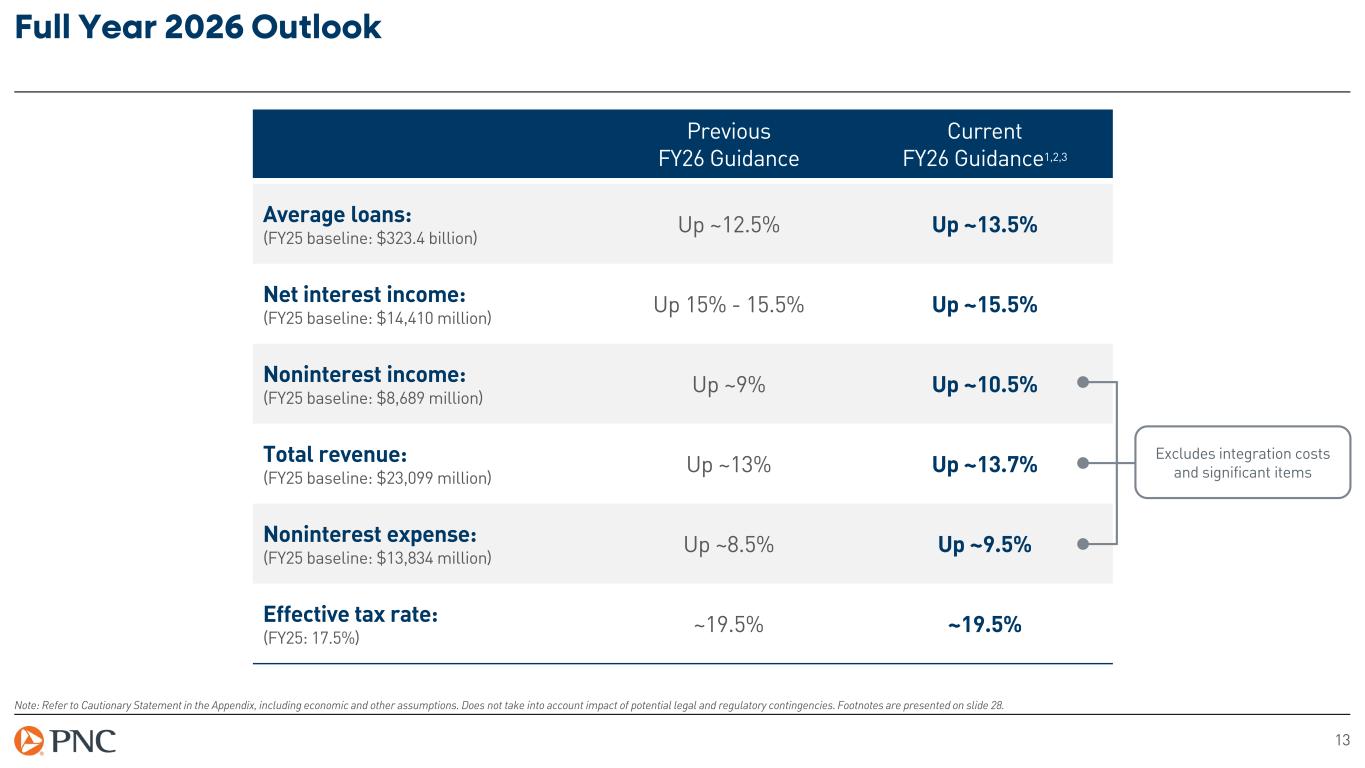
Previous FY26 Guidance Current FY26 Guidance1,2,3 Average loans: (FY25 baseline: $323.4 billion) Up ~12.5% Up ~13.5% Net interest income: (FY25 baseline: $14,410 million) Up 15% - 15.5% Up ~15.5% Noninterest income: (FY25 baseline: $8,689 million) Up ~9% Up ~10.5% Total revenue: (FY25 baseline: $23,099 million) Up ~13% Up ~13.7% Noninterest expense: (FY25 baseline: $13,834 million) Up ~8.5% Up ~9.5% Effective tax rate: (FY25: 17.5%) ~19.5% ~19.5% 13 Full Year 2026 Outlook Note: Refer to Cautionary Statement in the Appendix, including economic and other assumptions. Does not take into account impact of potential legal and regulatory contingencies. Footnotes are presented on slide 28. Excludes integration costs and significant items
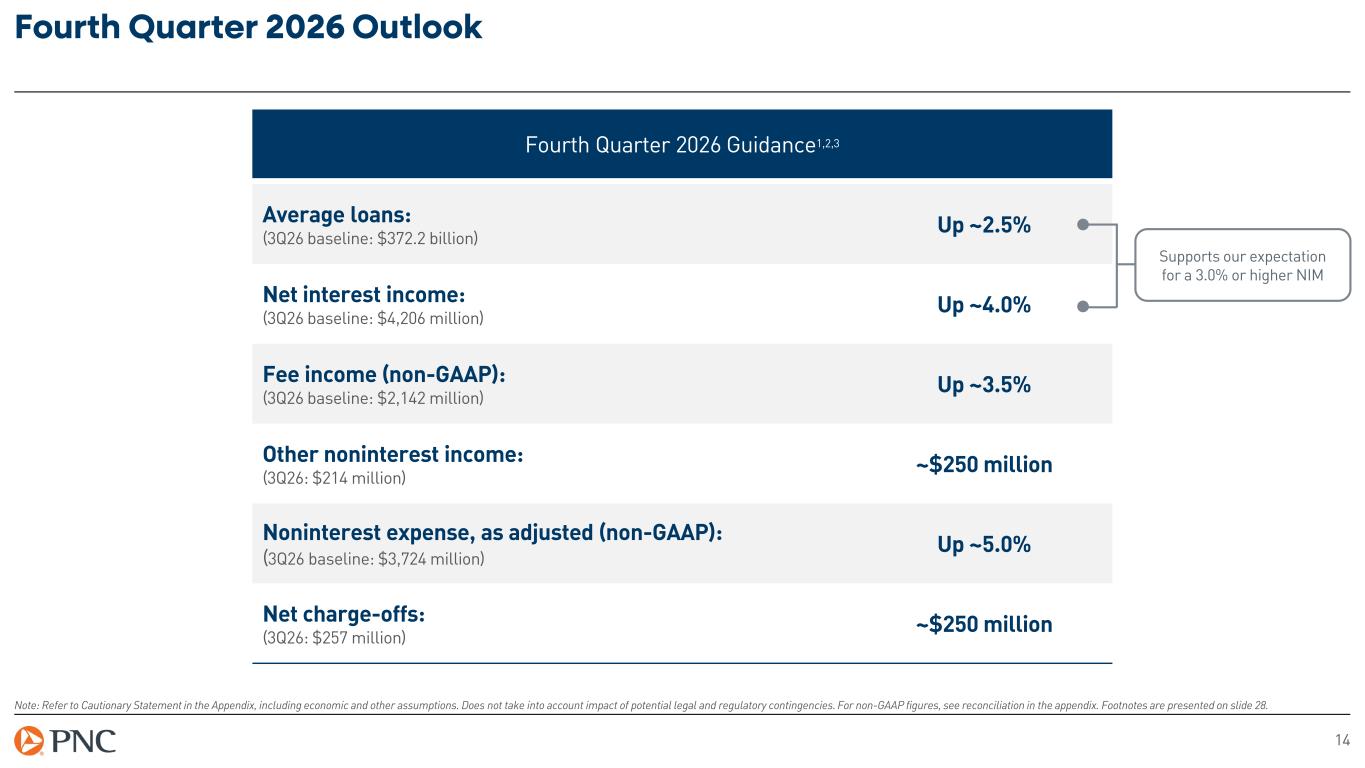
14 Fourth Quarter 2026 Outlook Note: Refer to Cautionary Statement in the Appendix, including economic and other assumptions. Does not take into account impact of potential legal and regulatory contingencies. For non-GAAP figures, see reconciliation in the appendix. Footnotes are presented on slide 28. Fourth Quarter 2026 Guidance1,2,3 Average loans: (3Q26 baseline: $372.2 billion) Up ~2.5% Net interest income: (3Q26 baseline: $4,206 million) Up ~4.0% Fee income (non-GAAP): (3Q26 baseline: $2,142 million) Up ~3.5% Other noninterest income: (3Q26: $214 million) ~$250 million Noninterest expense, as adjusted (non-GAAP): (3Q26 baseline: $3,724 million) Up ~5.0% Net charge-offs: (3Q26: $257 million) ~$250 million Supports our expectation for a 3.0% or higher NIM
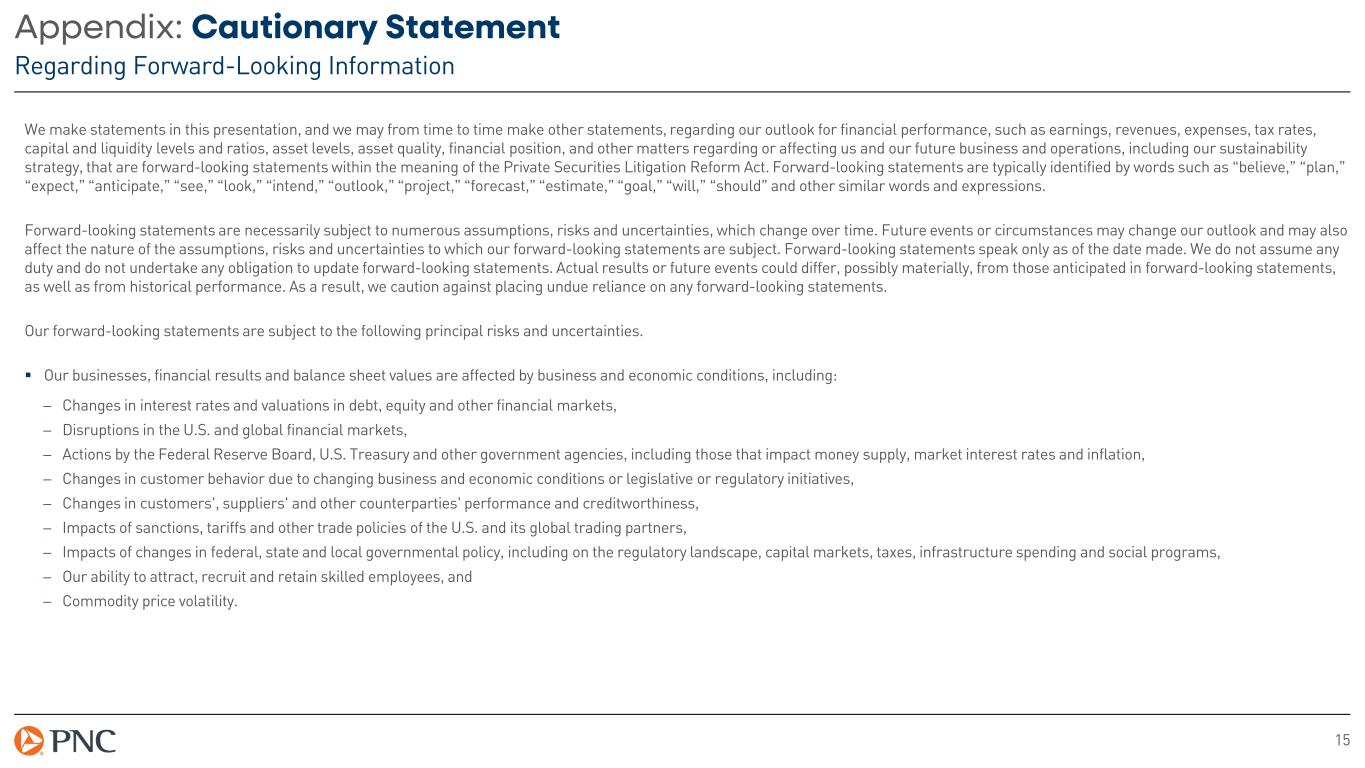
15 Appendix: Cautionary Statement Regarding Forward-Looking Information We make statements in this presentation, and we may from time to time make other statements, regarding our outlook for financial performance, such as earnings, revenues, expenses, tax rates, capital and liquidity levels and ratios, asset levels, asset quality, financial position, and other matters regarding or affecting us and our future business and operations, including our sustainability strategy, that are forward-looking statements within the meaning of the Private Securities Litigation Reform Act. Forward-looking statements are typically identified by words such as “believe,” “plan,” “expect,” “anticipate,” “see,” “look,” “intend,” “outlook,” “project,” “forecast,” “estimate,” “goal,” “will,” “should” and other similar words and expressions. Forward-looking statements are necessarily subject to numerous assumptions, risks and uncertainties, which change over time. Future events or circumstances may change our outlook and may also affect the nature of the assumptions, risks and uncertainties to which our forward-looking statements are subject. Forward-looking statements speak only as of the date made. We do not assume any duty and do not undertake any obligation to update forward-looking statements. Actual results or future events could differ, possibly materially, from those anticipated in forward-looking statements, as well as from historical performance. As a result, we caution against placing undue reliance on any forward-looking statements. Our forward-looking statements are subject to the following principal risks and uncertainties. Our businesses, financial results and balance sheet values are affected by business and economic conditions, including: − Changes in interest rates and valuations in debt, equity and other financial markets, − Disruptions in the U.S. and global financial markets, − Actions by the Federal Reserve Board, U.S. Treasury and other government agencies, including those that impact money supply, market interest rates and inflation, − Changes in customer behavior due to changing business and economic conditions or legislative or regulatory initiatives, − Changes in customers', suppliers' and other counterparties' performance and creditworthiness, − Impacts of sanctions, tariffs and other trade policies of the U.S. and its global trading partners, − Impacts of changes in federal, state and local governmental policy, including on the regulatory landscape, capital markets, taxes, infrastructure spending and social programs, − Our ability to attract, recruit and retain skilled employees, and − Commodity price volatility.
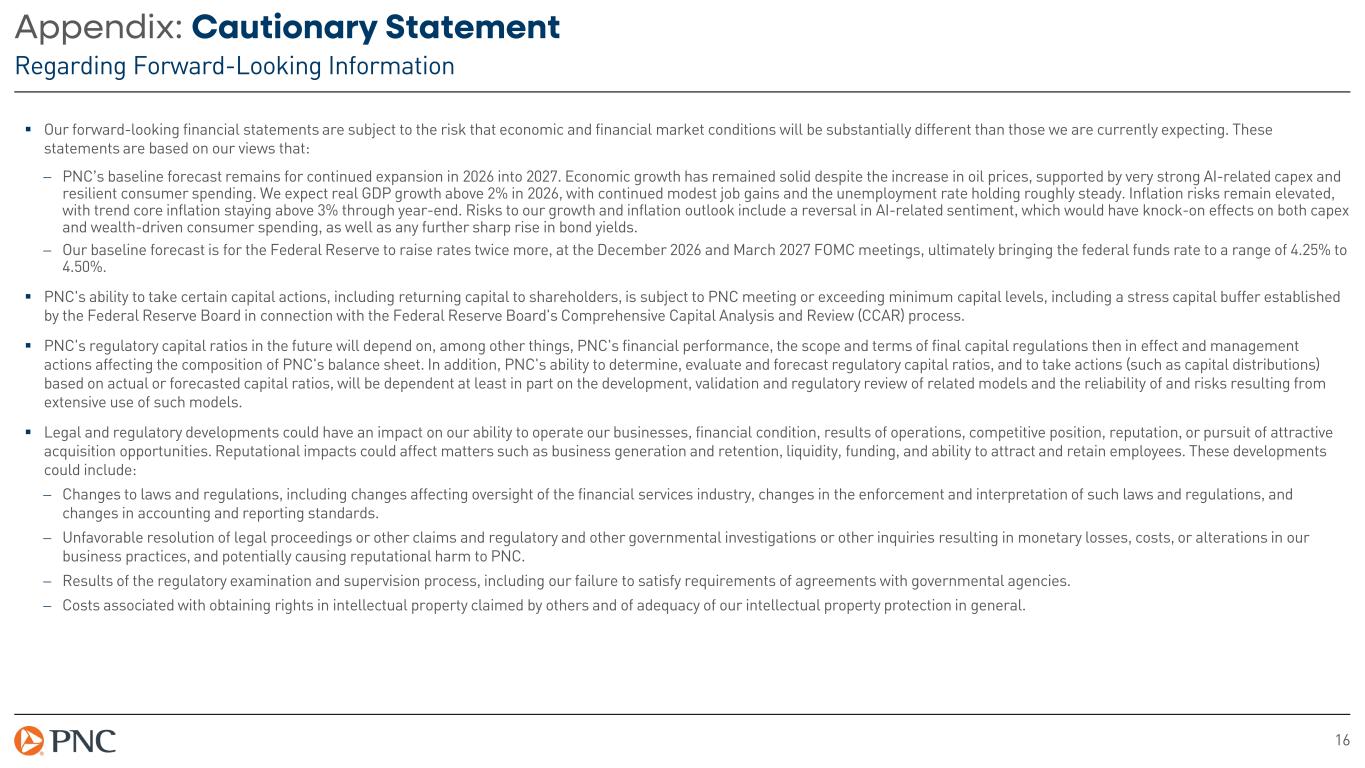
16 Appendix: Cautionary Statement Regarding Forward-Looking Information Our forward-looking financial statements are subject to the risk that economic and financial market conditions will be substantially different than those we are currently expecting. These statements are based on our views that: − PNC’s baseline forecast remains for continued expansion in 2026 into 2027. Economic growth has remained solid despite the increase in oil prices, supported by very strong AI-related capex and resilient consumer spending. We expect real GDP growth above 2% in 2026, with continued modest job gains and the unemployment rate holding roughly steady. Inflation risks remain elevated, with trend core inflation staying above 3% through year-end. Risks to our growth and inflation outlook include a reversal in AI-related sentiment, which would have knock-on effects on both capex and wealth-driven consumer spending, as well as any further sharp rise in bond yields. − Our baseline forecast is for the Federal Reserve to raise rates twice more, at the December 2026 and March 2027 FOMC meetings, ultimately bringing the federal funds rate to a range of 4.25% to 4.50%. PNC's ability to take certain capital actions, including returning capital to shareholders, is subject to PNC meeting or exceeding minimum capital levels, including a stress capital buffer established by the Federal Reserve Board in connection with the Federal Reserve Board's Comprehensive Capital Analysis and Review (CCAR) process. PNC's regulatory capital ratios in the future will depend on, among other things, PNC's financial performance, the scope and terms of final capital regulations then in effect and management actions affecting the composition of PNC's balance sheet. In addition, PNC's ability to determine, evaluate and forecast regulatory capital ratios, and to take actions (such as capital distributions) based on actual or forecasted capital ratios, will be dependent at least in part on the development, validation and regulatory review of related models and the reliability of and risks resulting from extensive use of such models. Legal and regulatory developments could have an impact on our ability to operate our businesses, financial condition, results of operations, competitive position, reputation, or pursuit of attractive acquisition opportunities. Reputational impacts could affect matters such as business generation and retention, liquidity, funding, and ability to attract and retain employees. These developments could include: − Changes to laws and regulations, including changes affecting oversight of the financial services industry, changes in the enforcement and interpretation of such laws and regulations, and changes in accounting and reporting standards. − Unfavorable resolution of legal proceedings or other claims and regulatory and other governmental investigations or other inquiries resulting in monetary losses, costs, or alterations in our business practices, and potentially causing reputational harm to PNC. − Results of the regulatory examination and supervision process, including our failure to satisfy requirements of agreements with governmental agencies. − Costs associated with obtaining rights in intellectual property claimed by others and of adequacy of our intellectual property protection in general.
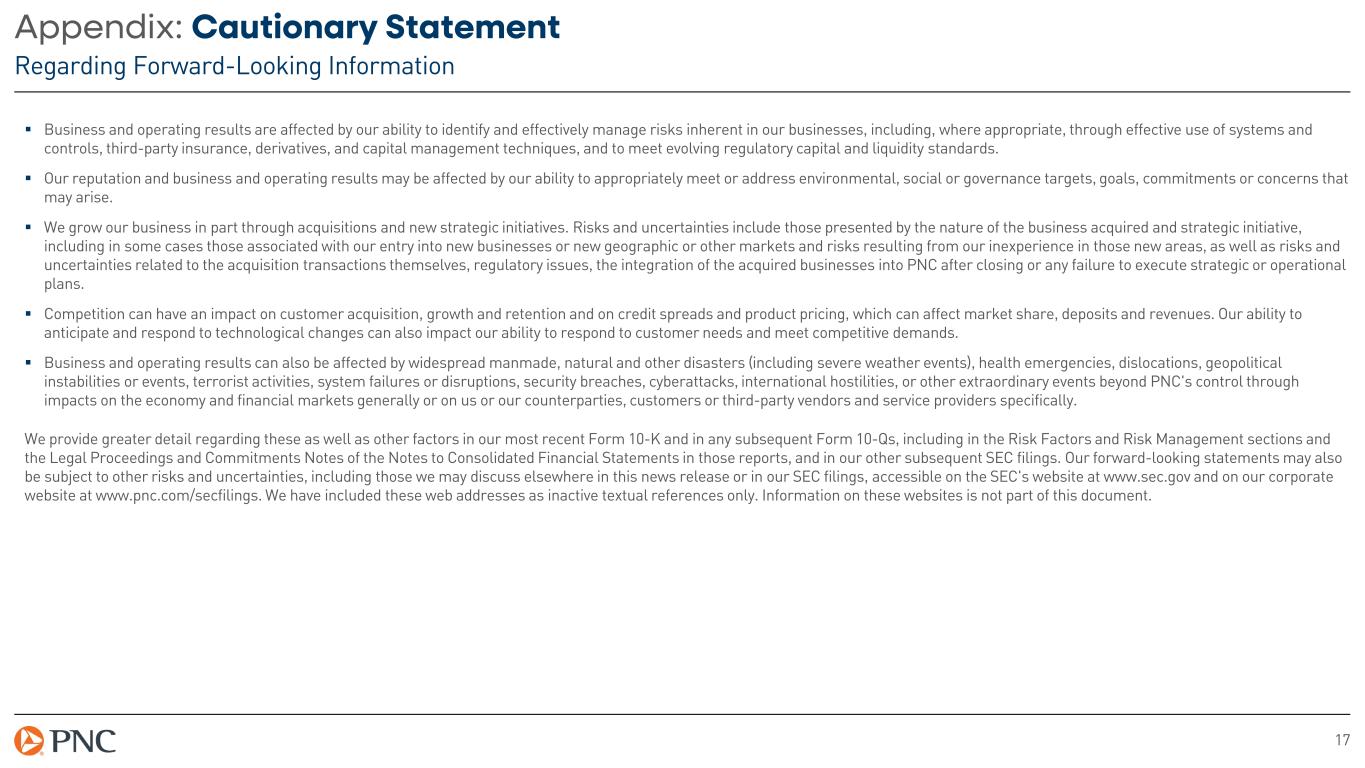
17 Appendix: Cautionary Statement Regarding Forward-Looking Information Business and operating results are affected by our ability to identify and effectively manage risks inherent in our businesses, including, where appropriate, through effective use of systems and controls, third-party insurance, derivatives, and capital management techniques, and to meet evolving regulatory capital and liquidity standards. Our reputation and business and operating results may be affected by our ability to appropriately meet or address environmental, social or governance targets, goals, commitments or concerns that may arise. We grow our business in part through acquisitions and new strategic initiatives. Risks and uncertainties include those presented by the nature of the business acquired and strategic initiative, including in some cases those associated with our entry into new businesses or new geographic or other markets and risks resulting from our inexperience in those new areas, as well as risks and uncertainties related to the acquisition transactions themselves, regulatory issues, the integration of the acquired businesses into PNC after closing or any failure to execute strategic or operational plans. Competition can have an impact on customer acquisition, growth and retention and on credit spreads and product pricing, which can affect market share, deposits and revenues. Our ability to anticipate and respond to technological changes can also impact our ability to respond to customer needs and meet competitive demands. Business and operating results can also be affected by widespread manmade, natural and other disasters (including severe weather events), health emergencies, dislocations, geopolitical instabilities or events, terrorist activities, system failures or disruptions, security breaches, cyberattacks, international hostilities, or other extraordinary events beyond PNC's control through impacts on the economy and financial markets generally or on us or our counterparties, customers or third-party vendors and service providers specifically. We provide greater detail regarding these as well as other factors in our most recent Form 10-K and in any subsequent Form 10-Qs, including in the Risk Factors and Risk Management sections and the Legal Proceedings and Commitments Notes of the Notes to Consolidated Financial Statements in those reports, and in our other subsequent SEC filings. Our forward-looking statements may also be subject to other risks and uncertainties, including those we may discuss elsewhere in this news release or in our SEC filings, accessible on the SEC's website at www.sec.gov and on our corporate website at www.pnc.com/secfilings. We have included these web addresses as inactive textual references only. Information on these websites is not part of this document.
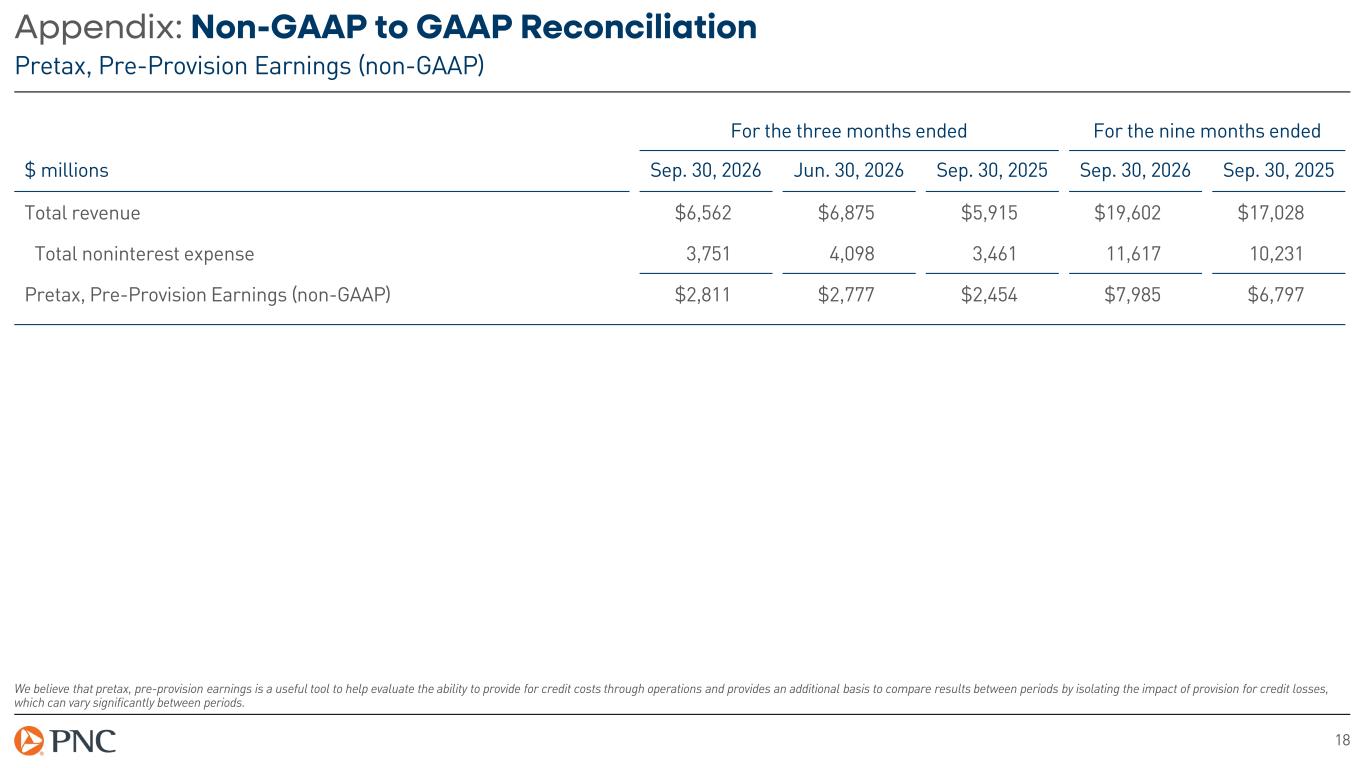
18 Appendix: Non-GAAP to GAAP Reconciliation Pretax, Pre-Provision Earnings (non-GAAP) We believe that pretax, pre-provision earnings is a useful tool to help evaluate the ability to provide for credit costs through operations and provides an additional basis to compare results between periods by isolating the impact of provision for credit losses, which can vary significantly between periods. For the three months ended For the nine months ended $ millions Sep. 30, 2026 Jun. 30, 2026 Sep. 30, 2025 Sep. 30, 2026 Sep. 30, 2025 Total revenue $6,562 $6,875 $5,915 $19,602 $17,028 Total noninterest expense 3,751 4,098 3,461 11,617 10,231 Pretax, Pre-Provision Earnings (non-GAAP) $2,811 $2,777 $2,454 $7,985 $6,797
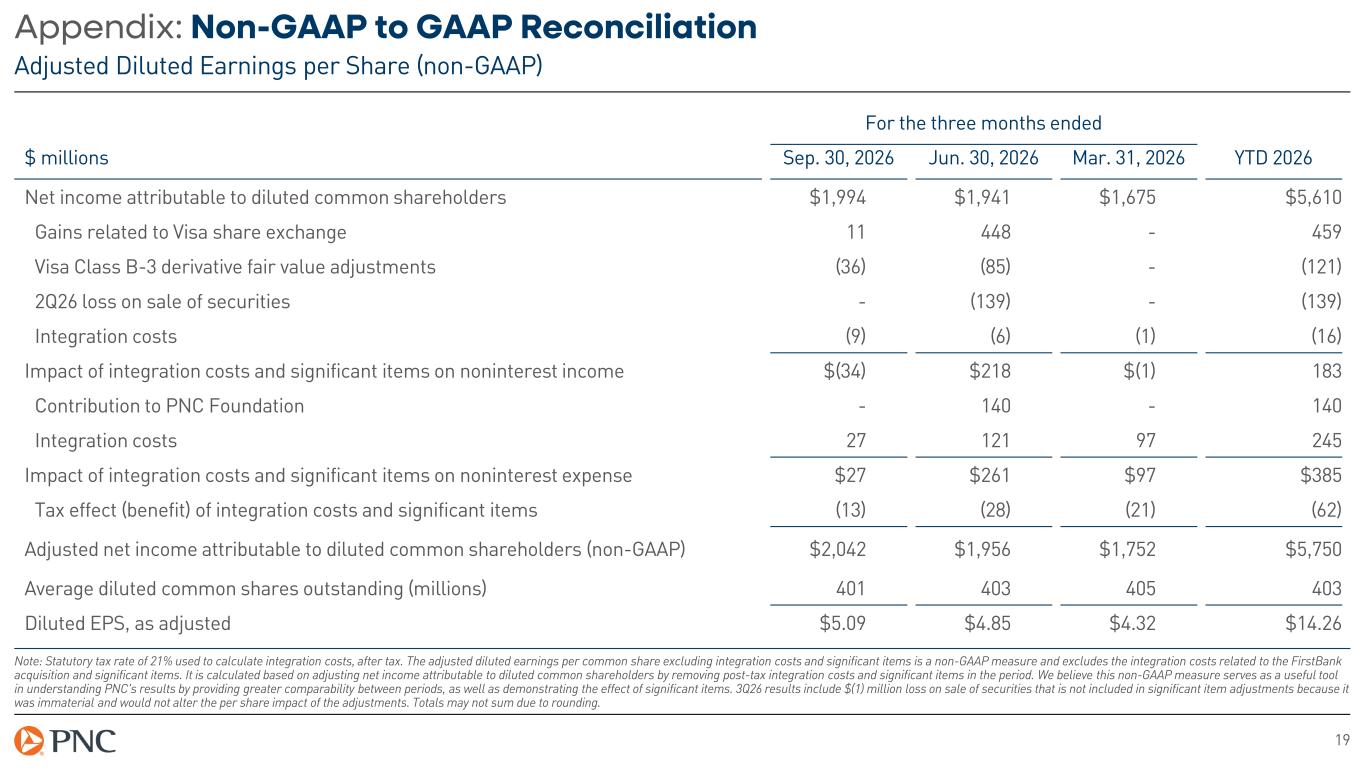
19 Appendix: Non-GAAP to GAAP Reconciliation Adjusted Diluted Earnings per Share (non-GAAP) Note: Statutory tax rate of 21% used to calculate integration costs, after tax. The adjusted diluted earnings per common share excluding integration costs and significant items is a non-GAAP measure and excludes the integration costs related to the FirstBank acquisition and significant items. It is calculated based on adjusting net income attributable to diluted common shareholders by removing post-tax integration costs and significant items in the period. We believe this non-GAAP measure serves as a useful tool in understanding PNC's results by providing greater comparability between periods, as well as demonstrating the effect of significant items. 3Q26 results include $(1) million loss on sale of securities that is not included in significant item adjustments because it was immaterial and would not alter the per share impact of the adjustments. Totals may not sum due to rounding. For the three months ended $ millions Sep. 30, 2026 Jun. 30, 2026 Mar. 31, 2026 YTD 2026 Net income attributable to diluted common shareholders $1,994 $1,941 $1,675 $5,610 Gains related to Visa share exchange 11 448 - 459 Visa Class B-3 derivative fair value adjustments (36) (85) - (121) 2Q26 loss on sale of securities - (139) - (139) Integration costs (9) (6) (1) (16) Impact of integration costs and significant items on noninterest income $(34) $218 $(1) 183 Contribution to PNC Foundation - 140 - 140 Integration costs 27 121 97 245 Impact of integration costs and significant items on noninterest expense $27 $261 $97 $385 Tax effect (benefit) of integration costs and significant items (13) (28) (21) (62) Adjusted net income attributable to diluted common shareholders (non-GAAP) $2,042 $1,956 $1,752 $5,750 Average diluted common shares outstanding (millions) 401 403 405 403 Diluted EPS, as adjusted $5.09 $4.85 $4.32 $14.26
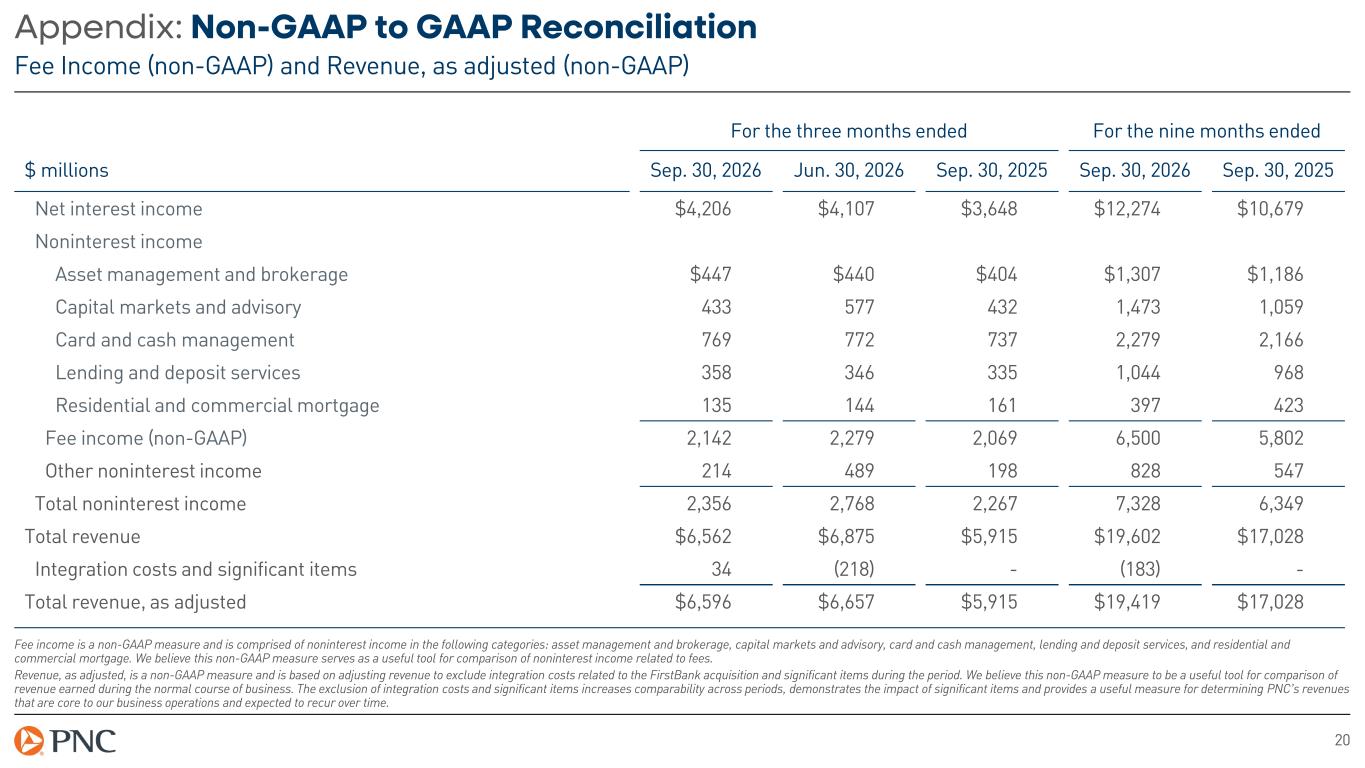
20 Appendix: Non-GAAP to GAAP Reconciliation Fee Income (non-GAAP) and Revenue, as adjusted (non-GAAP) For the three months ended For the nine months ended $ millions Sep. 30, 2026 Jun. 30, 2026 Sep. 30, 2025 Sep. 30, 2026 Sep. 30, 2025 Net interest income $4,206 $4,107 $3,648 $12,274 $10,679 Noninterest income Asset management and brokerage $447 $440 $404 $1,307 $1,186 Capital markets and advisory 433 577 432 1,473 1,059 Card and cash management 769 772 737 2,279 2,166 Lending and deposit services 358 346 335 1,044 968 Residential and commercial mortgage 135 144 161 397 423 Fee income (non-GAAP) 2,142 2,279 2,069 6,500 5,802 Other noninterest income 214 489 198 828 547 Total noninterest income 2,356 2,768 2,267 7,328 6,349 Total revenue $6,562 $6,875 $5,915 $19,602 $17,028 Integration costs and significant items 34 (218) - (183) - Total revenue, as adjusted $6,596 $6,657 $5,915 $19,419 $17,028 Fee income is a non-GAAP measure and is comprised of noninterest income in the following categories: asset management and brokerage, capital markets and advisory, card and cash management, lending and deposit services, and residential and commercial mortgage. We believe this non-GAAP measure serves as a useful tool for comparison of noninterest income related to fees. Revenue, as adjusted, is a non-GAAP measure and is based on adjusting revenue to exclude integration costs related to the FirstBank acquisition and significant items during the period. We believe this non-GAAP measure to be a useful tool for comparison of revenue earned during the normal course of business. The exclusion of integration costs and significant items increases comparability across periods, demonstrates the impact of significant items and provides a useful measure for determining PNC’s revenues that are core to our business operations and expected to recur over time.
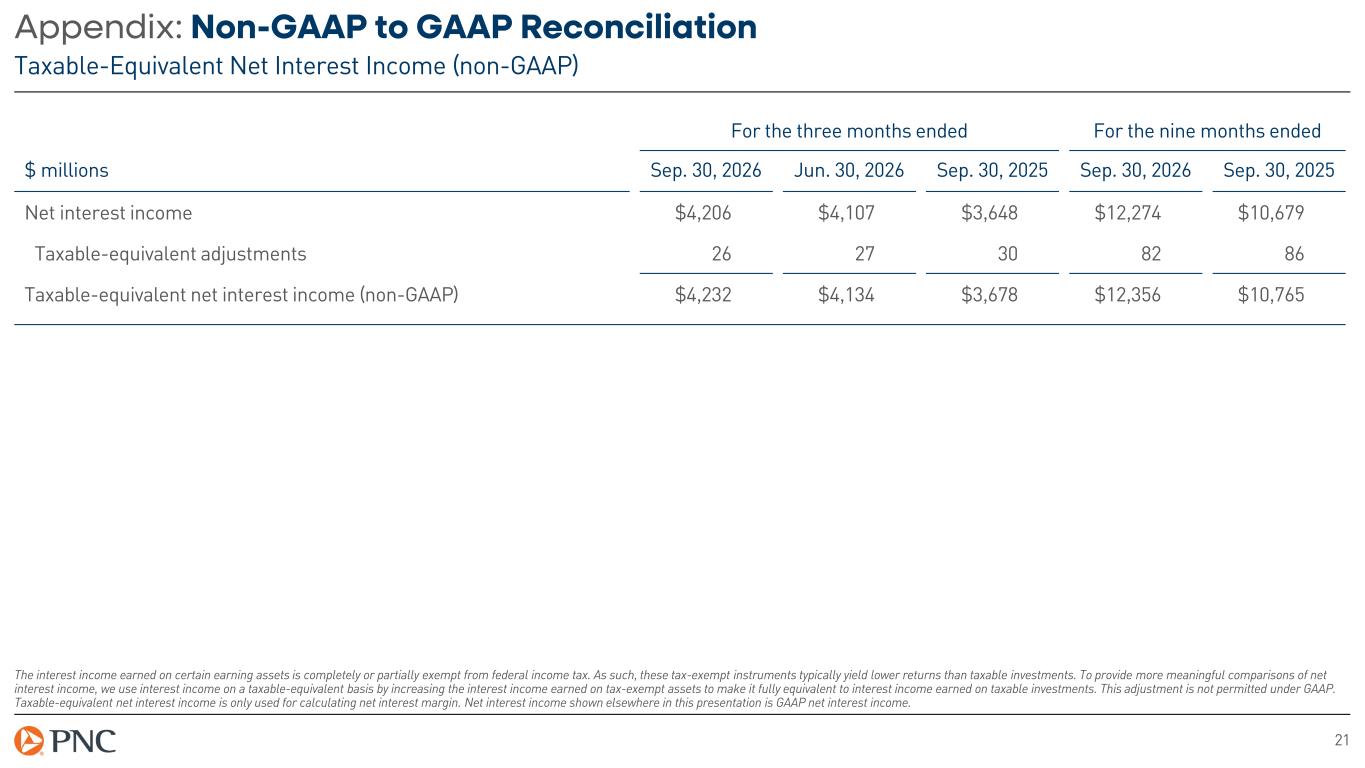
21 Appendix: Non-GAAP to GAAP Reconciliation Taxable-Equivalent Net Interest Income (non-GAAP) The interest income earned on certain earning assets is completely or partially exempt from federal income tax. As such, these tax-exempt instruments typically yield lower returns than taxable investments. To provide more meaningful comparisons of net interest income, we use interest income on a taxable-equivalent basis by increasing the interest income earned on tax-exempt assets to make it fully equivalent to interest income earned on taxable investments. This adjustment is not permitted under GAAP. Taxable-equivalent net interest income is only used for calculating net interest margin. Net interest income shown elsewhere in this presentation is GAAP net interest income. For the three months ended For the nine months ended $ millions Sep. 30, 2026 Jun. 30, 2026 Sep. 30, 2025 Sep. 30, 2026 Sep. 30, 2025 Net interest income $4,206 $4,107 $3,648 $12,274 $10,679 Taxable-equivalent adjustments 26 27 30 82 86 Taxable-equivalent net interest income (non-GAAP) $4,232 $4,134 $3,678 $12,356 $10,765
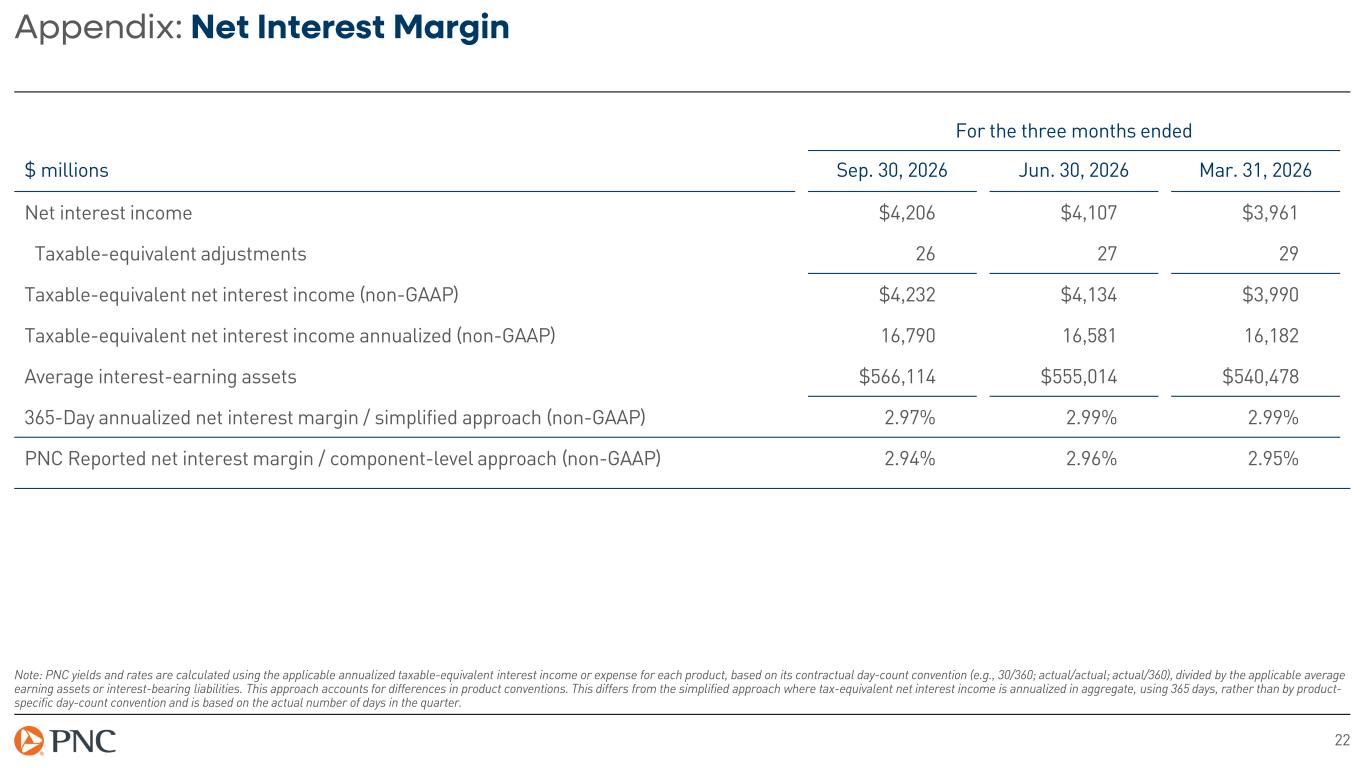
22 Appendix: Net Interest Margin Note: PNC yields and rates are calculated using the applicable annualized taxable-equivalent interest income or expense for each product, based on its contractual day-count convention (e.g., 30/360; actual/actual; actual/360), divided by the applicable average earning assets or interest-bearing liabilities. This approach accounts for differences in product conventions. This differs from the simplified approach where tax-equivalent net interest income is annualized in aggregate, using 365 days, rather than by product- specific day-count convention and is based on the actual number of days in the quarter. For the three months ended $ millions Sep. 30, 2026 Jun. 30, 2026 Mar. 31, 2026 Net interest income $4,206 $4,107 $3,961 Taxable-equivalent adjustments 26 27 29 Taxable-equivalent net interest income (non-GAAP) $4,232 $4,134 $3,990 Taxable-equivalent net interest income annualized (non-GAAP) 16,790 16,581 16,182 Average interest-earning assets $566,114 $555,014 $540,478 365-Day annualized net interest margin / simplified approach (non-GAAP) 2.97% 2.99% 2.99% PNC Reported net interest margin / component-level approach (non-GAAP) 2.94% 2.96% 2.95%
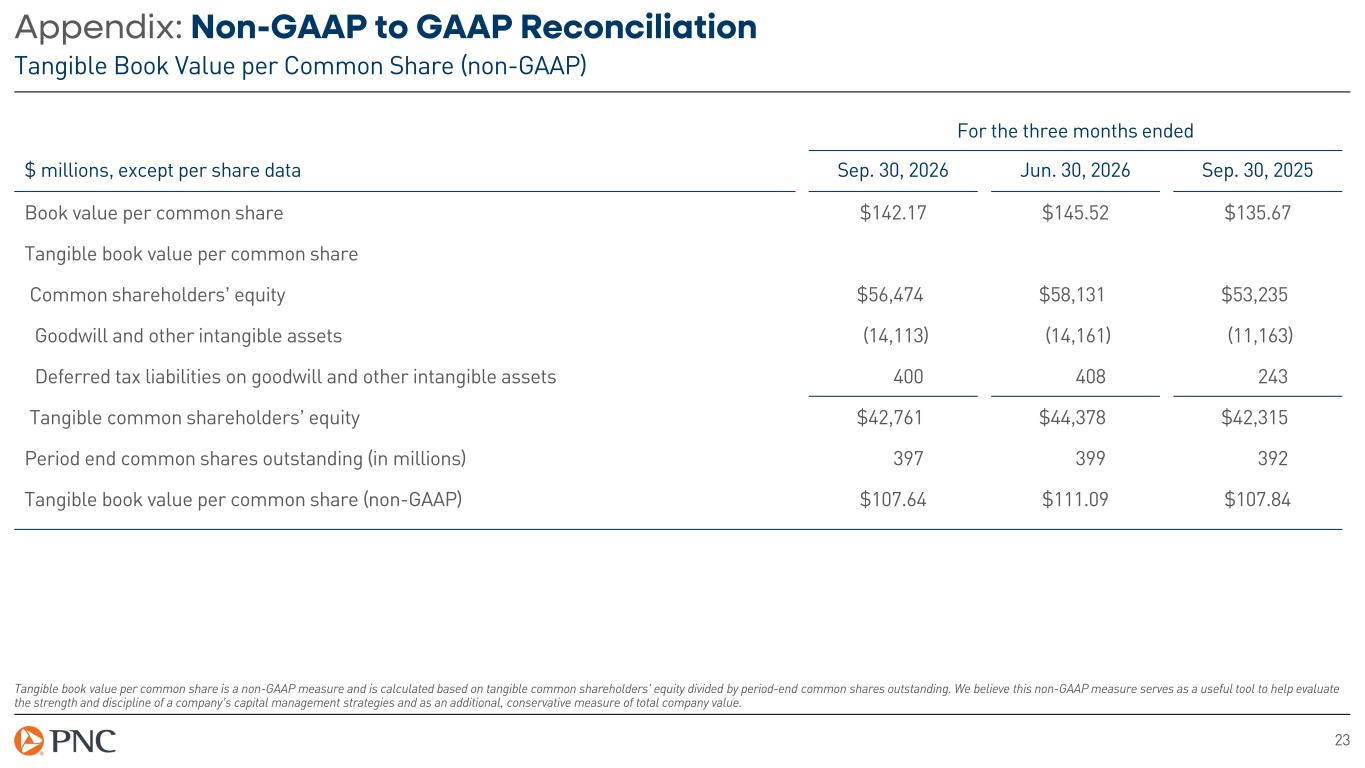
23 Appendix: Non-GAAP to GAAP Reconciliation Tangible Book Value per Common Share (non-GAAP) Tangible book value per common share is a non-GAAP measure and is calculated based on tangible common shareholders' equity divided by period-end common shares outstanding. We believe this non-GAAP measure serves as a useful tool to help evaluate the strength and discipline of a company’s capital management strategies and as an additional, conservative measure of total company value. For the three months ended $ millions, except per share data Sep. 30, 2026 Jun. 30, 2026 Sep. 30, 2025 Book value per common share $142.17 $145.52 $135.67 Tangible book value per common share Common shareholders’ equity $56,474 $58,131 $53,235 Goodwill and other intangible assets (14,113) (14,161) (11,163) Deferred tax liabilities on goodwill and other intangible assets 400 408 243 Tangible common shareholders’ equity $42,761 $44,378 $42,315 Period end common shares outstanding (in millions) 397 399 392 Tangible book value per common share (non-GAAP) $107.64 $111.09 $107.84
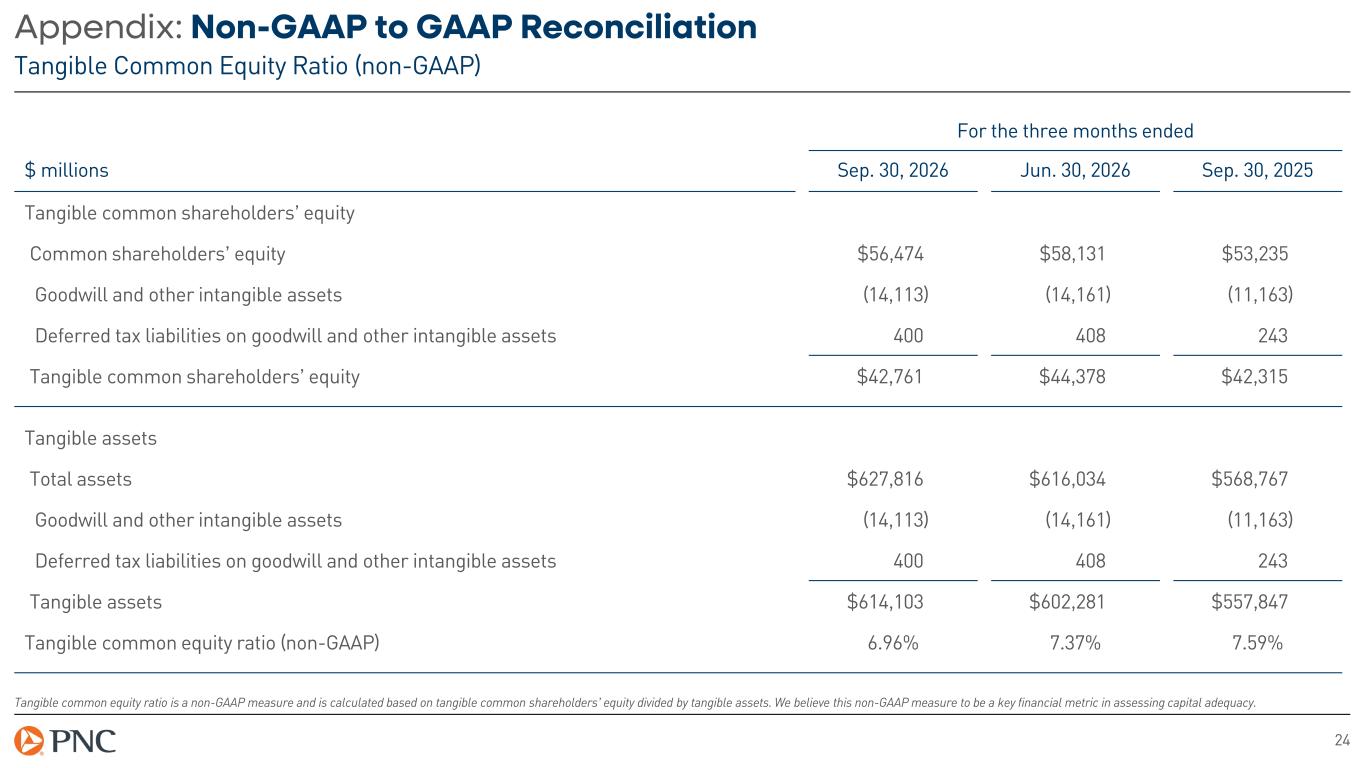
24 Appendix: Non-GAAP to GAAP Reconciliation Tangible Common Equity Ratio (non-GAAP) Tangible common equity ratio is a non-GAAP measure and is calculated based on tangible common shareholders’ equity divided by tangible assets. We believe this non-GAAP measure to be a key financial metric in assessing capital adequacy. For the three months ended $ millions Sep. 30, 2026 Jun. 30, 2026 Sep. 30, 2025 Tangible common shareholders’ equity Common shareholders’ equity $56,474 $58,131 $53,235 Goodwill and other intangible assets (14,113) (14,161) (11,163) Deferred tax liabilities on goodwill and other intangible assets 400 408 243 Tangible common shareholders’ equity $42,761 $44,378 $42,315 Tangible assets Total assets $627,816 $616,034 $568,767 Goodwill and other intangible assets (14,113) (14,161) (11,163) Deferred tax liabilities on goodwill and other intangible assets 400 408 243 Tangible assets $614,103 $602,281 $557,847 Tangible common equity ratio (non-GAAP) 6.96% 7.37% 7.59%
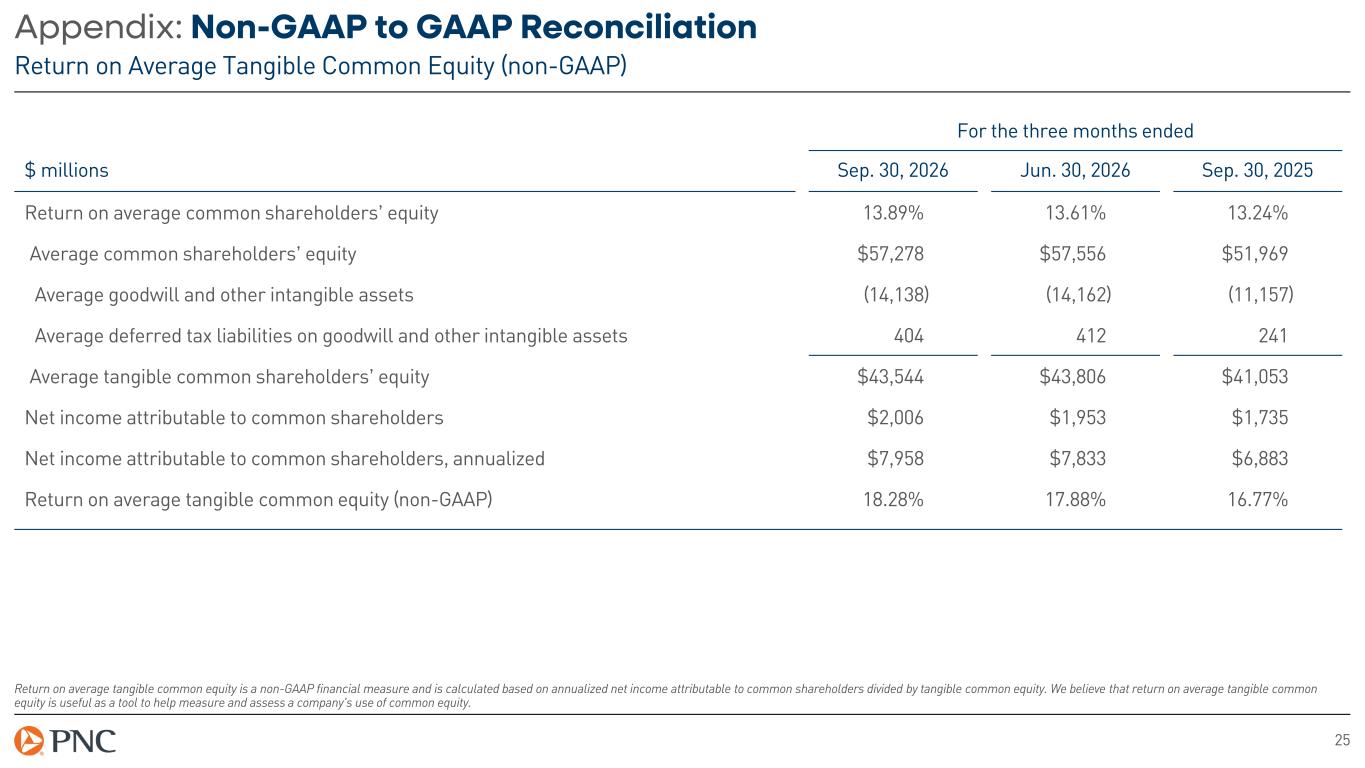
25 Appendix: Non-GAAP to GAAP Reconciliation Return on Average Tangible Common Equity (non-GAAP) Return on average tangible common equity is a non-GAAP financial measure and is calculated based on annualized net income attributable to common shareholders divided by tangible common equity. We believe that return on average tangible common equity is useful as a tool to help measure and assess a company's use of common equity. For the three months ended $ millions Sep. 30, 2026 Jun. 30, 2026 Sep. 30, 2025 Return on average common shareholders’ equity 13.89% 13.61% 13.24% Average common shareholders’ equity $57,278 $57,556 $51,969 Average goodwill and other intangible assets (14,138) (14,162) (11,157) Average deferred tax liabilities on goodwill and other intangible assets 404 412 241 Average tangible common shareholders’ equity $43,544 $43,806 $41,053 Net income attributable to common shareholders $2,006 $1,953 $1,735 Net income attributable to common shareholders, annualized $7,958 $7,833 $6,883 Return on average tangible common equity (non-GAAP) 18.28% 17.88% 16.77%
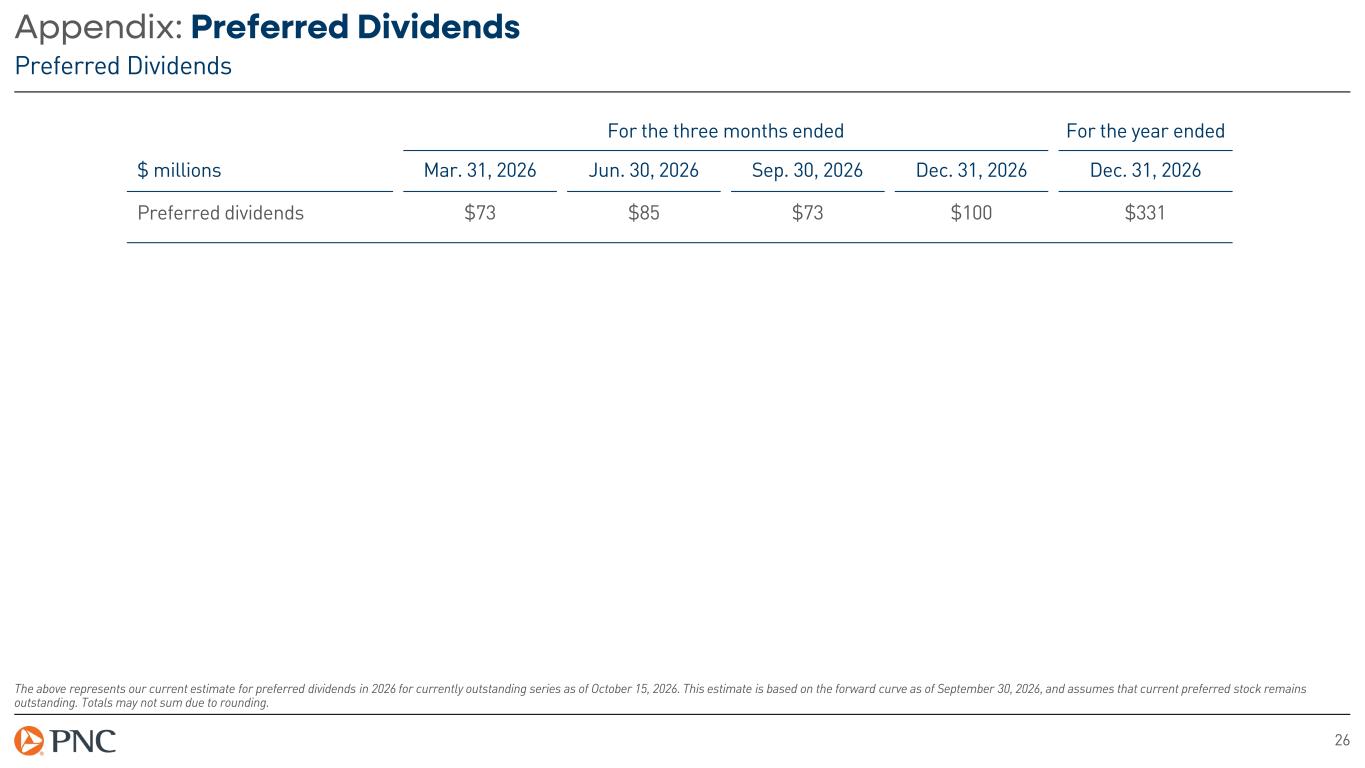
26 Appendix: Preferred Dividends Preferred Dividends The above represents our current estimate for preferred dividends in 2026 for currently outstanding series as of October 15, 2026. This estimate is based on the forward curve as of September 30, 2026, and assumes that current preferred stock remains outstanding. Totals may not sum due to rounding. For the three months ended For the year ended $ millions Mar. 31, 2026 Jun. 30, 2026 Sep. 30, 2026 Dec. 31, 2026 Dec. 31, 2026 Preferred dividends $73 $85 $73 $100 $331
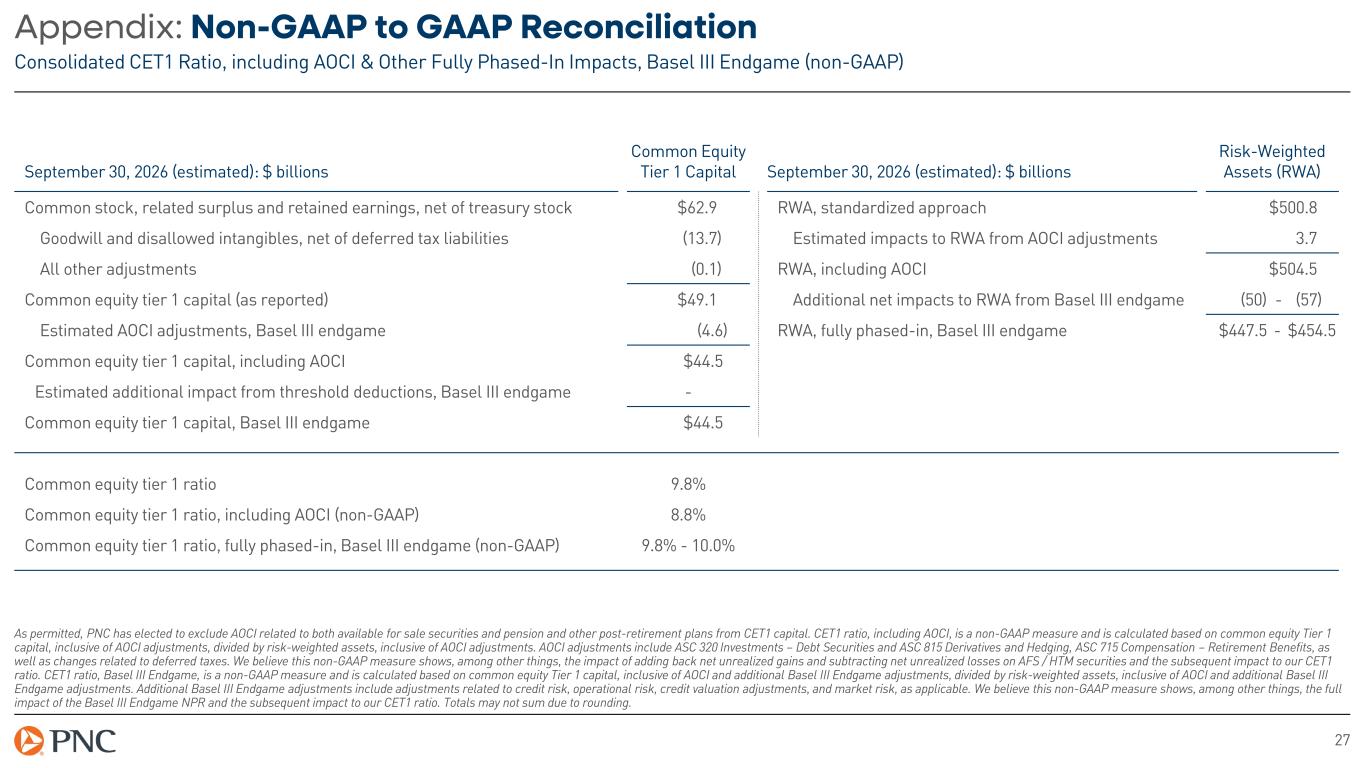
27 Appendix: Non-GAAP to GAAP Reconciliation Consolidated CET1 Ratio, including AOCI & Other Fully Phased-In Impacts, Basel III Endgame (non-GAAP) As permitted, PNC has elected to exclude AOCI related to both available for sale securities and pension and other post-retirement plans from CET1 capital. CET1 ratio, including AOCI, is a non-GAAP measure and is calculated based on common equity Tier 1 capital, inclusive of AOCI adjustments, divided by risk-weighted assets, inclusive of AOCI adjustments. AOCI adjustments include ASC 320 Investments – Debt Securities and ASC 815 Derivatives and Hedging, ASC 715 Compensation – Retirement Benefits, as well as changes related to deferred taxes. We believe this non-GAAP measure shows, among other things, the impact of adding back net unrealized gains and subtracting net unrealized losses on AFS / HTM securities and the subsequent impact to our CET1 ratio. CET1 ratio, Basel III Endgame, is a non-GAAP measure and is calculated based on common equity Tier 1 capital, inclusive of AOCI and additional Basel III Endgame adjustments, divided by risk-weighted assets, inclusive of AOCI and additional Basel III Endgame adjustments. Additional Basel III Endgame adjustments include adjustments related to credit risk, operational risk, credit valuation adjustments, and market risk, as applicable. We believe this non-GAAP measure shows, among other things, the full impact of the Basel III Endgame NPR and the subsequent impact to our CET1 ratio. Totals may not sum due to rounding. September 30, 2026 (estimated): $ billions Common Equity Tier 1 Capital September 30, 2026 (estimated): $ billions Risk-Weighted Assets (RWA) Common stock, related surplus and retained earnings, net of treasury stock $62.9 RWA, standardized approach $500.8 Goodwill and disallowed intangibles, net of deferred tax liabilities (13.7) Estimated impacts to RWA from AOCI adjustments 3.7 All other adjustments (0.1) RWA, including AOCI $504.5 Common equity tier 1 capital (as reported) $49.1 Additional net impacts to RWA from Basel III endgame (50) - (57) Estimated AOCI adjustments, Basel III endgame (4.6) RWA, fully phased-in, Basel III endgame $447.5 - $454.5 Common equity tier 1 capital, including AOCI $44.5 Estimated additional impact from threshold deductions, Basel III endgame - Common equity tier 1 capital, Basel III endgame $44.5 Common equity tier 1 ratio 9.8% Common equity tier 1 ratio, including AOCI (non-GAAP) 8.8% Common equity tier 1 ratio, fully phased-in, Basel III endgame (non-GAAP) 9.8% - 10.0%
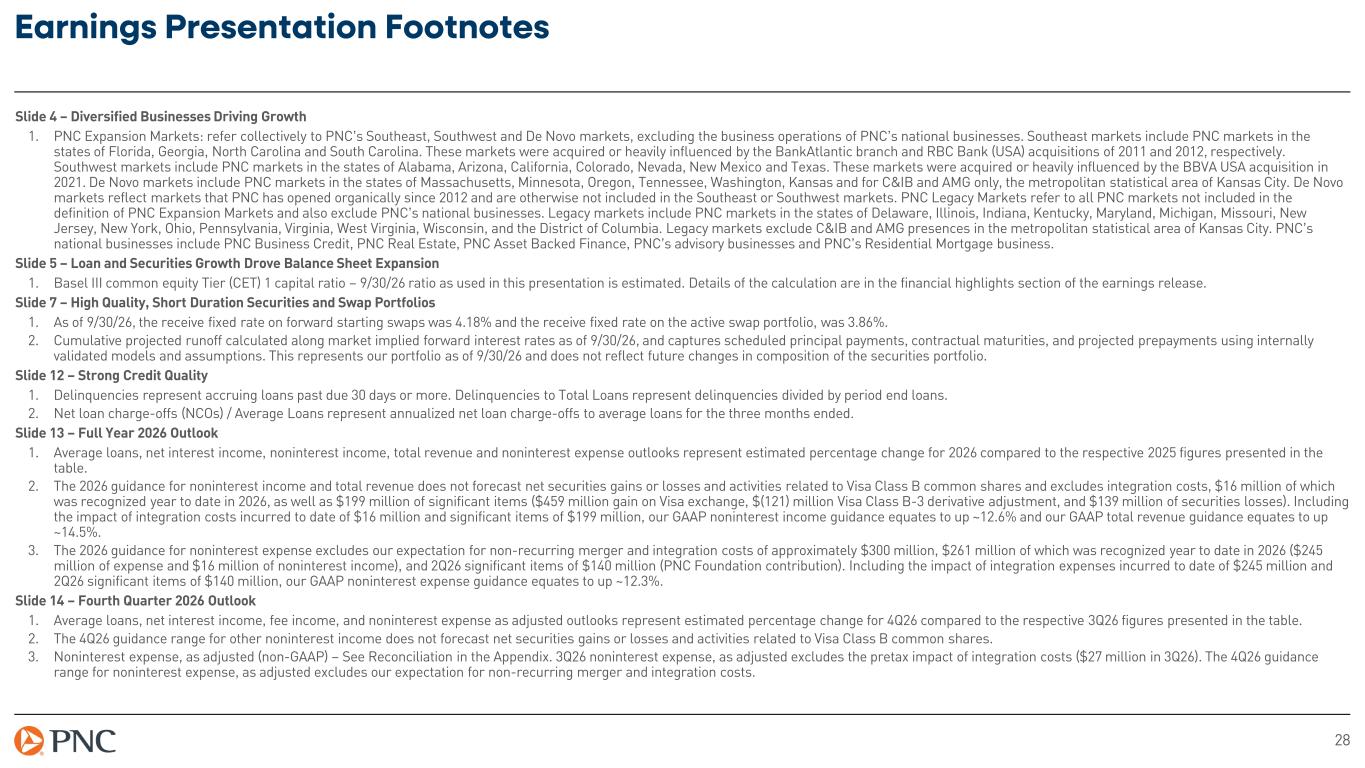
28 Earnings Presentation Footnotes Slide 4 – Diversified Businesses Driving Growth 1. PNC Expansion Markets: refer collectively to PNC’s Southeast, Southwest and De Novo markets, excluding the business operations of PNC’s national businesses. Southeast markets include PNC markets in the states of Florida, Georgia, North Carolina and South Carolina. These markets were acquired or heavily influenced by the BankAtlantic branch and RBC Bank (USA) acquisitions of 2011 and 2012, respectively. Southwest markets include PNC markets in the states of Alabama, Arizona, California, Colorado, Nevada, New Mexico and Texas. These markets were acquired or heavily influenced by the BBVA USA acquisition in 2021. De Novo markets include PNC markets in the states of Massachusetts, Minnesota, Oregon, Tennessee, Washington, Kansas and for C&IB and AMG only, the metropolitan statistical area of Kansas City. De Novo markets reflect markets that PNC has opened organically since 2012 and are otherwise not included in the Southeast or Southwest markets. PNC Legacy Markets refer to all PNC markets not included in the definition of PNC Expansion Markets and also exclude PNC’s national businesses. Legacy markets include PNC markets in the states of Delaware, Illinois, Indiana, Kentucky, Maryland, Michigan, Missouri, New Jersey, New York, Ohio, Pennsylvania, Virginia, West Virginia, Wisconsin, and the District of Columbia. Legacy markets exclude C&IB and AMG presences in the metropolitan statistical area of Kansas City. PNC’s national businesses include PNC Business Credit, PNC Real Estate, PNC Asset Backed Finance, PNC’s advisory businesses and PNC’s Residential Mortgage business. Slide 5 – Loan and Securities Growth Drove Balance Sheet Expansion 1. Basel III common equity Tier (CET) 1 capital ratio – 9/30/26 ratio as used in this presentation is estimated. Details of the calculation are in the financial highlights section of the earnings release. Slide 7 – High Quality, Short Duration Securities and Swap Portfolios 1. As of 9/30/26, the receive fixed rate on forward starting swaps was 4.18% and the receive fixed rate on the active swap portfolio, was 3.86%. 2. Cumulative projected runoff calculated along market implied forward interest rates as of 9/30/26, and captures scheduled principal payments, contractual maturities, and projected prepayments using internally validated models and assumptions. This represents our portfolio as of 9/30/26 and does not reflect future changes in composition of the securities portfolio. Slide 12 – Strong Credit Quality 1. Delinquencies represent accruing loans past due 30 days or more. Delinquencies to Total Loans represent delinquencies divided by period end loans. 2. Net loan charge-offs (NCOs) / Average Loans represent annualized net loan charge-offs to average loans for the three months ended. Slide 13 – Full Year 2026 Outlook 1. Average loans, net interest income, noninterest income, total revenue and noninterest expense outlooks represent estimated percentage change for 2026 compared to the respective 2025 figures presented in the table. 2. The 2026 guidance for noninterest income and total revenue does not forecast net securities gains or losses and activities related to Visa Class B common shares and excludes integration costs, $16 million of which was recognized year to date in 2026, as well as $199 million of significant items ($459 million gain on Visa exchange, $(121) million Visa Class B-3 derivative adjustment, and $139 million of securities losses). Including the impact of integration costs incurred to date of $16 million and significant items of $199 million, our GAAP noninterest income guidance equates to up ~12.6% and our GAAP total revenue guidance equates to up ~14.5%. 3. The 2026 guidance for noninterest expense excludes our expectation for non-recurring merger and integration costs of approximately $300 million, $261 million of which was recognized year to date in 2026 ($245 million of expense and $16 million of noninterest income), and 2Q26 significant items of $140 million (PNC Foundation contribution). Including the impact of integration expenses incurred to date of $245 million and 2Q26 significant items of $140 million, our GAAP noninterest expense guidance equates to up ~12.3%. Slide 14 – Fourth Quarter 2026 Outlook 1. Average loans, net interest income, fee income, and noninterest expense as adjusted outlooks represent estimated percentage change for 4Q26 compared to the respective 3Q26 figures presented in the table. 2. The 4Q26 guidance range for other noninterest income does not forecast net securities gains or losses and activities related to Visa Class B common shares. 3. Noninterest expense, as adjusted (non-GAAP) – See Reconciliation in the Appendix. 3Q26 noninterest expense, as adjusted excludes the pretax impact of integration costs ($27 million in 3Q26). The 4Q26 guidance range for noninterest expense, as adjusted excludes our expectation for non-recurring merger and integration costs.