O C T O B E R 2 0 2 6
Q 4 F Y 2 0 2 6 S u p p l e m e n t a l S l i d e s This presentation contains forward-looking statements within the meaning of the federal securities laws with respect to the expected benefits of the recent acquisitions of Concrete Pipe & Precast (“CP&P”) and Foley Products Company (“Foley”), general economic conditions, key macro-economic drivers that impact our business, the effects of ongoing trade actions, the effects of continued pressure on the liquidity of our customers, potential synergies and growth provided by acquisitions and strategic investments, the performance of the precast business, demand for our products, shipment volumes, metal margins, backlog volumes, the ability to operate our steel mills at full capacity particularly during periods of domestic mill start-ups, future availability and cost of supplies of raw materials and energy for our operations, growth rates in certain reportable segments, product margins within our Construction Solutions Group segment, share repurchases, legal proceedings, construction activity, international trade, the impact of geopolitical conditions, the effects of CBAM and other EU trade measures on European demand and pricing, capital expenditures, tax credits, the timing, amount and recurrence of CO2 or emissions-related credits, our liquidity and our ability to satisfy future liquidity requirements, our ability to achieve our stated deleveraging target within the anticipated timeframe, estimated contractual obligations, the expected capabilities and benefits of new facilities, anticipated benefits and the timeline for execution of our growth plan and initiatives, including our Transform, Advance and Grow (“TAG”) operational and commercial excellence program, our long-term financial targets and expectations for future financial performance and our expectations or beliefs concerning future events. The statements in this presentation that are not historical statements, are forward-looking statements. These forward-looking statements can generally be identified by phrases such as we or our management “expects,” “anticipates,” “believes,” “estimates,” “intends,” “may,” “plans to,” “ought,” “could,” “will,” “should,” “likely,” “appears,” “projects,” “forecasts,” “outlook” or other similar words or phrases, as well as by discussions of strategy, plans or intentions. Our forward-looking statements are based on management’s expectations and beliefs as of the date of this presentation. Although we believe that our expectations are reasonable, we can give no assurance that these expectations will prove to have been correct, and actual results may vary materially. Except as required by law, we undertake no obligation to update, amend or clarify any forward-looking statements to reflect changed assumptions, the occurrence of anticipated or unanticipated events, new information or circumstances or any other changes. Important factors that could cause actual results to differ materially from our expectations include those described in our filings with the Securities and Exchange Commission, including, but not limited to, in Part I, Item 1A, “Risk Factors” of our annual report on Form 10-K for the fiscal year ended August 31, 2025, as well as the following: changes in economic conditions which affect demand for our products or construction activity generally, and the impact of such changes on the highly cyclical steel industry; rapid and significant changes in the price of metals, potentially impairing our inventory values due to declines in commodity prices or reducing the profitability of downstream contracts within our vertically integrated steel operations due to rising commodity pricing; excess capacity in our industry, particularly in China, and product availability from competing steel mills and other steel suppliers including import quantities and pricing; the impact of additional steelmaking capacity expected to come online from a number of electric arc furnace projects in the U.S.; the impact of geopolitical conditions, including political turmoil and volatility, regional conflicts, terrorism and war on the global economy, inflation, energy supplies and raw materials; global factors, such as trade measures, military conflicts and political uncertainties, including changes to current trade regulations, such as Section 232 trade tariffs and quotas, tax legislation and other regulations which might adversely impact our business; operating and startup risks, as well as market risks associated with the commissioning of new projects could prevent us from realizing anticipated benefits and could result in a loss of all or a substantial part of our investments; our ability to successfully execute our TAG operational and commercial excellence program and other transformation initiatives, including the realization of anticipated benefits within the expected timeframes; attention to environmental, social and governance (“ESG”) matters, including any targets or other ESG, environmental justice or regulatory initiatives; impacts from global public health crises on the economy, demand for our products, global supply chain and on our operations; compliance with and changes in existing and future laws, regulations and other legal requirements and judicial decisions that govern our business, including increased environmental regulations associated with climate change and greenhouse gas emissions; involvement in various environmental matters that may result in fines, penalties or judgments; evolving remediation technology, changing regulations, possible third-party contributions, the inherent uncertainties of the estimation process and other factors that may impact amounts accrued for environmental liabilities; potential limitations in our or our customers' abilities to access credit and non-compliance with their contractual obligations, including payment obligations; activity in repurchasing shares of our common stock under our share repurchase program; financial and non-financial covenants and restrictions on the operation of our business contained in agreements governing our debt; our ability to successfully identify, consummate and integrate acquisitions and realize any or all of the anticipated synergies or other benefits of acquisitions; the effects that acquisitions may have on our financial leverage; risks associated with acquisitions generally, such as the inability to obtain, or delays in obtaining, required approvals under applicable antitrust legislation and other regulatory and third-party consents and approvals; lower than expected future levels of revenues and higher than expected future costs; failure or inability to implement growth strategies in a timely manner; the impact of goodwill or other indefinite-lived intangible asset impairment charges; the impact of long-lived asset impairment charges; currency fluctuations; availability and pricing of electricity, electrodes and natural gas for mill operations; our ability to hire and retain key executives and other employees; competition from other materials or from competitors that have a lower cost structure or access to greater financial resources; information technology interruptions and breaches in security; our ability to make necessary capital expenditures; availability and pricing of raw materials and other items over which we exert little influence, including scrap metal, energy and insurance; unexpected equipment failures; losses or limited potential gains due to hedging transactions; litigation claims and settlements, court decisions, regulatory rulings and legal compliance risks, including risks related to the Pacific Steel Group (“PSG”) litigation; risk of injury or death to employees, customers or other visitors to our operations; and civil unrest, protests and riots. This presentation includes illustrative financial information with respect to the Company’s precast concrete and concrete pipe products business (together, the “precast platform”), which information is estimated based on historical results of CP&P and Foley. This information is presented for illustrative purposes only and is based on available information and certain assumptions and estimates that we believe are reasonable. The illustrative precast platform financial information presented herein has not been prepared and presented in accordance with the requirements of Regulation S-X. The assumptions and estimates underlying the precast platform financial information are inherently uncertain and are subject to a variety of significant business, economic and competitive risks and uncertainties that could cause actual results to differ materially from those contained in the illustrative financial information, including the risks and uncertainties described above. The illustrative precast platform financial information may not necessarily reflect what the precast platform’s results of operations and financial position will be in the future. The Company’s auditors have not audited, reviewed, compiled or performed any procedures with respect to the illustrative precast platform financial information. Forward-Looking Statements 2
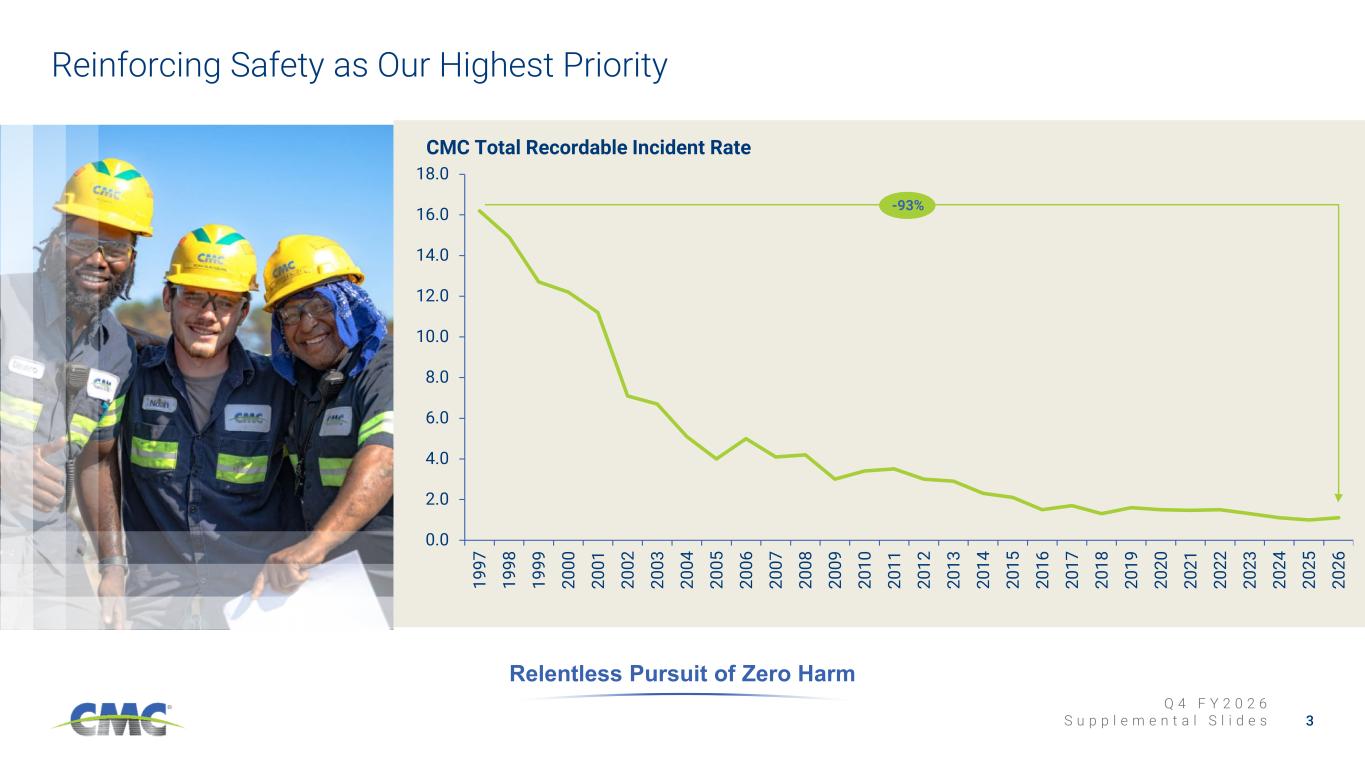
Q 4 F Y 2 0 2 6 S u p p l e m e n t a l S l i d e s 0.0 2.0 4.0 6.0 8.0 10.0 12.0 14.0 16.0 18.0 19 97 19 98 19 99 20 00 20 01 20 02 20 03 20 04 20 05 20 06 20 07 20 08 20 09 20 10 20 11 20 12 20 13 20 14 20 15 20 16 20 17 20 18 20 19 20 20 20 21 20 22 20 23 20 24 20 25 20 26 Reinforcing Safety as Our Highest Priority 3 Relentless Pursuit of Zero Harm CMC Total Recordable Incident Rate -93%
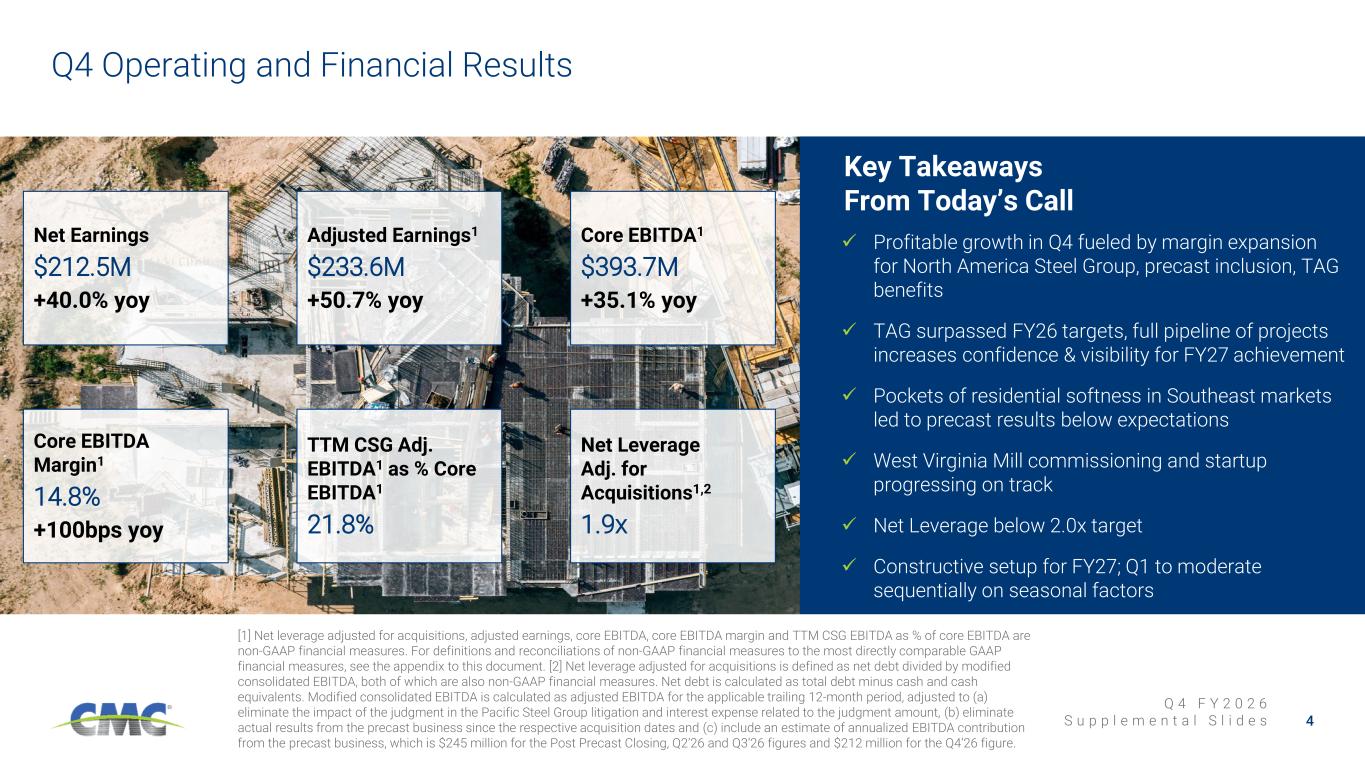
Q 4 F Y 2 0 2 6 S u p p l e m e n t a l S l i d e s Core EBITDA Margin1 14.8% +100bps yoy Net Leverage Adj. for Acquisitions1,2 1.9x Q4 Operating and Financial Results 4 [1] Net leverage adjusted for acquisitions, adjusted earnings, core EBITDA, core EBITDA margin and TTM CSG EBITDA as % of core EBITDA are non-GAAP financial measures. For definitions and reconciliations of non-GAAP financial measures to the most directly comparable GAAP financial measures, see the appendix to this document. [2] Net leverage adjusted for acquisitions is defined as net debt divided by modified consolidated EBITDA, both of which are also non-GAAP financial measures. Net debt is calculated as total debt minus cash and cash equivalents. Modified consolidated EBITDA is calculated as adjusted EBITDA for the applicable trailing 12-month period, adjusted to (a) eliminate the impact of the judgment in the Pacific Steel Group litigation and interest expense related to the judgment amount, (b) eliminate actual results from the precast business since the respective acquisition dates and (c) include an estimate of annualized EBITDA contribution from the precast business, which is $245 million for the Post Precast Closing, Q2’26 and Q3’26 figures and $212 million for the Q4’26 figure. Key Takeaways From Today’s Call Profitable growth in Q4 fueled by margin expansion for North America Steel Group, precast inclusion, TAG benefits TAG surpassed FY26 targets, full pipeline of projects increases confidence & visibility for FY27 achievement Pockets of residential softness in Southeast markets led to precast results below expectations West Virginia Mill commissioning and startup progressing on track Net Leverage below 2.0x target Constructive setup for FY27; Q1 to moderate sequentially on seasonal factors Net Earnings $212.5M +40.0% yoy Adjusted Earnings1 $233.6M +50.7% yoy Core EBITDA1 $393.7M +35.1% yoy TTM CSG Adj. EBITDA1 as % Core EBITDA1 21.8%
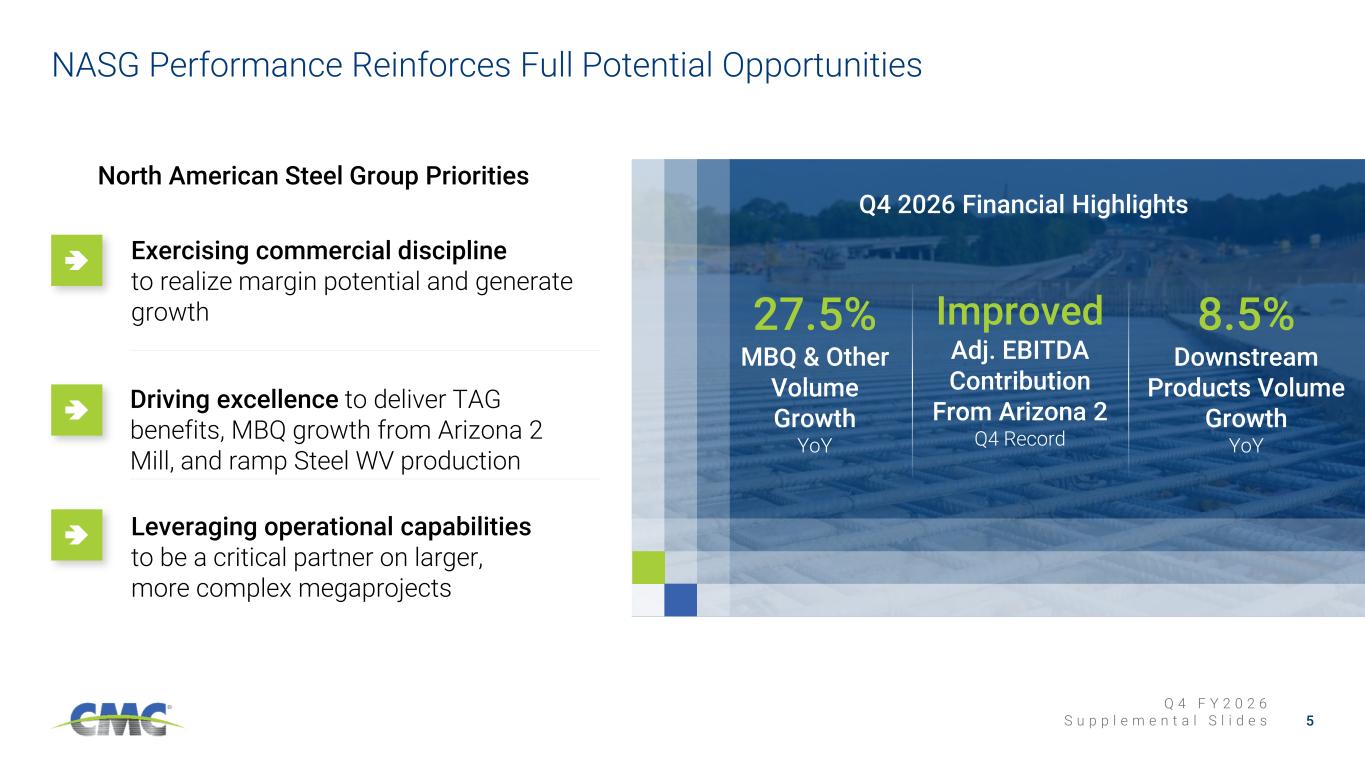
Q 4 F Y 2 0 2 6 S u p p l e m e n t a l S l i d e s NASG Performance Reinforces Full Potential Opportunities 5 Driving excellence to deliver TAG benefits, MBQ growth from Arizona 2 Mill, and ramp Steel WV production Exercising commercial discipline to realize margin potential and generate growth Q4 2026 Financial Highlights 27.5% MBQ & Other Volume Growth YoY 8.5% Downstream Products Volume Growth YoY Improved Adj. EBITDA Contribution From Arizona 2 Q4 Record North American Steel Group Priorities Leveraging operational capabilities to be a critical partner on larger, more complex megaprojects
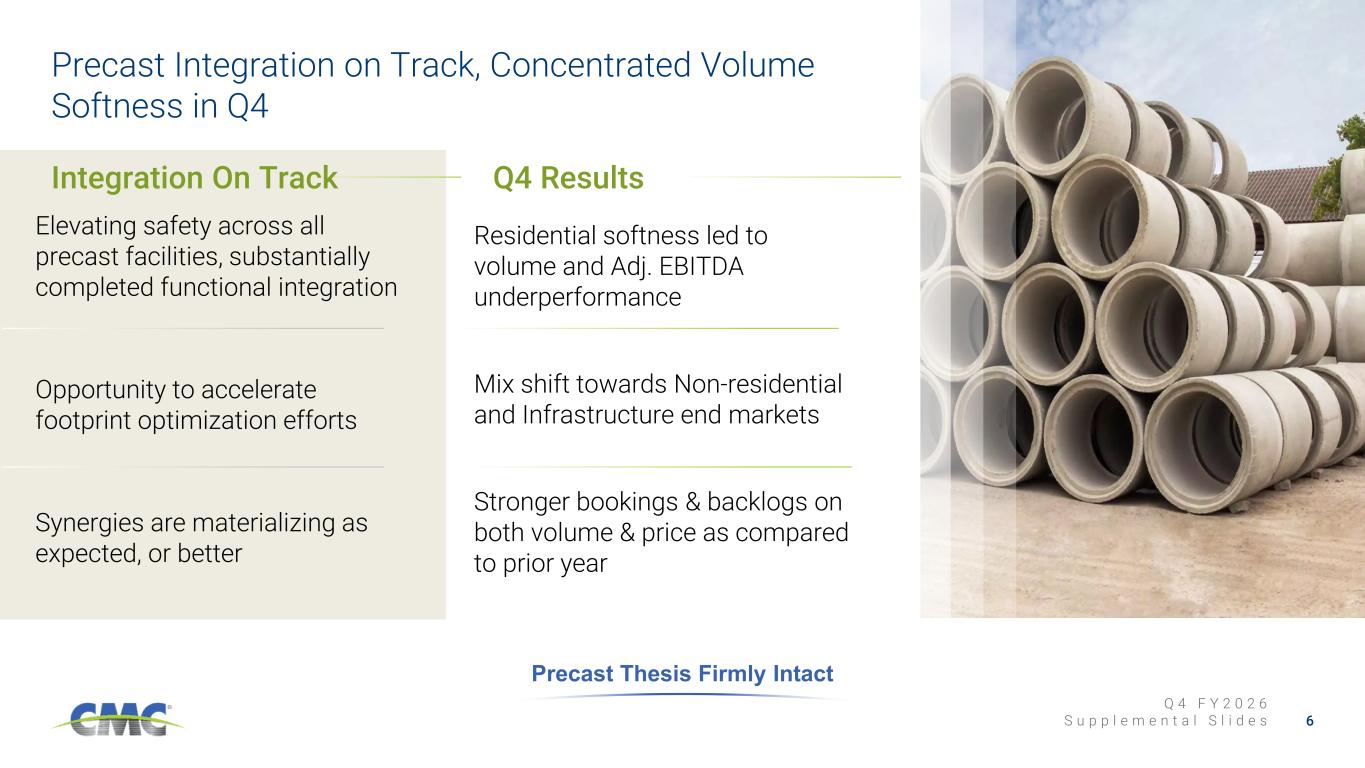
Q 4 F Y 2 0 2 6 S u p p l e m e n t a l S l i d e s Residential softness led to volume and Adj. EBITDA underperformance Mix shift towards Non-residential and Infrastructure end markets Stronger bookings & backlogs on both volume & price as compared to prior year Precast Integration on Track, Concentrated Volume Softness in Q4 6 Precast Thesis Firmly Intact Elevating safety across all precast facilities, substantially completed functional integration Opportunity to accelerate footprint optimization efforts Synergies are materializing as expected, or better Integration On Track Q4 Results
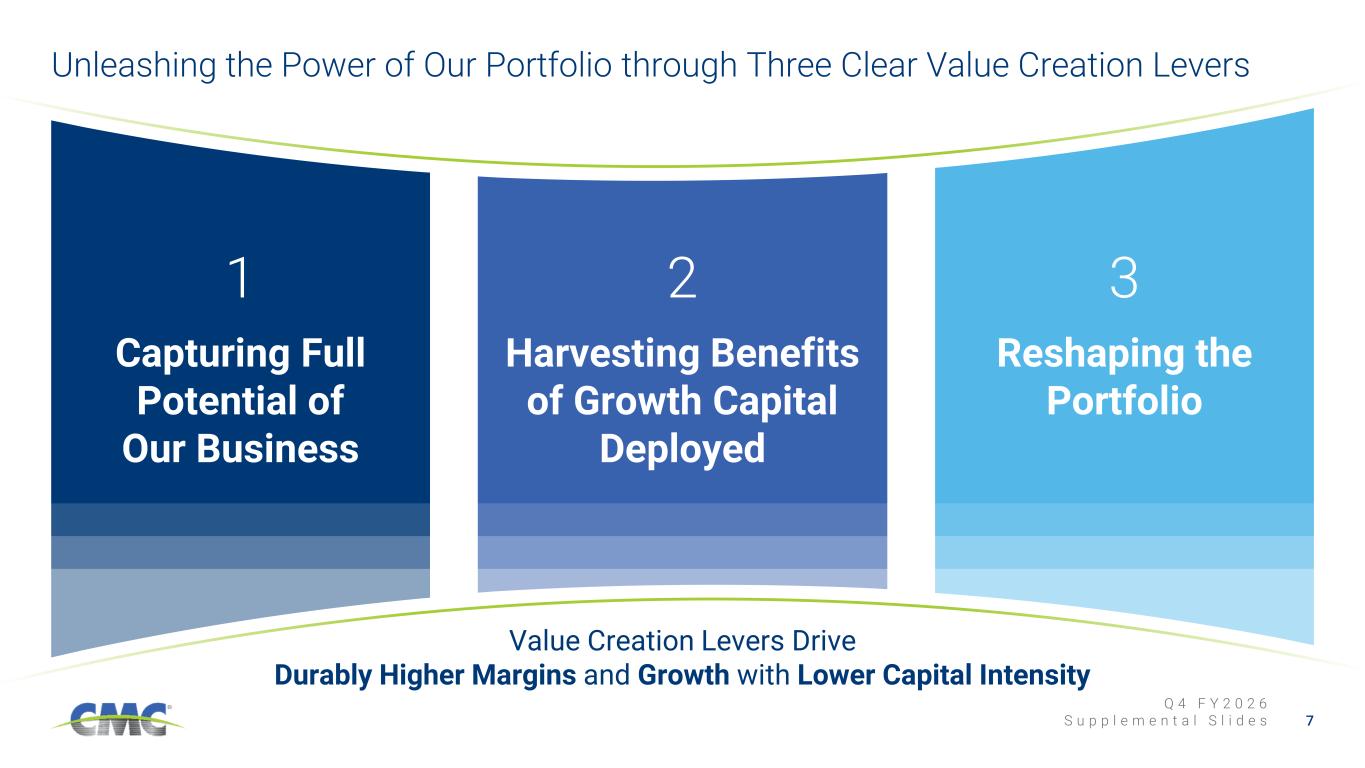
Q 4 F Y 2 0 2 6 S u p p l e m e n t a l S l i d e s Unleashing the Power of Our Portfolio through Three Clear Value Creation Levers Value Creation Levers Drive Durably Higher Margins and Growth with Lower Capital Intensity 1 Capturing Full Potential of Our Business 2 Harvesting Benefits of Growth Capital Deployed 3 Reshaping the Portfolio 7
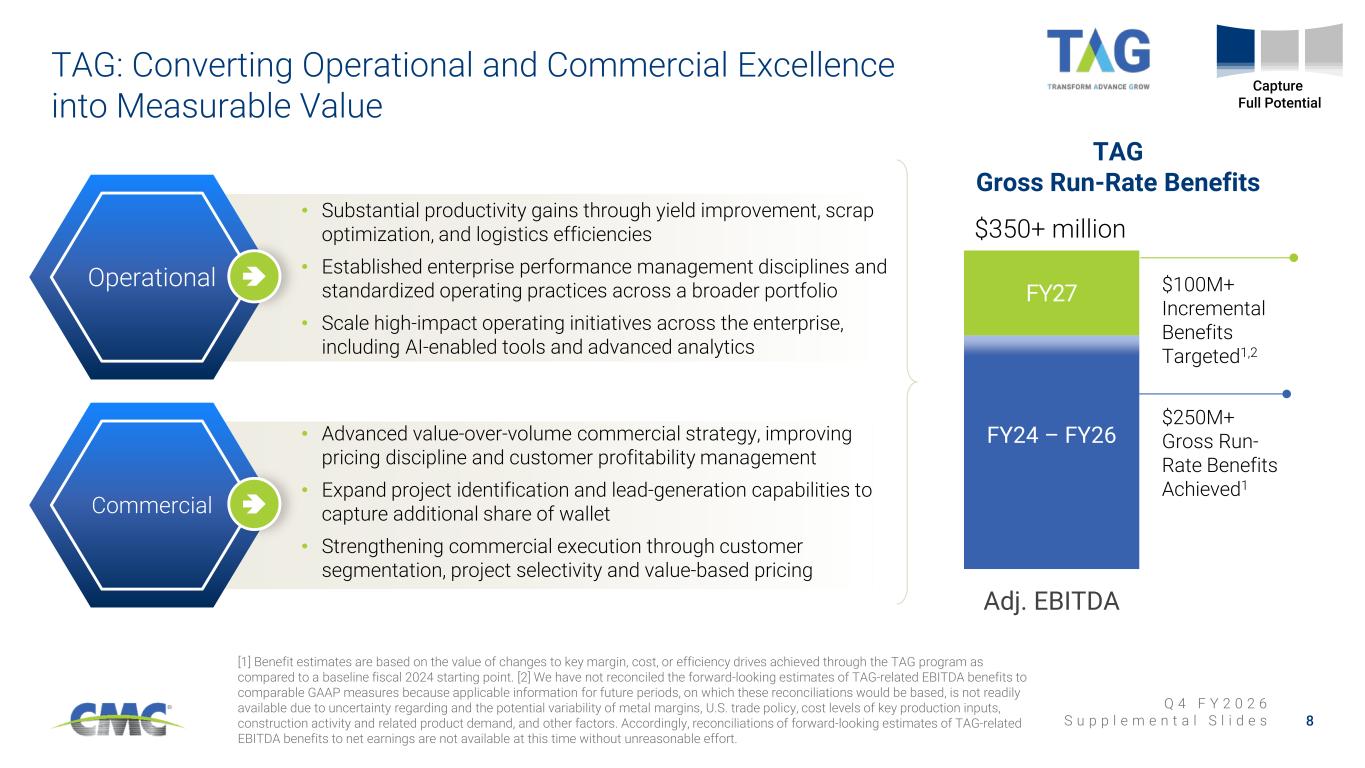
Q 4 F Y 2 0 2 6 S u p p l e m e n t a l S l i d e s TAG: Converting Operational and Commercial Excellence into Measurable Value 8 [1] Benefit estimates are based on the value of changes to key margin, cost, or efficiency drives achieved through the TAG program as compared to a baseline fiscal 2024 starting point. [2] We have not reconciled the forward-looking estimates of TAG-related EBITDA benefits to comparable GAAP measures because applicable information for future periods, on which these reconciliations would be based, is not readily available due to uncertainty regarding and the potential variability of metal margins, U.S. trade policy, cost levels of key production inputs, construction activity and related product demand, and other factors. Accordingly, reconciliations of forward-looking estimates of TAG-related EBITDA benefits to net earnings are not available at this time without unreasonable effort. FY24 – FY26 FY27 $0 $50 $100 $150 $200 $250 $300 $350 $400 Adj. EBITDA Operational Commercial • Substantial productivity gains through yield improvement, scrap optimization, and logistics efficiencies • Established enterprise performance management disciplines and standardized operating practices across a broader portfolio • Scale high-impact operating initiatives across the enterprise, including AI-enabled tools and advanced analytics • Advanced value-over-volume commercial strategy, improving pricing discipline and customer profitability management • Expand project identification and lead-generation capabilities to capture additional share of wallet • Strengthening commercial execution through customer segmentation, project selectivity and value-based pricing TAG Gross Run-Rate Benefits Capture Full Potential $350+ million $100M+ Incremental Benefits Targeted1,2 $250M+ Gross Run- Rate Benefits Achieved1
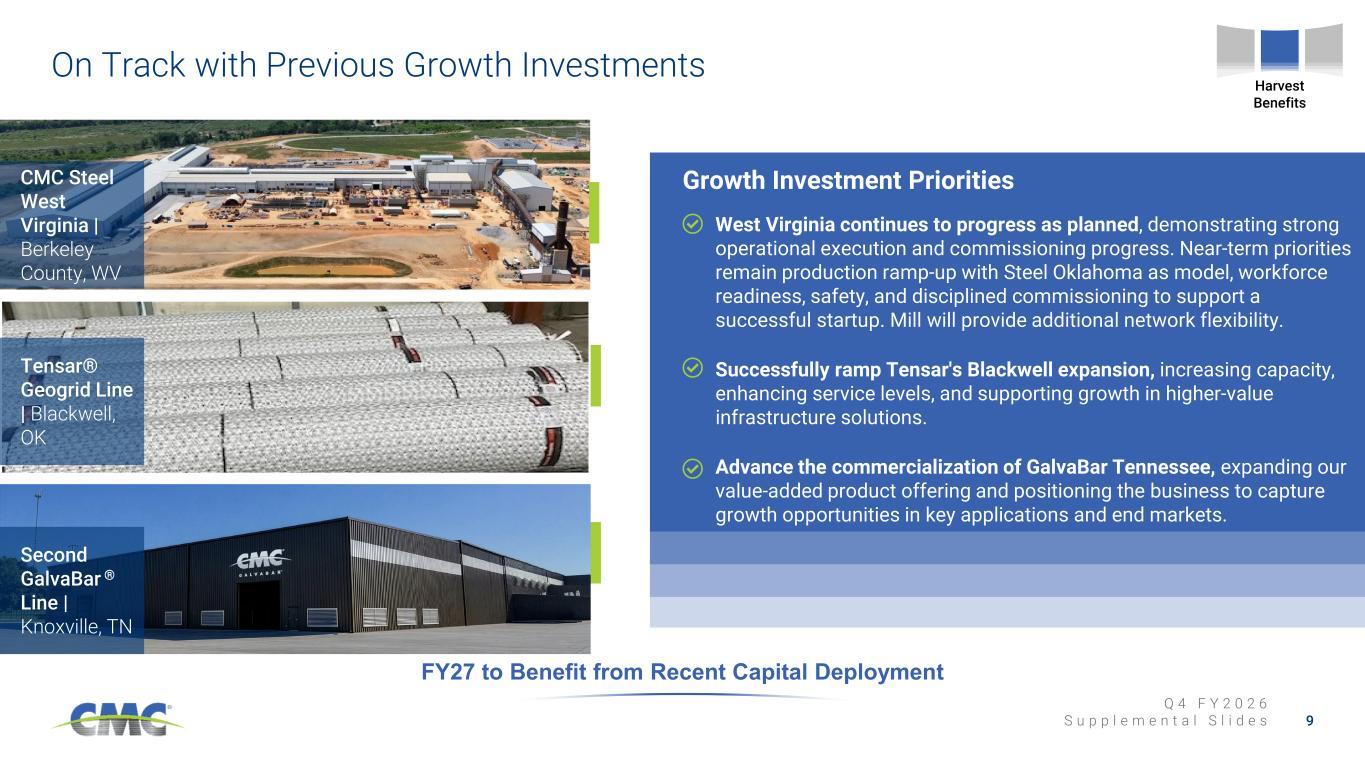
Q 4 F Y 2 0 2 6 S u p p l e m e n t a l S l i d e s On Track with Previous Growth Investments 9 FY27 to Benefit from Recent Capital Deployment Harvest Benefits CMC Steel West Virginia | Berkeley County, WV Tensar® Geogrid Line | Blackwell, OK Growth Investment Priorities West Virginia continues to progress as planned, demonstrating strong operational execution and commissioning progress. Near-term priorities remain production ramp-up with Steel Oklahoma as model, workforce readiness, safety, and disciplined commissioning to support a successful startup. Mill will provide additional network flexibility. Successfully ramp Tensar's Blackwell expansion, increasing capacity, enhancing service levels, and supporting growth in higher-value infrastructure solutions. Advance the commercialization of GalvaBar Tennessee, expanding our value-added product offering and positioning the business to capture growth opportunities in key applications and end markets. Second GalvaBar ® Line | Knoxville, TN
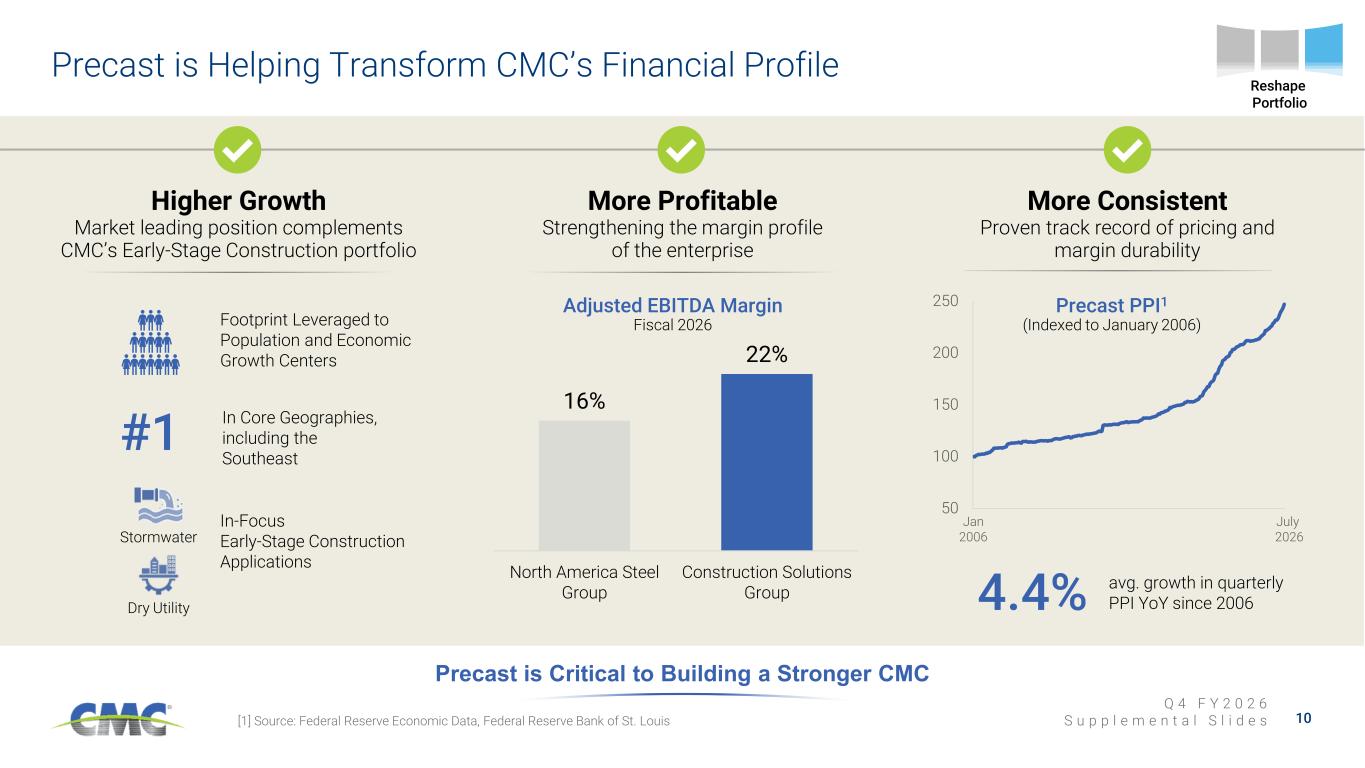
Q 4 F Y 2 0 2 6 S u p p l e m e n t a l S l i d e s 50 100 150 200 250 Precast is Helping Transform CMC’s Financial Profile 10[1] Source: Federal Reserve Economic Data, Federal Reserve Bank of St. Louis Precast is Critical to Building a Stronger CMC Higher Growth Market leading position complements CMC’s Early-Stage Construction portfolio More Profitable Strengthening the margin profile of the enterprise More Consistent Proven track record of pricing and margin durability Jan 2006 July 2026 Precast PPI1 (Indexed to January 2006) Reshape Portfolio Footprint Leveraged to Population and Economic Growth Centers In-Focus Early-Stage Construction Applications Stormwater Dry Utility #1 In Core Geographies, including the Southeast avg. growth in quarterly PPI YoY since 20064.4% 16% 22% North America Steel Group Construction Solutions Group 10 Adjusted EBITDA Margin Fiscal 2026
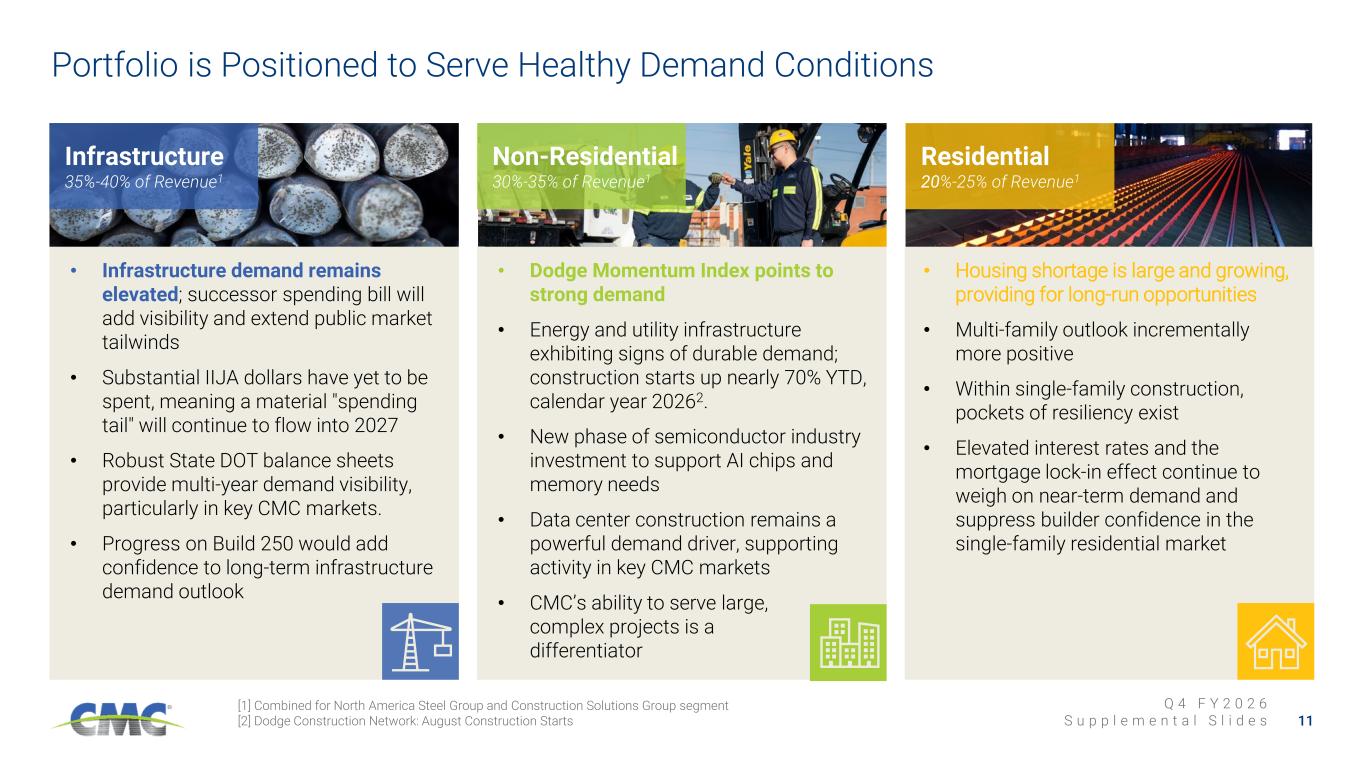
Q 4 F Y 2 0 2 6 S u p p l e m e n t a l S l i d e s • Housing shortage is large and growing, providing for long-run opportunities • Multi-family outlook incrementally more positive • Within single-family construction, pockets of resiliency exist • Elevated interest rates and the mortgage lock-in effect continue to weigh on near-term demand and suppress builder confidence in the single-family residential market Portfolio is Positioned to Serve Healthy Demand Conditions 11 [1] Combined for North America Steel Group and Construction Solutions Group segment [2] Dodge Construction Network: August Construction Starts Infrastructure 35%-40% of Revenue1 Non-Residential 30%-35% of Revenue1 Residential 20%-25% of Revenue1 • Infrastructure demand remains elevated; successor spending bill will add visibility and extend public market tailwinds • Substantial IIJA dollars have yet to be spent, meaning a material "spending tail" will continue to flow into 2027 • Robust State DOT balance sheets provide multi-year demand visibility, particularly in key CMC markets. • Progress on Build 250 would add confidence to long-term infrastructure demand outlook • Dodge Momentum Index points to strong demand • Energy and utility infrastructure exhibiting signs of durable demand; construction starts up nearly 70% YTD, calendar year 20262. • New phase of semiconductor industry investment to support AI chips and memory needs • Data center construction remains a powerful demand driver, supporting activity in key CMC markets • CMC’s ability to serve large, complex projects is a differentiator
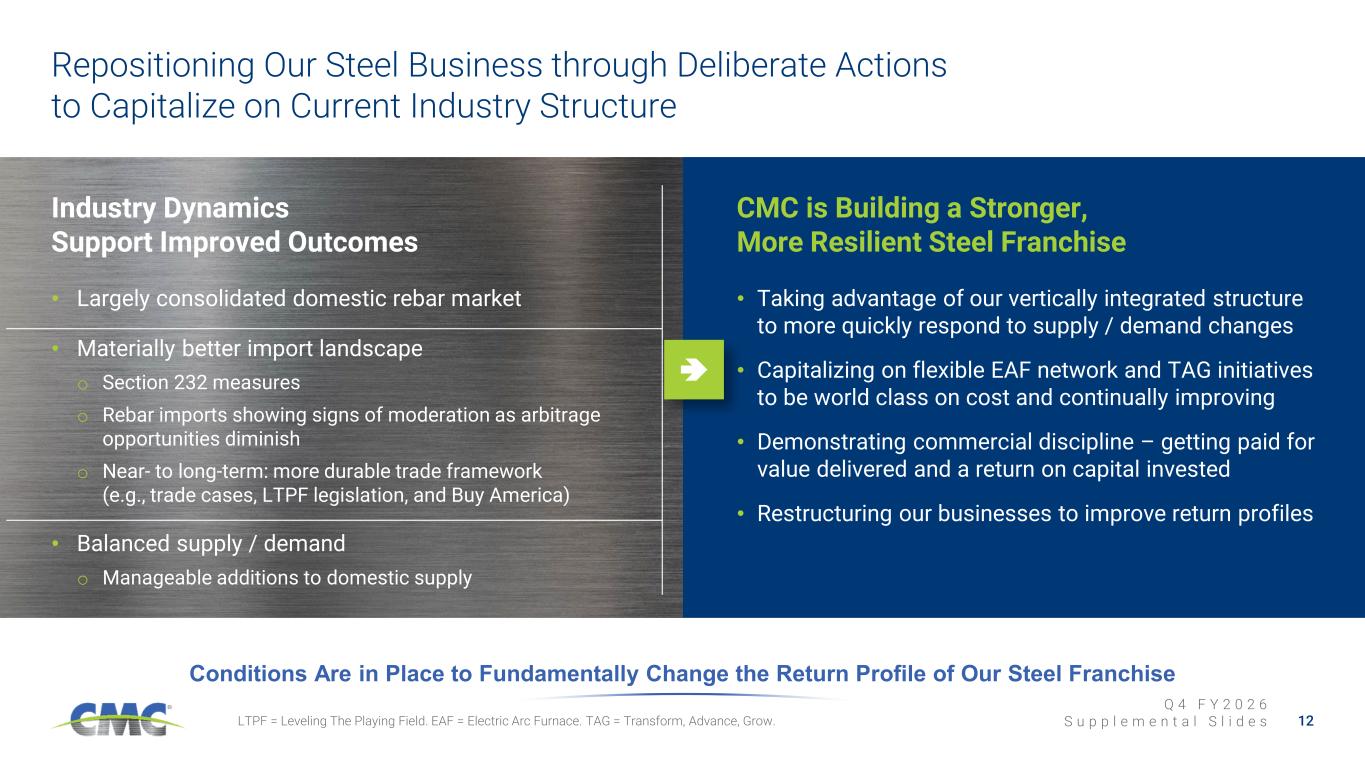
Q 4 F Y 2 0 2 6 S u p p l e m e n t a l S l i d e s Repositioning Our Steel Business through Deliberate Actions to Capitalize on Current Industry Structure LTPF = Leveling The Playing Field. EAF = Electric Arc Furnace. TAG = Transform, Advance, Grow. Conditions Are in Place to Fundamentally Change the Return Profile of Our Steel Franchise Industry Dynamics Support Improved Outcomes • Largely consolidated domestic rebar market • Materially better import landscape o Section 232 measures o Rebar imports showing signs of moderation as arbitrage opportunities diminish o Near- to long-term: more durable trade framework (e.g., trade cases, LTPF legislation, and Buy America) • Balanced supply / demand o Manageable additions to domestic supply CMC is Building a Stronger, More Resilient Steel Franchise • Taking advantage of our vertically integrated structure to more quickly respond to supply / demand changes • Capitalizing on flexible EAF network and TAG initiatives to be world class on cost and continually improving • Demonstrating commercial discipline – getting paid for value delivered and a return on capital invested • Restructuring our businesses to improve return profiles 12
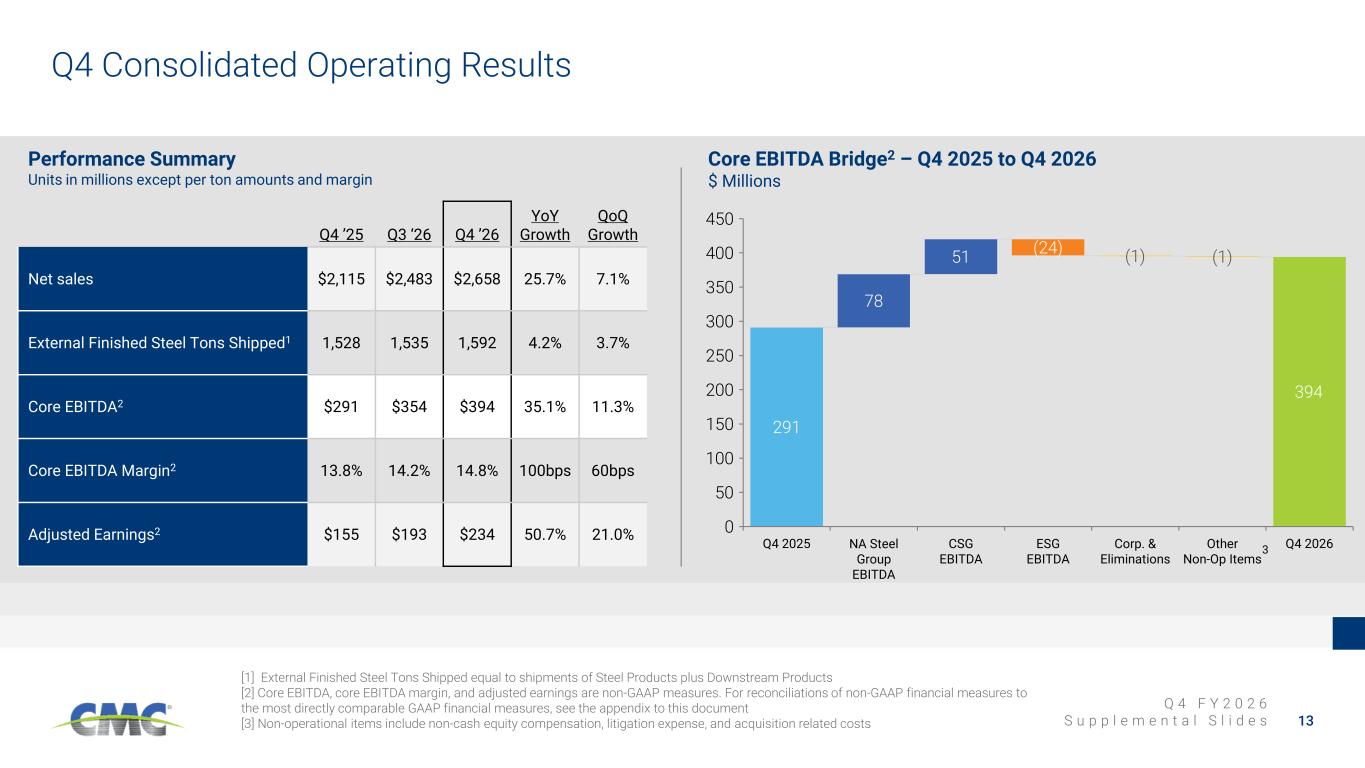
Q 4 F Y 2 0 2 6 S u p p l e m e n t a l S l i d e s 291 78 51 (24) (1) (1) Q4 2025 NA Steel Group EBITDA CSG EBITDA ESG EBITDA Corp. & Eliminations Other Non-Op Items Q4 2026 0 50 100 150 200 250 300 350 400 450 Q4 Consolidated Operating Results 13 Q4 ’25 Q3 ‘26 Q4 ’26 YoY Growth QoQ Growth Net sales $2,115 $2,483 $2,658 25.7% 7.1% External Finished Steel Tons Shipped1 1,528 1,535 1,592 4.2% 3.7% Core EBITDA2 $291 $354 $394 35.1% 11.3% Core EBITDA Margin2 13.8% 14.2% 14.8% 100bps 60bps Adjusted Earnings2 $155 $193 $234 50.7% 21.0% [1] External Finished Steel Tons Shipped equal to shipments of Steel Products plus Downstream Products [2] Core EBITDA, core EBITDA margin, and adjusted earnings are non-GAAP measures. For reconciliations of non-GAAP financial measures to the most directly comparable GAAP financial measures, see the appendix to this document [3] Non-operational items include non-cash equity compensation, litigation expense, and acquisition related costs Performance Summary Units in millions except per ton amounts and margin Core EBITDA Bridge2 – Q4 2025 to Q4 2026 $ Millions 394 3
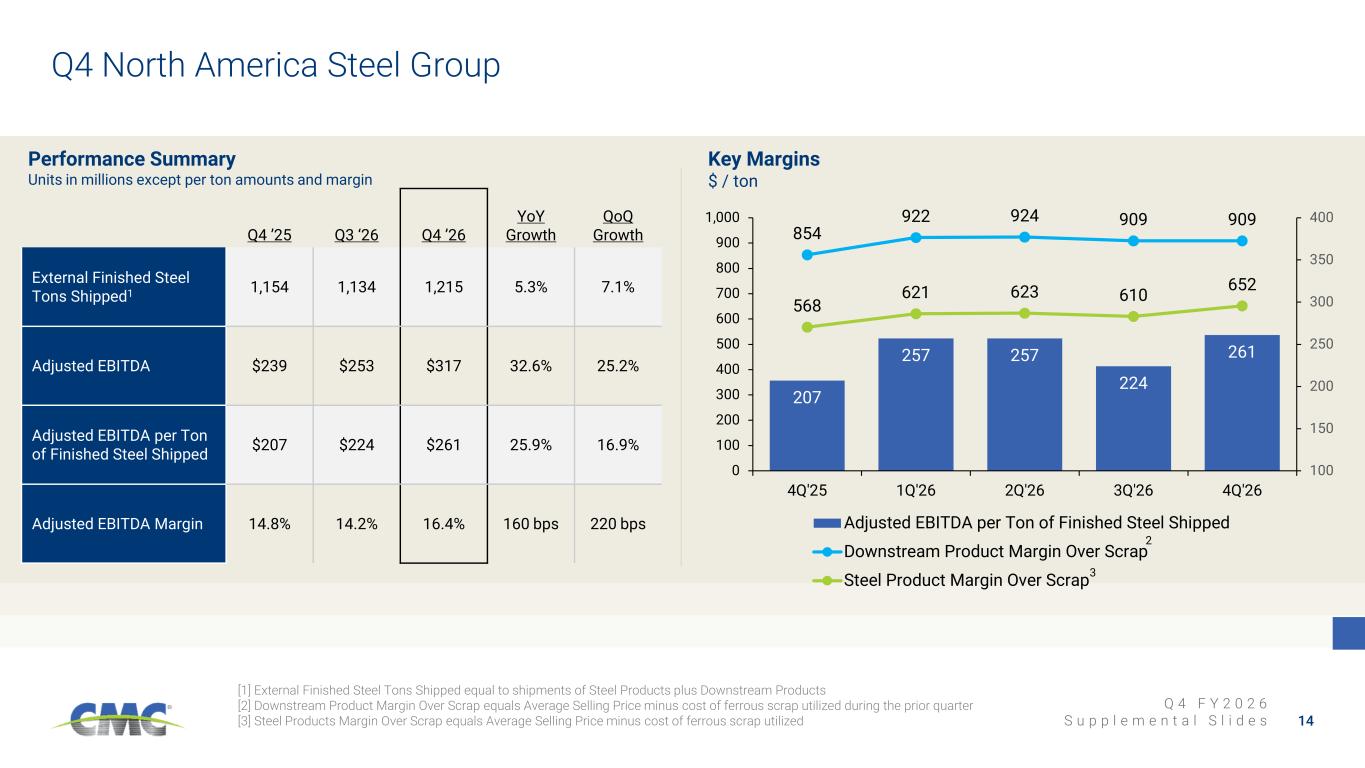
Q 4 F Y 2 0 2 6 S u p p l e m e n t a l S l i d e s Q4 North America Steel Group 14 [1] External Finished Steel Tons Shipped equal to shipments of Steel Products plus Downstream Products [2] Downstream Product Margin Over Scrap equals Average Selling Price minus cost of ferrous scrap utilized during the prior quarter [3] Steel Products Margin Over Scrap equals Average Selling Price minus cost of ferrous scrap utilized Q4 ’25 Q3 ‘26 Q4 ’26 YoY Growth QoQ Growth External Finished Steel Tons Shipped1 1,154 1,134 1,215 5.3% 7.1% Adjusted EBITDA $239 $253 $317 32.6% 25.2% Adjusted EBITDA per Ton of Finished Steel Shipped $207 $224 $261 25.9% 16.9% Adjusted EBITDA Margin 14.8% 14.2% 16.4% 160 bps 220 bps Performance Summary Units in millions except per ton amounts and margin Key Margins $ / ton 207 257 257 224 261 854 922 924 909 909 568 621 623 610 652 100 150 200 250 300 350 400 0 100 200 300 400 500 600 700 800 900 1,000 4Q'25 1Q'26 2Q'26 3Q'26 4Q'26 Adjusted EBITDA per Ton of Finished Steel Shipped Downstream Product Margin Over Scrap Steel Product Margin Over Scrap 2 3
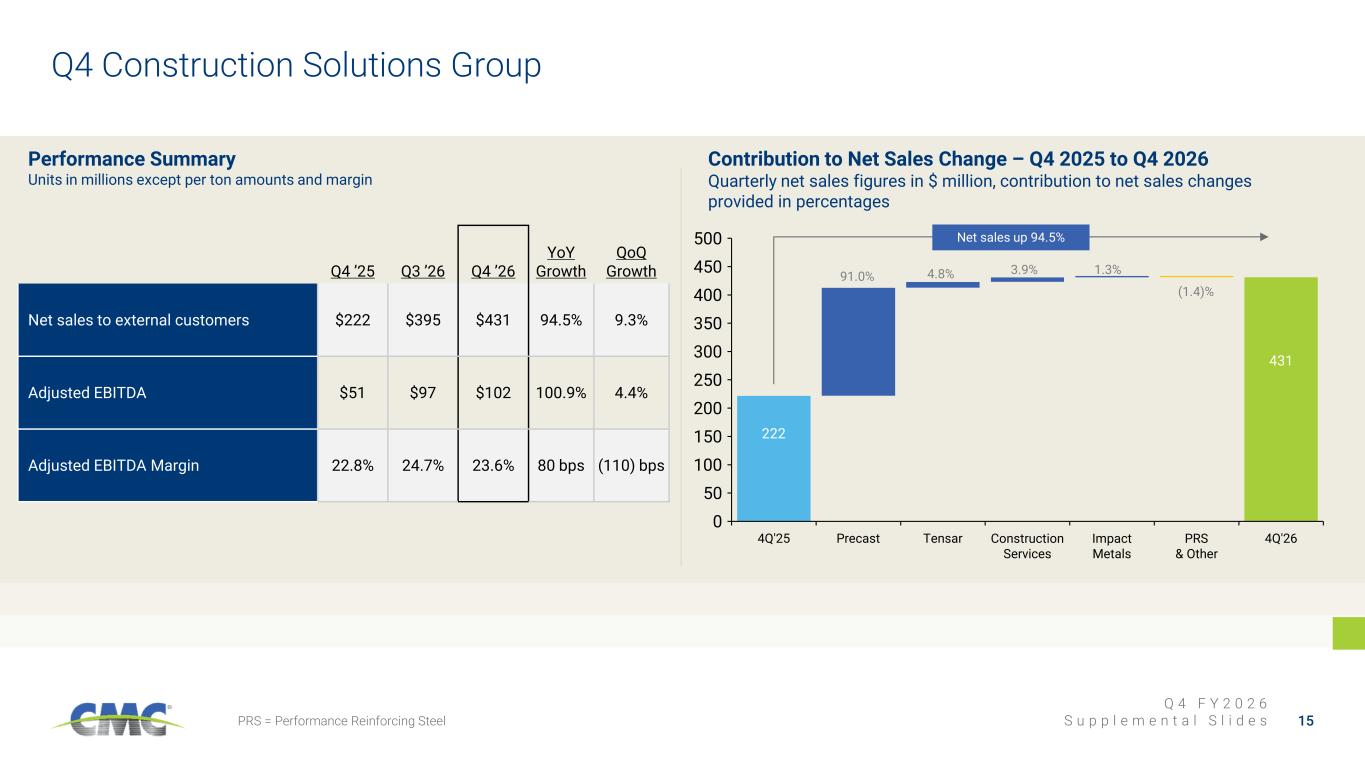
Q 4 F Y 2 0 2 6 S u p p l e m e n t a l S l i d e s 4Q'25 Precast Tensar Construction Services Impact Metals PRS & Other 4Q'26 0 50 100 150 200 250 300 350 400 450 500 15PRS = Performance Reinforcing Steel Q4 ’25 Q3 ’26 Q4 ’26 YoY Growth QoQ Growth Net sales to external customers $222 $395 $431 94.5% 9.3% Adjusted EBITDA $51 $97 $102 100.9% 4.4% Adjusted EBITDA Margin 22.8% 24.7% 23.6% 80 bps (110) bps 91.0% 4.8% 3.9% 1.3% (1.4)% 222 Q4 Construction Solutions Group Performance Summary Units in millions except per ton amounts and margin Contribution to Net Sales Change – Q4 2025 to Q4 2026 Quarterly net sales figures in $ million, contribution to net sales changes provided in percentages 431 Net sales up 94.5%
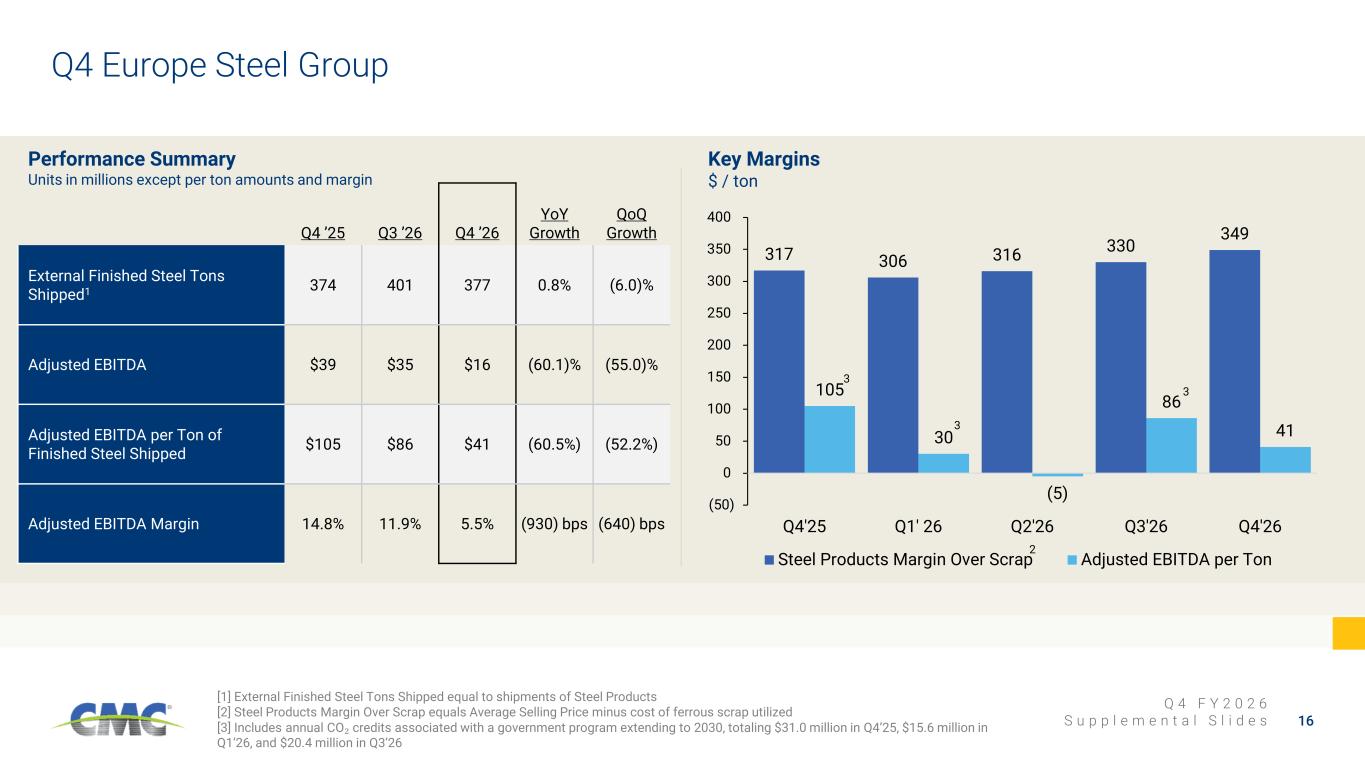
Q 4 F Y 2 0 2 6 S u p p l e m e n t a l S l i d e s 317 306 316 330 349 105 30 (5) 86 41 (50) 0 50 100 150 200 250 300 350 400 Q4'25 Q1' 26 Q2'26 Q3'26 Q4'26 Steel Products Margin Over Scrap Adjusted EBITDA per Ton 16 [1] External Finished Steel Tons Shipped equal to shipments of Steel Products [2] Steel Products Margin Over Scrap equals Average Selling Price minus cost of ferrous scrap utilized [3] Includes annual CO₂ credits associated with a government program extending to 2030, totaling $31.0 million in Q4’25, $15.6 million in Q1’26, and $20.4 million in Q3’26 Q4 Europe Steel Group Q4 ’25 Q3 ’26 Q4 ’26 YoY Growth QoQ Growth External Finished Steel Tons Shipped1 374 401 377 0.8% (6.0)% Adjusted EBITDA $39 $35 $16 (60.1)% (55.0)% Adjusted EBITDA per Ton of Finished Steel Shipped $105 $86 $41 (60.5%) (52.2%) Adjusted EBITDA Margin 14.8% 11.9% 5.5% (930) bps (640) bps 3 3 3 2 Performance Summary Units in millions except per ton amounts and margin Key Margins $ / ton
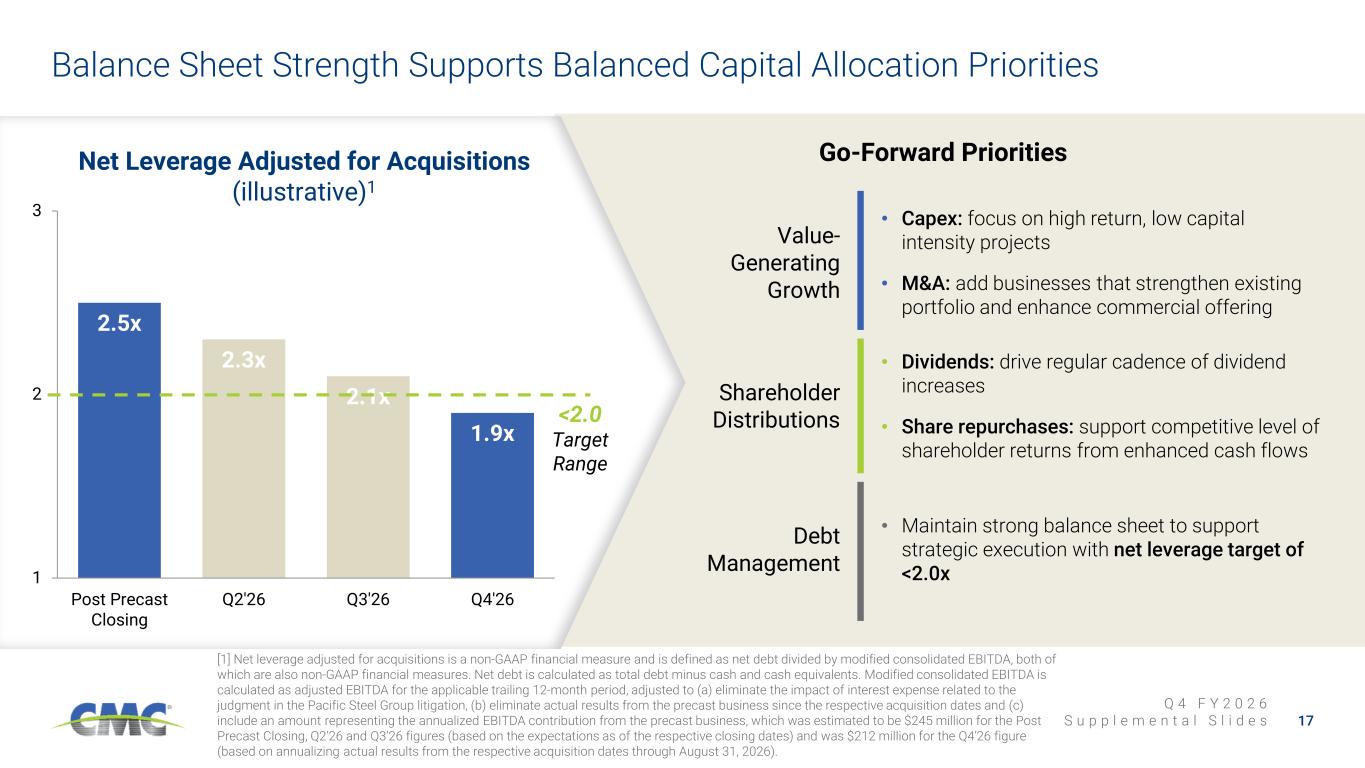
Q 4 F Y 2 0 2 6 S u p p l e m e n t a l S l i d e s 2.5x 2.3x 2.1x 1.9x 1 2 3 Post Precast Closing Q2'26 Q3'26 Q4'26 Balance Sheet Strength Supports Balanced Capital Allocation Priorities 17 [1] Net leverage adjusted for acquisitions is a non-GAAP financial measure and is defined as net debt divided by modified consolidated EBITDA, both of which are also non-GAAP financial measures. Net debt is calculated as total debt minus cash and cash equivalents. Modified consolidated EBITDA is calculated as adjusted EBITDA for the applicable trailing 12-month period, adjusted to (a) eliminate the impact of interest expense related to the judgment in the Pacific Steel Group litigation, (b) eliminate actual results from the precast business since the respective acquisition dates and (c) include an amount representing the annualized EBITDA contribution from the precast business, which was estimated to be $245 million for the Post Precast Closing, Q2’26 and Q3’26 figures (based on the expectations as of the respective closing dates) and was $212 million for the Q4’26 figure (based on annualizing actual results from the respective acquisition dates through August 31, 2026). Go-Forward Priorities Value- Generating Growth • Capex: focus on high return, low capital intensity projects • M&A: add businesses that strengthen existing portfolio and enhance commercial offering Shareholder Distributions • Dividends: drive regular cadence of dividend increases • Share repurchases: support competitive level of shareholder returns from enhanced cash flows Debt Management • Maintain strong balance sheet to support strategic execution with net leverage target of <2.0x Net Leverage Adjusted for Acquisitions (illustrative)1 <2.0 Target Range
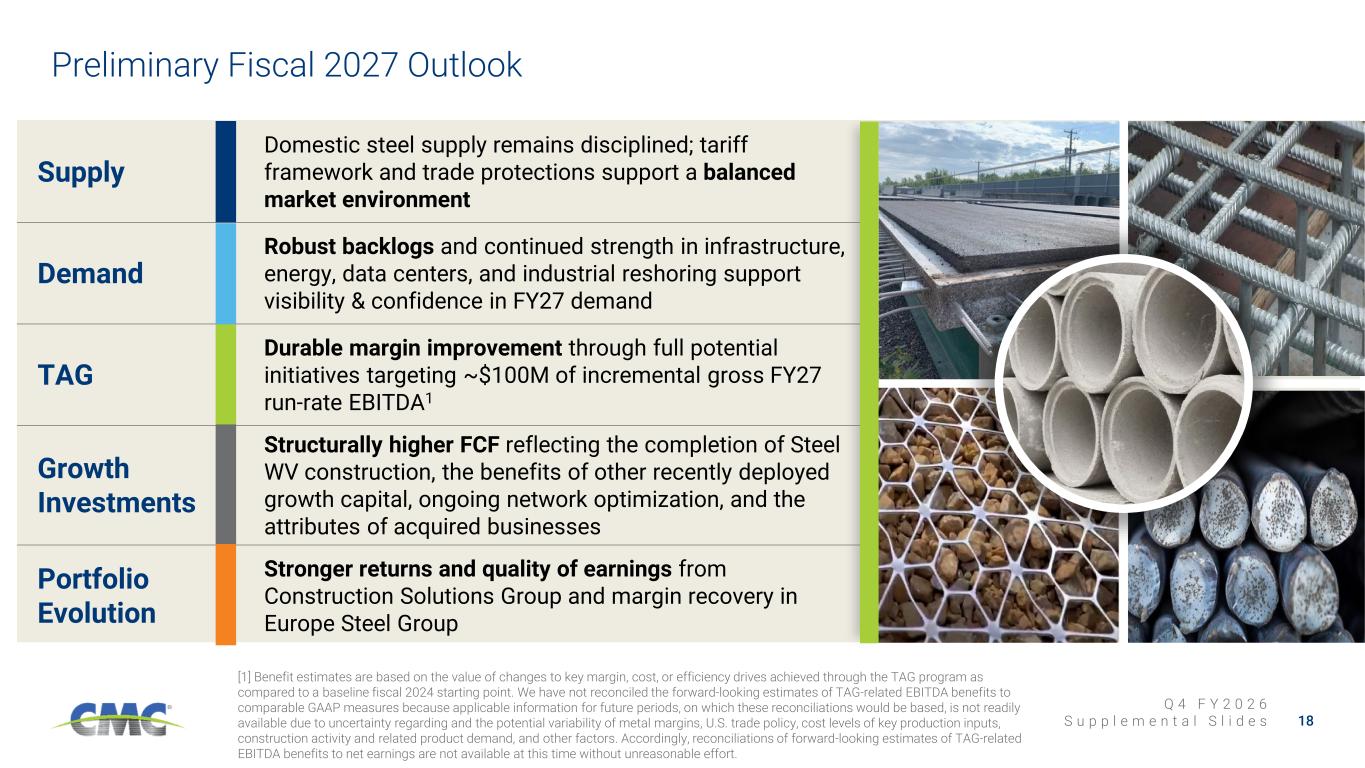
Q 4 F Y 2 0 2 6 S u p p l e m e n t a l S l i d e s Preliminary Fiscal 2027 Outlook Supply Domestic steel supply remains disciplined; tariff framework and trade protections support a balanced market environment Demand Robust backlogs and continued strength in infrastructure, energy, data centers, and industrial reshoring support visibility & confidence in FY27 demand TAG Durable margin improvement through full potential initiatives targeting ~$100M of incremental gross FY27 run-rate EBITDA1 Growth Investments Structurally higher FCF reflecting the completion of Steel WV construction, the benefits of other recently deployed growth capital, ongoing network optimization, and the attributes of acquired businesses Portfolio Evolution Stronger returns and quality of earnings from Construction Solutions Group and margin recovery in Europe Steel Group 18 [1] Benefit estimates are based on the value of changes to key margin, cost, or efficiency drives achieved through the TAG program as compared to a baseline fiscal 2024 starting point. We have not reconciled the forward-looking estimates of TAG-related EBITDA benefits to comparable GAAP measures because applicable information for future periods, on which these reconciliations would be based, is not readily available due to uncertainty regarding and the potential variability of metal margins, U.S. trade policy, cost levels of key production inputs, construction activity and related product demand, and other factors. Accordingly, reconciliations of forward-looking estimates of TAG-related EBITDA benefits to net earnings are not available at this time without unreasonable effort.
Q 4 F Y 2 0 2 6 S u p p l e m e n t a l S l i d e s Appendix Non-GAAP Financial Reconciliations
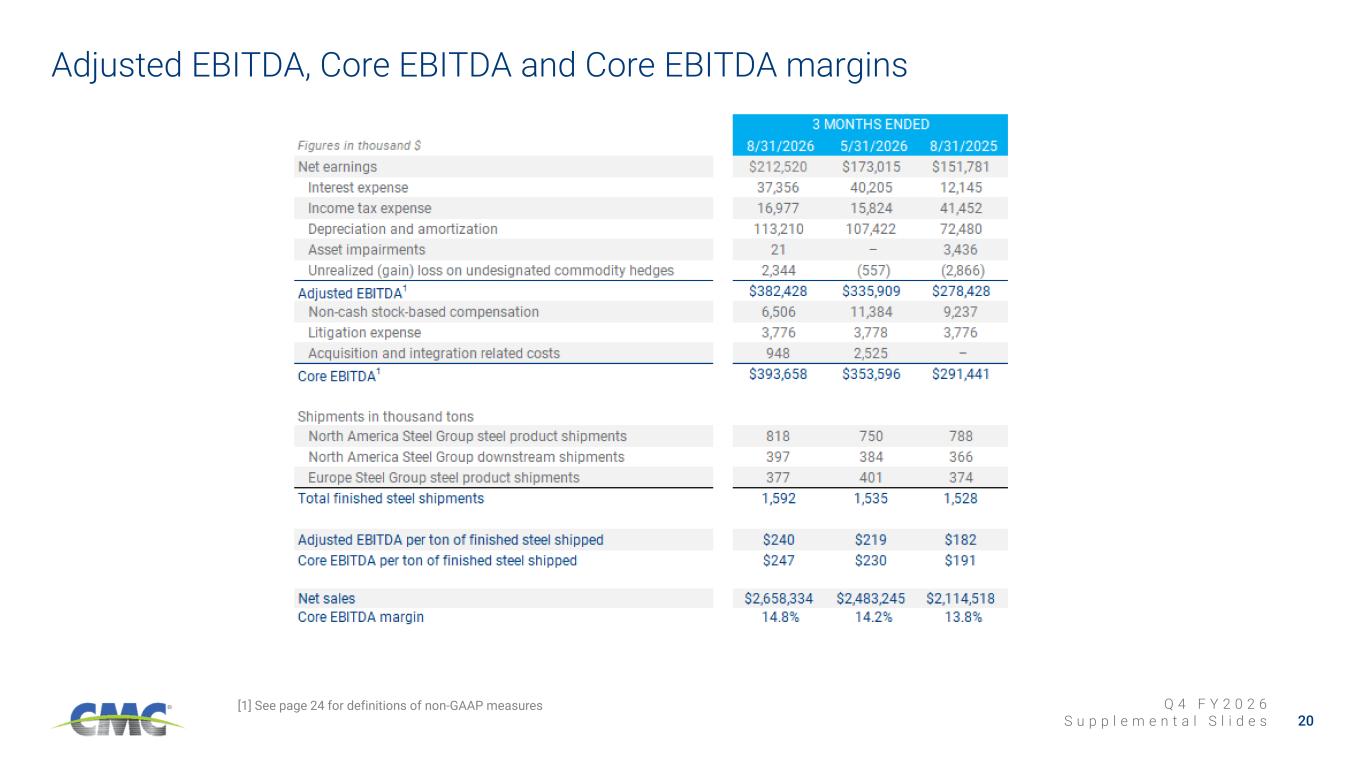
Q 4 F Y 2 0 2 6 S u p p l e m e n t a l S l i d e s 20 Adjusted EBITDA, Core EBITDA and Core EBITDA margins [1] See page 24 for definitions of non-GAAP measures
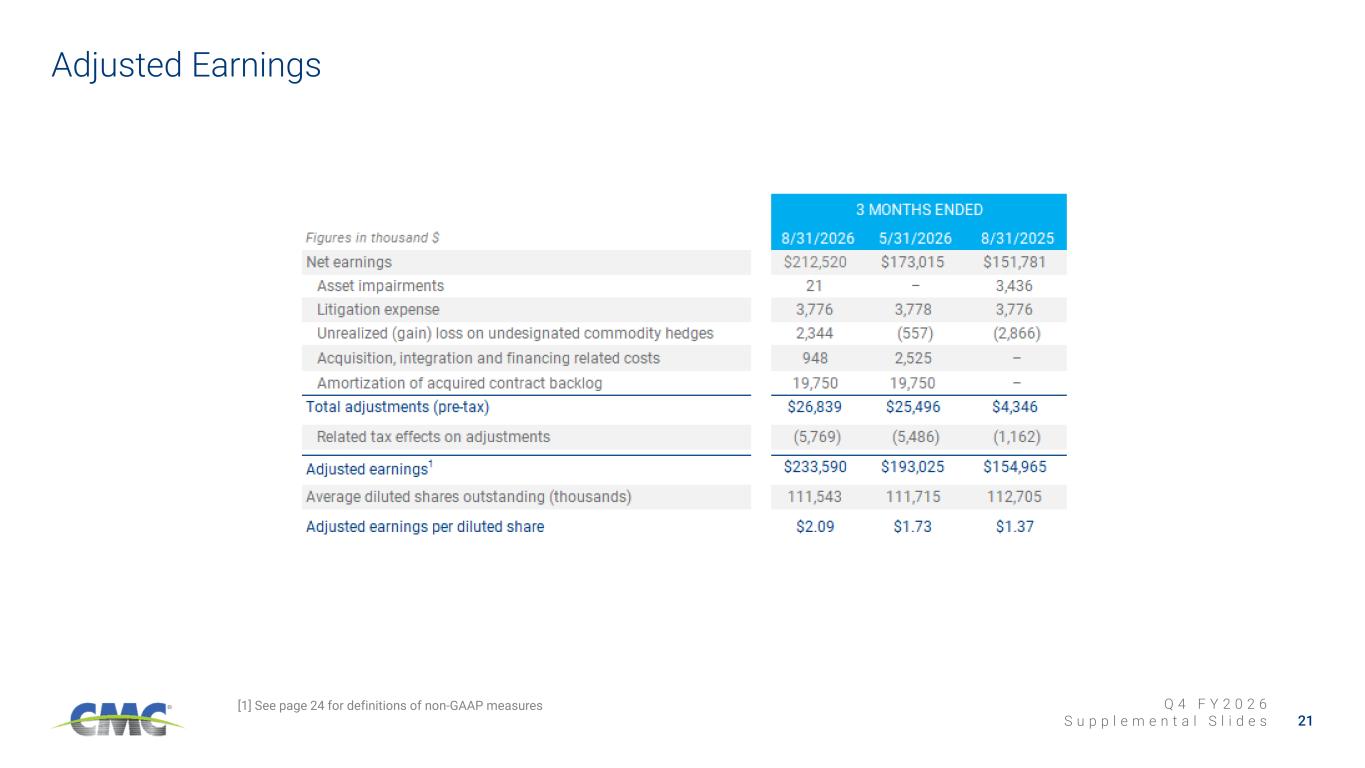
Q 4 F Y 2 0 2 6 S u p p l e m e n t a l S l i d e s 21 Adjusted Earnings [1] See page 24 for definitions of non-GAAP measures
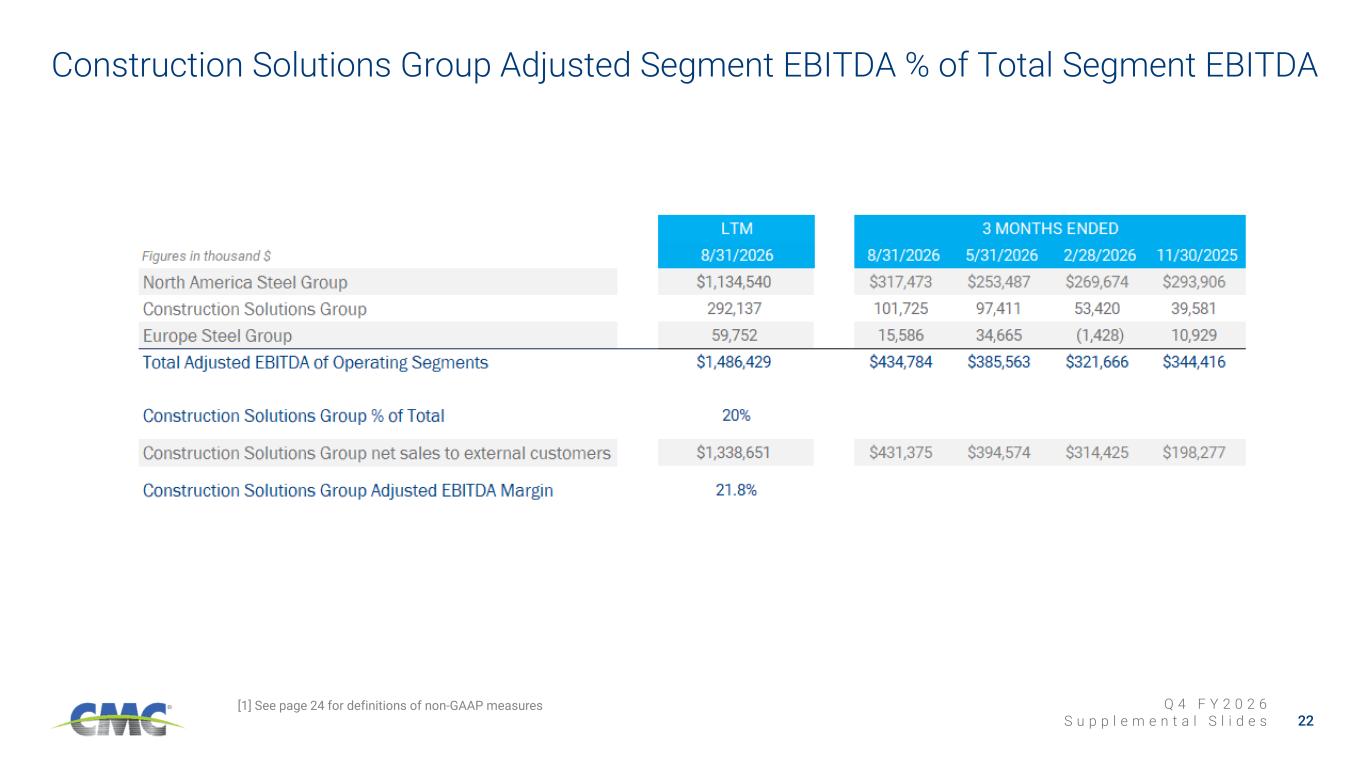
Q 4 F Y 2 0 2 6 S u p p l e m e n t a l S l i d e s 22 Construction Solutions Group Adjusted Segment EBITDA % of Total Segment EBITDA [1] See page 24 for definitions of non-GAAP measures
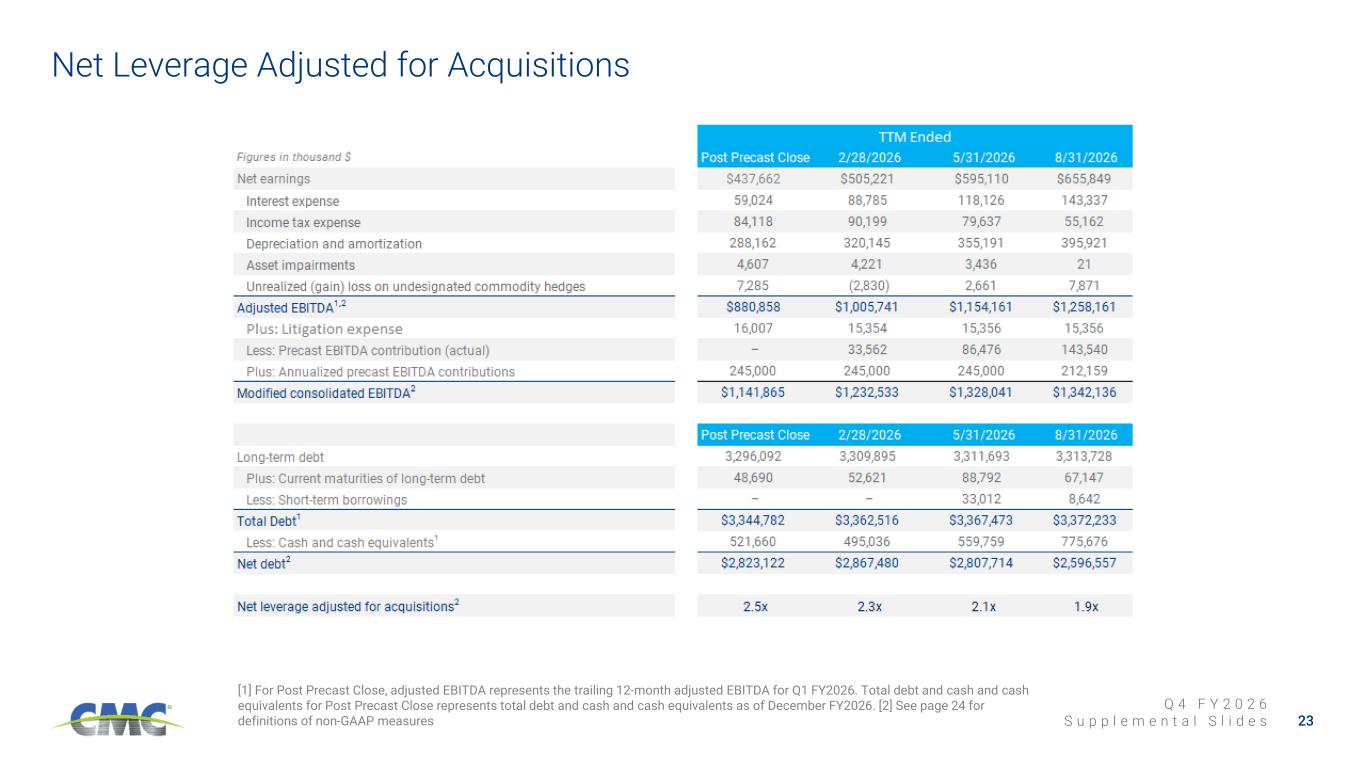
Q 4 F Y 2 0 2 6 S u p p l e m e n t a l S l i d e s 23 [1] For Post Precast Close, adjusted EBITDA represents the trailing 12-month adjusted EBITDA for Q1 FY2026. Total debt and cash and cash equivalents for Post Precast Close represents total debt and cash and cash equivalents as of December FY2026. [2] See page 24 for definitions of non-GAAP measures Net Leverage Adjusted for Acquisitions
Q 4 F Y 2 0 2 6 S u p p l e m e n t a l S l i d e s 24 Definitions for non-GAAP financial measures ADJUSTED EARNINGS Adjusted earnings is a non-GAAP financial measure that is equal to earnings (loss) before asset impairments and settlement for New Markets Tax Credit transactions, including the estimated income tax effects thereof. The adjustment “settlement for New Markets Tax Credit transaction” represents the recognition of deferred revenue from 2016 and 2017 resulting from the Company’s participation in the New Markets Tax Credit program provided for in the Community Renewal Tax Relief Act of 2000 during the development of a micro mill, spooler and T-post shop located in eligible zones as determined by the Internal Revenue Service. Adjusted earnings also excludes litigation expense, unrealized (gain) loss on undesignated commodity hedges and acquisition, integration and financing related costs, amortization of acquired contract backlog and purchase accounting effect on inventory. Adjusted earnings should not be considered as an alternative to net earnings (loss) or any other performance measure derived in accordance with GAAP. However, we believe that adjusted earnings provides relevant and useful information to investors as it allows: (i) a supplemental measure of our ongoing core performance and (ii) the assessment of period-to-period performance trends. Management uses adjusted earnings to evaluate our financial performance. Adjusted earnings may be inconsistent with similar measures presented by other companies. Adjusted earnings per diluted share (or adjusted EPS) is defined as adjusted earnings on a diluted per share basis. CORE EBITDA Core EBITDA is the sum of net earnings (loss) before interest expense and income taxes. It also excludes recurring non-cash charges for depreciation and amortization, asset impairments and unrealized (gain) loss on undesignated commodity hedges. Core EBITDA also excludes litigation expense, settlement for New Market Tax Credit transactions, non-cash stock-based compensation, loss on debt extinguishments, gains on sale of assets, acquisition settlements, acquisition and integration related costs, and purchase accounting effect on inventory. The adjustment “litigation expense” represents a provision recorded in the three months ended November 30, 2024 related to the judgment in the Pacific Steel Group litigation and, with respect to subsequent periods, interest expense on the judgment amount. The adjustment “settlement for New Markets Tax Credit transaction” represents the recognition of deferred revenue from 2016 and 2017 resulting from the Company’s participation in the New Markets Tax Credit program provided for in the Community Renewal Tax Relief Act of 2000 during the development of a micro mill, spooler and T-post shop located in eligible zones as determined by the Internal Revenue Service. Core EBITDA should not be considered an alternative to earnings (loss) from continuing operations or net earnings (loss), or as a better measure of liquidity than net cash flows from operating activities, as determined by GAAP. However, we believe that Core EBITDA provides relevant and useful information, which is often used by analysts, creditors and other interested parties in our industry as it allows: (i) comparison of our earnings to those of our competitors; (ii) a supplemental measure of our ongoing core performance; and (iii) the assessment of period-to-period performance trends. Additionally, Core EBITDA is the target benchmark for our annual and long-term cash incentive performance plans for management. Core EBITDA may be inconsistent with similar measures presented by other companies. CONSOLIDATED ADJUSTED EBITDA Adjusted EBITDA is a non-GAAP financial measure. Adjusted EBITDA is the sum of the Company’s net earnings (loss) before interest expense, income taxes, depreciation and amortization expense, asset impairments and unrealized (gain) loss on undesignated commodity hedges. Adjusted EBITDA should not be considered as an alternative to net earnings (loss), or any other performance measure derived in accordance with GAAP. However, we believe that adjusted EBITDA provides relevant and useful information to investors as it allows: (i) a supplemental measure of our ongoing performance and (ii) the assessment of period-to-period performance trends. Management uses adjusted EBITDA to evaluate our financial performance. Adjusted EBITDA may be inconsistent with similar measures presented by other companies. NET DEBT Net debt is defined as total long-term debt plus the current portion of long-term debt, less short-term borrowings (representing outstanding proceeds under the Poland accounts receivable facility), less cash and cash equivalents. NET LEVERAGE ADJUSTED FOR ACQUISITIONS Net leverage adjusted for acquisitions is a non-GAAP financial measure and is defined as net debt divided by modified consolidated EBITDA, both of which are also non-GAAP financial measures. Net debt is calculated as total debt minus cash and cash equivalents. Modified consolidated EBITDA is calculated as adjusted EBITDA for the trailing 12-month period, adjusted to (a) eliminate the impact of interest expense related to the judgment in the Pacific Steel Group litigation, which is $16 million for the Post Precast Closing and $15.4 million for each of Q2’26, Q3’26 and Q4’26, (b) eliminate actual results from the precast business since the respective acquisition dates and (c) include an estimate of annualized EBITDA contribution from the precast business, which is $245 million for the Post Precast Closing, Q2’26 and Q3’26 figures and $212 million for the Q4’26 figure. The annualized EBITDA contribution from the precast business used in the Q4’26 calculation was derived by annualizing the precast business’s actual results from the respective acquisition dates through August 31, 2026. The calculation also excludes the impact of the purchase accounting effect on inventory. The annualized figure used in the Q4’26 calculation assumes that the precast platform’s results for the post-acquisition period are representative of a full fiscal year. The figure does not reflect actual results the precast platform generated or will generate in any 12-month period, and it was not prepared in accordance with Article 11 of Regulation S-X. Results for future periods may differ materially. RETURN ON INVESTED CAPITAL Return on Invested Capital is defined as: 1) after-tax operating profit divided by 2) total assets less cash & cash equivalents less non-interest-bearing liabilities. For annual measures, trailing 5-quarter averages are used for balance sheet figures. During the fourth quarter of 2025, the Company modified its method of calculating adjusted EBITDA to exclude the impact of unrealized gains and losses from undesignated commodity derivatives. This change was primarily driven by heightened volatility in copper forward markets during 2025, which introduced significant non-cash fluctuations unrelated to core operations. By removing this volatility, the revised metric provides a more representative view of operating performance and cash-generating capability. Accordingly, the Company recast adjusted EBITDA, core EBITDA, core EBITDA margin, adjusted earnings and adjusted earnings per diluted share for all prior periods to conform to this presentation.