3Q26 October 15, 2026 QUARTERLY UPDATE
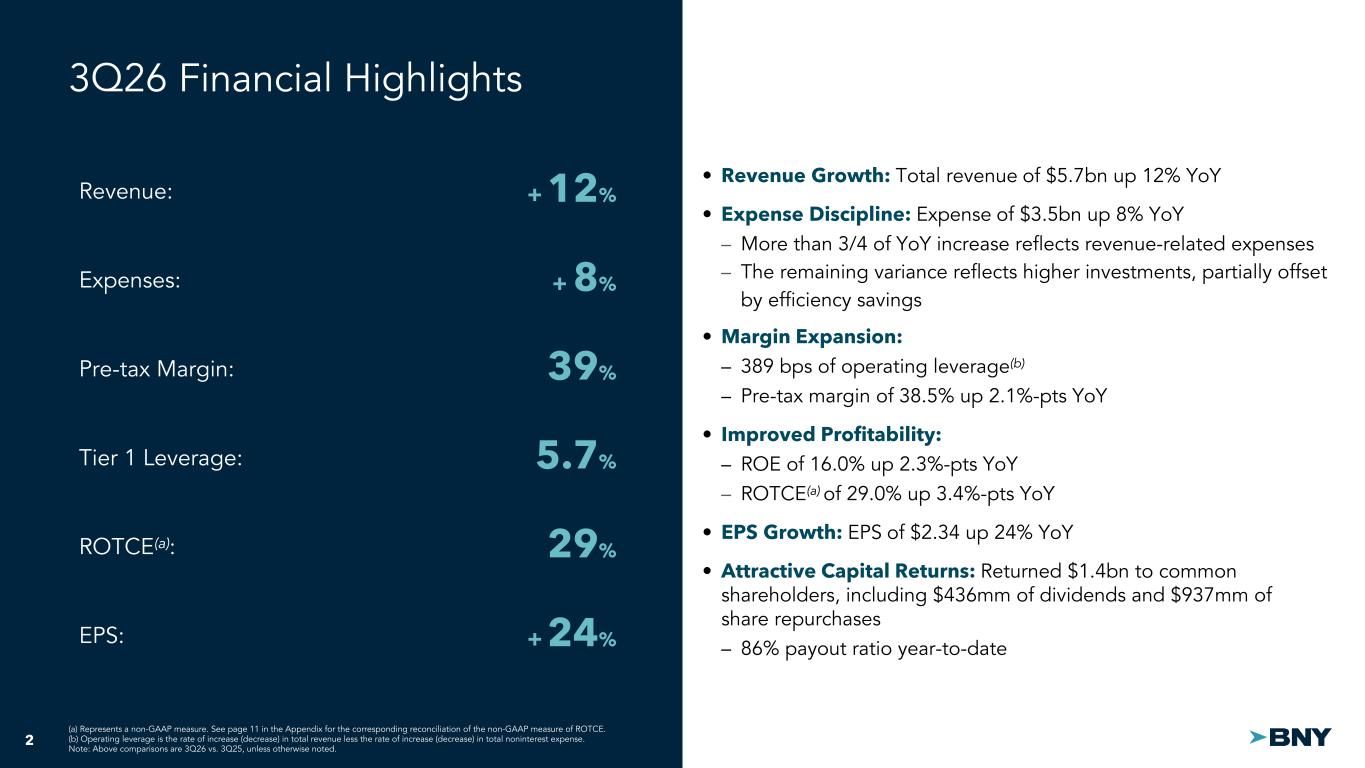
2 • Revenue Growth: Total revenue of $5.7bn up 12% YoY • Expense Discipline: Expense of $3.5bn up 8% YoY – More than 3/4 of YoY increase reflects revenue-related expenses – The remaining variance reflects higher investments, partially offset by efficiency savings • Margin Expansion: – 389 bps of operating leverage(b) – Pre-tax margin of 38.5% up 2.1%-pts YoY • Improved Profitability: – ROE of 16.0% up 2.3%-pts YoY – ROTCE(a) of 29.0% up 3.4%-pts YoY • EPS Growth: EPS of $2.34 up 24% YoY • Attractive Capital Returns: Returned $1.4bn to common shareholders, including $436mm of dividends and $937mm of share repurchases – 86% payout ratio year-to-date 3Q26 Financial Highlights + 24% Revenue: + 12% 39% ROTCE(a): 29% Tier 1 Leverage: 5.7% + 8% Pre-tax Margin: EPS: Expenses: (a) Represents a non-GAAP measure. See page 11 in the Appendix for the corresponding reconciliation of the non-GAAP measure of ROTCE. (b) Operating leverage is the rate of increase (decrease) in total revenue less the rate of increase (decrease) in total noninterest expense. Note: Above comparisons are 3Q26 vs. 3Q25, unless otherwise noted.
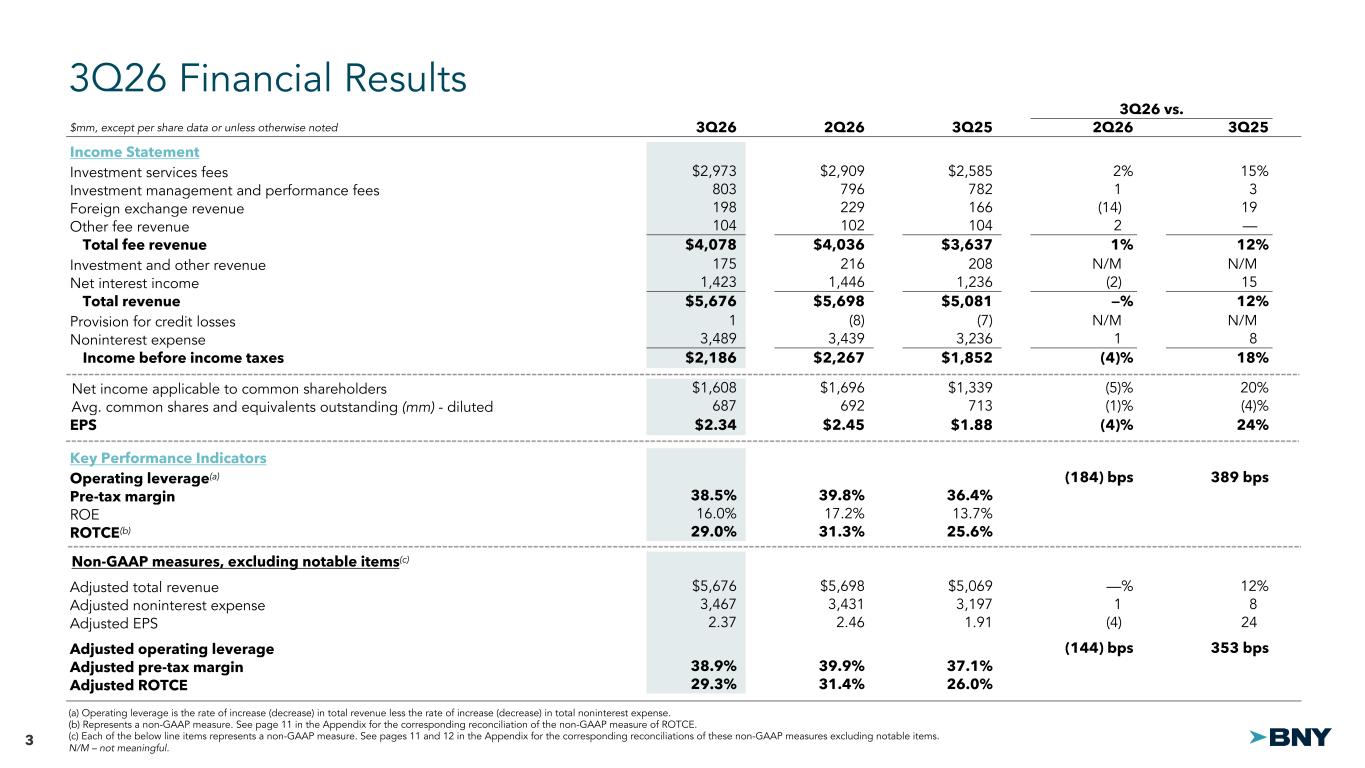
3 3Q26 vs. $mm, except per share data or unless otherwise noted 3Q26 2Q26 3Q25 2Q26 3Q25 Income Statement Investment services fees $2,973 $2,909 $2,585 2% 15% Investment management and performance fees 803 796 782 1 3 Foreign exchange revenue 198 229 166 (14) 19 Other fee revenue 104 102 104 2 — Total fee revenue $4,078 $4,036 $3,637 1% 12% Investment and other revenue 175 216 208 N/M N/M Net interest income 1,423 1,446 1,236 (2) 15 Total revenue $5,676 $5,698 $5,081 —% 12% Provision for credit losses 1 (8) (7) N/M N/M Noninterest expense 3,489 3,439 3,236 1 8 Income before income taxes $2,186 $2,267 $1,852 (4)% 18% Net income applicable to common shareholders $1,608 $1,696 $1,339 (5)% 20% Avg. common shares and equivalents outstanding (mm) - diluted 687 692 713 (1)% (4)% EPS $2.34 $2.45 $1.88 (4)% 24% Key Performance Indicators Operating leverage(a) (184) bps 389 bps Pre-tax margin 38.5% 39.8% 36.4% ROE 16.0% 17.2% 13.7% ROTCE(b) 29.0% 31.3% 25.6% Non-GAAP measures, excluding notable items(c) Adjusted total revenue $5,676 $5,698 $5,069 —% 12% Adjusted noninterest expense 3,467 3,431 3,197 1 8 Adjusted EPS 2.37 2.46 1.91 (4) 24 Adjusted operating leverage (144) bps 353 bps Adjusted pre-tax margin 38.9% 39.9% 37.1% Adjusted ROTCE 29.3% 31.4% 26.0% 3Q26 Financial Results (a) Operating leverage is the rate of increase (decrease) in total revenue less the rate of increase (decrease) in total noninterest expense. (b) Represents a non-GAAP measure. See page 11 in the Appendix for the corresponding reconciliation of the non-GAAP measure of ROTCE. (c) Each of the below line items represents a non-GAAP measure. See pages 11 and 12 in the Appendix for the corresponding reconciliations of these non-GAAP measures excluding notable items. N/M – not meaningful.
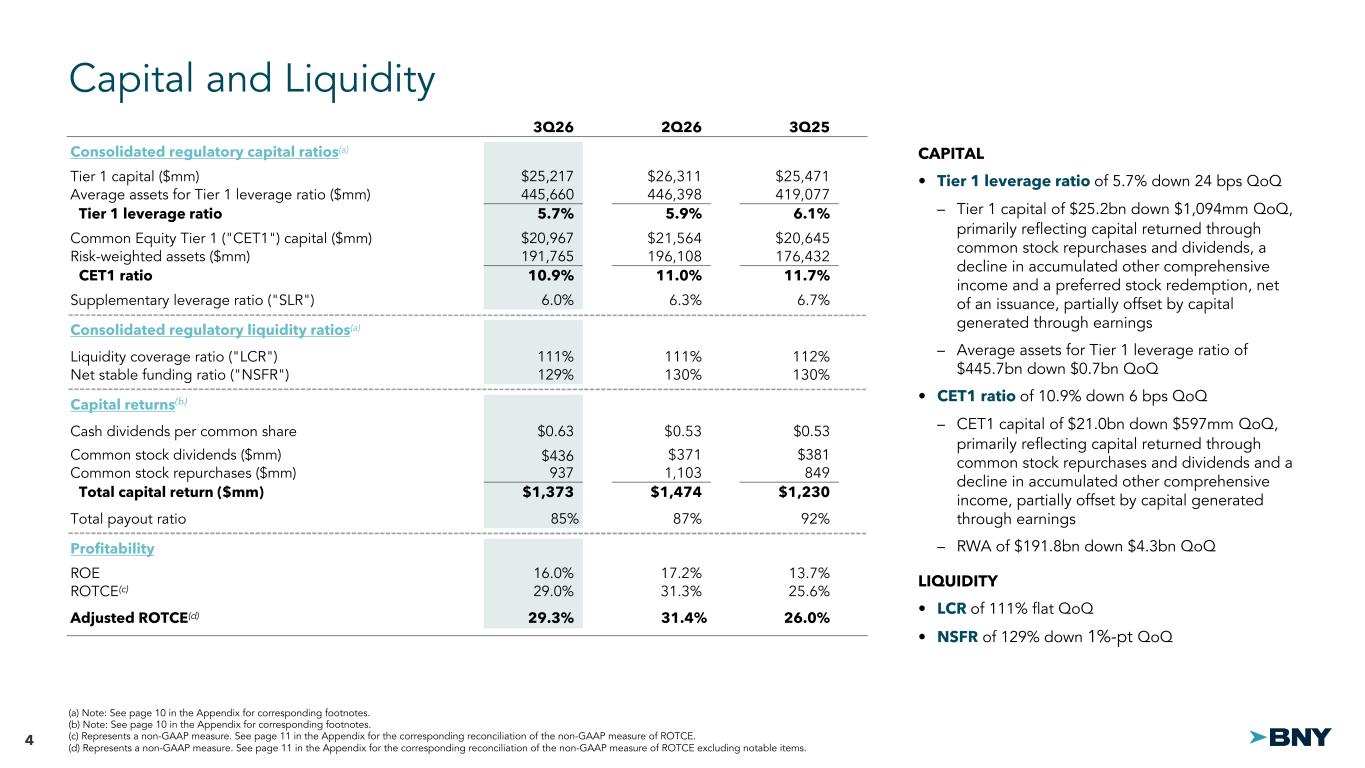
4 3Q26 2Q26 3Q25 Consolidated regulatory capital ratios(a) Tier 1 capital ($mm) $25,217 $26,311 $25,471 Average assets for Tier 1 leverage ratio ($mm) 445,660 446,398 419,077 Tier 1 leverage ratio 5.7% 5.9% 6.1% Common Equity Tier 1 ("CET1") capital ($mm) $20,967 $21,564 $20,645 Risk-weighted assets ($mm) 191,765 196,108 176,432 CET1 ratio 10.9% 11.0% 11.7% Supplementary leverage ratio ("SLR") 6.0% 6.3% 6.7% Consolidated regulatory liquidity ratios(a) Liquidity coverage ratio ("LCR") 111% 111% 112% Net stable funding ratio ("NSFR") 129% 130% 130% Capital returns(b) Cash dividends per common share $0.63 $0.53 $0.53 Common stock dividends ($mm) $436 $371 $381 Common stock repurchases ($mm) 937 1,103 849 Total capital return ($mm) $1,373 $1,474 $1,230 Total payout ratio 85% 87% 92% Profitability ROE 16.0% 17.2% 13.7% ROTCE(c) 29.0% 31.3% 25.6% Adjusted ROTCE(d) 29.3% 31.4% 26.0% Capital and Liquidity CAPITAL • Tier 1 leverage ratio of 5.7% down 24 bps QoQ – Tier 1 capital of $25.2bn down $1,094mm QoQ, primarily reflecting capital returned through common stock repurchases and dividends, a decline in accumulated other comprehensive income and a preferred stock redemption, net of an issuance, partially offset by capital generated through earnings – Average assets for Tier 1 leverage ratio of $445.7bn down $0.7bn QoQ • CET1 ratio of 10.9% down 6 bps QoQ – CET1 capital of $21.0bn down $597mm QoQ, primarily reflecting capital returned through common stock repurchases and dividends and a decline in accumulated other comprehensive income, partially offset by capital generated through earnings – RWA of $191.8bn down $4.3bn QoQ LIQUIDITY • LCR of 111% flat QoQ • NSFR of 129% down 1%-pt QoQ (a) Note: See page 10 in the Appendix for corresponding footnotes. (b) Note: See page 10 in the Appendix for corresponding footnotes. (c) Represents a non-GAAP measure. See page 11 in the Appendix for the corresponding reconciliation of the non-GAAP measure of ROTCE. (d) Represents a non-GAAP measure. See page 11 in the Appendix for the corresponding reconciliation of the non-GAAP measure of ROTCE excluding notable items.
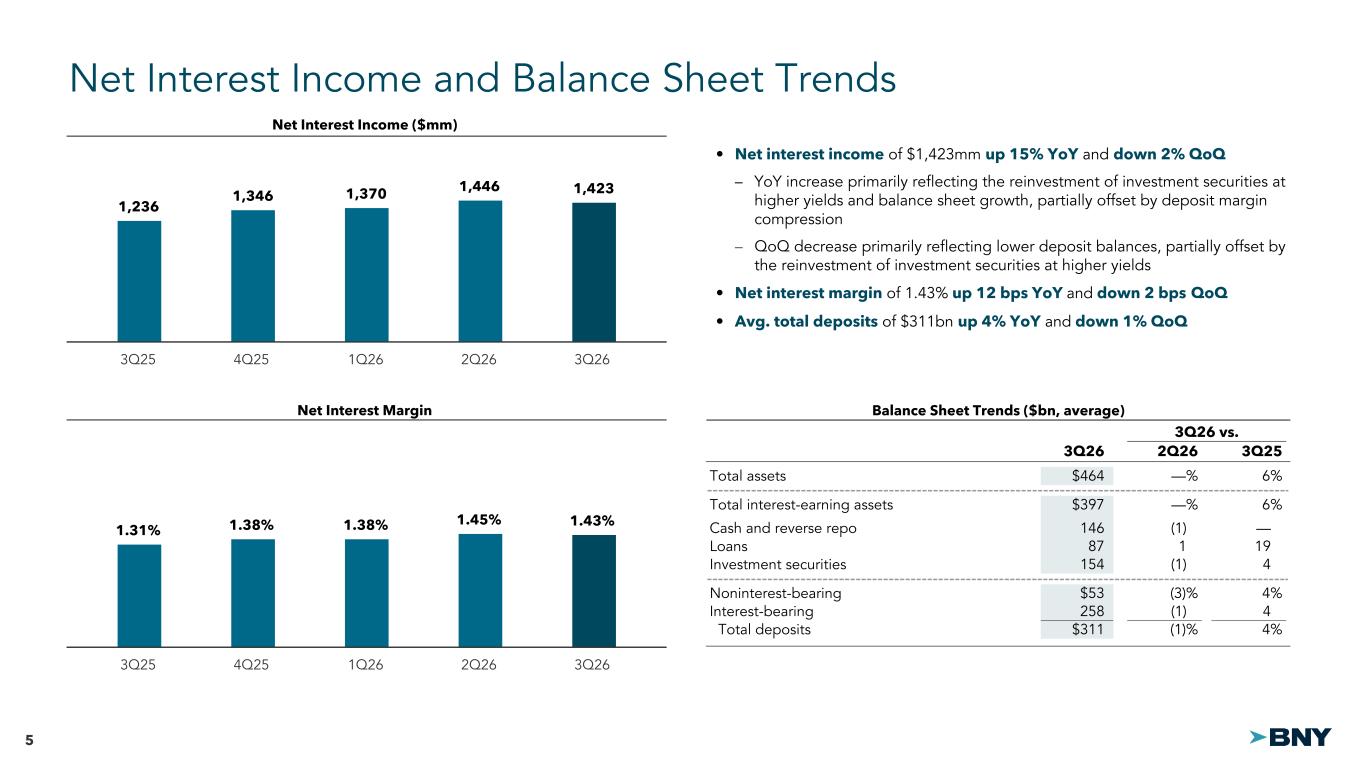
5 1,236 1,346 1,370 1,446 1,423 3Q25 4Q25 1Q26 2Q26 3Q26 3Q26 vs. 3Q26 2Q26 3Q25 Total assets $464 —% 6% Total interest-earning assets $397 —% 6% Cash and reverse repo 146 (1) — Loans 87 1 19 Investment securities 154 (1) 4 Noninterest-bearing $53 (3)% 4% Interest-bearing 258 (1) 4 Total deposits $311 (1)% 4% Net Interest Income and Balance Sheet Trends Net Interest Income ($mm) 1.31% 1.38% 1.38% 1.45% 1.43% 3Q25 4Q25 1Q26 2Q26 3Q26 Net Interest Margin Balance Sheet Trends ($bn, average) • Net interest income of $1,423mm up 15% YoY and down 2% QoQ – YoY increase primarily reflecting the reinvestment of investment securities at higher yields and balance sheet growth, partially offset by deposit margin compression – QoQ decrease primarily reflecting lower deposit balances, partially offset by the reinvestment of investment securities at higher yields • Net interest margin of 1.43% up 12 bps YoY and down 2 bps QoQ • Avg. total deposits of $311bn up 4% YoY and down 1% QoQ
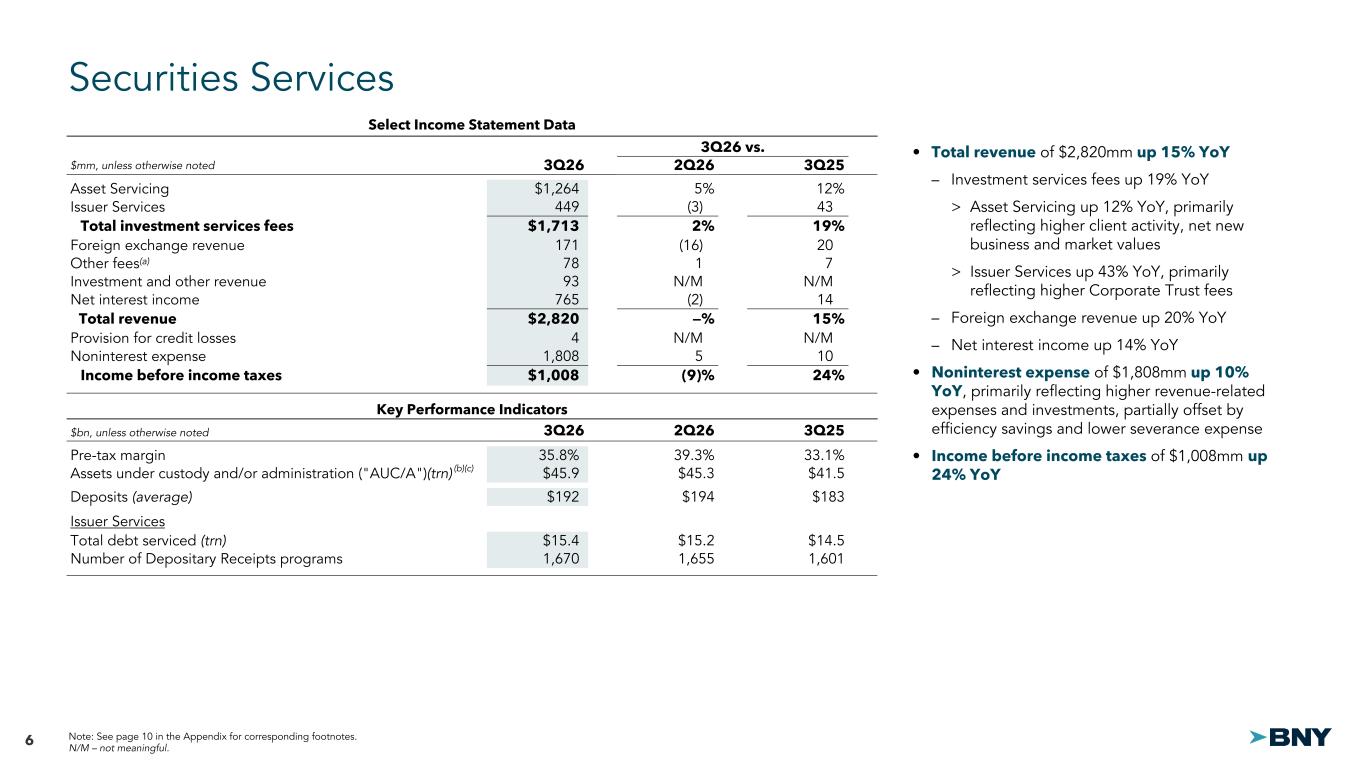
6 3Q26 vs. $mm, unless otherwise noted 3Q26 2Q26 3Q25 Asset Servicing $1,264 5% 12% Issuer Services 449 (3) 43 Total investment services fees $1,713 2% 19% Foreign exchange revenue 171 (16) 20 Other fees(a) 78 1 7 Investment and other revenue 93 N/M N/M Net interest income 765 (2) 14 Total revenue $2,820 —% 15% Provision for credit losses 4 N/M N/M Noninterest expense 1,808 5 10 Income before income taxes $1,008 (9)% 24% $bn, unless otherwise noted 3Q26 2Q26 3Q25 Pre-tax margin 35.8% 39.3% 33.1% Assets under custody and/or administration ("AUC/A")(trn) $45.9 $45.3 $41.5 Deposits (average) $192 $194 $183 Issuer Services Total debt serviced (trn) $15.4 $15.2 $14.5 Number of Depositary Receipts programs 1,670 1,655 1,601 Securities Services Select Income Statement Data Select Income Statement Data Key Performance Indicators (b)(c) • Total revenue of $2,820mm up 15% YoY – Investment services fees up 19% YoY > Asset Servicing up 12% YoY, primarily reflecting higher client activity, net new business and market values > Issuer Services up 43% YoY, primarily reflecting higher Corporate Trust fees – Foreign exchange revenue up 20% YoY – Net interest income up 14% YoY • Noninterest expense of $1,808mm up 10% YoY, primarily reflecting higher revenue-related expenses and investments, partially offset by efficiency savings and lower severance expense • Income before income taxes of $1,008mm up 24% YoY Note: See page 10 in the Appendix for corresponding footnotes. N/M – not meaningful.
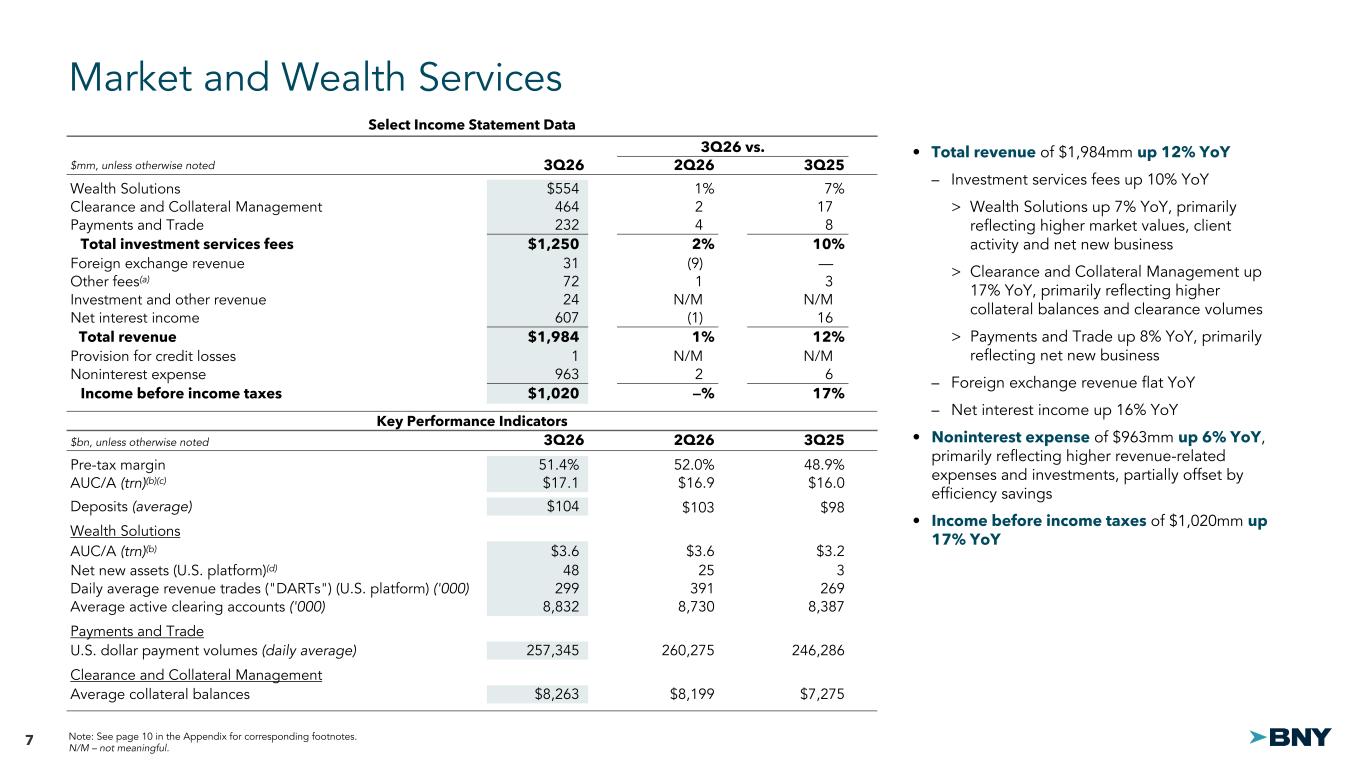
7 3Q26 vs. $mm, unless otherwise noted 3Q26 2Q26 3Q25 Wealth Solutions $554 1% 7% Clearance and Collateral Management 464 2 17 Payments and Trade 232 4 8 Total investment services fees $1,250 2% 10% Foreign exchange revenue 31 (9) — Other fees(a) 72 1 3 Investment and other revenue 24 N/M N/M Net interest income 607 (1) 16 Total revenue $1,984 1% 12% Provision for credit losses 1 N/M N/M Noninterest expense 963 2 6 Income before income taxes $1,020 —% 17% $bn, unless otherwise noted 3Q26 2Q26 3Q25 Pre-tax margin 51.4% 52.0% 48.9% AUC/A (trn)(b)(c) $17.1 $16.9 $16.0 Deposits (average) $104 $103 $98 Wealth Solutions AUC/A (trn)(b) $3.6 $3.6 $3.2 Net new assets (U.S. platform)(d) 48 25 3 Daily average revenue trades ("DARTs") (U.S. platform) ('000) 299 391 269 Average active clearing accounts ('000) 8,832 8,730 8,387 Payments and Trade U.S. dollar payment volumes (daily average) 257,345 260,275 246,286 Clearance and Collateral Management Average collateral balances $8,263 $8,199 $7,275 Market and Wealth Services Select Income Statement Data Key Performance Indicators Select Income Statement Data • Total revenue of $1,984mm up 12% YoY – Investment services fees up 10% YoY > Wealth Solutions up 7% YoY, primarily reflecting higher market values, client activity and net new business > Clearance and Collateral Management up 17% YoY, primarily reflecting higher collateral balances and clearance volumes > Payments and Trade up 8% YoY, primarily reflecting net new business – Foreign exchange revenue flat YoY – Net interest income up 16% YoY • Noninterest expense of $963mm up 6% YoY, primarily reflecting higher revenue-related expenses and investments, partially offset by efficiency savings • Income before income taxes of $1,020mm up 17% YoY Note: See page 10 in the Appendix for corresponding footnotes. N/M – not meaningful.
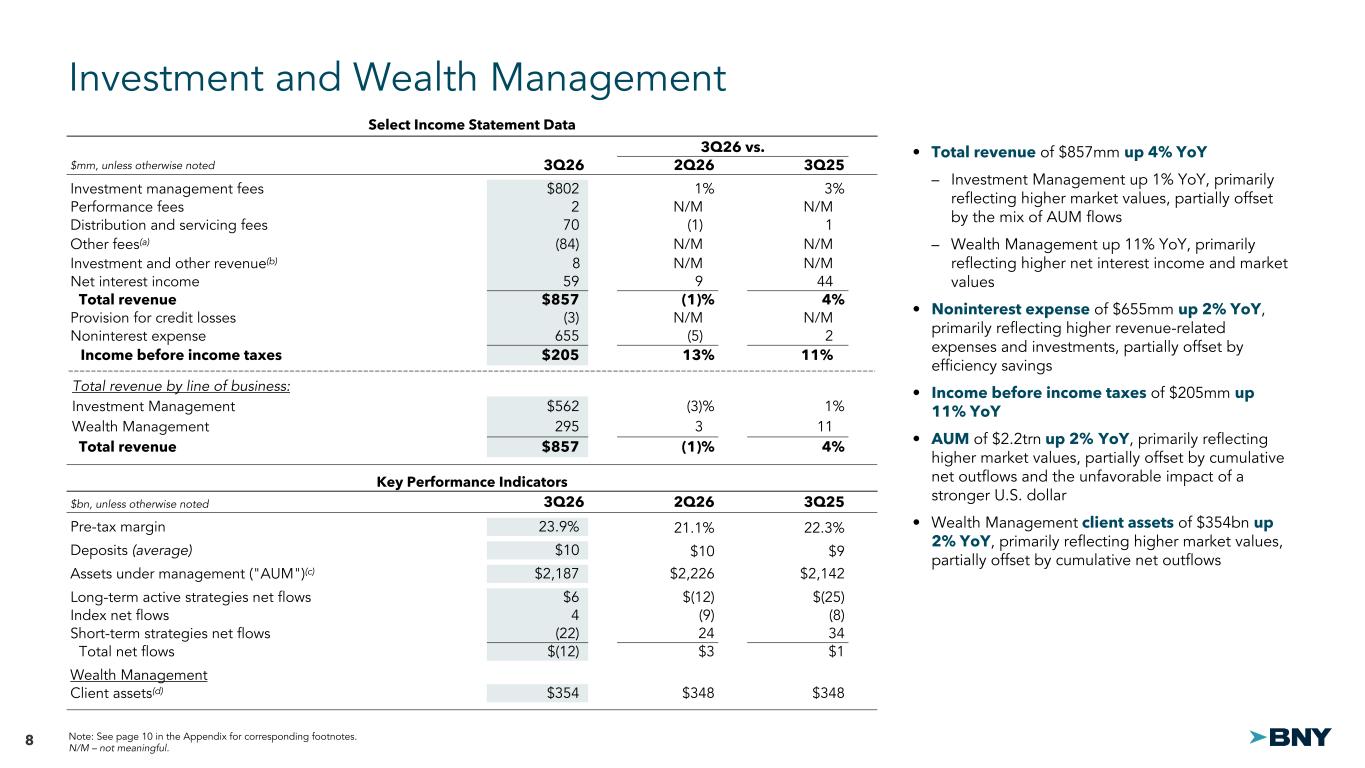
8 3Q26 vs. $mm, unless otherwise noted 3Q26 2Q26 3Q25 Investment management fees $802 1% 3% Performance fees 2 N/M N/M Distribution and servicing fees 70 (1) 1 Other fees(a) (84) N/M N/M Investment and other revenue(b) 8 N/M N/M Net interest income 59 9 44 Total revenue $857 (1)% 4% Provision for credit losses (3) N/M N/M Noninterest expense 655 (5) 2 Income before income taxes $205 13% 11% Total revenue by line of business: Investment Management $562 (3)% 1% Wealth Management 295 3 11 Total revenue $857 (1)% 4% $bn, unless otherwise noted 3Q26 2Q26 3Q25 Pre-tax margin 23.9% 21.1% 22.3% Deposits (average) $10 $10 $9 Assets under management ("AUM")(c) $2,187 $2,226 $2,142 Long-term active strategies net flows $6 $(12) $(25) Index net flows 4 (9) (8) Short-term strategies net flows (22) 24 34 Total net flows $(12) $3 $1 Wealth Management Client assets(d) $354 $348 $348 Investment and Wealth Management Select Income Statement Data Key Performance Indicators Select Income Statement Data • Total revenue of $857mm up 4% YoY – Investment Management up 1% YoY, primarily reflecting higher market values, partially offset by the mix of AUM flows – Wealth Management up 11% YoY, primarily reflecting higher net interest income and market values • Noninterest expense of $655mm up 2% YoY, primarily reflecting higher revenue-related expenses and investments, partially offset by efficiency savings • Income before income taxes of $205mm up 11% YoY • AUM of $2.2trn up 2% YoY, primarily reflecting higher market values, partially offset by cumulative net outflows and the unfavorable impact of a stronger U.S. dollar • Wealth Management client assets of $354bn up 2% YoY, primarily reflecting higher market values, partially offset by cumulative net outflows Note: See page 10 in the Appendix for corresponding footnotes. N/M – not meaningful.
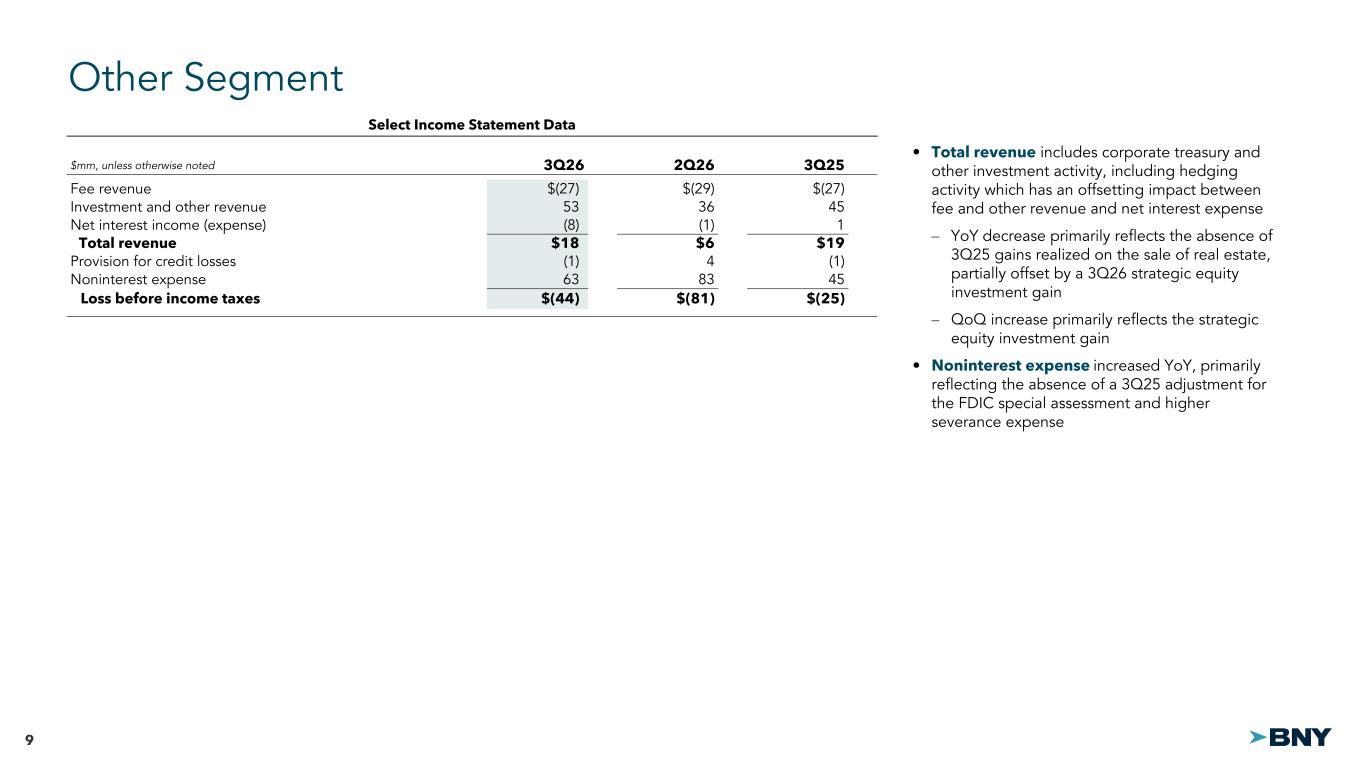
9 $mm, unless otherwise noted 3Q26 2Q26 3Q25 Fee revenue $(27) $(29) $(27) Investment and other revenue 53 36 45 Net interest income (expense) (8) (1) 1 Total revenue $18 $6 $19 Provision for credit losses (1) 4 (1) Noninterest expense 63 83 45 Loss before income taxes $(44) $(81) $(25) Other Segment Select Income Statement Data • Total revenue includes corporate treasury and other investment activity, including hedging activity which has an offsetting impact between fee and other revenue and net interest expense – YoY decrease primarily reflects the absence of 3Q25 gains realized on the sale of real estate, partially offset by a 3Q26 strategic equity investment gain – QoQ increase primarily reflects the strategic equity investment gain • Noninterest expense increased YoY, primarily reflecting the absence of a 3Q25 adjustment for the FDIC special assessment and higher severance expense Select Income Statement Data
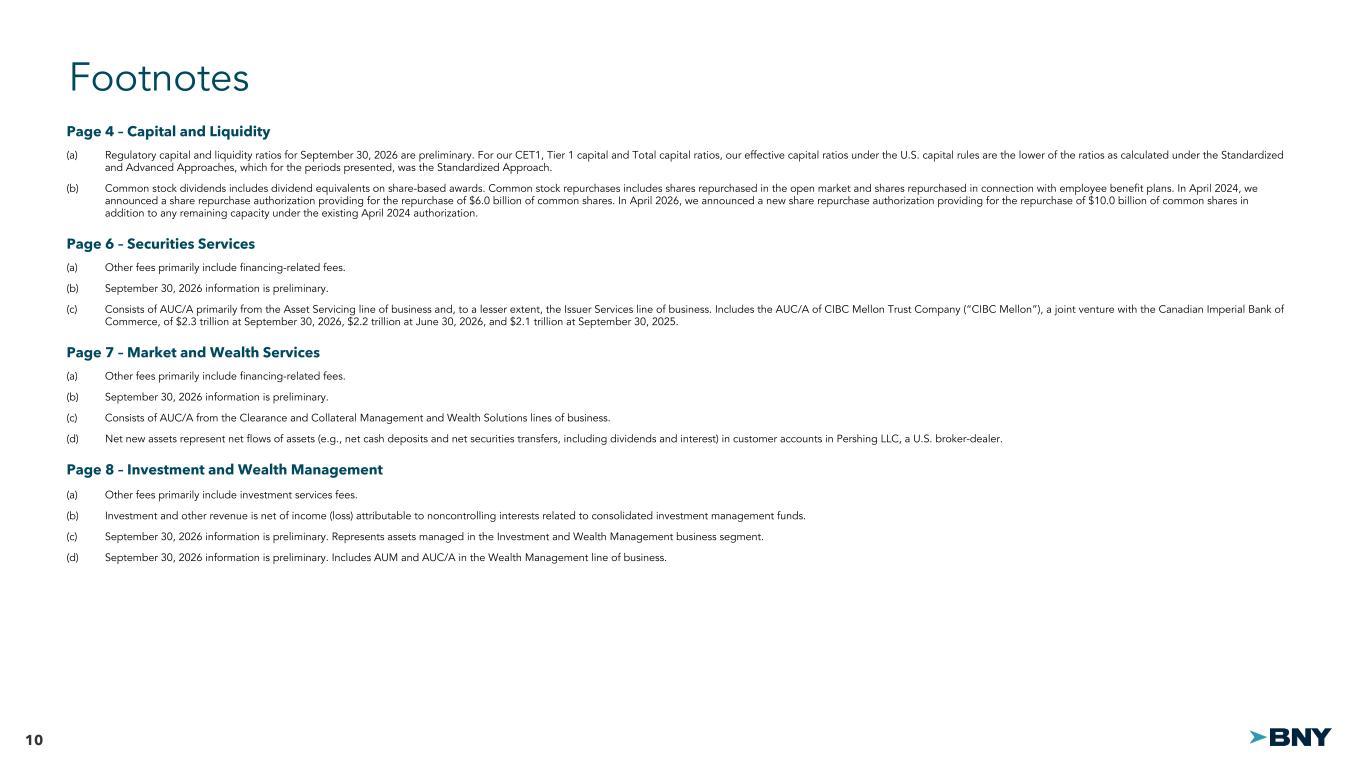
10 Footnotes Page 4 – Capital and Liquidity (a) Regulatory capital and liquidity ratios for September 30, 2026 are preliminary. For our CET1, Tier 1 capital and Total capital ratios, our effective capital ratios under the U.S. capital rules are the lower of the ratios as calculated under the Standardized and Advanced Approaches, which for the periods presented, was the Standardized Approach. (b) Common stock dividends includes dividend equivalents on share-based awards. Common stock repurchases includes shares repurchased in the open market and shares repurchased in connection with employee benefit plans. In April 2024, we announced a share repurchase authorization providing for the repurchase of $6.0 billion of common shares. In April 2026, we announced a new share repurchase authorization providing for the repurchase of $10.0 billion of common shares in addition to any remaining capacity under the existing April 2024 authorization. Page 6 – Securities Services (a) Other fees primarily include financing-related fees. (b) September 30, 2026 information is preliminary. (c) Consists of AUC/A primarily from the Asset Servicing line of business and, to a lesser extent, the Issuer Services line of business. Includes the AUC/A of CIBC Mellon Trust Company (“CIBC Mellon”), a joint venture with the Canadian Imperial Bank of Commerce, of $2.3 trillion at September 30, 2026, $2.2 trillion at June 30, 2026, and $2.1 trillion at September 30, 2025. Page 7 – Market and Wealth Services (a) Other fees primarily include financing-related fees. (b) September 30, 2026 information is preliminary. (c) Consists of AUC/A from the Clearance and Collateral Management and Wealth Solutions lines of business. (d) Net new assets represent net flows of assets (e.g., net cash deposits and net securities transfers, including dividends and interest) in customer accounts in Pershing LLC, a U.S. broker-dealer. Page 8 – Investment and Wealth Management (a) (a) Other fees primarily include investment services fees. (b) Investment and other revenue is net of income (loss) attributable to noncontrolling interests related to consolidated investment management funds. (c) September 30, 2026 information is preliminary. Represents assets managed in the Investment and Wealth Management business segment. (d) September 30, 2026 information is preliminary. Includes AUM and AUC/A in the Wealth Management line of business.
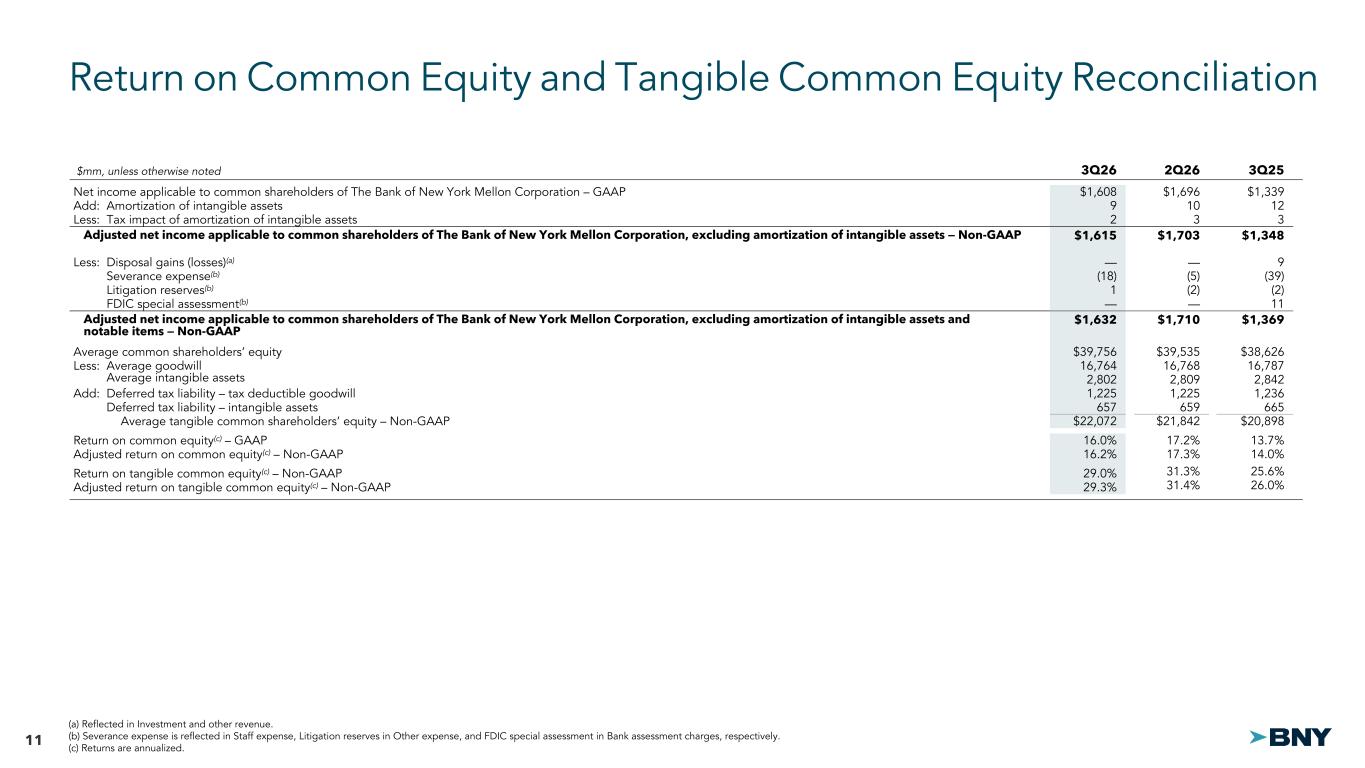
11 $mm, unless otherwise noted 3Q26 2Q26 3Q25 Net income applicable to common shareholders of The Bank of New York Mellon Corporation – GAAP $1,608 $1,696 $1,339 Add: Amortization of intangible assets 9 10 12 Less: Tax impact of amortization of intangible assets 2 3 3 Adjusted net income applicable to common shareholders of The Bank of New York Mellon Corporation, excluding amortization of intangible assets — Non-GAAP $1,615 $1,703 $1,348 Less: Disposal gains (losses)(a) — — 9 Less: Severance expense(b) (18) (5) (39) Less: Litigation reserves(b) 1 (2) (2) Less: FDIC special assessment(b) — — 11 Adjusted net income applicable to common shareholders of The Bank of New York Mellon Corporation, excluding amortization of intangible assets and notable items — Non-GAAP $1,632 $1,710 $1,369 Average common shareholders’ equity $39,756 $39,535 $38,626 Less: Average goodwill 16,764 16,768 16,787 Less: Average intangible assets 2,802 2,809 2,842 Add: Deferred tax liability – tax deductible goodwill 1,225 1,225 1,236 Add: Deferred tax liability – intangible assets 657 659 665 Average tangible common shareholders’ equity – Non-GAAP $22,072 $21,842 $20,898 Return on common equity(c) – GAAP 16.0% 17.2% 13.7% Adjusted return on common equity(c) – Non-GAAP 16.2% 17.3% 14.0% Return on tangible common equity(c) – Non-GAAP 29.0% 31.3% 25.6% Adjusted return on tangible common equity(c) – Non-GAAP 29.3% 31.4% 26.0% Return on Common Equity and Tangible Common Equity Reconciliation (a) Reflected in Investment and other revenue. (b) Severance expense is reflected in Staff expense, Litigation reserves in Other expense, and FDIC special assessment in Bank assessment charges, respectively. (c) Returns are annualized.
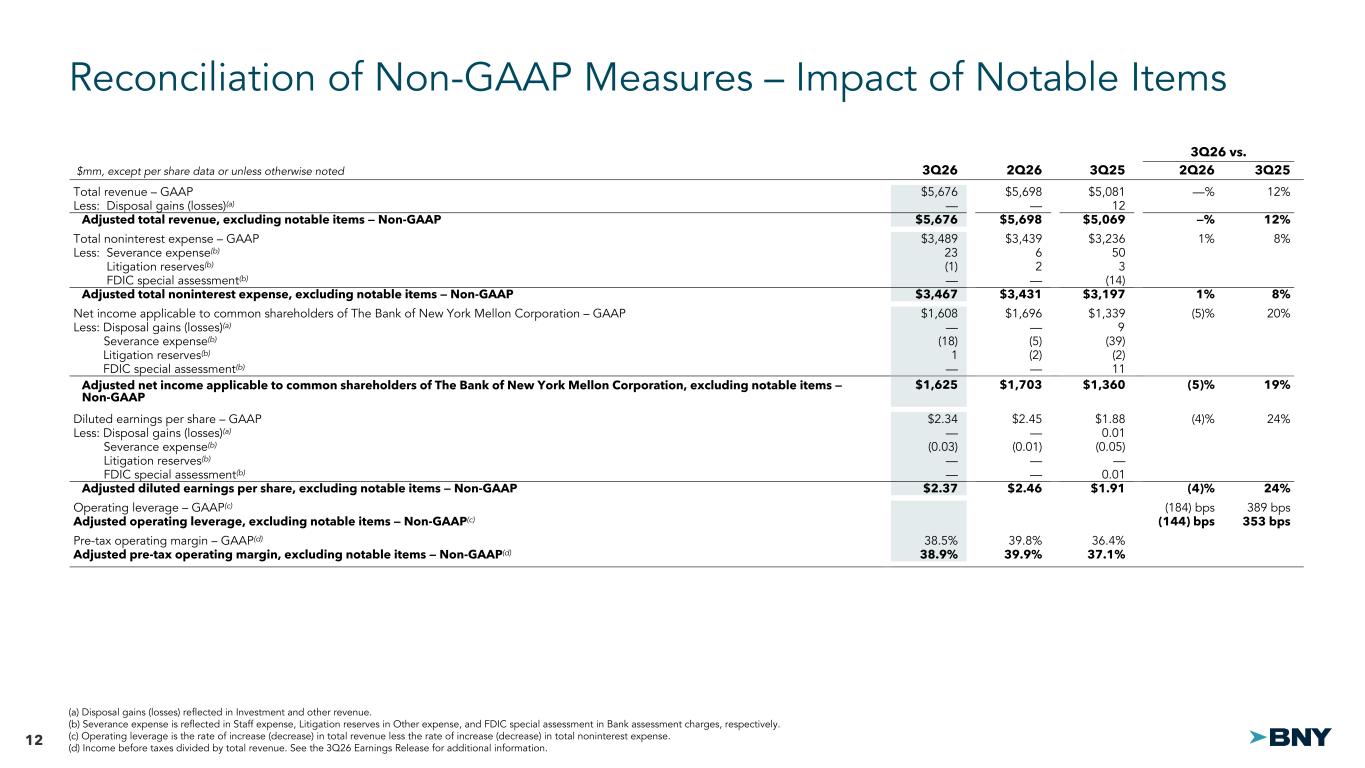
12 Select Income Statement Data Reconciliation of Non-GAAP Measures – Impact of Notable Items 3Q26 vs. $mm, except per share data or unless otherwise noted 3Q26 2Q26 3Q25 2Q26 3Q25 Total revenue – GAAP $5,676 $5,698 $5,081 —% 12% Less: Disposal gains (losses)(a) — — 12 Adjusted total revenue, excluding notable items — Non-GAAP $5,676 $5,698 $5,069 —% 12% Total noninterest expense – GAAP $3,489 $3,439 $3,236 1% 8% Less: Severance expense(b) 23 6 50 Less: Litigation reserves(b) (1) 2 3 Less: FDIC special assessment(b) — — (14) Adjusted total noninterest expense, excluding notable items — Non-GAAP $3,467 $3,431 $3,197 1% 8% Net income applicable to common shareholders of The Bank of New York Mellon Corporation – GAAP $1,608 $1,696 $1,339 (5)% 20% Less: Disposal gains (losses)(a) — — 9 Severance expense(b) (18) (5) (39) Less: Litigation reserves(b) 1 (2) (2) Less FDIC special assessment(b) — — 11 Adjusted net income applicable to common shareholders of The Bank of New York Mellon Corporation, excluding notable items — Non-GAAP $1,625 $1,703 $1,360 (5)% 19% Diluted earnings per share – GAAP $2.34 $2.45 $1.88 (4)% 24% Less: Disposal gains (losses)(a) — — 0.01 Severance expense(b) (0.03) (0.01) (0.05) Litigation reserves(b) — — — FDIC special assessment(b) — — 0.01 Adjusted diluted earnings per share, excluding notable items — Non-GAAP $2.37 $2.46 $1.91 (4)% 24% Operating leverage – GAAP(c) (184) bps 389 bps Adjusted operating leverage, excluding notable items — Non-GAAP(c) (144) bps 353 bps Pre-tax operating margin – GAAP(d) 38.5% 39.8% 36.4% Adjusted pre-tax operating margin, excluding notable items — Non-GAAP(d) 38.9% 39.9% 37.1% (a) Disposal gains (losses) reflected in Investment and other revenue. (b) Severance expense is reflected in Staff expense, Litigation reserves in Other expense, and FDIC special assessment in Bank assessment charges, respectively. (c) Operating leverage is the rate of increase (decrease) in total revenue less the rate of increase (decrease) in total noninterest expense. (d) Income before taxes divided by total revenue. See the 3Q26 Earnings Release for additional information.
13 A number of statements in our presentations, the accompanying slides and the responses to questions on our conference call discussing our quarterly results may constitute “forward-looking statements” within the meaning of the Private Securities Litigation Reform Act of 1995, including statements about The Bank of New York Mellon Corporation’s (the “Corporation,” “we,” “us,” or “our”) capital plans including dividends and repurchases, total payout ratio, financial performance, fee revenue, net interest income, expenses, cost discipline, efficiency savings, operating leverage, pre-tax margin, capital ratios, organic growth, pipeline, deposits, interest rates and yield curves, securities portfolio, taxes, investments, including in technology and product development, innovation in products and services, artificial intelligence, digital assets, client experience, strategic priorities and initiatives, acquisitions, related integration and divestiture activity, capabilities, resiliency, risk profile, human capital management and the effects of the current and near-term market and macroeconomic outlook on us, including on our business, operations, financial performance and prospects. Preliminary business metrics, NII sensitivity, and regulatory capital ratios are subject to change, possibly materially as we complete our Quarterly Report on Form 10-Q for the quarter ended September 30, 2026. Forward-looking statements may be expressed in a variety of ways, including the use of future or present tense language. Words such as “estimate,” “forecast,” “project,” “anticipate,” “likely,” “target,” “expect,” “intend,” “continue,” “seek,” “believe,” “plan,” “goal,” “could,” “should,” “would,” “may,” “might,” “will,” “strategy,” “synergies,” “opportunities,” “trends,” “momentum,” “ambition,” “aspiration,” “objective,” “aim,” “future,” “potentially,” “outlook” and words of similar meaning may signify forward-looking statements. These statements are not guarantees of future results or occurrences, are inherently uncertain and are based upon current beliefs and expectations of future events, many of which are, by their nature, difficult to predict, outside of our control and subject to change. By identifying these statements for you in this manner, we are alerting you to the possibility that our actual results may differ, possibly materially, from the anticipated results expressed or implied in these forward-looking statements as a result of a number of important factors. These factors include: global inflationary impacts and the risk factors and other uncertainties set forth in our Annual Report on Form 10-K for the year ended Dec. 31, 2025 (the “2025 Annual Report”) and our other filings with the Securities and Exchange Commission (the “SEC”). Forward-looking statements about the timing, profitability, benefits and other prospective aspects of business and expense initiatives, our financial outlook, our medium-term financial targets and our long-term strategy, and how they can be achieved, are based on our current expectations regarding our ability to execute against our strategic initiatives, as well as our balance sheet size and composition, and may change, possibly materially, from what is currently expected. Statements about our outlook on total revenue are subject to various factors, including market levels, client activity, our ability to win and onboard new business, lost business, pricing pressure, our ability to launch new products to, and expand relationships with, existing clients, interest rates, re-investment yields and the size, mix and duration of our balance sheet, including with respect to deposits, loan balances and the securities portfolio. Statements about our artificial intelligence initiatives, including the timing, implementation, efficacy and expected benefits, are subject to various factors, including third-party and vendor dependencies, the availability, usability and quality of data, evolving legal, regulatory and supervisory expectations, employee and client adoption, and our ability to deploy, monitor and scale such capabilities with appropriate governance and in an effective control environment. Statements about our outlook on net interest income are subject to various factors, including interest rates, continued quantitative tightening, re-investment yields and the size, mix and duration of our balance sheet, including with respect to deposits, loan balances and the securities portfolio. Statements about our outlook on expenses are subject to various factors, including investments, revenue-related expenses, efficiency savings, salary increases, inflation and currency fluctuations. Statements about our target Tier 1 leverage ratio and CET1 ratio are subject to various factors, including capital requirements, interest rates, capital levels, risk- weighted assets and the size of our balance sheet, including deposit levels. Statements about the timing, manner and amount of any future common stock dividends or repurchases are subject to various factors, including our capital position, capital deployment opportunities, prevailing market conditions, legal and regulatory considerations and our outlook for the economic environment. Statements about our future effective tax rate are subject to various factors including, changes in the tax rates applicable to us, changes in our earnings mix, our profitability, the assumptions we have made in forecasting our expected tax rate, the interpretation or application of existing tax statutes and regulations, as well as any corporate tax legislation that may be enacted or any guidance that may be issued by the U.S. Internal Revenue Service. You should not place undue reliance on any forward-looking statement. All forward-looking statements speak only as of the date on which they were made, and we undertake no obligation to update any forward-looking statement to reflect events or circumstances after such date or to reflect the occurrence of unanticipated events. Non-GAAP Measures. In this presentation, the accompanying slides and our responses to questions, we may discuss certain non-GAAP measures in detailing our performance, which exclude certain items or otherwise include components that differ from GAAP. We believe these measures are useful to the investment community in analyzing the financial results and trends of ongoing operations. We believe they facilitate comparisons with prior periods and reflect the principal basis on which our management monitors financial performance. Additional disclosures relating to non-GAAP measures are contained in our reports filed with the SEC, including the 2025 Annual Report, the third quarter 2026 earnings release and the third quarter 2026 financial supplement, which are available at www.bny.com/investorrelations. Forward-Looking Non-GAAP Financial Measures. From time to time we may discuss forward-looking non-GAAP financial measures, such as forward-looking estimates or targets for total revenue and expenses excluding notable items. We are unable to provide a reconciliation of forward-looking non-GAAP financial measures to their most directly comparable GAAP financial measures because we are unable to provide, without unreasonable effort, a meaningful or accurate calculation or estimation of amounts that would be necessary for the reconciliation due to the complexity and inherent difficulty in forecasting and quantifying future amounts or when they may occur. Such unavailable information could be significant to future results. Cautionary Statement