Pay vs Performance Disclosure - USD ($)
|
9 Months Ended |
12 Months Ended |
Mar. 31, 2027 |
Jun. 30, 2026 |
Jun. 30, 2025 |
Jun. 30, 2024 |
Jun. 30, 2023 |
| Pay vs Performance Disclosure |
|
|
|
|
|
| Pay vs Performance Disclosure, Table |
|
| | | | | | | | | | | | | | | | | | | | | | | | | | | | | | | | | | Summary Compensation Table Total for PEO (Cannon- Brookes)(2) ($) | Summary
Compensation
Table Total for
PEO
(Farquhar) ($) | Compensation
Actually Paid
for PEO
(Cannon-
Brookes)
($) | Compensation
Actually Paid
for PEO
(Farquhar)
($) | Average Summary Compensation Table Total for non-PEO NEOs(3) ($) | Average Compensation Actually Paid to non-PEO NEOs(3) ($) | Value of Initial Fixed $100 Investment Based On(1): | | | | Year | Total Stockholder Return ($) | Peer Group Total Stockholder Return ($) | GAAP
Net Loss
(in millions)
($) | Cloud Revenue(4) (in millions) ($) | | 2026 | $57,337 | | N/A | $57,337 | | N/A | $15,967,583 | | $2,563,726 | | $41.5 | | $160.2 | | -$53.8 | | $4,411 | | | 2025 | $54,240 | | $13,247 | | $54,240 | | $13,247 | | $16,693,120 | | $21,046,349 | | $108.4 | | $199.3 | | -$256.7 | | $3,447 | | | 2024 | $54,885 | | $55,871 | | $54,885 | | $55,871 | | $7,324,202 | | $3,180,090 | | $94.4 | | $173.9 | | -$300.5 | | $2,699 | | | 2023 | $55,109 | | $55,109 | | $55,109 | | $55,109 | | $13,612,685 | | $9,861,062 | | $89.5 | | $133.7 | | -$486.8 | | $2,085 | |
|
|
|
|
| Company Selected Measure Name |
|
Cloud revenue
|
|
|
|
| Named Executive Officers, Footnote |
|
Mr. Cannon-Brookes is and Mr. Farquhar was paid in Australian dollars, which have been converted into US dollars using a monthly average exchange rate for fiscal year 2026 of USD $1.00 to AUD $1.47, for fiscal year 2025 of USD $1.00 to AUD $1.55, for fiscal year 2024 of USD $1.00 to AUD $1.52, and for fiscal year 2023 of USD $1.00 to AUD $1.51. Messrs. Cannon-Brookes and Farquhar did not receive stock awards as part of their compensation and did not participate in the annual incentive bonus program.The individuals comprising the Non-PEO NEOs for each year are listed below: | | | | | | | | | | | | | 2026 | 2025 | 2024 | 2023 | | Anu Bharadwaj | Anu Bharadwaj | Anu Bharadwaj | Anu Bharadwaj | | Joseph Binz | Joseph Binz | Joseph Binz | Joseph Binz | | Rajeev Rajan | Rajeev Rajan | Rajeev Rajan | Rajeev Rajan | Brian Duffy | Brian Duffy | Cameron Deatsch | Cameron Deatsch | | James Chuong | | | |
|
|
|
|
| Peer Group Issuers, Footnote |
|
The Peer Group Total Stockholder Return set forth in this table utilizes the S&P 500 System Software Sub Industry Index which we also included in the stock performance graph required in our Annual Report on Form 10-K for fiscal year 2026. The comparison assumes $100 was invested for the period starting June 30, 2022, through the end of the listed year in Atlassian Class A Common Stock and in the S&P 500 System Software Sub Industry Index, respectively. Historical stock performance is not necessarily indicative of future stock performance.
|
|
|
|
| Adjustment To PEO Compensation, Footnote |
|
| | | | | | | | | | | | | | | | | | | | | | | | | | | | | | | | | | | | | | | | | | | | | | Fiscal Year 2026 | | Fiscal Year 2025 | | Fiscal Year 2024 | | Fiscal Year 2023 | | Mr. Cannon-
Brookes
(PEO) | Non-PEO NEOs(1) | | Mr. Cannon-
Brookes
(PEO) | Mr. Farquhar
(PEO) | Non-PEO NEOs(1) | | Mr. Cannon-
Brookes
(PEO) | Mr. Farquhar
(PEO) | Non-PEO NEOs(1) | | Mr. Cannon-
Brookes
(PEO) | Mr. Farquhar
(PEO) | Non-PEO NEOs(1) | | Summary Compensation Table Total | $57,337 | $15,967,583 | | | $54,240 | $13,247 | $16,693,120 | | | $54,885 | $55,871 | $7,324,202 | | $55,109 | $55,109 | $13,612,685 | Less - Grant date fair value of awards granted during the fiscal year | — | $8,767,341 | | — | — | $15,924,322 | | — | — | $6,577,254 | | — | — | $12,944,242 | Plus - Fair value of awards granted during the fiscal year at vest (if vested) or at year-end (if unvested) | — | $8,247,609 | | — | — | $17,477,926 | | — | — | $4,198,254 | | — | — | $10,268,477 | Plus - Change in fair value of awards granted prior to the fiscal year (2) | — | -$12,884,126 | | — | — | $2,799,625 | | — | — | -$1,765,112 | | — | — | -$1,075,858 | | Compensation Actually Paid | $57,337 | $2,563,726 | | $54,240 | $13,247 | $21,046,349 | | $54,885 | $55,871 | $3,180,090 | | $55,109 | $55,109 | $9,861,062 |
|
|
|
|
| Non-PEO NEO Average Total Compensation Amount |
|
$ 15,967,583
|
$ 16,693,120
|
$ 7,324,202
|
$ 13,612,685
|
| Non-PEO NEO Average Compensation Actually Paid Amount |
|
$ 2,563,726
|
21,046,349
|
3,180,090
|
9,861,062
|
| Adjustment to Non-PEO NEO Compensation Footnote |
| | | | | | | | | | | | | | | | | | | | | | | | | | | | | | | | | | | | | | | | | | | | | | Fiscal Year 2026 | | Fiscal Year 2025 | | Fiscal Year 2024 | | Fiscal Year 2023 | | Mr. Cannon-
Brookes
(PEO) | Non-PEO NEOs(1) | | Mr. Cannon-
Brookes
(PEO) | Mr. Farquhar
(PEO) | Non-PEO NEOs(1) | | Mr. Cannon-
Brookes
(PEO) | Mr. Farquhar
(PEO) | Non-PEO NEOs(1) | | Mr. Cannon-
Brookes
(PEO) | Mr. Farquhar
(PEO) | Non-PEO NEOs(1) | | Summary Compensation Table Total | $57,337 | $15,967,583 | | | $54,240 | $13,247 | $16,693,120 | | | $54,885 | $55,871 | $7,324,202 | | $55,109 | $55,109 | $13,612,685 | Less - Grant date fair value of awards granted during the fiscal year | — | $8,767,341 | | — | — | $15,924,322 | | — | — | $6,577,254 | | — | — | $12,944,242 | Plus - Fair value of awards granted during the fiscal year at vest (if vested) or at year-end (if unvested) | — | $8,247,609 | | — | — | $17,477,926 | | — | — | $4,198,254 | | — | — | $10,268,477 | Plus - Change in fair value of awards granted prior to the fiscal year (2) | — | -$12,884,126 | | — | — | $2,799,625 | | — | — | -$1,765,112 | | — | — | -$1,075,858 | | Compensation Actually Paid | $57,337 | $2,563,726 | | $54,240 | $13,247 | $21,046,349 | | $54,885 | $55,871 | $3,180,090 | | $55,109 | $55,109 | $9,861,062 |
|
|
|
|
|
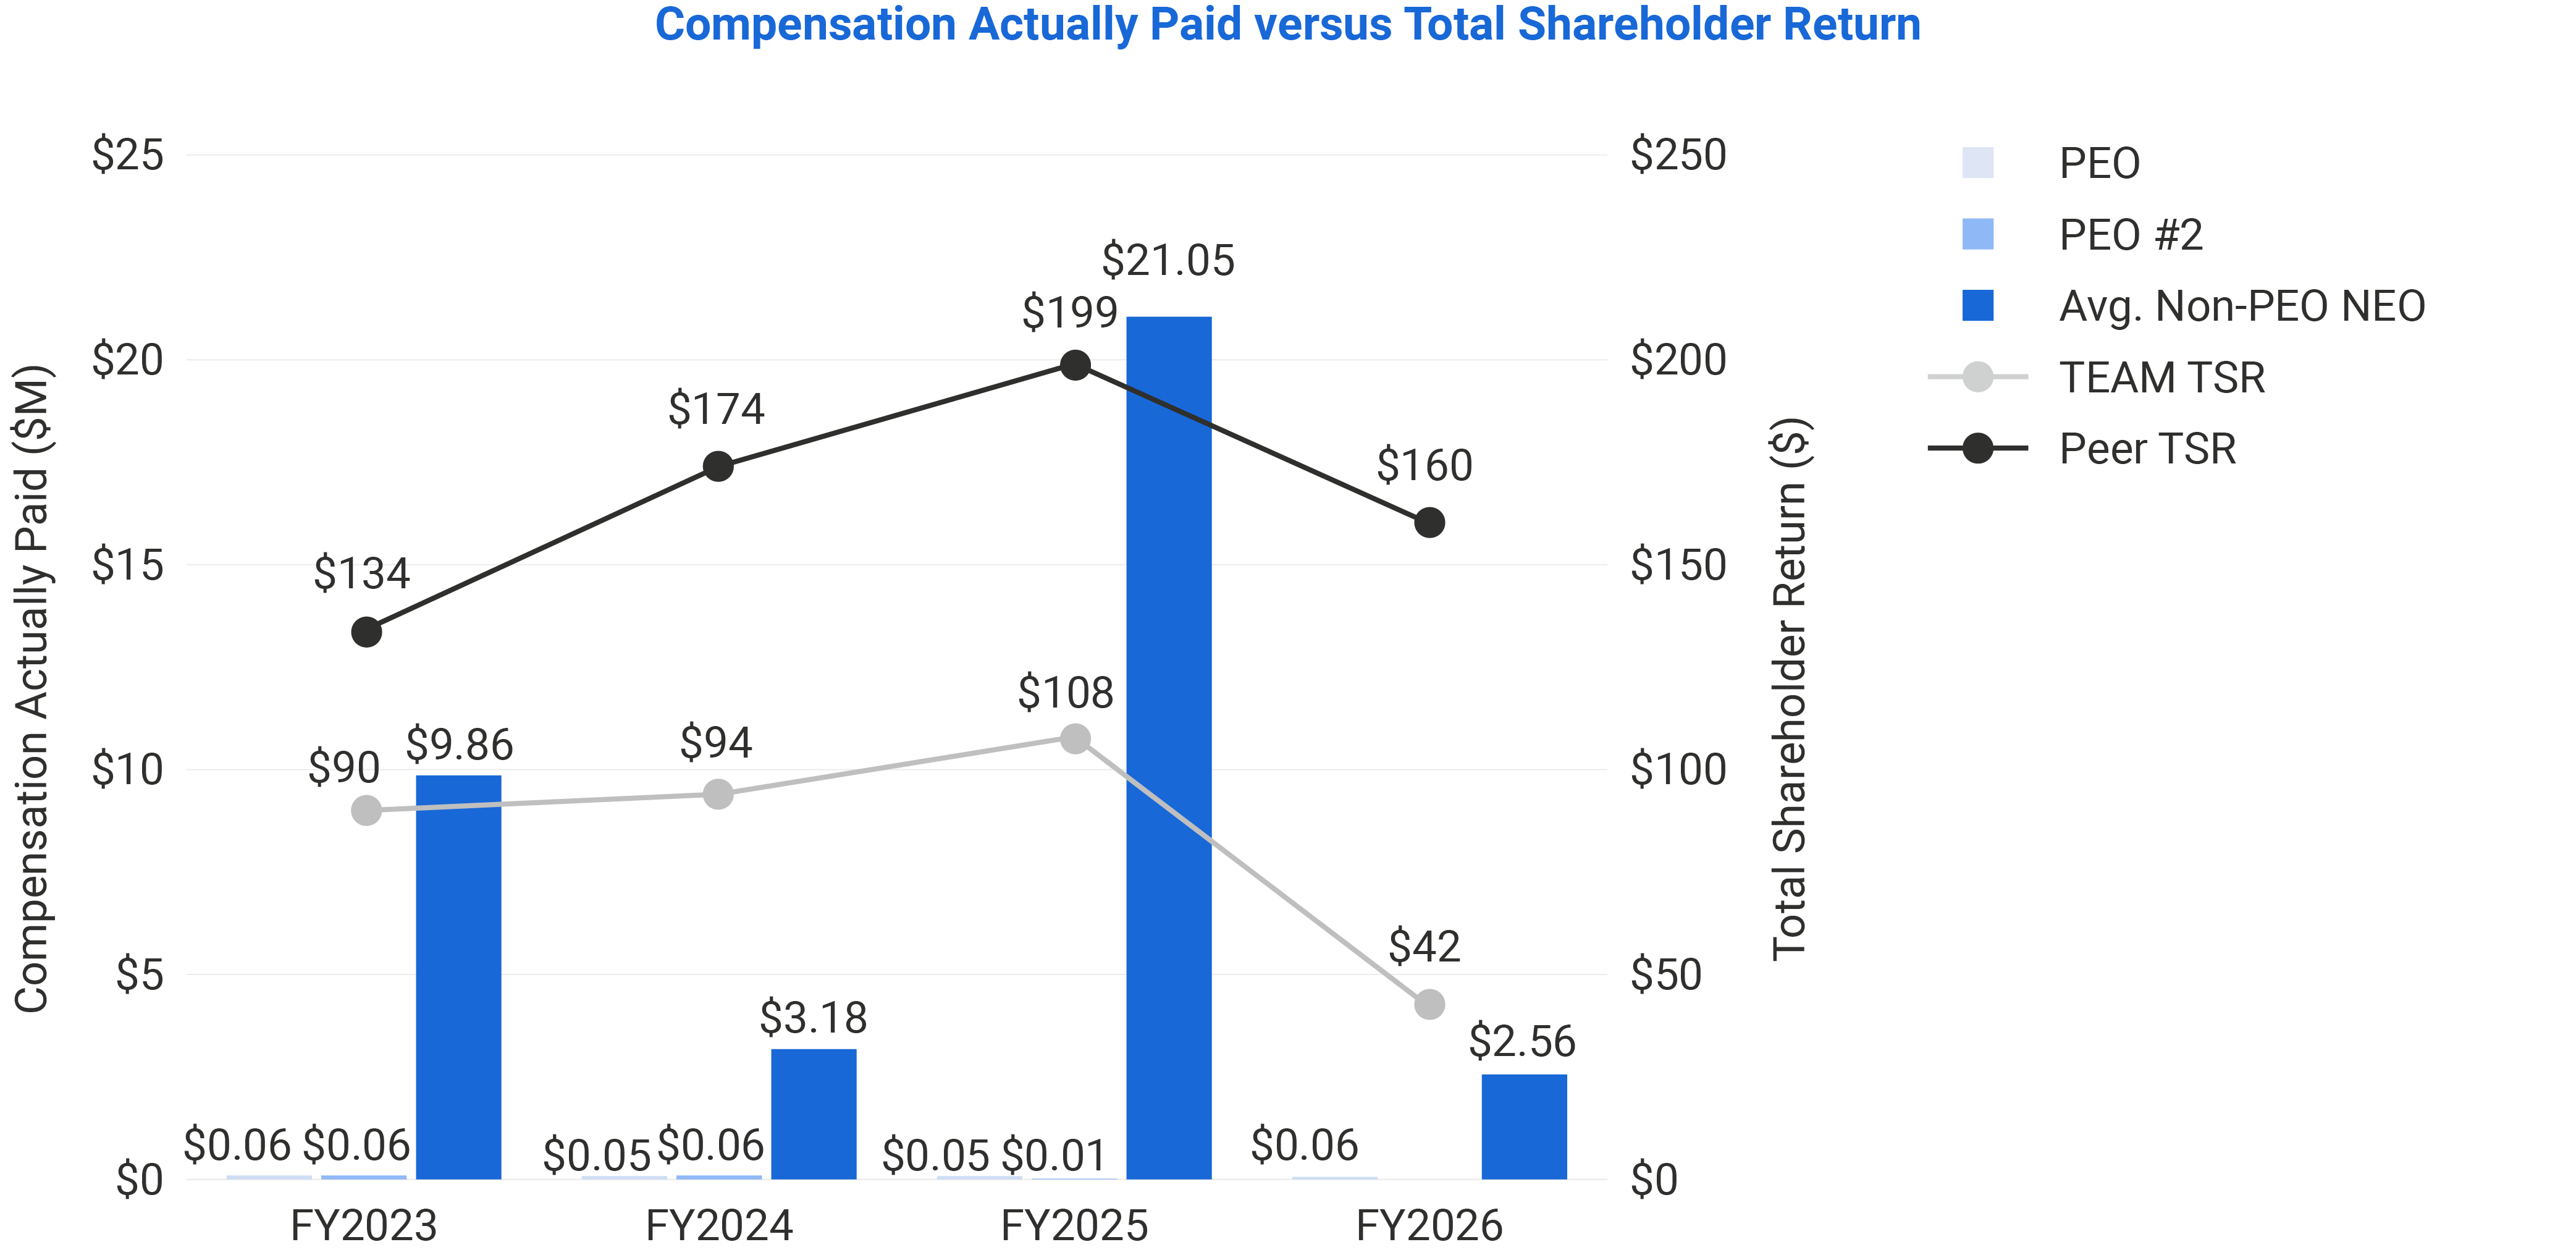
| Compensation Actually Paid vs. Total Shareholder Return |
|
The increase in Compensation Actually Paid (as computed in accordance with SEC rules) to our Non-PEO NEOs for fiscal year 2026 is due primarily to the change in composition of our Non-PEO NEOs.
|
|
|
|
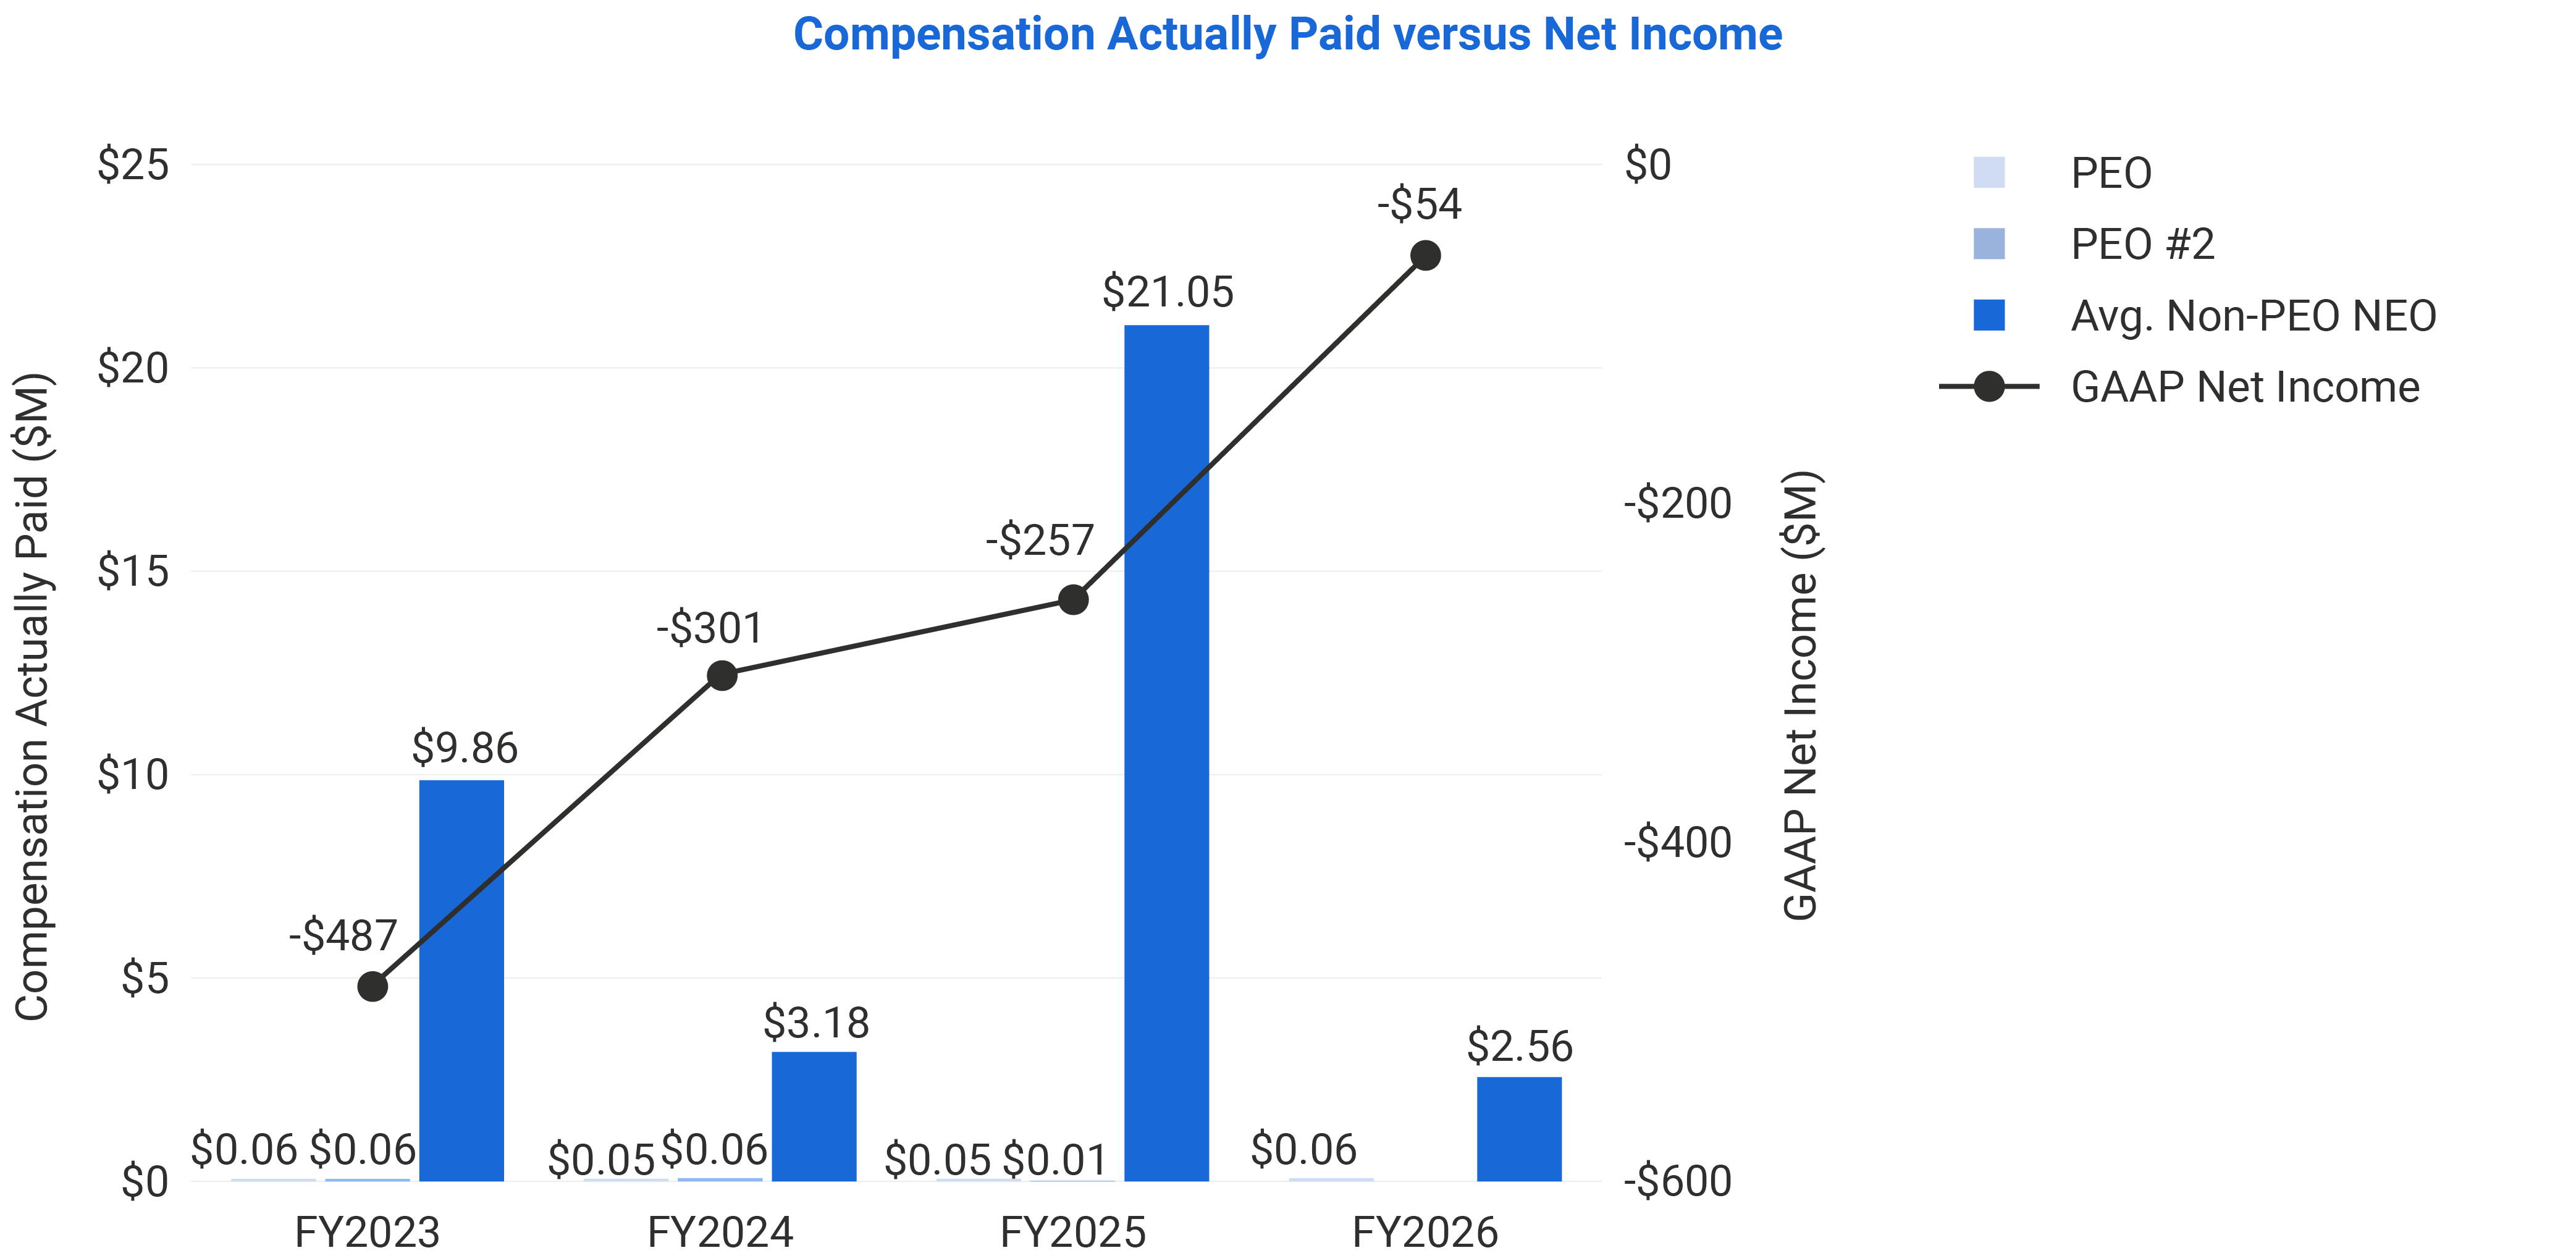
| Compensation Actually Paid vs. Net Income |
|
Our net losses across fiscal years 2023, 2024, 2025, and 2026 were inclusive of stock-based compensation expense and did not have any impact on the Compensation Actually Paid (as computed in accordance with SEC rules) to our Non-PEO NEOs.
|
|
|
|
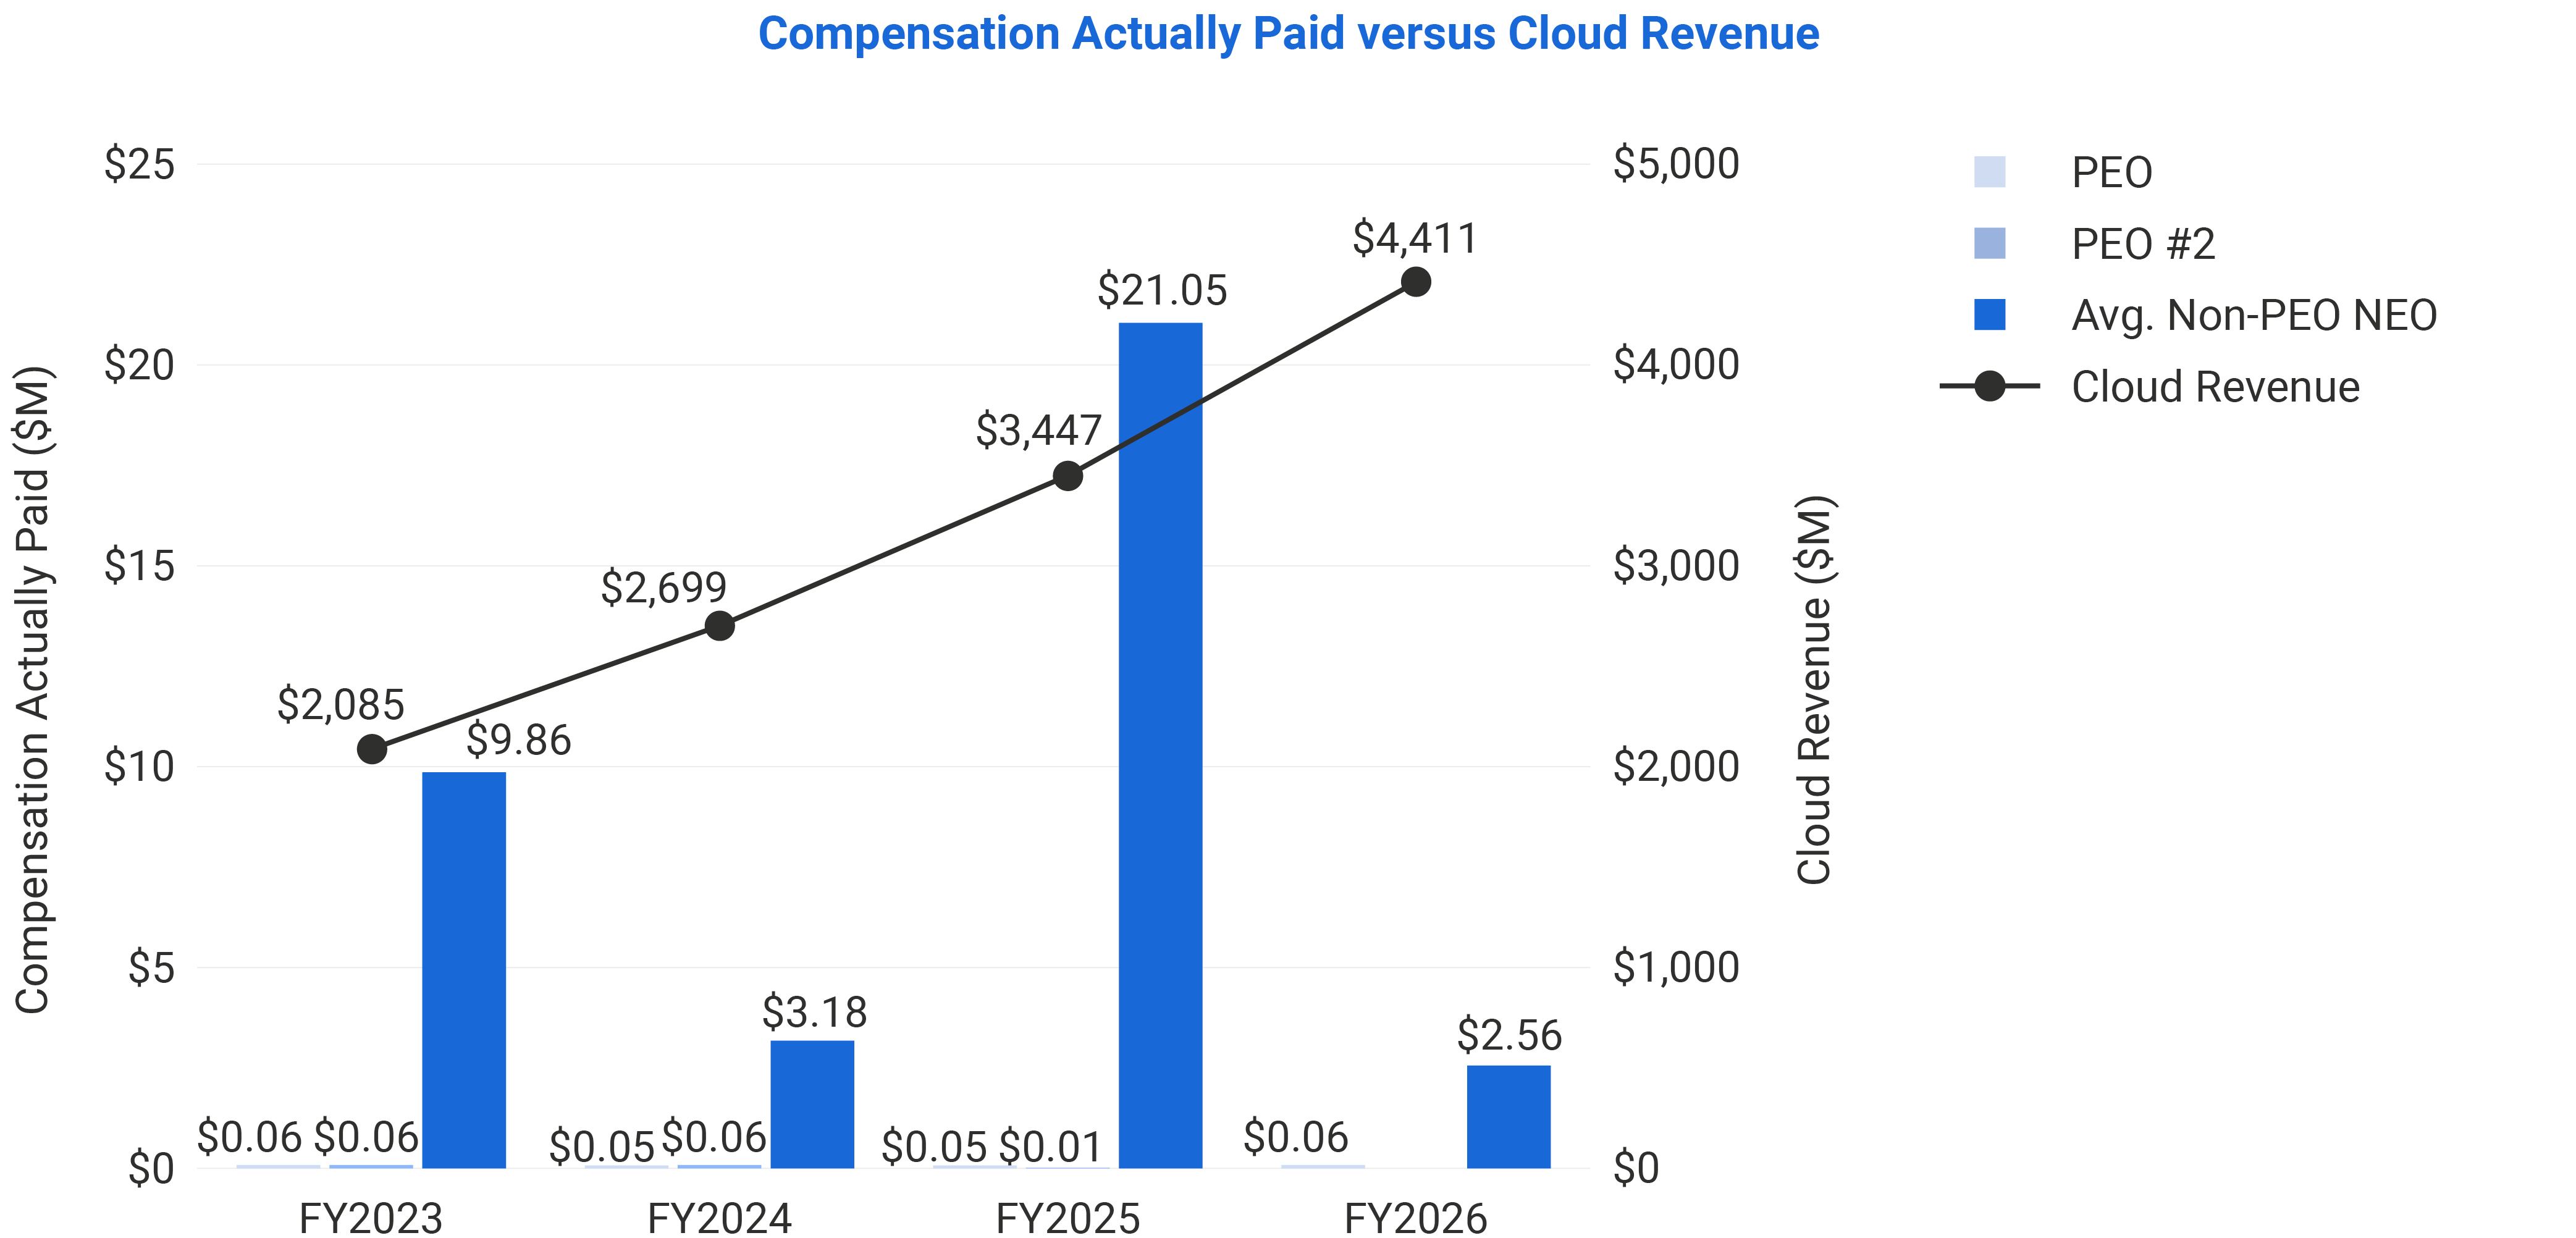
| Compensation Actually Paid vs. Company Selected Measure |
|
Our annual Cloud revenue targets had a direct impact on the overall compensation of our Non-PEO NEOs, as it, when added to fees received for sales of third-party cloud apps in the Atlassian Marketplace, resulted in bonus payouts of 45.2%, 95.6%, 96.6%, and 100% for fiscal years 2023, 2024, 2025, and 2026, respectively.
|
|
|
|
| Total Shareholder Return Vs Peer Group |
|
Our cumulative total stockholder return over the same period reflects the challenging competitive landscape and macroeconomic environment.
|
|
|
|
| Total Shareholder Return Amount |
|
$ 41.5
|
108.4
|
94.4
|
89.5
|
| Peer Group Total Shareholder Return Amount |
|
160.2
|
199.3
|
173.9
|
133.7
|
| Net Income (Loss) |
|
$ (53,800,000)
|
$ (256,700,000)
|
$ (300,500,000)
|
$ (486,800,000)
|
| Company Selected Measure Amount |
|
4,411,000,000
|
3,447,000,000
|
2,699,000,000
|
2,085,000,000
|
| Additional 402(v) Disclosure |
|
Cloud revenue is equal to Cloud revenue as reported in the audited financial statements included in our Annual Report on Form 10-K for fiscal years 2026, 2025, 2024 and 2023.All amounts included in this column represent the average for all Non-PEO NEOs.Calculated as fair value at the earlier of vesting date or last day of the fiscal year minus the fair value on the last day of the prior fiscal year. We believe that Cloud revenue, which we define as Cloud revenue as reported in our audited financial statements, represents the most important financial performance measure used by us to link compensation actually paid to our NEOs to our performance for the fiscal year ended June 30, 2026. We also believe that Marketplace Cloud revenue is an important financial performance measure that we have used to link compensation actually paid to our NEOs to our performance for the fiscal year 2026. We do not use any other financial performance measures in linking compensation actually paid to our NEOs to our performance.
|
|
|
|
| Cannon-Brookes [Member] |
|
|
|
|
|
| Pay vs Performance Disclosure |
|
|
|
|
|
| PEO Total Compensation Amount |
|
$ 57,337
|
$ 54,240
|
$ 54,885
|
$ 55,109
|
| PEO Actually Paid Compensation Amount |
|
57,337
|
54,240
|
54,885
|
55,109
|
| Farquhar [Member] |
|
|
|
|
|
| Pay vs Performance Disclosure |
|
|
|
|
|
| PEO Total Compensation Amount |
|
|
13,247
|
55,871
|
55,109
|
| PEO Actually Paid Compensation Amount |
|
|
13,247
|
55,871
|
55,109
|
| PEO | Cannon-Brookes [Member] | Year-over-Year Change in Fair Value of Equity Awards Granted in Prior Years That are Outstanding and Unvested |
|
|
|
|
|
| Pay vs Performance Disclosure |
|
|
|
|
|
| Adjustment to Compensation, Amount |
|
0
|
0
|
0
|
0
|
| PEO | Cannon-Brookes [Member] | Vesting Date Fair Value of Equity Awards Granted and Vested in Covered Year |
|
|
|
|
|
| Pay vs Performance Disclosure |
|
|
|
|
|
| Adjustment to Compensation, Amount |
|
0
|
0
|
0
|
0
|
| PEO | Cannon-Brookes [Member] | Change in Fair Value as of Vesting Date of Prior Year Equity Awards Vested in Covered Year |
|
|
|
|
|
| Pay vs Performance Disclosure |
|
|
|
|
|
| Adjustment to Compensation, Amount |
|
0
|
0
|
0
|
0
|
| PEO | Farquhar [Member] | Year-over-Year Change in Fair Value of Equity Awards Granted in Prior Years That are Outstanding and Unvested |
|
|
|
|
|
| Pay vs Performance Disclosure |
|
|
|
|
|
| Adjustment to Compensation, Amount |
|
|
0
|
0
|
0
|
| PEO | Farquhar [Member] | Vesting Date Fair Value of Equity Awards Granted and Vested in Covered Year |
|
|
|
|
|
| Pay vs Performance Disclosure |
|
|
|
|
|
| Adjustment to Compensation, Amount |
|
|
0
|
0
|
0
|
| PEO | Farquhar [Member] | Change in Fair Value as of Vesting Date of Prior Year Equity Awards Vested in Covered Year |
|
|
|
|
|
| Pay vs Performance Disclosure |
|
|
|
|
|
| Adjustment to Compensation, Amount |
|
|
0
|
0
|
0
|
| Non-PEO NEO | Year-over-Year Change in Fair Value of Equity Awards Granted in Prior Years That are Outstanding and Unvested |
|
|
|
|
|
| Pay vs Performance Disclosure |
|
|
|
|
|
| Adjustment to Compensation, Amount |
|
8,247,609
|
17,477,926
|
4,198,254
|
10,268,477
|
| Non-PEO NEO | Vesting Date Fair Value of Equity Awards Granted and Vested in Covered Year |
|
|
|
|
|
| Pay vs Performance Disclosure |
|
|
|
|
|
| Adjustment to Compensation, Amount |
|
(8,767,341)
|
(15,924,322)
|
(6,577,254)
|
(12,944,242)
|
| Non-PEO NEO | Change in Fair Value as of Vesting Date of Prior Year Equity Awards Vested in Covered Year |
|
|
|
|
|
| Pay vs Performance Disclosure |
|
|
|
|
|
| Adjustment to Compensation, Amount |
|
$ (12,884,126)
|
$ 2,799,625
|
$ (1,765,112)
|
$ (1,075,858)
|