
1 3Q 2026 Financial Highlights NYSE: STT October 14, 2026 Exhibit 99.3
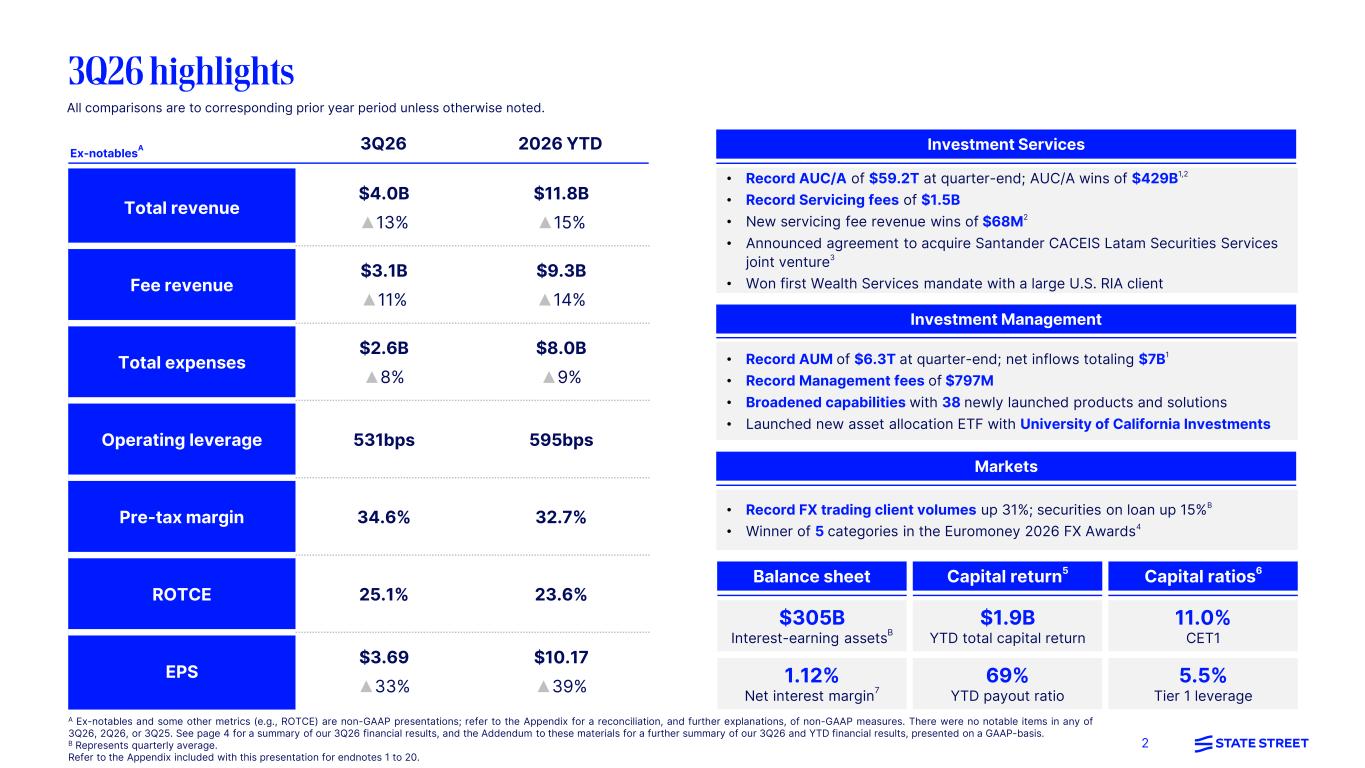
2 A Ex-notables and some other metrics (e.g., ROTCE) are non-GAAP presentations; refer to the Appendix for a reconciliation, and further explanations, of non-GAAP measures. There were no notable items in any of 3Q26, 2Q26, or 3Q25. See page 4 for a summary of our 3Q26 financial results, and the Addendum to these materials for a further summary of our 3Q26 and YTD financial results, presented on a GAAP-basis. B Represents quarterly average. Refer to the Appendix included with this presentation for endnotes 1 to 20. All comparisons are to corresponding prior year period unless otherwise noted. • Record AUC/A of $59.2T at quarter-end; AUC/A wins of $429B1,2 • Record Servicing fees of $1.5B • New servicing fee revenue wins of $68M2 • Announced agreement to acquire Santander CACEIS Latam Securities Services joint venture3 • Won first Wealth Services mandate with a large U.S. RIA client Investment Services $1.9B YTD total capital return Capital return5 69% YTD payout ratio Capital ratios6 5.5% Tier 1 leverage 11.0% CET1 $305B Interest-earning assetsB 1.12% Net interest margin7 Balance sheet 3Q26 2026 YTD Total revenue $4.0B ▲13% $11.8B ▲15% Fee revenue $3.1B ▲11% $9.3B ▲14% Total expenses $2.6B ▲8% $8.0B ▲9% Operating leverage 531bps 595bps Pre-tax margin 34.6% 32.7% ROTCE 25.1% 23.6% EPS $3.69 ▲33% $10.17 ▲39% Ex-notablesA • Record FX trading client volumes up 31%; securities on loan up 15%B • Winner of 5 categories in the Euromoney 2026 FX Awards4 Markets • Record AUM of $6.3T at quarter-end; net inflows totaling $7B1 • Record Management fees of $797M • Broadened capabilities with 38 newly launched products and solutions • Launched new asset allocation ETF with University of California Investments Investment Management 3Q26 highlights
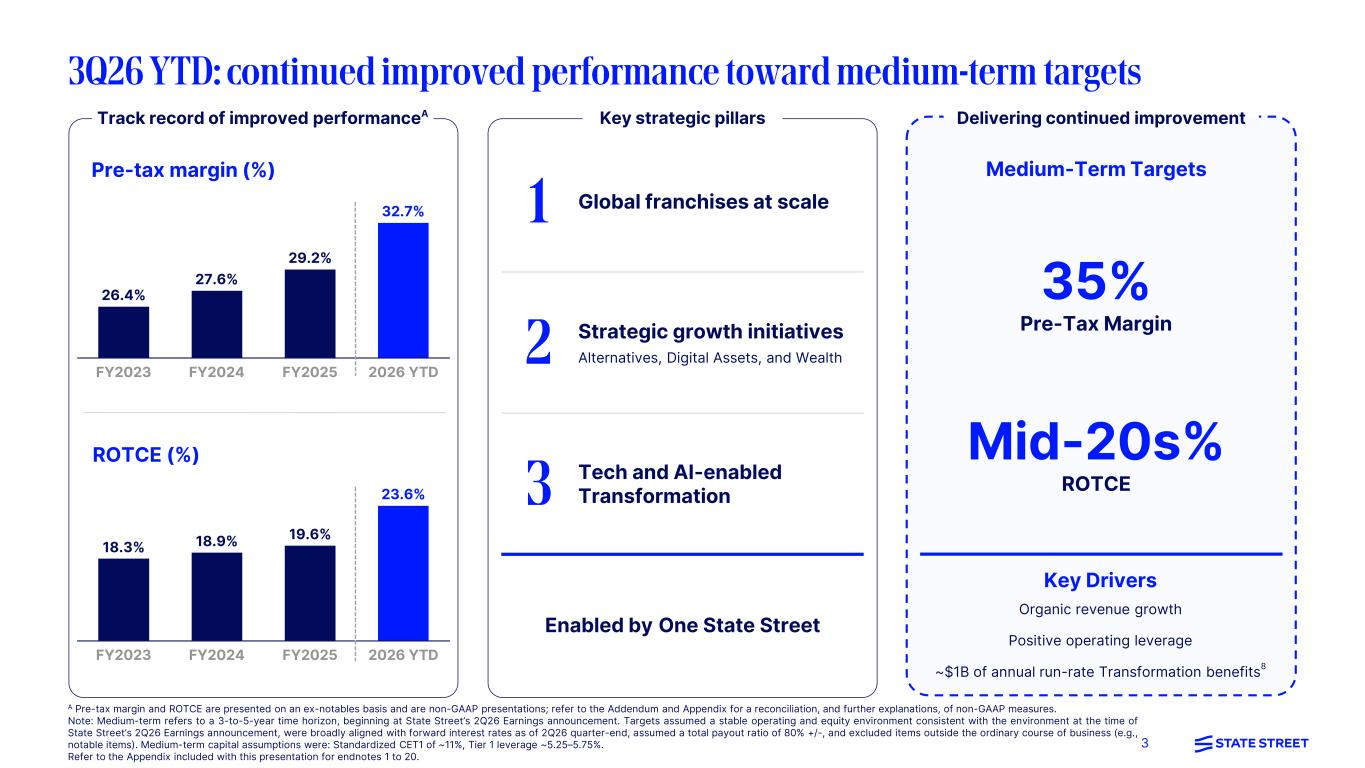
3 Pre-tax margin (%) ROTCE (%) FY2023 FY2024 FY2025 2026 YTD 26.4% 27.6% 29.2% 32.7% FY2023 FY2024 FY2025 2026 YTD 18.3% 18.9% 19.6% 23.6% A Pre-tax margin and ROTCE are presented on an ex-notables basis and are non-GAAP presentations; refer to the Addendum and Appendix for a reconciliation, and further explanations, of non-GAAP measures. Note: Medium-term refers to a 3-to-5-year time horizon, beginning at State Street’s 2Q26 Earnings announcement. Targets assumed a stable operating and equity environment consistent with the environment at the time of State Street’s 2Q26 Earnings announcement, were broadly aligned with forward interest rates as of 2Q26 quarter-end, assumed a total payout ratio of 80% +/-, and excluded items outside the ordinary course of business (e.g., notable items). Medium-term capital assumptions were: Standardized CET1 of ~11%, Tier 1 leverage ~5.25–5.75%. Refer to the Appendix included with this presentation for endnotes 1 to 20. Global franchises at scale Strategic growth initiatives Alternatives, Digital Assets, and Wealth Tech and AI-enabled Transformation Enabled by One State Street 1 2 3 Delivering continued improvement Medium-Term Targets Key strategic pillarsTrack record of improved performanceA 3Q26 YTD: continued improved performance toward medium-term targets 35% Pre-Tax Margin Mid-20s% ROTCE Key Drivers Organic revenue growth Positive operating leverage ~$1B of annual run-rate Transformation benefits8
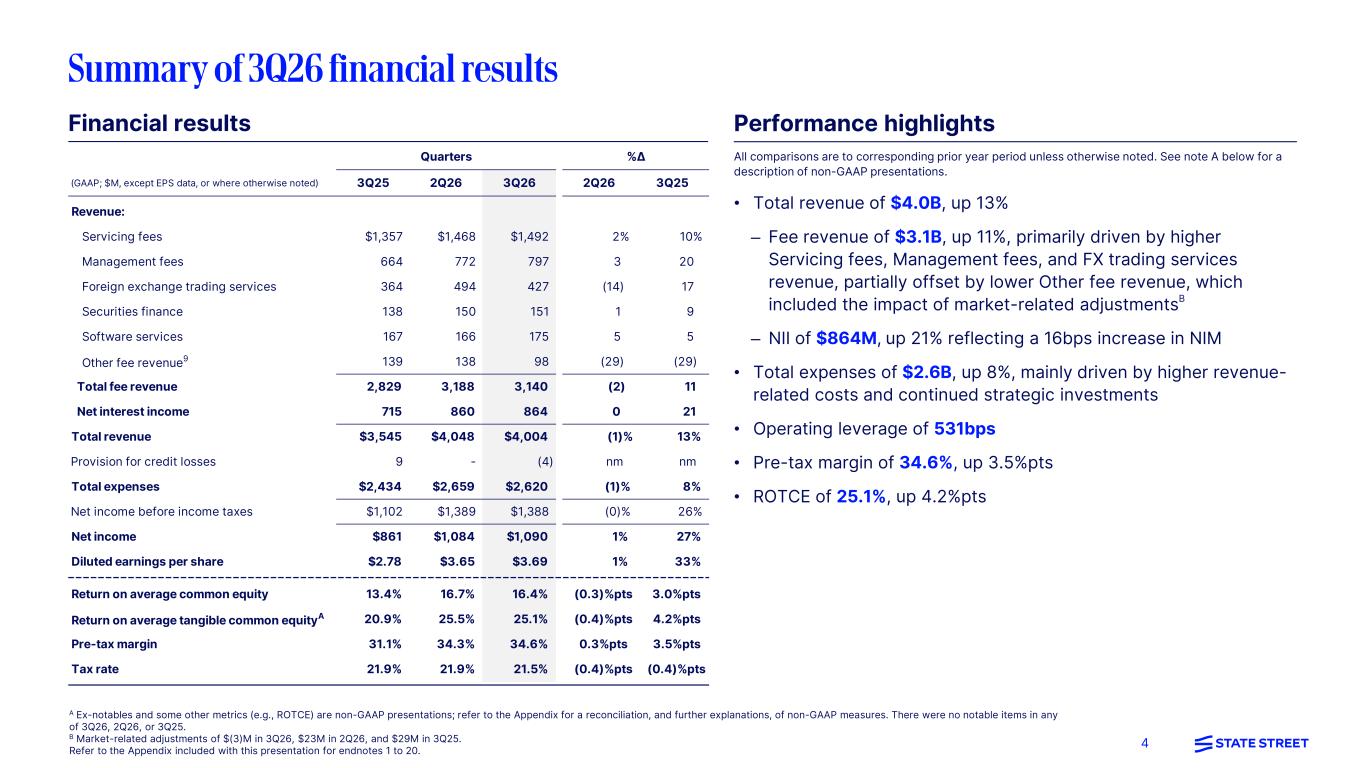
4 Summary of 3Q26 financial results • Total revenue of $4.0B, up 13% – Fee revenue of $3.1B, up 11%, primarily driven by higher Servicing fees, Management fees, and FX trading services revenue, partially offset by lower Other fee revenue, which included the impact of market-related adjustmentsB – NII of $864M, up 21% reflecting a 16bps increase in NIM • Total expenses of $2.6B, up 8%, mainly driven by higher revenue- related costs and continued strategic investments • Operating leverage of 531bps • Pre-tax margin of 34.6%, up 3.5%pts • ROTCE of 25.1%, up 4.2%pts All comparisons are to corresponding prior year period unless otherwise noted. See note A below for a description of non-GAAP presentations. Financial results Performance highlights A Ex-notables and some other metrics (e.g., ROTCE) are non-GAAP presentations; refer to the Appendix for a reconciliation, and further explanations, of non-GAAP measures. There were no notable items in any of 3Q26, 2Q26, or 3Q25. B Market-related adjustments of $(3)M in 3Q26, $23M in 2Q26, and $29M in 3Q25. Refer to the Appendix included with this presentation for endnotes 1 to 20. (GAAP; $M, except EPS data, or where otherwise noted) 3Q25 2Q26 3Q26 2Q26 3Q25 Revenue: Servicing fees $1,357 $1,468 $1,492 2% 10% Management fees 664 772 797 3 20 Foreign exchange trading services 364 494 427 (14) 17 Securities finance 138 150 151 1 9 Software services 167 166 175 5 5 Other fee revenue9 139 138 98 (29) (29) Total fee revenue 2,829 3,188 3,140 (2) 11 Net interest income 715 860 864 0 21 Total revenue $3,545 $4,048 $4,004 (1)% 13% Provision for credit losses 9 - (4) nm nm Total expenses $2,434 $2,659 $2,620 (1)% 8% Net income before income taxes $1,102 $1,389 $1,388 (0)% 26% Net income $861 $1,084 $1,090 1% 27% Diluted earnings per share $2.78 $3.65 $3.69 1% 33% Return on average common equity 13.4% 16.7% 16.4% (0.3)%pts 3.0%pts Return on average tangible common equityA 20.9% 25.5% 25.1% (0.4)%pts 4.2%pts Pre-tax margin 31.1% 34.3% 34.6% 0.3%pts 3.5%pts Tax rate 21.9% 21.9% 21.5% (0.4)%pts (0.4)%pts Quarters %∆
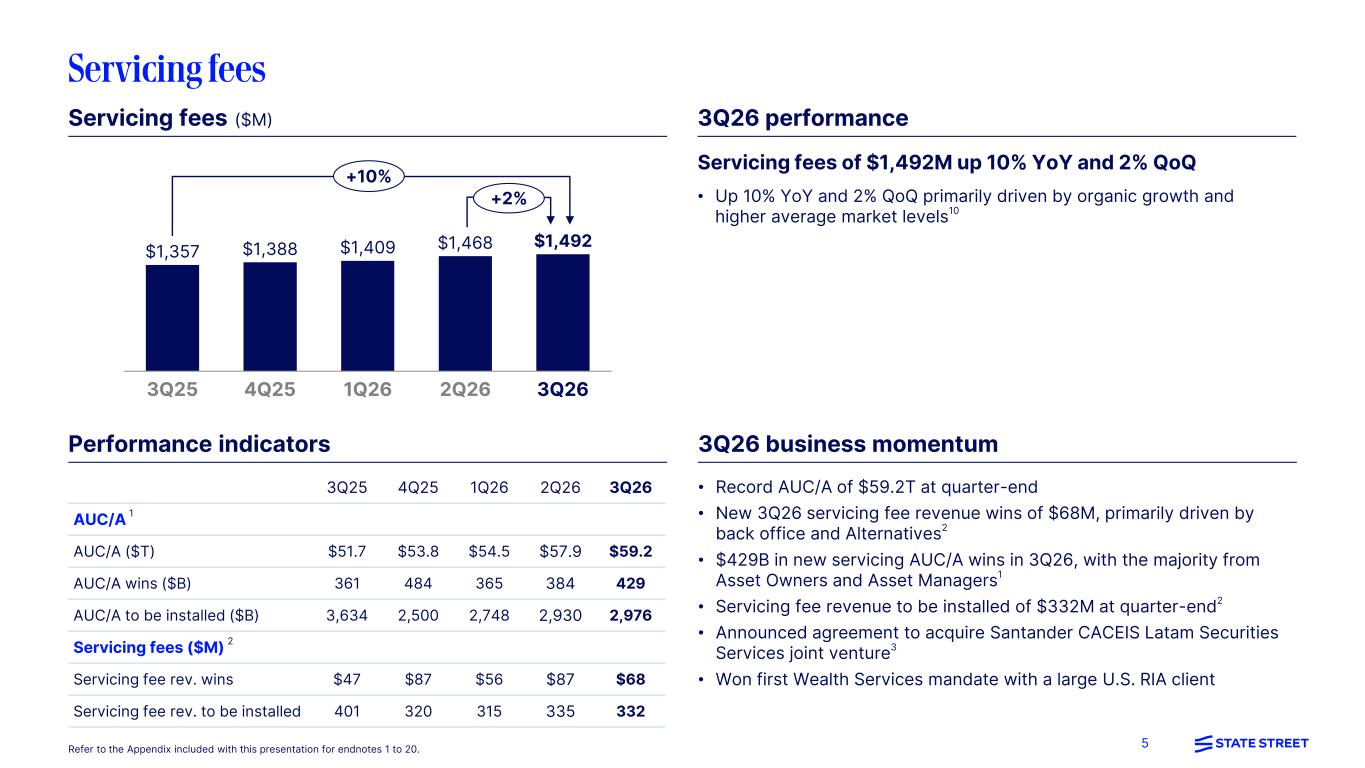
5 Servicing fees Refer to the Appendix included with this presentation for endnotes 1 to 20. 3Q25 4Q25 1Q26 3Q26 $1,357 $1,388 $1,409 $1,492 2Q26 $1,468 +10% +2% 3Q25 4Q25 1Q26 2Q26 3Q26 AUC/A 1 AUC/A ($T) $51.7 $53.8 $54.5 $57.9 $59.2 AUC/A wins ($B) 361 484 365 384 429 AUC/A to be installed ($B) 3,634 2,500 2,748 2,930 2,976 Servicing fees ($M) 2 Servicing fee rev. wins $47 $87 $56 $87 $68 Servicing fee rev. to be installed 401 320 315 335 332 Servicing fees of $1,492M up 10% YoY and 2% QoQ • Up 10% YoY and 2% QoQ primarily driven by organic growth and higher average market levels10 • Record AUC/A of $59.2T at quarter-end • New 3Q26 servicing fee revenue wins of $68M, primarily driven by back office and Alternatives2 • $429B in new servicing AUC/A wins in 3Q26, with the majority from Asset Owners and Asset Managers1 • Servicing fee revenue to be installed of $332M at quarter-end2 • Announced agreement to acquire Santander CACEIS Latam Securities Services joint venture3 • Won first Wealth Services mandate with a large U.S. RIA client Performance indicators 3Q26 business momentum 3Q26 performanceServicing fees ($M)
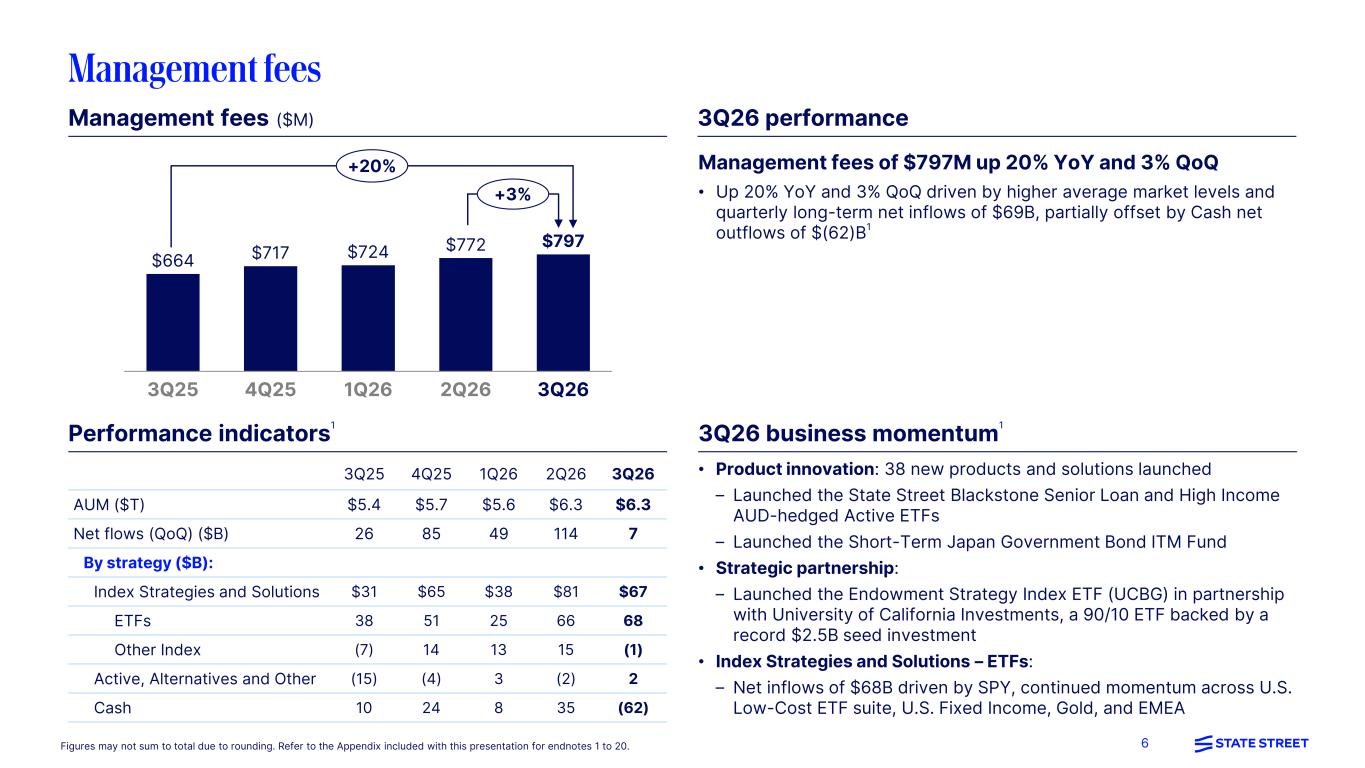
6 Management fees Management fees of $797M up 20% YoY and 3% QoQ • Up 20% YoY and 3% QoQ driven by higher average market levels and quarterly long-term net inflows of $69B, partially offset by Cash net outflows of $(62)B1 3Q25 4Q25 1Q26 3Q26 $664 $717 $724 $797 2Q26 $772 +3% +20% 3Q25 4Q25 1Q26 2Q26 3Q26 AUM ($T) $5.4 $5.7 $5.6 $6.3 $6.3 Net flows (QoQ) ($B) 26 85 49 114 7 By strategy ($B): Index Strategies and Solutions $31 $65 $38 $81 $67 ETFs 38 51 25 66 68 Other Index (7) 14 13 15 (1) Active, Alternatives and Other (15) (4) 3 (2) 2 Cash 10 24 8 35 (62) • Product innovation: 38 new products and solutions launched – Launched the State Street Blackstone Senior Loan and High Income AUD-hedged Active ETFs – Launched the Short-Term Japan Government Bond ITM Fund • Strategic partnership: – Launched the Endowment Strategy Index ETF (UCBG) in partnership with University of California Investments, a 90/10 ETF backed by a record $2.5B seed investment • Index Strategies and Solutions – ETFs: – Net inflows of $68B driven by SPY, continued momentum across U.S. Low-Cost ETF suite, U.S. Fixed Income, Gold, and EMEA Management fees ($M) 3Q26 performance Performance indicators1 3Q26 business momentum1 Figures may not sum to total due to rounding. Refer to the Appendix included with this presentation for endnotes 1 to 20.
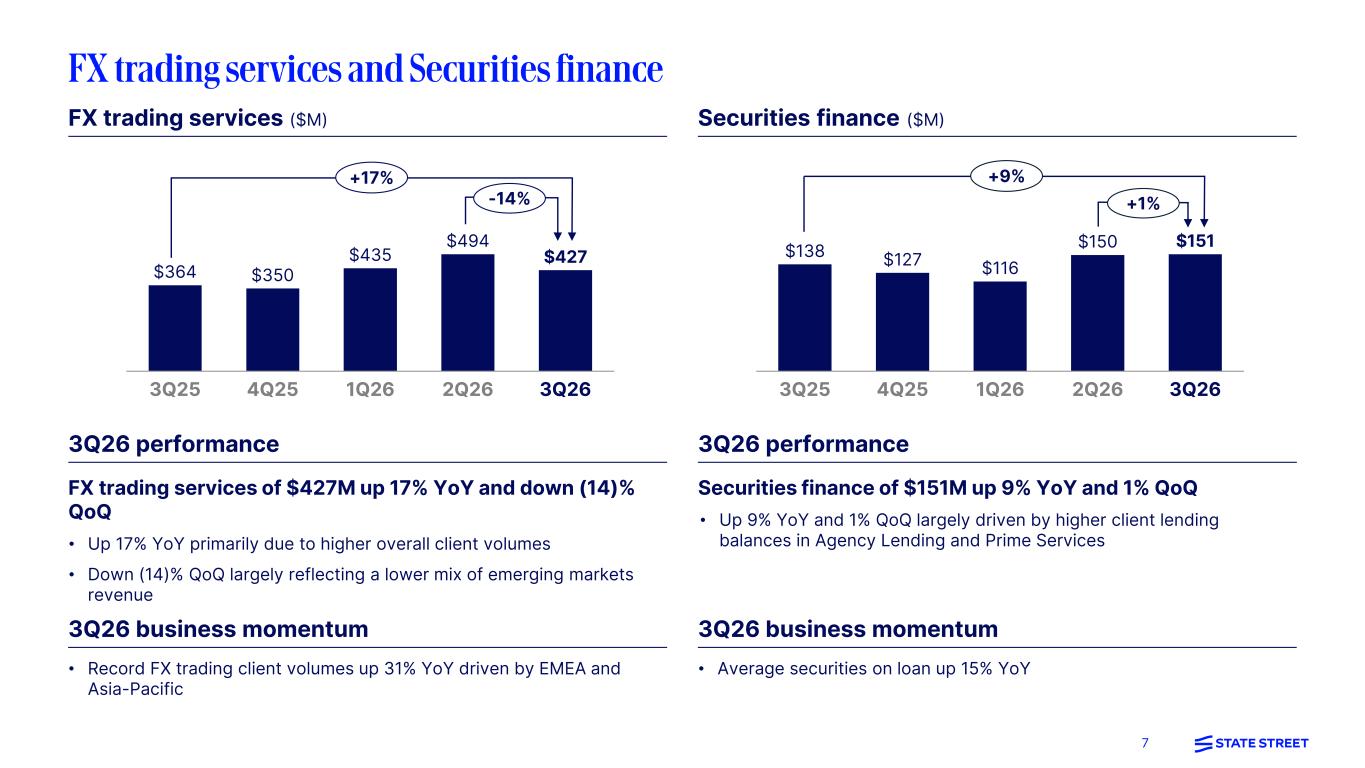
7 FX trading services and Securities finance 3Q25 4Q25 1Q26 2Q26 3Q26 $364 $350 $435 $494 $427 +17% -14% 3Q25 4Q25 1Q26 2Q26 3Q26 $138 $127 $116 $151$150 FX trading services ($M) Securities finance ($M) +9% +1% Securities finance of $151M up 9% YoY and 1% QoQ • Up 9% YoY and 1% QoQ largely driven by higher client lending balances in Agency Lending and Prime Services 3Q26 performance3Q26 performance FX trading services of $427M up 17% YoY and down (14)% QoQ • Up 17% YoY primarily due to higher overall client volumes • Down (14)% QoQ largely reflecting a lower mix of emerging markets revenue 3Q26 business momentum3Q26 business momentum • Record FX trading client volumes up 31% YoY driven by EMEA and Asia-Pacific • Average securities on loan up 15% YoY
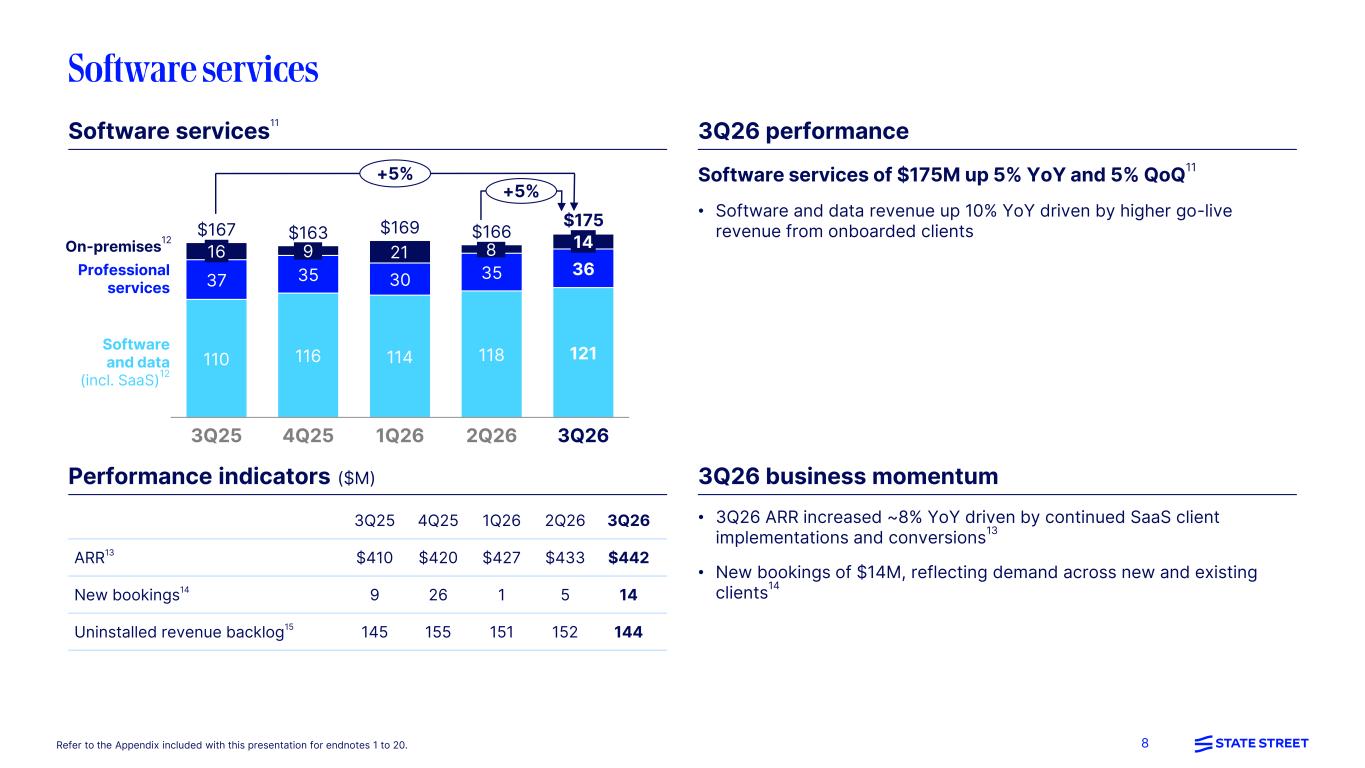
8 3Q25 4Q25 1Q26 2Q26 3Q26 ARR13 $410 $420 $427 $433 $442 New bookings14 9 26 1 5 14 Uninstalled revenue backlog15 145 155 151 152 144 Software services • 3Q26 ARR increased ~8% YoY driven by continued SaaS client implementations and conversions13 • New bookings of $14M, reflecting demand across new and existing clients14 Professional services Software and data (incl. SaaS)12 On-premises12 +5% 110 116 114 118 121 37 35 30 35 36 16 3Q25 4Q25 1Q26 2Q26 14 3Q26 $167 $163 $169 $166 $175 Software services of $175M up 5% YoY and 5% QoQ11 • Software and data revenue up 10% YoY driven by higher go-live revenue from onboarded clients 21 Software services11 3Q26 performance Performance indicators ($M) 3Q26 business momentum Refer to the Appendix included with this presentation for endnotes 1 to 20. +5% 89
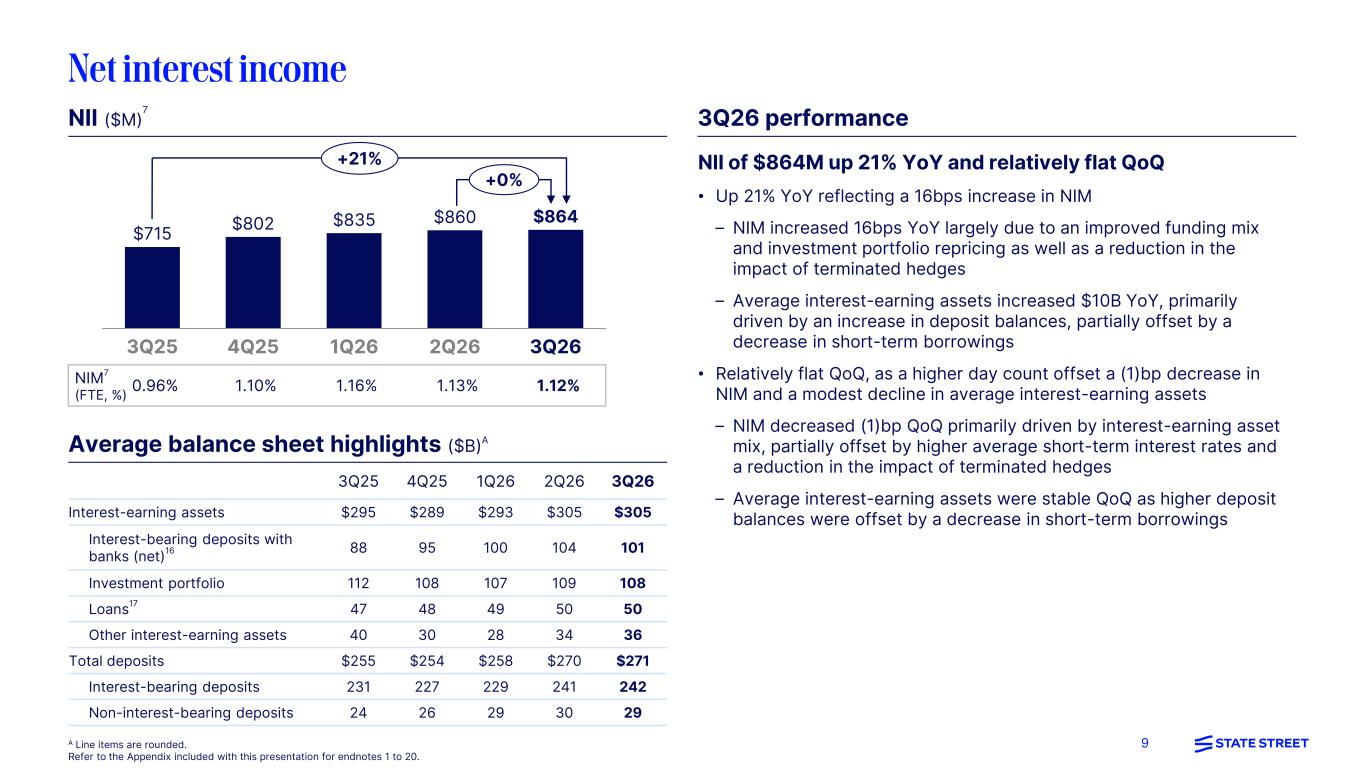
9 Net interest income A Line items are rounded. Refer to the Appendix included with this presentation for endnotes 1 to 20. NII of $864M up 21% YoY and relatively flat QoQ • Up 21% YoY reflecting a 16bps increase in NIM – NIM increased 16bps YoY largely due to an improved funding mix and investment portfolio repricing as well as a reduction in the impact of terminated hedges – Average interest-earning assets increased $10B YoY, primarily driven by an increase in deposit balances, partially offset by a decrease in short-term borrowings • Relatively flat QoQ, as a higher day count offset a (1)bp decrease in NIM and a modest decline in average interest-earning assets – NIM decreased (1)bp QoQ primarily driven by interest-earning asset mix, partially offset by higher average short-term interest rates and a reduction in the impact of terminated hedges – Average interest-earning assets were stable QoQ as higher deposit balances were offset by a decrease in short-term borrowings 3Q25 4Q25 1Q26 2Q26 3Q26 Interest-earning assets $295 $289 $293 $305 $305 Interest-bearing deposits with banks (net)16 88 95 100 104 101 Investment portfolio 112 108 107 109 108 Loans17 47 48 49 50 50 Other interest-earning assets 40 30 28 34 36 Total deposits $255 $254 $258 $270 $271 Interest-bearing deposits 231 227 229 241 242 Non-interest-bearing deposits 24 26 29 30 29 NIM7 (FTE, %) 0.96% 1.10% 1.16% 1.13% 1.12% 3Q25 4Q25 1Q26 3Q26 $715 $802 $835 $864 2Q26 $860 +0% +21% NII ($M) 7 Average balance sheet highlights ($B)A 3Q26 performance
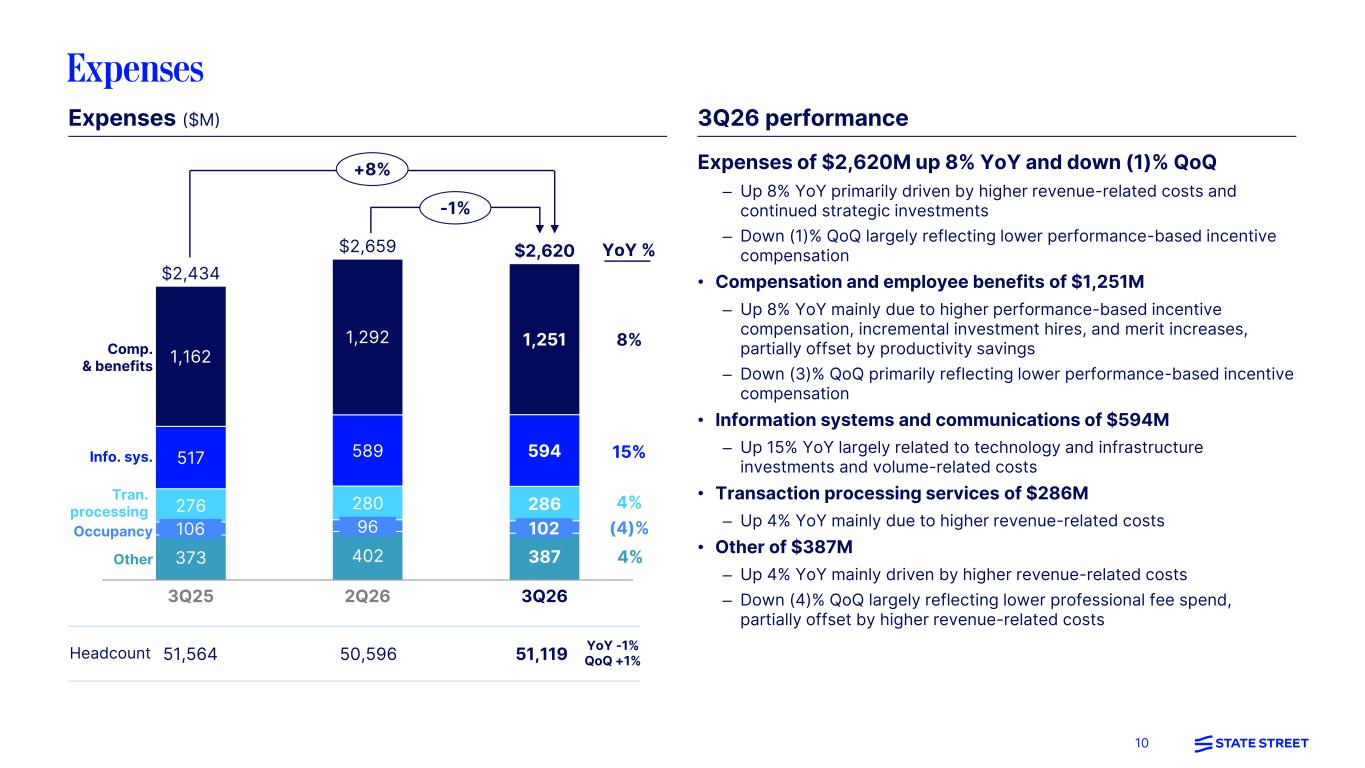
10 Expenses of $2,620M up 8% YoY and down (1)% QoQ – Up 8% YoY primarily driven by higher revenue-related costs and continued strategic investments – Down (1)% QoQ largely reflecting lower performance-based incentive compensation • Compensation and employee benefits of $1,251M – Up 8% YoY mainly due to higher performance-based incentive compensation, incremental investment hires, and merit increases, partially offset by productivity savings – Down (3)% QoQ primarily reflecting lower performance-based incentive compensation • Information systems and communications of $594M – Up 15% YoY largely related to technology and infrastructure investments and volume-related costs • Transaction processing services of $286M – Up 4% YoY mainly due to higher revenue-related costs • Other of $387M – Up 4% YoY mainly driven by higher revenue-related costs – Down (4)% QoQ largely reflecting lower professional fee spend, partially offset by higher revenue-related costs Expenses 373 402 387 276 280 286 517 589 594 1,162 1,292 1,251 3Q25 2Q26 3Q26 $2,434 $2,659 $2,620 Comp. & benefits Info. sys. Tran. processing Other Occupancy +8% -1% 8% 15% 4% YoY % (4)% 4% 51,564 50,596 51,119Headcount YoY -1% QoQ +1% 106 96 102 Expenses ($M) 3Q26 performance
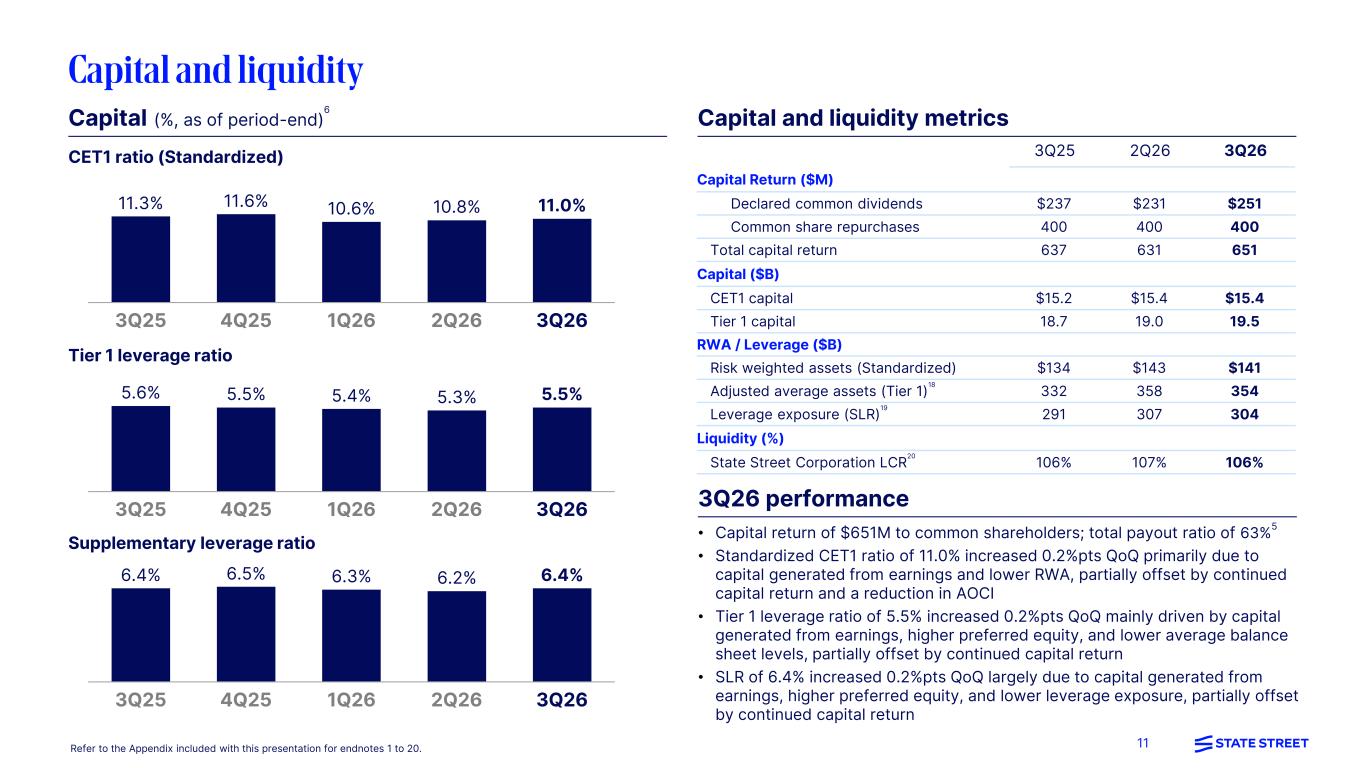
11 Capital and liquidity • Capital return of $651M to common shareholders; total payout ratio of 63%5 • Standardized CET1 ratio of 11.0% increased 0.2%pts QoQ primarily due to capital generated from earnings and lower RWA, partially offset by continued capital return and a reduction in AOCI • Tier 1 leverage ratio of 5.5% increased 0.2%pts QoQ mainly driven by capital generated from earnings, higher preferred equity, and lower average balance sheet levels, partially offset by continued capital return • SLR of 6.4% increased 0.2%pts QoQ largely due to capital generated from earnings, higher preferred equity, and lower leverage exposure, partially offset by continued capital return 3Q25 2Q26 3Q26 Capital Return ($M) Declared common dividends $237 $231 $251 Common share repurchases 400 400 400 Total capital return 637 631 651 Capital ($B) CET1 capital $15.2 $15.4 $15.4 Tier 1 capital 18.7 19.0 19.5 RWA / Leverage ($B) Risk weighted assets (Standardized) $134 $143 $141 Adjusted average assets (Tier 1) 18 332 358 354 Leverage exposure (SLR) 19 291 307 304 Liquidity (%) State Street Corporation LCR 20 106% 107% 106% Capital and liquidity metrics 3Q26 performance CET1 ratio (Standardized) Capital (%, as of period-end) 6 Tier 1 leverage ratio Supplementary leverage ratio Refer to the Appendix included with this presentation for endnotes 1 to 20. 5.6% 5.5% 5.4% 5.3% 5.5% 3Q25 4Q25 1Q26 2Q26 3Q26 6.4% 6.5% 6.3% 6.2% 6.4% 3Q25 4Q25 1Q26 2Q26 3Q26 11.3% 11.6% 10.6% 10.8% 11.0% 3Q25 4Q25 1Q26 2Q26 3Q26
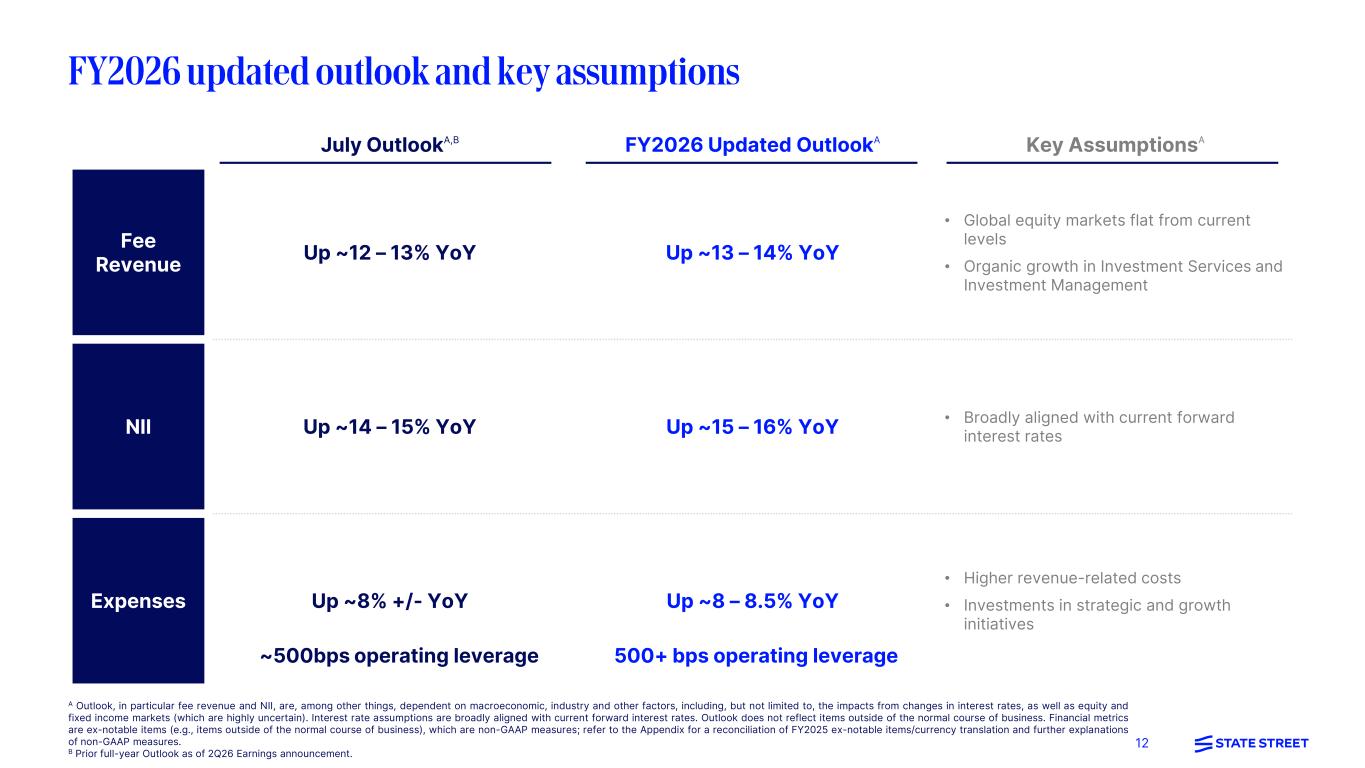
12 A Outlook, in particular fee revenue and NII, are, among other things, dependent on macroeconomic, industry and other factors, including, but not limited to, the impacts from changes in interest rates, as well as equity and fixed income markets (which are highly uncertain). Interest rate assumptions are broadly aligned with current forward interest rates. Outlook does not reflect items outside of the normal course of business. Financial metrics are ex-notable items (e.g., items outside of the normal course of business), which are non-GAAP measures; refer to the Appendix for a reconciliation of FY2025 ex-notable items/currency translation and further explanations of non-GAAP measures. B Prior full-year Outlook as of 2Q26 Earnings announcement. FY2026 updated outlook and key assumptions July OutlookA,B FY2026 Updated OutlookA Key AssumptionsA Fee Revenue Up ~12 – 13% YoY Up ~13 – 14% YoY • Global equity markets flat from current levels • Organic growth in Investment Services and Investment Management NII Up ~14 – 15% YoY Up ~15 – 16% YoY • Broadly aligned with current forward interest rates Expenses Up ~8% +/- YoY Up ~8 – 8.5% YoY • Higher revenue-related costs • Investments in strategic and growth initiatives ~500bps operating leverage 500+ bps operating leverage

13
14 Appendix Reconciliation of notable items 15 Reconciliation of constant currency impacts 16 Endnotes & other information 17 Forward-looking statements 19 Non-GAAP measures 20 Definitions 21
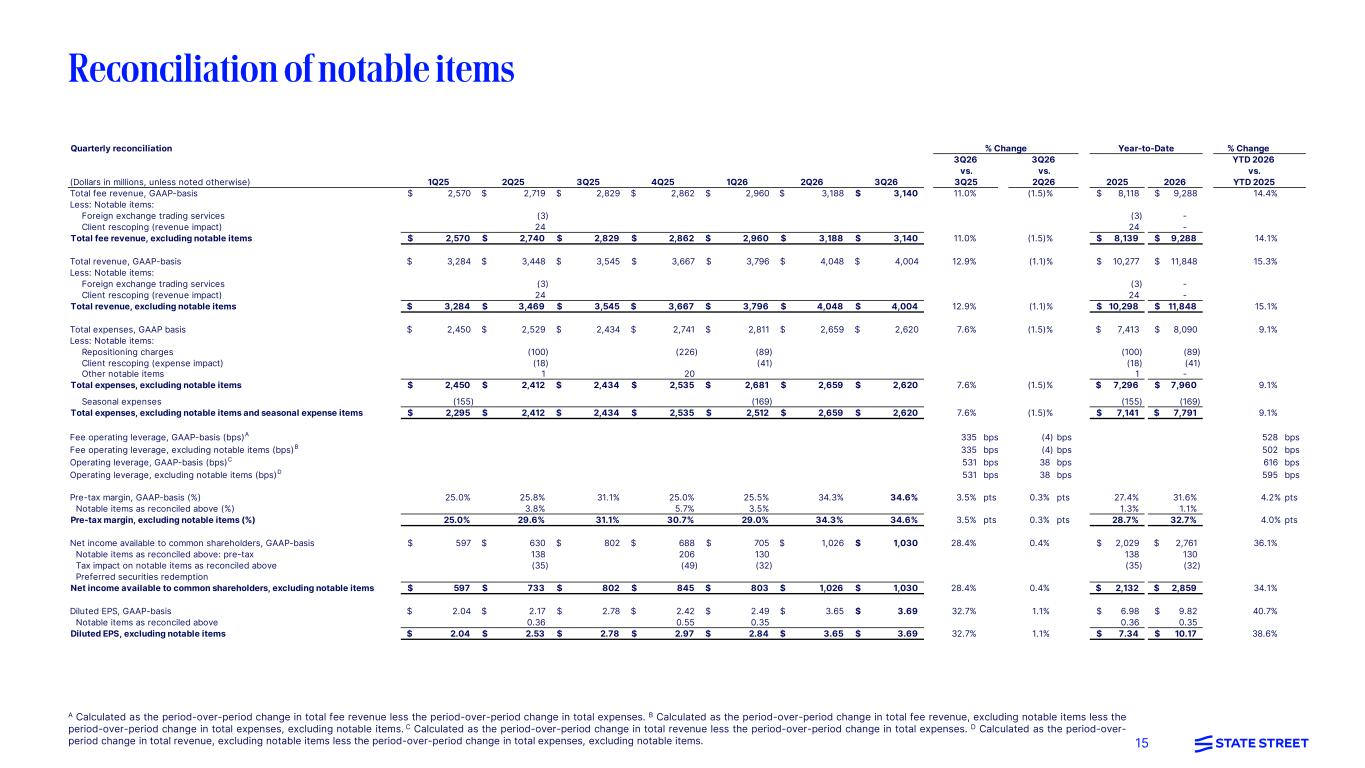
15 Quarterly reconciliation % Change (Dollars in millions, unless noted otherwise) 1Q25 2Q25 3Q25 4Q25 1Q26 2Q26 3Q26 2025 2026 YTD 2026 vs. YTD 2025 Total fee revenue, GAAP-basis 2,570$ 2,719$ 2,829$ 2,862$ 2,960$ 3,188$ 3,140$ 11.0% (1.5)% 8,118$ 9,288$ 14.4% Less: Notable items: Foreign exchange trading services (3) (3) - Client rescoping (revenue impact) 24 24 - Total fee revenue, excluding notable items 2,570$ 2,740$ 2,829$ 2,862$ 2,960$ 3,188$ 3,140$ 11.0% (1.5)% 8,139$ 9,288$ 14.1% Total revenue, GAAP-basis 3,284$ 3,448$ 3,545$ 3,667$ 3,796$ 4,048$ 4,004$ 12.9% (1.1)% 10,277$ 11,848$ 15.3% Less: Notable items: Foreign exchange trading services (3) (3) - Client rescoping (revenue impact) 24 24 - Total revenue, excluding notable items 3,284$ 3,469$ 3,545$ 3,667$ 3,796$ 4,048$ 4,004$ 12.9% (1.1)% 10,298$ 11,848$ 15.1% Total expenses, GAAP basis 2,450$ 2,529$ 2,434$ 2,741$ 2,811$ 2,659$ 2,620$ 7.6% (1.5)% 7,413$ 8,090$ 9.1% Less: Notable items: Repositioning charges (100) (226) (89) (100) (89) Client rescoping (expense impact) (18) (41) (18) (41) Other notable items 1 20 1 - Total expenses, excluding notable items 2,450$ 2,412$ 2,434$ 2,535$ 2,681$ 2,659$ 2,620$ 7.6% (1.5)% 7,296$ 7,960$ 9.1% Seasonal expenses (155) (169) (155) (169) Total expenses, excluding notable items and seasonal expense items 2,295$ 2,412$ 2,434$ 2,535$ 2,512$ 2,659$ 2,620$ 7.6% (1.5)% 7,141$ 7,791$ 9.1% Fee operating leverage, GAAP-basis (bps)A 335 bps (4) bps 528 bps Fee operating leverage, excluding notable items (bps)B 335 bps (4) bps 502 bps Operating leverage, GAAP-basis (bps)C 531 bps 38 bps 616 bps Operating leverage, excluding notable items (bps)D 531 bps 38 bps 595 bps Pre-tax margin, GAAP-basis (%) 25.0% 25.8% 31.1% 25.0% 25.5% 34.3% 34.6% 3.5% pts 0.3% pts 27.4% 31.6% 4.2% pts Notable items as reconciled above (%) 3.8% 5.7% 3.5% 1.3% 1.1% Pre-tax margin, excluding notable items (%) 25.0% 29.6% 31.1% 30.7% 29.0% 34.3% 34.6% 3.5% pts 0.3% pts 28.7% 32.7% 4.0% pts Net income available to common shareholders, GAAP-basis 597$ 630$ 802$ 688$ 705$ 1,026$ 1,030$ 28.4% 0.4% 2,029$ 2,761$ 36.1% Notable items as reconciled above: pre-tax 138 206 130 138 130 Tax impact on notable items as reconciled above (35) (49) (32) (35) (32) Preferred securities redemption Net income available to common shareholders, excluding notable items 597$ 733$ 802$ 845$ 803$ 1,026$ 1,030$ 28.4% 0.4% 2,132$ 2,859$ 34.1% Diluted EPS, GAAP-basis 2.04$ 2.17$ 2.78$ 2.42$ 2.49$ 3.65$ 3.69$ 32.7% 1.1% 6.98$ 9.82$ 40.7% Notable items as reconciled above 0.36 0.55 0.35 0.36 0.35 Diluted EPS, excluding notable items 2.04$ 2.53$ 2.78$ 2.97$ 2.84$ 3.65$ 3.69$ 32.7% 1.1% 7.34$ 10.17$ 38.6% Year-to-Date 3Q26 vs. 3Q25 3Q26 vs. 2Q26 % Change Reconciliation of notable items A Calculated as the period-over-period change in total fee revenue less the period-over-period change in total expenses. B Calculated as the period-over-period change in total fee revenue, excluding notable items less the period-over-period change in total expenses, excluding notable items. C Calculated as the period-over-period change in total revenue less the period-over-period change in total expenses. D Calculated as the period-over- period change in total revenue, excluding notable items less the period-over-period change in total expenses, excluding notable items.
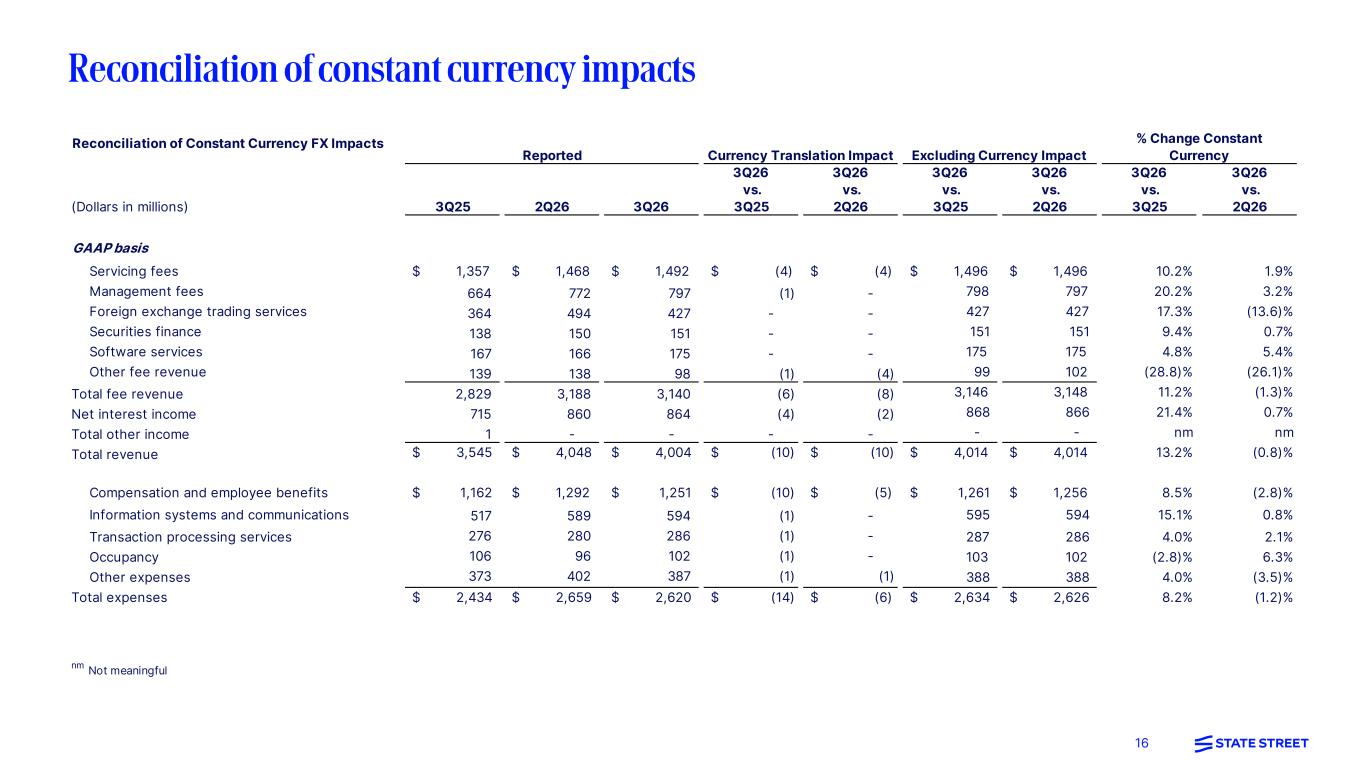
16 Reconciliation of constant currency impacts Reconciliation of Constant Currency FX Impacts (Dollars in millions) 3Q25 2Q26 3Q26 3Q26 vs. 3Q25 3Q26 vs. 2Q26 3Q26 vs. 3Q25 3Q26 vs. 2Q26 3Q26 vs. 3Q25 3Q26 vs. 2Q26 GAAP basis Servicing fees $ 1,357 $ 1,468 $ 1,492 $ (4) $ (4) $ 1,496 $ 1,496 10.2% 1.9% Management fees 664 772 797 (1) - 798 797 20.2% 3.2% Foreign exchange trading services 364 494 427 - - 427 427 17.3% (13.6)% Securities finance 138 150 151 - - 151 151 9.4% 0.7% Software services 167 166 175 - - 175 175 4.8% 5.4% Other fee revenue 139 138 98 (1) (4) 99 102 (28.8)% (26.1)% Total fee revenue 2,829 3,188 3,140 (6) (8) 3,146 3,148 11.2% (1.3)% Net interest income 715 860 864 (4) (2) 868 866 21.4% 0.7% Total other income 1 - - - - - - nm nm Total revenue $ 3,545 $ 4,048 $ 4,004 $ (10) $ (10) $ 4,014 $ 4,014 13.2% (0.8)% Compensation and employee benefits $ 1,162 $ 1,292 $ 1,251 $ (10) $ (5) $ 1,261 $ 1,256 8.5% (2.8)% Information systems and communications 517 589 594 (1) - 595 594 15.1% 0.8% Transaction processing services 276 280 286 (1) - 287 286 4.0% 2.1% Occupancy 106 96 102 (1) - 103 102 (2.8)% 6.3% Other expenses 373 402 387 (1) (1) 388 388 4.0% (3.5)% Total expenses $ 2,434 $ 2,659 $ 2,620 $ (14) $ (6) $ 2,634 $ 2,626 8.2% (1.2)% nm Not meaningful Reported Currency Translation Impact Excluding Currency Impact % Change Constant Currency
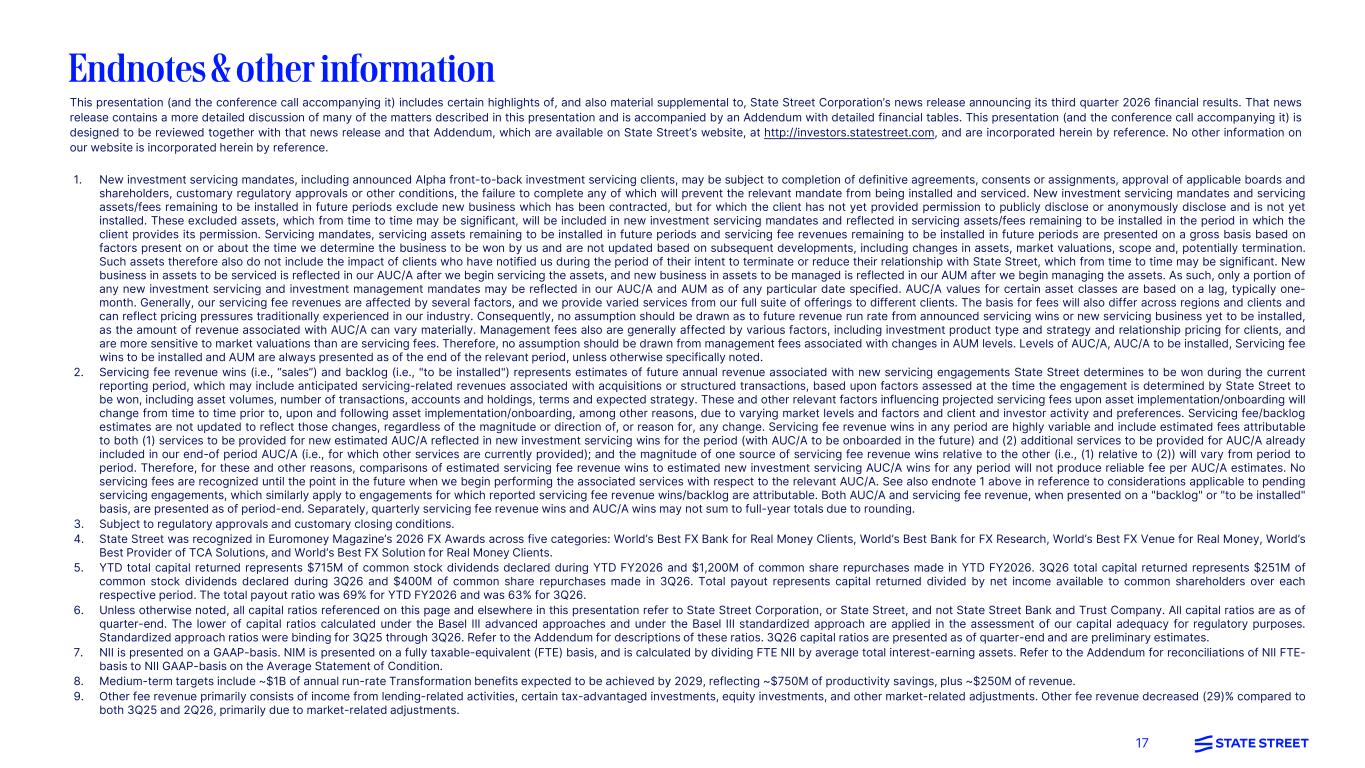
17 Endnotes & other information This presentation (and the conference call accompanying it) includes certain highlights of, and also material supplemental to, State Street Corporation’s news release announcing its third quarter 2026 financial results. That news release contains a more detailed discussion of many of the matters described in this presentation and is accompanied by an Addendum with detailed financial tables. This presentation (and the conference call accompanying it) is designed to be reviewed together with that news release and that Addendum, which are available on State Street’s website, at http://investors.statestreet.com, and are incorporated herein by reference. No other information on our website is incorporated herein by reference. 1. New investment servicing mandates, including announced Alpha front-to-back investment servicing clients, may be subject to completion of definitive agreements, consents or assignments, approval of applicable boards and shareholders, customary regulatory approvals or other conditions, the failure to complete any of which will prevent the relevant mandate from being installed and serviced. New investment servicing mandates and servicing assets/fees remaining to be installed in future periods exclude new business which has been contracted, but for which the client has not yet provided permission to publicly disclose or anonymously disclose and is not yet installed. These excluded assets, which from time to time may be significant, will be included in new investment servicing mandates and reflected in servicing assets/fees remaining to be installed in the period in which the client provides its permission. Servicing mandates, servicing assets remaining to be installed in future periods and servicing fee revenues remaining to be installed in future periods are presented on a gross basis based on factors present on or about the time we determine the business to be won by us and are not updated based on subsequent developments, including changes in assets, market valuations, scope and, potentially termination. Such assets therefore also do not include the impact of clients who have notified us during the period of their intent to terminate or reduce their relationship with State Street, which from time to time may be significant. New business in assets to be serviced is reflected in our AUC/A after we begin servicing the assets, and new business in assets to be managed is reflected in our AUM after we begin managing the assets. As such, only a portion of any new investment servicing and investment management mandates may be reflected in our AUC/A and AUM as of any particular date specified. AUC/A values for certain asset classes are based on a lag, typically one- month. Generally, our servicing fee revenues are affected by several factors, and we provide varied services from our full suite of offerings to different clients. The basis for fees will also differ across regions and clients and can reflect pricing pressures traditionally experienced in our industry. Consequently, no assumption should be drawn as to future revenue run rate from announced servicing wins or new servicing business yet to be installed, as the amount of revenue associated with AUC/A can vary materially. Management fees also are generally affected by various factors, including investment product type and strategy and relationship pricing for clients, and are more sensitive to market valuations than are servicing fees. Therefore, no assumption should be drawn from management fees associated with changes in AUM levels. Levels of AUC/A, AUC/A to be installed, Servicing fee wins to be installed and AUM are always presented as of the end of the relevant period, unless otherwise specifically noted. 2. Servicing fee revenue wins (i.e., “sales”) and backlog (i.e., "to be installed") represents estimates of future annual revenue associated with new servicing engagements State Street determines to be won during the current reporting period, which may include anticipated servicing-related revenues associated with acquisitions or structured transactions, based upon factors assessed at the time the engagement is determined by State Street to be won, including asset volumes, number of transactions, accounts and holdings, terms and expected strategy. These and other relevant factors influencing projected servicing fees upon asset implementation/onboarding will change from time to time prior to, upon and following asset implementation/onboarding, among other reasons, due to varying market levels and factors and client and investor activity and preferences. Servicing fee/backlog estimates are not updated to reflect those changes, regardless of the magnitude or direction of, or reason for, any change. Servicing fee revenue wins in any period are highly variable and include estimated fees attributable to both (1) services to be provided for new estimated AUC/A reflected in new investment servicing wins for the period (with AUC/A to be onboarded in the future) and (2) additional services to be provided for AUC/A already included in our end-of period AUC/A (i.e., for which other services are currently provided); and the magnitude of one source of servicing fee revenue wins relative to the other (i.e., (1) relative to (2)) will vary from period to period. Therefore, for these and other reasons, comparisons of estimated servicing fee revenue wins to estimated new investment servicing AUC/A wins for any period will not produce reliable fee per AUC/A estimates. No servicing fees are recognized until the point in the future when we begin performing the associated services with respect to the relevant AUC/A. See also endnote 1 above in reference to considerations applicable to pending servicing engagements, which similarly apply to engagements for which reported servicing fee revenue wins/backlog are attributable. Both AUC/A and servicing fee revenue, when presented on a "backlog" or "to be installed" basis, are presented as of period-end. Separately, quarterly servicing fee revenue wins and AUC/A wins may not sum to full-year totals due to rounding. 3. Subject to regulatory approvals and customary closing conditions. 4. State Street was recognized in Euromoney Magazine’s 2026 FX Awards across five categories: World’s Best FX Bank for Real Money Clients, World’s Best Bank for FX Research, World’s Best FX Venue for Real Money, World’s Best Provider of TCA Solutions, and World’s Best FX Solution for Real Money Clients. 5. YTD total capital returned represents $715M of common stock dividends declared during YTD FY2026 and $1,200M of common share repurchases made in YTD FY2026. 3Q26 total capital returned represents $251M of common stock dividends declared during 3Q26 and $400M of common share repurchases made in 3Q26. Total payout represents capital returned divided by net income available to common shareholders over each respective period. The total payout ratio was 69% for YTD FY2026 and was 63% for 3Q26. 6. Unless otherwise noted, all capital ratios referenced on this page and elsewhere in this presentation refer to State Street Corporation, or State Street, and not State Street Bank and Trust Company. All capital ratios are as of quarter-end. The lower of capital ratios calculated under the Basel III advanced approaches and under the Basel III standardized approach are applied in the assessment of our capital adequacy for regulatory purposes. Standardized approach ratios were binding for 3Q25 through 3Q26. Refer to the Addendum for descriptions of these ratios. 3Q26 capital ratios are presented as of quarter-end and are preliminary estimates. 7. NII is presented on a GAAP-basis. NIM is presented on a fully taxable-equivalent (FTE) basis, and is calculated by dividing FTE NII by average total interest-earning assets. Refer to the Addendum for reconciliations of NII FTE- basis to NII GAAP-basis on the Average Statement of Condition. 8. Medium-term targets include ~$1B of annual run-rate Transformation benefits expected to be achieved by 2029, reflecting ~$750M of productivity savings, plus ~$250M of revenue. 9. Other fee revenue primarily consists of income from lending-related activities, certain tax-advantaged investments, equity investments, and other market-related adjustments. Other fee revenue decreased (29)% compared to both 3Q25 and 2Q26, primarily due to market-related adjustments.
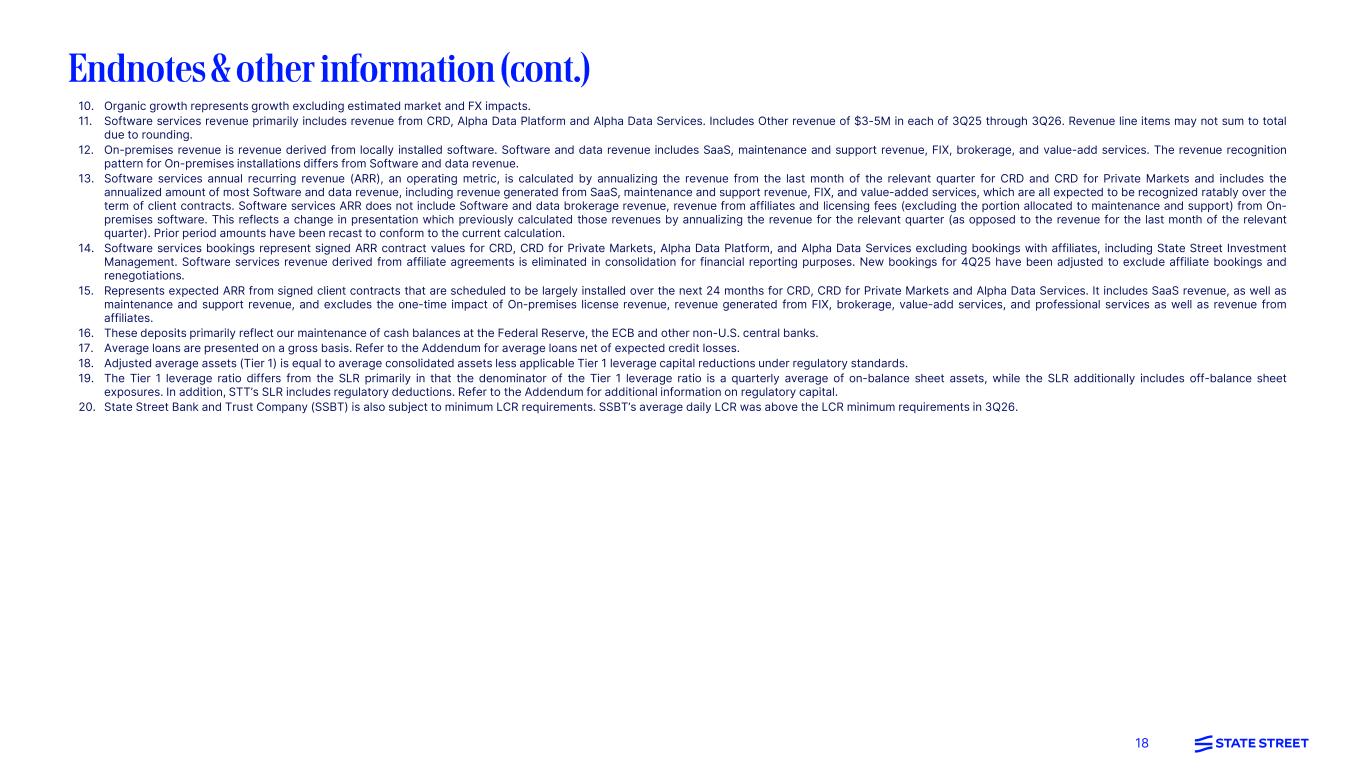
18 Endnotes & other information (cont.) 10. Organic growth represents growth excluding estimated market and FX impacts. 11. Software services revenue primarily includes revenue from CRD, Alpha Data Platform and Alpha Data Services. Includes Other revenue of $3-5M in each of 3Q25 through 3Q26. Revenue line items may not sum to total due to rounding. 12. On-premises revenue is revenue derived from locally installed software. Software and data revenue includes SaaS, maintenance and support revenue, FIX, brokerage, and value-add services. The revenue recognition pattern for On-premises installations differs from Software and data revenue. 13. Software services annual recurring revenue (ARR), an operating metric, is calculated by annualizing the revenue from the last month of the relevant quarter for CRD and CRD for Private Markets and includes the annualized amount of most Software and data revenue, including revenue generated from SaaS, maintenance and support revenue, FIX, and value-added services, which are all expected to be recognized ratably over the term of client contracts. Software services ARR does not include Software and data brokerage revenue, revenue from affiliates and licensing fees (excluding the portion allocated to maintenance and support) from On- premises software. This reflects a change in presentation which previously calculated those revenues by annualizing the revenue for the relevant quarter (as opposed to the revenue for the last month of the relevant quarter). Prior period amounts have been recast to conform to the current calculation. 14. Software services bookings represent signed ARR contract values for CRD, CRD for Private Markets, Alpha Data Platform, and Alpha Data Services excluding bookings with affiliates, including State Street Investment Management. Software services revenue derived from affiliate agreements is eliminated in consolidation for financial reporting purposes. New bookings for 4Q25 have been adjusted to exclude affiliate bookings and renegotiations. 15. Represents expected ARR from signed client contracts that are scheduled to be largely installed over the next 24 months for CRD, CRD for Private Markets and Alpha Data Services. It includes SaaS revenue, as well as maintenance and support revenue, and excludes the one-time impact of On-premises license revenue, revenue generated from FIX, brokerage, value-add services, and professional services as well as revenue from affiliates. 16. These deposits primarily reflect our maintenance of cash balances at the Federal Reserve, the ECB and other non-U.S. central banks. 17. Average loans are presented on a gross basis. Refer to the Addendum for average loans net of expected credit losses. 18. Adjusted average assets (Tier 1) is equal to average consolidated assets less applicable Tier 1 leverage capital reductions under regulatory standards. 19. The Tier 1 leverage ratio differs from the SLR primarily in that the denominator of the Tier 1 leverage ratio is a quarterly average of on-balance sheet assets, while the SLR additionally includes off-balance sheet exposures. In addition, STT’s SLR includes regulatory deductions. Refer to the Addendum for additional information on regulatory capital. 20. State Street Bank and Trust Company (SSBT) is also subject to minimum LCR requirements. SSBT’s average daily LCR was above the LCR minimum requirements in 3Q26.
19 Forward-looking statements This Presentation contains forward-looking statements within the meaning of United States securities laws, including statements about our goals and expectations regarding our strategy, growth and sales prospects, capital management, business, financial and capital condition, results of operations, the financial and market outlook and the business environment. Forward-looking statements are often, but not always, identified by such forward-looking terminology as “expect,” “will,” “medium-term,” “outlook,” “target,” “opportunity,” “strategy,” “strategic,” “driver,” “priority,” “assumption,” “illustrative,” “framework,” “forecast,” “guidance,” “objective,” “believe,” “plan," “anticipate,” “seek," “may,” “trend,” “goal,” “estimate,” “intend,” “aim,” “outcome,” “future,” “pipeline,” and “trajectory,” or similar statements or variations of such terms. These statements are not guarantees of future performance, are inherently uncertain, are based on current assumptions that are difficult to predict and involve a number of risks and uncertainties. Therefore, actual outcomes and results may differ materially from what is expressed in those statements, and those statements should not be relied upon as representing our expectations or beliefs as of any time subsequent to the time this Presentation is first issued. We are subject to intense competition, which could negatively affect our profitability; We are subject to significant pricing pressure and variability in our financial results and our AUC/A and AUM; We could be adversely affected by political, geopolitical, economic and market conditions, including, for example, as a result of liquidity or capital deficiencies (actual or perceived) by other financial institutions and related market and government actions, changes in U.S. trade or other policies or those policies of other nations, the ongoing conflicts in Ukraine and in the Middle East, major political shifts domestically or internationally (including the potential for retaliatory actions by governments, market participants or clients based on diverging perspectives or otherwise), actions taken by central banks in an attempt to address prevailing economic conditions, changes in monetary policy or periods of significant volatility in the markets for equity, fixed income and other asset classes globally or within specific markets; Our development and completion of new products and services, including State Street Alpha® and those related to wealth servicing, alternative investment management or digital assets or incorporating artificial intelligence, may impose costs on us, involve dependencies on third parties and may expose us to increased risks; Our business may be negatively affected by risks associated with strategic initiatives we are undertaking to enhance the effectiveness, including the adoption or integration of new technologies such as artificial intelligence, and efficiency of our operations and of our cybersecurity and technology infrastructure or by our failure to meet the related, resiliency or other expectations of our clients and regulators, or as a result of a cyber-attack or similar vulnerability in our or business partners' infrastructure; Our risk management framework, models and processes may not be effective in identifying or mitigating risk and reducing the potential for related losses, and a failure or circumvention of our controls and procedures, or errors or delays in our operational and transaction processing, or those of third parties, could have an adverse effect on our business, financial condition, operating results and reputation; Acquisitions, strategic alliances, joint ventures and divestitures, and the integration, retention and development of the benefits of these transactions, pose risks for our business; Competition for qualified members of our workforce is intense, and we may not be able to attract and retain the highly skilled people we need to support our business; Our investment securities portfolio, consolidated financial condition and consolidated results of operations could be adversely affected by changes in the financial markets, governmental action or monetary policy. For example, among other risks, changes in prevailing interest rates or market conditions have led, and were they to persist or occur in the future could further lead, to decreases in our NII or to portfolio management decisions resulting in reductions in our capital or liquidity ratios; Our business activities expose us to interest rate risk; We assume significant credit risk of counterparties, who may also have substantial financial dependencies on other financial institutions, and these credit exposures and concentrations could expose us to financial loss; Our fee revenue represents a significant portion of our revenue and is subject to and may decline based on, among other factors, market and currency declines, investment activities and preferences of our clients and their business mix, as well as the timing of new business onboarding; If we are unable to effectively manage our capital and liquidity, our financial condition, capital ratios, results of operations and business prospects could be adversely affected; Our return of capital to shareholders through common share repurchases and common stock dividends may be variable and is subject to various business and financial factors and regulatory requirements and approvals of our Board of Directors; We may need to raise additional capital or debt in the future, which may not be available to us or may only be available on unfavorable terms; If we experience a downgrade in our credit ratings, or an actual or perceived reduction in our financial strength, our borrowing and capital costs, liquidity and reputation could be adversely affected; Our business and capital-related activities, including common share repurchases, may be adversely affected by regulatory requirements and considerations, including capital, credit and liquidity; We face extensive and changing government regulation and supervision in the U.S. and non-U.S. jurisdictions in which we operate, which may increase our costs and compliance risks and may affect our business activities and strategies; Our businesses may be adversely affected by government enforcement and litigation; Our businesses may be adversely affected by increased and conflicting political, regulatory and client scrutiny of investment management, stewardship and sustainable investment strategies and services offered; Any misappropriation of the confidential information we possess could have an adverse impact on our business and could subject us to regulatory actions, litigation and other adverse effects; Our calculations of risk exposures, total RWA and capital ratios depend on data inputs, formulae, models, correlations and assumptions that are subject to change, which could materially impact our risk exposures, our total RWA and our capital ratios from period to period; Changes in accounting standards may adversely affect our consolidated results of operations and financial condition; Changes in tax laws, rules or regulations, challenges to our tax positions and changes in the composition of our pre-tax earnings may increase our effective tax rate; We could face liabilities for withholding and other non-income taxes, including in connection with our services to clients, as a result of tax authority examinations; Our businesses may be negatively affected by adverse publicity or other reputational harm; Shifting and maintaining operational activities to non- U.S. jurisdictions, changing our operating model, and outsourcing to, or insourcing from, third parties expose us to increased operational risk, geopolitical risk and reputational harm and may not result in expected cost savings or operational improvements; Attacks or unauthorized access to our or our business partners' or clients' information technology systems or facilities, such as cyber-attacks or other disruptions to our or their operations, including attacks leveraging advanced or new artificial intelligence models that are continuously evolving and presenting heightened risks, could result in significant costs, reputational damage and impacts on our business activities; Long-term contracts and customizing service delivery for clients expose us to increased operational risk, pricing and performance risk; We may not be able to protect our intellectual property or may infringe upon the rights of third parties; The quantitative models we use to manage our business may contain errors that could adversely impact our business, financial condition, operating results and regulatory compliance, and lapses in disclosure controls and procedures or internal control over financial reporting could occur, any of which could result in material harm; Our reputation and business prospects may be damaged if investors in the collective investment pools we sponsor or manage incur substantial losses in these investment pools or are restricted in redeeming their interests in these investment pools; The impacts of global regulatory requirements and expectations, shifting client preferences, and disclosure requirements related to climate risks and sustainability standards could adversely affect us; and We may incur losses or face negative impacts on our business as a result of unforeseen events, including terrorist attacks, geopolitical events, acute or chronic physical risk events, including natural disasters, pandemics, global conflicts, or a banking crisis, which may have a negative impact on our business and operations. Other important factors that could cause actual results to differ materially from those indicated by any forward-looking statements are set forth in our 2025 Annual Report on Form 10-K and our subsequent SEC filings. We encourage investors to read these filings, particularly the sections on risk factors, for additional information with respect to any forward-looking statements and prior to making any investment decision. The forward-looking statements contained in this Presentation should not be relied on as representing our expectations or beliefs as of any time subsequent to the time this Presentation is first issued, and we do not undertake efforts to revise those forward-looking statements to reflect events after that time.
20 Non-GAAP measures In addition to presenting State Street's financial results in conformity with U.S. generally accepted accounting principles, or GAAP, management also presents certain financial information on a basis that excludes or adjusts one or more items from GAAP. This latter basis is a non-GAAP presentation. In general, our non-GAAP financial results adjust selected GAAP-basis financial results to exclude the impact of revenue and expenses outside of State Street’s normal course of business or other notable items, such as acquisition and restructuring charges, repositioning charges, gains/losses on sales, as well as, for selected comparisons, seasonal items. For example, we sometimes present expenses on a basis we may refer to as “expenses ex-notable items", which exclude notable items and, to provide additional perspective on both prior year quarter and sequential quarter comparisons, may also exclude seasonal items. There were no notable items in any of 3Q26, 2Q26, or 3Q25. Management believes that this presentation of financial information facilitates an investor's further understanding and analysis of State Street's financial performance and trends with respect to State Street’s business operations from period-to-period, including providing additional insight into our underlying margin and profitability. In addition, Management may also provide additional non-GAAP measures. For example, we may sometimes present ratios, such as return on tangible common equity, based on an adjusted common shareholder equity metric, "tangible common equity", which reflects a reduction (net of deferred taxes) for goodwill and other intangible assets, as we believe this presentation provides additional context about our use of equity. As an additional example, we may present revenue and expense measures on a constant currency basis to identify the significance of changes in foreign currency exchange rates (which often are variable) in period-to-period comparisons. This presentation represents the effects of applying prior period weighted average foreign currency exchange rates to current period results. Non-GAAP financial measures should be considered in addition to, not as a substitute for or superior to, financial measures determined in conformity with GAAP. Refer to the “Reconciliation of notable items” in this Appendix and to the Addendum for reconciliations of our non-GAAP financial information. To access the Addendum go to http://investors.statestreet.com and click on “Filings & Reports – Quarterly Results”.
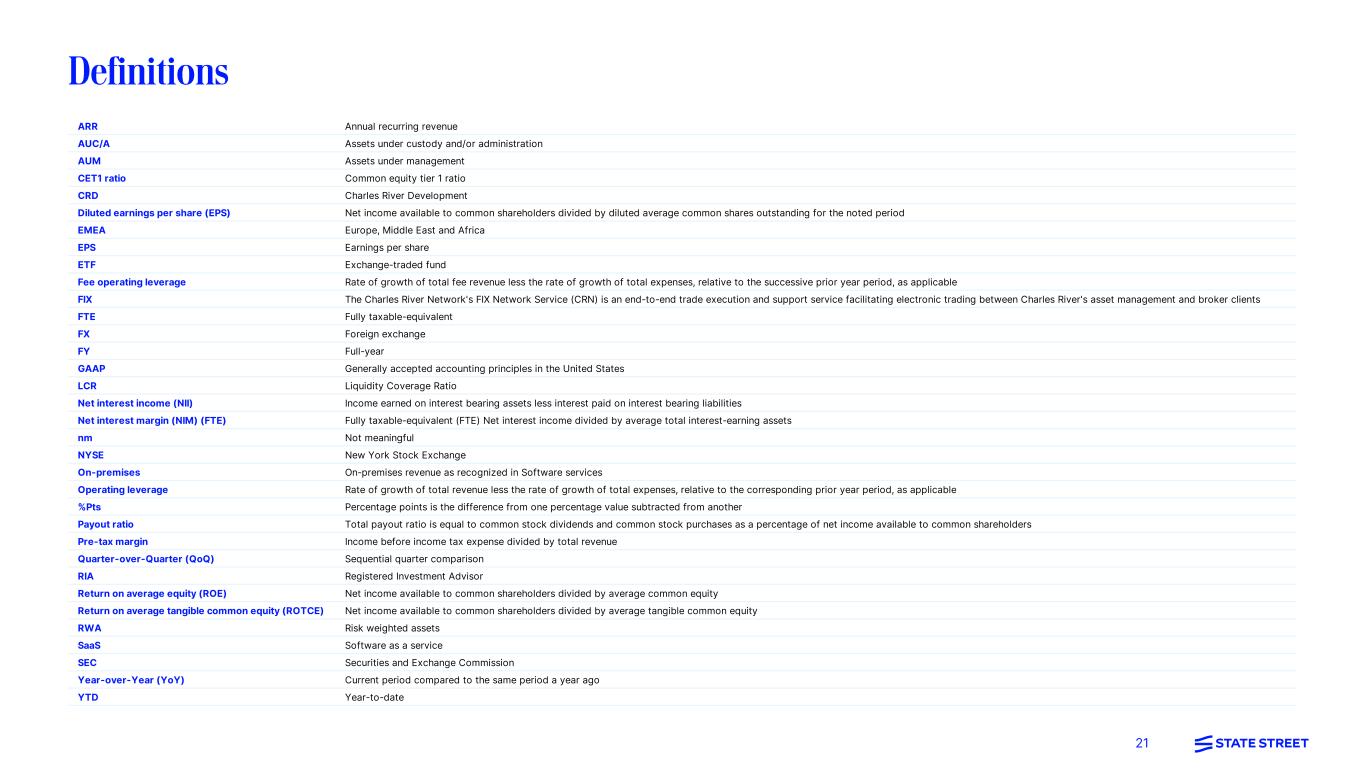
21 Definitions ARR Annual recurring revenue AUC/A Assets under custody and/or administration AUM Assets under management CET1 ratio Common equity tier 1 ratio CRD Charles River Development Diluted earnings per share (EPS) Net income available to common shareholders divided by diluted average common shares outstanding for the noted period EMEA Europe, Middle East and Africa EPS Earnings per share ETF Exchange-traded fund Fee operating leverage Rate of growth of total fee revenue less the rate of growth of total expenses, relative to the successive prior year period, as applicable FIX The Charles River Network's FIX Network Service (CRN) is an end-to-end trade execution and support service facilitating electronic trading between Charles River's asset management and broker clients FTE Fully taxable-equivalent FX Foreign exchange FY Full-year GAAP Generally accepted accounting principles in the United States LCR Liquidity Coverage Ratio Net interest income (NII) Income earned on interest bearing assets less interest paid on interest bearing liabilities Net interest margin (NIM) (FTE) Fully taxable-equivalent (FTE) Net interest income divided by average total interest-earning assets nm Not meaningful NYSE New York Stock Exchange On-premises On-premises revenue as recognized in Software services Operating leverage Rate of growth of total revenue less the rate of growth of total expenses, relative to the corresponding prior year period, as applicable %Pts Percentage points is the difference from one percentage value subtracted from another Payout ratio Total payout ratio is equal to common stock dividends and common stock purchases as a percentage of net income available to common shareholders Pre-tax margin Income before income tax expense divided by total revenue Quarter-over-Quarter (QoQ) Sequential quarter comparison RIA Registered Investment Advisor Return on average equity (ROE) Net income available to common shareholders divided by average common equity Return on average tangible common equity (ROTCE) Net income available to common shareholders divided by average tangible common equity RWA Risk weighted assets SaaS Software as a service SEC Securities and Exchange Commission Year-over-Year (YoY) Current period compared to the same period a year ago YTD Year-to-date