| Year | Summary Compensation Table Total for First Principal Executive Officer (“PEO”)(1) ($) | Summary Compensation Table Total for Second PEO(1) | Compensation Actually Paid to First PEO(2) ($) | Compensation Actually Paid to Second PEO(2) | Average Summary Compensation Table Total for Non-PEO NEOs(3) ($) | Average Compensation Actually Paid to Non-PEO NEOs(4) ($) | Value of Initial Fixed $100 Investment Based on Total Shareholder Return (“TSR”)(5) ($) | Net Income (Loss) ($) | ||||||||||||||||||||||||
| (a) | (b) | (c) | (d) | (e) | (f) | (g) | (h) | (i) | ||||||||||||||||||||||||
| 2025 | 627,125 | 1,175,507 | 322,617 | 876,387 | 24.75 | 1,194,000 | ||||||||||||||||||||||||||
| 2024 | 410,172 | (175,734 | ) | 148,704 | (68,641 | ) | 24.92 | 74,000 | ||||||||||||||||||||||||
| 2023 | 545,549 | 694,972 | 544,401 | 1,293,587 | 167,572 | 348,449 | 40.33 | (1,575,000 | ) | |||||||||||||||||||||||
| (1) | The dollar amounts reported in columns (b) and (c) are the amounts of total compensation reported for Andrew Astor, our former President, Chief Executive Officer and Chief Financial Officer (shown as first PEO) and Robert Banks, our President and Chief Executive Officer (shown as the second PEO), for each corresponding year in the “Total” column of the Summary Compensation Table. Refer to “Summary Compensation Table” in this proxy statement for Mr. Banks’s compensation with respect to the fiscal years ended December 31, 2025 and 2024. Mr. Astor served as President and Chief Executive Officer from August 24, 2020 to May 11, 2023 and as Chief Financial Officer from January 28, 2021 to November 1, 2023. Mr. Banks was appointed President and Chief Executive Officer effective May 11, 2023. For Mr. Astor’s and Mr. Banks’s compensation with respect to the fiscal year ended December 31, 2023, refer to “Summary Compensation Table” from our definitive proxy statement on Schedule 14A filed with the Securities and Exchange Commission on April 12, 2024, which is incorporated herein by reference. |
| Year | Reported Summary Compensation Table Total for Second PEO ($) | Less: Grant date fair value of any equity awards granted during the applicable year(a) ($) | Less: Fair value as of the end of the prior fiscal year of any awards granted in any prior fiscal year that fail to meet the applicable vesting conditions during the covered year ($) | Plus: Year-end fair value of outstanding and unvested equity awards granted during the applicable year ($) | Plus: Vesting date fair value of awards that were granted and vested during the applicable year ($) | Plus: year-over-year change in the fair value of equity awards granted in prior years that are outstanding and unvested as of the end of the covered year ($) | Plus: year-over-year change in fair value of equity awards granted in prior years that vested during the covered year(b) ($) | Plus: Value of dividends or other earnings paid on equity awards in the applicable year prior to the vesting date that are not otherwise included in total compensation for the year ($) | Compensation Actually Paid ($) | |||||||||||||||||||||||||||
| 2025 | 627,125 | 430,027 | 118,354 | 1,175,507 | ||||||||||||||||||||||||||||||||
| 2024 | 410,172 | (14,672 | ) | 8,091 | (405,448 | ) | (173,878 | ) | (175,734 | ) | ||||||||||||||||||||||||||
| 2023 | 694,972 | (350,022 | ) | 948,637 | 1,293,587 | |||||||||||||||||||||||||||||||
| (a) | The grant date fair value of equity awards represents the total of the amounts reported in the “Stock Awards” and “Option Awards” columns in the Summary Compensation Table for the applicable year. | |
| (b) | Measured from the end of the prior fiscal year to the vesting date. |
| Year | Average of Reported Summary Compensation Table Total for non-PEO NEOs ($) | Less: Grant date fair value of any equity awards granted during the applicable year(a) ($) | Less: Fair value as of the end of the prior fiscal year of any awards granted in any prior fiscal year that fail to meet the applicable vesting conditions during the covered year ($) | Plus: Year-end fair value of outstanding and unvested equity awards granted during the applicable year ($) | Plus: Vesting date fair value of awards that were granted and vested during the applicable year ($) | Plus: year-over-year change in the fair value of equity awards granted in prior years that are outstanding and unvested as of the end of the covered year ($) | Plus: year-over-year change in fair value of equity awards granted in prior years that vested during the covered year(b) ($) | Plus: Value of dividends or other earnings paid on equity awards in the applicable year prior to the vesting date that are not otherwise included in total compensation for the year ($) | Compensation Actually Paid ($) | |||||||||||||||||||||||||||
| 2025 | 322,617 | (117,853 | ) | 444,733 | 184,161 | 42,728 | 876,387 | |||||||||||||||||||||||||||||
| 2024 | 148,704 | (163,319 | ) | (54,027 | ) | (68,641 | ) | |||||||||||||||||||||||||||||
| 2023 | 167,572 | (137,227 | ) | 318,104 | 348,449 | |||||||||||||||||||||||||||||||
| (a) | The grant date fair value of equity awards represents the total of the amounts reported in the “Stock Awards” and “Option Awards” columns in the Summary Compensation Table for the applicable year. | |
| (b) | Measured from the end of the prior fiscal year to the vesting date. |
The following graph sets forth the relationship between Compensation Actually Paid to our PEO, the average of Compensation Actually Paid to our Non-PEO NEOs, and the Company’s TSR over the period covering fiscal years 2023, 2024 and 2025. For fiscal year 2023, the Compensation Actually Paid to our PEO included compensation paid to Robert Banks, our current Chief Executive Officer, and Andrew Astor, our former Chief Executive Officer, who served as President and Chief Executive Officer from August 24, 2020 to May 11, 2023 and as Chief Financial Officer from January 28, 2021 to November 1, 2023. As demonstrated by the graph below, the amount of Compensation Actually Paid to the company’s PEO, and the average amount of Compensation Actually paid to the company’s other NEOs as a group, is aligned with the Company’s TSR for the years presented. The alignment of Compensation Actually Paid with the Company’s cumulative TSR over the period presented is a result of having a significant portion of executive compensation tied to equity awards, the fair value of which is inherently driven by the Company’s stock price. During 2024, we did not award any equity or non-equity incentives to our named executive officers.
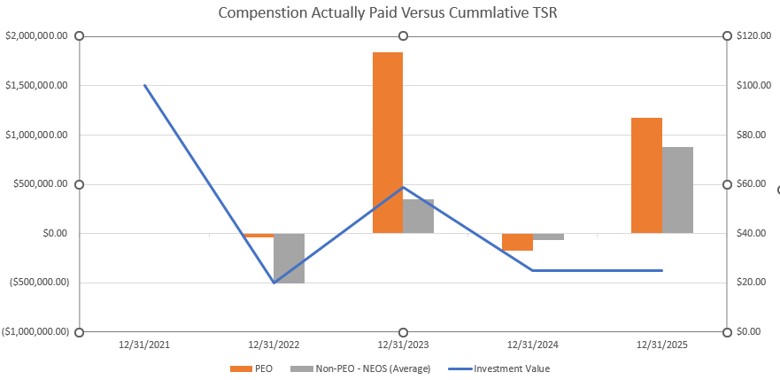
Compensation Actually Paid and Net Income (Loss)
Under our executive compensation program, we utilize net income (loss), along with sales, profitability and cash flow from operations as performance measures for determining bonuses payable to our executive officers. Our net income increased from $74,000 in 2024 to $1,194,000 in 2025, and the Compensation Actually Paid to our PEO and the average Compensation Actually Paid to our Non-PEO NEOs also increased in this period, primarily due to the grant of new equity awards in 2025 (as no equity or non-equity incentives were awarded to our named executive officers in 2024).
| (2) | The dollar amounts reported in columns (d) and (e) represent the amount of Compensation Actually Paid to Mr. Astor (shown as first PEO) and Mr. Banks (shown as second PEO). In accordance with the requirements of Item 402(v) of Regulation S-K, the following adjustments were made to Mr. Astor and Mr. Banks’s Total Compensation from the Summary Compensation Table, in order to determine Compensation Actually Paid: |
| Year | Reported Summary Compensation Table Total for First PEO ($) | Less: Grant date fair value of any equity awards granted during the applicable year(a) ($) | Less: Fair value as of the end of the prior fiscal year of any awards granted in any prior fiscal year that fail to meet the applicable vesting cond itions during the covered year ($) | Plus: Year-end fair value of outstanding and unvested equity awards granted during the applicable year ($) | Plus: Vesting date fair value of awards that were granted and vested during the applicable year ($) | Plus: year-over-year change in the fair value of equity awards granted in prior years that are outstanding and unvested as of the end of the covered year ($) | Plus: year-over-year change in fair value of equity awards granted in prior years that vested during the covered year(b) ($) | Plus: Value of dividends or other earnings paid on equity awards in the applicable year prior to the vesting date that are not otherwise included in total compensation for the year ($) | Compensation Actually Paid ($) | |||||||||||||||||||||||||||
| 2025 | ||||||||||||||||||||||||||||||||||||
| 2024 | ||||||||||||||||||||||||||||||||||||
| 2023 | 545,549 | (8,463 | ) | 7,315 | 544,401 | |||||||||||||||||||||||||||||||
| [1] | For the 2025, 2024 and 2023 fiscal years, our Non-PEO NEO was Judy Krandel, who was appointed as Chief Financial Officer effective November 1, 2023. The dollar amounts reported in column (f) are the amounts of total compensation reported for Ms. Krandel for each corresponding year in the “Total” column of the Summary Compensation Table. Refer to “Summary Compensation Table” in this proxy statement for Ms. Krandel’s compensation with respect to the fiscal years ended December 31, 2025 and 2024. For Ms. Krandel’s compensation with respect to the fiscal year ended December 31, 2023, refer to “Summary Compensation Table” from our definitive proxy statement on Schedule 14A filed with the Securities and Exchange Commission on April 12, 2024, which is incorporated herein by reference. |
| [2] | The dollar amounts reported in column (g) represent the amount of Compensation Actually Paid to Ms. Krandel . In accordance with the requirements of Item 402(v) of Regulation S-K, the following adjustments were made to Ms. Krandel’s Total Compensation from the Summary Compensation Table, in order to determine Compensation Actually Paid: |
| [3] | Calculated by dividing the sum of the cumulative amount of dividends for the measurement period, assuming dividend reinvestment, and the difference between the share price of our common stock at the end and the beginning of the measurement period by the share price of our common stock at the beginning of the measurement period. |
| [4] | The dollar amounts reported in columns (b) and (c) are the amounts of total compensation reported for Andrew Astor, our former President, Chief Executive Officer and Chief Financial Officer (shown as first PEO) and Robert Banks, our President and Chief Executive Officer (shown as the second PEO), for each corresponding year in the “Total” column of the Summary Compensation Table. Refer to “Summary Compensation Table” in this proxy statement for Mr. Banks’s compensation with respect to the fiscal years ended December 31, 2025 and 2024. Mr. Astor served as President and Chief Executive Officer from August 24, 2020 to May 11, 2023 and as Chief Financial Officer from January 28, 2021 to November 1, 2023. Mr. Banks was appointed President and Chief Executive Officer effective May 11, 2023. For Mr. Astor’s and Mr. Banks’s compensation with respect to the fiscal year ended December 31, 2023, refer to “Summary Compensation Table” from our definitive proxy statement on Schedule 14A filed with the Securities and Exchange Commission on April 12, 2024, which is incorporated herein by reference. |
| [5] | The dollar amounts reported in columns (d) and (e) represent the amount of Compensation Actually Paid to Mr. Astor (shown as first PEO) and Mr. Banks (shown as second PEO). In accordance with the requirements of Item 402(v) of Regulation S-K, the following adjustments were made to Mr. Astor and Mr. Banks’s Total Compensation from the Summary Compensation Table, in order to determine Compensation Actually Paid: |
| [6] | The grant date fair value of equity awards represents the total of the amounts reported in the “Stock Awards” and “Option Awards” columns in the Summary Compensation Table for the applicable year. |
| [7] | Measured from the end of the prior fiscal year to the vesting date. |
| [8] | The grant date fair value of equity awards represents the total of the amounts reported in the “Stock Awards” and “Option Awards” columns in the Summary Compensation Table for the applicable year. |
| [9] | Measured from the end of the prior fiscal year to the vesting date. |
| [10] | The grant date fair value of equity awards represents the total of the amounts reported in the “Stock Awards” and “Option Awards” columns in the Summary Compensation Table for the applicable year. |
| [11] | Measured from the end of the prior fiscal year to the vesting date. |