Exhibit 99.2
Forward Looking Statements This presentation contains “forward-looking statements” within the meaning of Section 27A of the Securities Act of 1933, as amended, and Section 21E of the Securities Exchange Act of 1934, as amended and are intended to be covered by the safe harbor provisions provided by the Private Securities Litigation Reform Act of 1995, as amended. These forward-looking statements reflect the current views of Equity’s management with respect to, among other things, future events and Equity’s financial performance. These statements are often, but not always, made through the use of words or phrases such as “may,” “should,” “could,” “predict,” “potential,” “believe,” “will likely result,” “expect,” “continue,” “will,” “anticipate,” “seek,” “estimate,” “intend,” “plan,” “project,” “forecast,” “goal,” “target,” “would” and “outlook,” or the negative variations of those words or other comparable words of a future or forward-looking nature. These forward-looking statements are not historical facts, and are based on current expectations, estimates and projections about Equity’s industry, management’s beliefs and certain assumptions made by management, many of which, by their nature, are inherently uncertain and beyond Equity’s control. Accordingly, Equity cautions you that any such forward-looking statements are not guarantees of future performance and are subject to risks, assumptions and uncertainties that are difficult to predict. Although Equity believes that the expectations reflected in these forward-looking statements are reasonable as of the date made, actual results may prove to be materially different from the results expressed or implied by the forward-looking statements. Factors that could cause actual results to differ materially from Equity’s expectations include competition from other financial institutions and bank holding companies; the effects of and changes in trade, monetary and fiscal policies and laws, including interest rate policies of the Federal Reserve Board; changes in the demand for loans; fluctuations in value of collateral and loan reserves; inflation, interest rate, market and monetary fluctuations; changes in consumer spending, borrowing and savings habits; and acquisitions and integration of acquired businesses; and similar variables. The foregoing list of factors is not exhaustive. In addition, the following factors, among others, related to the transaction between Equity and Lincoln Bancorp (“Lincoln”) could cause actual outcomes and results to differ materially from forward-looking statements or historical performance: the possibility that the anticipated benefits of the transaction will not be realized when expected or at all, including as a result of the impact of, or problems arising from, the integration of the two companies or as a result of the strength of the economy and competitive factors in the areas where companies do business; the possibility that the transaction may be more expensive to complete than anticipated, including as a result of unexpected factors or events; Lincoln and Equity’s ability to obtain required governmental approvals of the proposed transaction on the timeline expected, or at all, and the risk that such approvals may result in the imposition of conditions that could adversely affect the combined company after the closing of the proposed transaction or adversely affect the expected benefits of the proposed transaction; the failure to obtain the necessary approvals by the shareholders of Lincoln; the failure to satisfy other conditions to completion of the proposed merger, or any unexpected delay in closing the proposed transaction or the occurrence of any event, change or other circumstances that could give rise to the termination of the merger agreement; diversion of management’s attention from ongoing business operations and opportunities; potential adverse reactions or changes to business or employee relationships, including those resulting from the completion of the transaction; the business, economic and political conditions in the markets in which the parties operate; the risk that the proposed combination could have an adverse effect the parties’ ability to retain customers and retain or hire key personnel and maintain relationships with customers; the risk that the combination may be more difficult, time-consuming or expensive than anticipated; and other factors that may affect future results of Equity. For discussion of these and other risks that may cause actual results to differ from expectations, please refer to “Cautionary Note Regarding Forward-Looking Statements” and “Risk Factors” in Equity’s Annual Report on Form 10-K filed with the Securities and Exchange Commission on March 6, 2026, as amended, and any updates to those risk factors set forth in Equity’s subsequent Quarterly Reports on Form 10-Q or Current Reports on Form 8-K. If one or more events related to these or other risks or uncertainties materialize, or if Equity’s underlying assumptions prove to be incorrect, actual results may differ materially from what Equity anticipates. Accordingly, you should not place undue reliance on any such forward-looking statements. Any forward-looking statement speaks only as of the date on which it is made, and Equity does not undertake any obligation to publicly update or review any forward-looking statement, whether as a result of new information, future developments or otherwise. New risks and uncertainties arise from time to time, and it is not possible for us to predict those events or how they may affect us. In addition, Equity cannot assess the impact of each factor on Equity’s business or the extent to which any factor, or combination of factors, may cause actual results to differ materially from those contained in any forward-looking statements. All forward-looking statements, expressed or implied, included in this presentation are expressly qualified in their entirety by this cautionary statement. This cautionary statement should also be considered in connection with any subsequent written or oral forward-looking statements that Equity or persons acting on Equity’s behalf may issue. ADDITIONAL INFORMATION ABOUT THE TRANSACTION AND WHERE TO FIND IT In connection with the proposed transaction with Lincoln, Equity filed with the SEC a registration statement on Form S-4 to register the shares of Equity’s Class A common stock to be issued to the shareholders of Lincoln. The registration statement includes a proxy statement/prospectus, which will be sent to the shareholders of Lincoln seeking their approval of the proposed transaction. WE URGE INVESTORS AND SECURITY HOLDERS TO READ THE REGISTRATION STATEMENT ON FORM S-4, THE PROXY STATEMENT/PROSPECTUS INCLUDED WITHIN THE REGISTRATION STATEMENT ON FORM S-4 AND ANY OTHER RELEVANT DOCUMENTS TO BE FILED WITH THE SEC IN CONNECTION WITH THE PROPOSED TRANSACTION WHEN THEY BECOME AVAILABLE BECAUSE THEY WILL CONTAIN IMPORTANT INFORMATION ABOUT EQUITY, LINCOLN AND THE PROPOSED TRANSACTION. The documents filed by Equity with the SEC may be obtained free of charge at Equity’s investor relations website at investor.equitybank.com or at the SEC’s website at www.sec.gov. Alternatively, these documents, when available, can be obtained free of charge from Equity upon written request to Equity Bancshares, Inc., Attn: Investor Relations, 7701 East Kellogg Drive, Suite 300, Wichita, Kansas 67207 or by calling (316) 612-6000. NO OFFER OR SOLICITATION This communication is for informational purposes only and is not intended to and does not constitute an offer to subscribe for, buy or sell, or the solicitation of an offer to subscribe for, buy or sell, or an invitation to subscribe for, buy or sell any securities or a solicitation of any vote or approval in any jurisdiction, nor shall there be any sale, issuance or transfer of securities in any jurisdiction in which such offer, invitation, sale or solicitation would be unlawful prior to registration or qualification under the securities laws of any such jurisdiction. No offer of securities shall be made except by means of a prospectus meeting the requirements of Section 10 of the Securities Act, and otherwise in accordance with applicable law. NON-GAAP FINANCIAL MEASURES This presentation contains certain non-GAAP financial measures intended to supplement, not substitute for, comparable GAAP measures. Reconciliations of non-GAAP financial measures to GAAP financial measures are provided at the end of this presentation. Numbers in the presentation may not sum due to rounding.
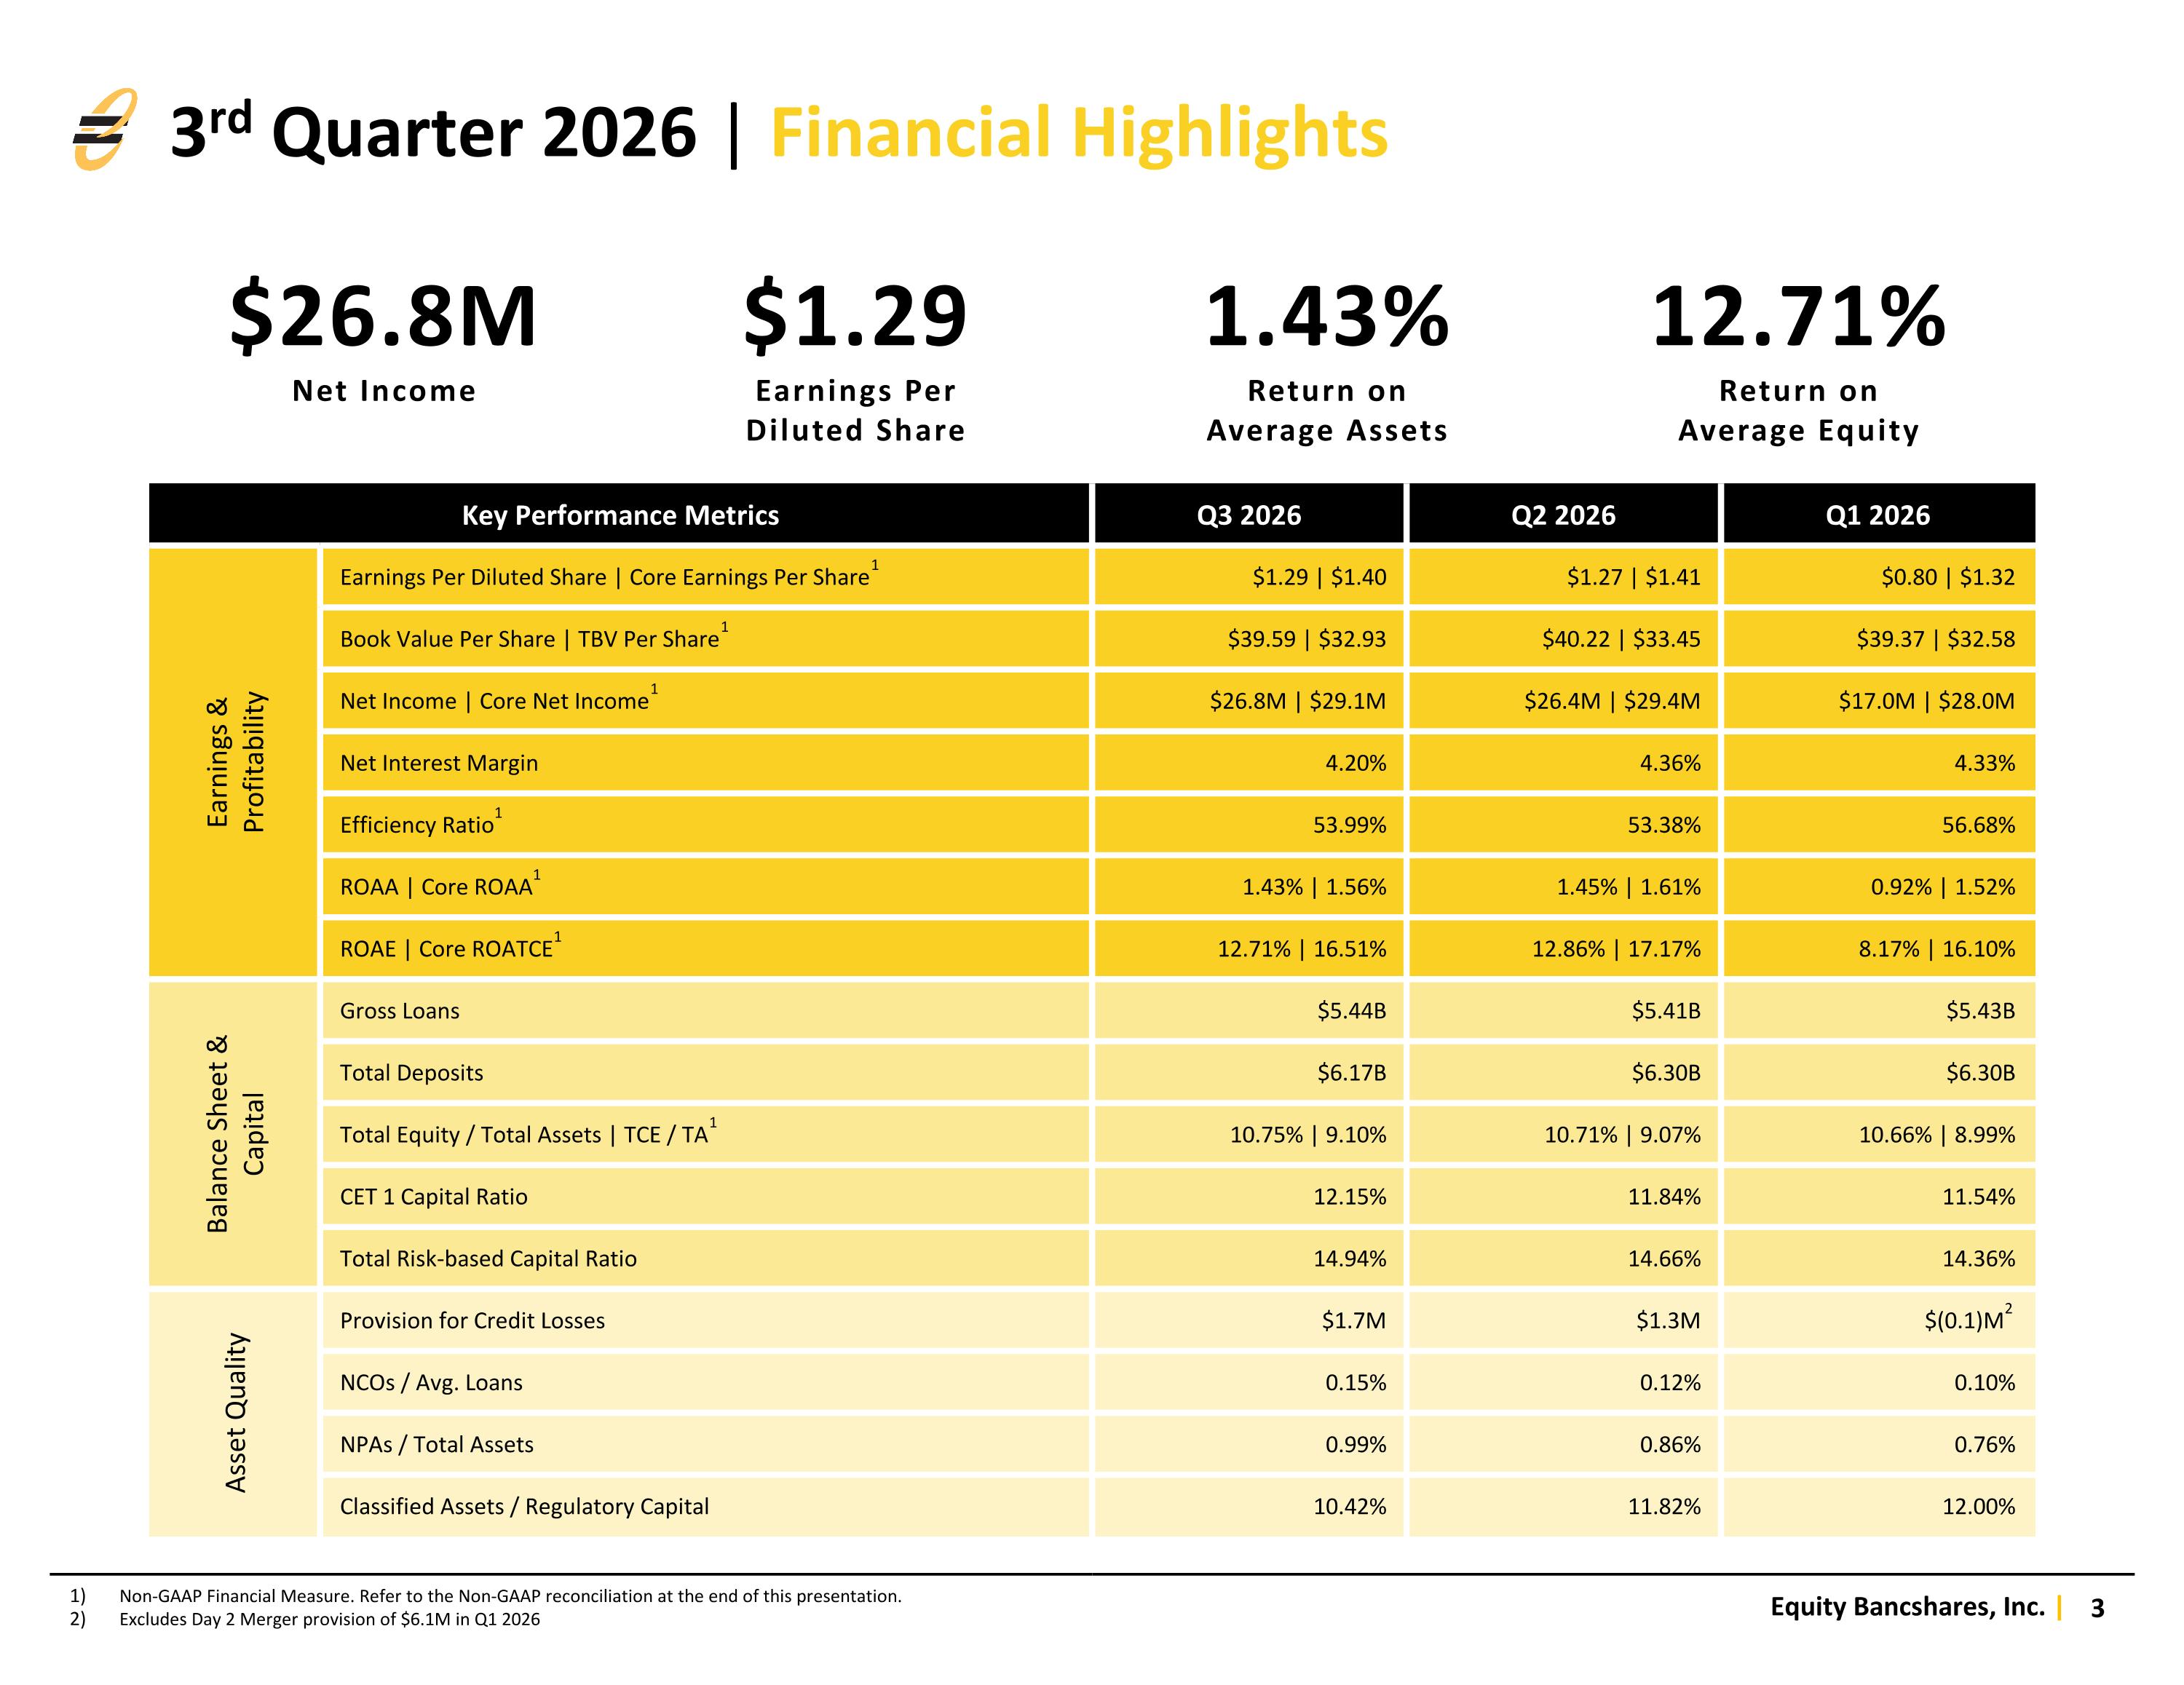
3rd Quarter 2026 | Financial Highlights Non-GAAP Financial Measure. Refer to the Non-GAAP reconciliation at the end of this presentation. Excludes Day 2 Merger provision of $6.1M in Q1 2026 $26.8M Net Income $1.29 Earnings Per Diluted Share 1.43% Return on Average Assets 12.71% Return on Average Equity Key Performance Metrics Q3 2026 Q2 2026 Q1 2026 Earnings & Profitability Earnings Per Diluted Share | Core Earnings Per Share1 $1.29 | $1.40 $1.27 | $1.41 $0.80 | $1.32 Book Value Per Share | TBV Per Share1 $39.59 | $32.93 $40.22 | $33.45 $39.37 | $32.58 Net Income | Core Net Income1 $26.8M | $29.1M $26.4M | $29.4M $17.0M | $28.0M Net Interest Margin 4.20% 4.36% 4.33% Efficiency Ratio1 53.99% 53.38% 56.68% ROAA | Core ROAA1 1.43% | 1.56% 1.45% | 1.61% 0.92% | 1.52% ROAE | Core ROATCE1 12.71% | 16.51% 12.86% | 17.17% 8.17% | 16.10% Balance Sheet & Capital Gross Loans $5.44B $5.41B $5.43B Total Deposits $6.17B $6.30B $6.30B Total Equity / Total Assets | TCE / TA1 10.75% | 9.10% 10.71% | 9.07% 10.66% | 8.99% CET 1 Capital Ratio 12.15% 11.84% 11.54% Total Risk-based Capital Ratio 14.94% 14.66% 14.36% Asset Quality Provision for Credit Losses $1.7M $1.3M $(0.1)M2 NCOs / Avg. Loans 0.15% 0.12% 0.10% NPAs / Total Assets 0.99% 0.86% 0.76% Classified Assets / Regulatory Capital 10.42% 11.82% 12.00%
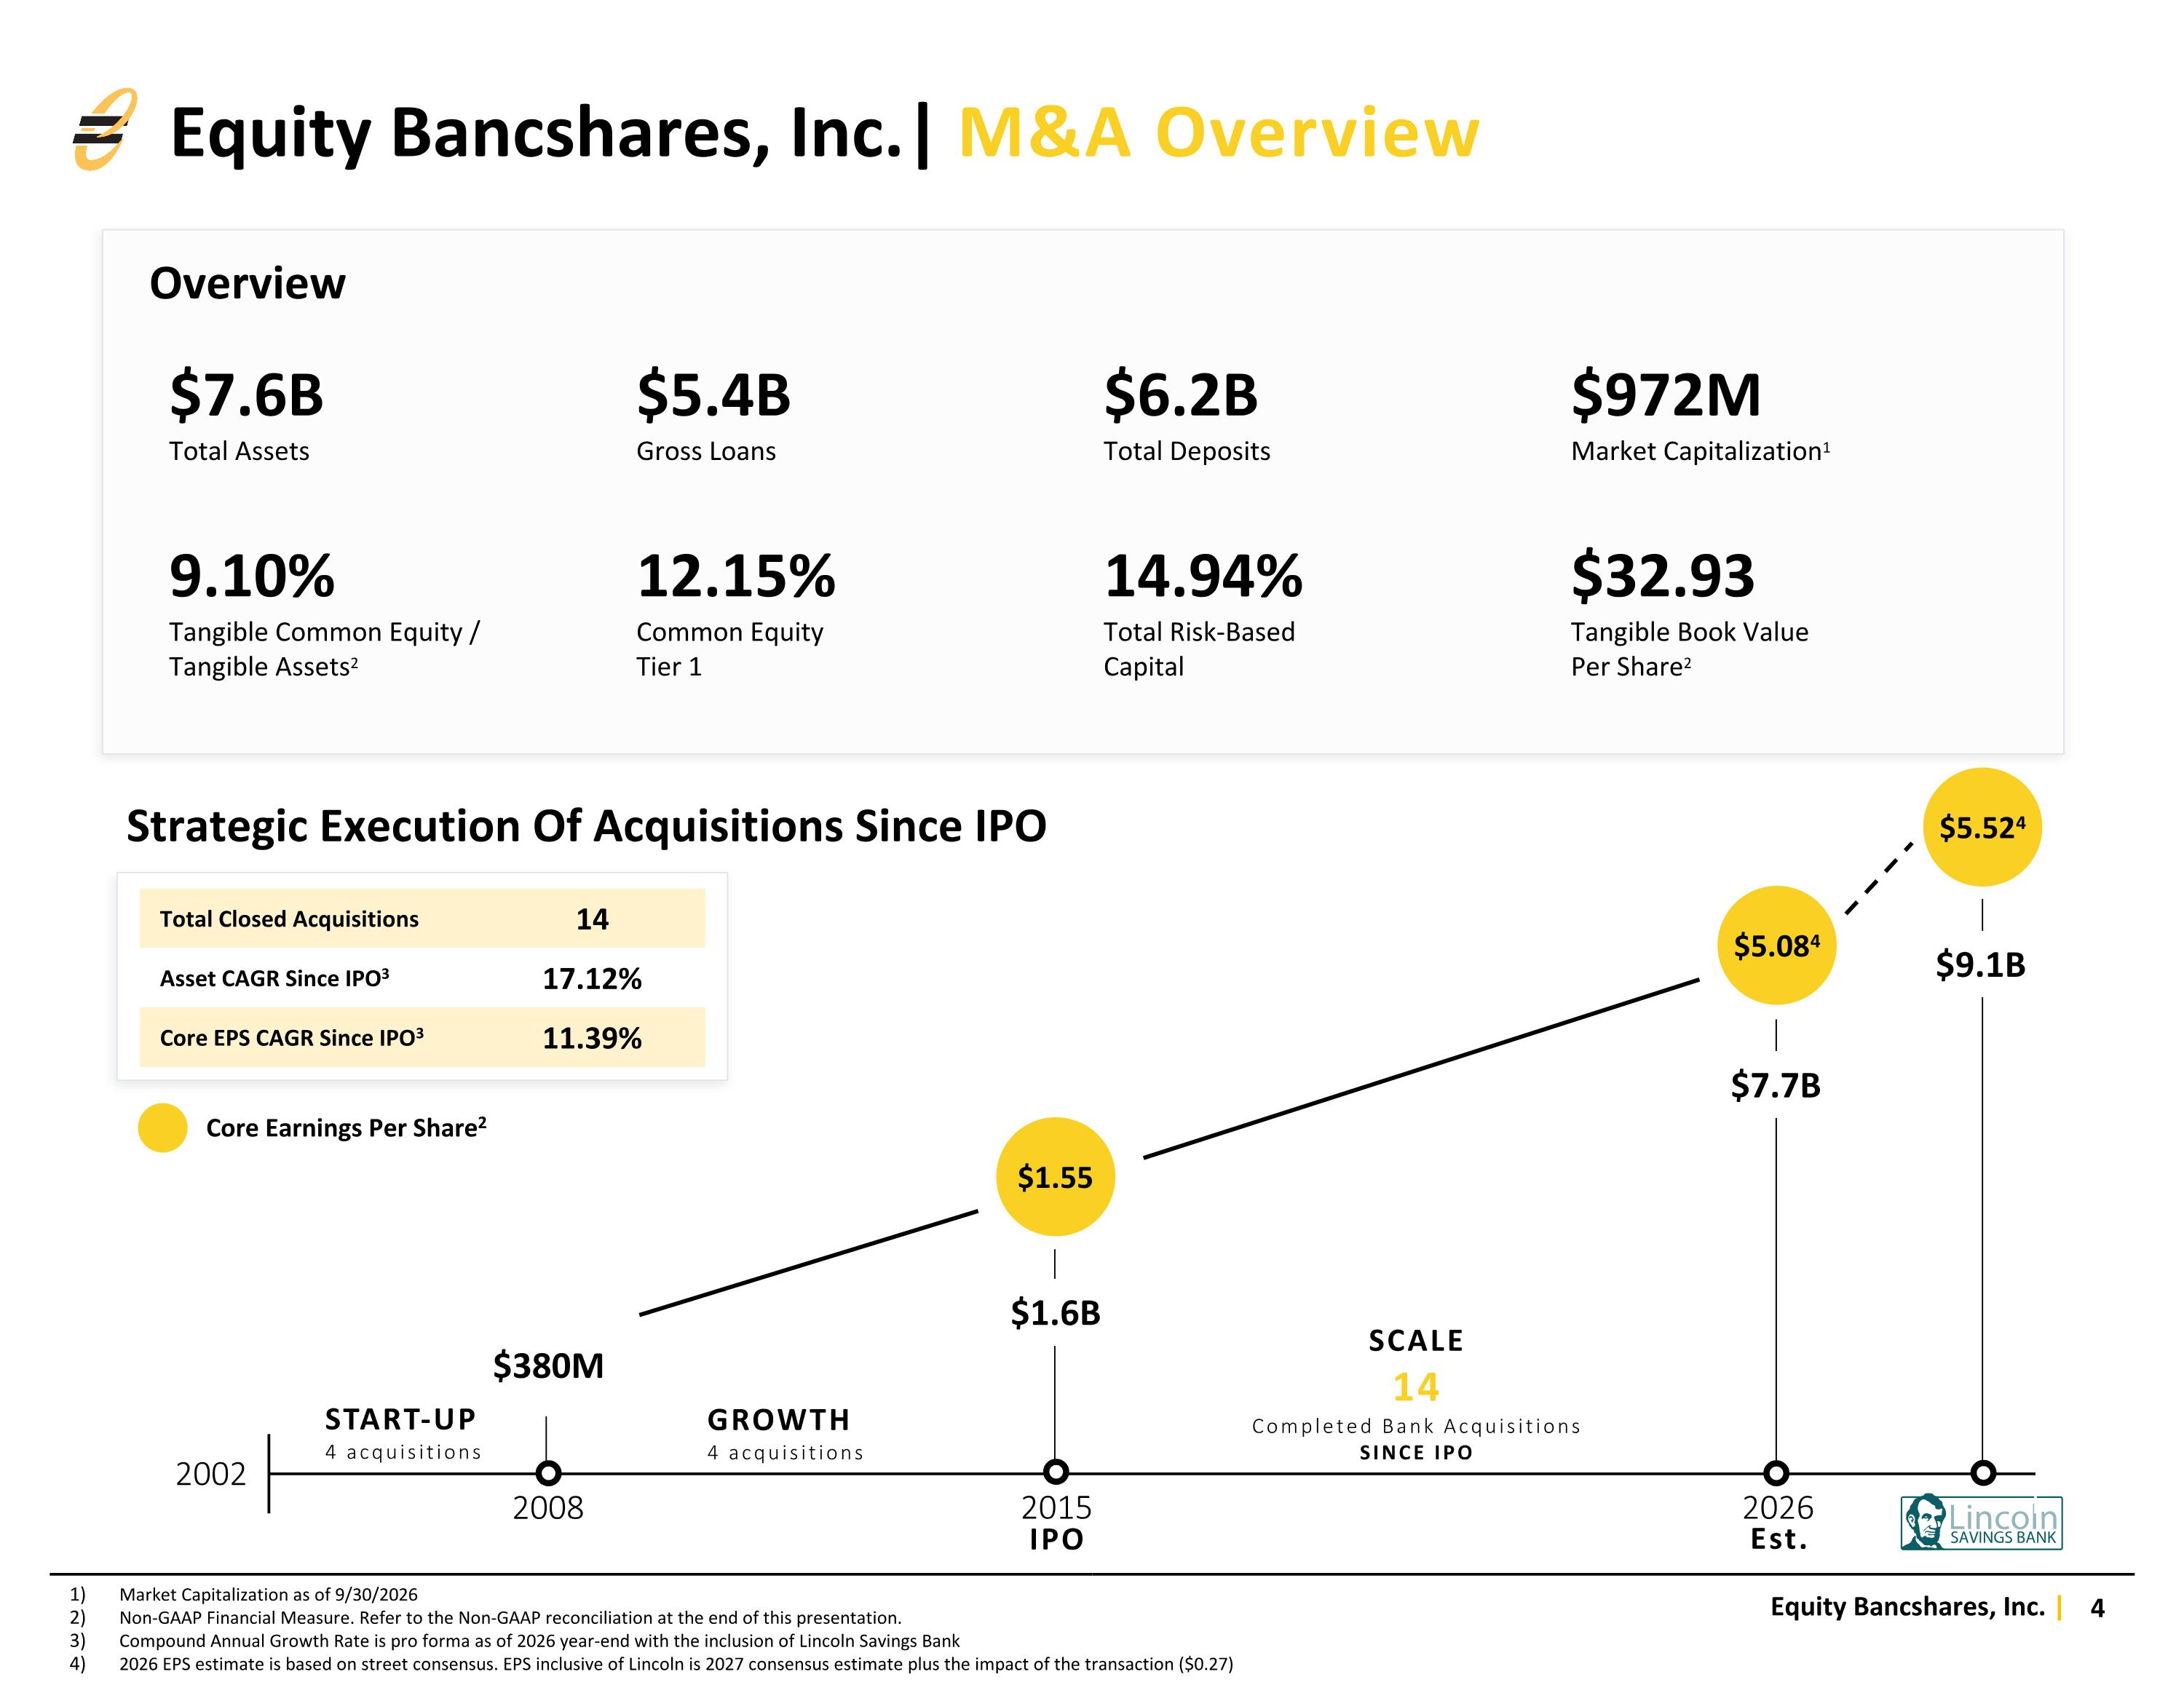
Equity Bancshares, Inc.| M&A Overview SCALE 14 Completed Bank Acquisitions SINCE IPO 2002 2008 2015 2026 GROWTH 4 acquisitions IPO $380M $1.6B Est. Strategic Execution Of Acquisitions Since IPO $5.524 $5.084 $1.55 Core Earnings Per Share2 $7.7B $9.1B START-UP 4 acquisitions Total Closed Acquisitions 14 Asset CAGR Since IPO3 17.12% Core EPS CAGR Since IPO3 11.39% Overview $7.6B Total Assets $5.4B Gross Loans $6.2B Total Deposits $972M Market Capitalization1 9.10% Tangible Common Equity / Tangible Assets2 12.15% Common Equity Tier 1 14.94% Total Risk-Based Capital $32.93 Tangible Book Value Per Share2 Market Capitalization as of 9/30/2026 Non-GAAP Financial Measure. Refer to the Non-GAAP reconciliation at the end of this presentation. Compound Annual Growth Rate is pro forma as of 2026 year-end with the inclusion of Lincoln Savings Bank 2026 EPS estimate is based on street consensus. EPS inclusive of Lincoln is 2027 consensus estimate plus the impact of the transaction ($0.27)
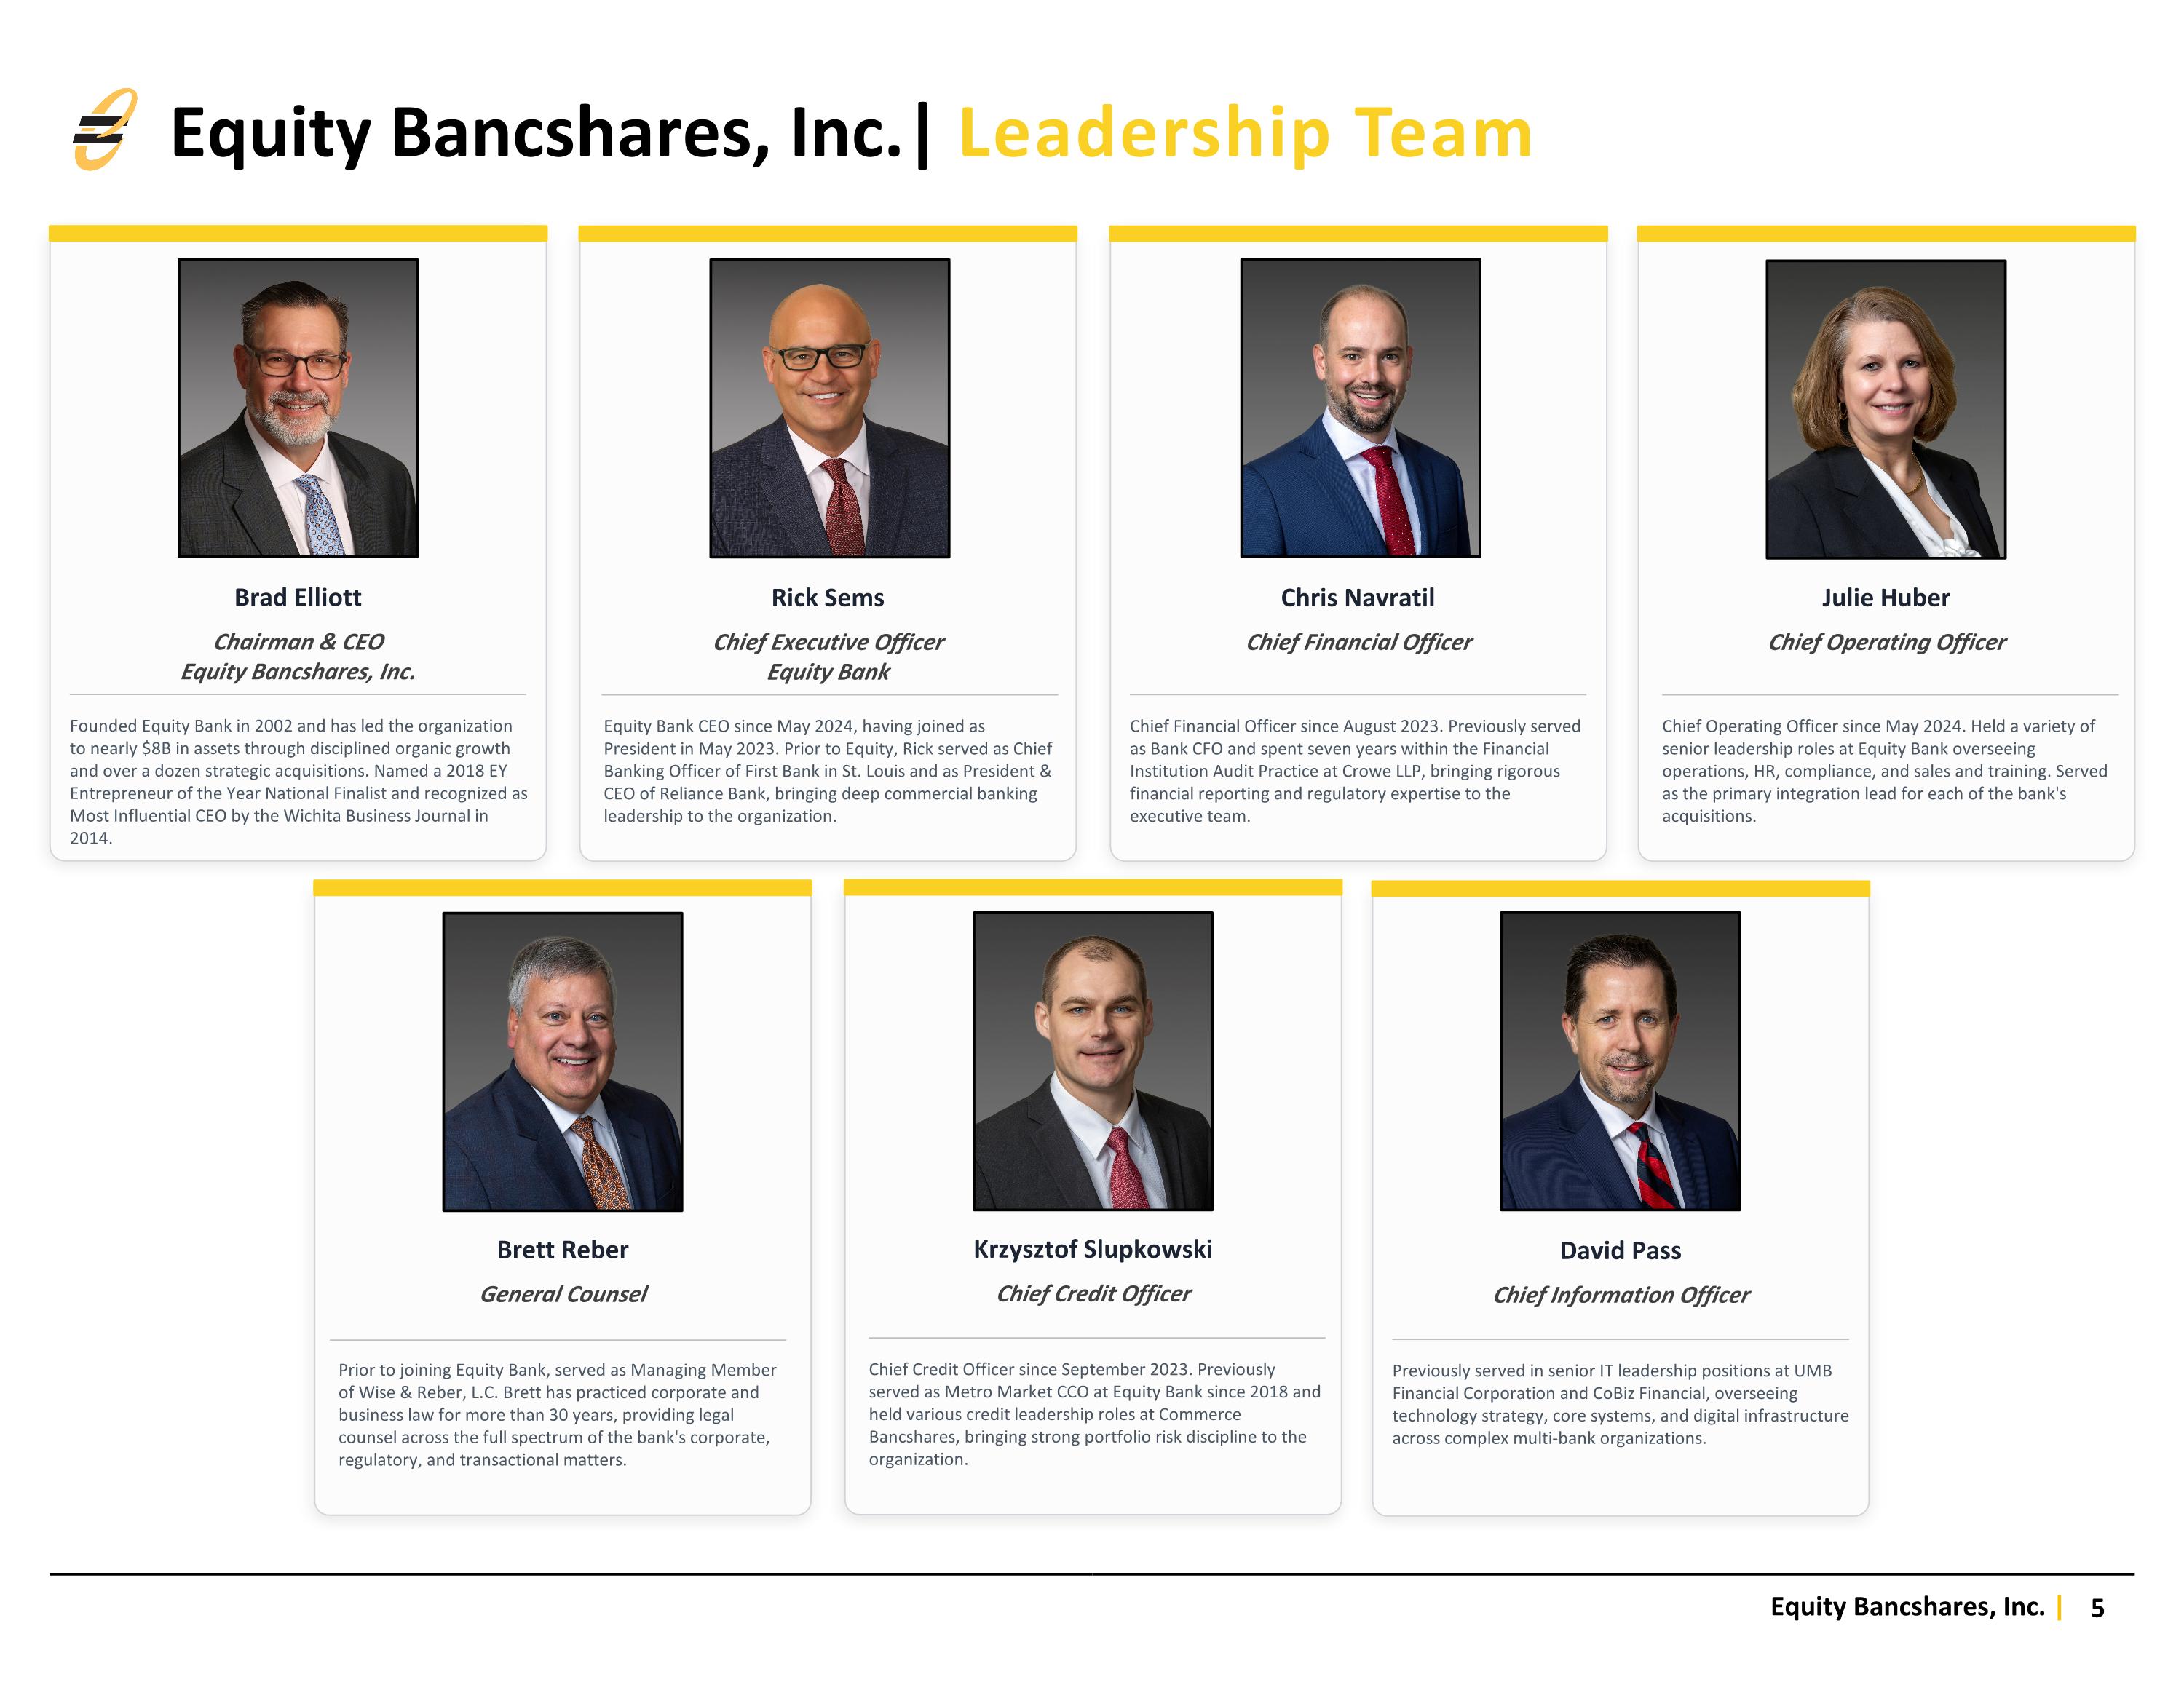
Brad Elliott Chairman & CEO Equity Bancshares, Inc. Founded Equity Bank in 2002 and has led the organization to nearly $8B in assets through disciplined organic growth and over a dozen strategic acquisitions. Named a 2018 EY Entrepreneur of the Year National Finalist and recognized as Most Influential CEO by the Wichita Business Journal in 2014. Rick Sems Chief Executive Officer Equity Bank Equity Bank CEO since May 2024, having joined as President in May 2023. Prior to Equity, Rick served as Chief Banking Officer of First Bank in St. Louis and as President & CEO of Reliance Bank, bringing deep commercial banking leadership to the organization. Chris Navratil Chief Financial Officer Chief Financial Officer since August 2023. Previously served as Bank CFO and spent seven years within the Financial Institution Audit Practice at Crowe LLP, bringing rigorous financial reporting and regulatory expertise to the executive team. Julie Huber Chief Operating Officer Chief Operating Officer since May 2024. Held a variety of senior leadership roles at Equity Bank overseeing operations, HR, compliance, and sales and training. Served as the primary integration lead for each of the bank's acquisitions. Brett Reber General Counsel Prior to joining Equity Bank, served as Managing Member of Wise & Reber, L.C. Brett has practiced corporate and business law for more than 30 years, providing legal counsel across the full spectrum of the bank's corporate, regulatory, and transactional matters. Krzysztof Slupkowski Chief Credit Officer Chief Credit Officer since September 2023. Previously served as Metro Market CCO at Equity Bank since 2018 and held various credit leadership roles at Commerce Bancshares, bringing strong portfolio risk discipline to the organization. David Pass Chief Information Officer Previously served in senior IT leadership positions at UMB Financial Corporation and CoBiz Financial, overseeing technology strategy, core systems, and digital infrastructure across complex multi-bank organizations. Equity Bancshares, Inc.| Leadership Team
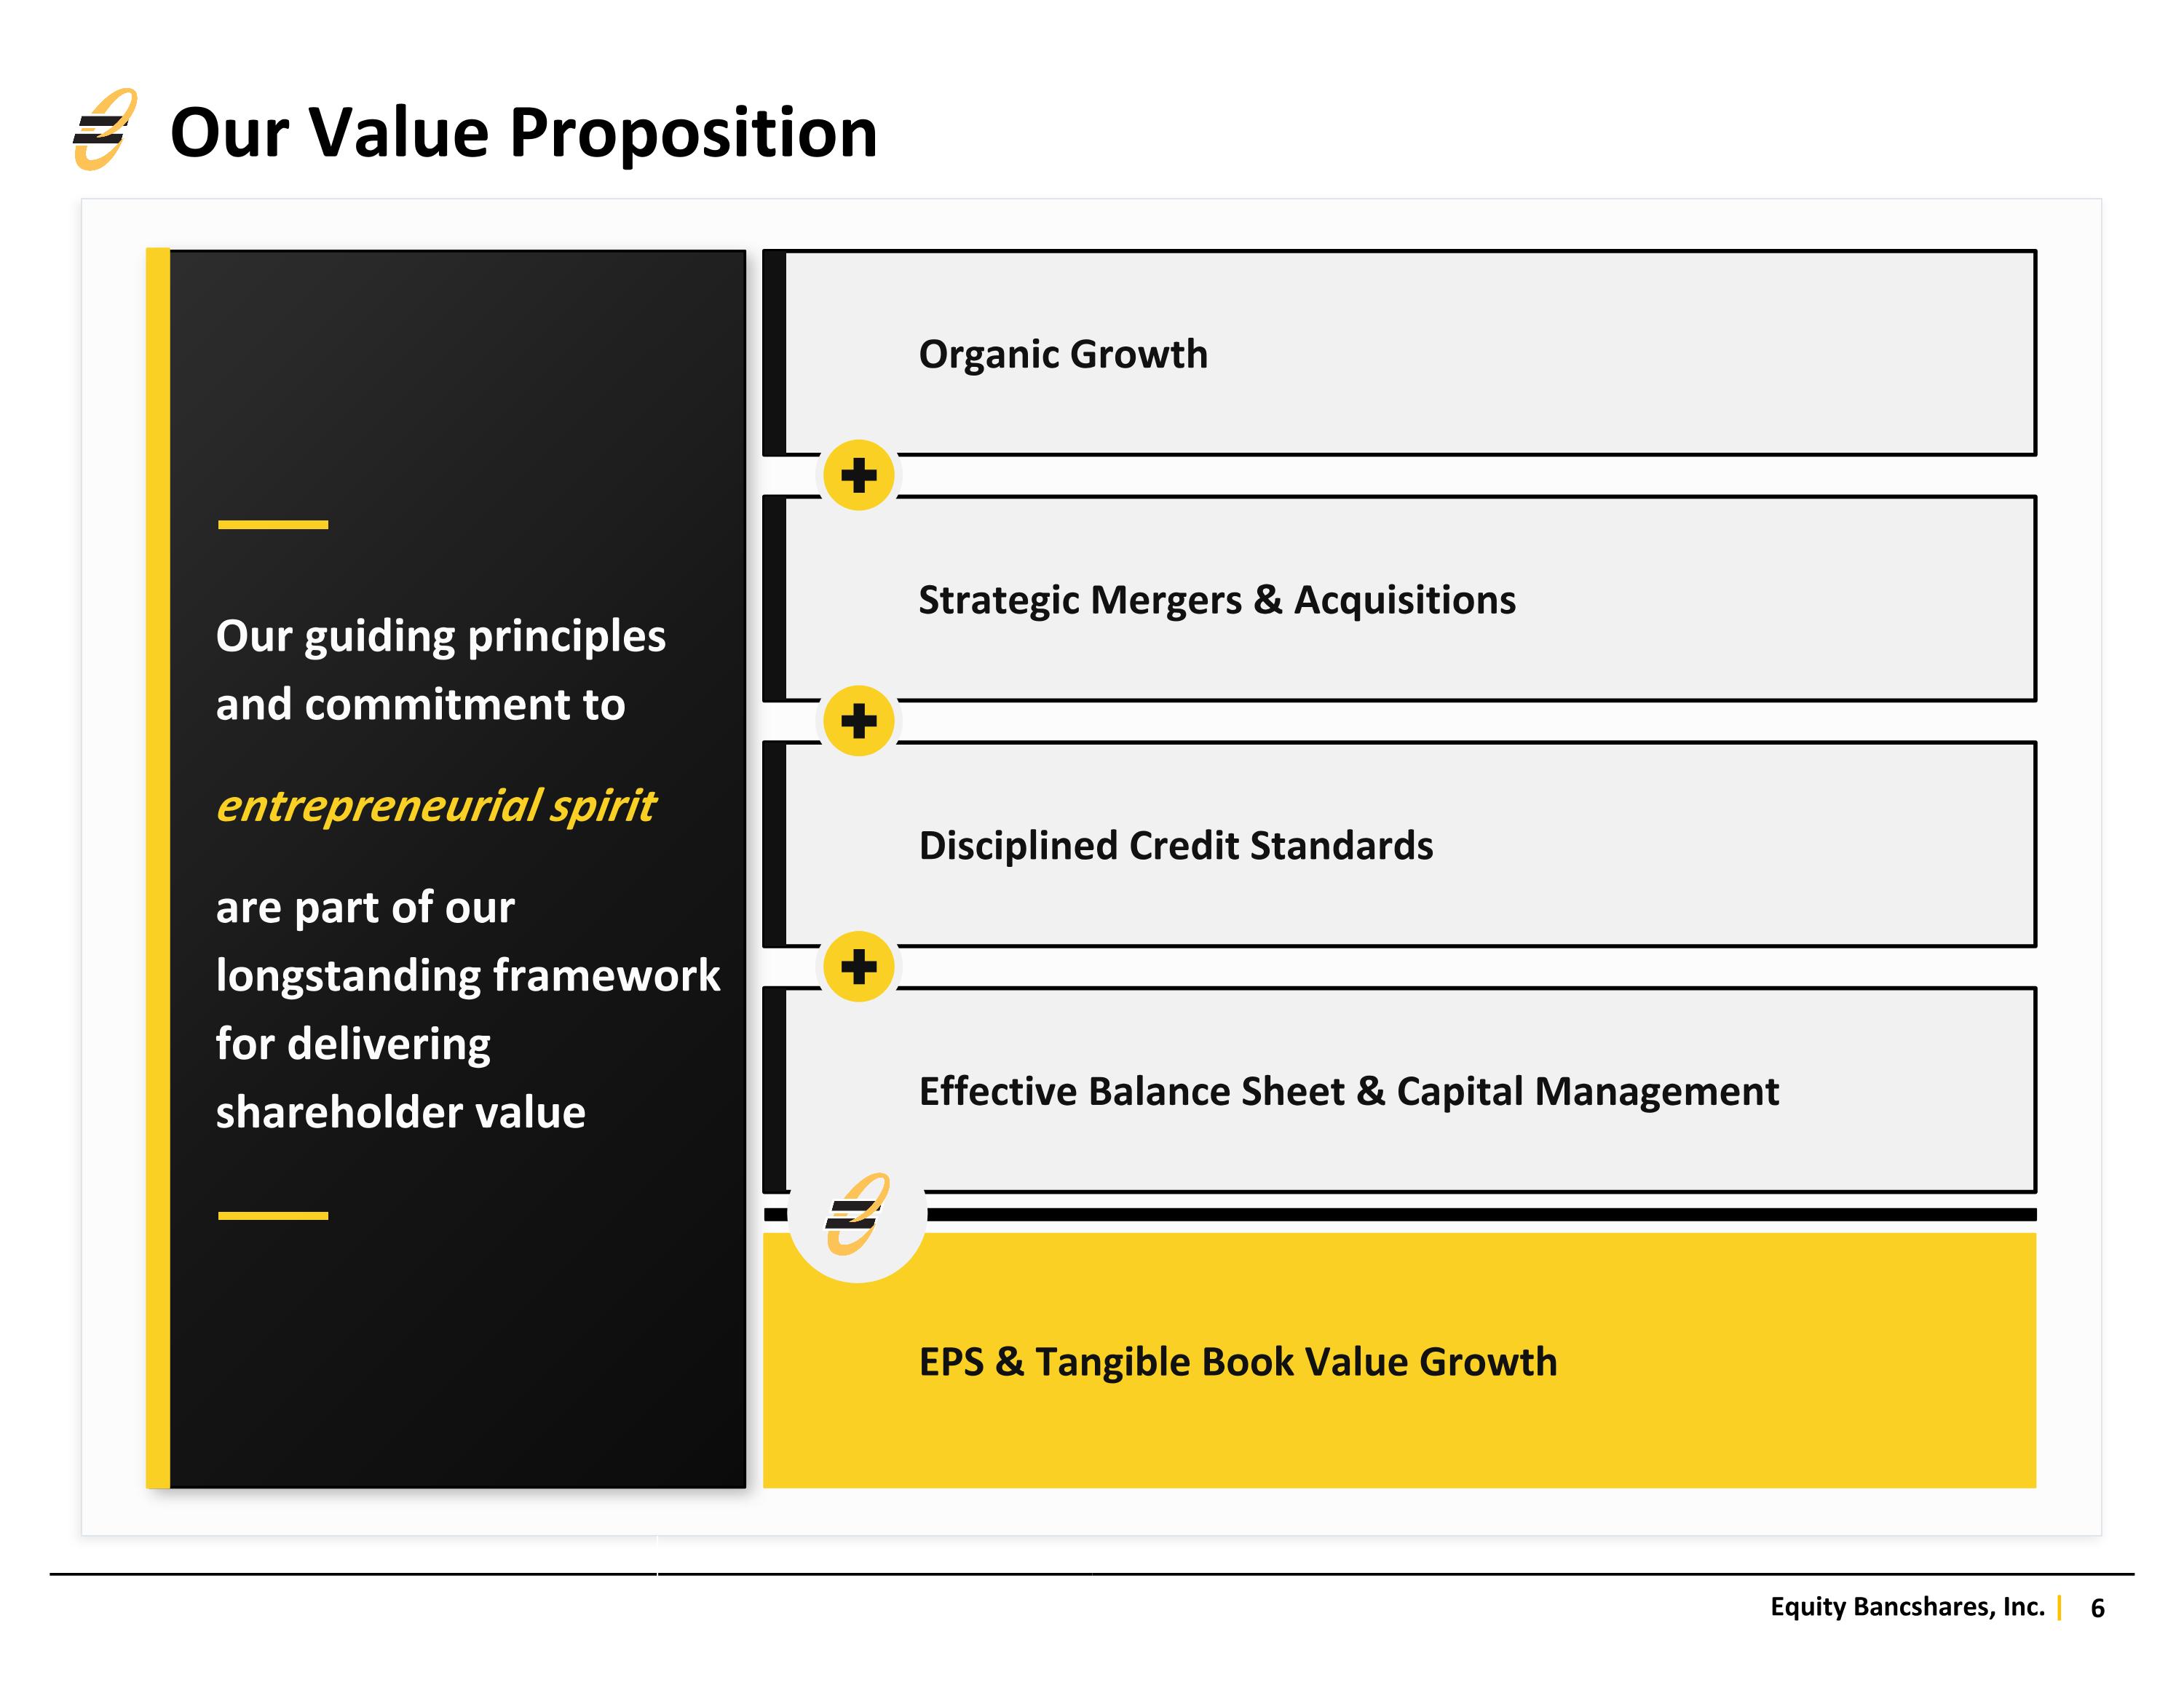
Our Value Proposition Our guiding principles and commitment to entrepreneurial spirit are part of our longstanding framework for delivering shareholder value Organic Growth Strategic Mergers & Acquisitions Disciplined Credit Standards Effective Balance Sheet & Capital Management EPS & Tangible Book Value Growth
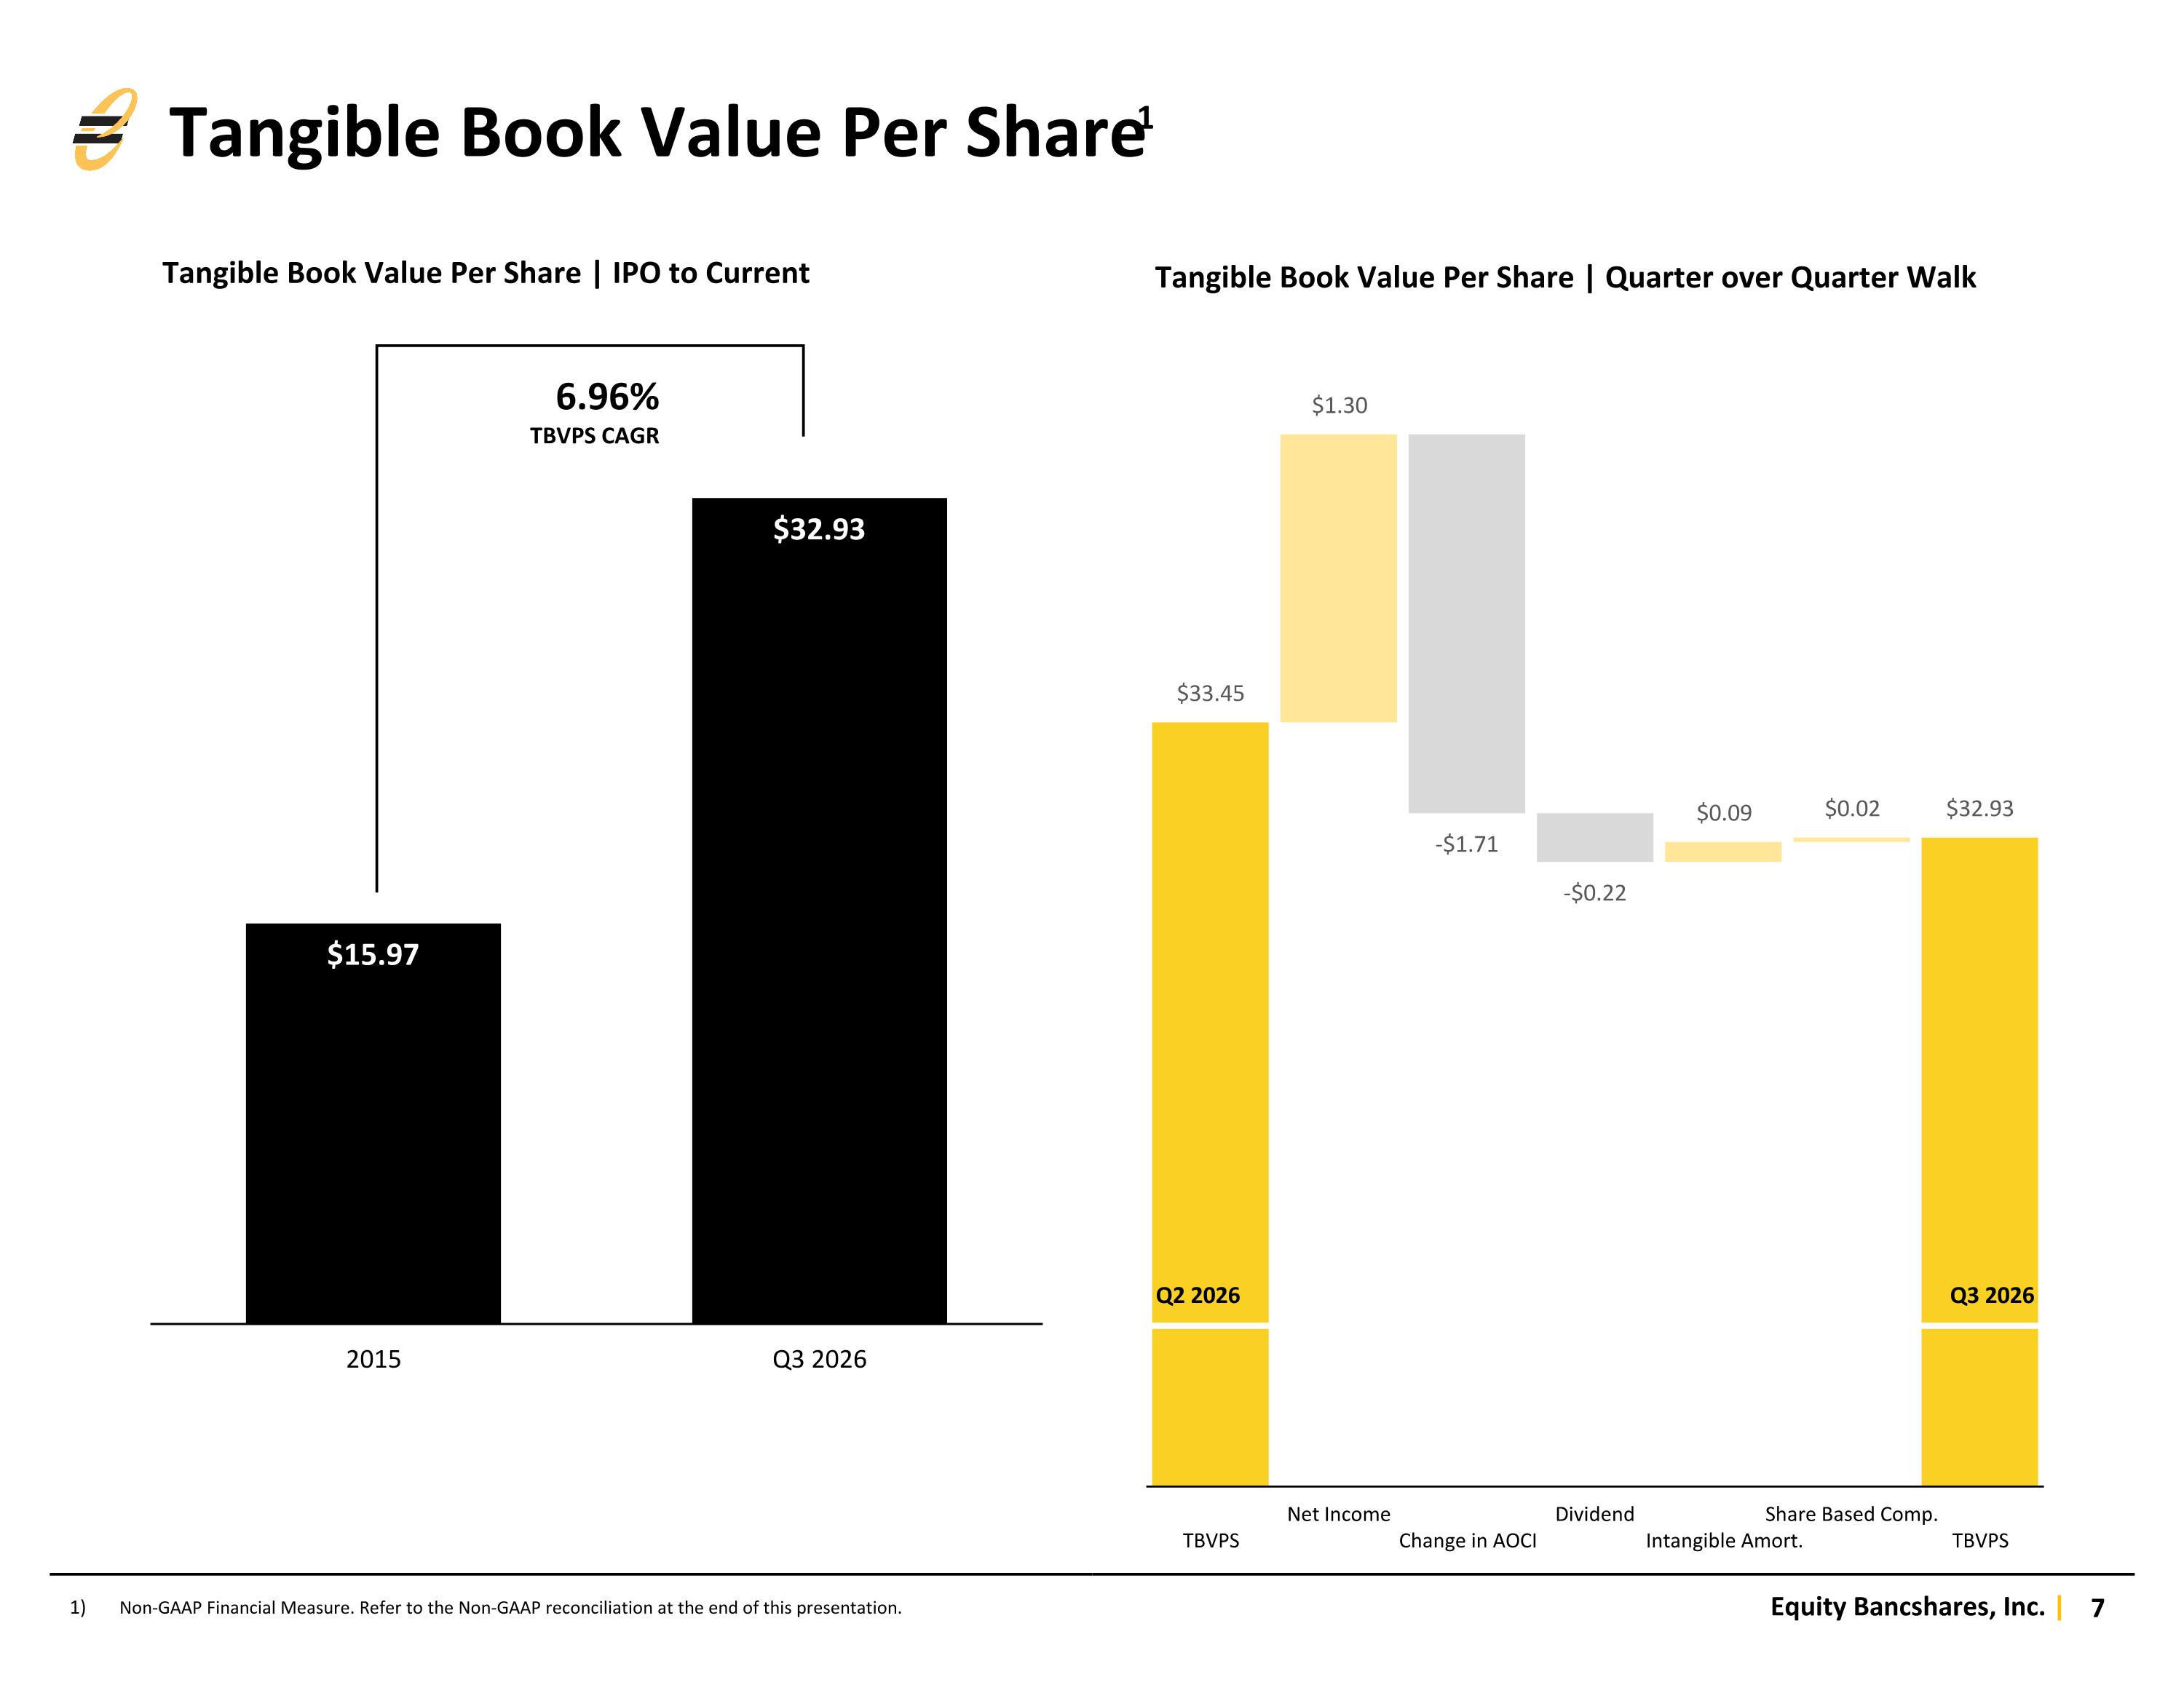
Tangible Book Value Per Share | IPO to Current Tangible Book Value Per Share | Quarter over Quarter Walk Tangible Book Value Per Share1 6.96% TBVPS CAGR Q2 2026 Q3 2026 Non-GAAP Financial Measure. Refer to the Non-GAAP reconciliation at the end of this presentation.
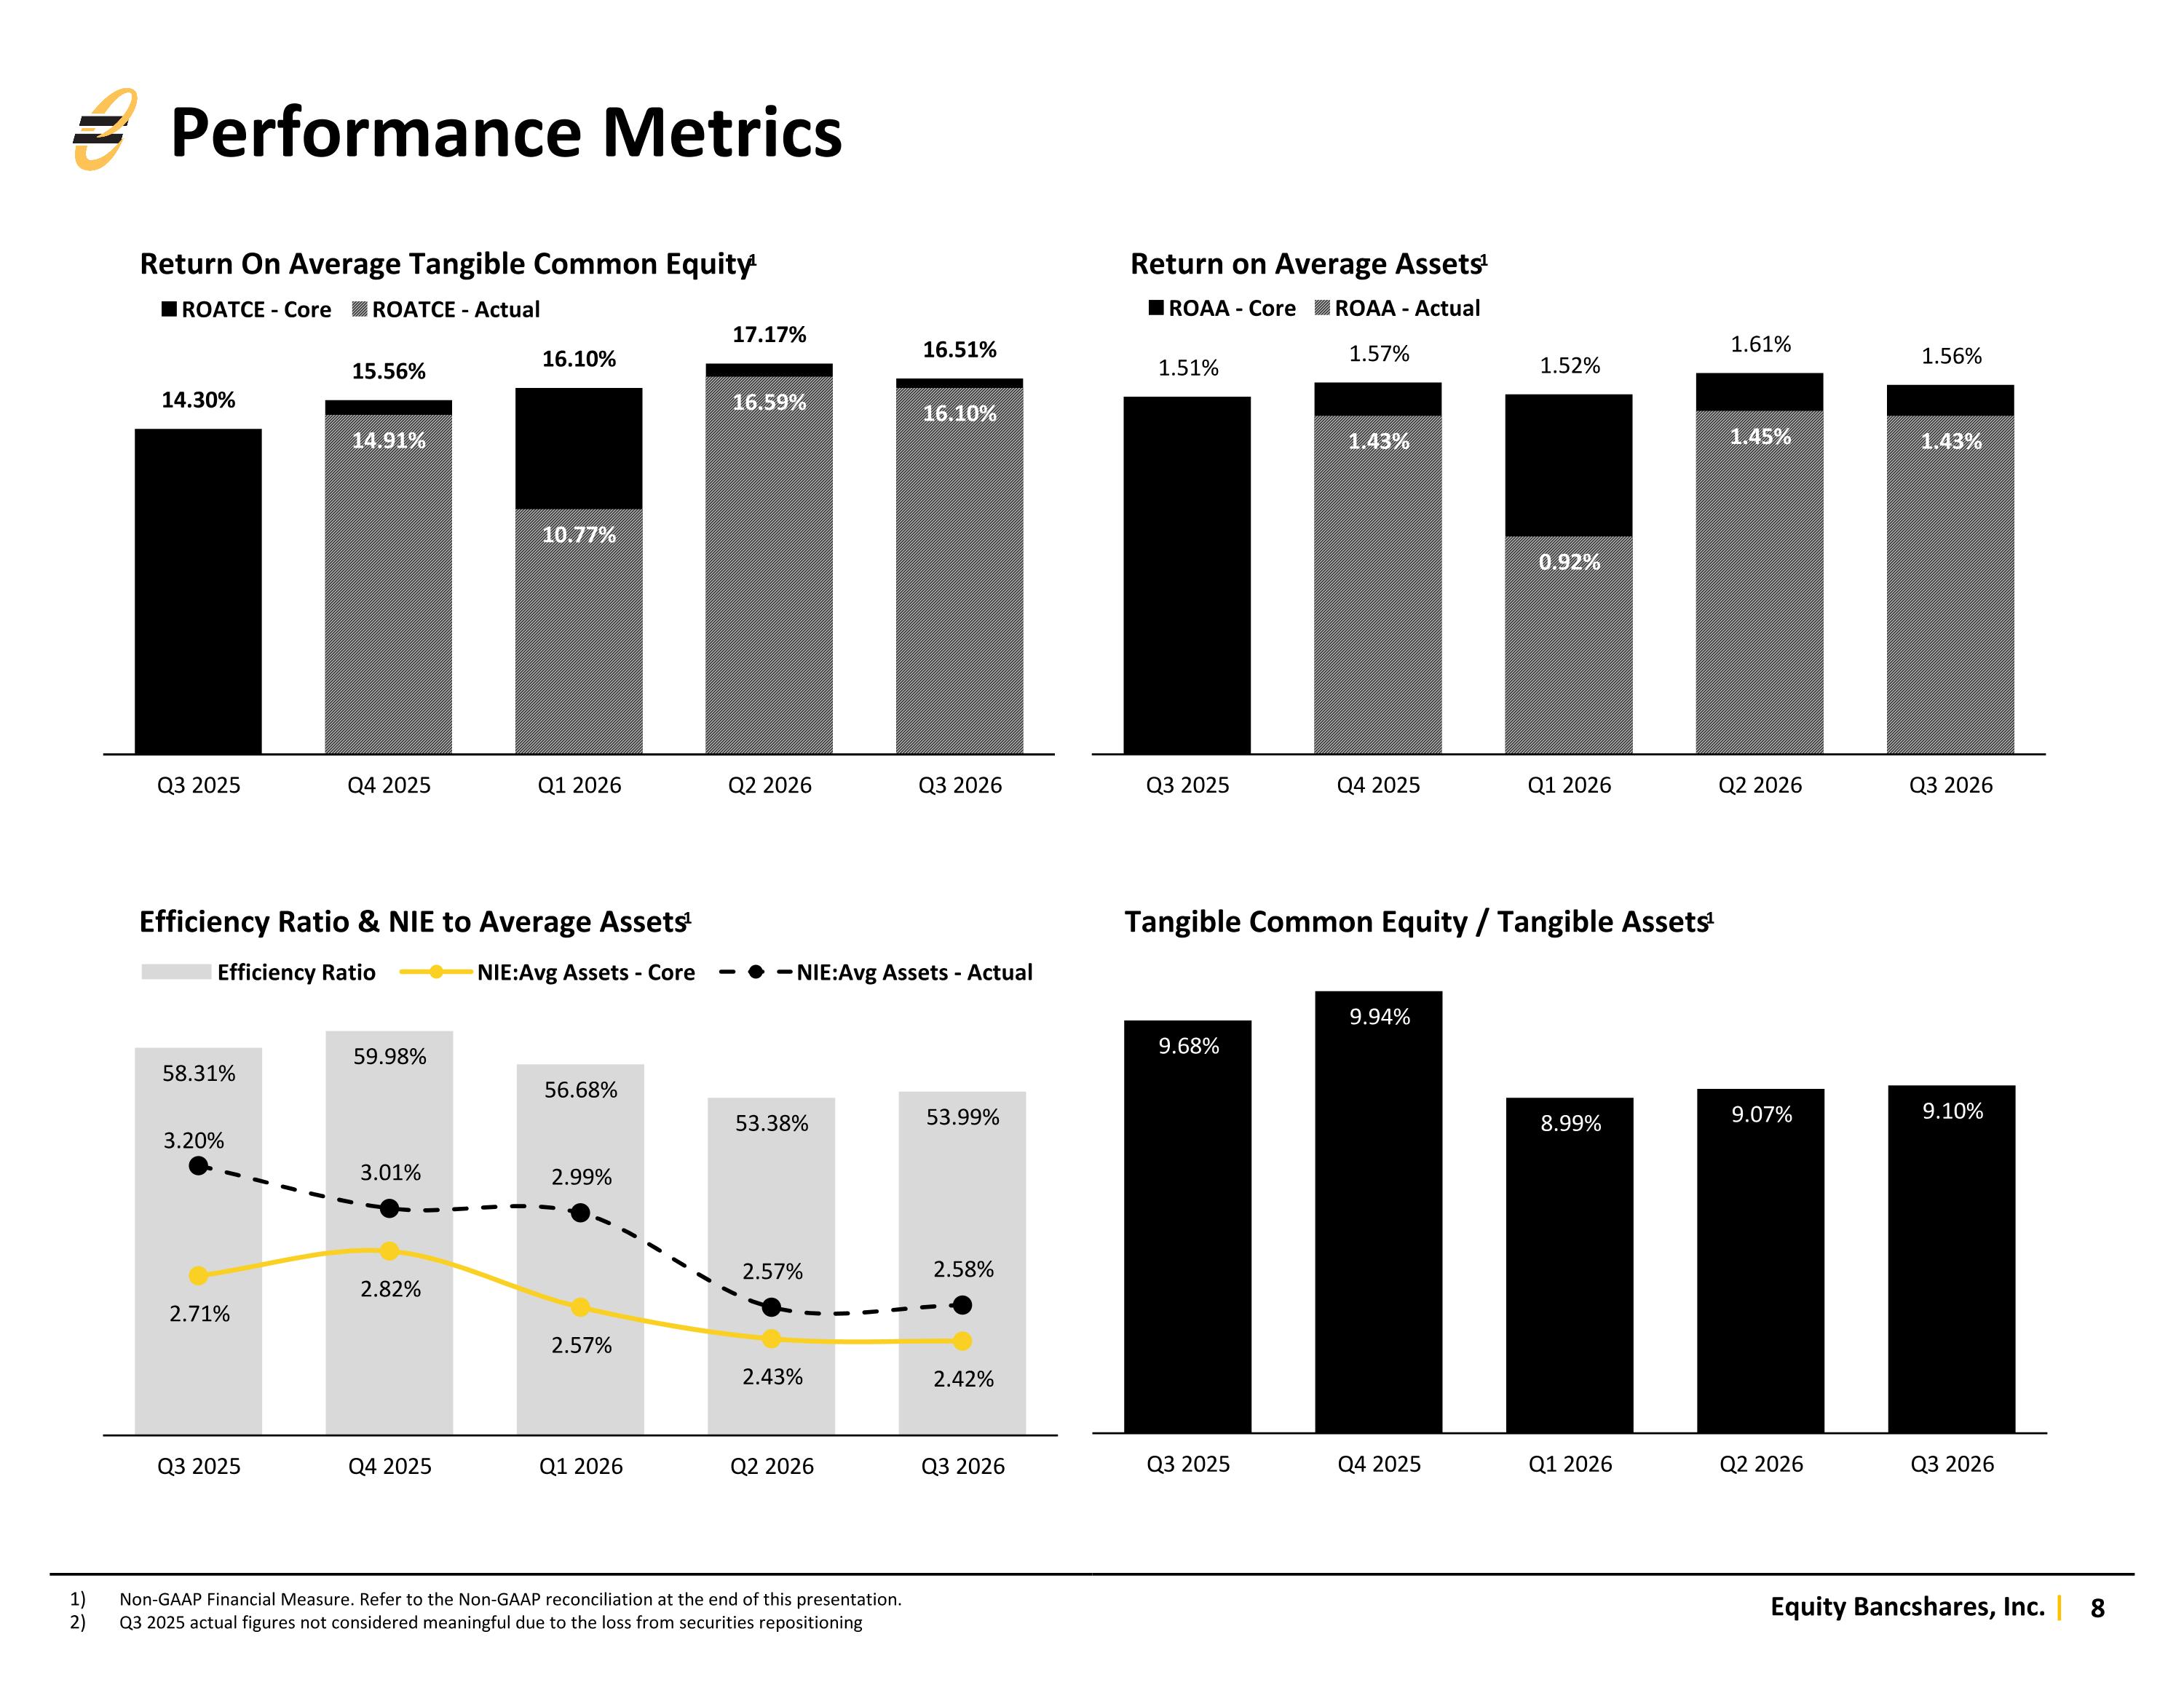
Non-GAAP Financial Measure. Refer to the Non-GAAP reconciliation at the end of this presentation. Q3 2025 actual figures not considered meaningful due to the loss from securities repositioning Return On Average Tangible Common Equity1 Return on Average Assets1 Efficiency Ratio & NIE to Average Assets1 Tangible Common Equity / Tangible Assets1 Performance Metrics
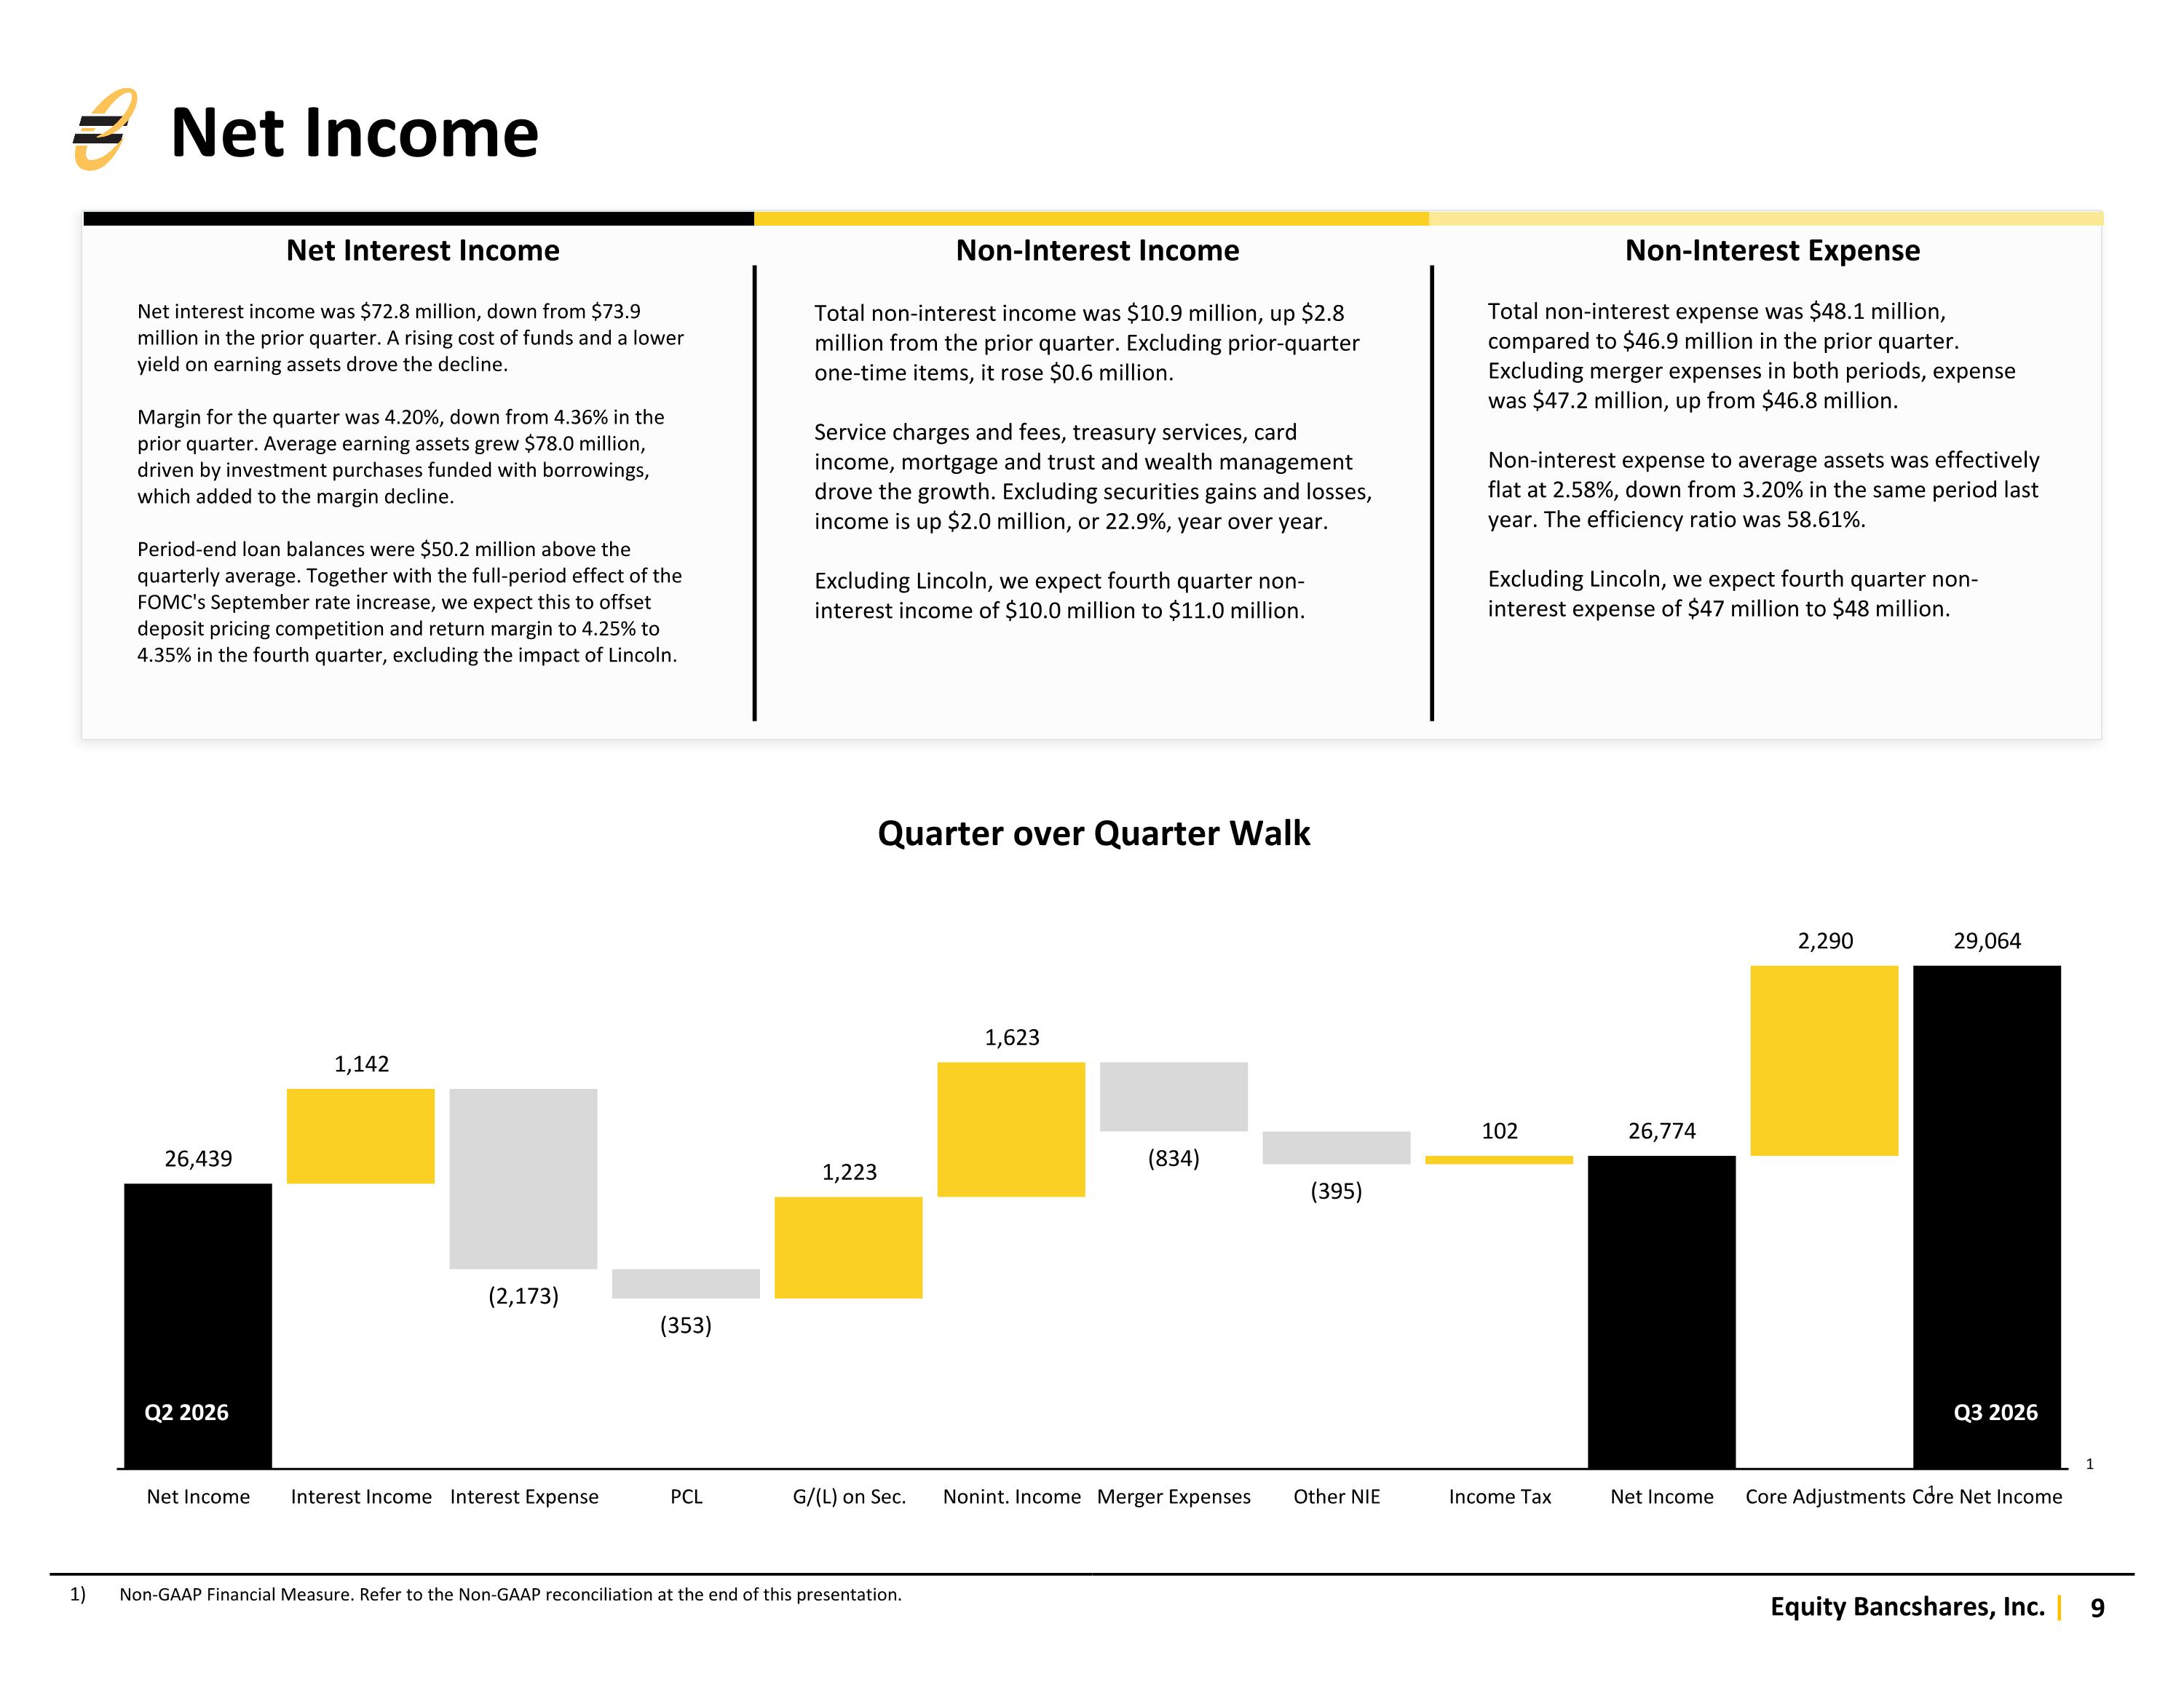
Net Income Non-GAAP Financial Measure. Refer to the Non-GAAP reconciliation at the end of this presentation. 1 Q2 2026 Q3 2026 1 Net interest income was $72.8 million, down from $73.9 million in the prior quarter. A rising cost of funds and a lower yield on earning assets drove the decline. Margin for the quarter was 4.20%, down from 4.36% in the prior quarter. Average earning assets grew $78.0 million, driven by investment purchases funded with borrowings, which added to the margin decline. Period-end loan balances were $50.2 million above the quarterly average. Together with the full-period effect of the FOMC's September rate increase, we expect this to offset deposit pricing competition and return margin to 4.25% to 4.35% in the fourth quarter, excluding the impact of Lincoln. Total non-interest income was $10.9 million, up $2.8 million from the prior quarter. Excluding prior-quarter one-time items, it rose $0.6 million. Service charges and fees, treasury services, card income, mortgage and trust and wealth management drove the growth. Excluding securities gains and losses, income is up $2.0 million, or 22.9%, year over year. Excluding Lincoln, we expect fourth quarter non-interest income of $10.0 million to $11.0 million. Total non-interest expense was $48.1 million, compared to $46.9 million in the prior quarter. Excluding merger expenses in both periods, expense was $47.2 million, up from $46.8 million. Non-interest expense to average assets was effectively flat at 2.58%, down from 3.20% in the same period last year. The efficiency ratio was 58.61%. Excluding Lincoln, we expect fourth quarter non-interest expense of $47 million to $48 million. Net Interest Income Non-Interest Income Non-Interest Expense
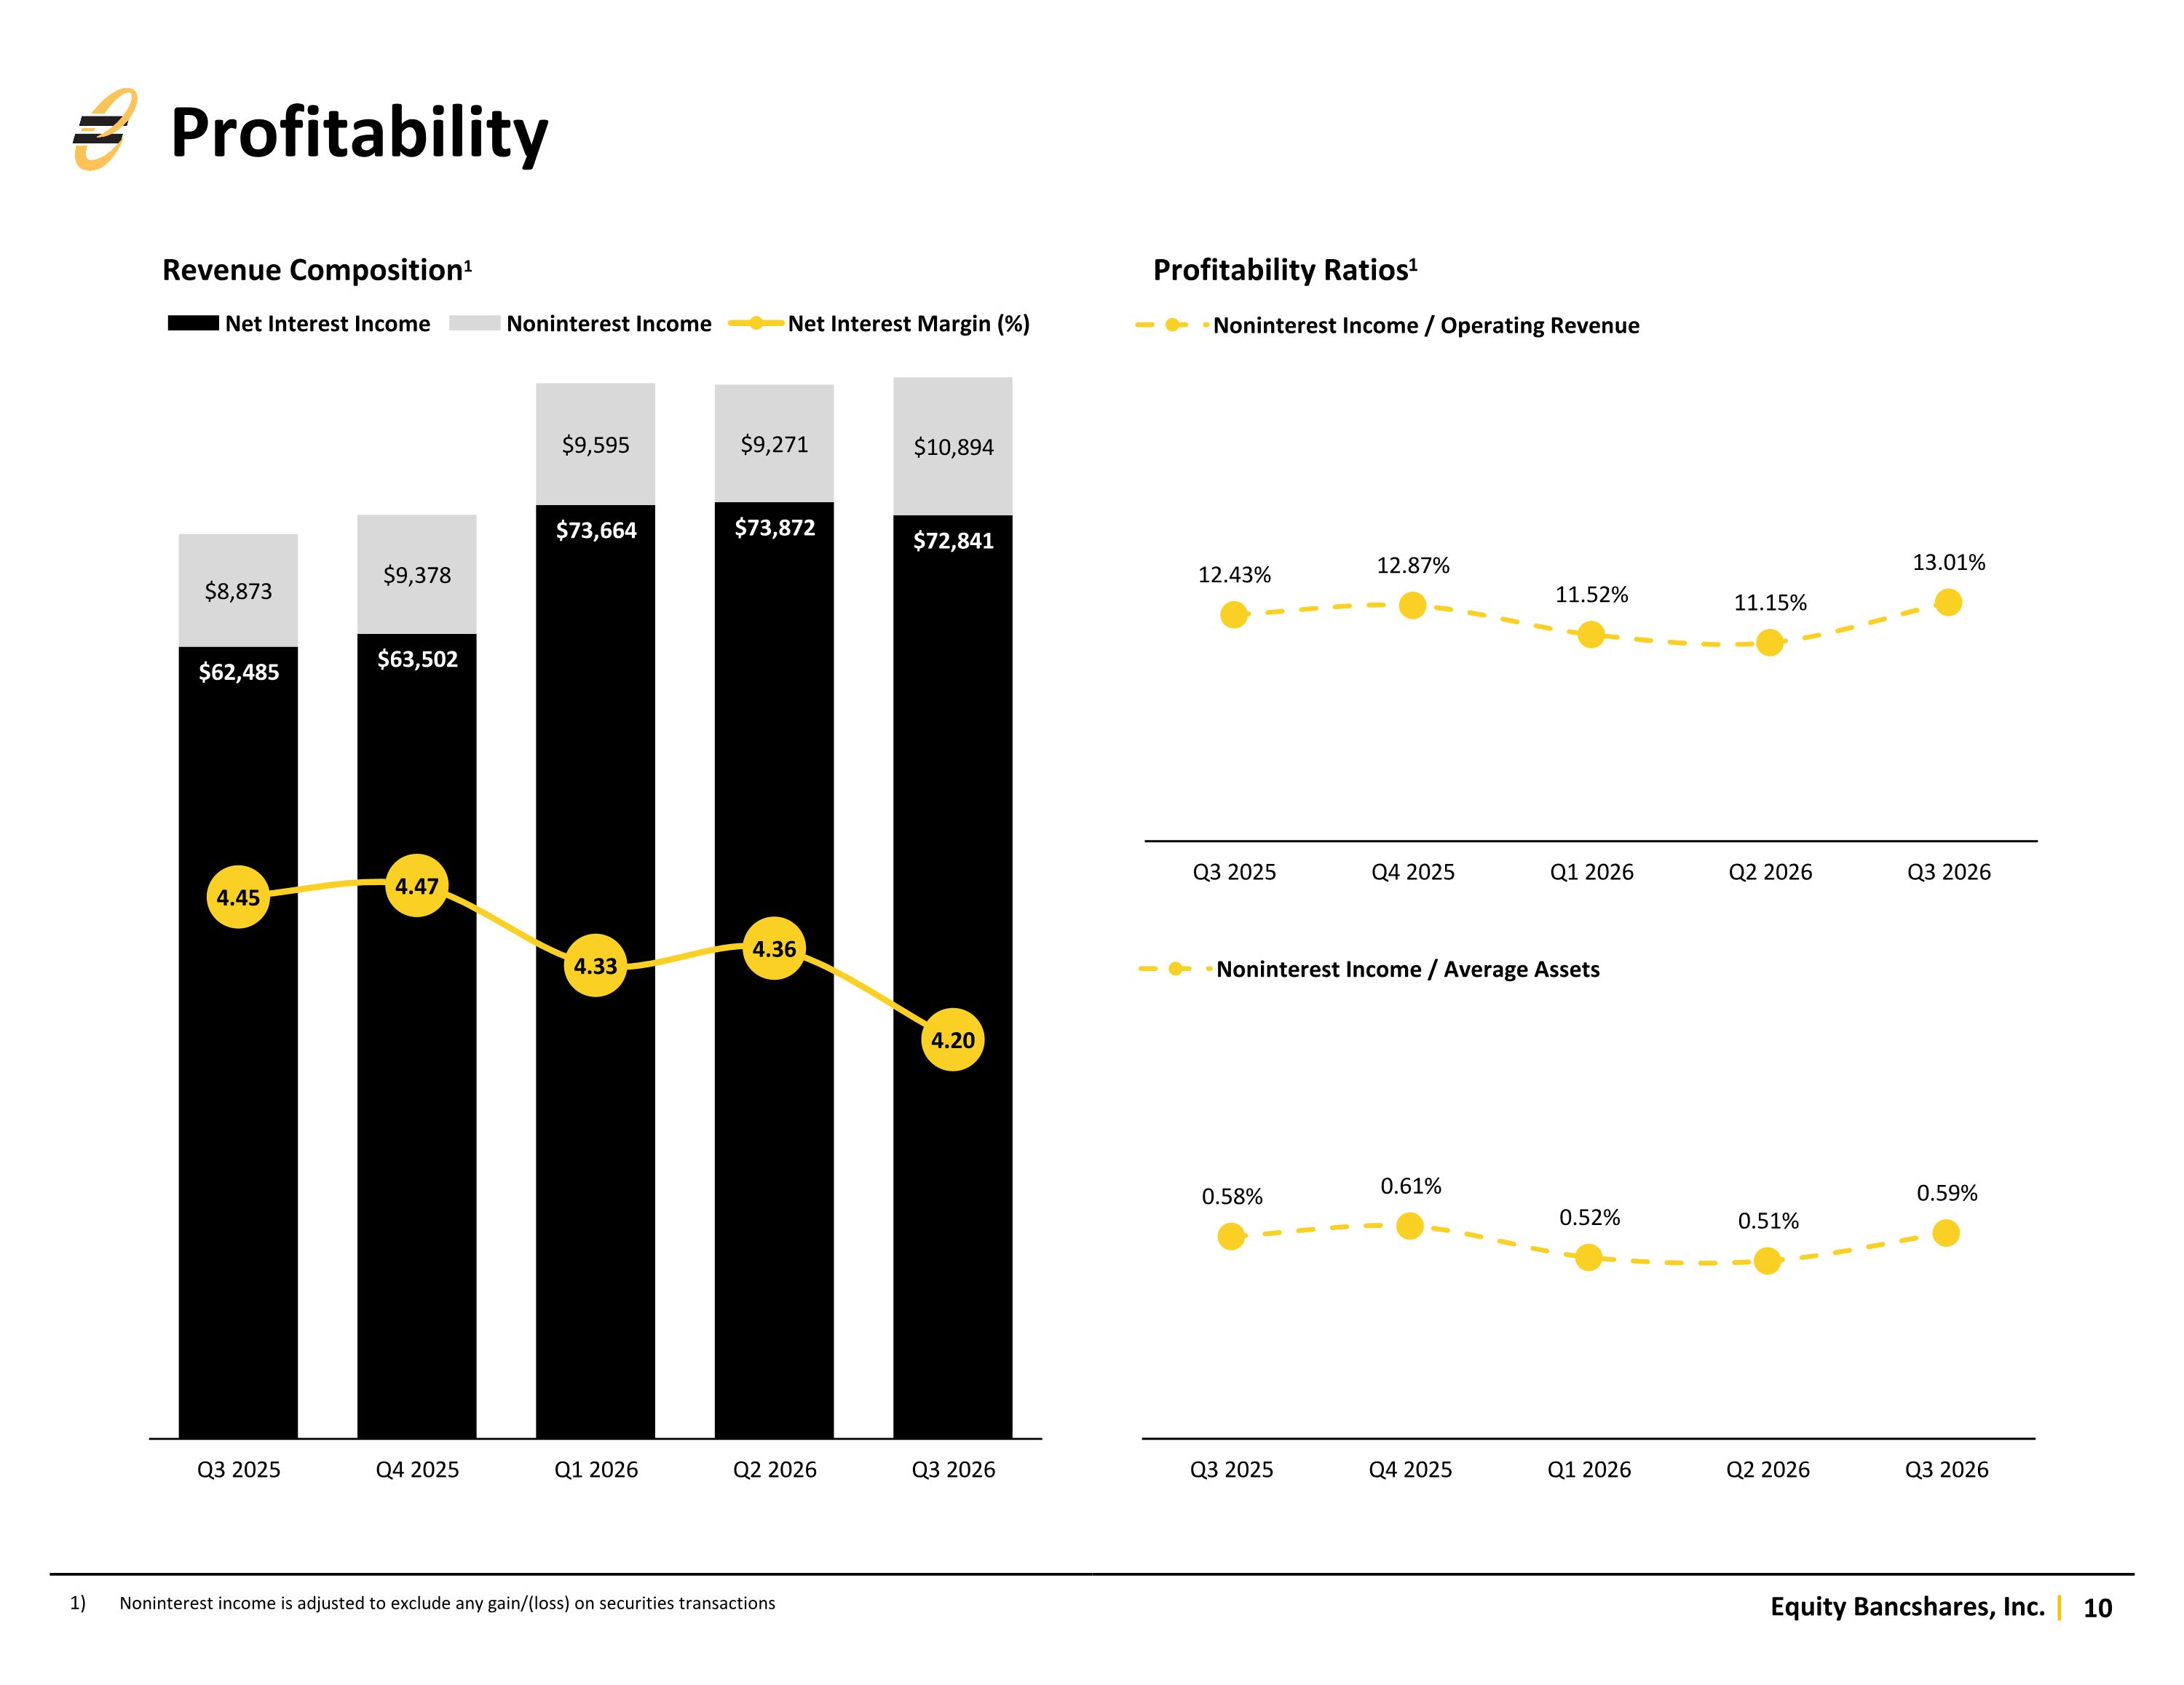
Profitability Noninterest income is adjusted to exclude any gain/(loss) on securities transactions Revenue Composition1 Profitability Ratios1
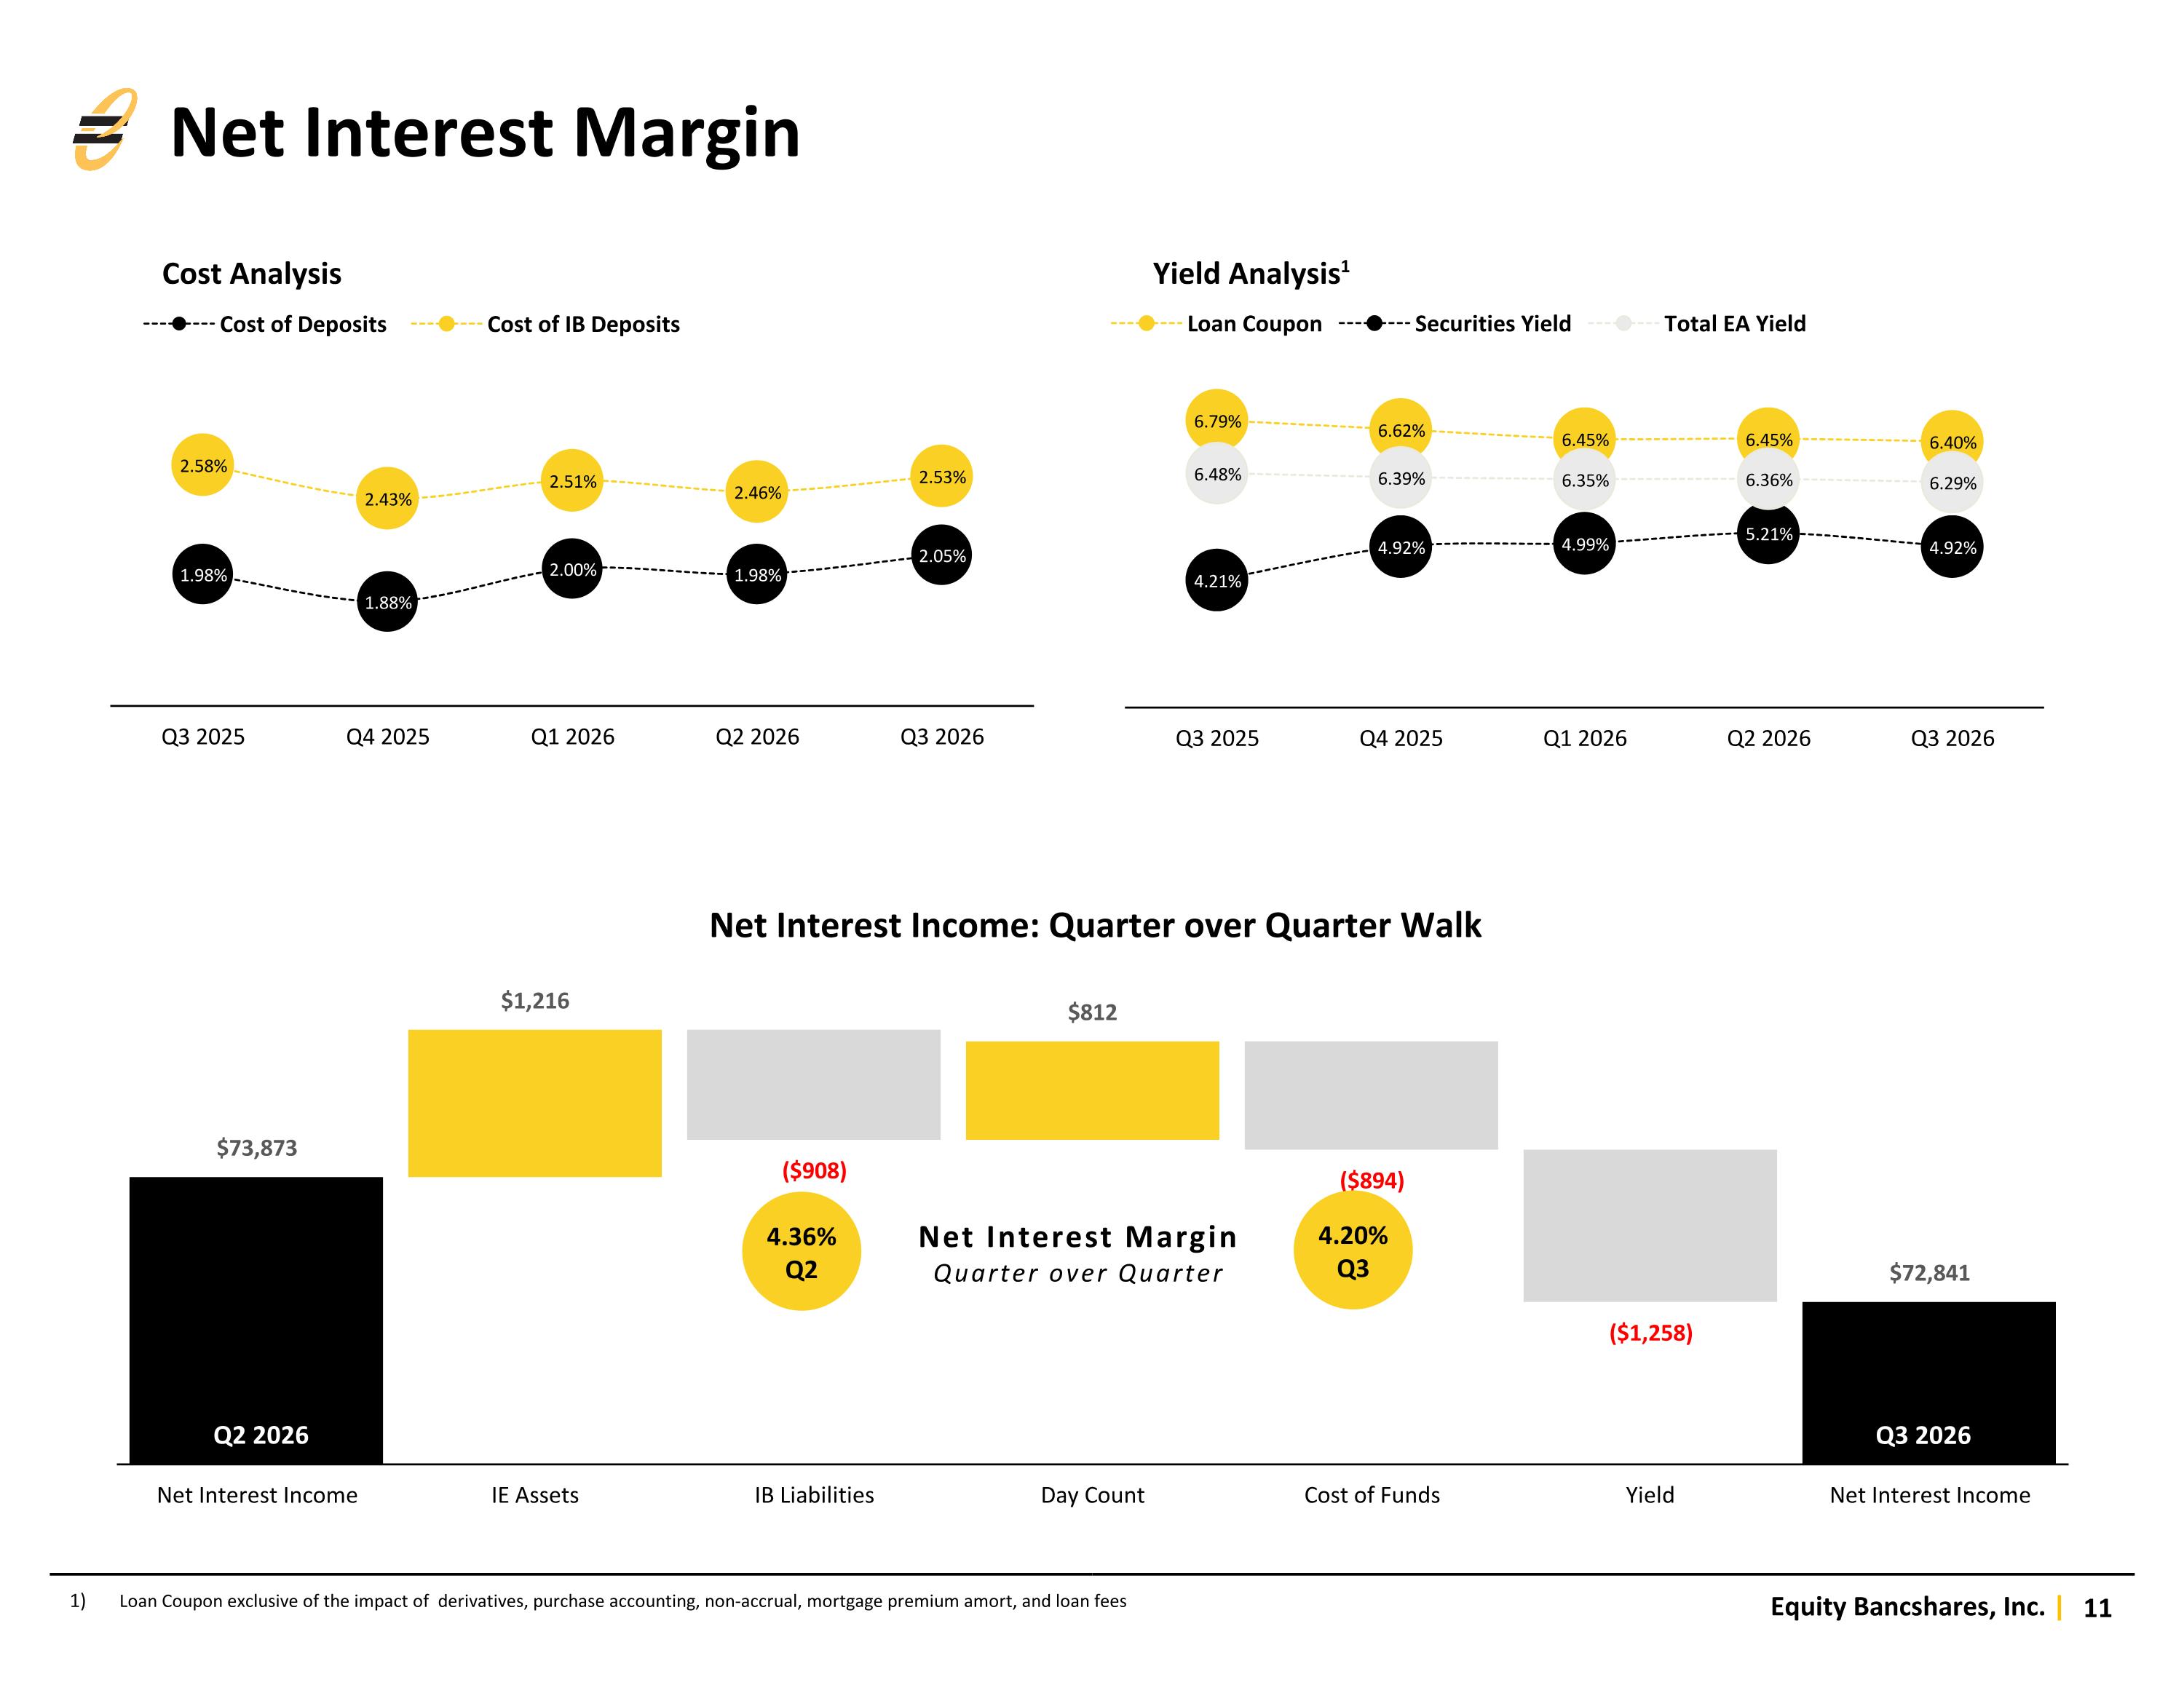
Net Interest Margin Quarter over Quarter Net Interest Margin 4.36% Q2 4.20% Q3 Q2 2026 Q3 2026 Cost Analysis Yield Analysis1 Loan Coupon exclusive of the impact of derivatives, purchase accounting, non-accrual, mortgage premium amort, and loan fees
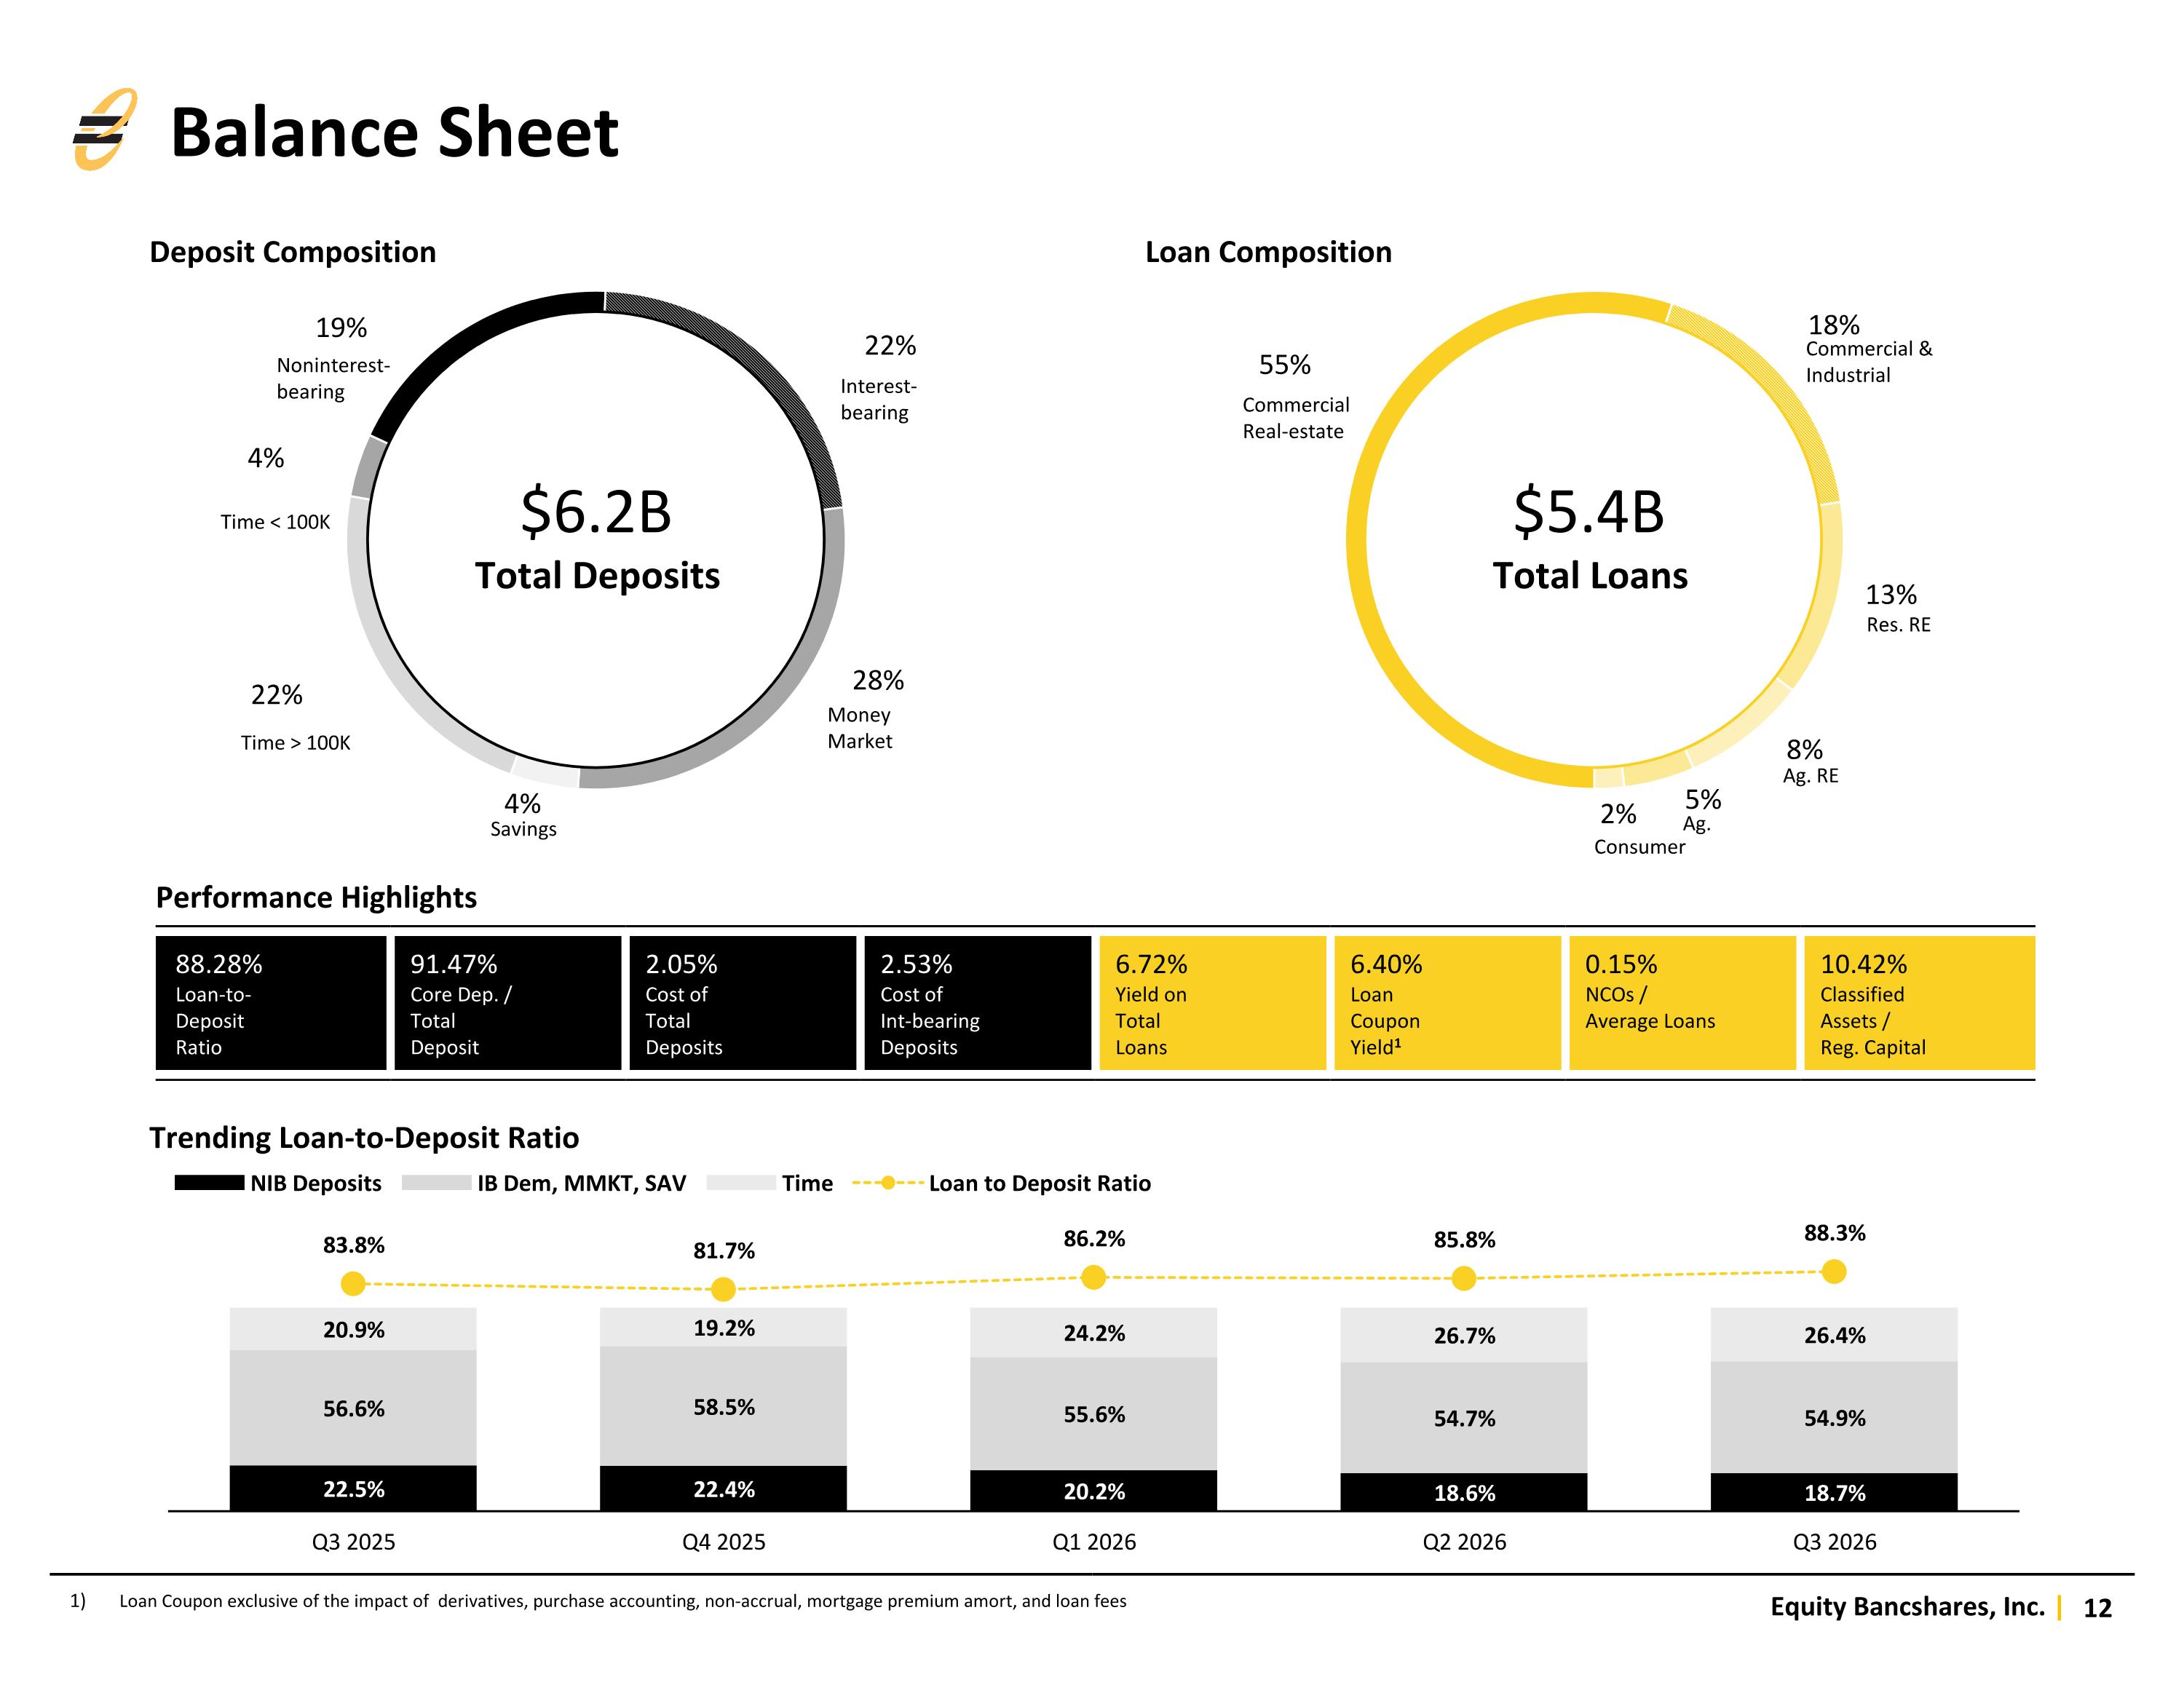
$6.2B Total Deposits Deposit Composition Loan Composition Performance Highlights 88.28% Loan-to- Deposit Ratio 91.47% Core Dep. / Total Deposit 2.05% Cost of Total Deposits 2.53% Cost of Int-bearing Deposits 6.72% Yield on Total Loans 6.40% Loan Coupon Yield1 0.15% NCOs / Average Loans 10.42% Classified Assets / Reg. Capital Balance Sheet Loan Coupon exclusive of the impact of derivatives, purchase accounting, non-accrual, mortgage premium amort, and loan fees Noninterest- bearing Time < 100K Time > 100K Savings Money Market Interest- bearing Commercial Real-estate Commercial & Industrial Res. RE Ag. RE Ag. Consumer Trending Loan-to-Deposit Ratio $5.4B Total Loans
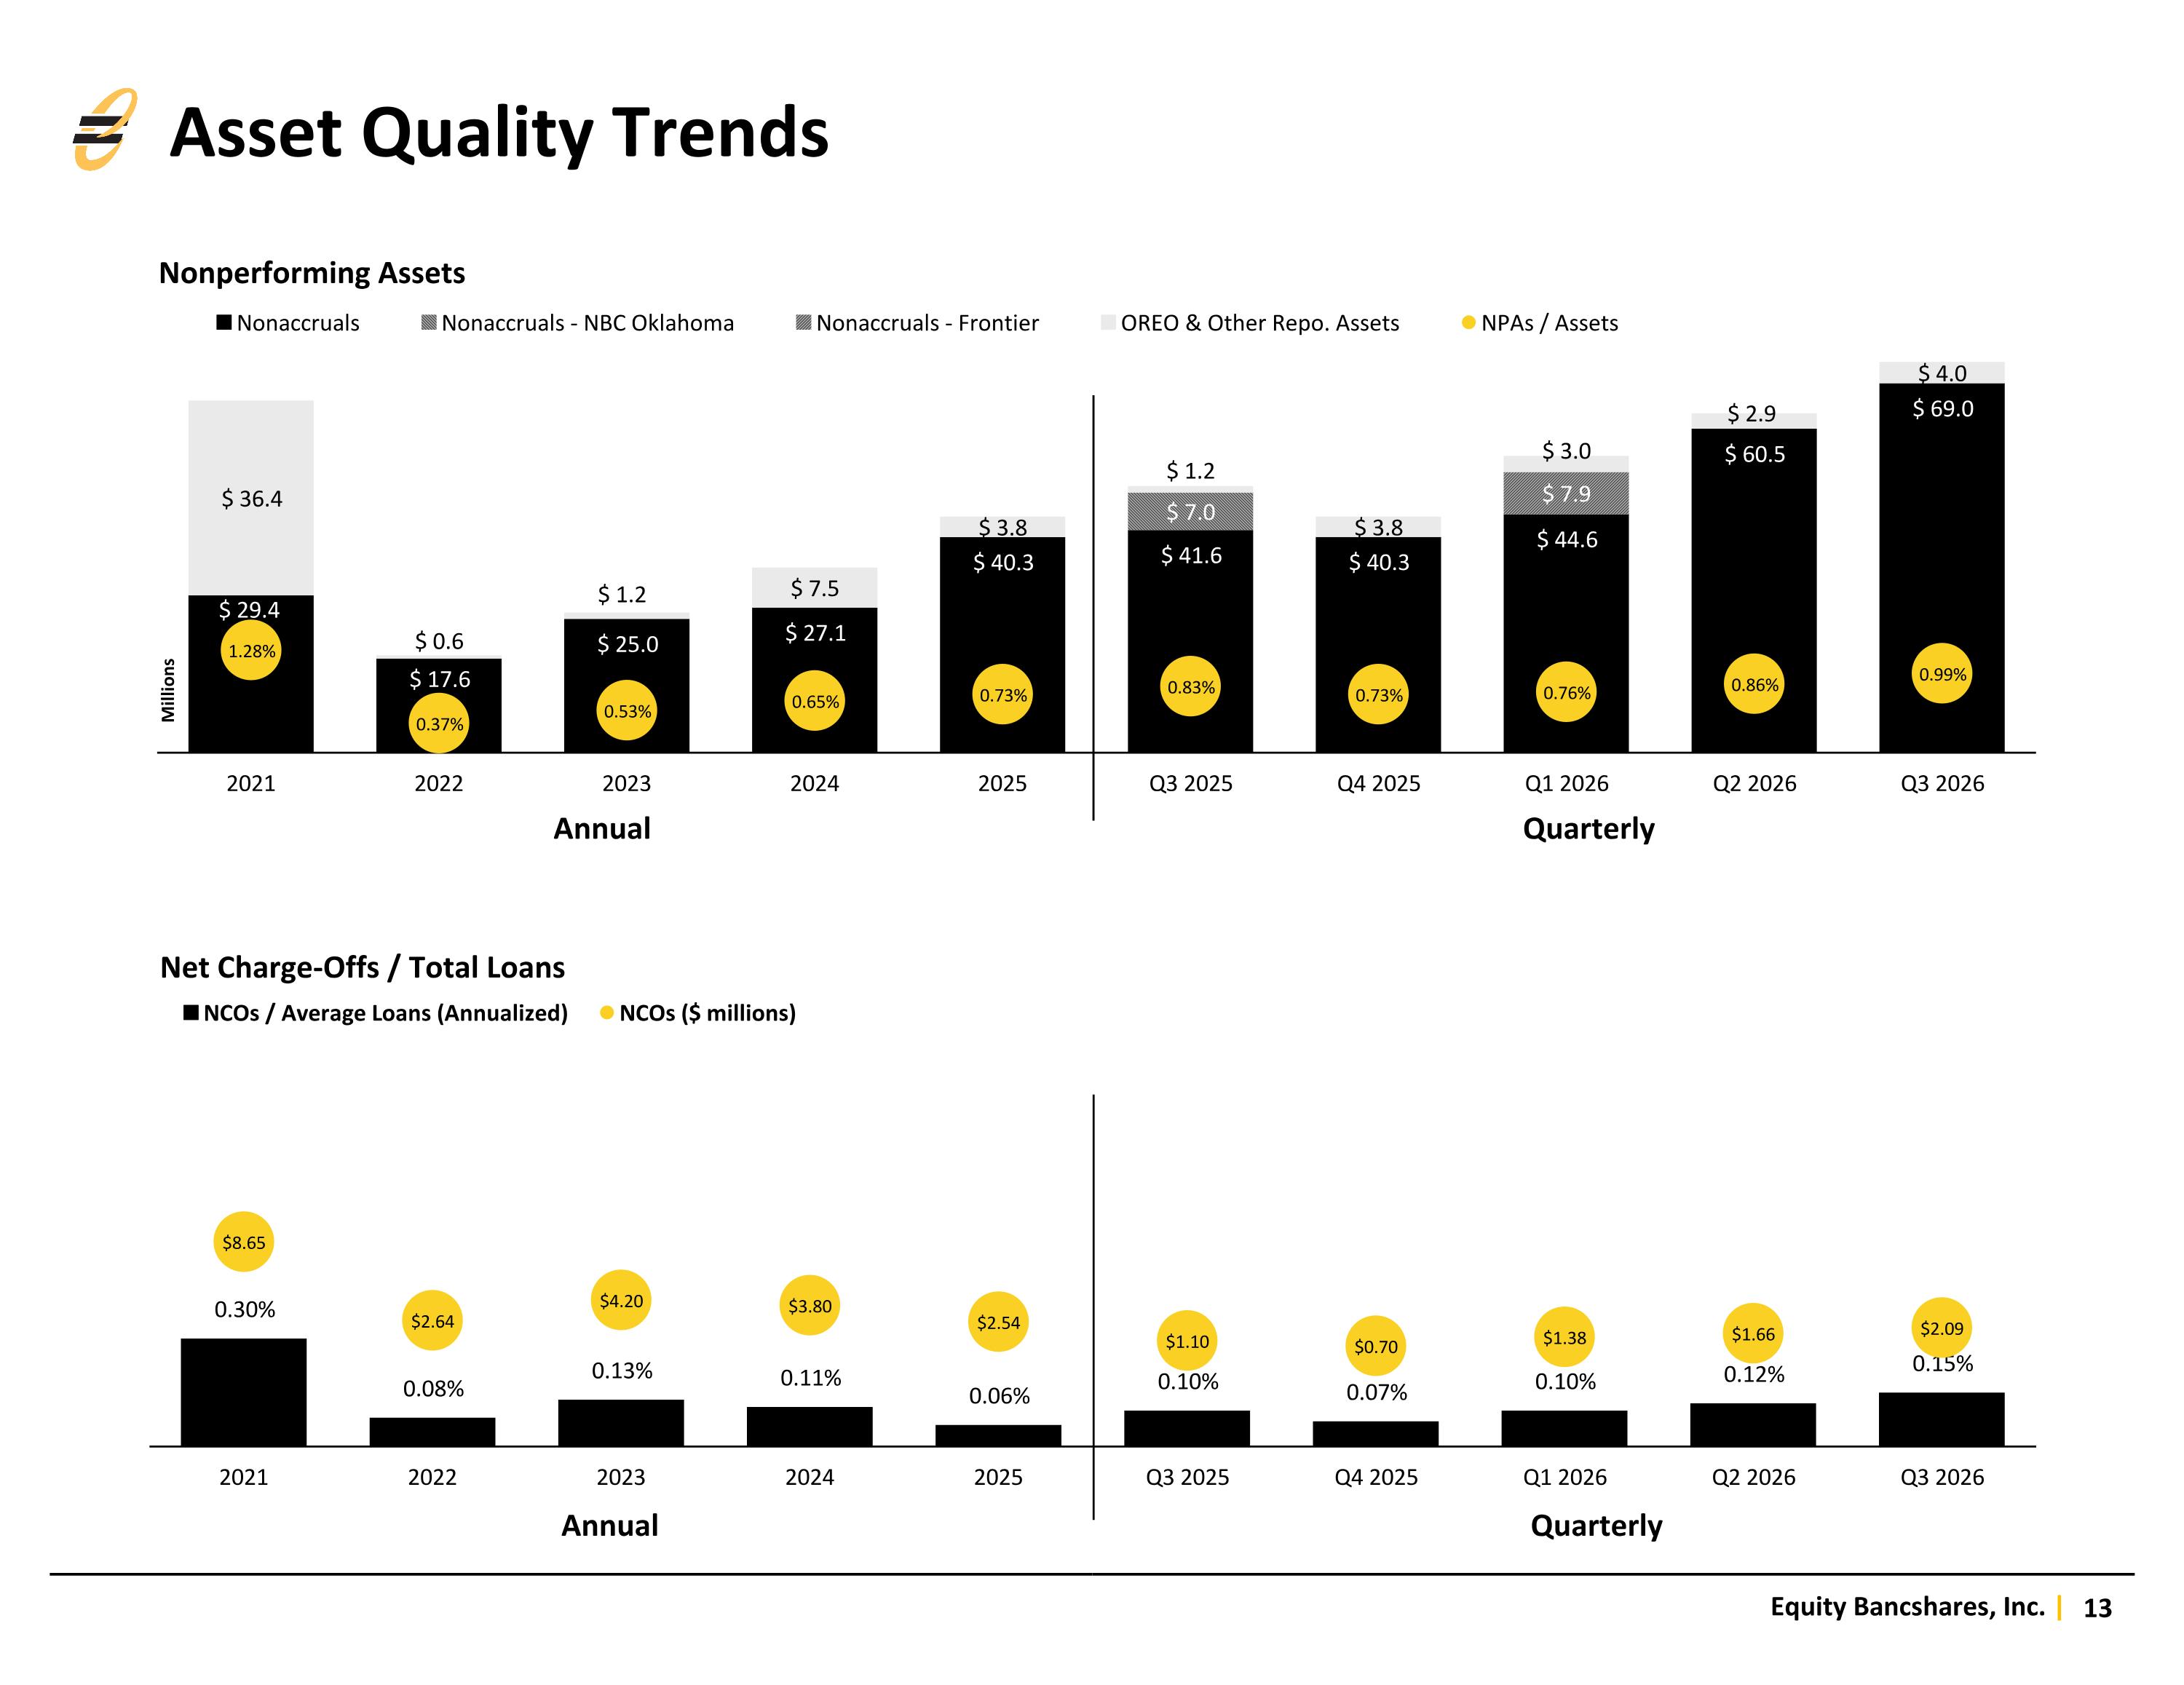
Asset Quality Trends Annual Quarterly Annual Quarterly
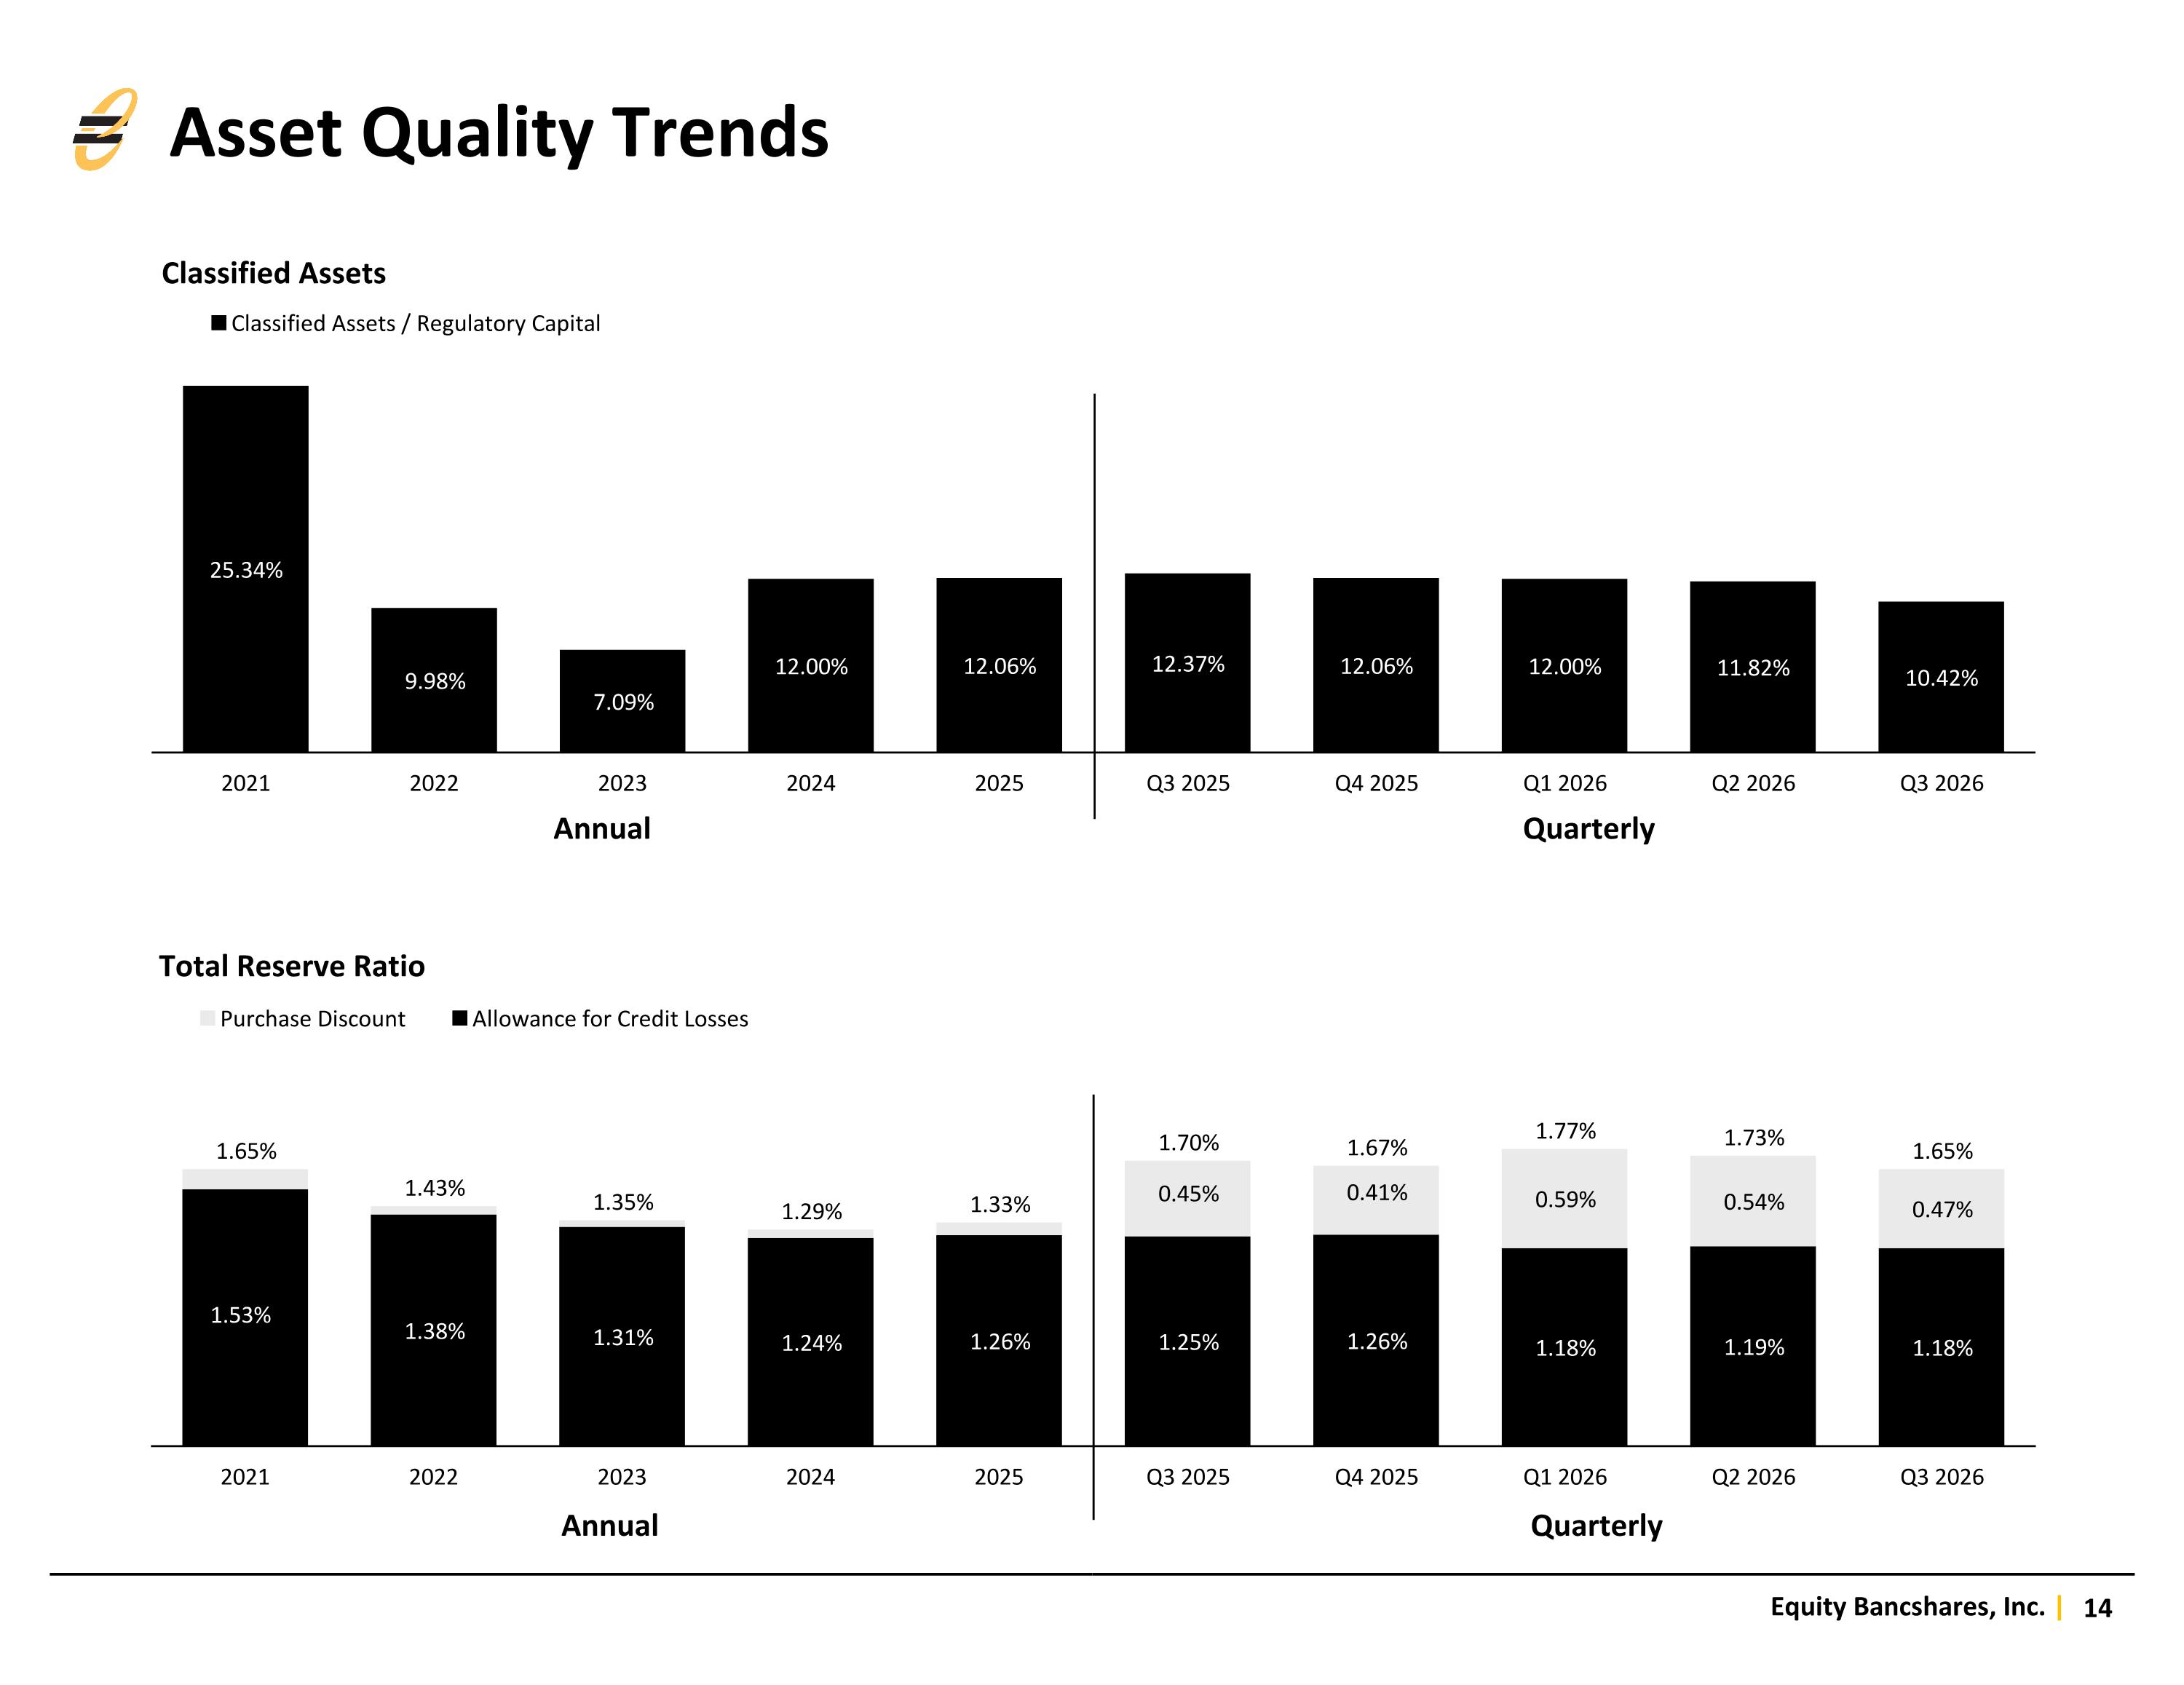
Asset Quality Trends Annual Quarterly Annual Quarterly
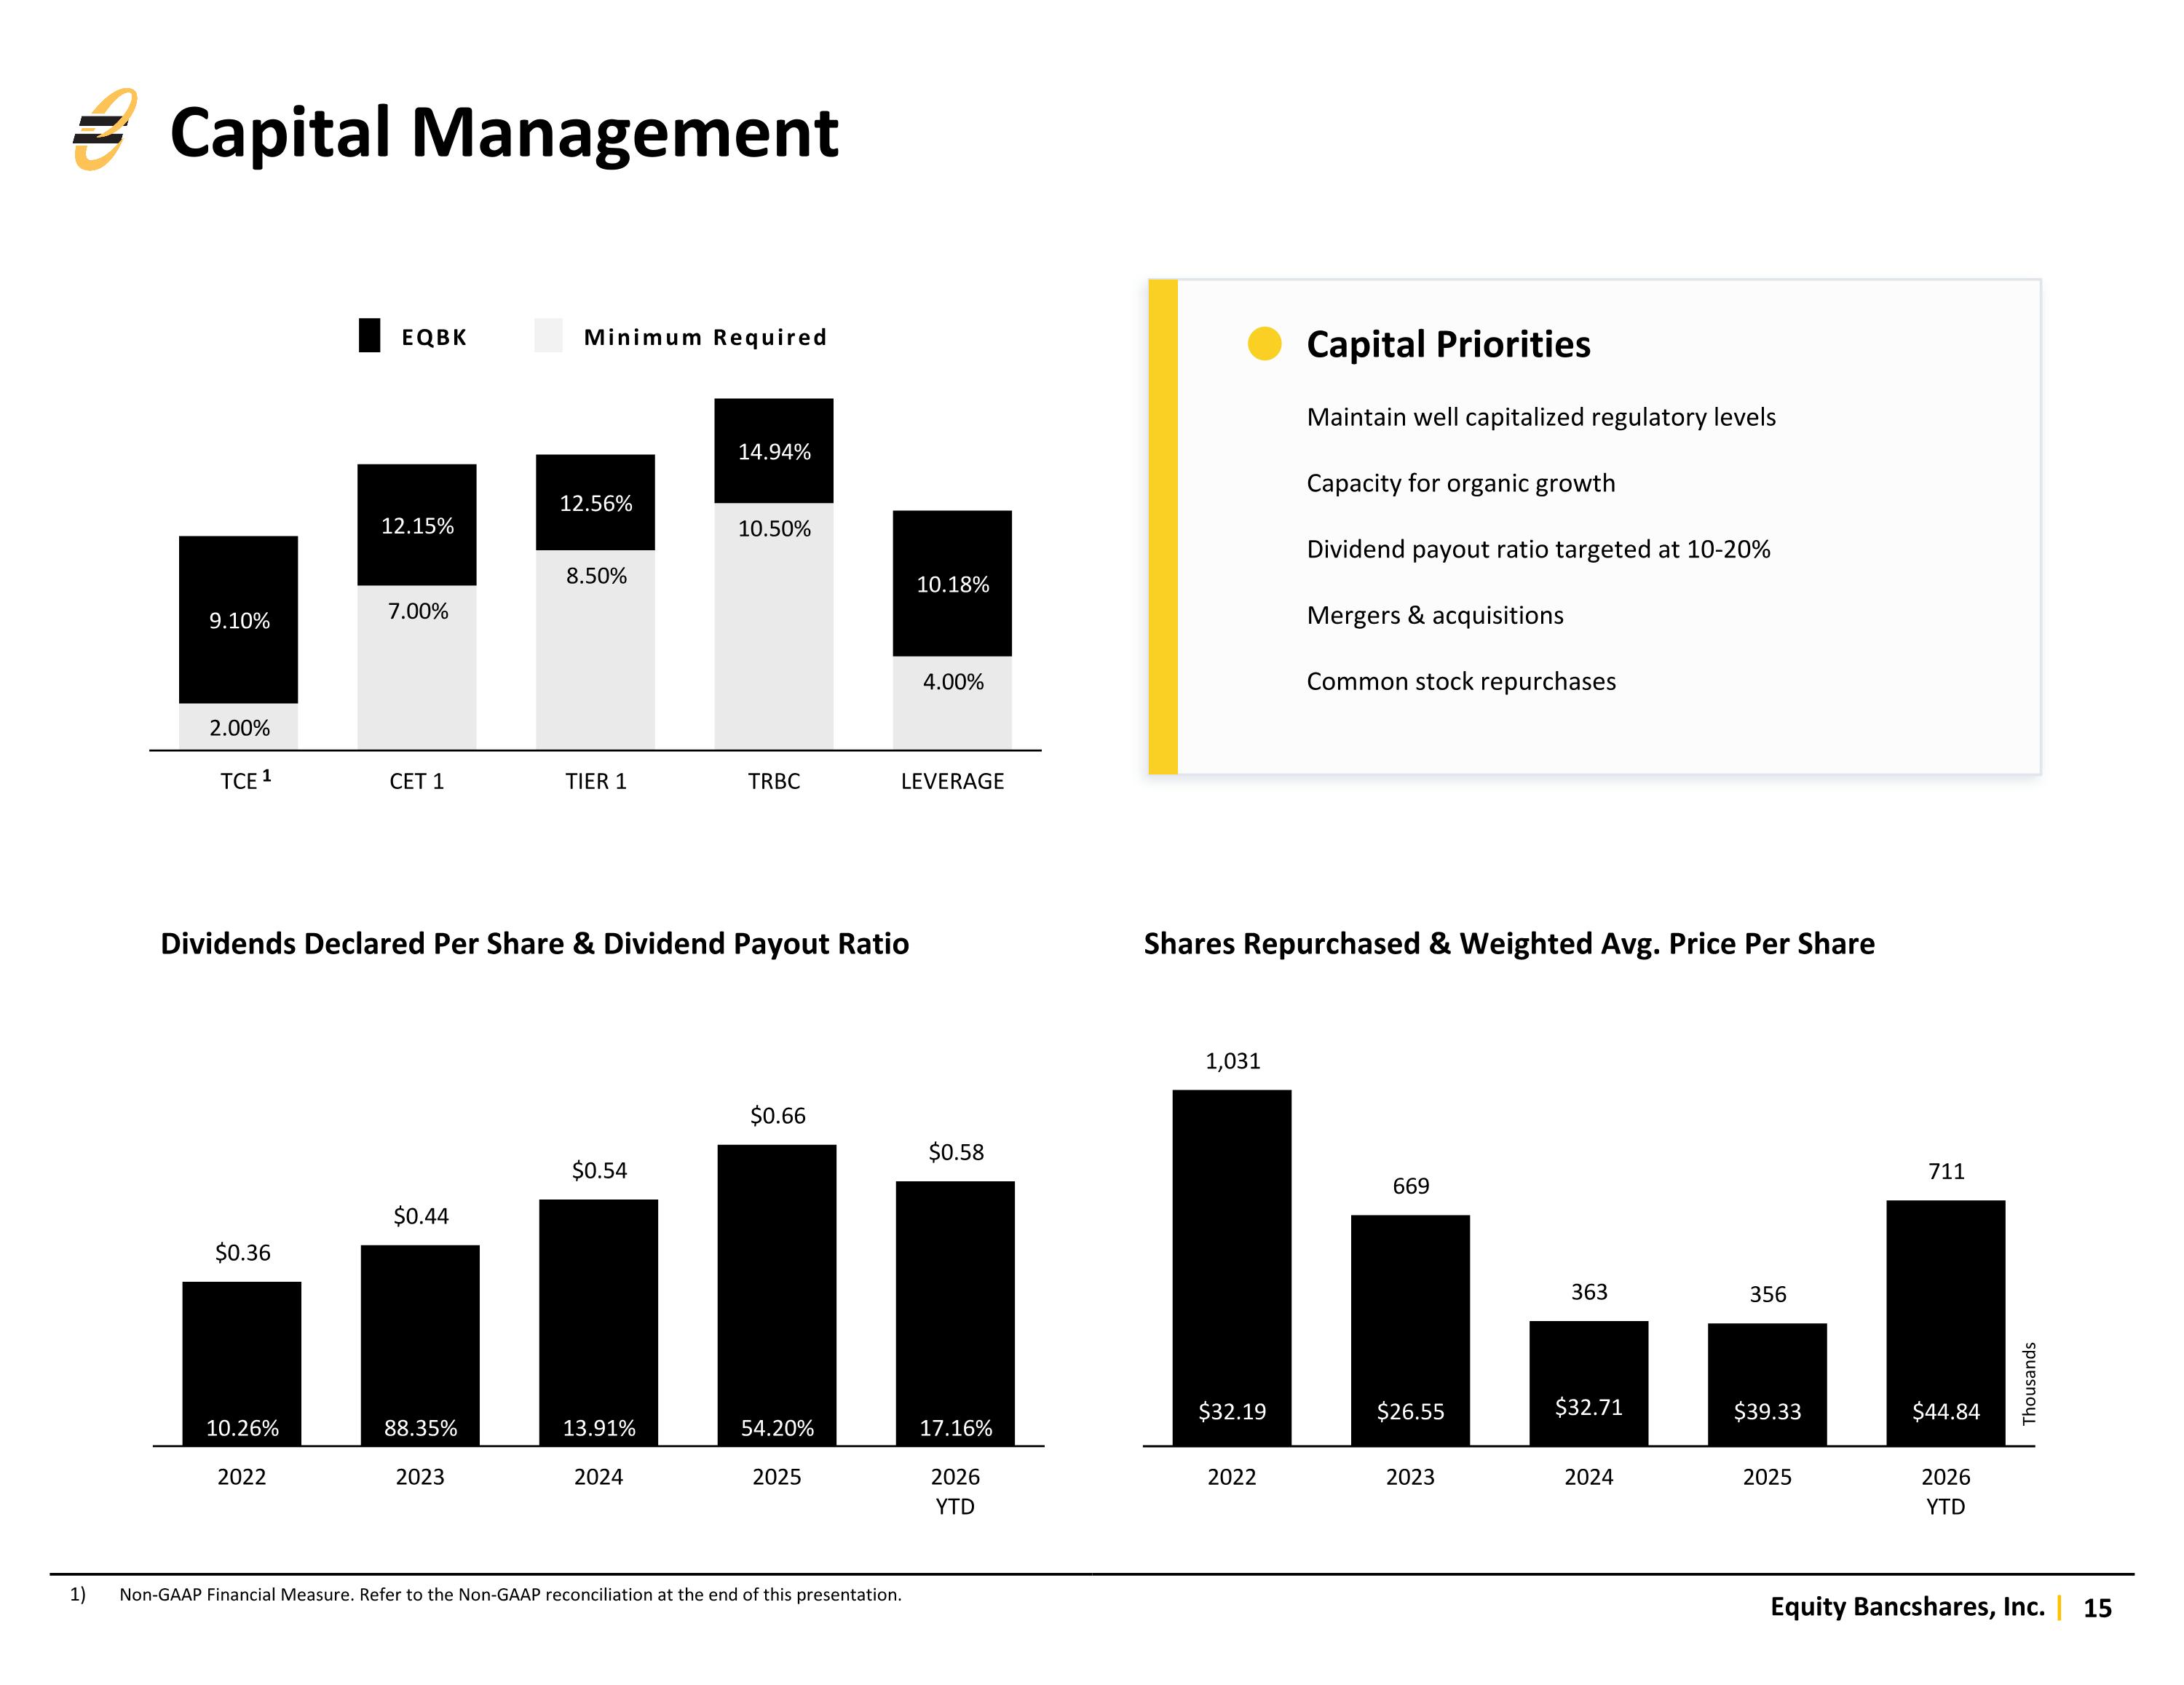
Non-GAAP Financial Measure. Refer to the Non-GAAP reconciliation at the end of this presentation. EQBK Minimum Required Dividends Declared Per Share & Dividend Payout Ratio Shares Repurchased & Weighted Avg. Price Per Share 1 Thousands Capital Priorities Maintain well capitalized regulatory levels Capacity for organic growth Dividend payout ratio targeted at 10-20% Mergers & acquisitions Common stock repurchases Capital Management
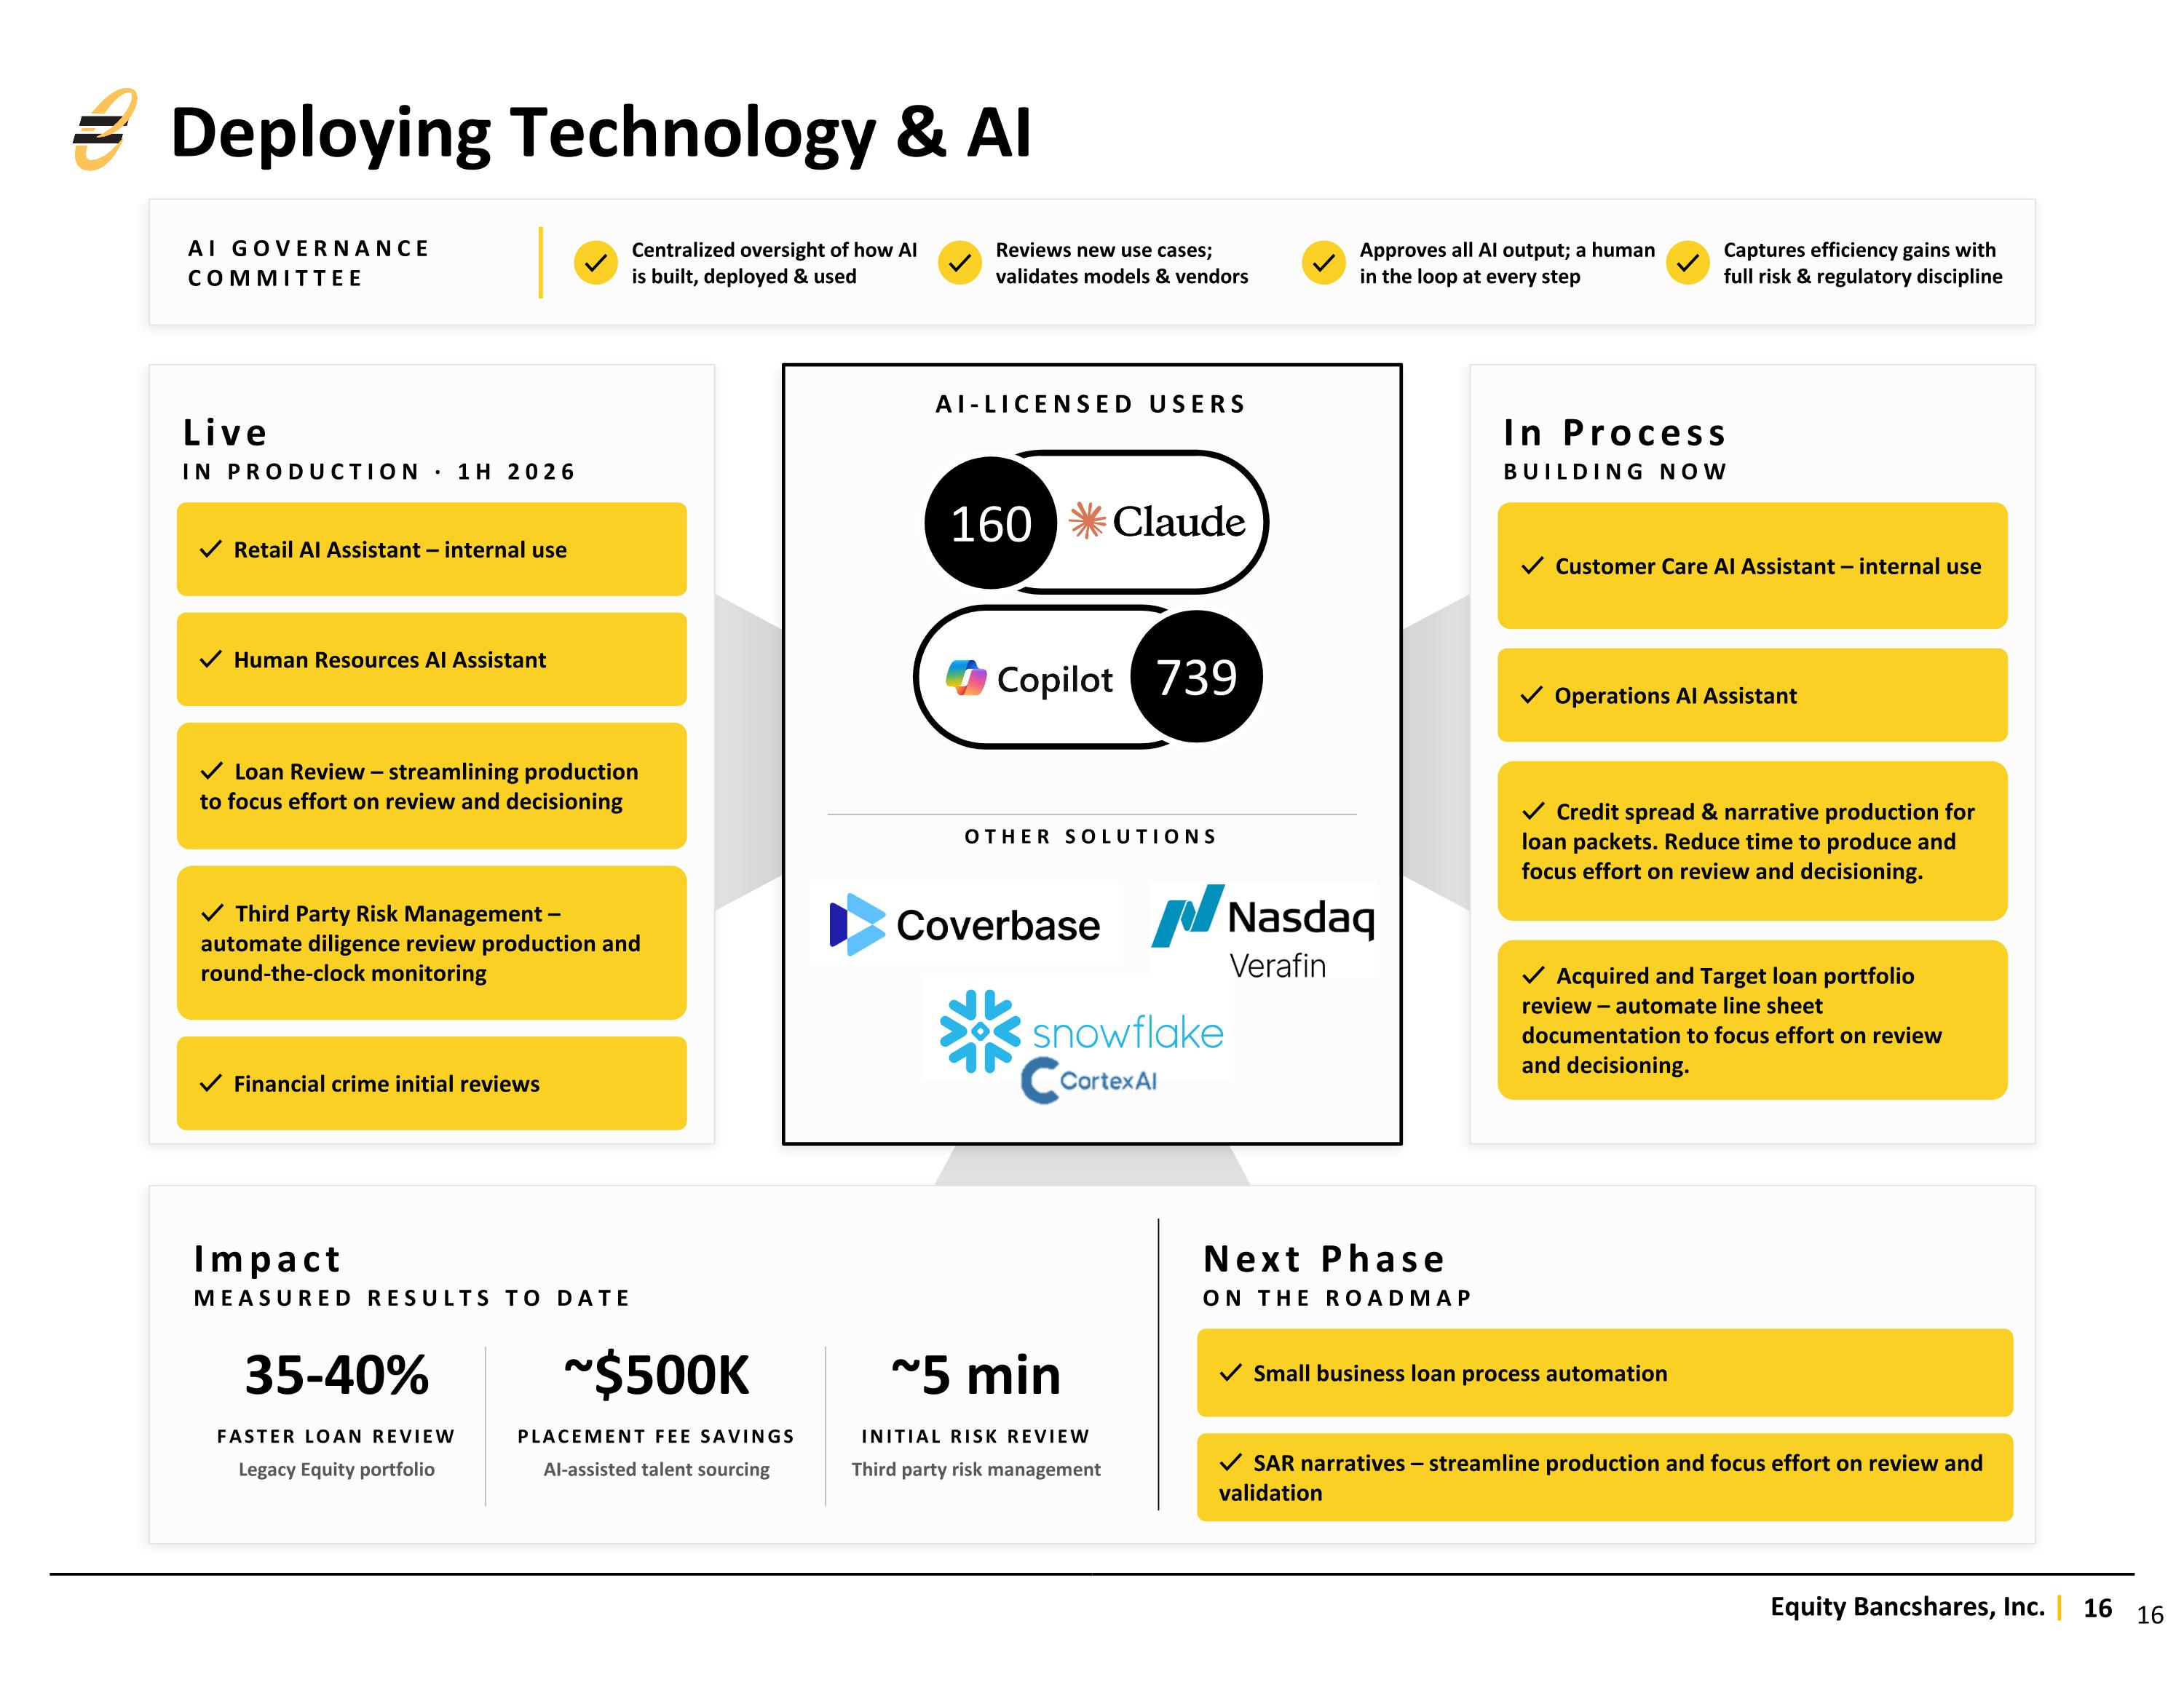
Deploying Technology & AI Live IN PRODUCTION · 1H 2026 ✓ Retail AI Assistant – internal use ✓ Human Resources AI Assistant ✓ Loan Review – streamlining production to focus effort on review and decisioning ✓ Third Party Risk Management – automate diligence review production and round-the-clock monitoring ✓ Financial crime initial reviews In Process BUILDING NOW ✓ Customer Care AI Assistant – internal use ✓ Operations AI Assistant ✓ Credit spread & narrative production for loan packets. Reduce time to produce and focus effort on review and decisioning. ✓ Acquired and Target loan portfolio review – automate line sheet documentation to focus effort on review and decisioning. AI-LICENSED USERS OTHER SOLUTIONS Next Phase ON THE ROADMAP ✓ Small business loan process automation ✓ SAR narratives – streamline production and focus effort on review and validation 160 739 AI GOVERNANCE COMMITTEE ✓ Centralized oversight of how AI is built, deployed & used ✓ Reviews new use cases; validates models & vendors ✓ Approves all AI output; a human in the loop at every step ✓ Captures efficiency gains with full risk & regulatory discipline Impact MEASURED RESULTS TO DATE 35-40% FASTER LOAN REVIEW Legacy Equity portfolio ~$500K PLACEMENT FEE SAVINGS AI-assisted talent sourcing ~5 min INITIAL RISK REVIEW Third party risk management
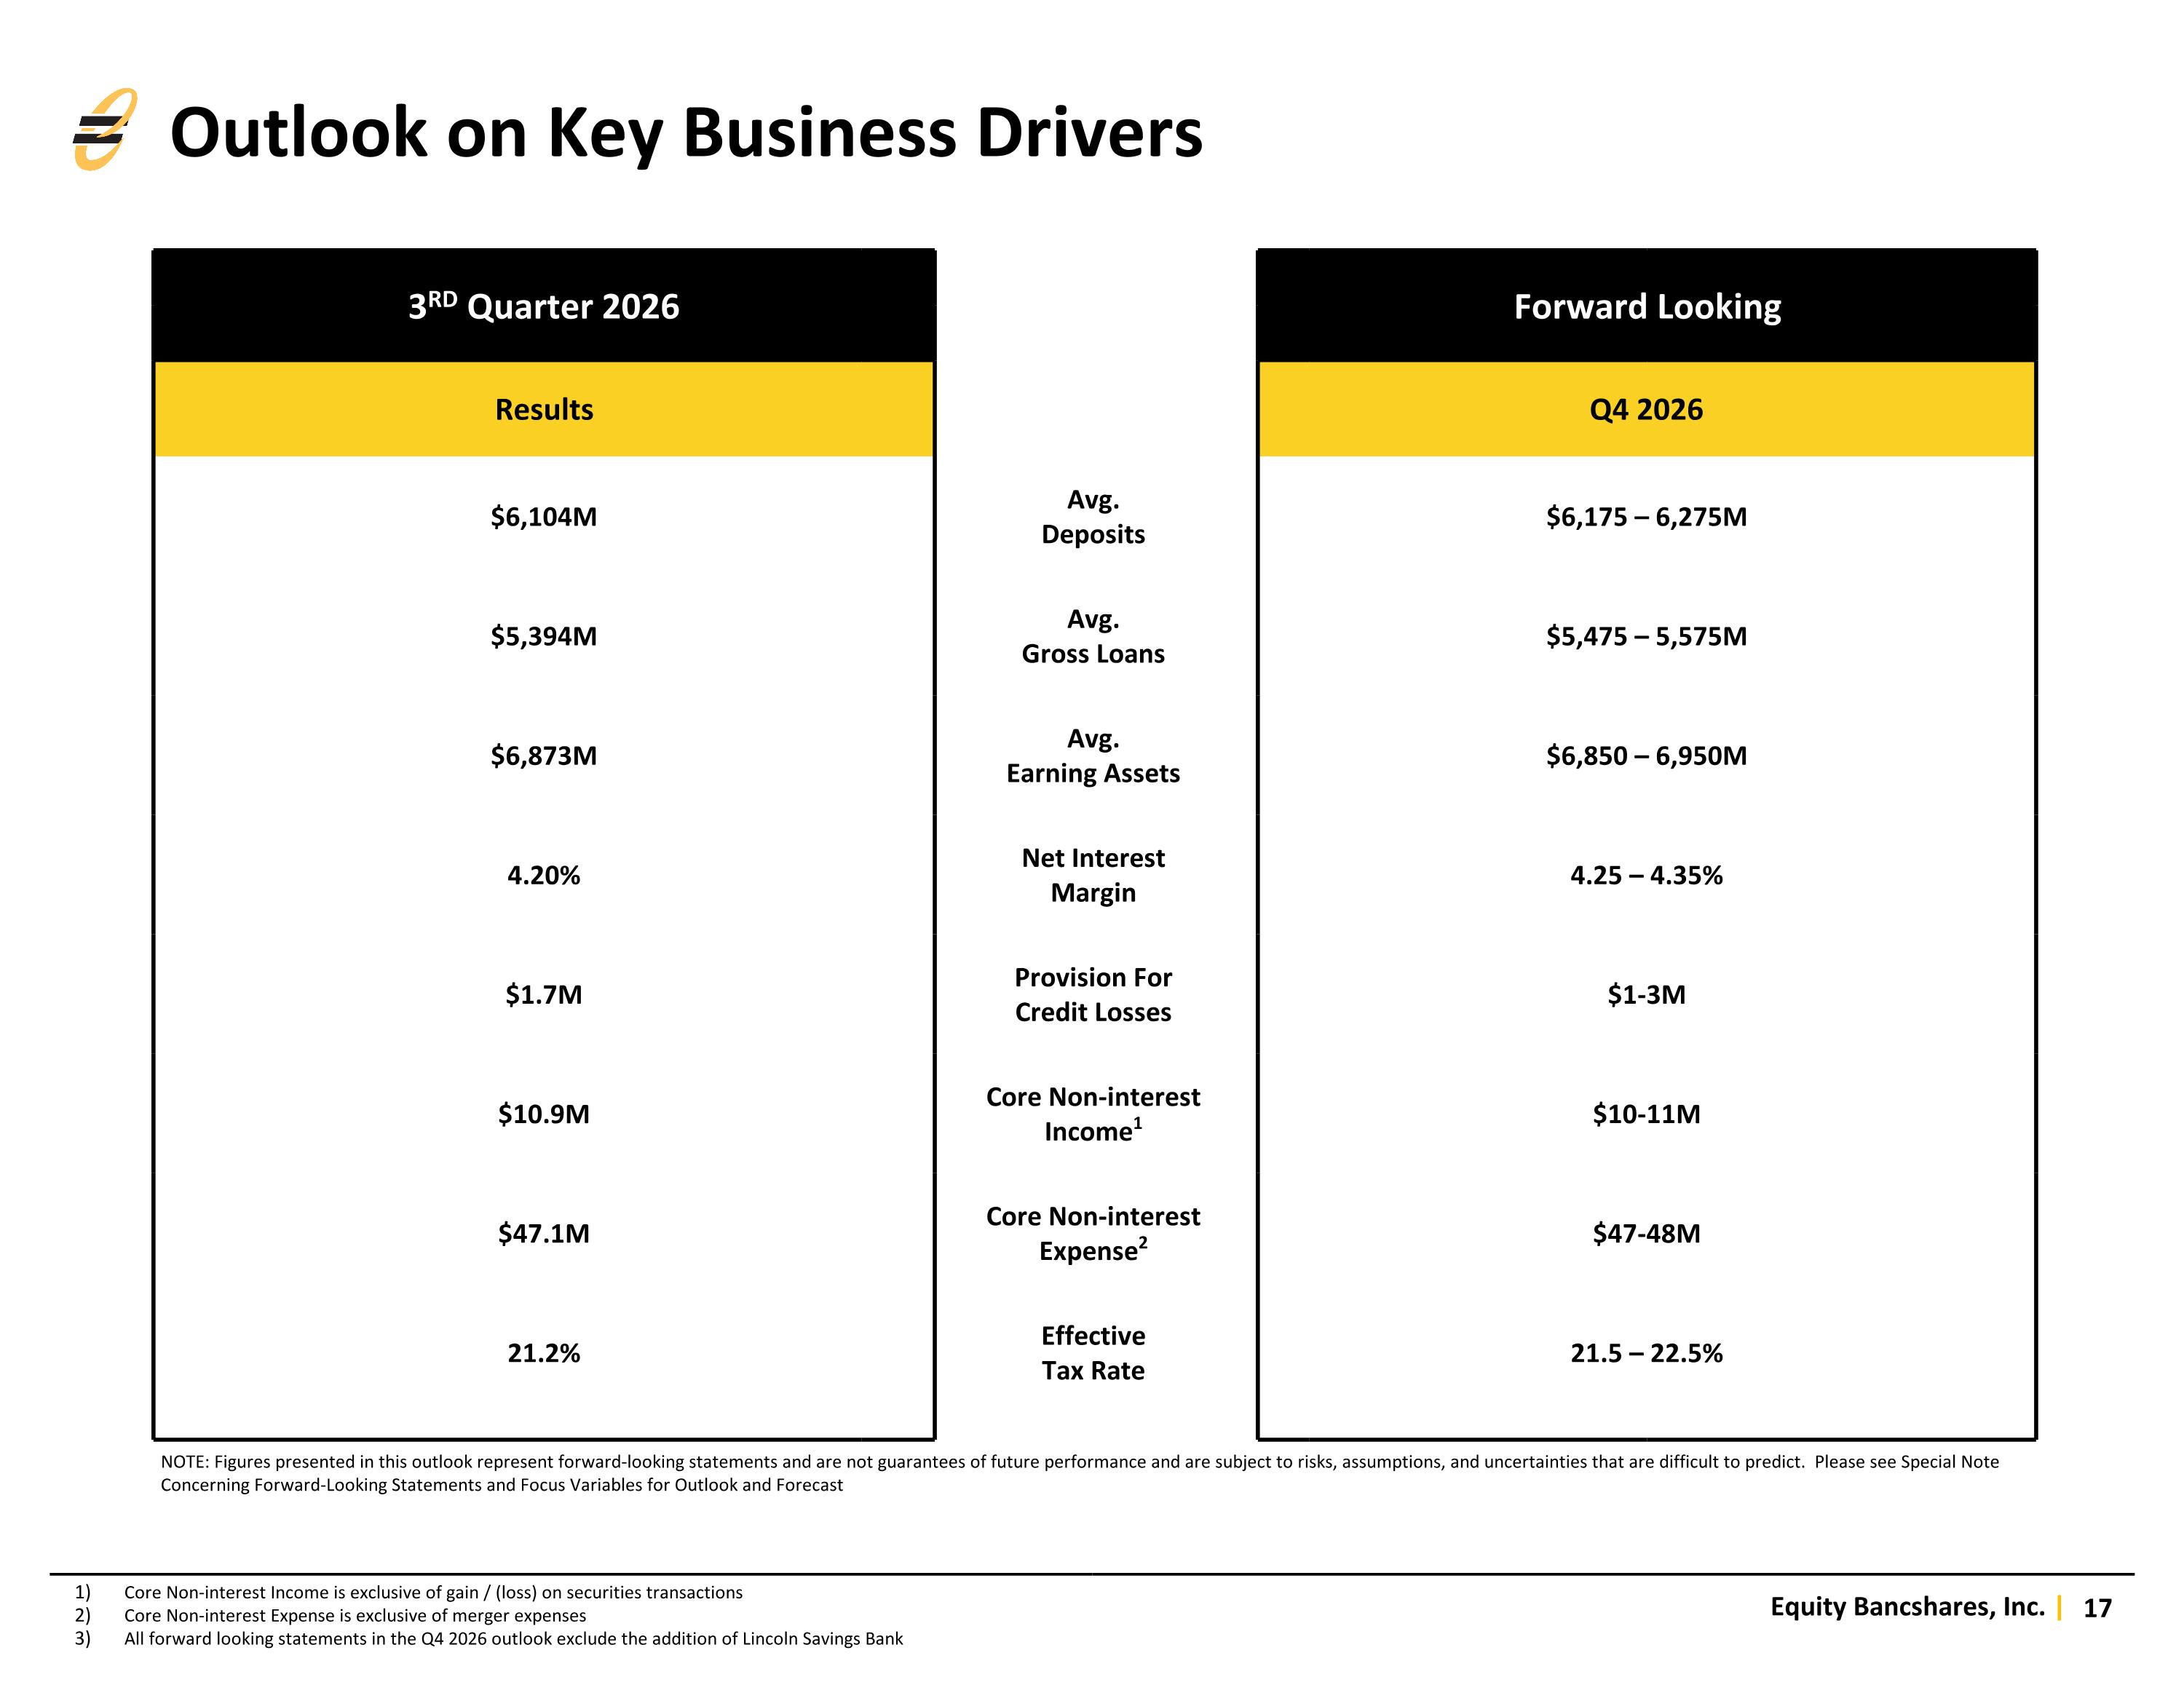
Core Non-interest Income is exclusive of gain / (loss) on securities transactions Core Non-interest Expense is exclusive of merger expenses All forward looking statements in the Q4 2026 outlook exclude the addition of Lincoln Savings Bank Forward Looking Q4 2026 $6,175 – 6,275M $5,475 – 5,575M $6,850 – 6,950M 4.25 – 4.35% $1-3M $10-11M $47-48M 21.5 – 22.5% Outlook on Key Business Drivers NOTE: Figures presented in this outlook represent forward-looking statements and are not guarantees of future performance and are subject to risks, assumptions, and uncertainties that are difficult to predict. Please see Special Note Concerning Forward-Looking Statements and Focus Variables for Outlook and Forecast 3rd Quarter 2026 Results $6,104M Avg. Deposits $5,394M Avg. Gross Loans $6,873M Avg. Earning Assets 4.20% Net Interest Margin $1.7M Provision For Credit Losses $10.9M Core Non-interest Income1 $47.1M Core Non-interest Expense2 21.2% Effective Tax Rate
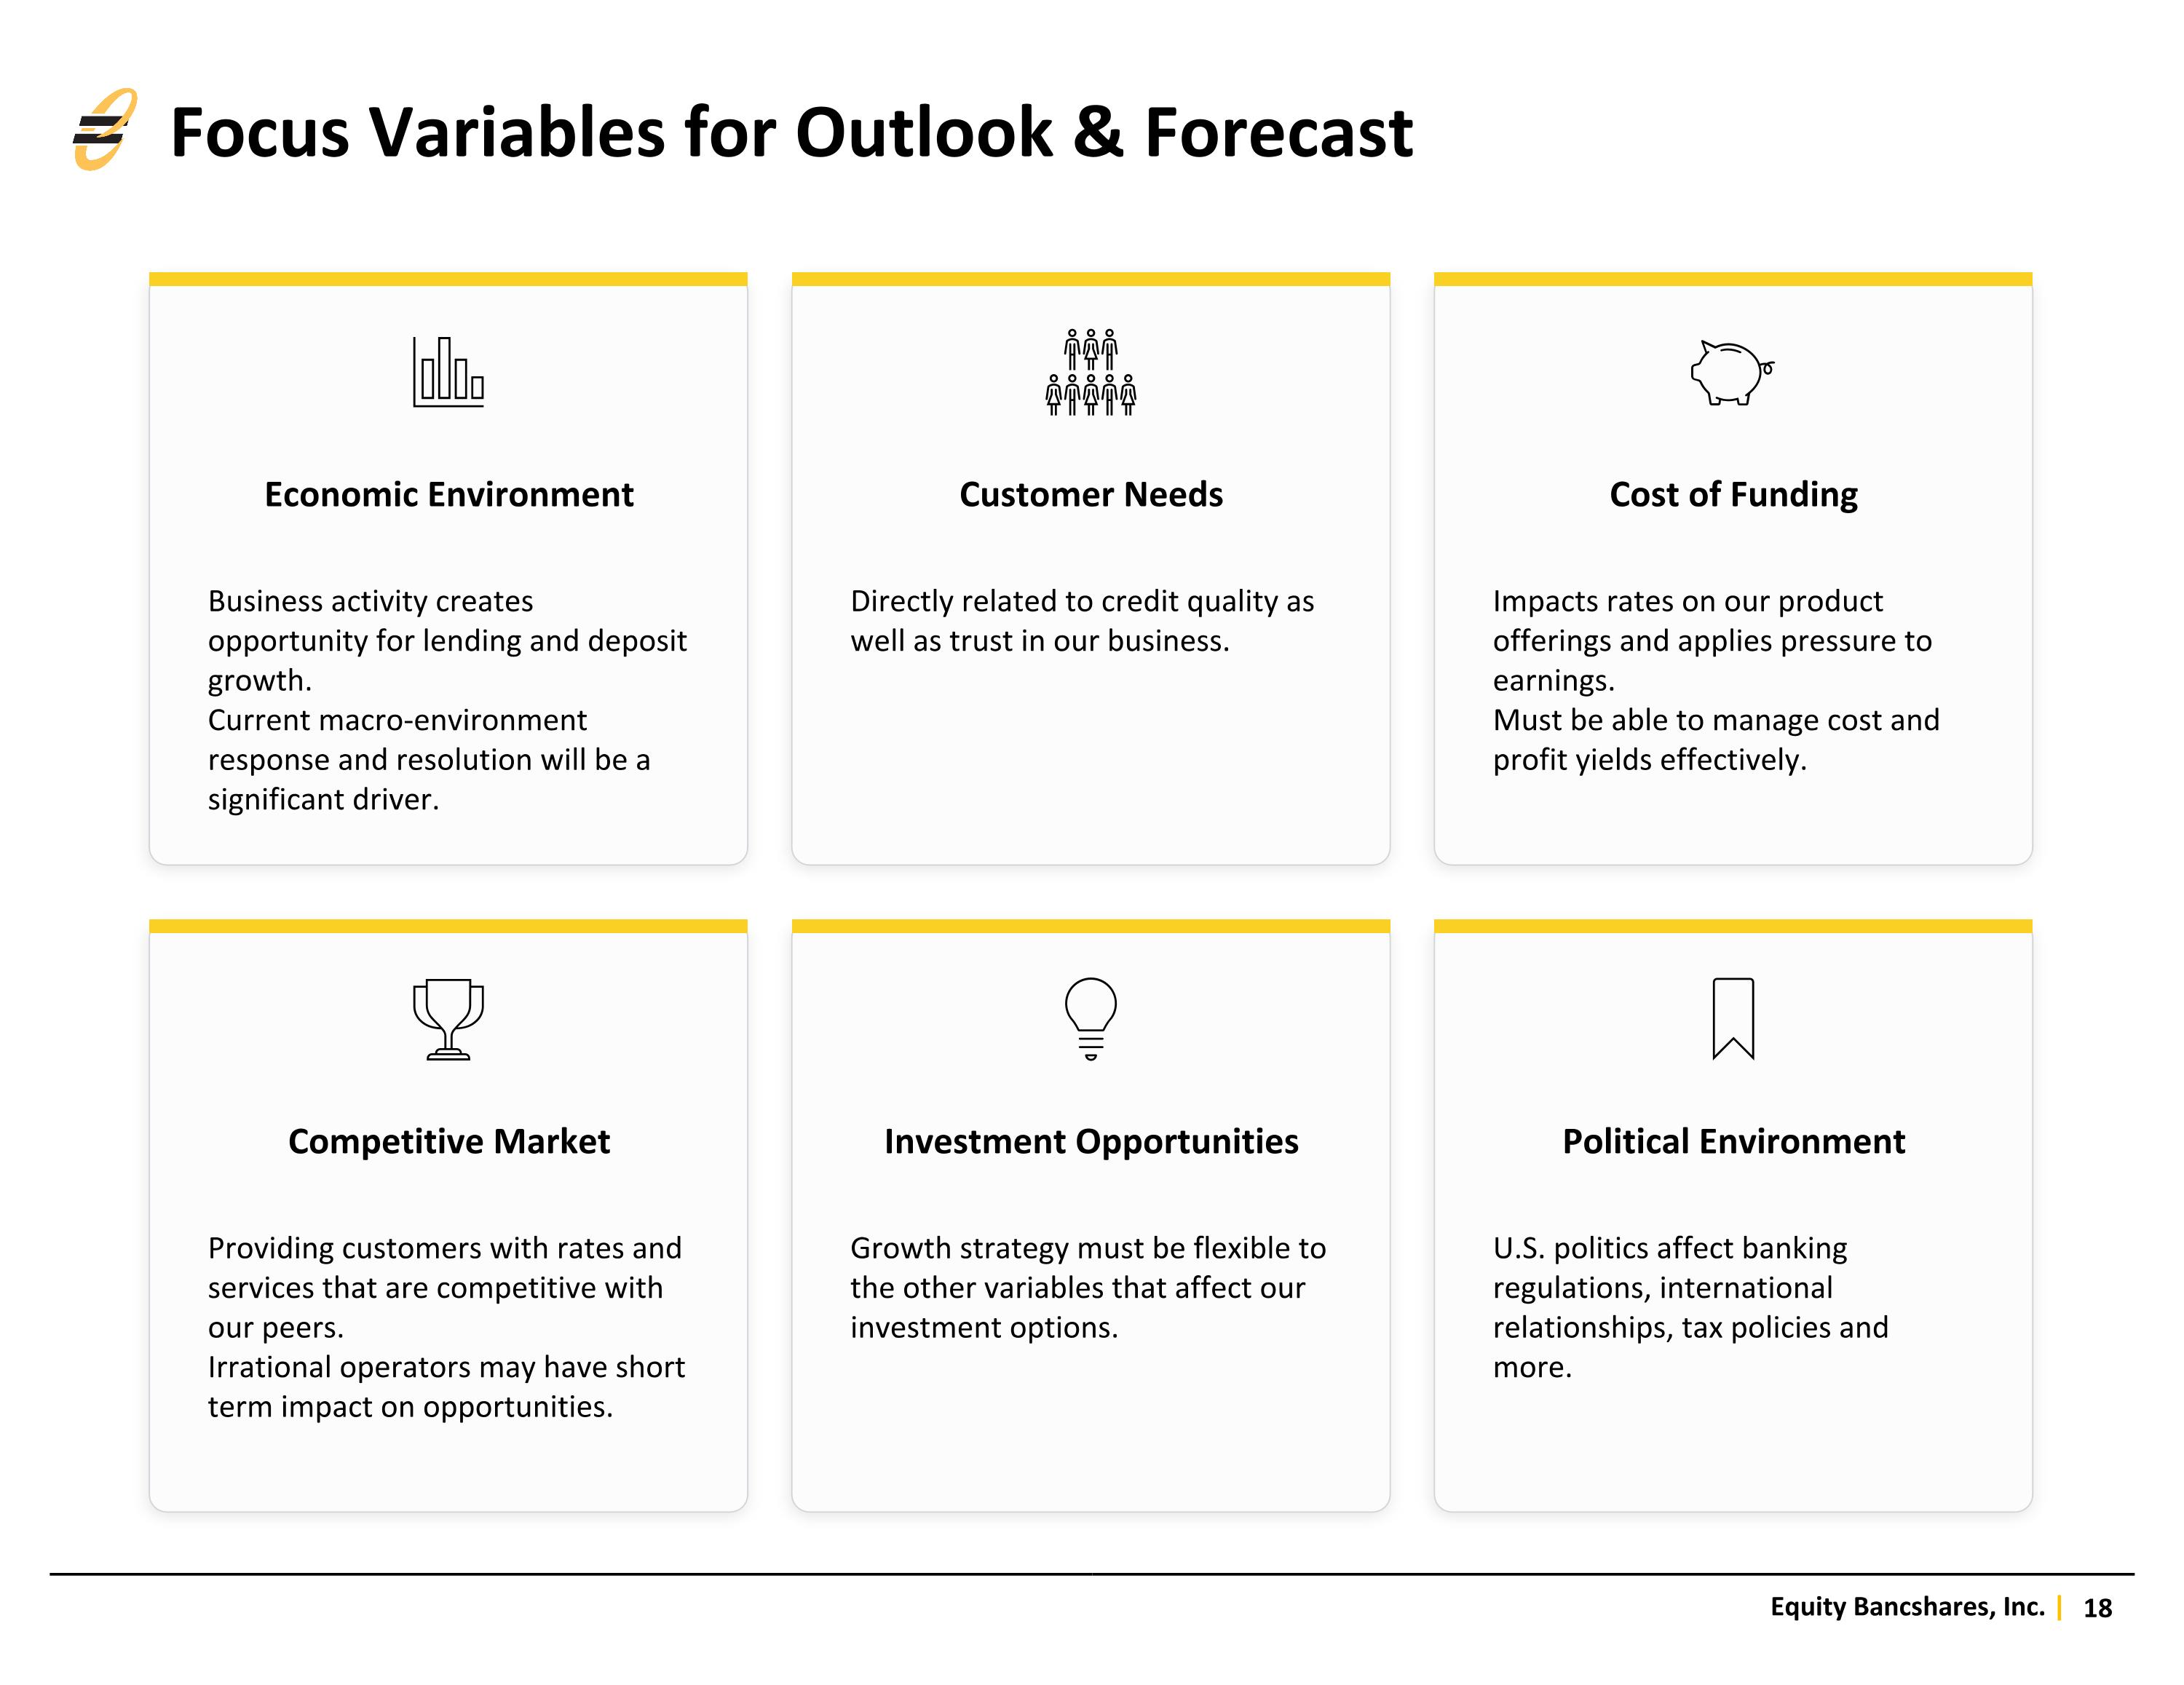
Economic Environment Business activity creates opportunity for lending and deposit growth. Current macro-environment response and resolution will be a significant driver. Customer Needs Directly related to credit quality as well as trust in our business. Cost of Funding Impacts rates on our product offerings and applies pressure to earnings. Must be able to manage cost and profit yields effectively. Competitive Market Providing customers with rates and services that are competitive with our peers. Irrational operators may have short term impact on opportunities. Investment Opportunities Growth strategy must be flexible to the other variables that affect our investment options. Political Environment U.S. politics affect banking regulations, international relationships, tax policies and more. Focus Variables for Outlook & Forecast
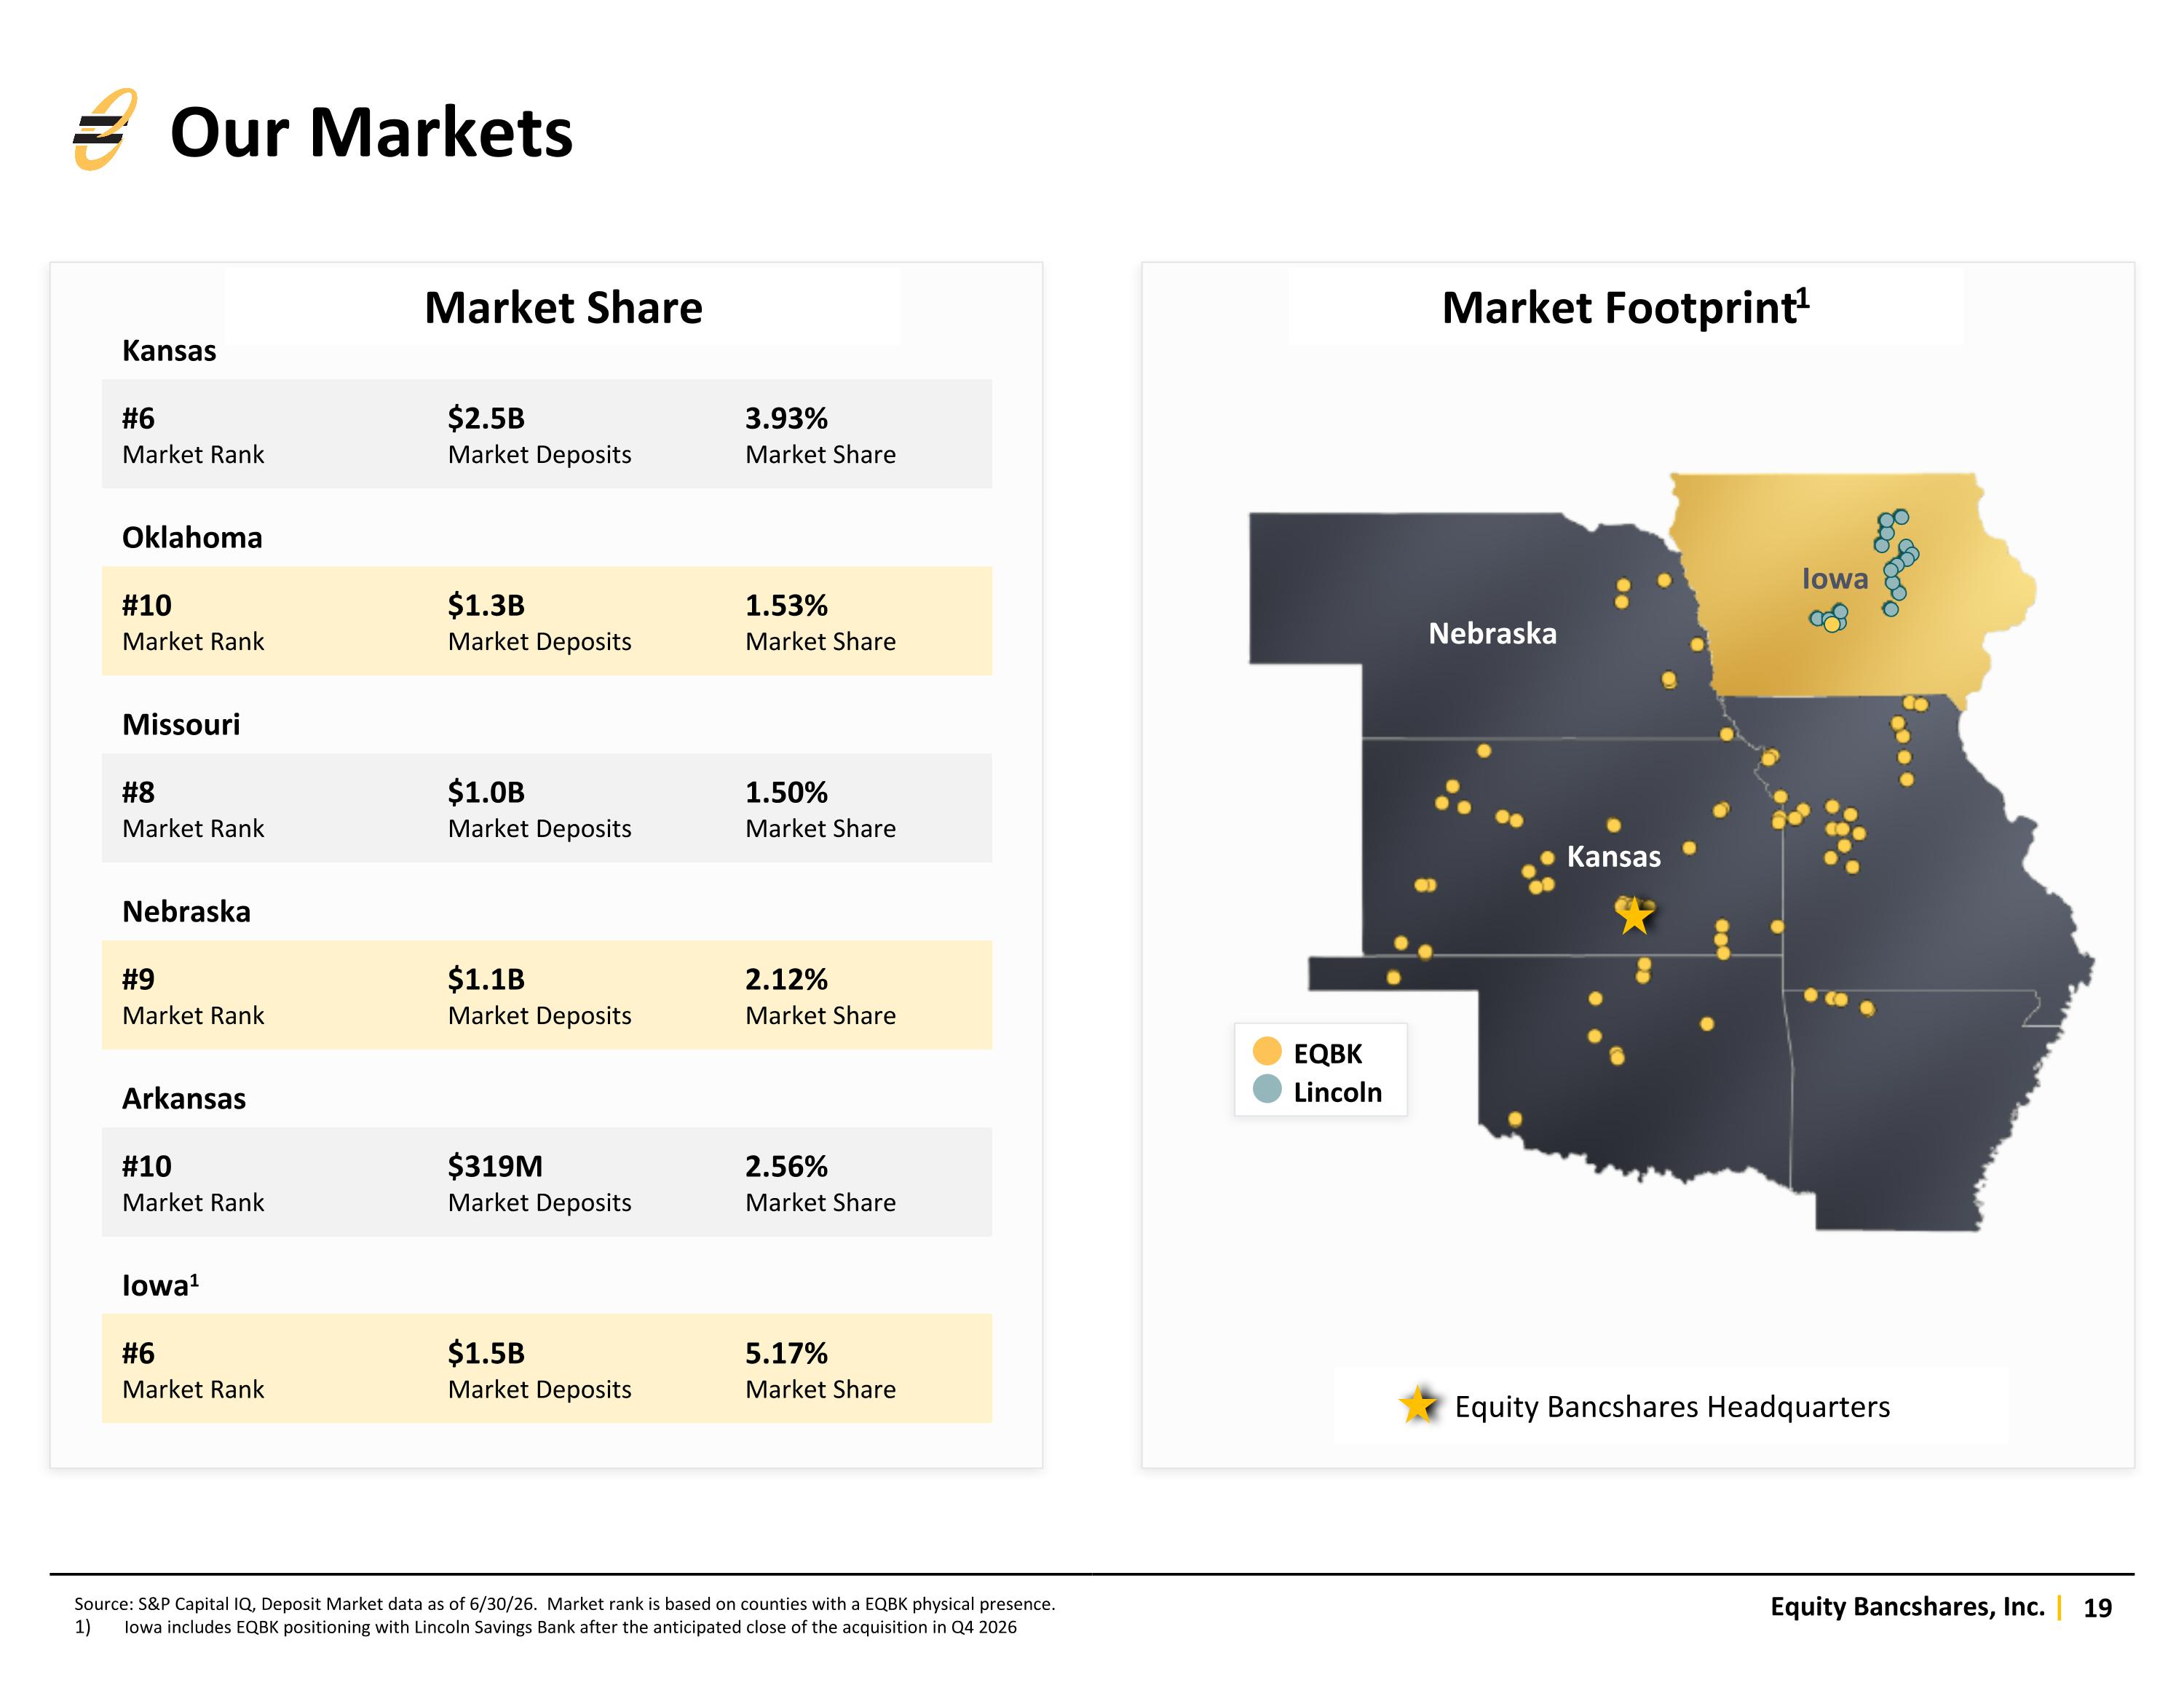
Our Markets Nebraska Kansas Iowa EQBK Lincoln Market Share Kansas #6 Market Rank $2.5B Market Deposits 3.93% Market Share Oklahoma #10 Market Rank $1.3B Market Deposits 1.53% Market Share Missouri #8 Market Rank $1.0B Market Deposits 1.50% Market Share Nebraska #9 Market Rank $1.1B Market Deposits 2.12% Market Share Arkansas #10 Market Rank $319M Market Deposits 2.56% Market Share Iowa1 #6 Market Rank $1.5B Market Deposits 5.17% Market Share Market Footprint1 Equity Bancshares Headquarters Source: S&P Capital IQ, Deposit Market data as of 6/30/26. Market rank is based on counties with a EQBK physical presence. Iowa includes EQBK positioning with Lincoln Savings Bank after the anticipated close of the acquisition in Q4 2026
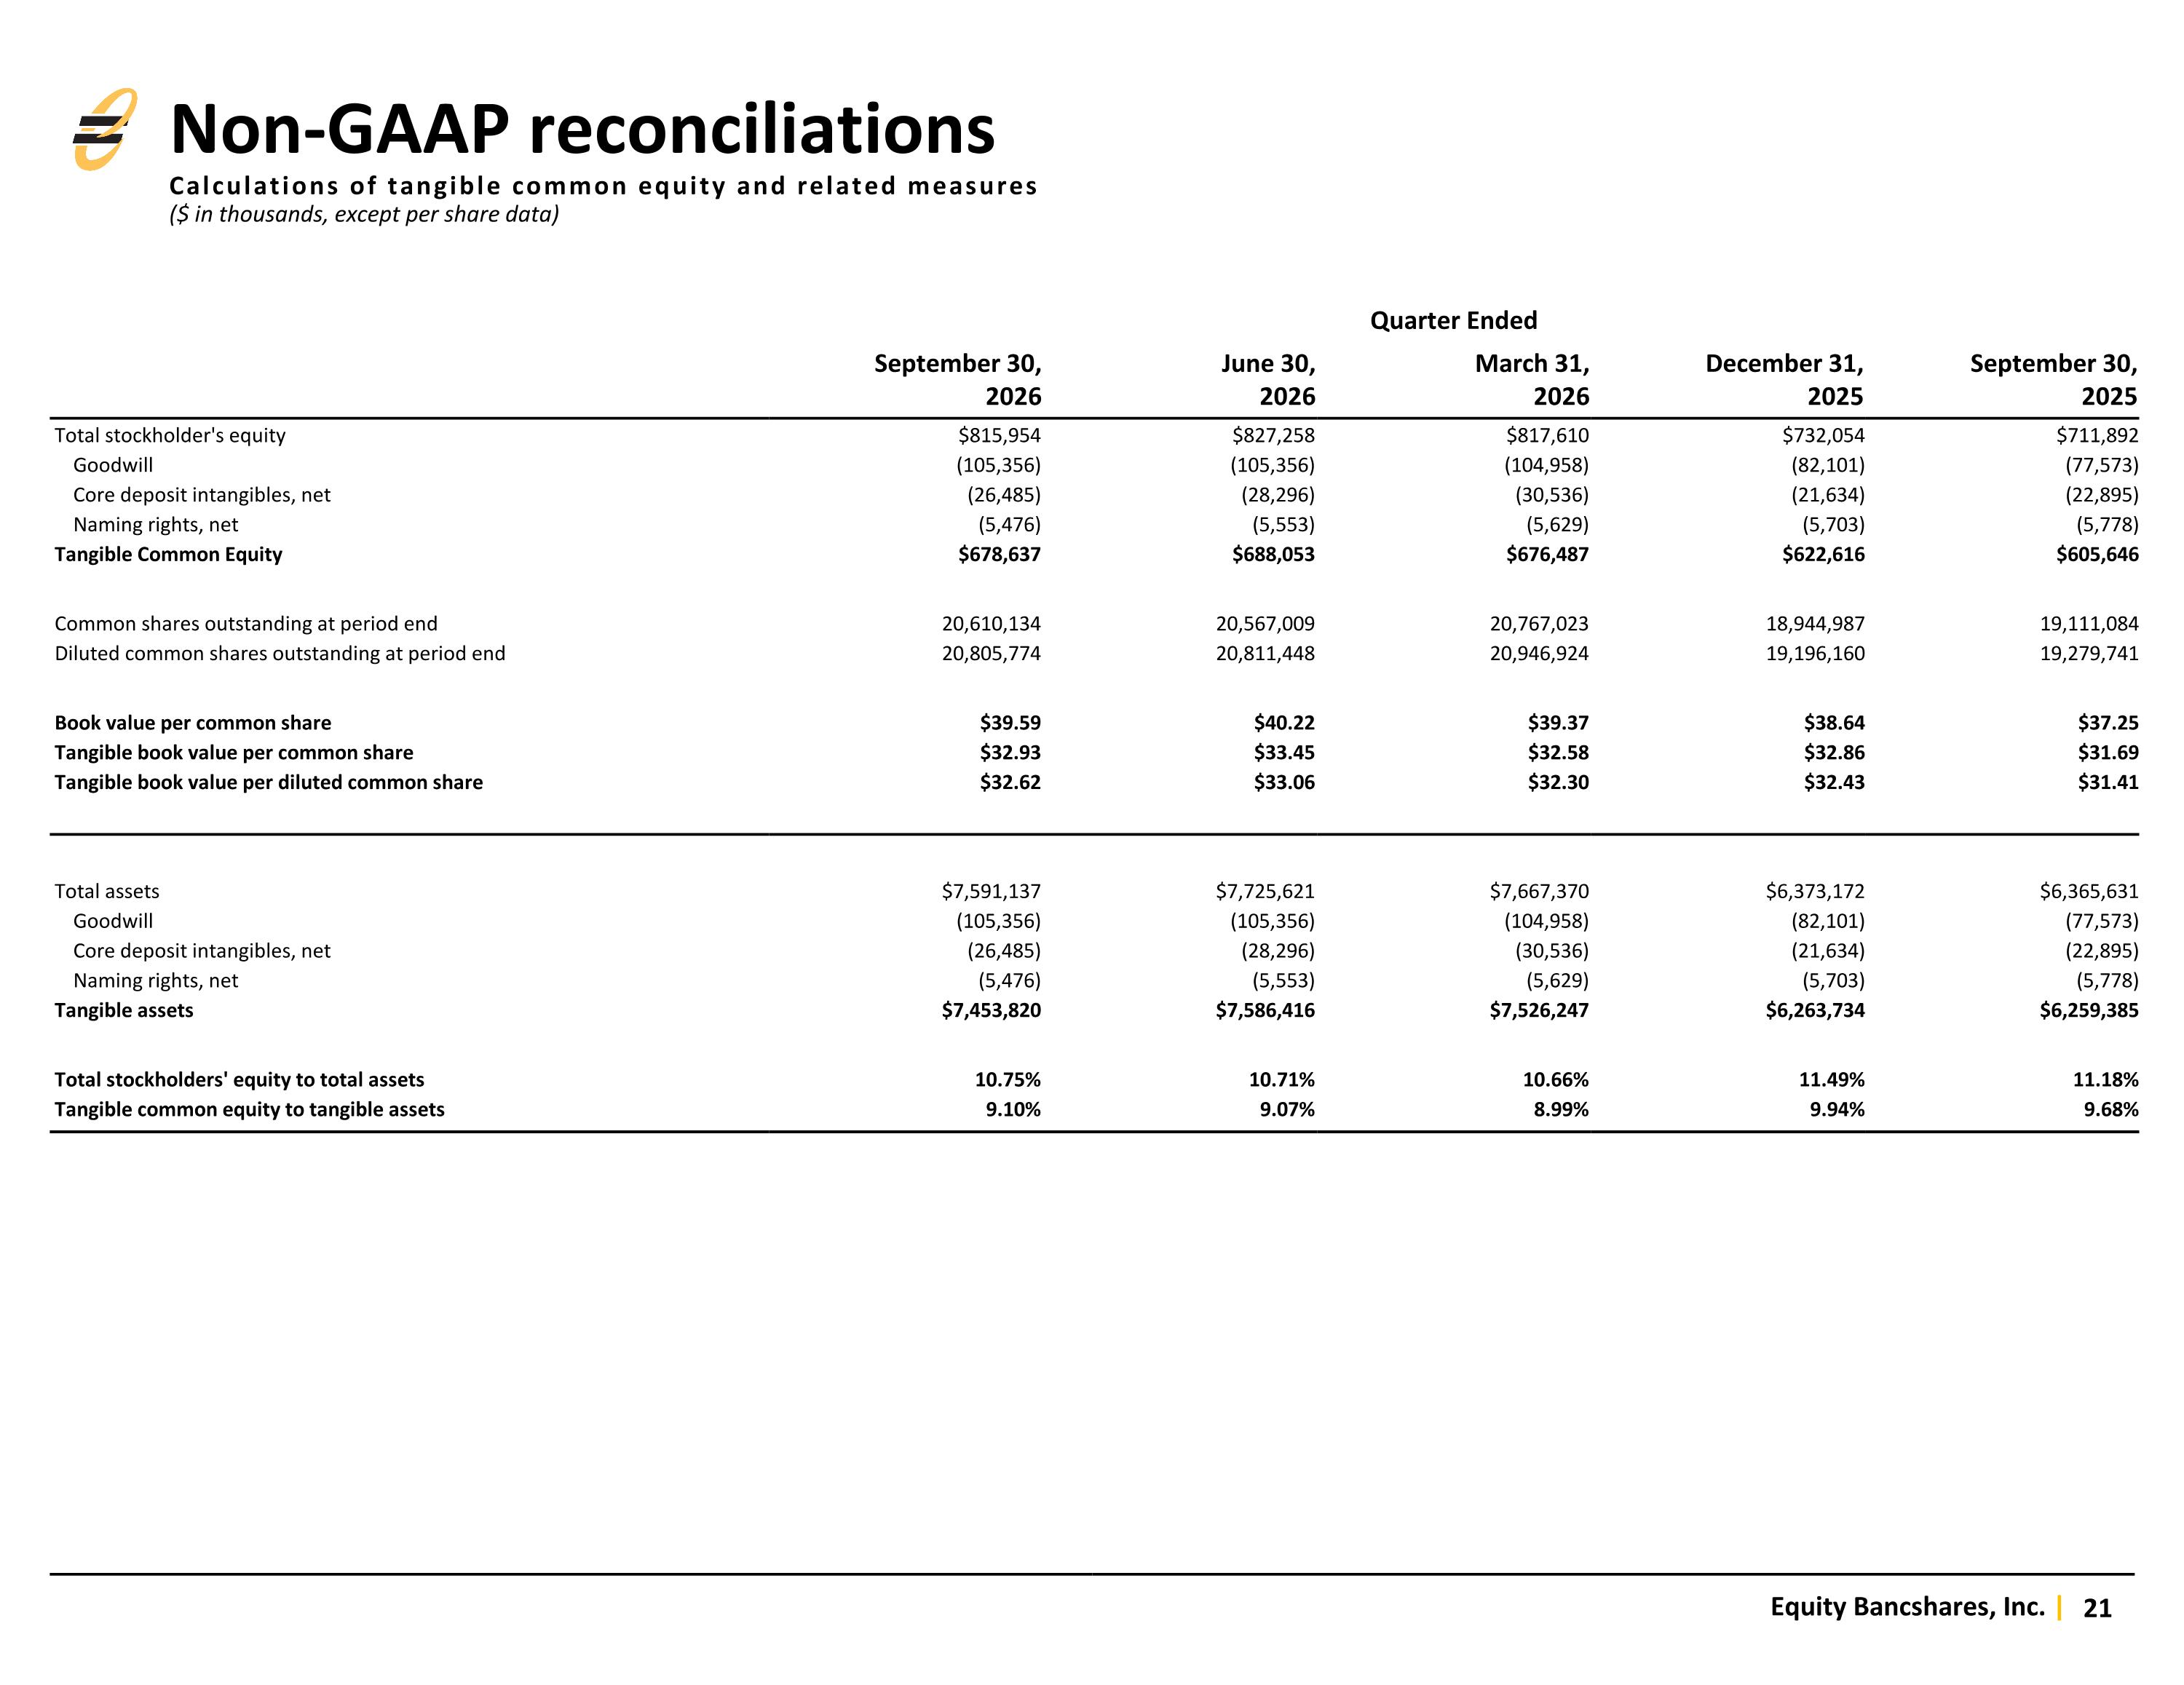
Quarter Ended September 30, 2026 June 30, 2026 March 31, 2026 December 31, 2025 September 30, 2025 Total stockholder's equity $815,954 $827,258 $817,610 $732,054 $711,892 Goodwill (105,356) (105,356) (104,958) (82,101) (77,573) Core deposit intangibles, net (26,485) (28,296) (30,536) (21,634) (22,895) Naming rights, net (5,476) (5,553) (5,629) (5,703) (5,778) Tangible Common Equity $678,637 $688,053 $676,487 $622,616 $605,646 Common shares outstanding at period end 20,610,134 20,567,009 20,767,023 18,944,987 19,111,084 Diluted common shares outstanding at period end 20,805,774 20,811,448 20,946,924 19,196,160 19,279,741 Book value per common share $39.59 $40.22 $39.37 $38.64 $37.25 Tangible book value per common share $32.93 $33.45 $32.58 $32.86 $31.69 Tangible book value per diluted common share $32.62 $33.06 $32.30 $32.43 $31.41 Total assets $7,591,137 $7,725,621 $7,667,370 $6,373,172 $6,365,631 Goodwill (105,356) (105,356) (104,958) (82,101) (77,573) Core deposit intangibles, net (26,485) (28,296) (30,536) (21,634) (22,895) Naming rights, net (5,476) (5,553) (5,629) (5,703) (5,778) Tangible assets $7,453,820 $7,586,416 $7,526,247 $6,263,734 $6,259,385 Total stockholders' equity to total assets 10.75% 10.71% 10.66% 11.49% 11.18% Tangible common equity to tangible assets 9.10% 9.07% 8.99% 9.94% 9.68% Non-GAAP reconciliations Calculations of tangible common equity and related measures ($ in thousands, except per share data)
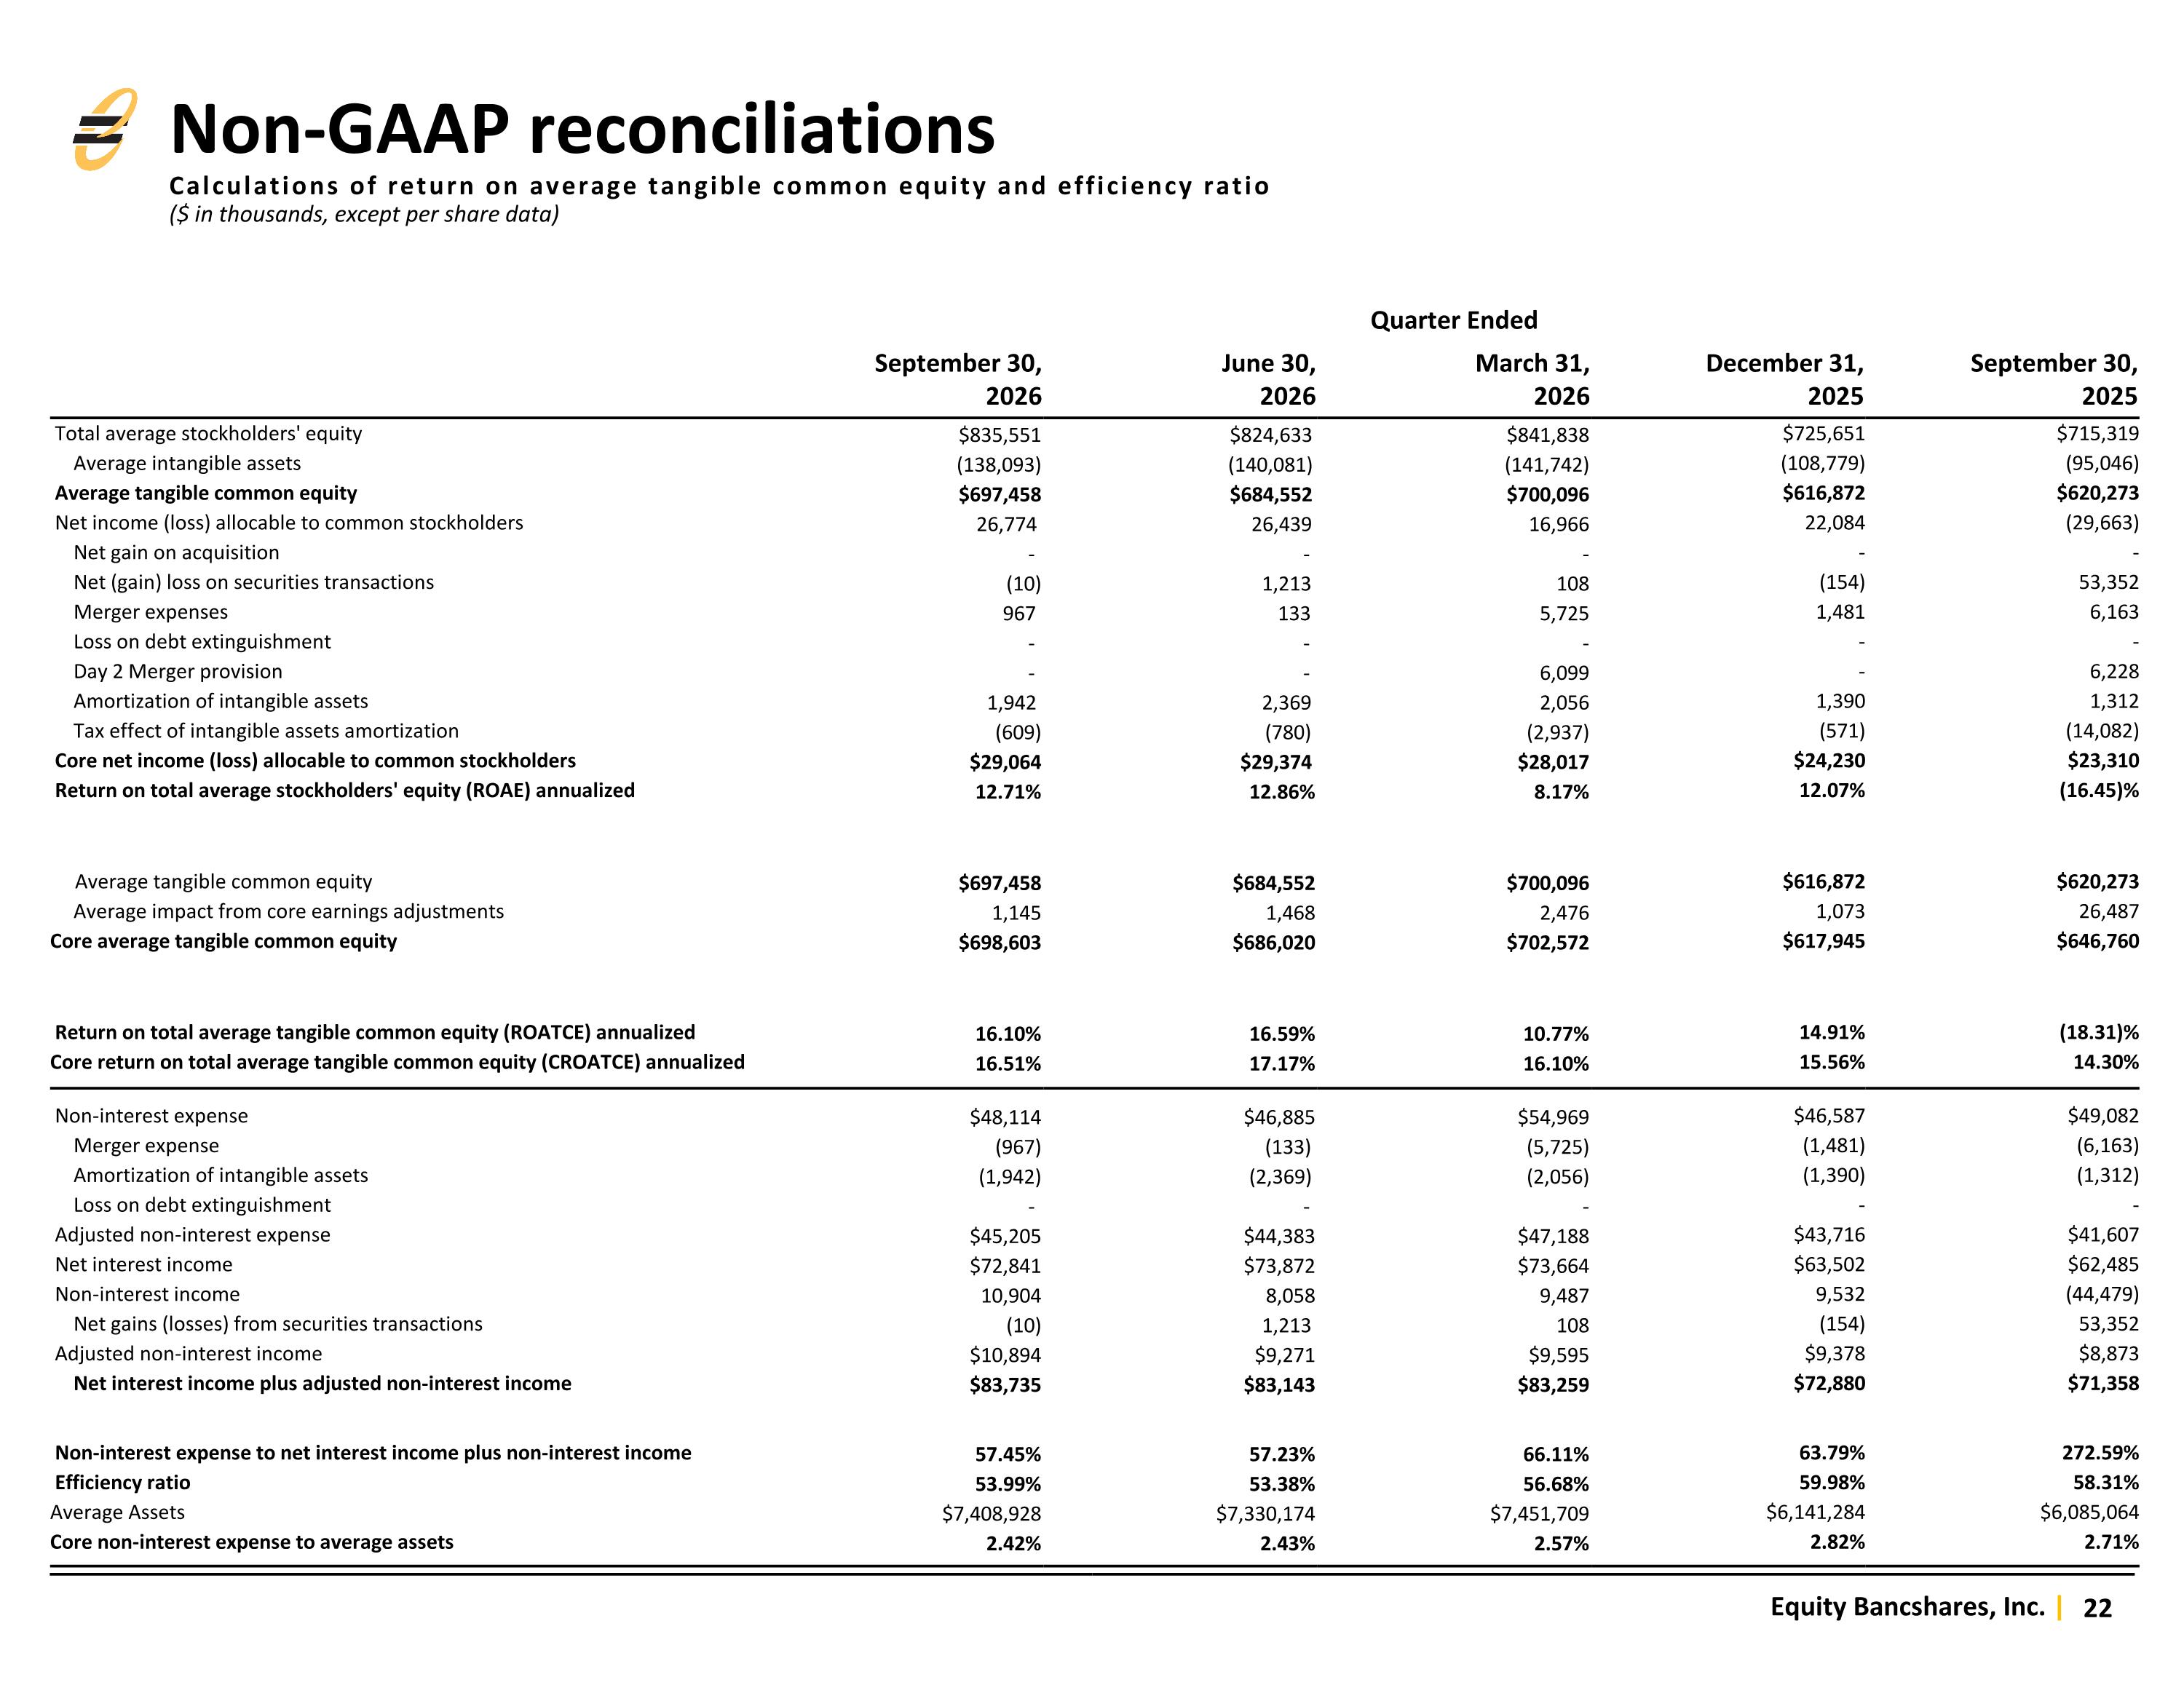
Quarter Ended September 30, 2026 June 30, 2026 March 31, 2026 December 31, 2025 September 30, 2025 Total average stockholders' equity $835,551 $824,633 $841,838 $725,651 $715,319 Average intangible assets (138,093) (140,081) (141,742) (108,779) (95,046) Average tangible common equity $697,458 $684,552 $700,096 $616,872 $620,273 Net income (loss) allocable to common stockholders 26,774 26,439 16,966 22,084 (29,663) Net gain on acquisition - - - - - Net (gain) loss on securities transactions (10) 1,213 108 (154) 53,352 Merger expenses 967 133 5,725 1,481 6,163 Loss on debt extinguishment - - - - - Day 2 Merger provision - - 6,099 - 6,228 Amortization of intangible assets 1,942 2,369 2,056 1,390 1,312 Tax effect of intangible assets amortization (609) (780) (2,937) (571) (14,082) Core net income (loss) allocable to common stockholders $29,064 $29,374 $28,017 $24,230 $23,310 Return on total average stockholders' equity (ROAE) annualized 12.71% 12.86% 8.17% 12.07% (16.45)% Average tangible common equity $697,458 $684,552 $700,096 $616,872 $620,273 Average impact from core earnings adjustments 1,145 1,468 2,476 1,073 26,487 Core average tangible common equity $698,603 $686,020 $702,572 $617,945 $646,760 Return on total average tangible common equity (ROATCE) annualized 16.10% 16.59% 10.77% 14.91% (18.31)% Core return on total average tangible common equity (CROATCE) annualized 16.51% 17.17% 16.10% 15.56% 14.30% Non-interest expense $48,114 $46,885 $54,969 $46,587 $49,082 Merger expense (967) (133) (5,725) (1,481) (6,163) Amortization of intangible assets (1,942) (2,369) (2,056) (1,390) (1,312) Loss on debt extinguishment - - - - - Adjusted non-interest expense $45,205 $44,383 $47,188 $43,716 $41,607 Net interest income $72,841 $73,872 $73,664 $63,502 $62,485 Non-interest income 10,904 8,058 9,487 9,532 (44,479) Net gains (losses) from securities transactions (10) 1,213 108 (154) 53,352 Adjusted non-interest income $10,894 $9,271 $9,595 $9,378 $8,873 Net interest income plus adjusted non-interest income $83,735 $83,143 $83,259 $72,880 $71,358 Non-interest expense to net interest income plus non-interest income 57.45% 57.23% 66.11% 63.79% 272.59% Efficiency ratio 53.99% 53.38% 56.68% 59.98% 58.31% Average Assets $7,408,928 $7,330,174 $7,451,709 $6,141,284 $6,085,064 Core non-interest expense to average assets 2.42% 2.43% 2.57% 2.82% 2.71% Non-GAAP reconciliations Calculations of return on average tangible common equity and efficiency ratio ($ in thousands, except per share data)
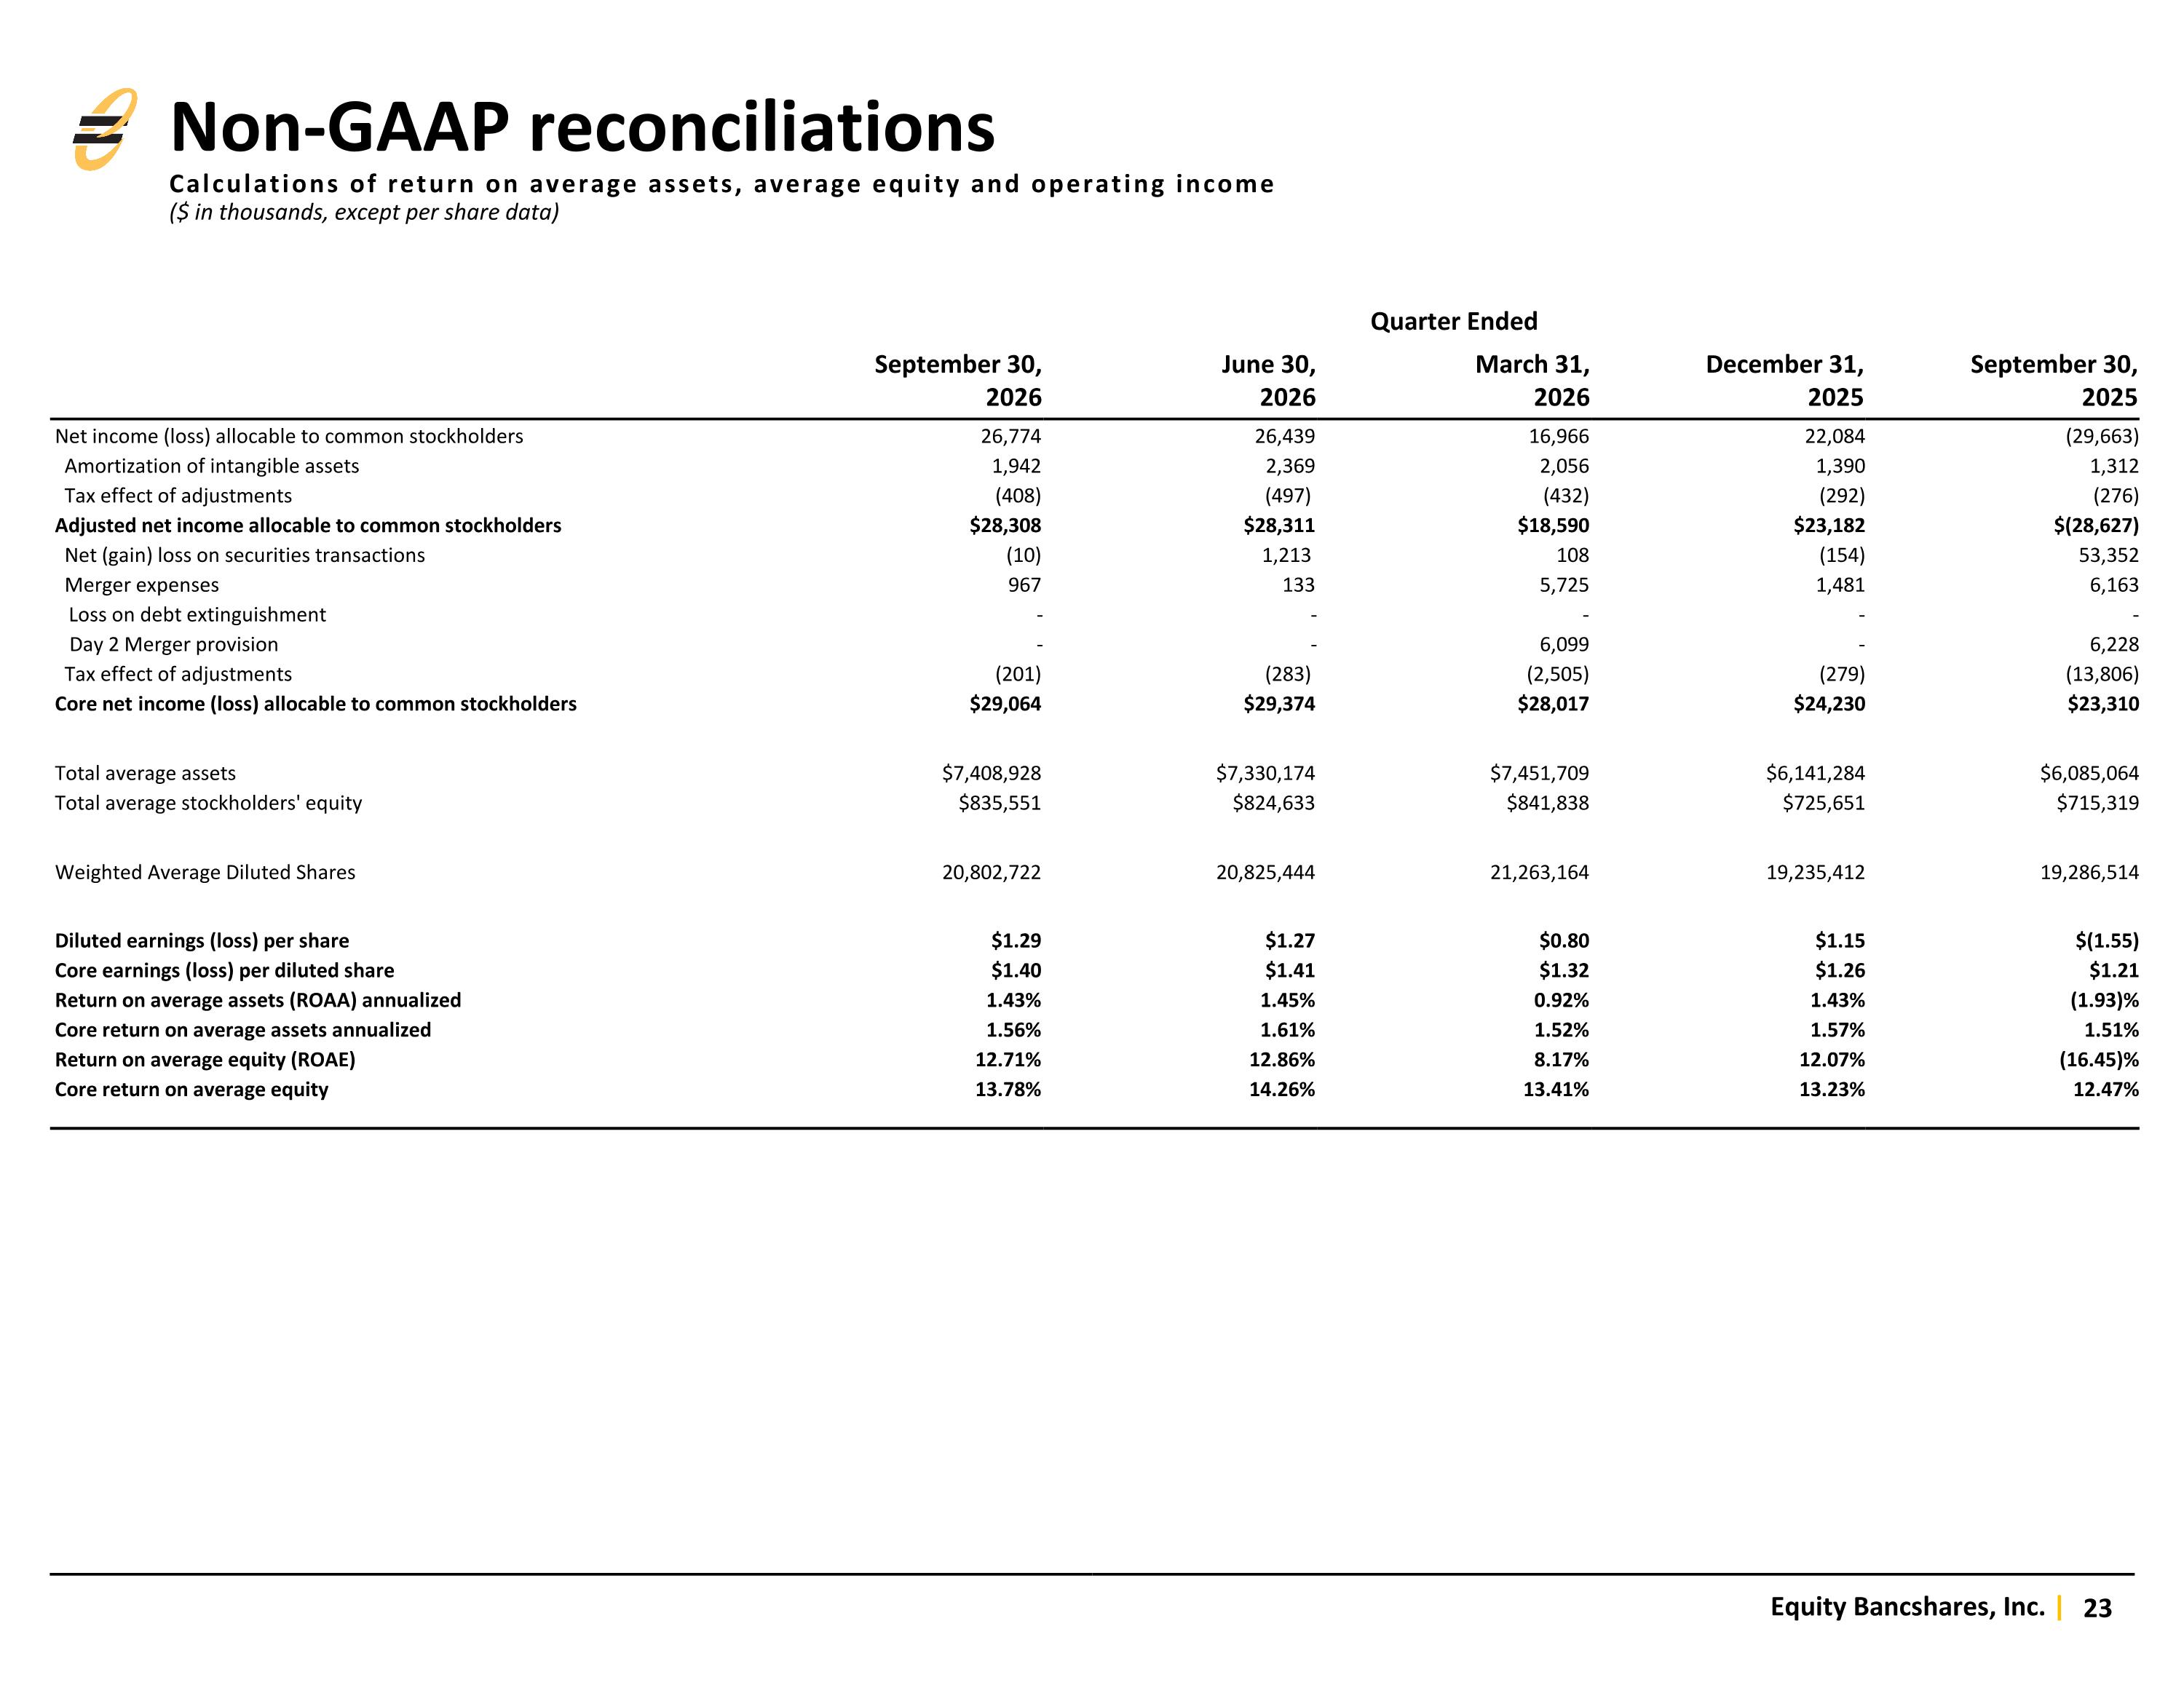
Quarter Ended September 30, 2026 June 30, 2026 March 31, 2026 December 31, 2025 September 30, 2025 Net income (loss) allocable to common stockholders 26,774 26,439 16,966 22,084 (29,663) Amortization of intangible assets 1,942 2,369 2,056 1,390 1,312 Tax effect of adjustments (408) (497) (432) (292) (276) Adjusted net income allocable to common stockholders $28,308 $28,311 $18,590 $23,182 $(28,627) Net (gain) loss on securities transactions (10) 1,213 108 (154) 53,352 Merger expenses 967 133 5,725 1,481 6,163 Loss on debt extinguishment - - - - - Day 2 Merger provision - - 6,099 - 6,228 Tax effect of adjustments (201) (283) (2,505) (279) (13,806) Core net income (loss) allocable to common stockholders $29,064 $29,374 $28,017 $24,230 $23,310 Total average assets $7,408,928 $7,330,174 $7,451,709 $6,141,284 $6,085,064 Total average stockholders' equity $835,551 $824,633 $841,838 $725,651 $715,319 Weighted Average Diluted Shares 20,802,722 20,825,444 21,263,164 19,235,412 19,286,514 Diluted earnings (loss) per share $1.29 $1.27 $0.80 $1.15 $(1.55) Core earnings (loss) per diluted share $1.40 $1.41 $1.32 $1.26 $1.21 Return on average assets (ROAA) annualized 1.43% 1.45% 0.92% 1.43% (1.93)% Core return on average assets annualized 1.56% 1.61% 1.52% 1.57% 1.51% Return on average equity (ROAE) 12.71% 12.86% 8.17% 12.07% (16.45)% Core return on average equity 13.78% 14.26% 13.41% 13.23% 12.47% Non-GAAP reconciliations Calculations of return on average assets, average equity and operating income ($ in thousands, except per share data)

investor.equitybank.com