Exhibit 99.1
1 Investor Presentation October 2026 ELLOMAY CAPITAL LIMITED
2 2 General - The information contained in this presentation is subject to, and must be read in conjunction with, all other publicly available information, including our Annual Report on Form 20-F for the year ended December 31, 2025, and other filings that we make from time to time with the SEC. Any person at any time acquiring securities must do so only on the basis of such person's own judgment as to the merits or the suitability of the securities for its purpose and only based on such information as is contained in such filings, having received all such professional or other advice as it deems right or appropriate under the circumstances and not in reliance on the information contained in the presentation. By making this presentation available, we do not provide advice and make no recommendation to buy, sell or otherwise trade our shares or any other securities or investments whatsoever. We do not warrant that the information is complete or accurate, nor will we bear any liability for any damage or losses that may arise from any use of the information. This presentation and any information contained herein do not constitute an offer to sell or the solicitation of an offer to buy any securities. No offering of securities shall be made in the United States except pursuant to registration under the US Securities Act of 1933, as amended, or an exemption from the registration requirement thereunder. Securities will only be issued in Israel pursuant to a valid prospectus under the Israeli Securities Law, 1968 or an exemption from the prospectus requirements under this law. Historical facts and past financials and operating results do not mean that future performance or results for any period whatsoever will necessarily match or exceed those of any previous year. This presentation and the information included herein are owned exclusively by the Company, and may not be published, distributed or used in any other way without first obtaining our express written approval. Forward-looking information - This presentation contains forward-looking statements that involve material risks and uncertainties, including statements that are based on the current expectations and assumptions of the Company's management. All statements included in this presentation concerning our plans, objectives, expectations and assumptions other than statements involving historical facts, are forward-looking statements. Such forward-looking statements include forecast financial information. Such forward-looking statements regarding revenues, earnings, performance, strategies, prospects, expenses and other aspects of our businesses are based on current expectations, which are subject to risks and uncertainties, and based on forecast electricity prices, the current government tariff, and/or commercial agreements pertaining to each project and the current or expected licenses and permits of each project. In addition, the details regarding projects included in this presentation, that are under advanced development or early-stage development, are based on current internal assessments of our management, and there is no certainty or assurance that we will be able to develop or complete those projects, as the development of such projects requires, among other things, approvals, land rights, permits and financing (equity, project financing and capital which will be raised through debt and equity issuances, and through disposal of assets). The use of certain words, including the words "assessment", "project", "intends", "expects", "plans", "believes", "will" and similar expressions are aimed at identifying forward-looking statements as defined in the Private Securities Litigation Reform Act of 1995 and the Israeli Securities Law, 1968. The Company may not actually achieve the plans, intentions or expectations included in our forward-looking statements, and one should not place undue reliance on these forward- looking statements. Various important factors could cause actual results or events to differ materially from those which may be expressed or implied by our forward-looking statements, including changes in electricity prices and demand, regulatory changes, inability to obtain the financing required for the development and construction of projects, continuation of the war and hostilities in Israel, Gaza and Lebanon and between Israel and Iran, increases in interest rates and inflation, changes in exchange rates, in the availability and prices of resources required for the operation of the Company's facilities (such as waste and natural gas) and in the price of oil, the impact of continued military conflict between Russia and Ukraine, delays in development, construction, or commencement of operation of the projects under development and construction, technical and other disruptions in the operations or construction of the facilities owned by the Company, failure to obtain permits - whether within the set timeframe or at all, climate change, and general market, political and economic conditions in the countries in which the Company operates, including Israel, Spain, Italy and the United States. These and other risks and uncertainties associated with our business are described in greater detail in the filings we make from time to time with SEC, including our Annual Report on Form 20-F. The forward-looking statements are made as of that date and we do not undertake any obligation to revise any forward-looking statements, whether due to new information, future events or otherwise. Projections are calculated based on an NIS/EUR exchange rate of approximately 3.4. Use of non-IFRS measures - This presentation includes actual and forecast EBITDA and FFO, which are non-IFRS measures. EBITDA is defined as income before net finance expenses, taxes, depreciation and amortization, and FFO (funds from operations) is calculated by adding taxes and finance expenses to the EBITDA. Although the Company views the non-IFRS measures as important measures of comparative operational performance, these non-IFRS measures should not be viewed in isolation or as a substitute for net income or other statement of income or cash flow data prepared in accordance with IFRS as a mearsure of profitability or liquidity. These non-IFRS measures do not take into consideration our obligations, including capital expenditure and restricted cash, and therefore are not necessarily indicative of amounts that may be available for discretionary use. In addition, FFO does not represent and is not an alternative to operating cash flow as defined in IFRS, and is not an indication of cash available to fund all cash flow needs, including the ability to make distributions. Not all companies calculate EBITDA or FFO in the same manner, and the presented measures may not be comparable to similarly-titled measures presented by other companies. The Company uses these measures internally as performance indicators, and believes that when these measures are combined with IFRS measures they add useful information regarding the Company's operational performance. The Company is unable to provide a reconciliation between projected EBITDA, FFO and the net income or loss on a forward-looking basis without unreasonable efforts, as items that affect these financial measures, which are non-IFRS, are not under the Company's control and/or may not be reasonably predicted. These items include, among others, exchange rate differences, depreciation and amortization, other income, finance income, finance expenses and taxes on income. Such items may have a significant impact on the future financial results of the Company, and the Company believes that such a reconciliation for the projected results will not be meaningful. Legal Disclaimer 2
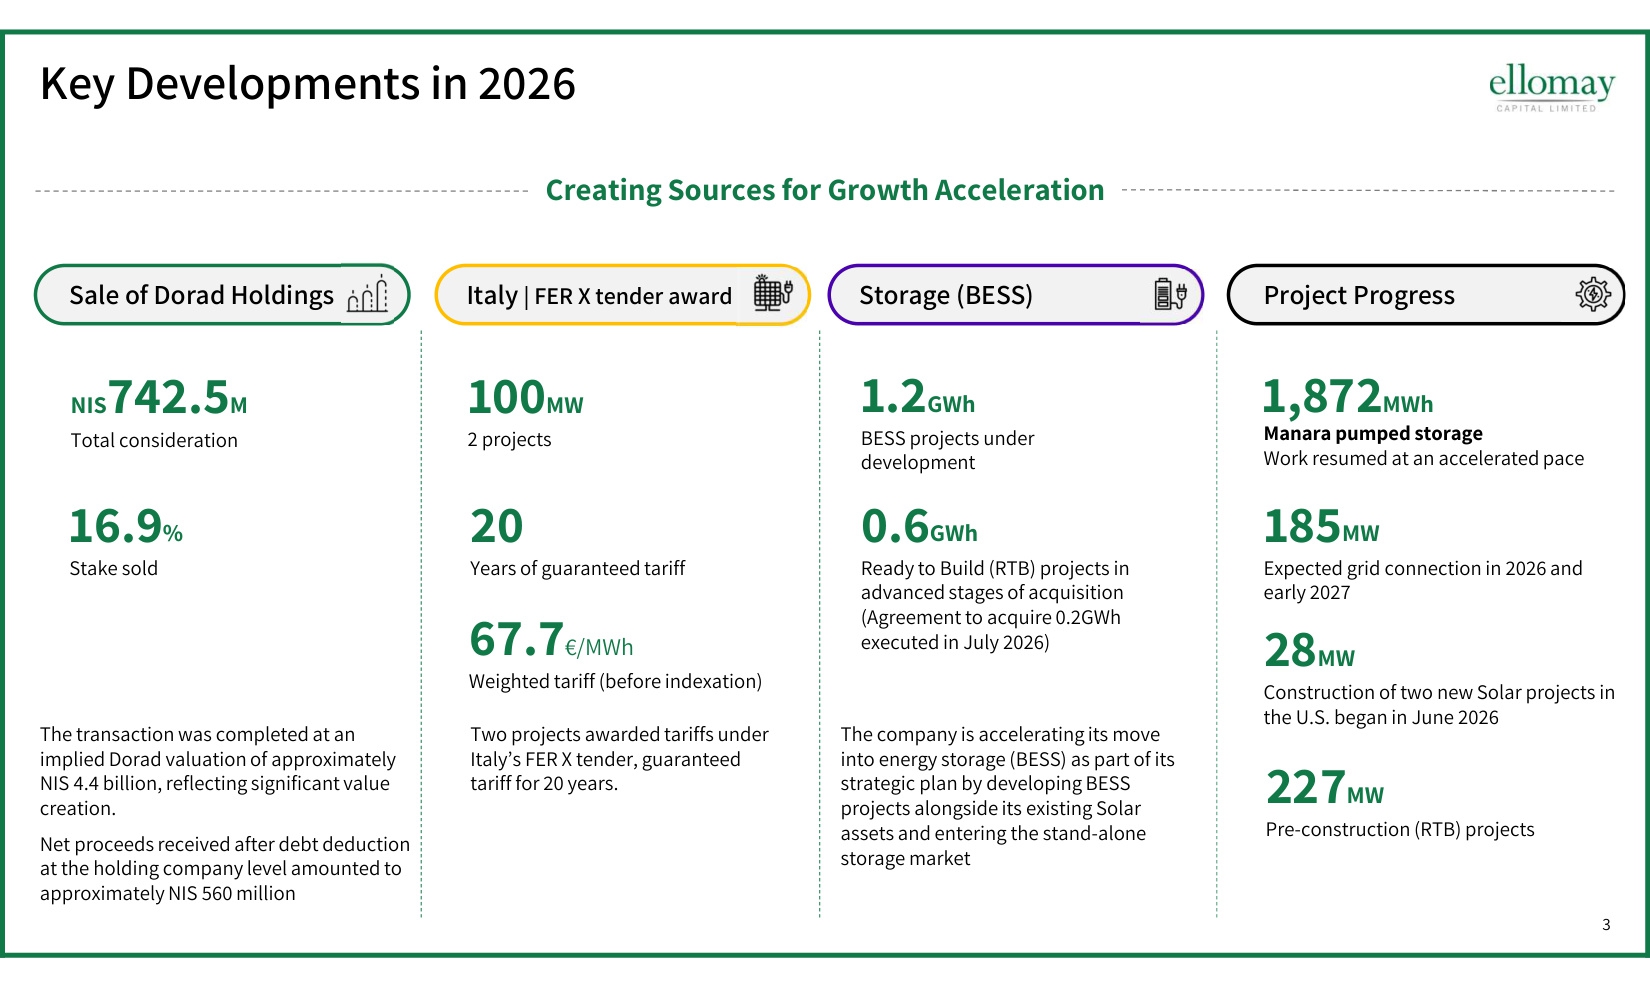
3 Key Developments in 2026 % 16.9 Stake sold Sale of Dorad Holdings NIS742.5M Total consideration The transaction was completed at an implied Dorad valuation of approximately NIS 4.4 billion, reflecting significant value creation. Net proceeds received after debt deduction at the holding company level amounted to approximately NIS 560 million Storage (BESS) The company is accelerating its move into energy storage (BESS) as part of its strategic plan by developing BESS projects alongside its existing Solar assets and entering the stand-alone storage market 1.2GWh BESS projects under development 0.6GWh Ready to Build (RTB) projects in advanced stages of acquisition (Agreement to acquire 0.2GWh executed in July 2026) Italy | FER X tender award Two projects awarded tariffs under Italy's FER X tender, guaranteed tariff for 20 years. Project Progress 100MW 2 projects 20 Years of guaranteed tariff 185MW Expected grid connection in 2026 and early 2027 28MW Construction of two new Solar projects in the U.S. began in June 2026 67.7€/MWh Weighted tariff (before indexation) 227MW Pre-construction (RTB) projects Creating Sources for Growth Acceleration MWh 1,872 Manara pumped storage Work resumed at an accelerated pace
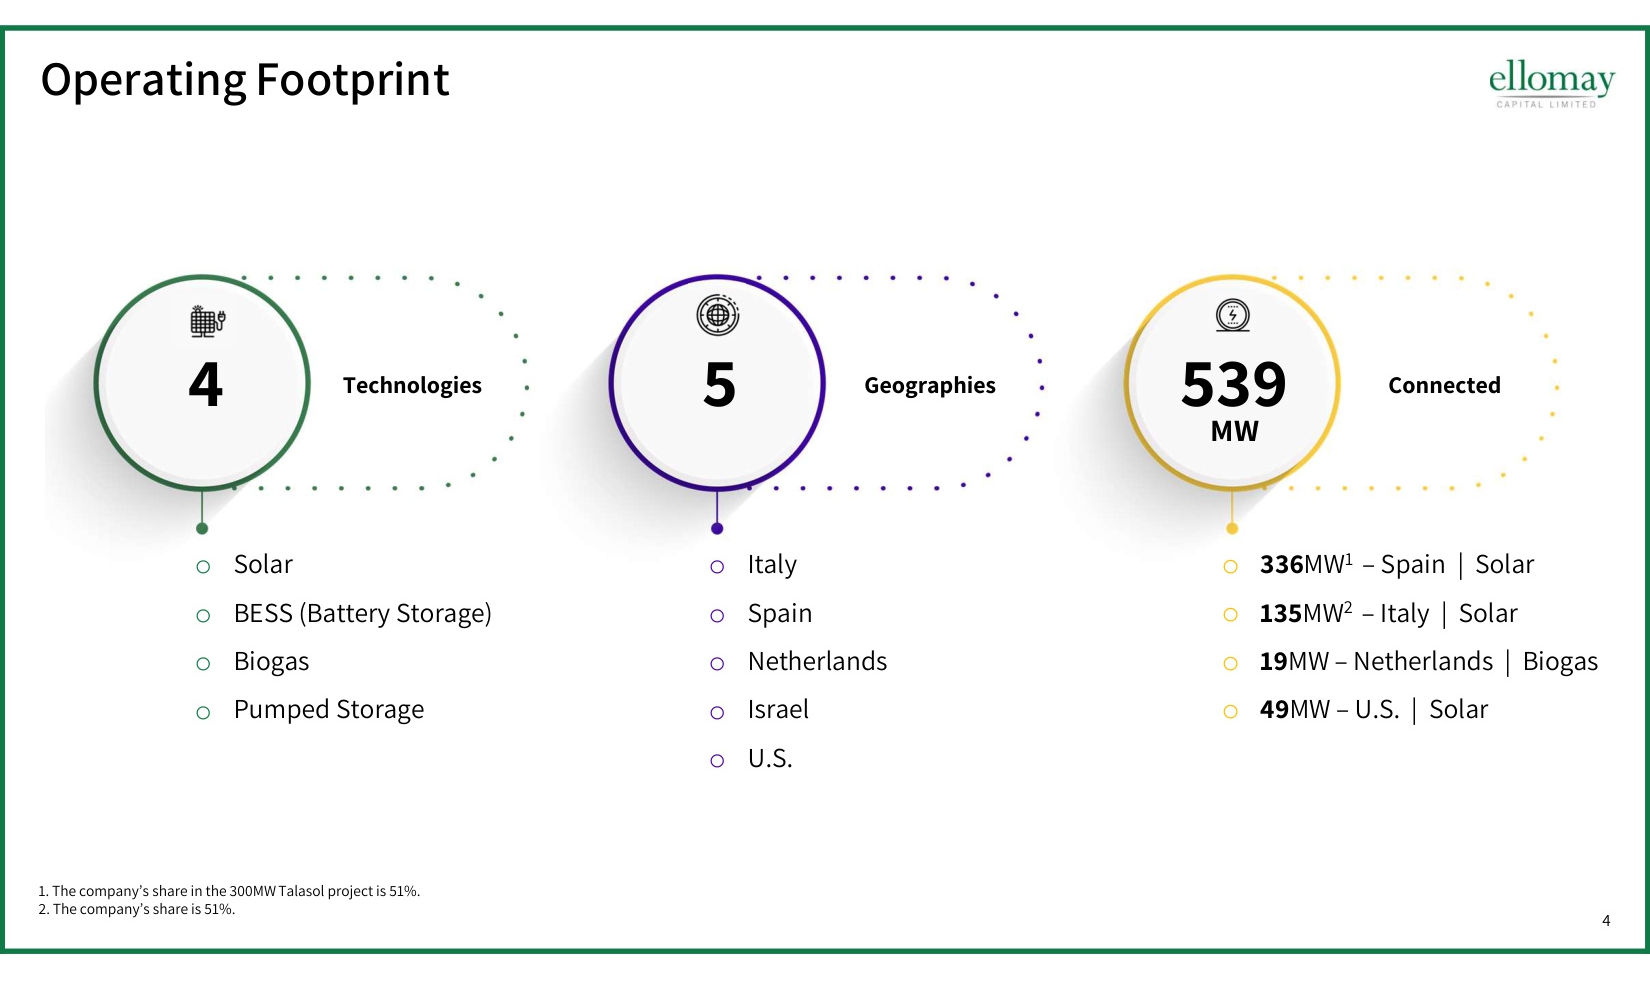
4 Operating Footprint 1. The company's share in the 300MW Talasol project is 51%. 2. The company's share is 51%. o Solar o BESS (Battery Storage) o Biogas o Pumped Storage 4 Technologies o Italy o Spain o Netherlands o Israel o U.S. 5 Geographies o 336MW1 – Spain | Solar o 135MW2 – Italy | Solar o 19MW – Netherlands | Biogas o 49MW – U.S. | Solar 539 Connected MW
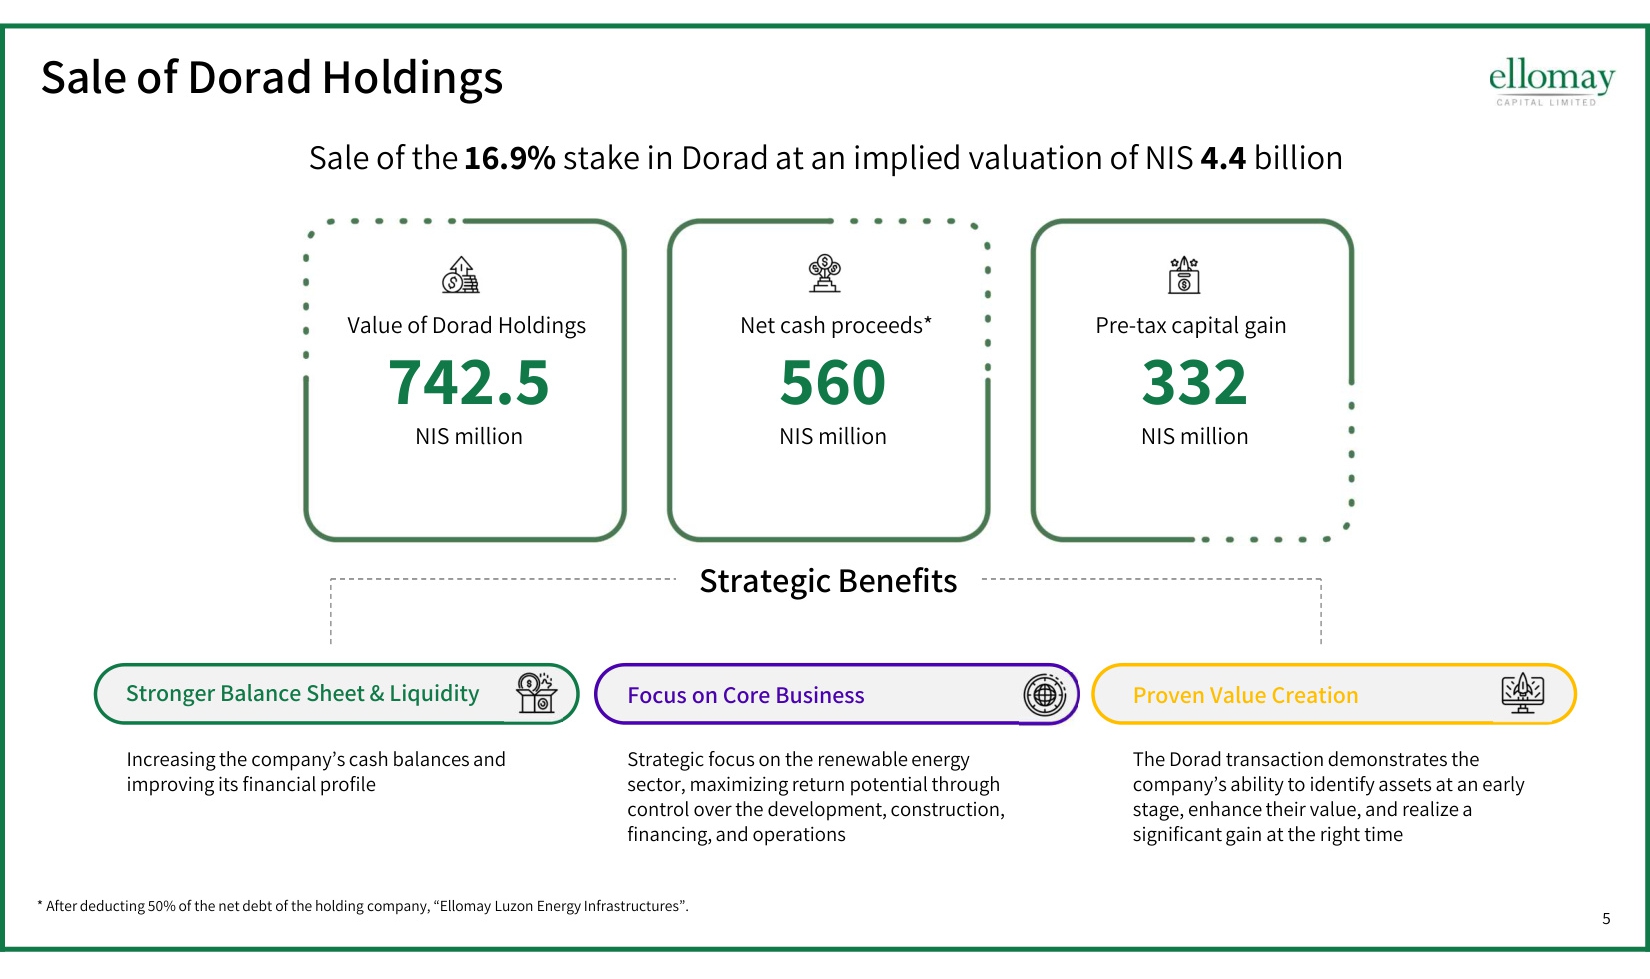
5 Sale of Dorad Holdings Sale of the 16.9% stake in Dorad at an implied valuation of NIS 4.4 billion 742.5 NIS million Value of Dorad Holdings 560 NIS million Net cash proceeds* 332 NIS million Pre-tax capital gain * After deducting 50% of the net debt of the holding company, "Ellomay Luzon Energy Infrastructures". Strategic Benefits The Dorad transaction demonstrates the company's ability to identify assets at an early stage, enhance their value, and realize a significant gain at the right time Strategic focus on the renewable energy sector, maximizing return potential through control over the development, construction, financing, and operations Stronger Balance Sheet & Liquidity Increasing the company's cash balances and improving its financial profile Focus on Core Business Proven Value Creation
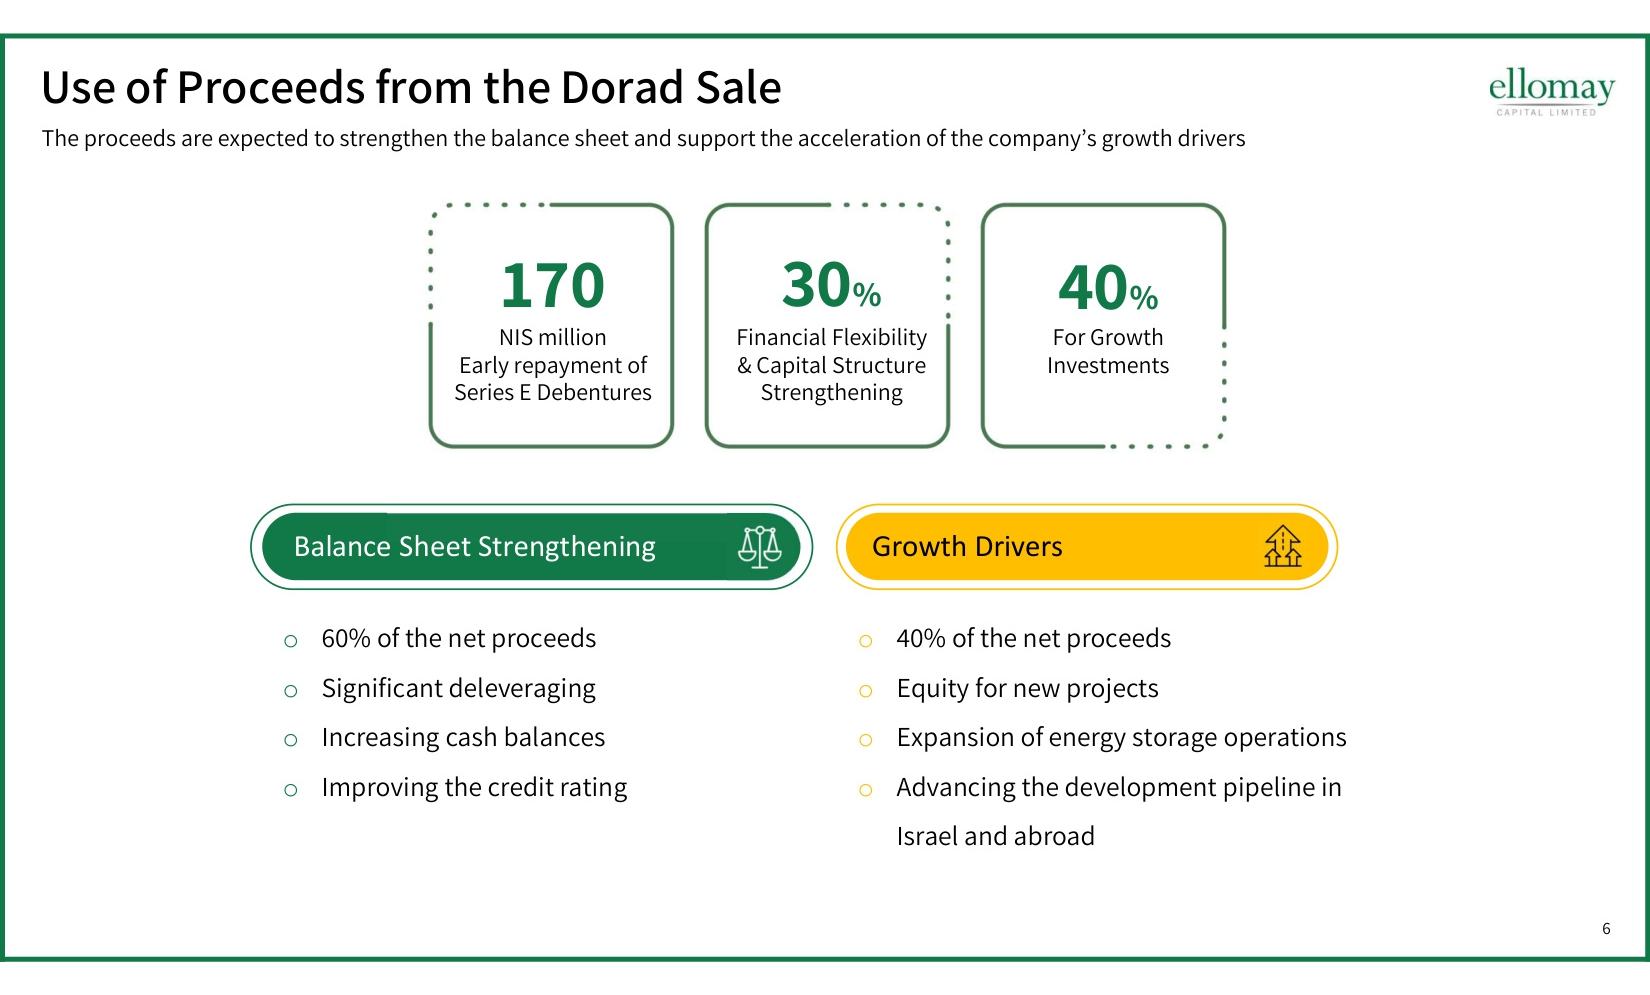
6 Use of Proceeds from the Dorad Sale The proceeds are expected to strengthen the balance sheet and support the acceleration of the company's growth drivers o 40% of the net proceeds o Equity for new projects o Expansion of energy storage operations o Advancing the development pipeline in Israel and abroad o 60% of the net proceeds o Significant deleveraging o Increasing cash balances o Improving the credit rating Growth Drivers NIS million Early repayment of Series E Debentures Financial Flexibility & Capital Structure Strengthening 170 % 30 For Growth Investments % 40 Balance Sheet Strengthening
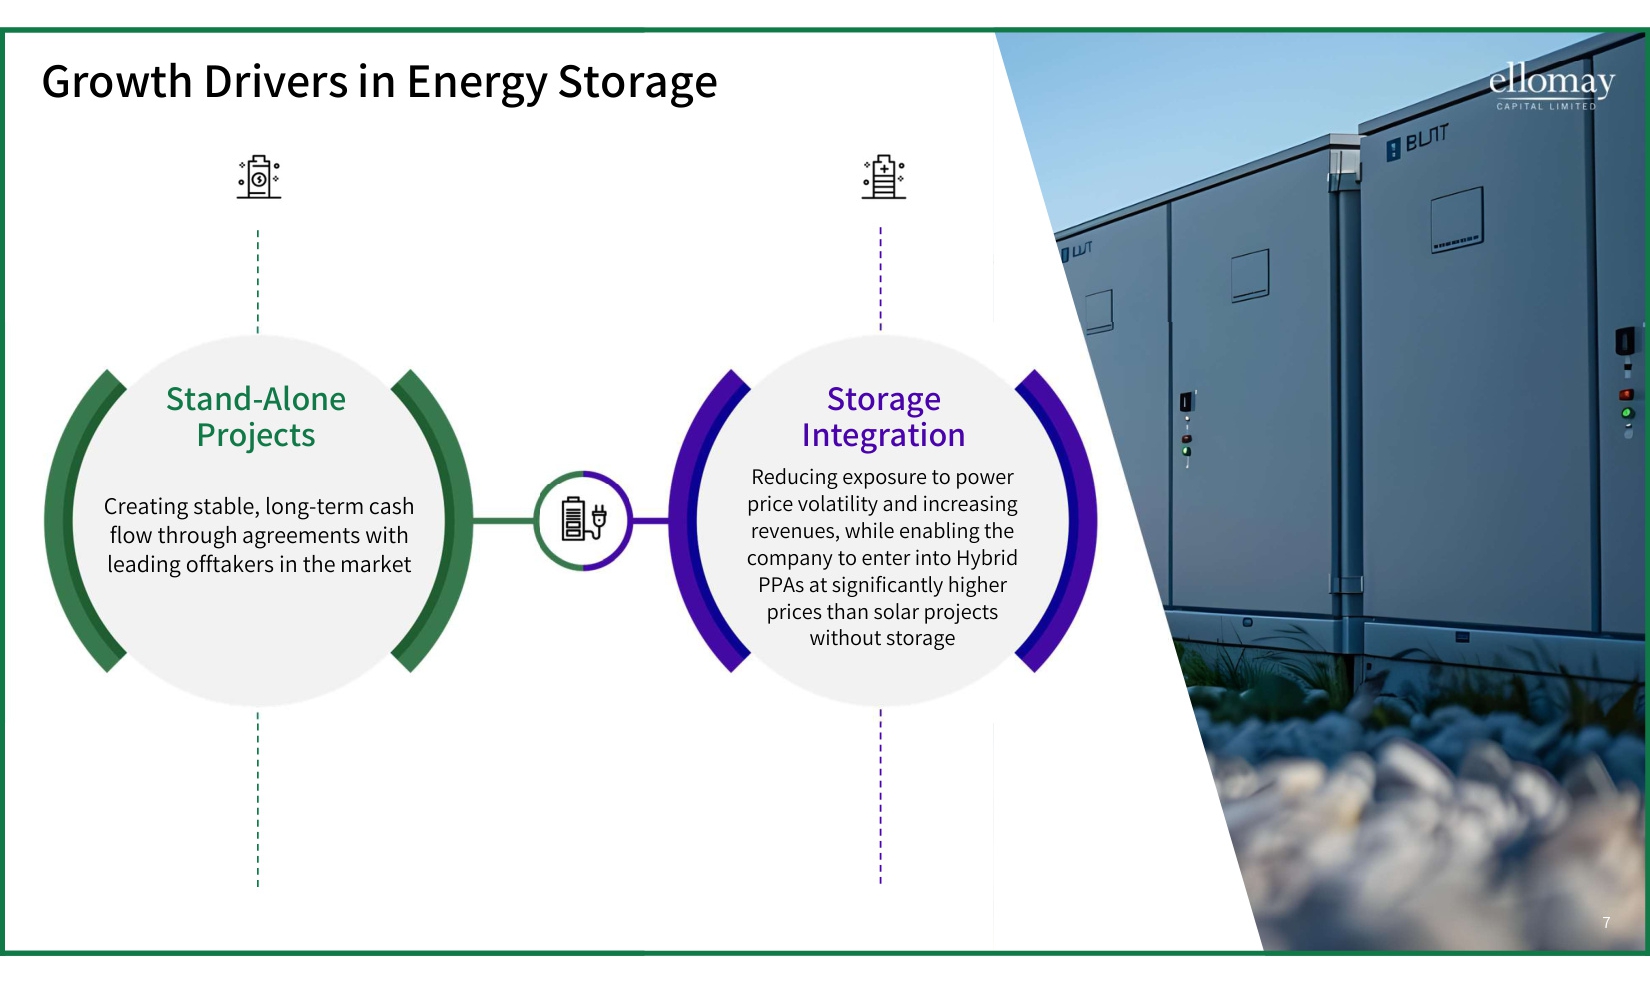
7 7 Growth Drivers in Energy Storage Creating stable, long-term cash flow through agreements with leading offtakers in the market Stand-Alone Projects Reducing exposure to power price volatility and increasing revenues, while enabling the company to enter into Hybrid PPAs at significantly higher prices than solar projects without storage Storage Integration
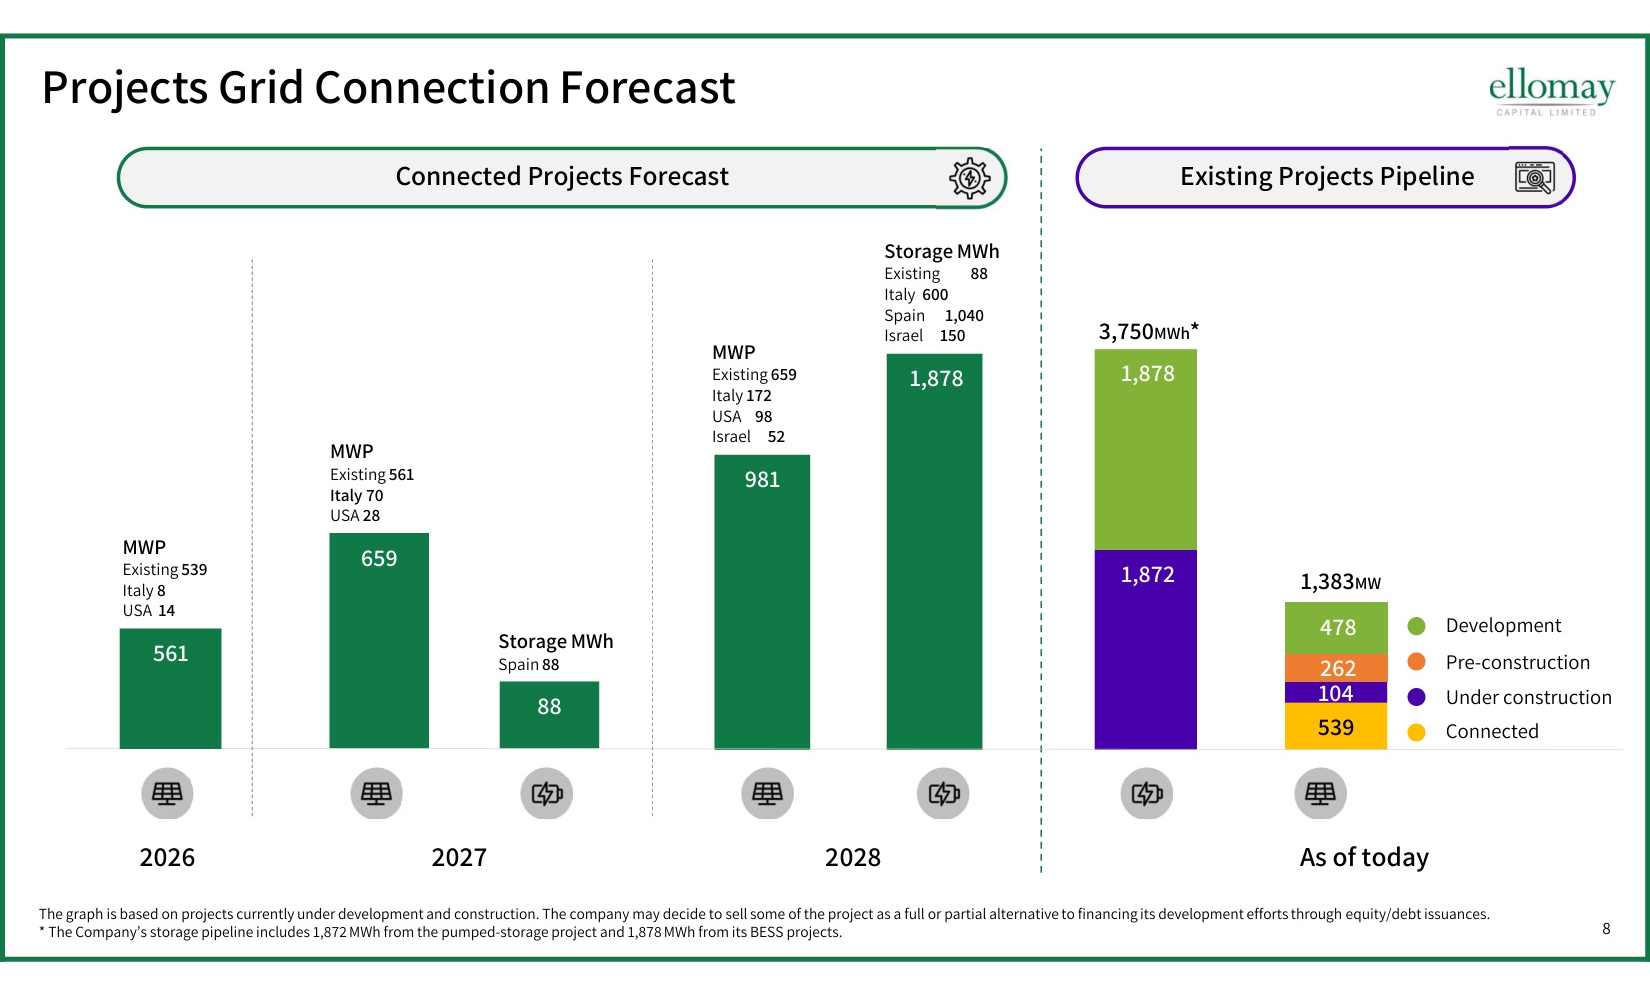
8 539 104 1,872 262 478 1,878 659 88 981 1,878 Projects Grid Connection Forecast As of today 2026 2028 MWP Existing 561 Italy 70 USA 28 Storage MWh Spain 88 MWP Existing 659 Italy 172 USA 98 Israel 52 Storage MWh Existing 88 Italy 600 Spain 1,040 Israel 150 1,383MW * MWh 3,750 Development Pre-construction Under construction Connected Existing Projects Pipeline Connected Projects Forecast 2027 MWP Existing 539 Italy 8 USA 14 561 The graph is based on projects currently under development and construction. The company may decide to sell some of the project as a full or partial alternative to financing its development efforts through equity/debt issuances. * The Company's storage pipeline includes 1,872 MWh from the pumped-storage project and 1,878 MWh from its BESS projects.
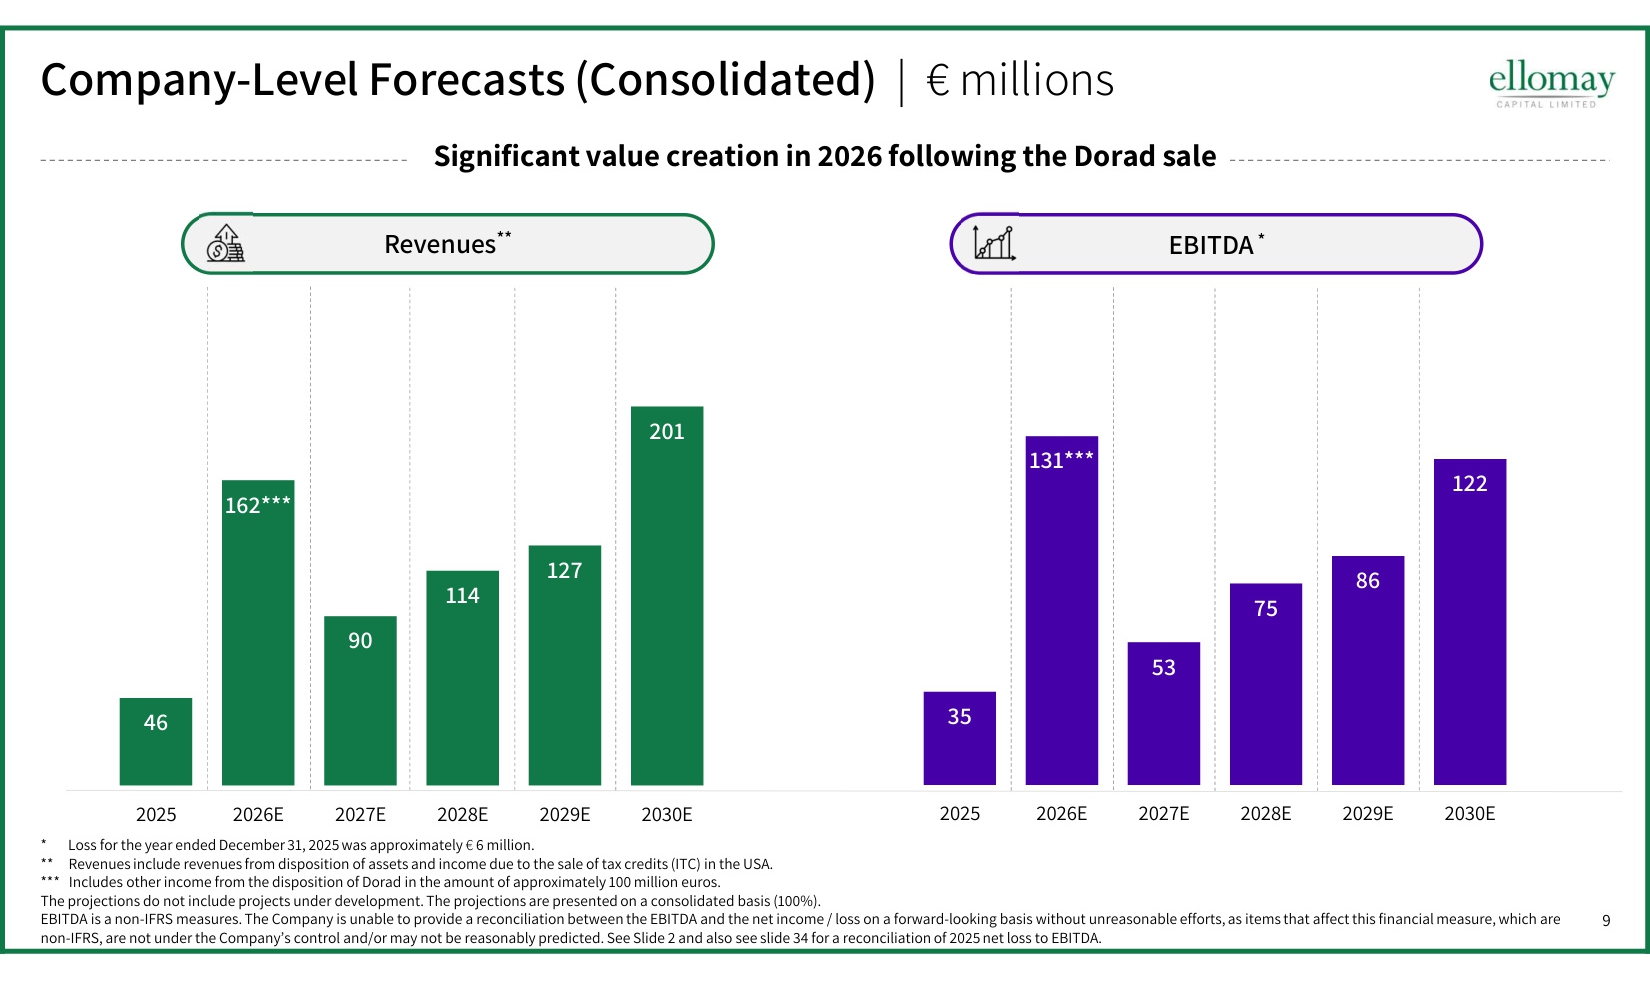
9 Company-Level Forecasts (Consolidated) | € millions EBITDA * Revenues** Significant value creation in 2026 following the Dorad sale * Loss for the year ended December 31, 2025was approximately € 6 million. ** Revenues include revenues from disposition of assets and income due to the sale of tax credits (ITC) in the USA. *** Includes other income from the disposition of Dorad in the amount of approximately 100 million euros. The projections do not include projects under development. The projections are presented on a consolidated basis (100%). EBITDA is a non-IFRS measures. The Company is unable to provide a reconciliation between the EBITDA and the net income / loss on a forward-looking basis without unreasonable efforts, as items that affect this financial measure, which are non-IFRS, are not under the Company's control and/or may not be reasonably predicted. See Slide 2 and also see slide 34 for a reconciliation of 2025 net loss to EBITDA. 46 162*** 90 114 127 201 2025 2026E 2027E 2028E 2029E 2030E 35 131*** 53 75 86 122 2025 2026E 2027E 2028E 2029E 2030E
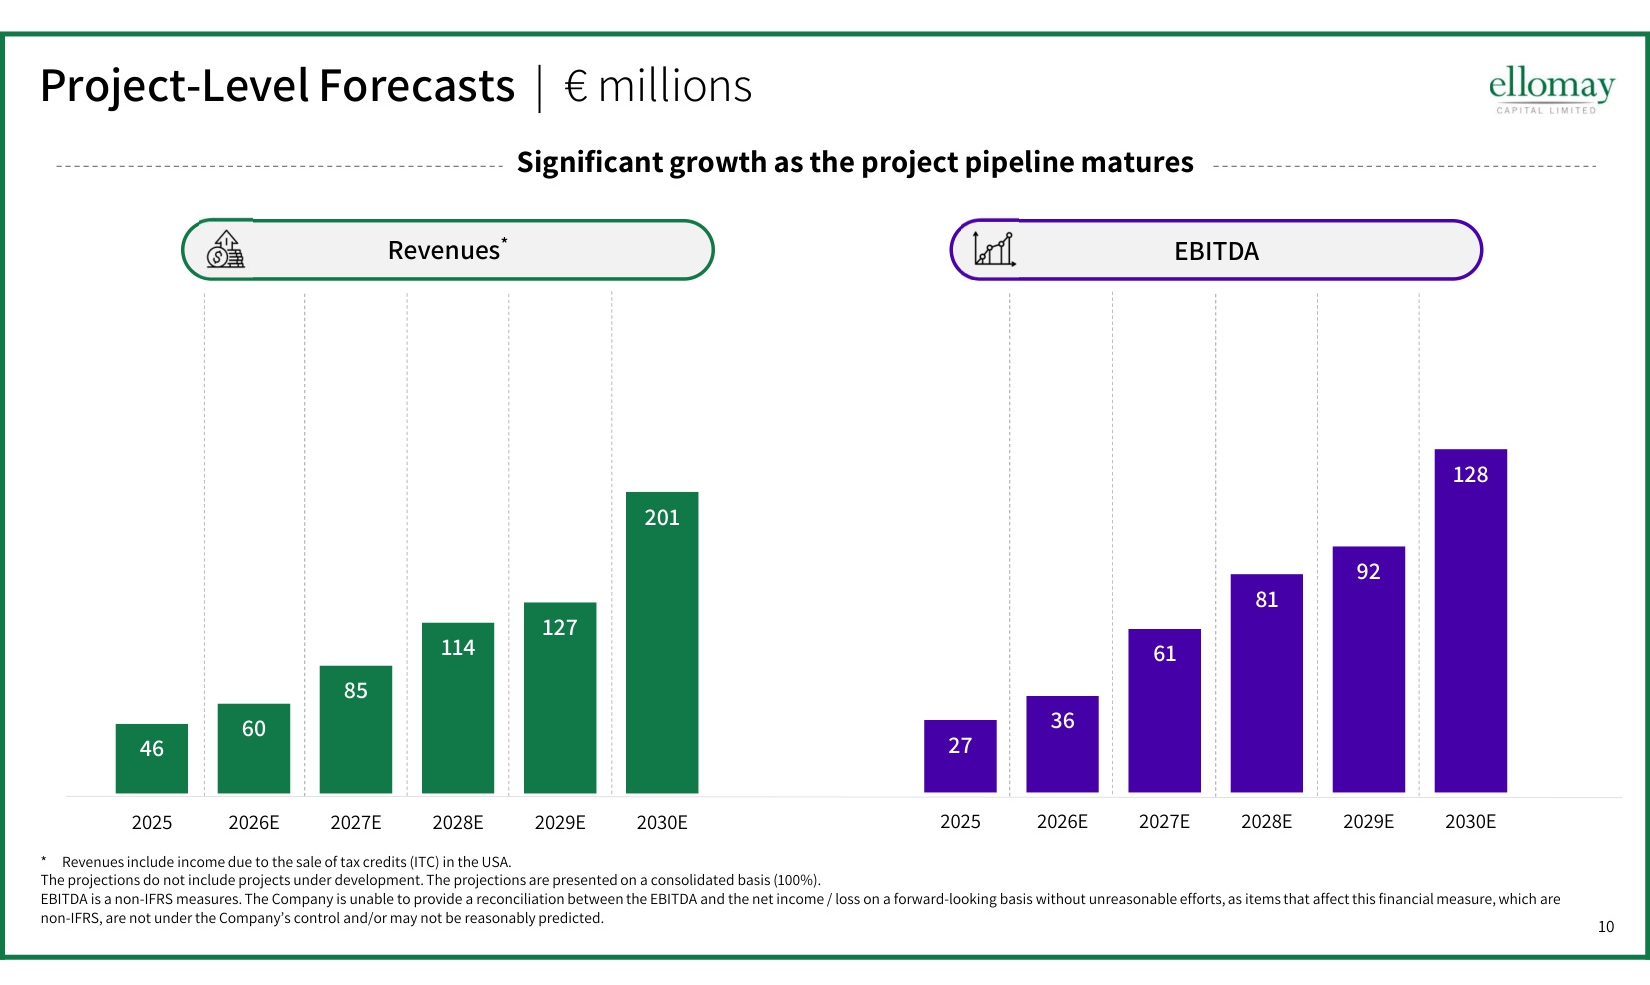
10 Project-Level Forecasts | € millions Significant growth as the project pipeline matures EBITDA Revenues* * Revenues include income due to the sale of tax credits (ITC) in the USA. The projections do not include projects under development. The projections are presented on a consolidated basis (100%). EBITDA is a non-IFRS measures. The Company is unable to provide a reconciliation between the EBITDA and the net income / loss on a forward-looking basis without unreasonable efforts, as items that affect this financial measure, which are non-IFRS, are not under the Company's control and/or may not be reasonably predicted. 46 60 85 114 127 201 2025 2026E 2027E 2028E 2029E 2030E 27 36 61 81 92 128 2025 2026E 2027E 2028E 2029E 2030E
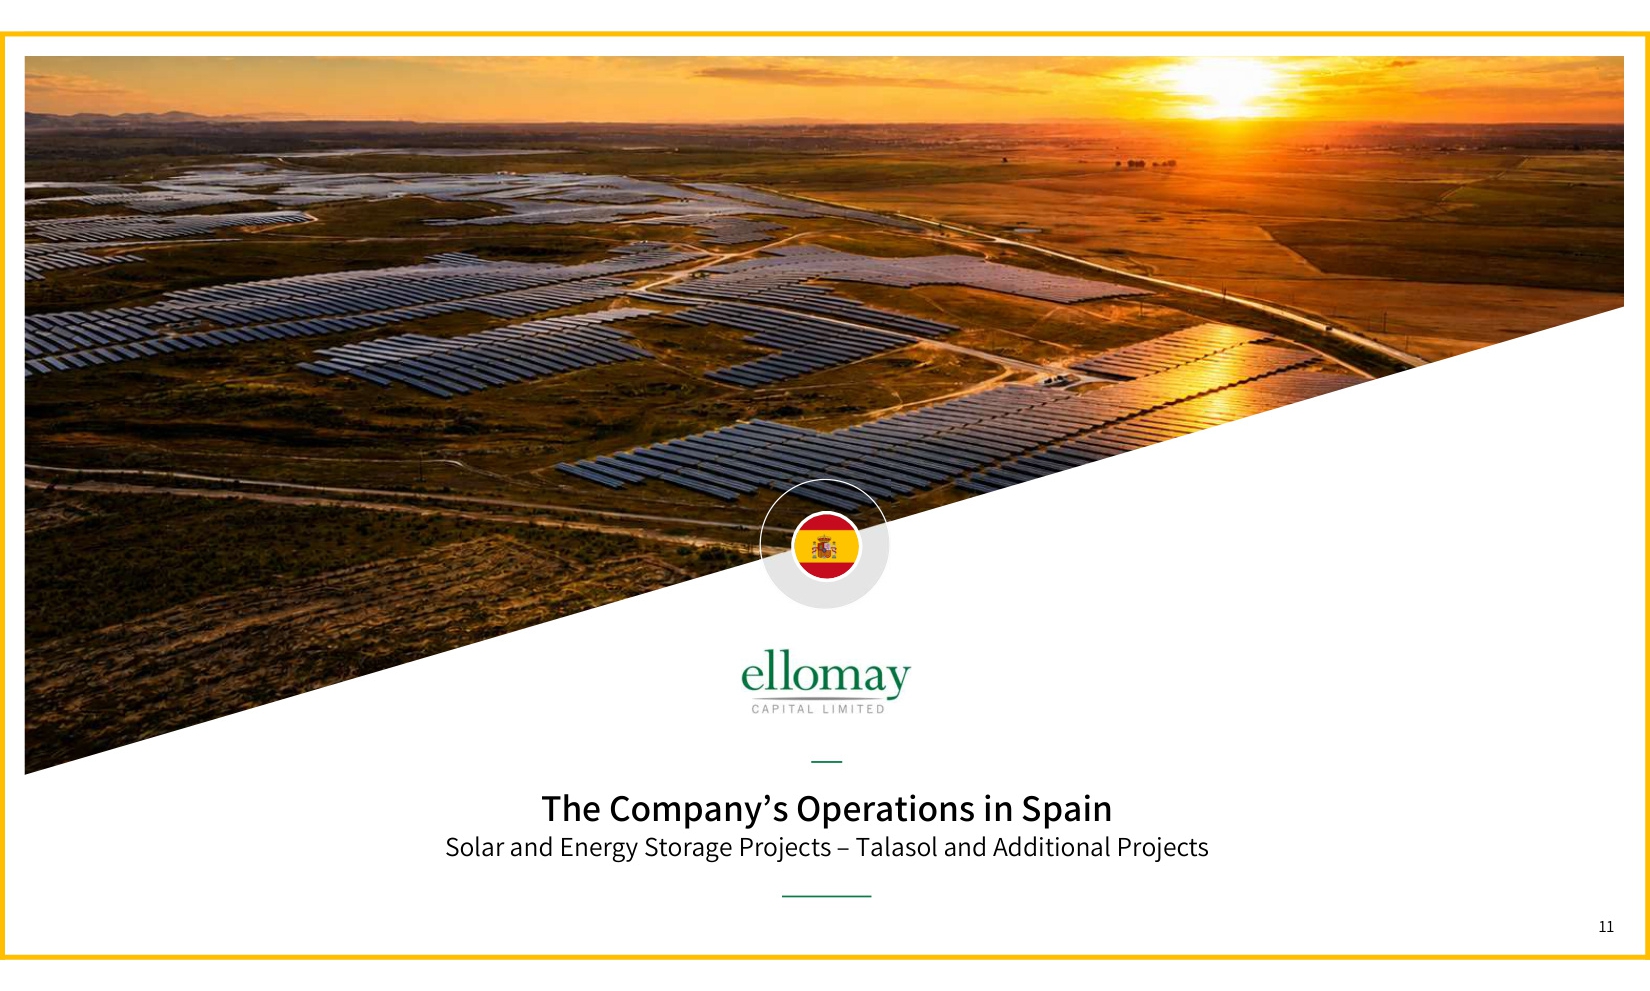
11 The Company's Operations in Spain Solar and Energy Storage Projects – Talasol and Additional Projects 11
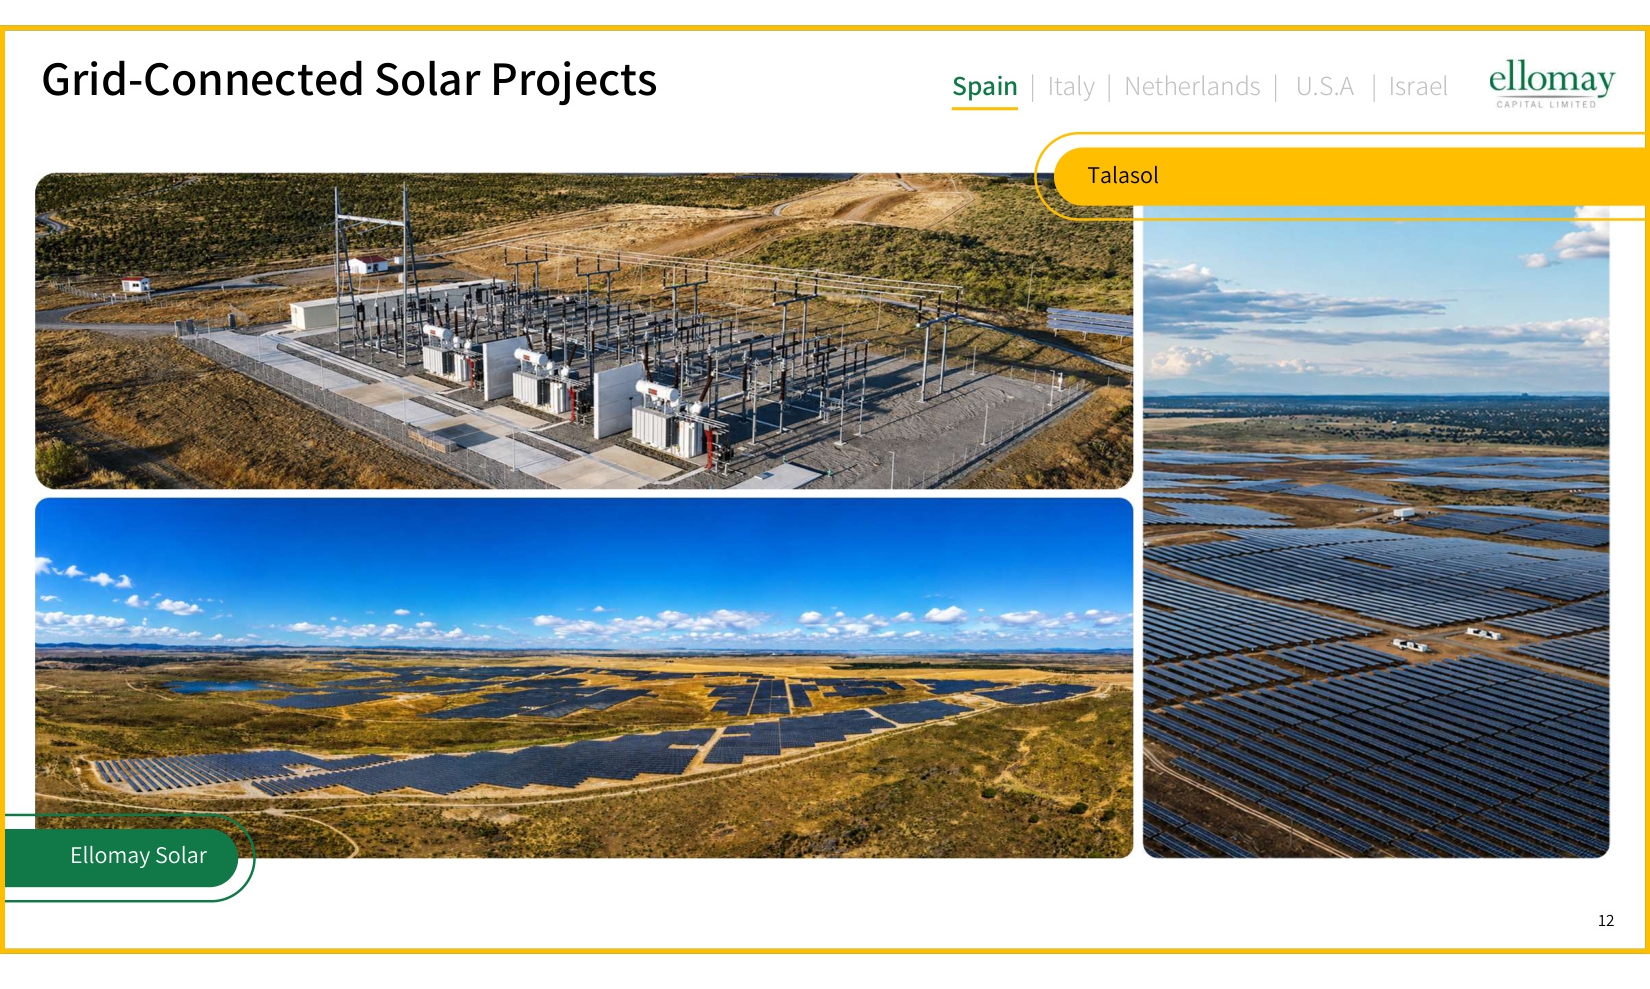
12 Grid-Connected Solar Projects Talasol Ellomay Solar Spain | Italy | Netherlands | U.S.A | Israel
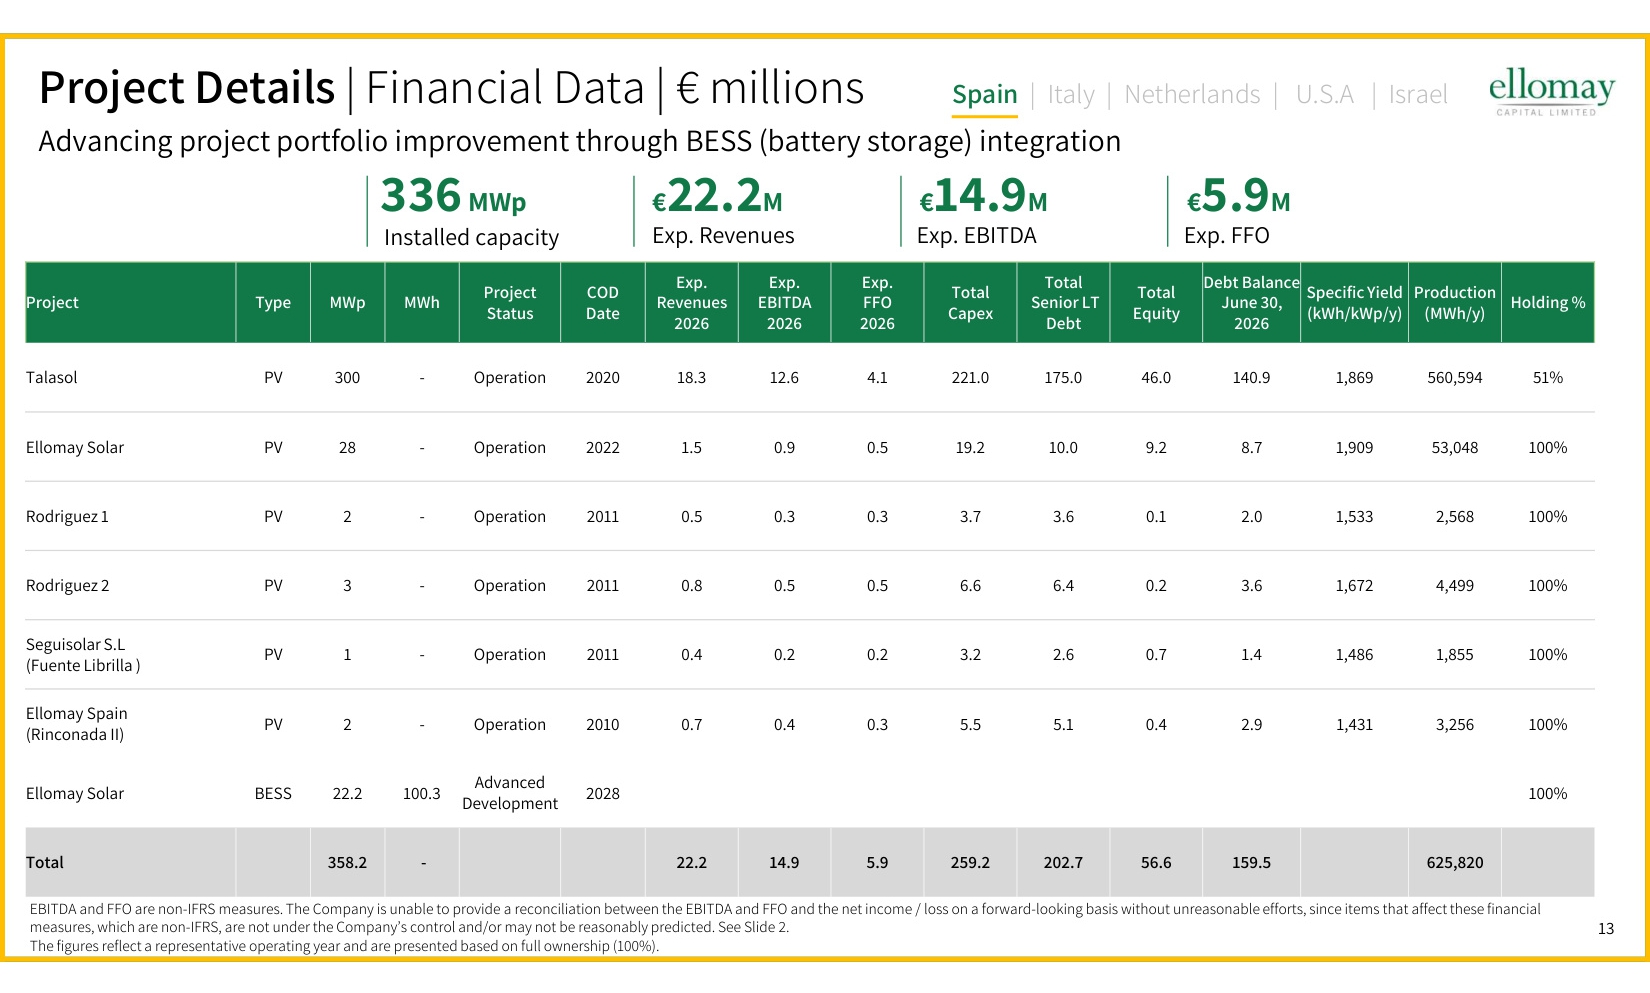
13 Holding % Production (MWh/y) Specific Yield (kWh/kWp/y) Debt Balance June 30, 2026 Total Equity Total Senior LT Debt Total Capex Exp. FFO 2026 Exp. EBITDA 2026 Exp. Revenues 2026 COD Date Project Status MWh MWp Type Project 51% 560,594 1,869 140.9 46.0 175.0 221.0 4.1 12.6 18.3 2020 Operation - 300 PV Talasol 100% 53,048 1,909 8.7 9.2 10.0 19.2 0.5 0.9 1.5 2022 Operation - 28 PV Ellomay Solar 100% 2,568 1,533 2.0 0.1 3.6 3.7 0.3 0.3 0.5 2011 Operation - 2 PV Rodriguez 1 100% 4,499 1,672 3.6 0.2 6.4 6.6 0.5 0.5 0.8 2011 Operation - 3 PV Rodriguez 2 100% 1,855 1,486 1.4 0.7 2.6 3.2 0.2 0.2 0.4 2011 Operation - 1 PV Seguisolar S.L (Fuente Librilla ) 100% 3,256 1,431 2.9 0.4 5.1 5.5 0.3 0.4 0.7 2010 Operation - 2 PV Ellomay Spain (Rinconada II) 100% 2028 Advanced Development 100.3 22.2 BESS Ellomay Solar 625,820 159.5 56.6 202.7 259.2 5.9 14.9 22.2 - 358.2 Total 336 MWp €22.2M Exp. Revenues €14.9M Exp. EBITDA Installed capacity Advancing project portfolio improvement through BESS (battery storage) integration €5.9M Exp. FFO EBITDA and FFO are non-IFRS measures. The Company is unable to provide a reconciliation between the EBITDA and FFO and the net income / loss on a forward-looking basis without unreasonable efforts, since items that affect these financial measures, which are non-IFRS, are not under the Company's control and/or may not be reasonably predicted. See Slide 2. The figures reflect a representative operating year and are presented based on full ownership (100%). Spain | Italy | Netherlands | U.S.A | Israel Project Details | Financial Data | € millions
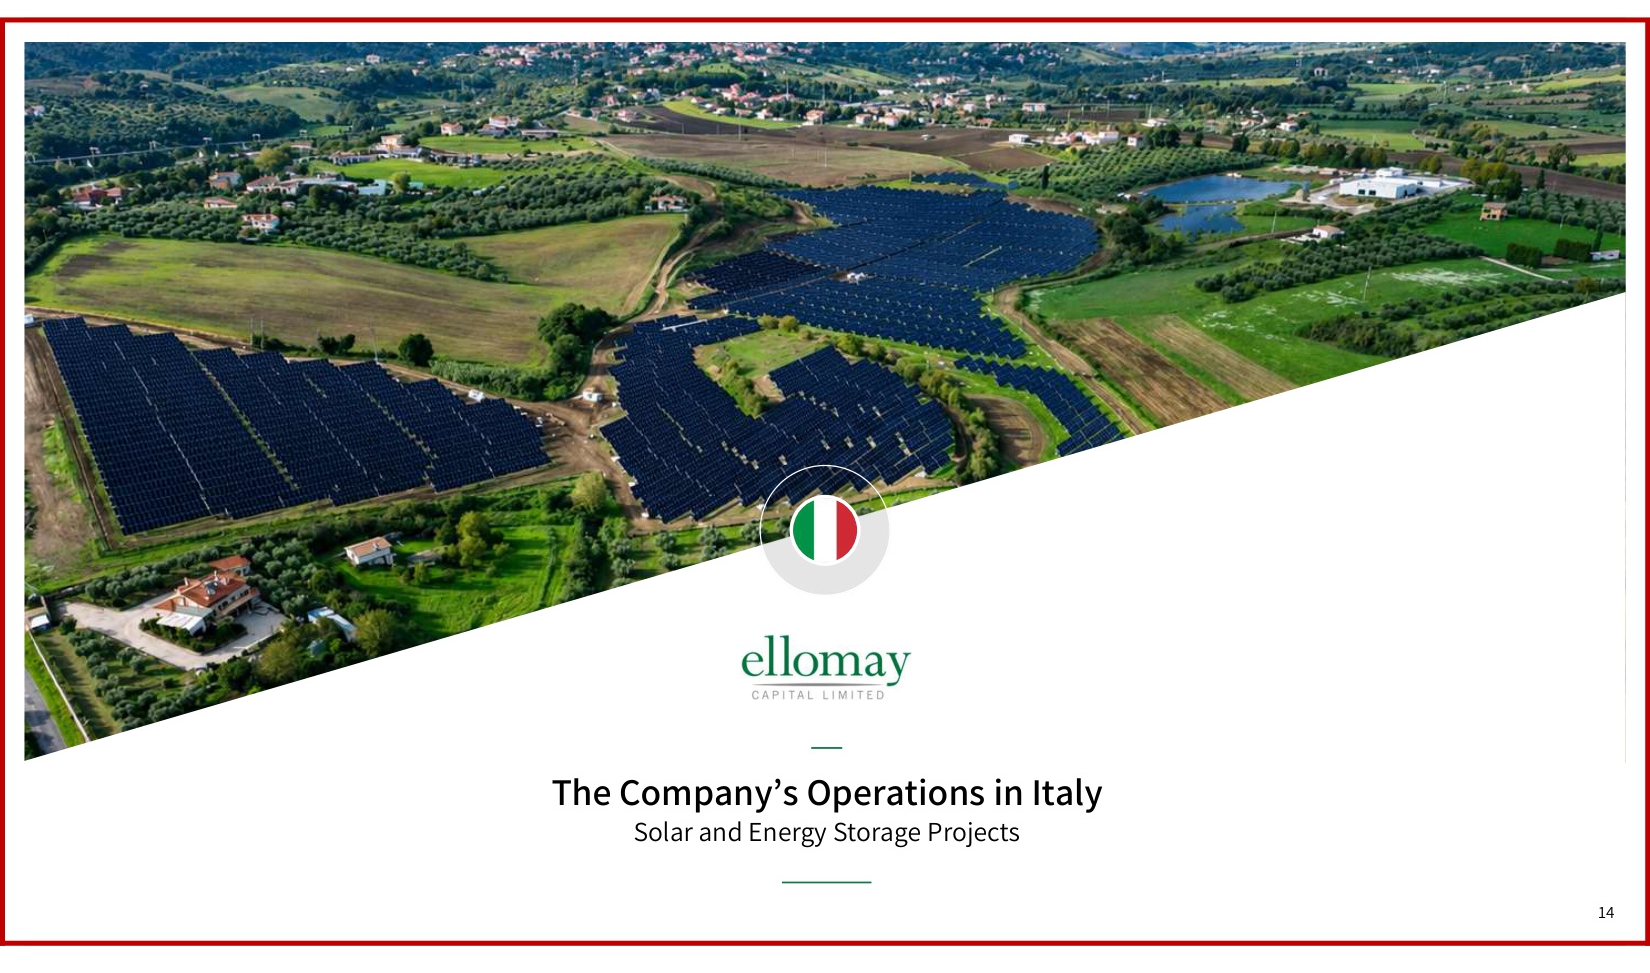
14 The Company's Operations in Italy Solar and Energy Storage Projects 14
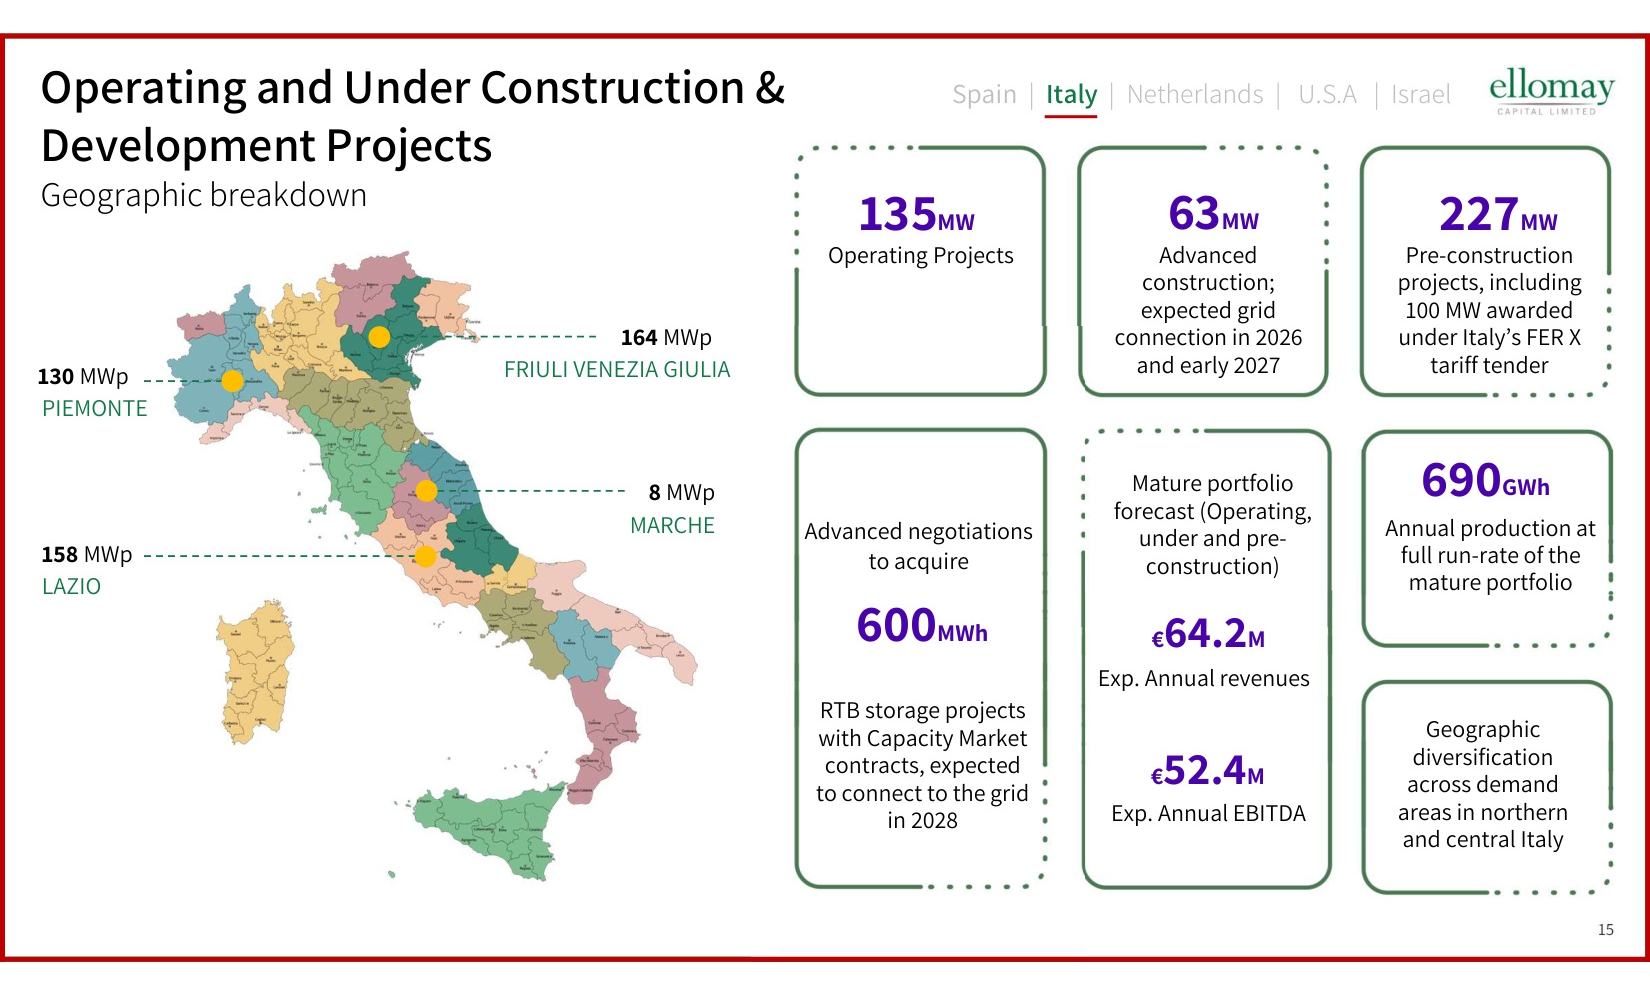
15 Operating and Under Construction & Development Projects Geographic breakdown MW 35 1 Operating Projects 63MW Advanced construction; expected grid connection in 2026 and early 2027 227MW Pre-construction projects, including 100 MW awarded under Italy's FER X tariff tender RTB storage projects with Capacity Market contracts, expected to connect to the grid in 2028 MWh 600 Mature portfolio forecast (Operating, under and pre- construction) Exp. Annual revenues €64.2M Exp. Annual EBITDA € . 52 4M GWh 690 Annual production at full run-rate of the mature portfolio Geographic diversification across demand areas in northern and central Italy 164 MWp FRIULI VENEZIA GIULIA 8 MWp MARCHE 130 MWp PIEMONTE 158 MWp LAZIO Advanced negotiations to acquire Spain | Italy | Netherlands | U.S.A | Israel
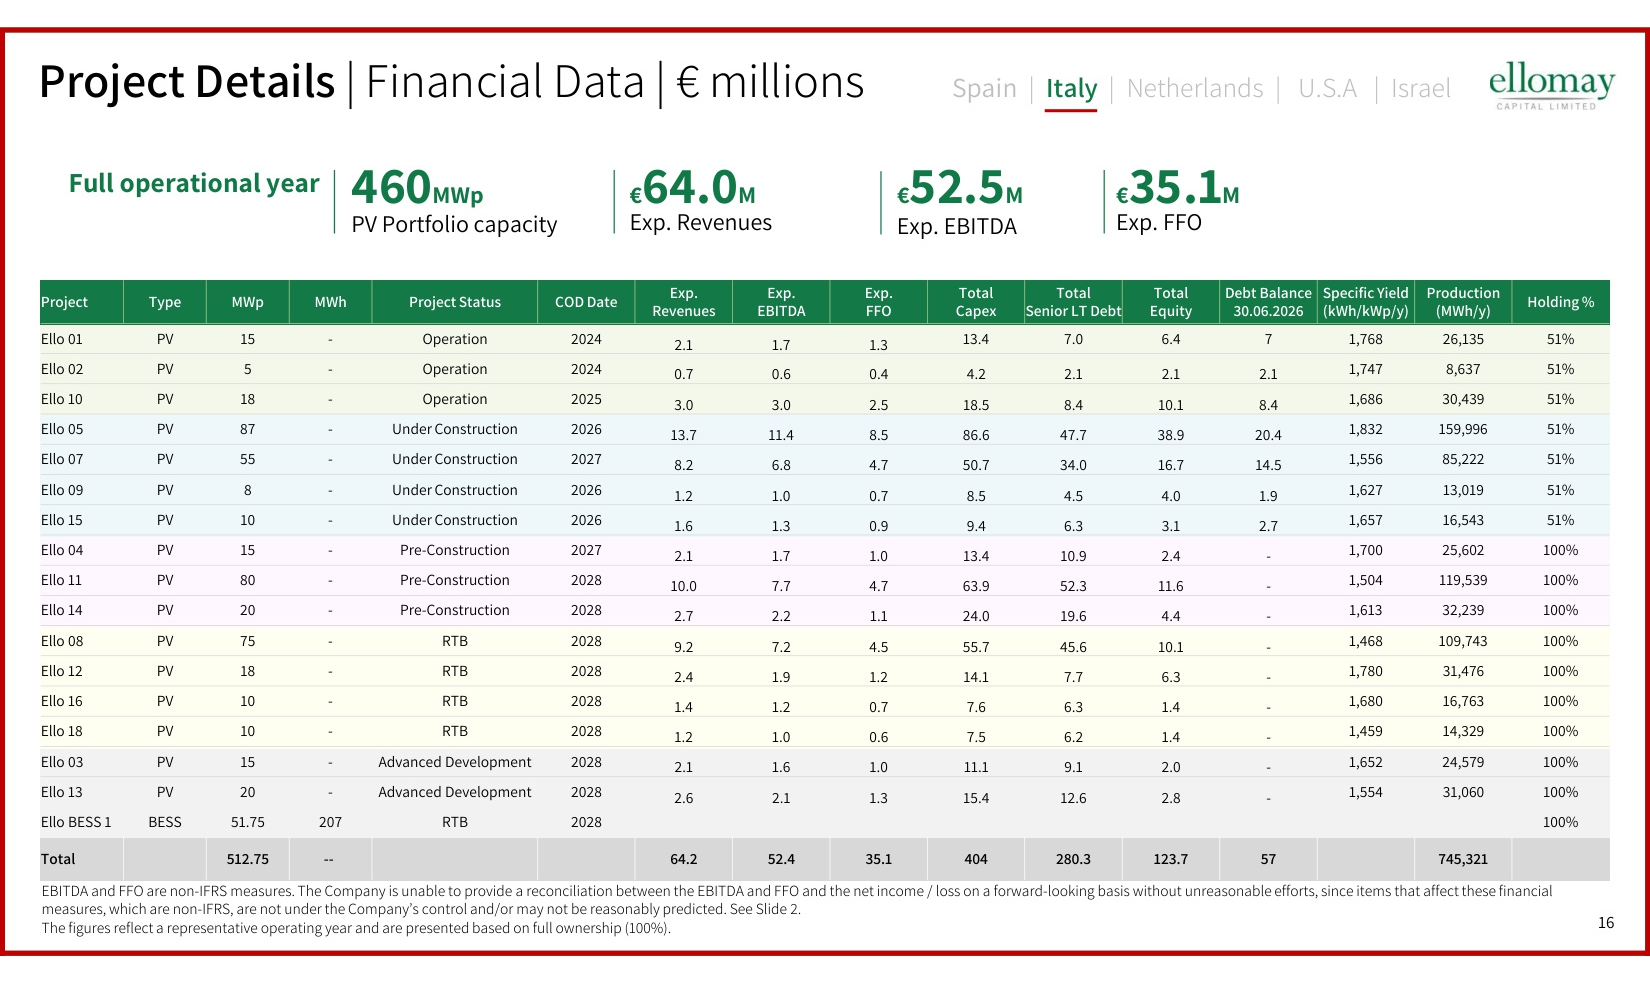
16 Holding % Production (MWh/y) Specific Yield (kWh/kWp/y) Debt Balance 30.06.2026 Total Equity Total Senior LT Debt Total Capex Exp. FFO Exp. EBITDA Exp. Revenues COD Date Project Status MWh MWp Type Project 51% 26,135 1,768 7 6.4 7.0 13.4 1.3 1.7 2.1 2024 Operation - 15 PV Ello 01 51% 8,637 1,747 2.1 2.1 2.1 4.2 0.4 0.6 0.7 2024 Operation - 5 PV Ello 02 51% 30,439 1,686 8.4 10.1 8.4 18.5 2.5 3.0 3.0 2025 Operation - 18 PV Ello 10 51% 159,996 1,832 20.4 38.9 47.7 86.6 8.5 11.4 13.7 2026 Under Construction - 87 PV Ello 05 51% 85,222 1,556 14.5 16.7 34.0 50.7 4.7 6.8 8.2 2027 Under Construction - 55 PV Ello 07 51% 13,019 1,627 1.9 4.0 4.5 8.5 0.7 1.0 1.2 2026 Under Construction - 8 PV Ello 09 51% 16,543 1,657 2.7 3.1 6.3 9.4 0.9 1.3 1.6 2026 Under Construction - 10 PV Ello 15 100% 25,602 1,700 - 2.4 10.9 13.4 1.0 1.7 2.1 2027 Pre-Construction - 15 PV Ello 04 100% 119,539 1,504 - 11.6 52.3 63.9 4.7 7.7 10.0 2028 Pre-Construction - 80 PV Ello 11 100% 32,239 1,613 - 4.4 19.6 24.0 1.1 2.2 2.7 2028 Pre-Construction - 20 PV Ello 14 100% 109,743 1,468 - 10.1 45.6 55.7 4.5 7.2 9.2 2028 RTB - 75 PV Ello 08 100% 31,476 1,780 - 6.3 7.7 14.1 1.2 1.9 2.4 2028 RTB - 18 PV Ello 12 100% 16,763 1,680 - 1.4 6.3 7.6 0.7 1.2 1.4 2028 RTB - 10 PV Ello 16 100% 14,329 1,459 - 1.4 6.2 7.5 0.6 1.0 1.2 2028 RTB - 10 PV Ello 18 100% 24,579 1,652 - 2.0 9.1 11.1 1.0 1.6 2.1 2028 Advanced Development - 15 PV Ello 03 100% 31,060 1,554 - 2.8 12.6 15.4 1.3 2.1 2.6 2028 Advanced Development - 20 PV Ello 13 100% 2028 RTB 207 51.75 BESS Ello BESS 1 745,321 57 123.7 280.3 404 35.1 52.4 64.2 -- 512.75 Total 460MWp PV Portfolio capacity Exp. Revenues Exp. EBITDA €64.0M €52.5M Exp. FFO €35.1M Spain | Italy | Netherlands | U.S.A | Israel EBITDA and FFO are non-IFRS measures. The Company is unable to provide a reconciliation between the EBITDA and FFO and the net income / loss on a forward-looking basis without unreasonable efforts, since items that affect these financial measures, which are non-IFRS, are not under the Company's control and/or may not be reasonably predicted. See Slide 2. The figures reflect a representative operating year and are presented based on full ownership (100%). Project Details | Financial Data | € millions Full operational year
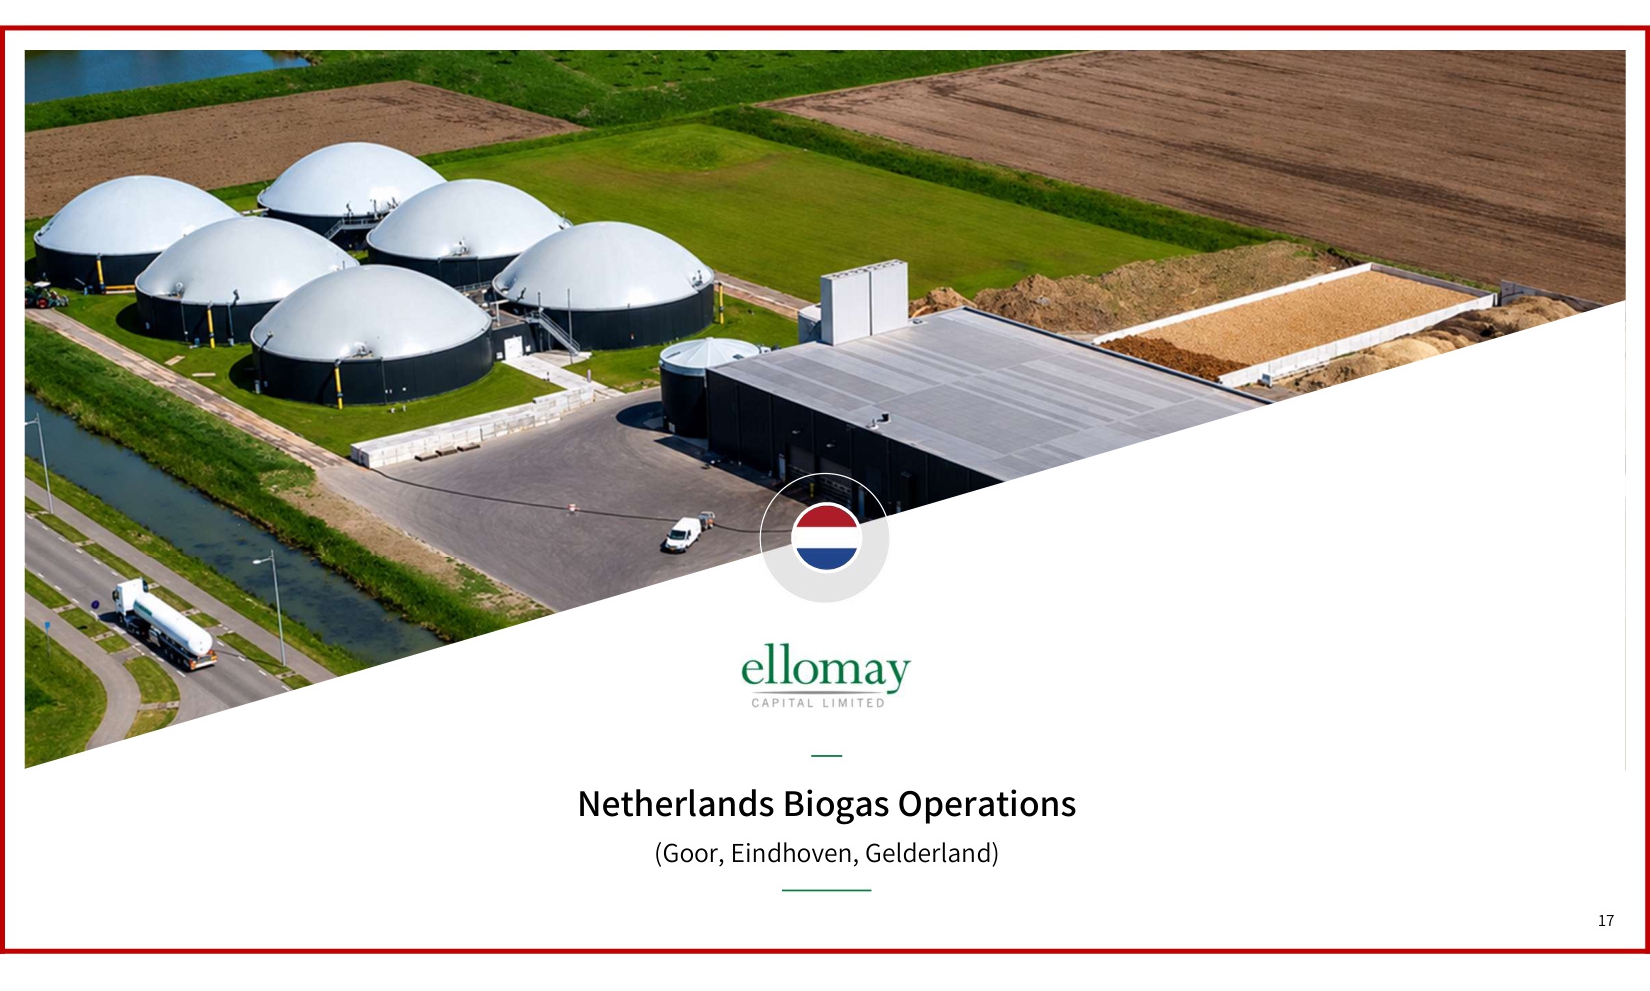
17 Netherlands Biogas Operations (Goor, Eindhoven, Gelderland) 17
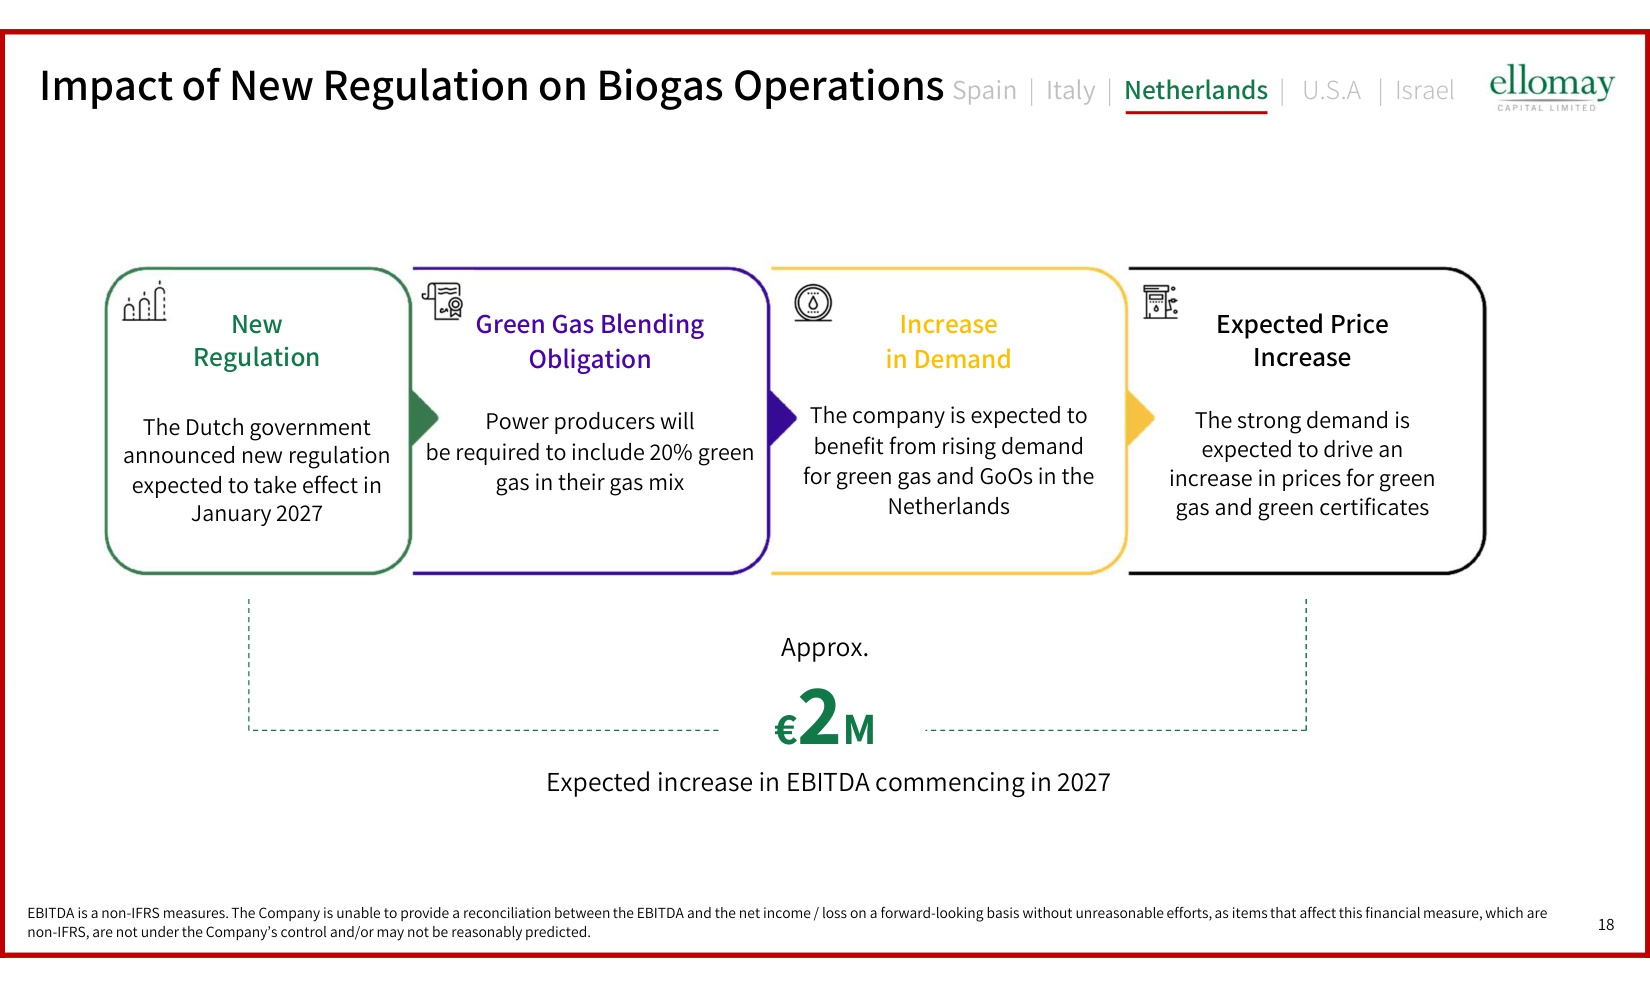
18 Impact of New Regulation on Biogas Operations Expected Price Increase The strong demand is expected to drive an increase in prices for green gas and green certificates Increase in Demand The company is expected to benefit from rising demand for green gas and GoOs in the Netherlands Green Gas Blending Obligation Power producers will be required to include 20% green gas in their gas mix New Regulation The Dutch government announced new regulation expected to take effect in January 2027 Approx. €2M Expected increase in EBITDA commencing in 2027 EBITDA is a non-IFRS measures. The Company is unable to provide a reconciliation between the EBITDA and the net income / loss on a forward-looking basis without unreasonable efforts, as items that affect this financial measure, which are non-IFRS, are not under the Company's control and/or may not be reasonably predicted. Spain | Italy | Netherlands | U.S.A | Israel
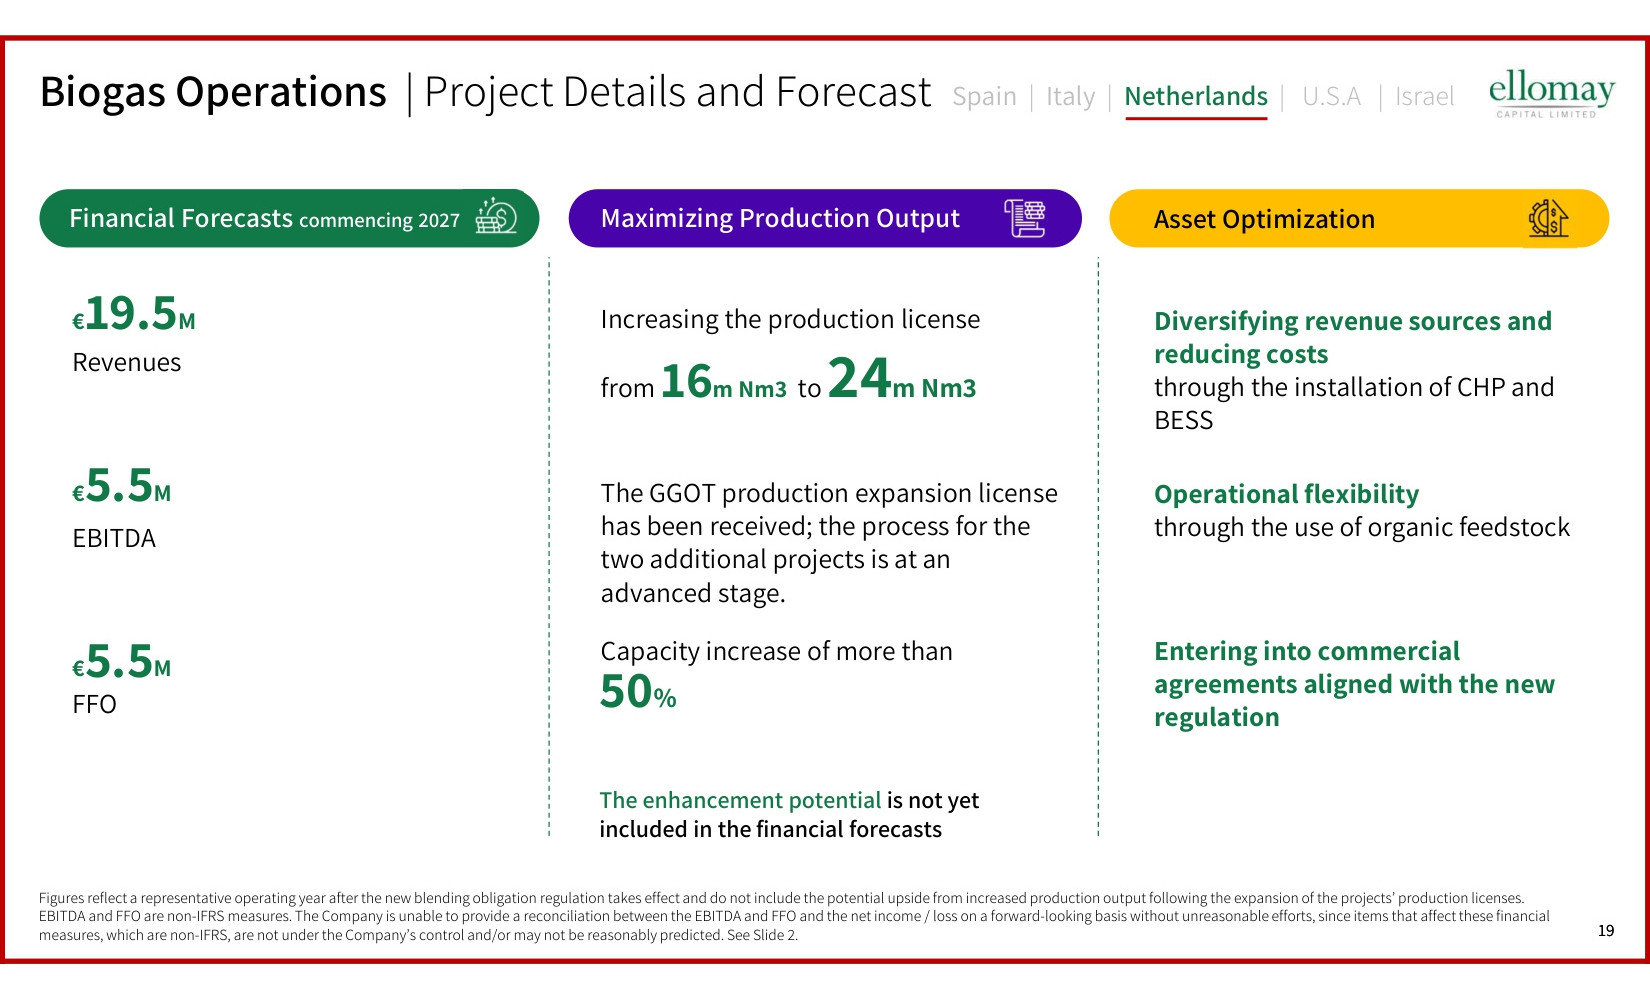
19 Biogas Operations | Project Details and Forecast €19.5M Revenues €5.5M EBITDA €5.5M FFO Financial Forecasts commencing 2027 from 16m Nm3 to 24m Nm3 50% Maximizing Production Output Increasing the production license The GGOT production expansion license has been received; the process for the two additional projects is at an advanced stage. Asset Optimization Diversifying revenue sources and reducing costs through the installation of CHP and BESS Operational flexibility through the use of organic feedstock Capacity increase of more than The enhancement potential is not yet included in the financial forecasts Entering into commercial agreements aligned with the new regulation 19 Figures reflect a representative operating year after the new blending obligation regulation takes effect and do not include the potential upside from increased production output following the expansion of the projects' production licenses. EBITDA and FFO are non-IFRS measures. The Company is unable to provide a reconciliation between the EBITDA and FFO and the net income / loss on a forward-looking basis without unreasonable efforts, since items that affect these financial measures, which are non-IFRS, are not under the Company's control and/or may not be reasonably predicted. See Slide 2. Spain | Italy | Netherlands | U.S.A | Israel
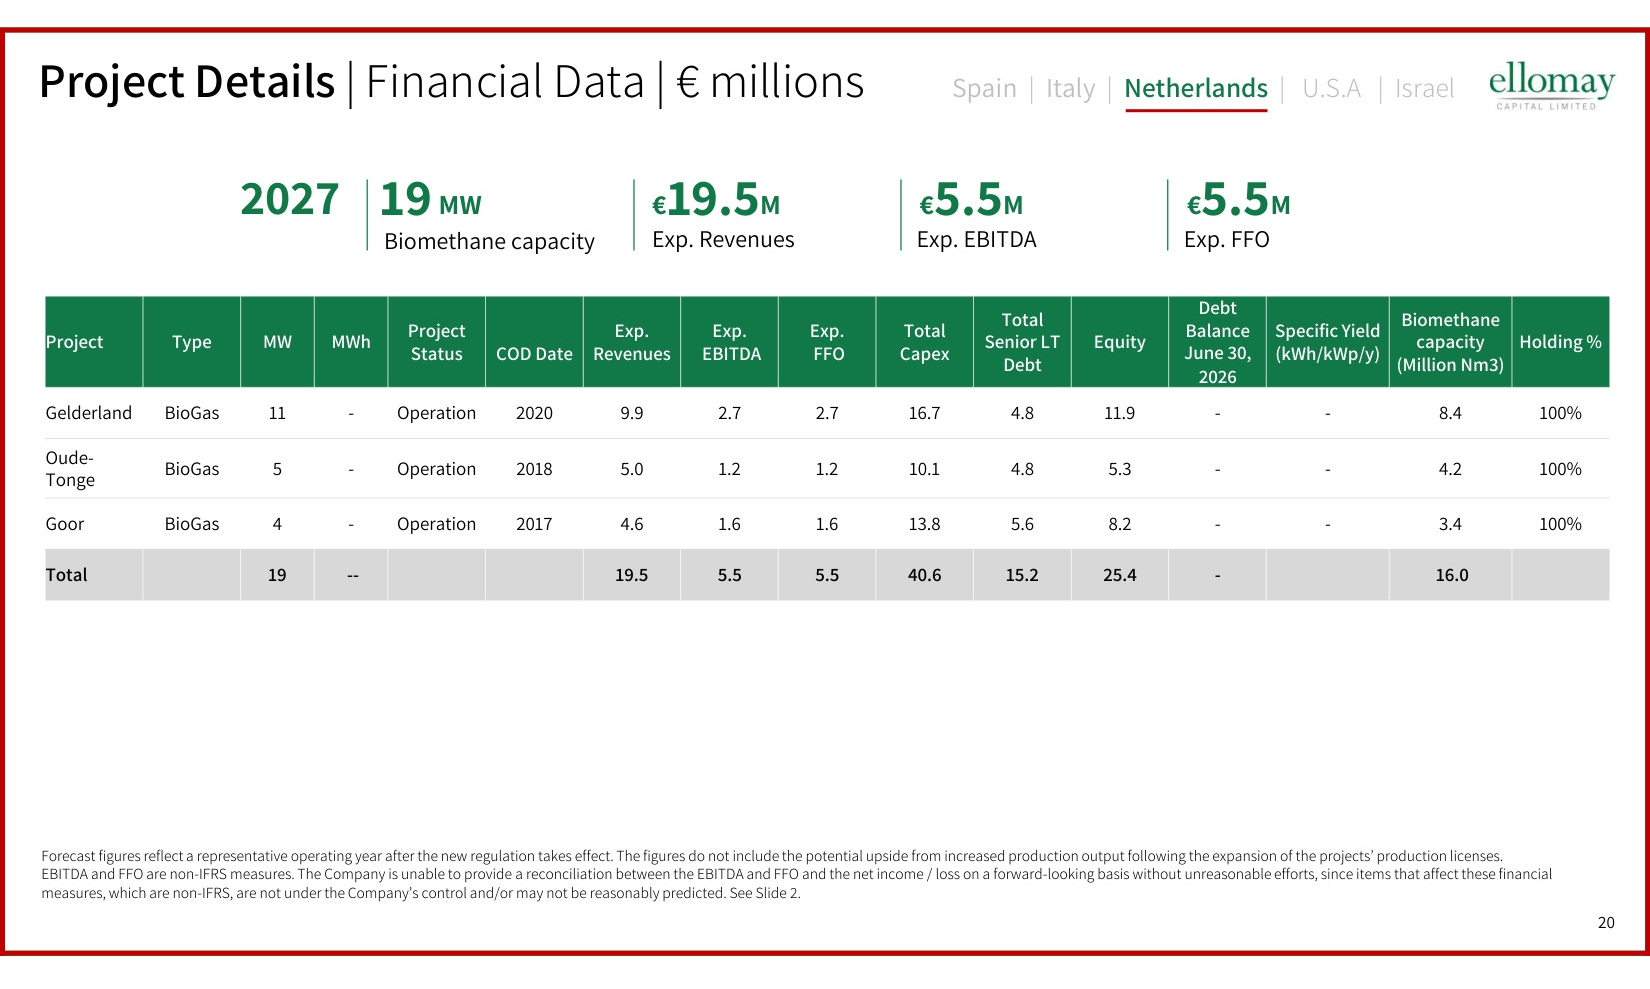
20 Holding % Biomethane capacity (Million Nm3) Specific Yield (kWh/kWp/y) Debt Balance June 30, 2026 Equity Total Senior LT Debt Total Capex Exp. FFO Exp. EBITDA Exp. Revenues COD Date Project Status MWh MW Type Project 100% 8.4 - - 11.9 4.8 16.7 2.7 2.7 9.9 2020 Operation - 11 BioGas Gelderland 100% 4.2 - - 5.3 4.8 10.1 1.2 1.2 5.0 2018 Operation - 5 BioGas Oude- Tonge 100% 3.4 - - 8.2 5.6 13.8 1.6 1.6 4.6 2017 Operation - 4 BioGas Goor 16.0 - 25.4 15.2 40.6 5.5 5.5 19.5 -- 19 Total Project Details | Financial Data | € millions 19 MW €19.5M Exp. Revenues €5.5M Exp. EBITDA Biomethane capacity €5.5M Exp. FFO Forecast figures reflect a representative operating year after the new regulation takes effect. The figures do not include the potential upside from increased production output following the expansion of the projects' production licenses. EBITDA and FFO are non-IFRS measures. The Company is unable to provide a reconciliation between the EBITDA and FFO and the net income / loss on a forward-looking basis without unreasonable efforts, since items that affect these financial measures, which are non-IFRS, are not under the Company's control and/or may not be reasonably predicted. See Slide 2. Spain | Italy | Netherlands | U.S.A | Israel 2027
21 The Company's Operations in the U.S.A Solar Projects – Texas, U.S.A 21
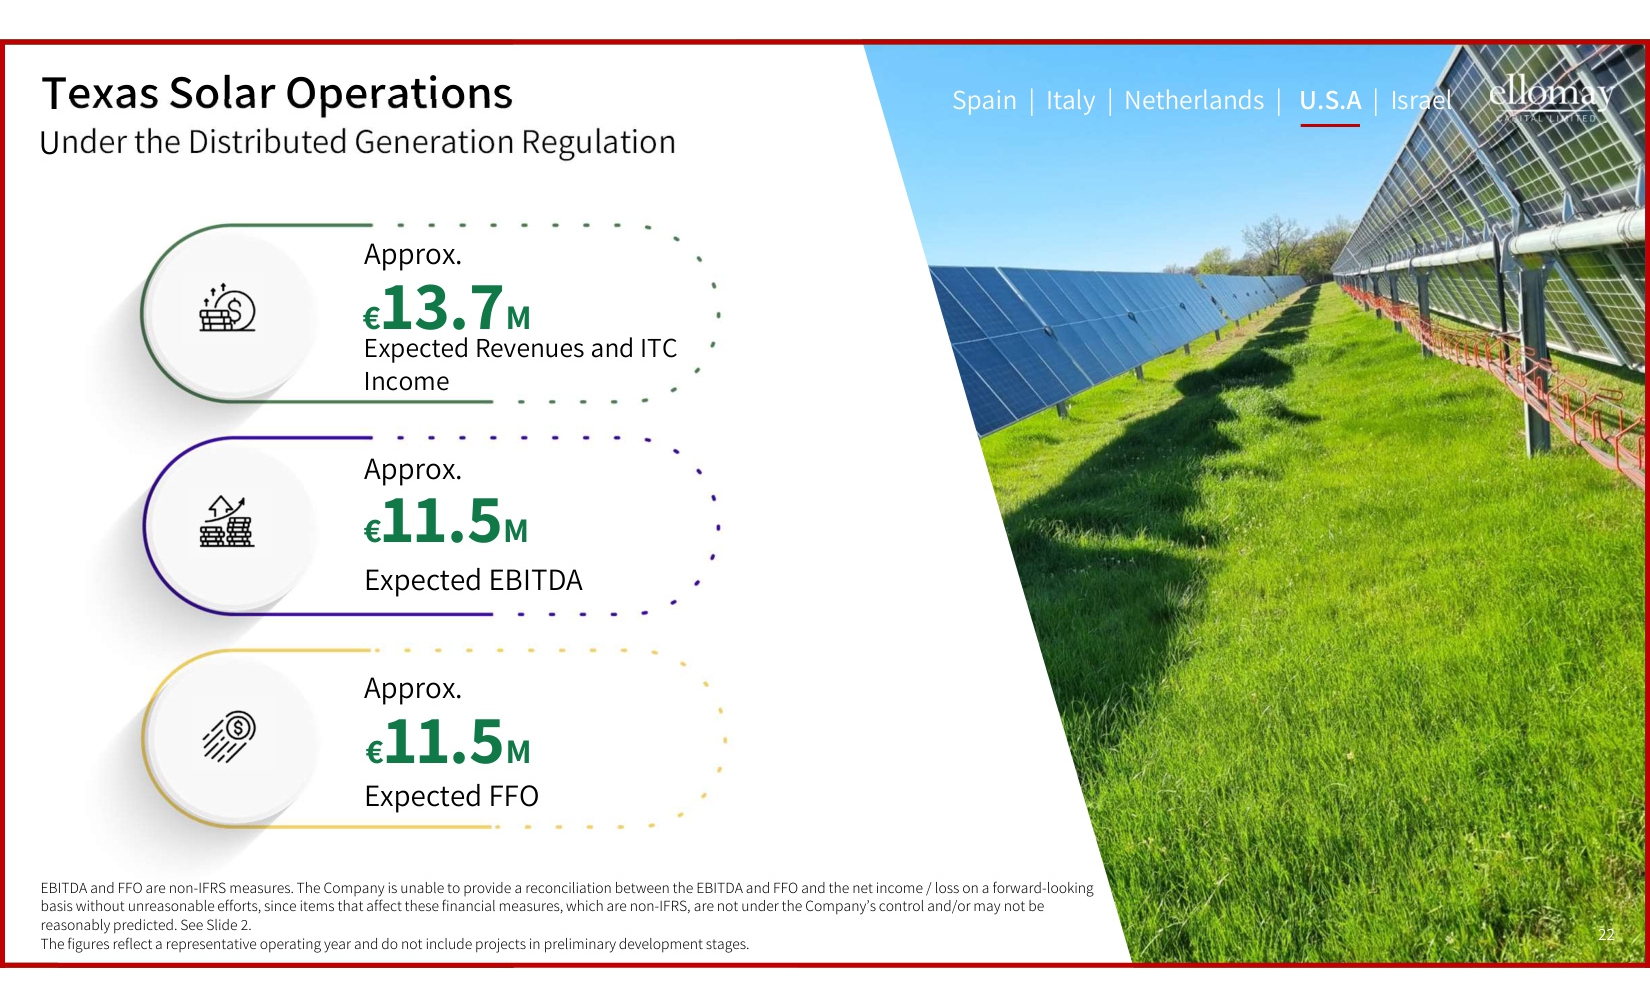
22 22 Texas Solar Operations Under the Distributed Generation Regulation €13.7M €11.5M €11.5M Expected Revenues and ITC Income Expected EBITDA Expected FFO Approx. Approx. Approx. EBITDA and FFO are non-IFRS measures. The Company is unable to provide a reconciliation between the EBITDA and FFO and the net income / loss on a forward-looking basis without unreasonable efforts, since items that affect these financial measures, which are non-IFRS, are not under the Company's control and/or may not be reasonably predicted. See Slide 2. The figures reflect a representative operating year and do not include projects in preliminary development stages. Spain | Italy | Netherlands | U.S.A | Israel
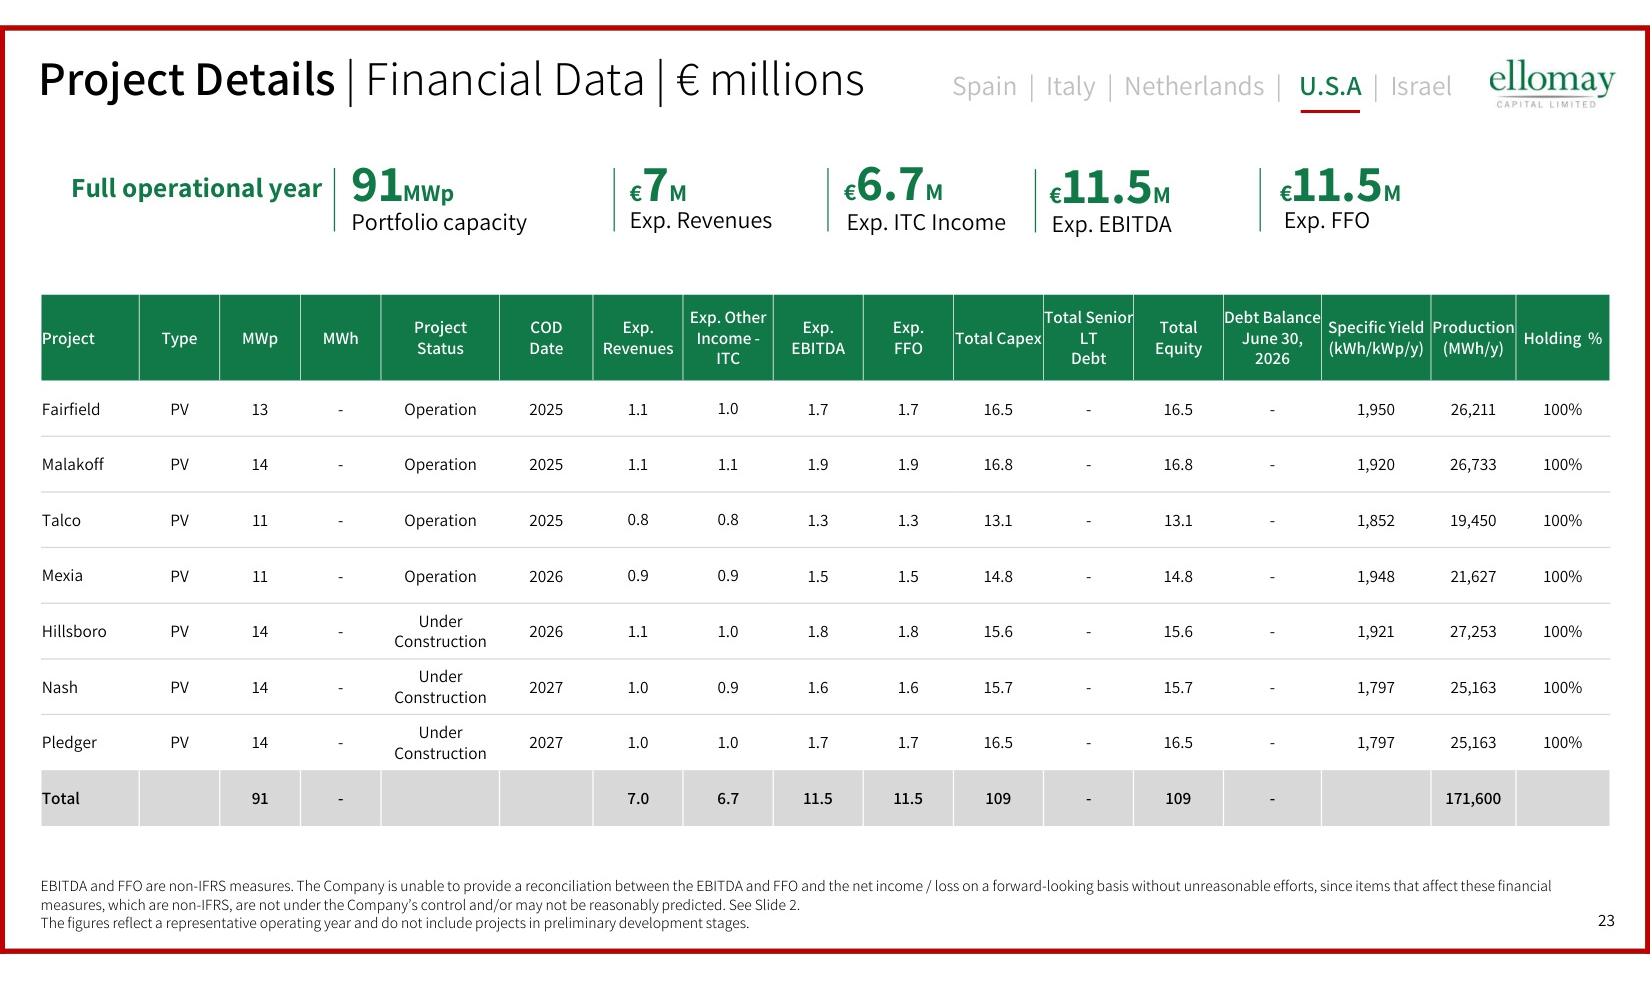
23 Holding % Production (MWh/y) Specific Yield (kWh/kWp/y) Debt Balance June 30, 2026 Total Equity Total Senior LT Debt Total Capex Exp. FFO Exp. EBITDA Exp. Other Income - ITC Exp. Revenues COD Date Project Status MWh MWp Type Project 100% 26,211 1,950 - 16.5 - 16.5 1.7 1.7 1.0 1.1 2025 Operation - 13 PV Fairfield 100% 26,733 1,920 - 16.8 - 16.8 1.9 1.9 1.1 1.1 2025 Operation - 14 PV Malakoff 100% 19,450 1,852 - 13.1 - 13.1 1.3 1.3 0.8 0.8 2025 Operation - 11 PV Talco 100% 21,627 1,948 - 14.8 - 14.8 1.5 1.5 0.9 0.9 2026 Operation - 11 PV Mexia 100% 27,253 1,921 - 15.6 - 15.6 1.8 1.8 1.0 1.1 2026 Under Construction - 14 PV Hillsboro 100% 25,163 1,797 - 15.7 - 15.7 1.6 1.6 0.9 1.0 2027 Under Construction - 14 PV Nash 100% 25,163 1,797 - 16.5 - 16.5 1.7 1.7 1.0 1.0 2027 Under Construction - 14 PV Pledger 171,600 - 109 - 109 11.5 11.5 6.7 7.0 - 91 Total Spain | Italy | Netherlands | U.S.A | Israel 91MWp Portfolio capacity Exp. Revenues Exp. EBITDA €7M €11.5M Exp. FFO €11.5M EBITDA and FFO are non-IFRS measures. The Company is unable to provide a reconciliation between the EBITDA and FFO and the net income / loss on a forward-looking basis without unreasonable efforts, since items that affect these financial measures, which are non-IFRS, are not under the Company's control and/or may not be reasonably predicted. See Slide 2. The figures reflect a representative operating year and do not include projects in preliminary development stages. Project Details | Financial Data | € millions Full operational year Exp. ITC Income €6.7M
24 The Company's Operations in Israel Pumped Storage Project and Solar Projects 24
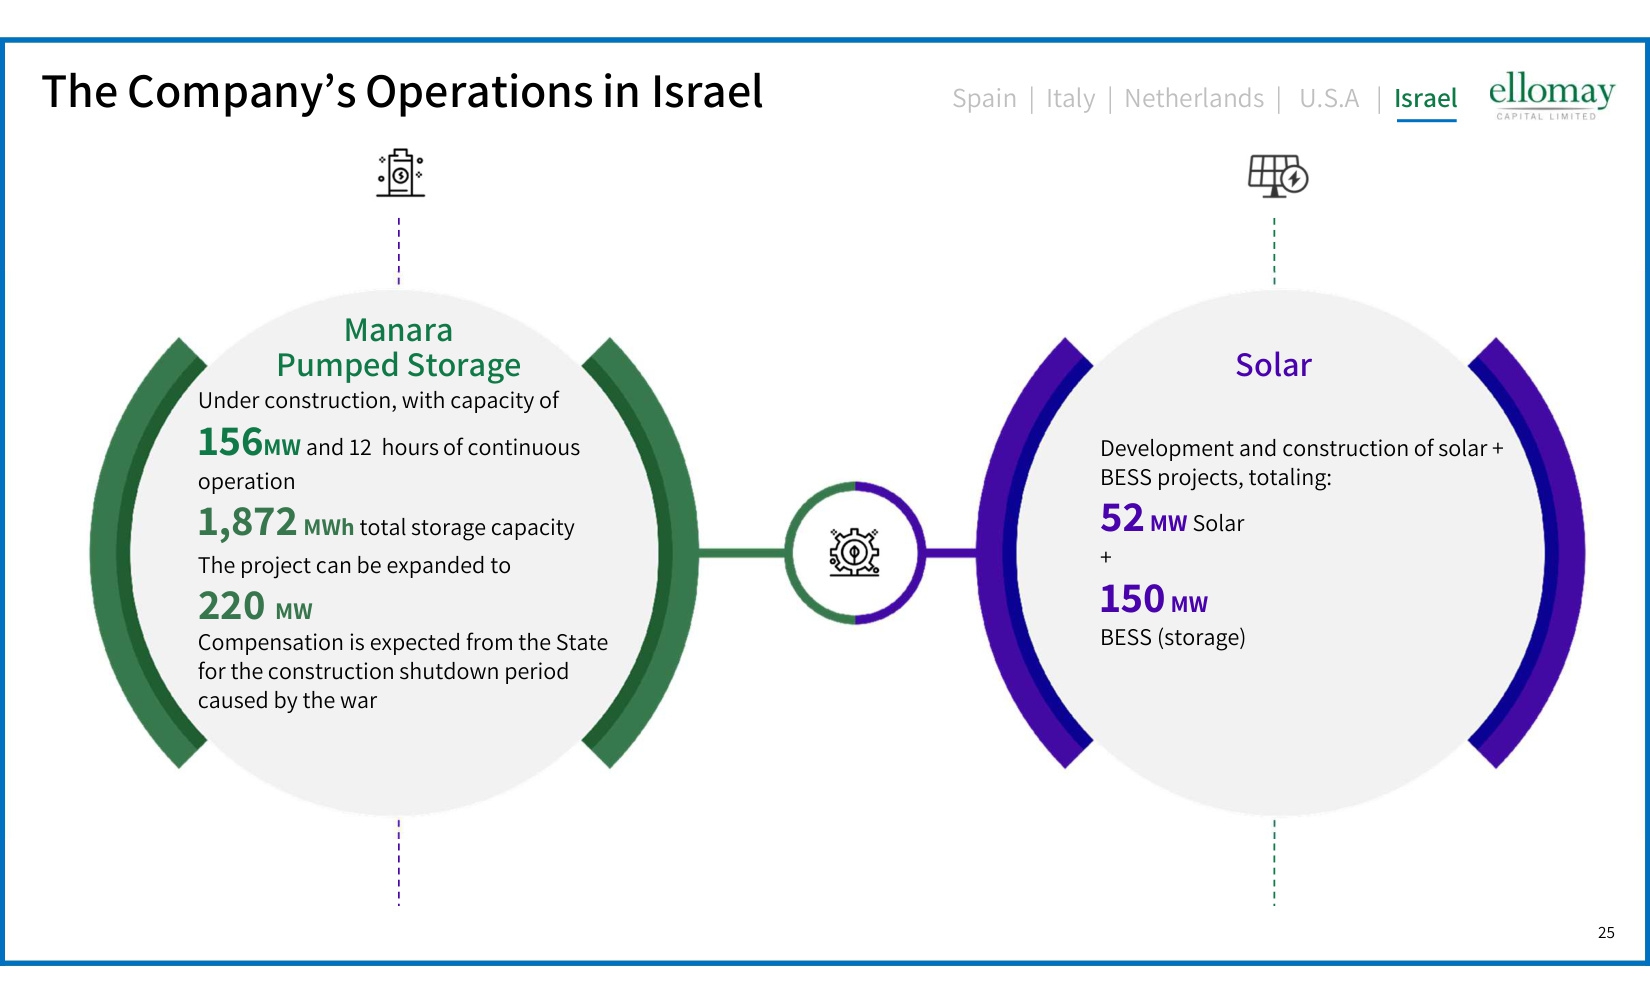
25 25 The Company's Operations in Israel Manara Pumped Storage Solar Under construction, with capacity of 156MW and 12 hours of continuous operation 1,872 MWh total storage capacity The project can be expanded to 220 MW Compensation is expected from the State for the construction shutdown period caused by the war Development and construction of solar + BESS projects, totaling: 52 MW Solar + 150 MW BESS (storage) Spain | Italy | Netherlands | U.S.A | Israel
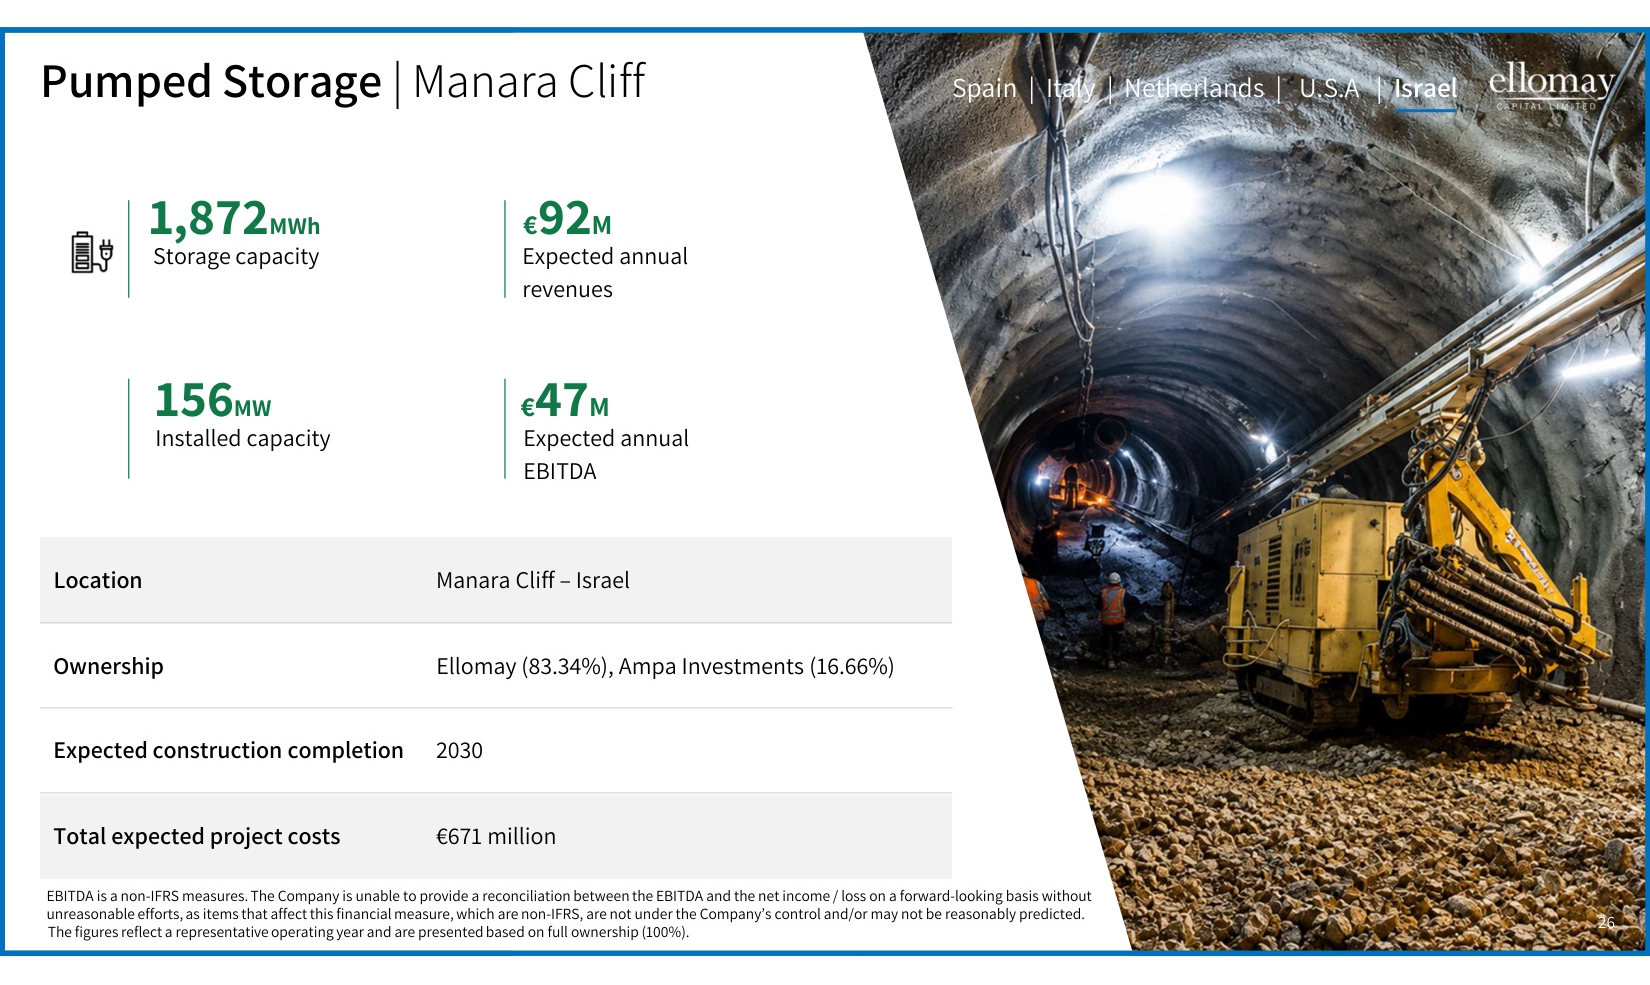
26 26 Pumped Storage | Manara Cliff Manara Cliff – Israel Location Ellomay (83.34%), Ampa Investments (16.66%) Ownership 2030 Expected construction completion €671 million Total expected project costs 156MW Installed capacity 1,872MWh Storage capacity €47M Expected annual EBITDA €92M Expected annual revenues 26 EBITDA is a non-IFRS measures. The Company is unable to provide a reconciliation between the EBITDA and the net income / loss on a forward-looking basis without unreasonable efforts, as items that affect this financial measure, which are non-IFRS, are not under the Company's control and/or may not be reasonably predicted. The figures reflect a representative operating year and are presented based on full ownership (100%). Spain | Italy | Netherlands | U.S.A | Israel
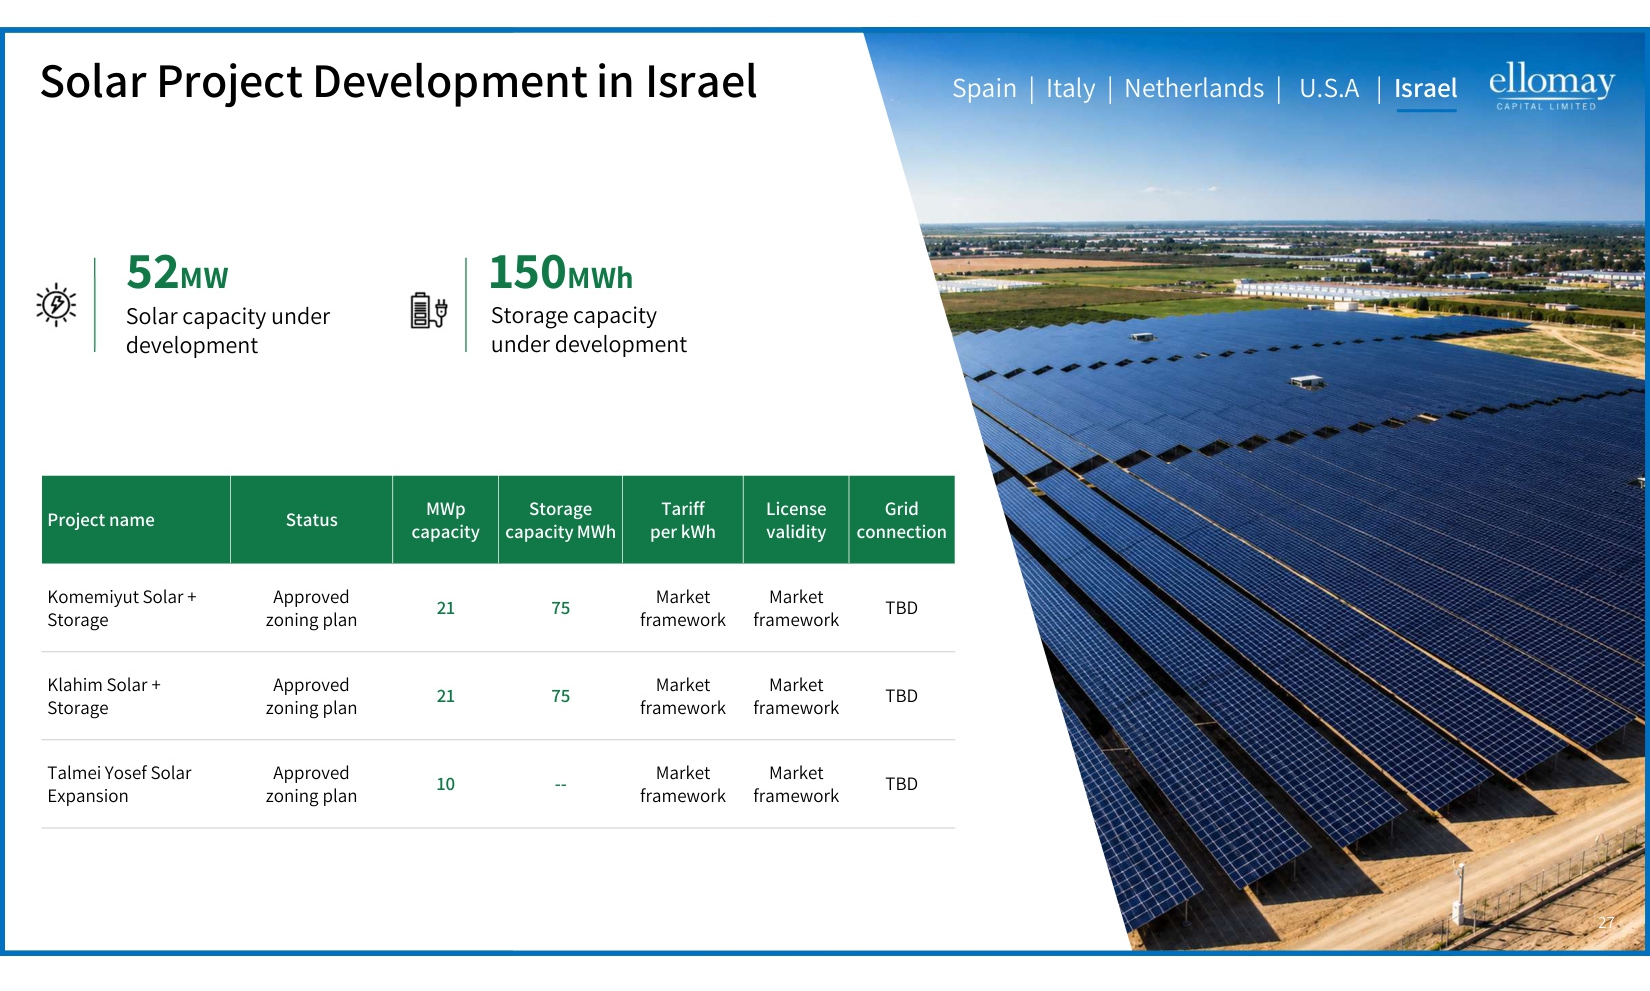
27 27 Solar Project Development in Israel Grid connection License validity Tariff per kWh Storage capacity MWh MWp capacity Status Project name TBD Market framework Market framework 75 21 Approved zoning plan Komemiyut Solar + Storage TBD Market framework Market framework 75 21 Approved zoning plan Klahim Solar + Storage TBD Market framework Market framework -- 10 Approved zoning plan Talmei Yosef Solar Expansion 52MW Solar capacity under development 150MWh Storage capacity under development Spain | Italy | Netherlands | U.S.A | Israel
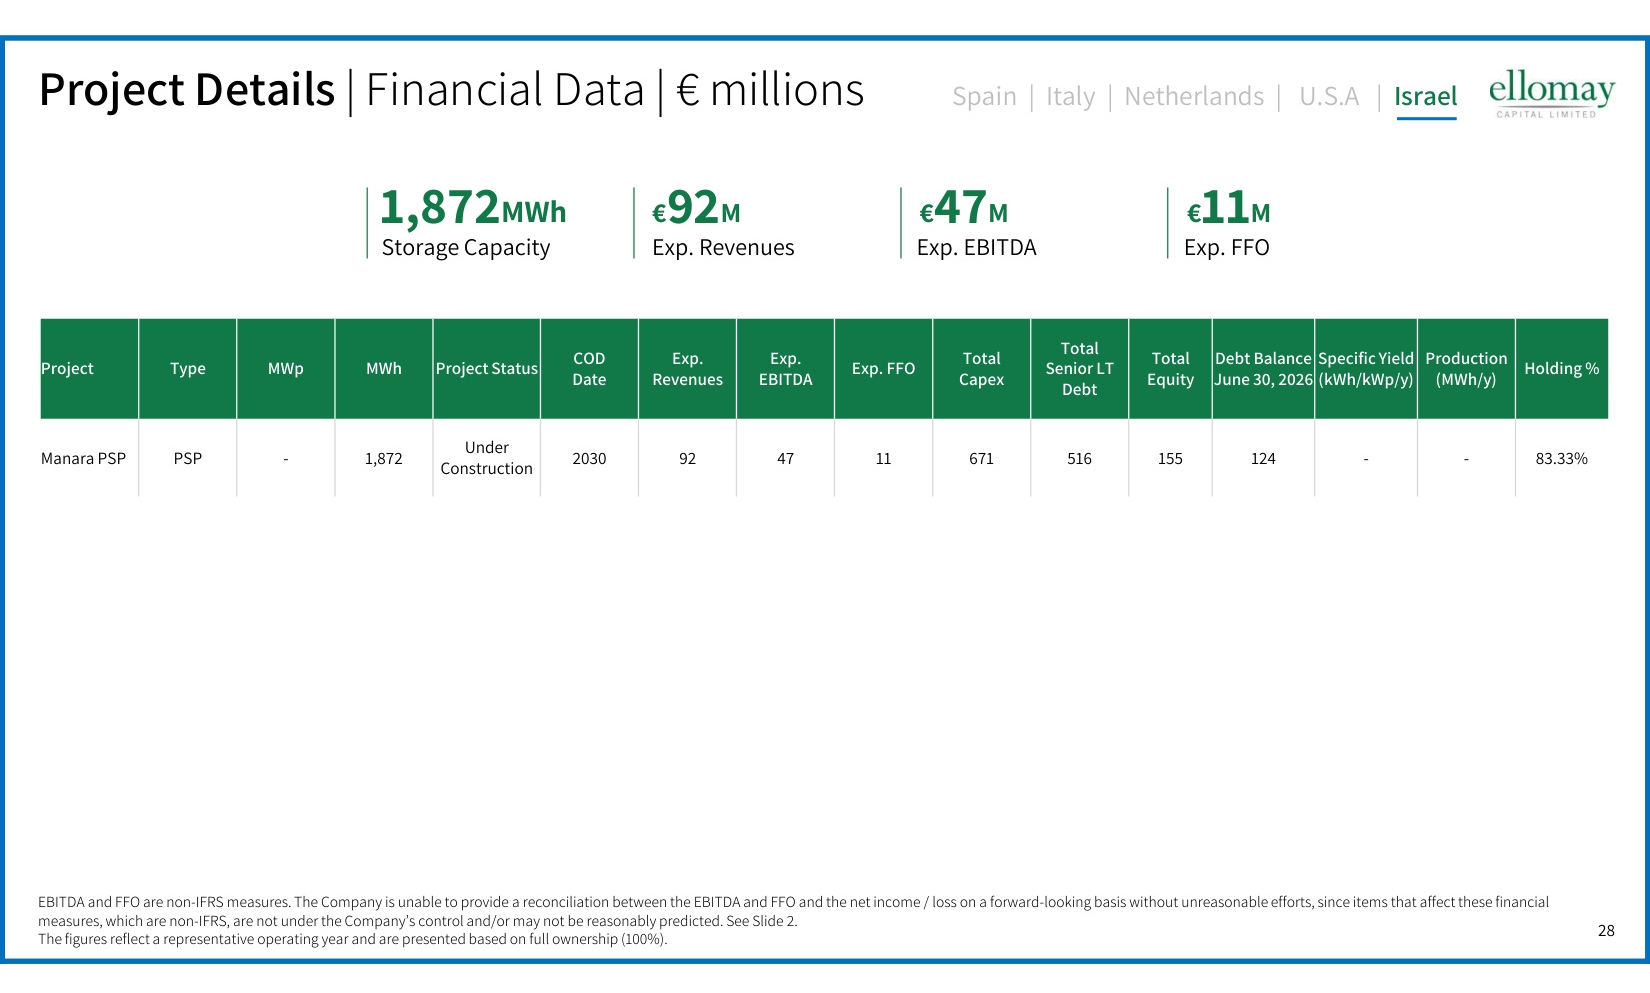
28 Holding % Production (MWh/y) Specific Yield (kWh/kWp/y) Debt Balance June 30, 2026 Total Equity Total Senior LT Debt Total Capex Exp. FFO Exp. EBITDA Exp. Revenues COD Date ProjectStatus MWh MWp Type Project 83.33% - - 124 155 516 671 11 47 92 2030 Under Construction 1,872 - PSP Manara PSP 1,872MWh €92M Exp. Revenues €47M Exp. EBITDA €11M Exp. FFO Spain | Italy | Netherlands | U.S.A | Israel Project Details | Financial Data | € millions Storage Capacity EBITDA and FFO are non-IFRS measures. The Company is unable to provide a reconciliation between the EBITDA and FFO and the net income / loss on a forward-looking basis without unreasonable efforts, since items that affect these financial measures, which are non-IFRS, are not under the Company's control and/or may not be reasonably predicted. See Slide 2. The figures reflect a representative operating year and are presented based on full ownership (100%).
29 Projects under Development 29
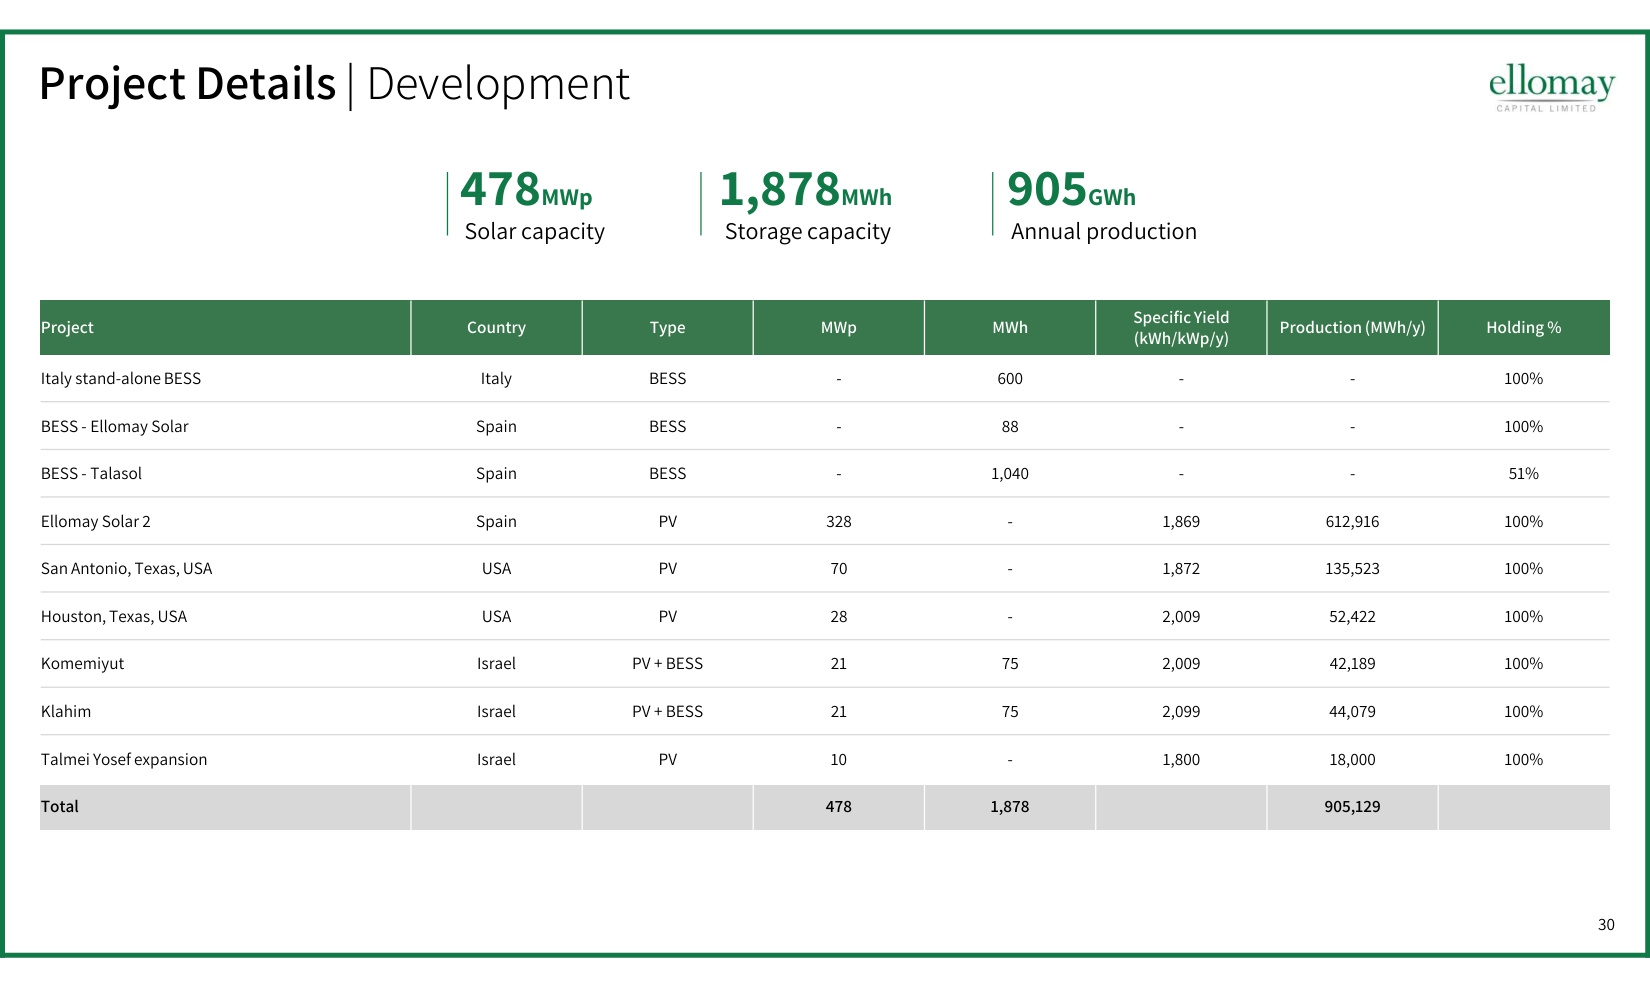
30 Project Details | Development Holding % Production (MWh/y) Specific Yield (kWh/kWp/y) MWh MWp Type Country Project 100% - - 600 - BESS Italy Italy stand-alone BESS 100% - - 88 - BESS Spain BESS - Ellomay Solar 51% - - 1,040 - BESS Spain BESS - Talasol 100% 612,916 1,869 - 328 PV Spain Ellomay Solar 2 100% 135,523 1,872 - 70 PV USA San Antonio, Texas, USA 100% 52,422 2,009 - 28 PV USA Houston, Texas, USA 100% 42,189 2,009 75 21 PV + BESS Israel Komemiyut 100% 44,079 2,099 75 21 PV + BESS Israel Klahim 100% 18,000 1,800 - 10 PV Israel Talmei Yosef expansion 905,129 1,878 478 Total 478MWp Solar capacity Storage capacity Annual production 1,878MWh 905GWh

31 Financial Data 31
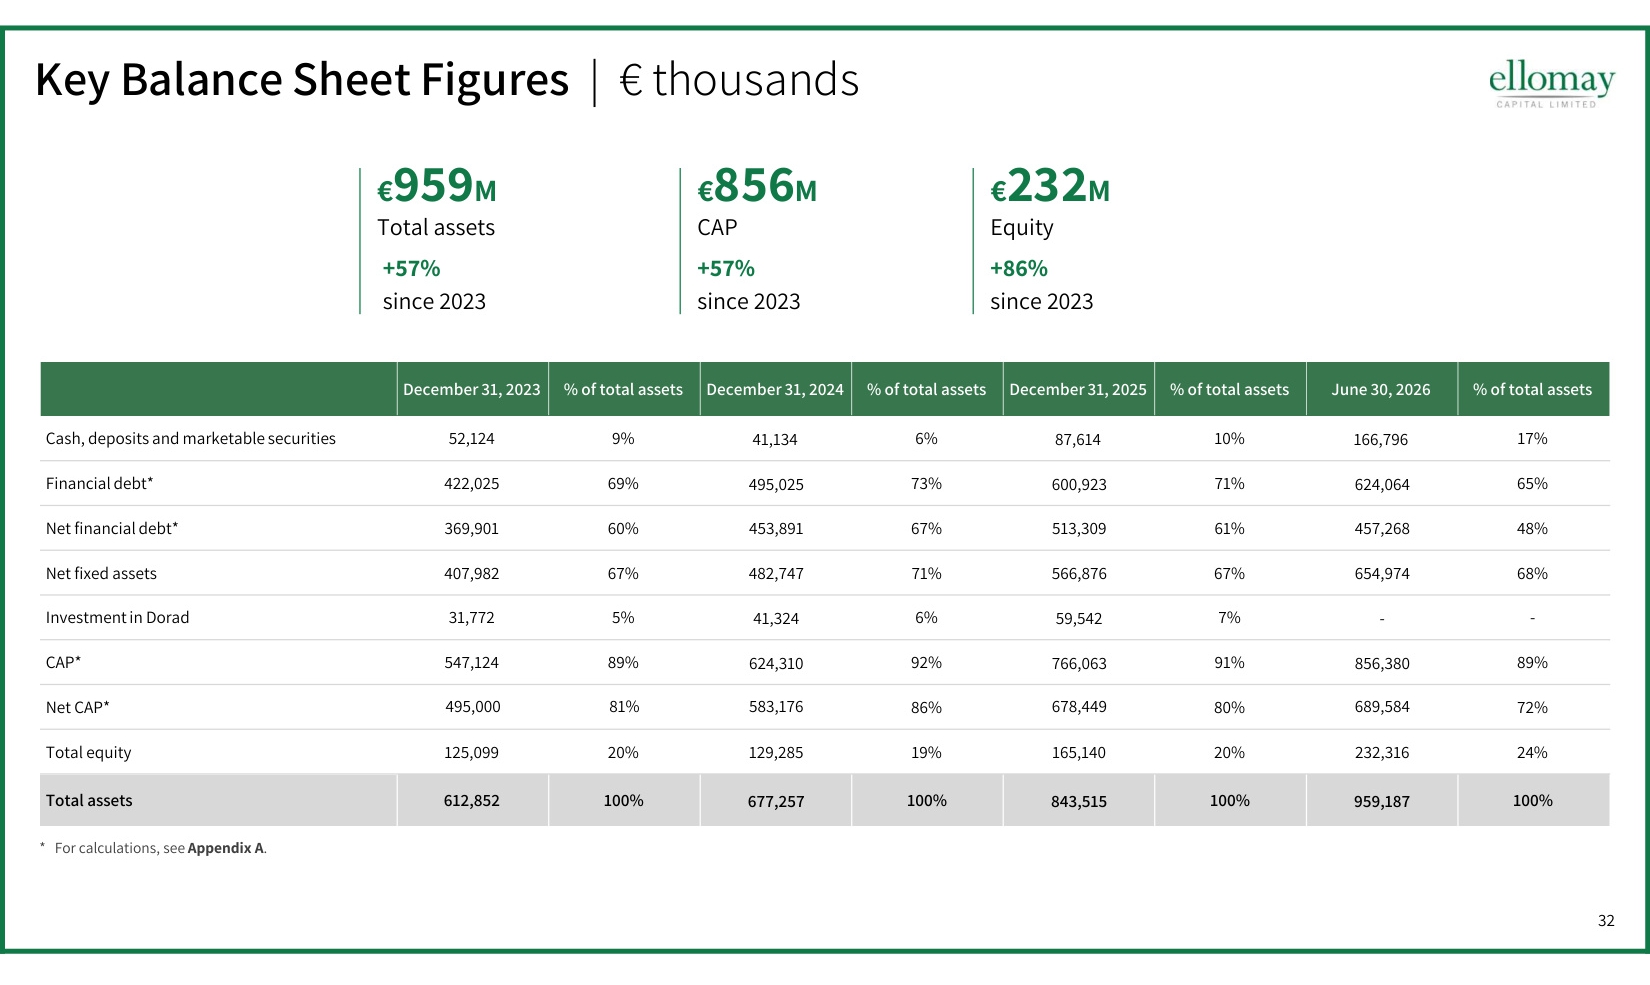
32 Key Balance Sheet Figures | € thousands % of total assets June 30, 2026 % of total assets December 31, 2025 % of total assets December 31, 2024 % of total assets December 31, 2023 17% 166,796 10% 87,614 6% 41,134 9% 52,124 Cash, deposits and marketable securities 65% 624,064 71% 600,923 73% 495,025 69% 422,025 Financial debt* 48% 457,268 61% 513,309 67% 453,891 60% 369,901 Net financial debt* 68% 654,974 67% 566,876 71% 482,747 67% 407,982 Net fixed assets - - 7% 59,542 6% 41,324 5% 31,772 Investmentin Dorad 89% 856,380 91% 766,063 92% 624,310 89% 547,124 CAP* 72% 689,584 80% 678,449 86% 583,176 81% 495,000 Net CAP* 24% 232,316 20% 165,140 19% 129,285 20% 125,099 Total equity 100% 959,187 100% 843,515 100% 677,257 100% 612,852 Total assets €959M Total assets +57% since 2023 €856M CAP +57% since 2023 €232M Equity +86% since 2023 * For calculations, see Appendix A.
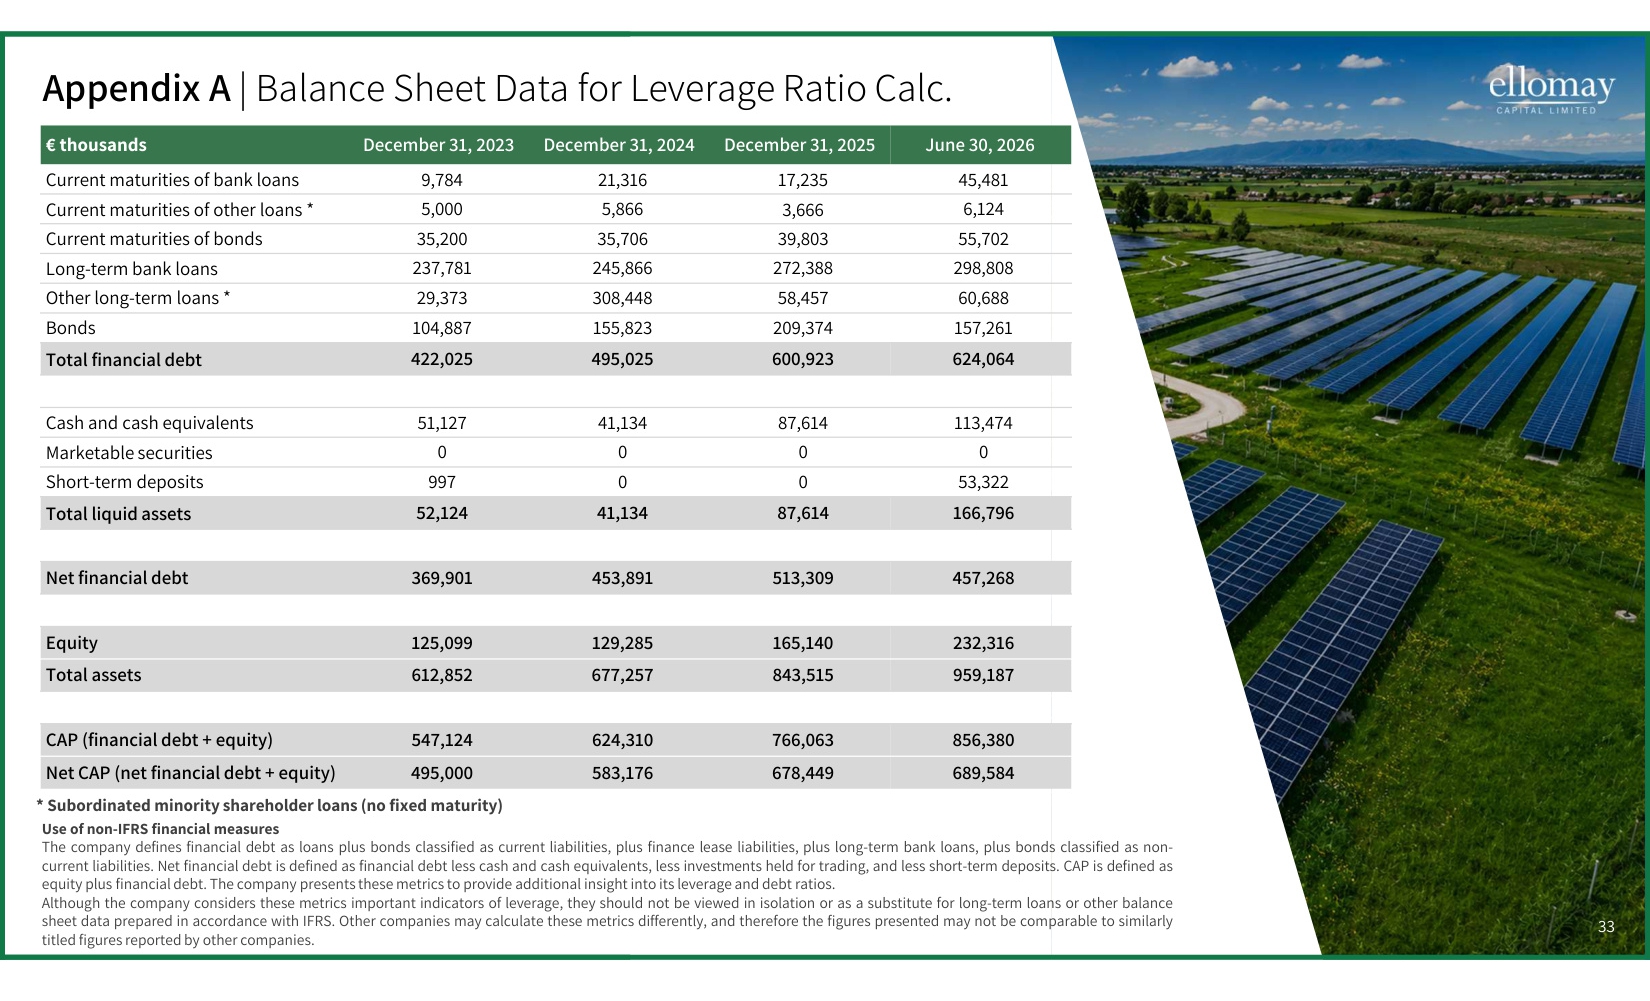
33 June 30, 2026 December 31, 2025 December 31, 2024 December 31, 2023 € thousands 45,481 17,235 21,316 9,784 Current maturities of bank loans 6,124 3,666 5,866 5,000 Current maturities of other loans * 55 7, 02 39,803 35,706 35,200 Current maturities of bonds 298,808 272,388 245,866 23 ,7 781 Long-term bank loans 60,688 58,457 308,448 29,373 Other long-term loans * 157,261 209,374 155,823 104,887 Bonds 624,064 600,923 495,025 422,025 Total financial debt 11 ,3 474 87,614 41,134 51,127 Cash and cash equivalents 0 0 0 0 Marketable securities 53,322 0 0 997 Short-term deposits 166,796 87,614 41,134 52,124 Total liquid assets 457,268 513,309 453,891 369,901 Net financial debt 232,316 165,140 129,285 125,099 Equity 959,187 843,515 677,257 612,852 Total assets 856,380 766,063 624,310 547,124 CAP (financial debt + equity) 689,584 678,449 583,176 495,000 Net CAP (net financial debt + equity) Use of non-IFRS financial measures The company defines financial debt as loans plus bonds classified as current liabilities, plus finance lease liabilities, plus long-term bank loans, plus bonds classified as non- current liabilities. Net financial debt is defined as financial debt less cash and cash equivalents, less investments held for trading, and less short-term deposits. CAP is defined as equity plus financialdebt. The company presentsthese metrics to provide additional insight into its leverage and debt ratios. Although the company considers these metrics important indicators of leverage, they should not be viewed in isolation or as a substitute for long-term loans or other balance sheet data prepared in accordance with IFRS. Other companies may calculate these metrics differently, and therefore the figures presented may not be comparable to similarly titled figures reported by other companies. 33 Appendix A | Balance Sheet Data for Leverage Ratio Calc. * Subordinated minority shareholder loans (no fixed maturity)
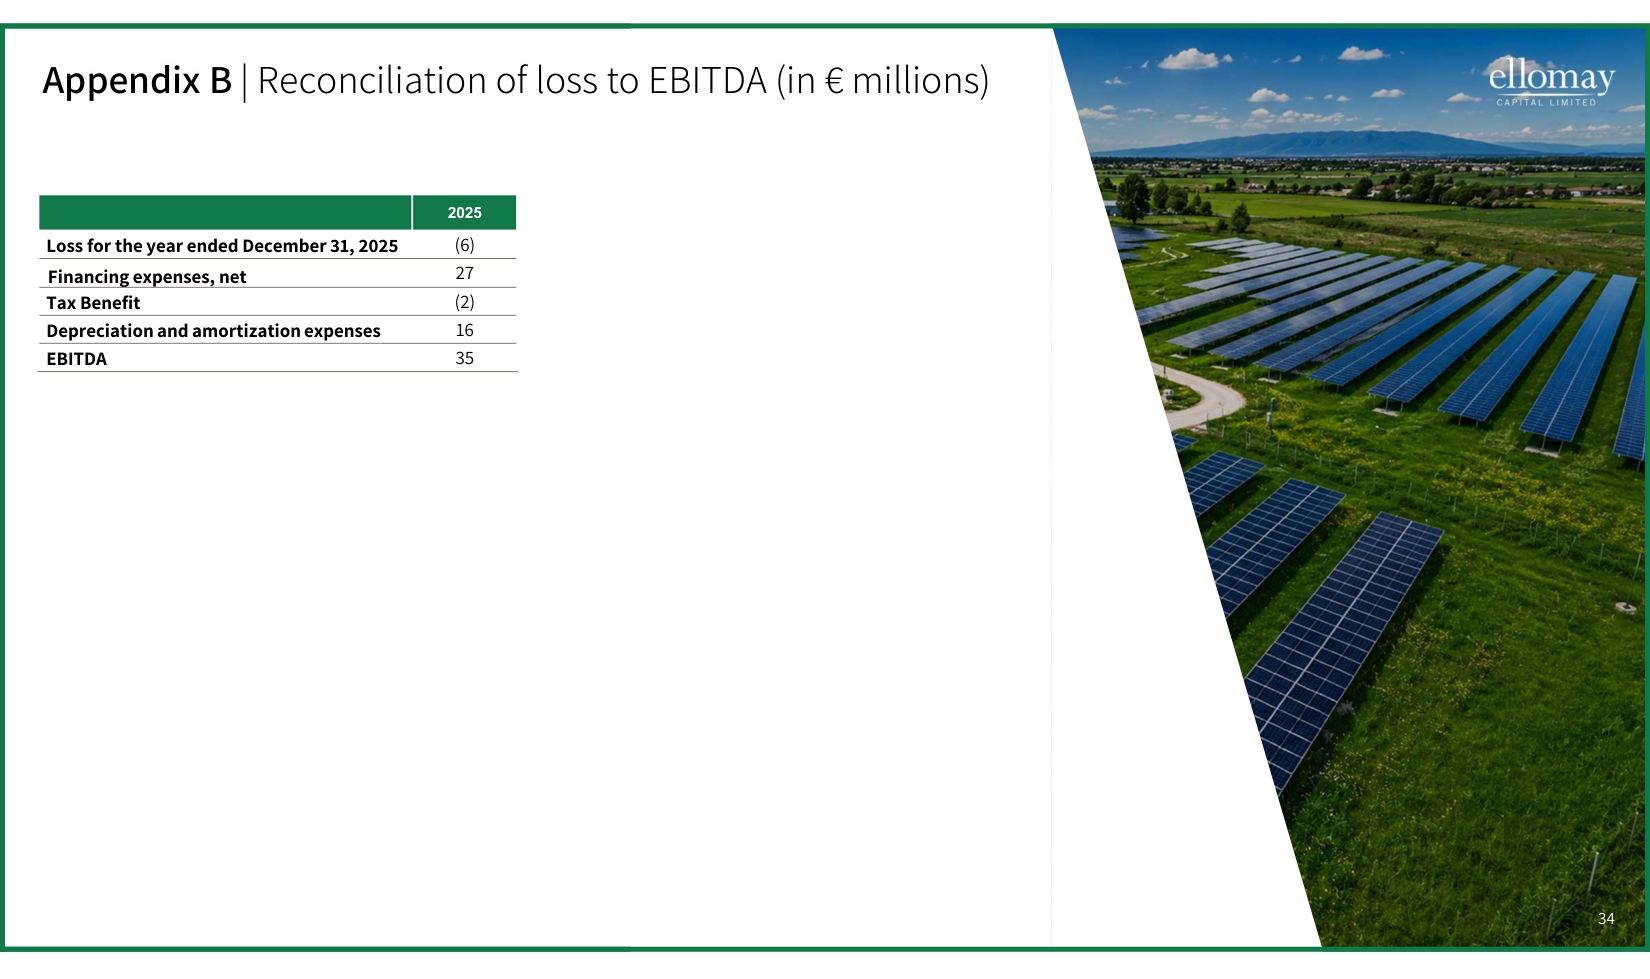
34 34 Appendix B | Reconciliation of loss to EBITDA (in € millions) 2025 (6) Loss for the year ended December 31, 2025 27 Financing expenses, net (2) Tax Benefit 16 Depreciation and amortization expenses 35 EBITDA
35 Thank you