NFG to Separate Integrated Upstream and Gathering Business October 14, 2026 Exhibit 99.2
Today’s Presenters David P. Bauer President and Chief Executive Officer National Fuel Gas Company Timothy J. Silverstein Treasurer and Chief Financial Officer National Fuel Gas Company Justin I. Loweth President Seneca Resources and NFG Midstream (Integrated Upstream and Gathering)
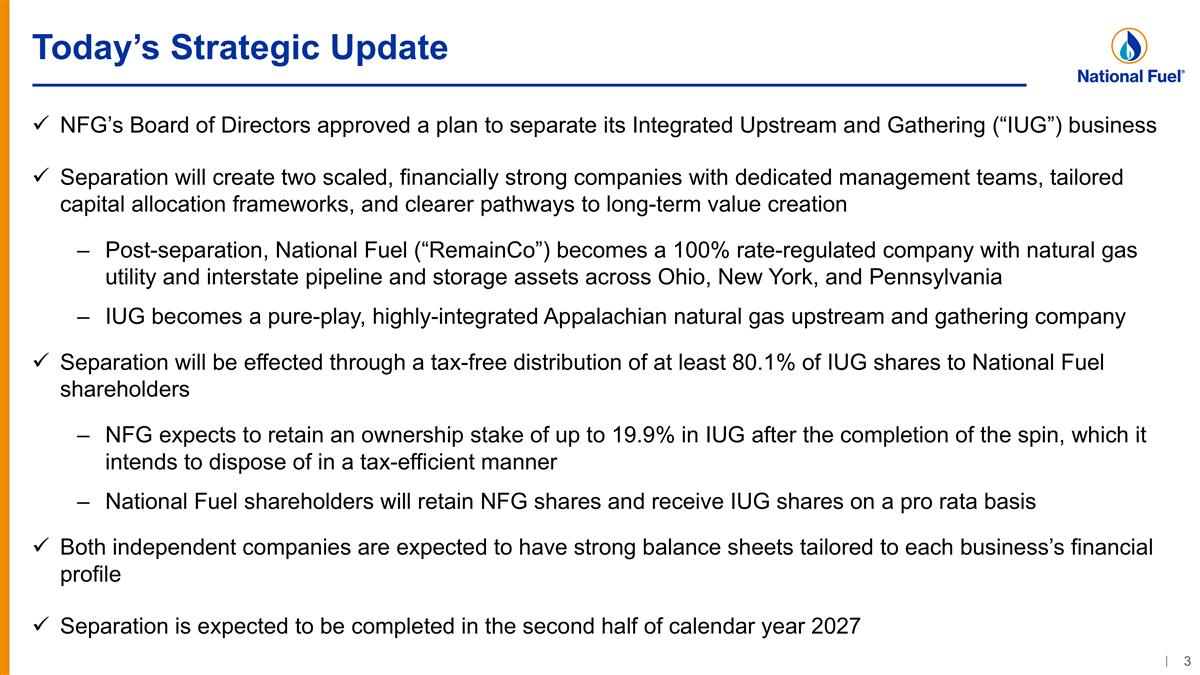
Today’s Strategic Update NFG’s Board of Directors approved a plan to separate its Integrated Upstream and Gathering (“IUG”) business Separation will create two scaled, financially strong companies with dedicated management teams, tailored capital allocation frameworks, and clearer pathways to long-term value creation Post-separation, National Fuel (“RemainCo”) becomes a 100% rate-regulated company with natural gas utility and interstate pipeline and storage assets across Ohio, New York, and Pennsylvania IUG becomes a pure-play, highly-integrated Appalachian natural gas upstream and gathering company Separation will be effected through a tax-free distribution of at least 80.1% of IUG shares to National Fuel shareholders NFG expects to retain an ownership stake of up to 19.9% in IUG after the completion of the spin, which it intends to dispose of in a tax-efficient manner National Fuel shareholders will retain NFG shares and receive IUG shares on a pro rata basis Both independent companies are expected to have strong balance sheets tailored to each business’s financial profile Separation is expected to be completed in the second half of calendar year 2027
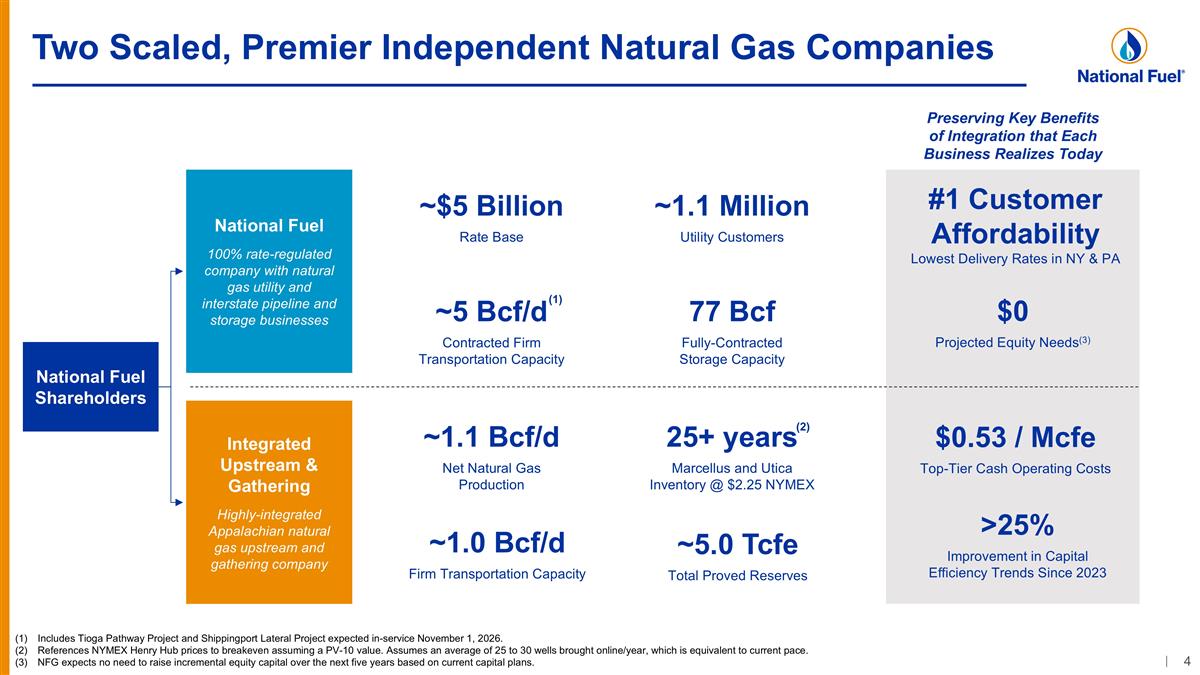
Two Scaled, Premier Independent Natural Gas Companies Includes Tioga Pathway Project and Shippingport Lateral Project expected in-service November 1, 2026. References NYMEX Henry Hub prices to breakeven assuming a PV-10 value. Assumes an average of 25 to 30 wells brought online/year, which is equivalent to current pace. NFG expects no need to raise incremental equity capital over the next five years based on current capital plans. National Fuel Shareholders National Fuel 100% rate-regulated company with natural gas utility and interstate pipeline and storage businesses ~1.1 Million Utility Customers 77 Bcf Fully-Contracted Storage Capacity ~5 Bcf/d Contracted Firm Transportation Capacity ~1.1 Bcf/d Net Natural Gas Production Integrated Upstream & Gathering Highly-integrated Appalachian natural gas upstream and gathering company 25+ years Marcellus and Utica Inventory @ $2.25 NYMEX ~1.0 Bcf/d Firm Transportation Capacity ~$5 Billion Rate Base $0.53 / Mcfe Top-Tier Cash Operating Costs #1 Customer Affordability Lowest Delivery Rates in NY & PA ~5.0 Tcfe Total Proved Reserves Preserving Key Benefits of Integration that Each Business Realizes Today $0 Projected Equity Needs(3) >25% Improvement in Capital Efficiency Trends Since 2023 (1) (2)
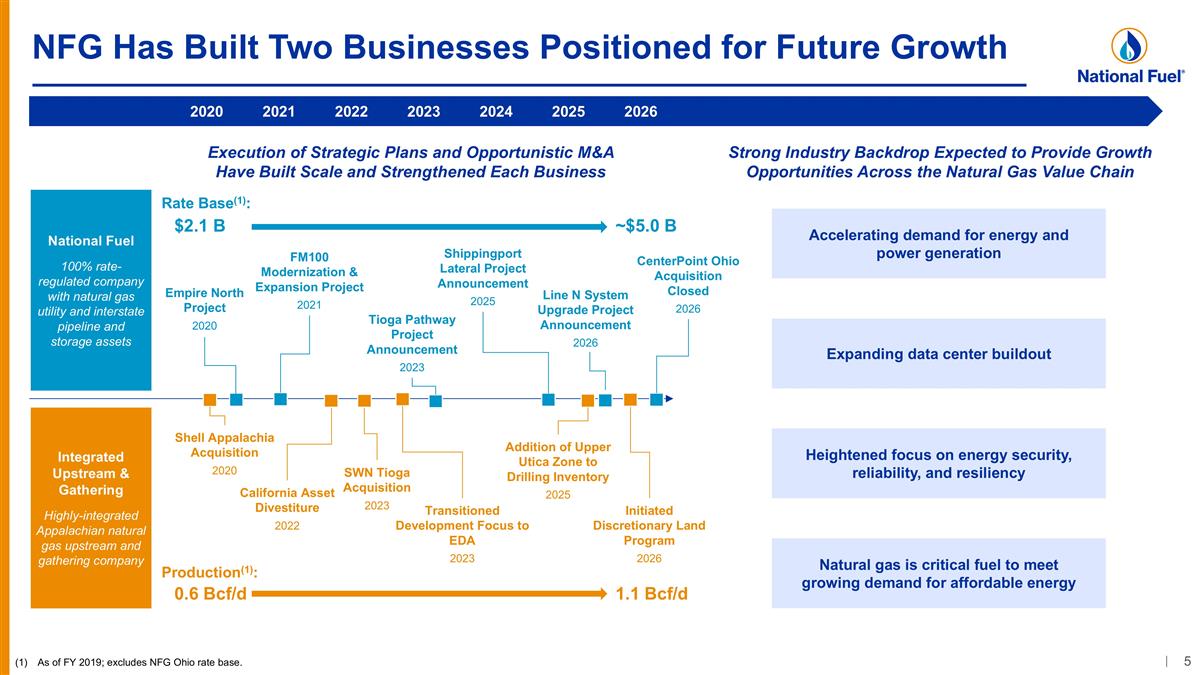
Transitioned Development Focus to EDA 2023 NFG Has Built Two Businesses Positioned for Future Growth 2026 Strong Industry Backdrop Expected to Provide Growth Opportunities Across the Natural Gas Value Chain Execution of Strategic Plans and Opportunistic M&A Have Built Scale and Strengthened Each Business Heightened focus on energy security, reliability, and resiliency Natural gas is critical fuel to meet growing demand for affordable energy Shell Appalachia Acquisition 2020 SWN Tioga Acquisition 2023 California Asset Divestiture 2022 CenterPoint Ohio Acquisition Closed 2026 FM100 Modernization & Expansion Project 2021 Tioga Pathway Project Announcement 2023 Shippingport Lateral Project Announcement 2025 Addition of Upper Utica Zone to Drilling Inventory 2025 Integrated Upstream & Gathering Highly-integrated Appalachian natural gas upstream and gathering company National Fuel 100% rate-regulated company with natural gas utility and interstate pipeline and storage assets Rate Base(1): $2.1 B ~$5.0 B Production(1): 0.6 Bcf/d 1.1 Bcf/d Line N System Upgrade Project Announcement 2026 Accelerating demand for energy and power generation Expanding data center buildout 2020 2021 2022 2023 2024 2025 Empire North Project 2020 Initiated Discretionary Land Program 2026 As of FY 2019; excludes NFG Ohio rate base.
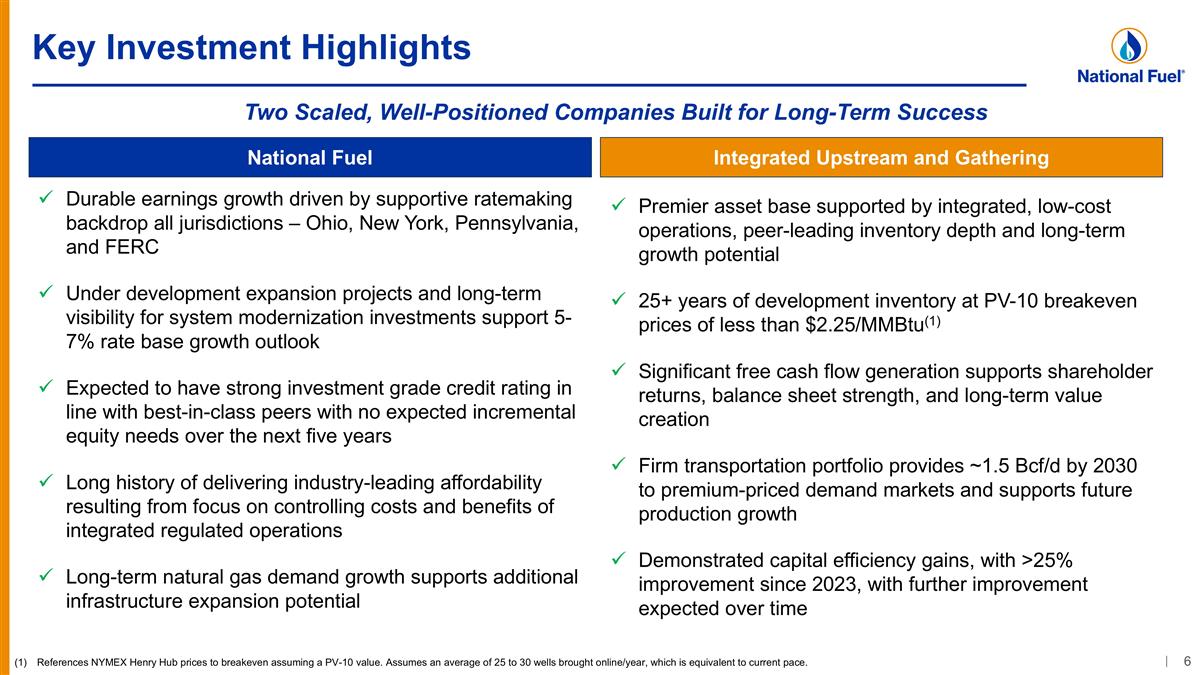
Key Investment Highlights Premier asset base supported by integrated, low-cost operations, peer-leading inventory depth and long-term growth potential 25+ years of development inventory at PV-10 breakeven prices of less than $2.25/MMBtu(1) Significant free cash flow generation supports shareholder returns, balance sheet strength, and long-term value creation Firm transportation portfolio provides ~1.5 Bcf/d by 2030 to premium-priced demand markets and supports future production growth Demonstrated capital efficiency gains, with >25% improvement since 2023, with further improvement expected over time National Fuel Integrated Upstream and Gathering Durable earnings growth driven by supportive ratemaking backdrop all jurisdictions – Ohio, New York, Pennsylvania, and FERC Under development expansion projects and long-term visibility for system modernization investments support 5-7% rate base growth outlook Expected to have strong investment grade credit rating in line with best-in-class peers with no expected incremental equity needs over the next five years Long history of delivering industry-leading affordability resulting from focus on controlling costs and benefits of integrated regulated operations Long-term natural gas demand growth supports additional infrastructure expansion potential Two Scaled, Well-Positioned Companies Built for Long-Term Success References NYMEX Henry Hub prices to breakeven assuming a PV-10 value. Assumes an average of 25 to 30 wells brought online/year, which is equivalent to current pace.
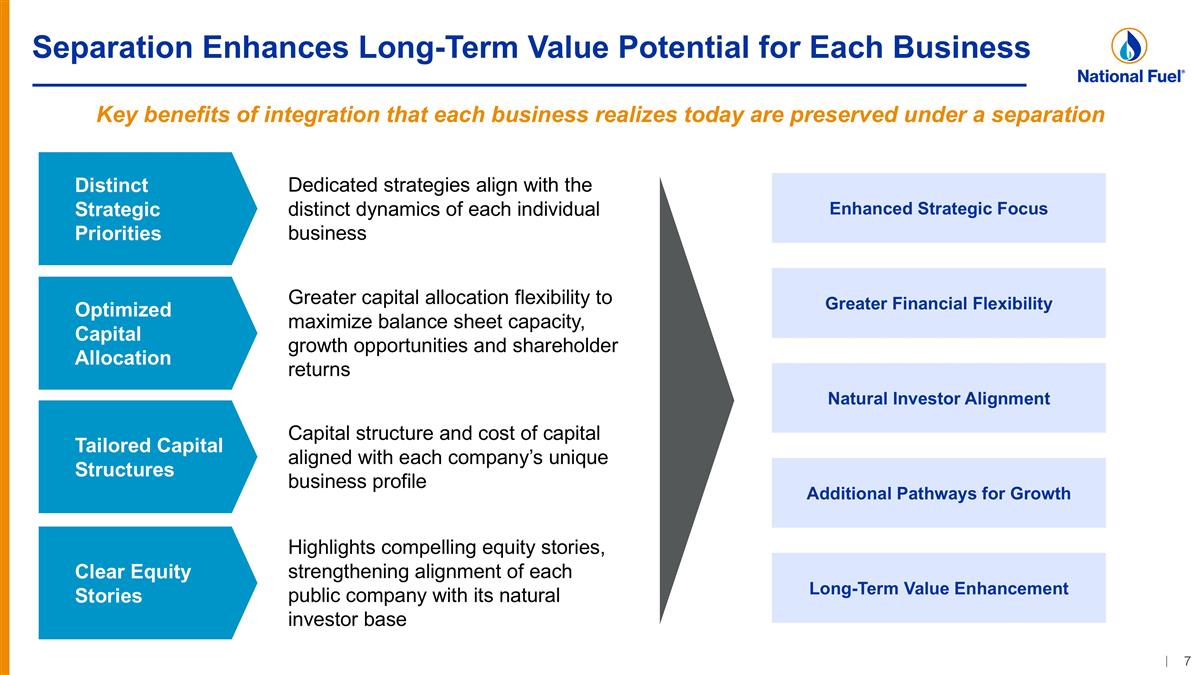
Separation Enhances Long-Term Value Potential for Each Business Distinct Strategic Priorities Optimized Capital Allocation Tailored Capital Structures Clear Equity Stories Dedicated strategies align with the distinct dynamics of each individual business Greater capital allocation flexibility to maximize balance sheet capacity, growth opportunities and shareholder returns Capital structure and cost of capital aligned with each company’s unique business profile Highlights compelling equity stories, strengthening alignment of each public company with its natural investor base Key benefits of integration that each business realizes today are preserved under a separation Enhanced Strategic Focus Greater Financial Flexibility Natural Investor Alignment Additional Pathways for Growth Long-Term Value Enhancement
Integrated Upstream and Gathering Overview
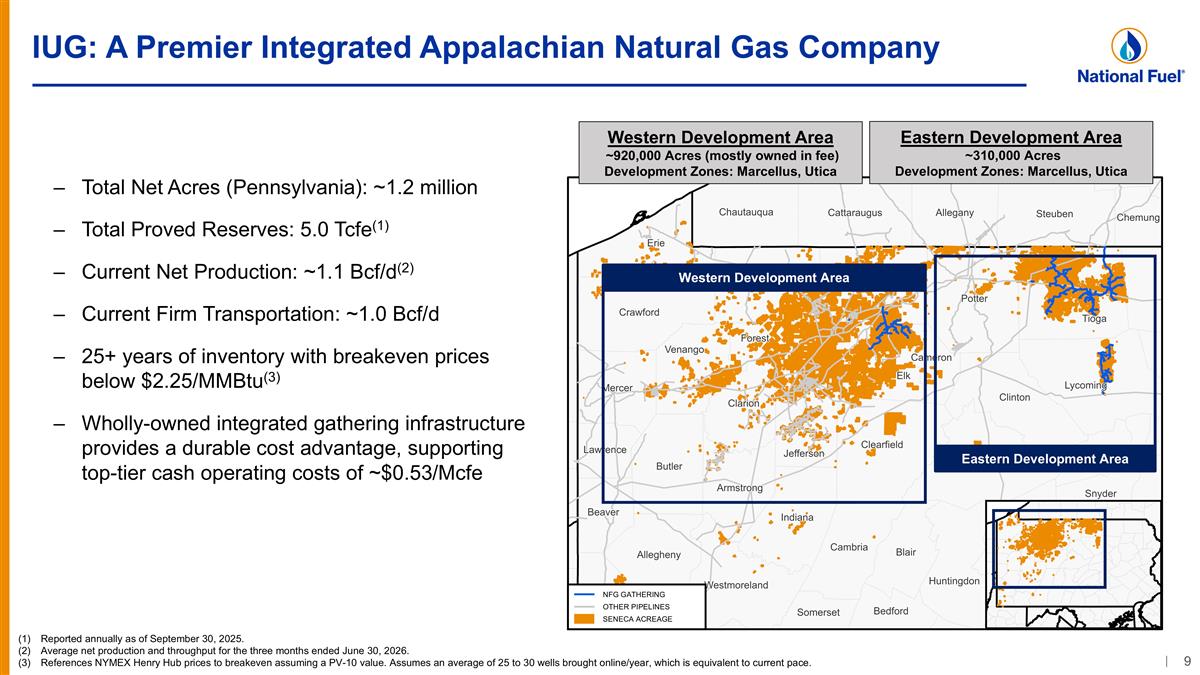
IUG: A Premier Integrated Appalachian Natural Gas Company Reported annually as of September 30, 2025. Average net production and throughput for the three months ended June 30, 2026. References NYMEX Henry Hub prices to breakeven assuming a PV-10 value. Assumes an average of 25 to 30 wells brought online/year, which is equivalent to current pace. Total Net Acres (Pennsylvania): ~1.2 million Total Proved Reserves: 5.0 Tcfe(1) Current Net Production: ~1.1 Bcf/d(2) Current Firm Transportation: ~1.0 Bcf/d 25+ years of inventory with breakeven prices below $2.25/MMBtu(3) Wholly-owned integrated gathering infrastructure provides a durable cost advantage, supporting top-tier cash operating costs of ~$0.53/Mcfe Western Development Area Eastern Development Area Eastern Development Area ~310,000 Acres Development Zones: Marcellus, Utica Western Development Area ~920,000 Acres (mostly owned in fee) Development Zones: Marcellus, Utica OTHER PIPELINES SENECA ACREAGE NFG GATHERING
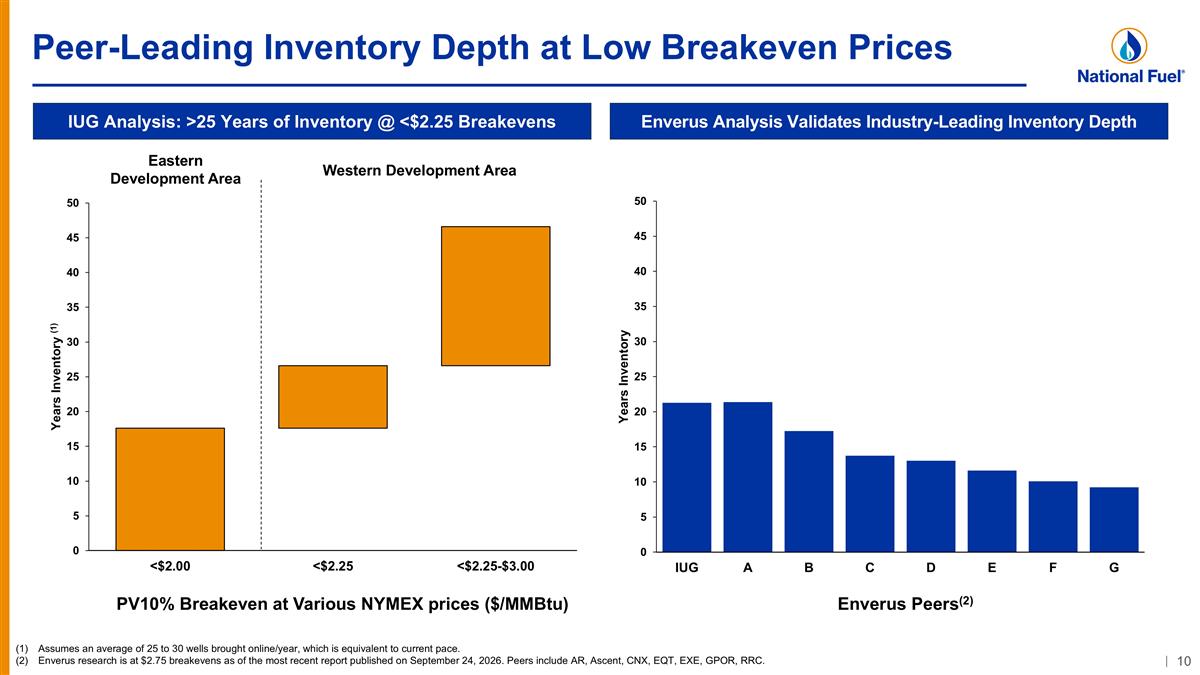
Peer-Leading Inventory Depth at Low Breakeven Prices Assumes an average of 25 to 30 wells brought online/year, which is equivalent to current pace. Enverus research is at $2.75 breakevens as of the most recent report published on September 24, 2026. Peers include AR, Ascent, CNX, EQT, EXE, GPOR, RRC. Eastern Development Area Western Development Area IUG Analysis: >25 Years of Inventory @ <$2.25 Breakevens Enverus Analysis Validates Industry-Leading Inventory Depth Enverus Peers(2) PV10% Breakeven at Various NYMEX prices ($/MMBtu)
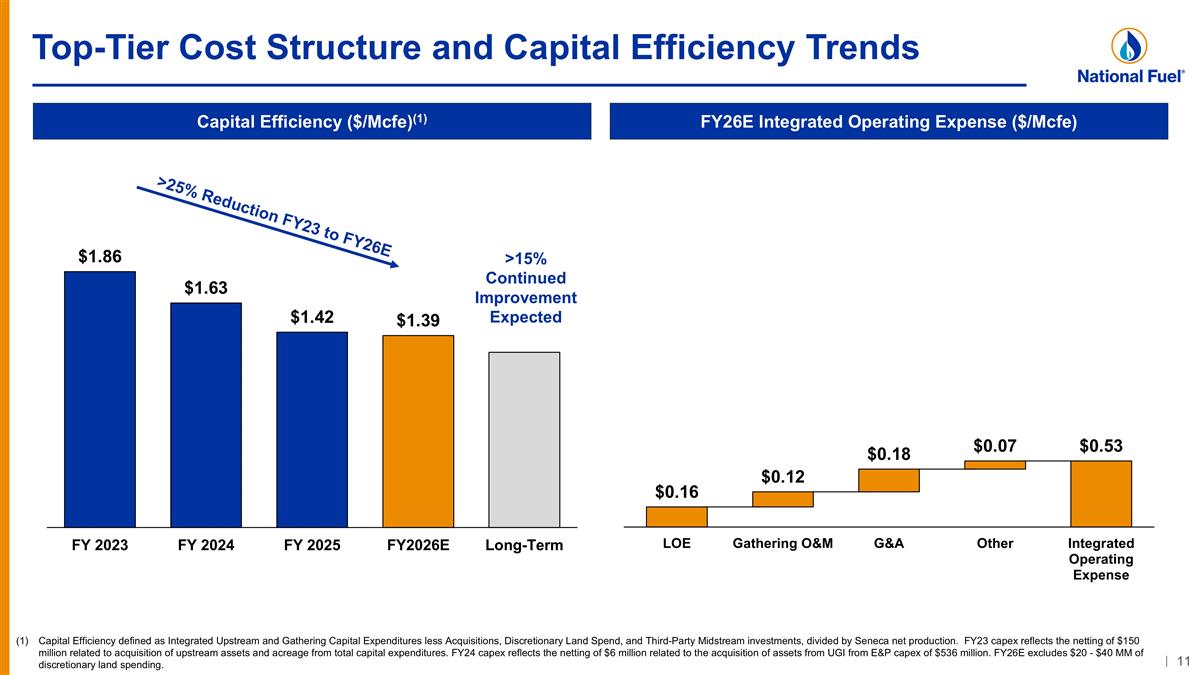
Top-Tier Cost Structure and Capital Efficiency Trends Capital Efficiency defined as Integrated Upstream and Gathering Capital Expenditures less Acquisitions, Discretionary Land Spend, and Third-Party Midstream investments, divided by Seneca net production. FY23 capex reflects the netting of $150 million related to acquisition of upstream assets and acreage from total capital expenditures. FY24 capex reflects the netting of $6 million related to the acquisition of assets from UGI from E&P capex of $536 million. FY26E excludes $20 - $40 MM of discretionary land spending. >25% Reduction FY23 to FY26E >15% Continued Improvement Expected Capital Efficiency ($/Mcfe)(1) FY26E Integrated Operating Expense ($/Mcfe)
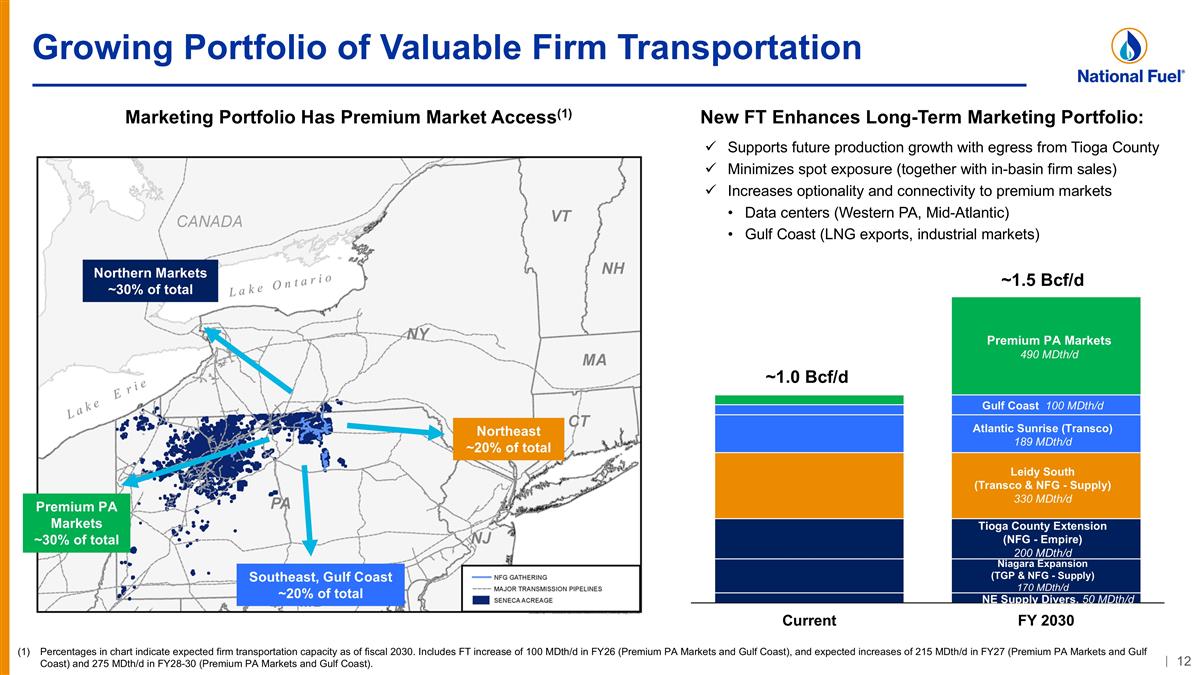
Growing Portfolio of Valuable Firm Transportation Marketing Portfolio Has Premium Market Access(1) New FT Enhances Long-Term Marketing Portfolio: Northern Markets ~30% of total Southeast, Gulf Coast ~20% of total Northeast ~20% of total Percentages in chart indicate expected firm transportation capacity as of fiscal 2030. Includes FT increase of 100 MDth/d in FY26 (Premium PA Markets and Gulf Coast), and expected increases of 215 MDth/d in FY27 (Premium PA Markets and Gulf Coast) and 275 MDth/d in FY28-30 (Premium PA Markets and Gulf Coast). NE Supply Divers. 50 MDth/d Niagara Expansion (TGP & NFG - Supply) 170 MDth/d Atlantic Sunrise (Transco) 189 MDth/d Tioga County Extension (NFG - Empire) 200 MDth/d Premium PA Markets ~30% of total Premium PA Markets 490 MDth/d ~1.0 Bcf/d ~1.5 Bcf/d Gulf Coast 100 MDth/d Leidy South (Transco & NFG - Supply) 330 MDth/d Supports future production growth with egress from Tioga County Minimizes spot exposure (together with in-basin firm sales) Increases optionality and connectivity to premium markets Data centers (Western PA, Mid-Atlantic) Gulf Coast (LNG exports, industrial markets)
National Fuel Gas Company (RemainCo) Overview
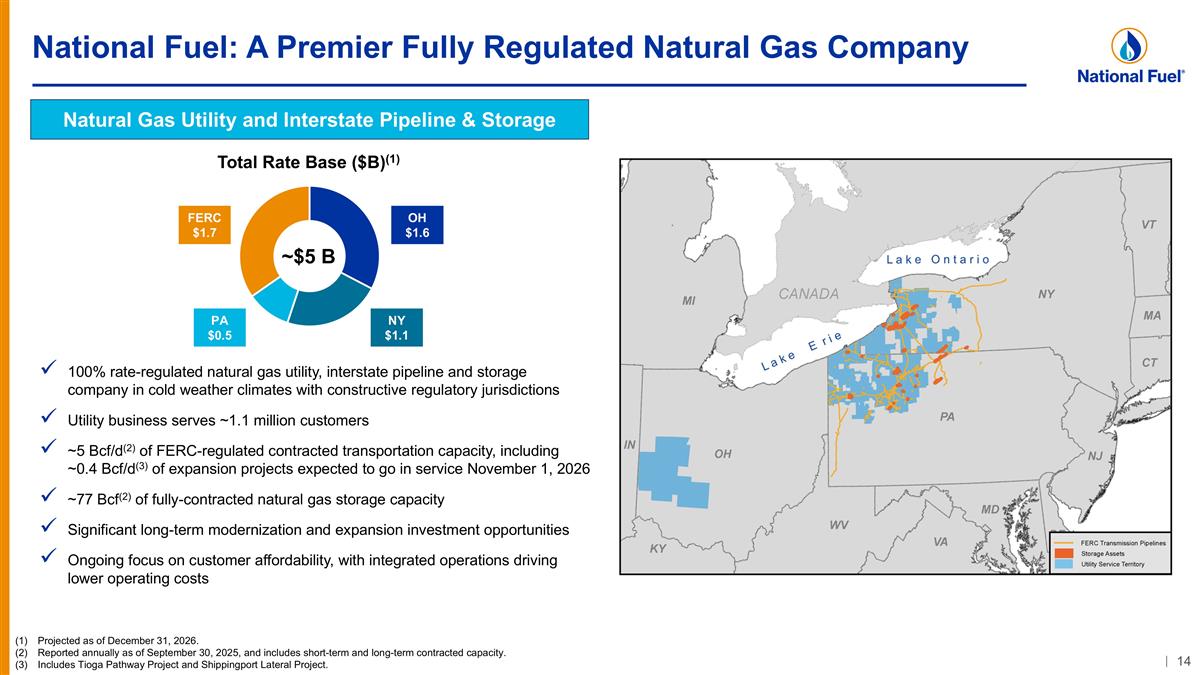
National Fuel: A Premier Fully Regulated Natural Gas Company Natural Gas Utility and Interstate Pipeline & Storage Projected as of December 31, 2026. Reported annually as of September 30, 2025, and includes short-term and long-term contracted capacity. Includes Tioga Pathway Project and Shippingport Lateral Project. 100% rate-regulated natural gas utility, interstate pipeline and storage company in cold weather climates with constructive regulatory jurisdictions Utility business serves ~1.1 million customers ~5 Bcf/d(2) of FERC-regulated contracted transportation capacity, including ~0.4 Bcf/d(3) of expansion projects expected to go in service November 1, 2026 ~77 Bcf(2) of fully-contracted natural gas storage capacity Significant long-term modernization and expansion investment opportunities Ongoing focus on customer affordability, with integrated operations driving lower operating costs ~$5 B NY $1.1 PA $0.5 OH $1.6 FERC $1.7 Total Rate Base ($B)(1)
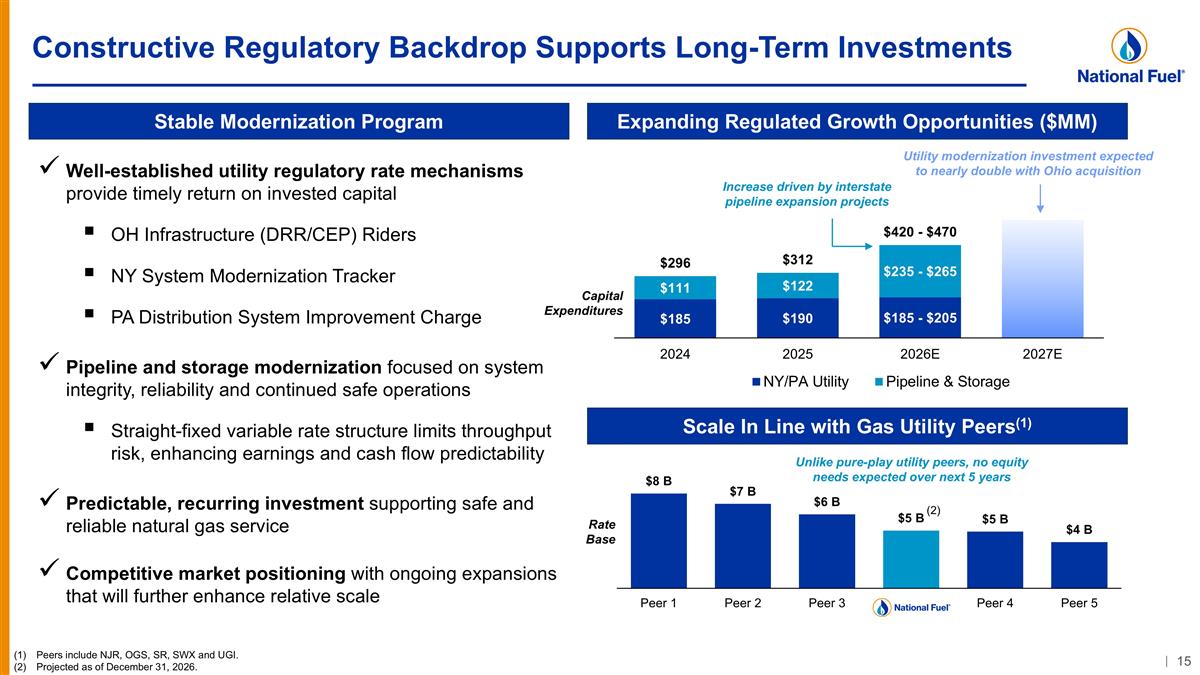
Constructive Regulatory Backdrop Supports Long-Term Investments Well-established utility regulatory rate mechanisms provide timely return on invested capital OH Infrastructure (DRR/CEP) Riders NY System Modernization Tracker PA Distribution System Improvement Charge Pipeline and storage modernization focused on system integrity, reliability and continued safe operations Straight-fixed variable rate structure limits throughput risk, enhancing earnings and cash flow predictability Predictable, recurring investment supporting safe and reliable natural gas service Competitive market positioning with ongoing expansions that will further enhance relative scale Stable Modernization Program Utility modernization investment expected to nearly double with Ohio acquisition Expanding Regulated Growth Opportunities ($MM) Scale In Line with Gas Utility Peers(1) (1) Peers include NJR, OGS, SR, SWX and UGI. Projected as of December 31, 2026. Increase driven by interstate pipeline expansion projects (2) Rate Base Unlike pure-play utility peers, no equity needs expected over next 5 years Capital Expenditures
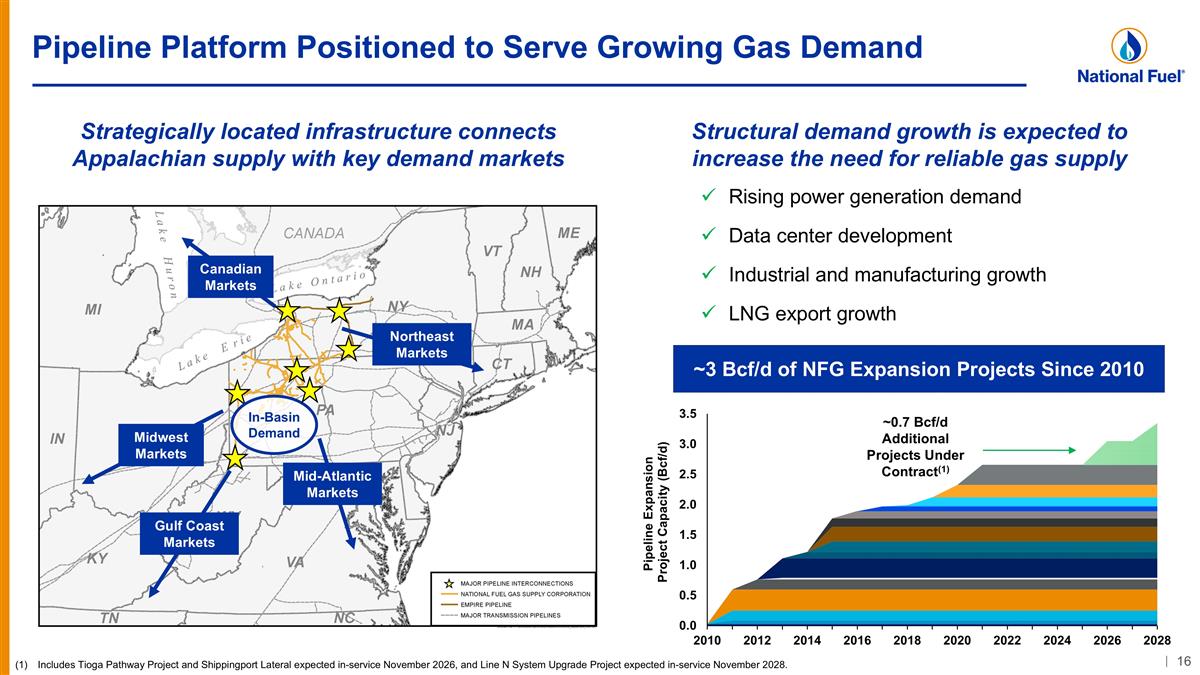
Pipeline Platform Positioned to Serve Growing Gas Demand ~3 Bcf/d of NFG Expansion Projects Since 2010 Strategically located infrastructure connects Appalachian supply with key demand markets Structural demand growth is expected to increase the need for reliable gas supply Rising power generation demand Data center development Industrial and manufacturing growth LNG export growth Canadian Markets Northeast Markets Mid-Atlantic Markets Gulf Coast Markets Midwest Markets Includes Tioga Pathway Project and Shippingport Lateral expected in-service November 2026, and Line N System Upgrade Project expected in-service November 2028. In-Basin Demand
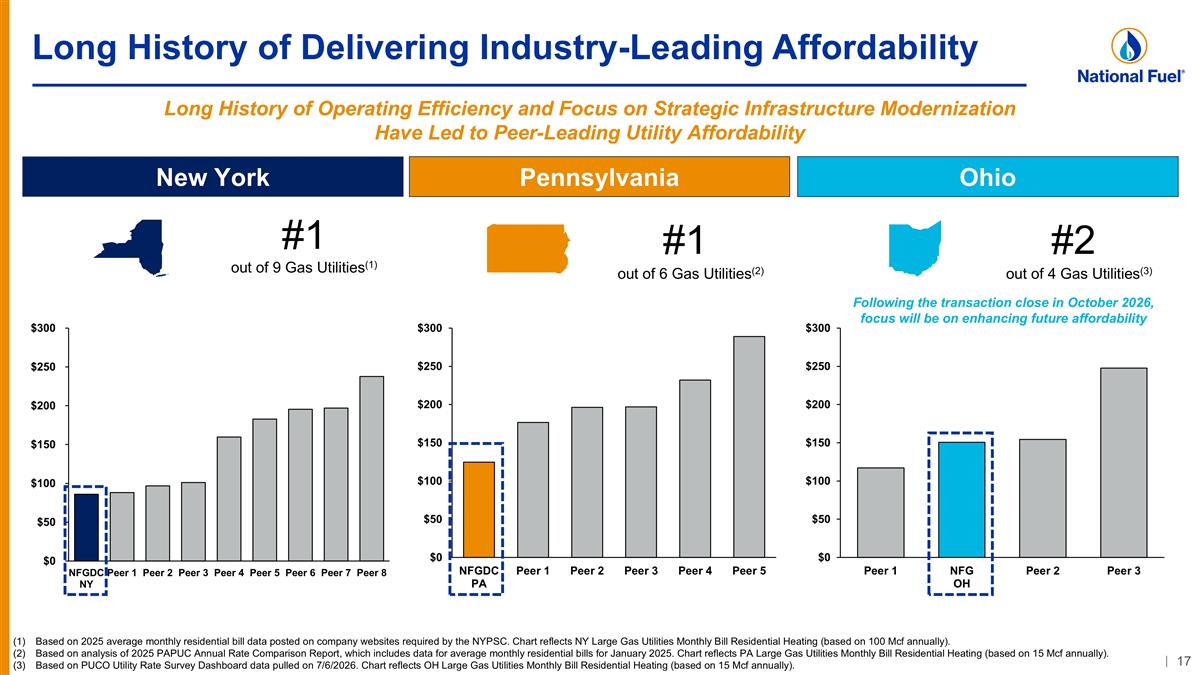
Long History of Delivering Industry-Leading Affordability Based on 2025 average monthly residential bill data posted on company websites required by the NYPSC. Chart reflects NY Large Gas Utilities Monthly Bill Residential Heating (based on 100 Mcf annually). Based on analysis of 2025 PAPUC Annual Rate Comparison Report, which includes data for average monthly residential bills for January 2025. Chart reflects PA Large Gas Utilities Monthly Bill Residential Heating (based on 15 Mcf annually). Based on PUCO Utility Rate Survey Dashboard data pulled on 7/6/2026. Chart reflects OH Large Gas Utilities Monthly Bill Residential Heating (based on 15 Mcf annually). New York Pennsylvania #1 out of 9 Gas Utilities(1) #1 out of 6 Gas Utilities(2) Ohio #2 out of 4 Gas Utilities(3) Long History of Operating Efficiency and Focus on Strategic Infrastructure Modernization Have Led to Peer-Leading Utility Affordability Following the transaction close in October 2026, focus will be on enhancing future affordability
Financial Profile & Transaction Details
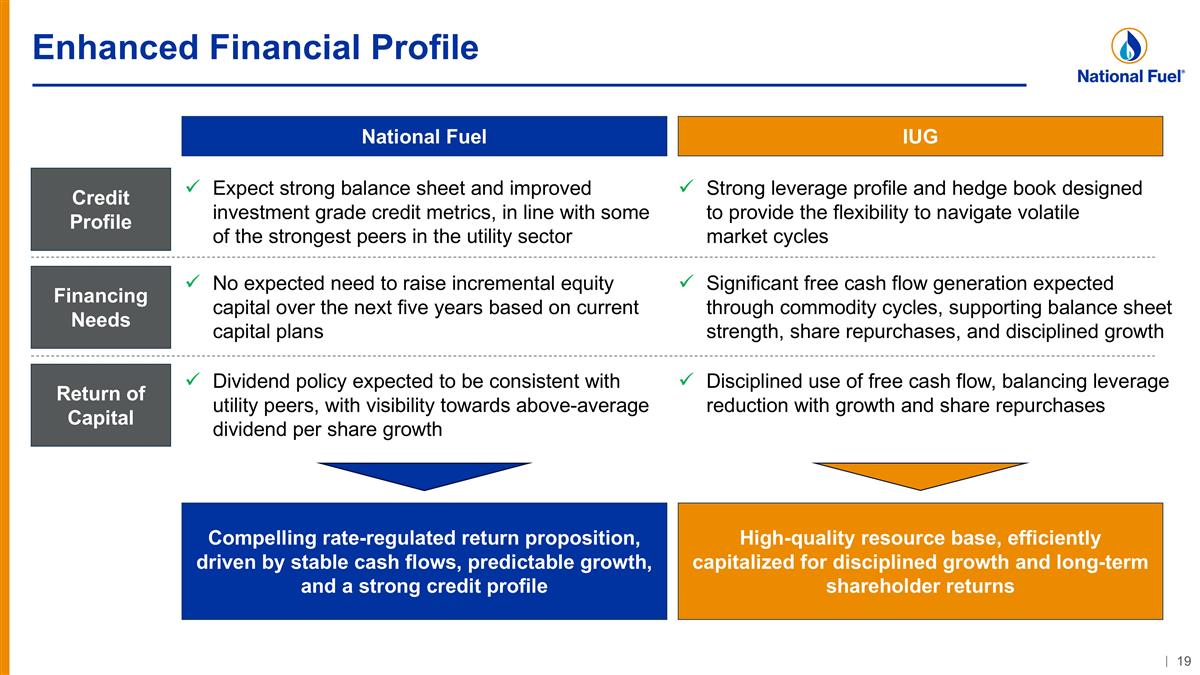
Enhanced Financial Profile High-quality resource base, efficiently capitalized for disciplined growth and long-term shareholder returns Compelling rate-regulated return proposition, driven by stable cash flows, predictable growth, and a strong credit profile Expect strong balance sheet and improved investment grade credit metrics, in line with some of the strongest peers in the utility sector Strong leverage profile and hedge book designed to provide the flexibility to navigate volatile market cycles National Fuel IUG Credit Profile Return of Capital Financing Needs Dividend policy expected to be consistent with utility peers, with visibility towards above-average dividend per share growth No expected need to raise incremental equity capital over the next five years based on current capital plans Significant free cash flow generation expected through commodity cycles, supporting balance sheet strength, share repurchases, and disciplined growth Disciplined use of free cash flow, balancing leverage reduction with growth and share repurchases
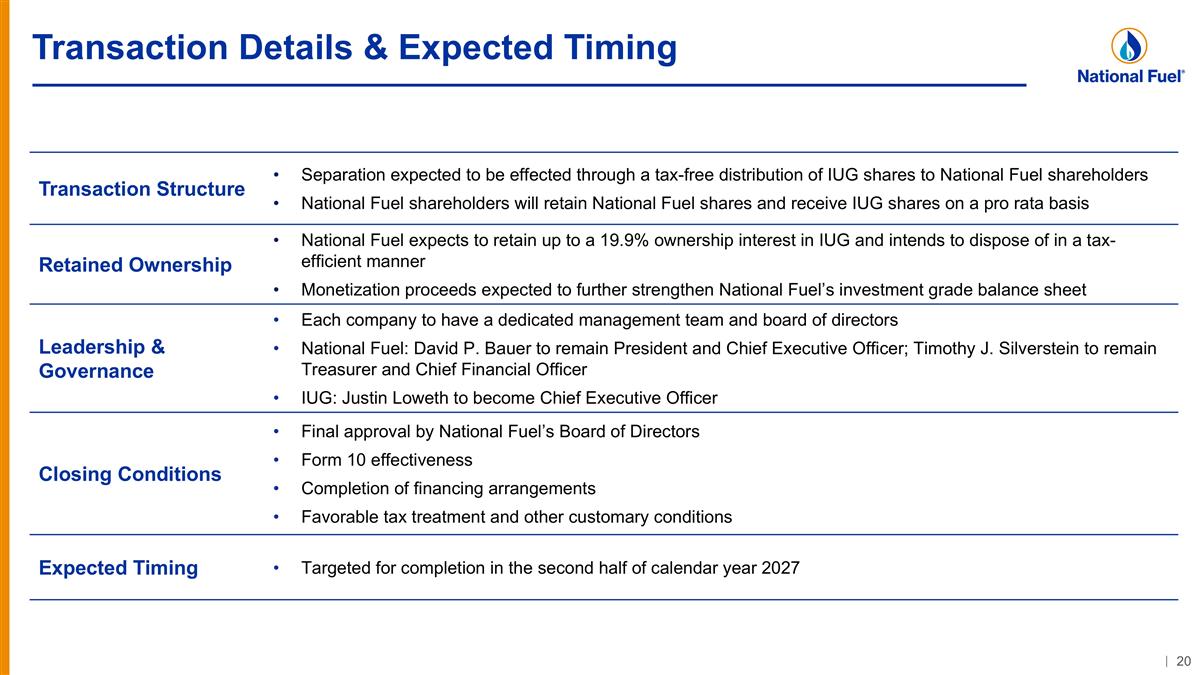
Transaction Details & Expected Timing Transaction Structure Separation expected to be effected through a tax-free distribution of IUG shares to National Fuel shareholders National Fuel shareholders will retain National Fuel shares and receive IUG shares on a pro rata basis Retained Ownership National Fuel expects to retain up to a 19.9% ownership interest in IUG and intends to dispose of in a tax-efficient manner Monetization proceeds expected to further strengthen National Fuel’s investment grade balance sheet Leadership & Governance Each company to have a dedicated management team and board of directors National Fuel: David P. Bauer to remain President and Chief Executive Officer; Timothy J. Silverstein to remain Treasurer and Chief Financial Officer IUG: Justin Loweth to become Chief Executive Officer Closing Conditions Final approval by National Fuel’s Board of Directors Form 10 effectiveness Completion of financing arrangements Favorable tax treatment and other customary conditions Expected Timing Targeted for completion in the second half of calendar year 2027
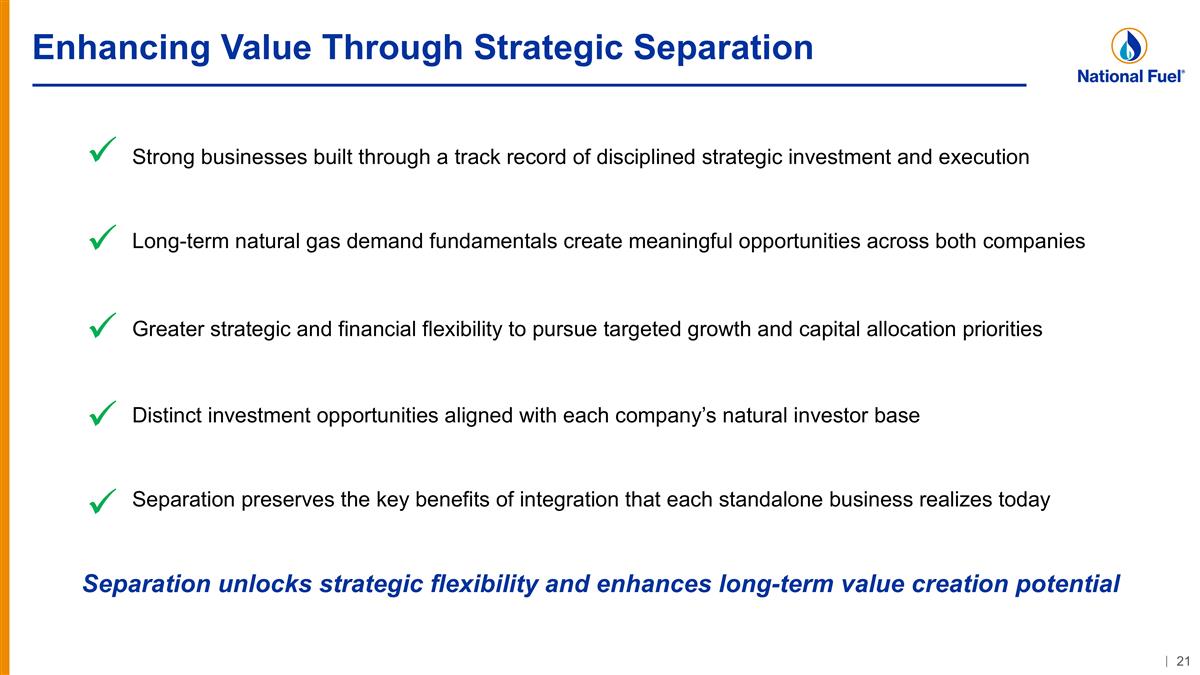
Enhancing Value Through Strategic Separation ü Long-term natural gas demand fundamentals create meaningful opportunities across both companies ü Separation preserves the key benefits of integration that each standalone business realizes today ü Distinct investment opportunities aligned with each company’s natural investor base ü Greater strategic and financial flexibility to pursue targeted growth and capital allocation priorities ü Strong businesses built through a track record of disciplined strategic investment and execution Separation unlocks strategic flexibility and enhances long-term value creation potential
Safe Harbor For Forward Looking Statements Certain statements contained herein, including statements identified by the use of the words “anticipates,” “believes,” “could,” “estimates,” “expects,” “forecasts,” “guidance,” “intends,” “may,” “might,” “outlook,” “plans,” “potential,” “predicts,” “projects,” “seeks,” “targets,” “will,” “would”, and variations of such words and similar future or conditional expressions, and statements which are other than statements of historical facts, are intended to identify “forward-looking statements” as defined under U.S. federal securities laws, including, but not limited to, statements, estimates, and projections relating to the potential separation of the Company into two companies (the “Separation”), including the timing and structure of the Separation, the characteristics of the separated businesses, and the expected benefits of the Separation, future operating and financial performance and long-term strategy, and the assumptions underlying such expected benefits, targets, strategies, and statements. These forward-looking statements are based on management’s beliefs, expectations, estimates, and projections at the time they are made and are not guarantees of future performance. Forward-looking statements involve risks and uncertainties, which could cause actual results or outcomes to differ materially from those expressed in the forward-looking statements. The Company’s expectations, beliefs, and projections contained herein are expressed in good faith and are believed to have a reasonable basis, but there can be no assurance that such expectations, beliefs, or projections will result or be achieved or accomplished. There can be no guarantees with respect to whether the Separation will be completed. In addition to other factors, the following are among the important factors that could cause actual results to differ materially from those discussed in the forward-looking statements: the ability to effect the Separation and to meet the conditions related thereto; the ability to obtain any consents or approvals required to complete the Separation; the ability of the separated companies to each succeed as standalone publicly traded companies; negative effects of the announcement or pendency of the Separation on the market price of the Company’s securities and/or on the Company’s financial performance; the possibility that the Separation will not achieve its intended benefits; the possibility of disruption, including disputes, litigation, or unanticipated costs in connection with the Separation; the impact of the Separation on the Company’s businesses and the risk that the Separation may be more difficult, time-consuming, or costly than expected, including the impact on the Company’s resources, systems, procedures, and controls, diversion of management’s attention, and the impact and possible disruption of existing relationships with regulators, customers, suppliers, employees, and other business counterparties; the ability to achieve anticipated capital structures in connection with the Separation; the ability to achieve anticipated credit ratings in connection with the Separation; the ability to achieve anticipated tax treatments in connection with the Separation and future, if any, divestitures, mergers, acquisitions, and other portfolio changes, and the impact of changes in relevant tax and other laws and regulations; changes in laws, regulations, or judicial interpretations to which the Company is subject, including those involving derivatives, taxes, safety, employment, climate change, other environmental matters, real property, and exploration and production activities such as hydraulic fracturing; governmental/regulatory actions, initiatives, and proceedings, including those involving rate cases (which address, among other things, target rates of return, rate design, retained natural gas, and system modernization), environmental/safety requirements, affiliate relationships, industry structure, and franchise renewal; changes in economic conditions, including the imposition of additional tariffs on U.S. imports and related retaliatory tariffs, inflationary pressures, supply chain issues, liquidity challenges, and global, national, or regional recessions, and their effect on the demand for, and customers’ ability to pay for, the Company’s products and services; the Company’s ability to complete strategic transactions, and to recognize the anticipated benefits of such transactions; governmental/regulatory actions and/or market pressures to reduce or eliminate reliance on natural gas; the Company’s ability to estimate accurately the time and resources necessary to meet emissions targets; changes in the price of natural gas; impairments under the SEC’s full cost ceiling test for natural gas reserves; the creditworthiness or performance of the Company’s key suppliers, customers, and counterparties; financial and economic conditions, including the availability of credit, and occurrences affecting the Company’s ability to obtain financing on acceptable terms for working capital, capital expenditures, other investments, and acquisitions, including any downgrades in the Company’s credit ratings and changes in interest rates and other capital market conditions; negotiations with the collective bargaining units representing the Company’s workforce, including potential work stoppages during negotiations; changes in price differentials between similar quantities of natural gas sold at different geographic locations, and the effect of such changes on commodity production, revenues, and demand for pipeline transportation capacity to or from such locations; the impact of information technology disruptions, cybersecurity, or data security breaches, including the impact of issues that may arise from the use of artificial intelligence technologies; factors affecting the Company’s ability to successfully identify, drill for, and produce economically viable natural gas reserves, including, among others, geology, lease availability and costs, title disputes, weather conditions, water availability and disposal or recycling opportunities of used water, shortages, delays, or unavailability of equipment and services required in drilling operations, insufficient gathering, processing, and transportation capacity, the need to obtain governmental approvals and permits, and compliance with environmental laws and regulations; increased costs, delays, or changes in plans with respect to Company projects or related projects of other companies, as well as difficulties or delays in obtaining necessary governmental approvals, permits or orders or in obtaining the cooperation of interconnecting facility operators; increasing health care costs and the resulting effect on health insurance premiums and on the obligation to provide other post-retirement benefits; other changes in price differentials between similar quantities of natural gas having different quality, heating value, hydrocarbon mix or delivery date; the cost and effects of legal and administrative claims against the Company or activist shareholder campaigns to effect changes at the Company; uncertainty of natural gas reserve estimates; significant differences between the Company’s projected and actual production levels for natural gas; changes in demographic patterns and weather conditions, including those related to climate change; changes in the availability, price, or accounting treatment of derivative financial instruments; changes in laws, actuarial assumptions, the interest rate environment, and the return on plan/trust assets related to the Company’s pension and other post-retirement benefits, which can affect future funding obligations and costs and plan liabilities; economic disruptions or uninsured losses resulting from major accidents, fires, severe weather, natural disasters, terrorist activities, or acts of war, as well as economic and operational disruptions due to third-party outages; significant differences between the Company’s projected and actual capital expenditures and operating expenses; increasing costs of insurance, changes in coverage, and the ability to obtain insurance; other factors described in the risk factors set forth in the Company’s filings with the U.S. Securities and Exchange Commission, including the Company’s most recently filed Annual Report on Form 10-K and subsequent Current Reports on Form 8-K and Quarterly Reports on Form 10-Q. Forward-looking statements speak only as of the date on which they are made, and the Company undertakes no obligation, and disclaims any duty, to update, revise, or withdraw any forward-looking statement, whether as a result of new information, future events, or otherwise, except as required by applicable law or regulation. .