Pay vs Performance Disclosure
Jun. 30, 2026
USD ($)
$ / shares
Jun. 30, 2025
USD ($)
$ / shares
Jun. 30, 2024
USD ($)
$ / shares
Jun. 30, 2023
USD ($)
$ / shares
Pay Versus Performance
Pursuant to Section 953(a) of the Dodd-Frank Act and Item 402(v) of SEC Regulation S-K, we are providing the following information about the relationship between CAP to IREN’s Co-PEOs and the Non-PEO NEOs and certain aspects of the financial performance of IREN. The Compensation Committee does not utilize CAP as the basis for making compensation decisions. For further information concerning our compensation philosophy and how we align executive compensation with our performance, please see our CD&A.
Pay Versus Performance
Fiscal Year(1) | Summary Compensation Table Total for Co-PEO W. Roberts(2) | Summary Compensation Table Total for Co-PEO D. Roberts(2) | Compensation Actually Paid to Co-PEO W. Roberts(3) | Compensation Actually Paid to Co-PEO D. Roberts(3) | Average Summary Compensation Table Total for Non-PEO NEOs(2) | Average Compensation Actually Paid to Non-PEO NEOs(3) | Value of Initial Fixed $100 Investment Based on: | GAAP Net Income ($m) | Company Selected Measure: Share Price (as of fiscal year end) | |||||||||||||||||||||||
IREN Total Shareholder Return(4) | Peer Group Total Shareholder Return(5) | |||||||||||||||||||||||||||||||
2026 | $49,899,354 | $49,988,498 | $505,921,565 | $506,010,709 | $3,336,242 | $5,367,167 | $1,365 | $330 | ($703) | $45.73 | ||||||||||||||||||||||
2025 | $72,647,744 | $72,647,744 | $116,262,163 | $116,262,163 | $2,321,407 | $3,553,385 | $435 | $225 | $87 | $14.57 | ||||||||||||||||||||||
2024 | $6,672,353 | $6,672,353 | $23,271,677 | $23,271,677 | $921,643 | $1,940,501 | $337 | $154 | ($29) | $11.29 | ||||||||||||||||||||||
2023 | $6,772,876 | $6,772,876 | $8,171,715 | $8,171,715 | $825,703 | $893,793 | $139 | $128 | ($172) | $4.66 | ||||||||||||||||||||||
(1) | Mr. William Roberts and Mr. Daniel Roberts served as Co-PEOs for fiscal years 2023 through 2026. Our Non-PEO NEOs for 2026 were Mr. Anthony Lewis and Ms. Belinda Nucifora, and our Non-PEO NEO for 2023 through 2025 was Ms. Belinda Nucifora. |
(2) | Amounts reported in these columns represent (i) the total compensation reported in the SCT for the applicable year in the case of our Co-PEOs, and (ii) the average of the total compensation reported in the SCT for the applicable year for our Non-PEO NEOs reported for the applicable year. |
(3) | Amounts reported in these columns represent compensation actually paid, or “CAP”; adjustments were made to the amounts reported in the SCT for the applicable year. A reconciliation of the adjustments for our Co-PEOs and, on average, for the Non-PEO NEOs for Fiscal 2026 is set forth in the following table. Each adjustment, as prescribed by SEC rules, is made to calculate CAP from the amounts reported in the SCT. |
Fiscal Year 2026 | |||||||||||
W. Roberts Co-PEO | D. Roberts Co-PEO | Average Non-PEO NEOs | |||||||||
Summary Compensation Table Total | $49,899,354 | $49,988,498 | $3,336,242 | ||||||||
Minus Equity Award Value & Option Award Value Reported in the SCT for the Fiscal Year | ($46,032,491) | ($46,032,491) | ($2,591,896) | ||||||||
Plus Year End Fair Value of Equity Awards Granted During the Fiscal Year that Remain Outstanding and Unvested as of Last Day of the Fiscal Year | $151,486,652 | $151,486,652 | $5,685,513 | ||||||||
Plus Year over Year Change in Fair Value as of the Last Day of the Fiscal Year of Outstanding and Unvested Equity Awards Granted in Prior Years | $109,930,079 | $109,930,079 | $0 | ||||||||
Plus Fair Value as of Vesting Date of Equity Awards Granted and Vested in the Fiscal Year | $0 | $0 | $0 | ||||||||
Plus Year over Year Change in Fair Value as of the Vesting Date of Equity Awards Granted in Prior Years that Vested During the Fiscal Year | $240,637,971 | $240,637,971 | $510,400 | ||||||||
Minus Fair Value at the End of the Prior Year of Equity Awards that Failed to Meet Vesting Conditions in the Fiscal Year | $0 | $0 | ($1,573,092) | ||||||||
Plus Value of Dividends or other Earnings Paid on Equity or Option Awards Not Otherwise Reflected in Fair Value or Total Compensation for the Fiscal Year | $0 | $0 | $0 | ||||||||
Compensation Actually Paid | $505,921,565 | $506,010,709 | $5,367,167 | ||||||||
The fair value of equity awards was calculated in accordance with ASC Topic 718.
(4) | TSR is cumulative for the measurement periods beginning on June 30, 2022 and ending on June 30 of each of 2023, 2024, 2025, and 2026, respectively, calculated in accordance with Item 201(e) of Regulation S-K. |
(5) | “Peer Group Total Shareholder Return” represents the weighted average total shareholder return according to the respective companies’ stock market capitalization at the beginning of each period for which a return is indicated. This “Peer Group” reflects the same Peer Group reported in the performance graph included in IREN’s Annual Report on Form 10-K for the fiscal year ended June 30, 2026. Beginning in 2026, the Peer Group includes the following companies: Bitdeer Technologies, Cipher Digital (formerly known as Cipher Mining), CleanSpark, CoreWeave, Hut 8, Keel Infrastructure (formerly known as Bitfarms), MARA Holdings, Nebius Group, Riot Platforms, and TeraWulf. Before 2026, the Peer Group included the following companies: Bitdeer Technologies, Cipher Digital, CleanSpark, Hut 8, Keel Infrastructure, MARA Holdings, and Riot Platforms. The prior peer group indexed TSR was 2023 - $225, 2024 - $297, 2025 - $270, and 2026 - $652. |
(1) | Mr. William Roberts and Mr. Daniel Roberts served as Co-PEOs for fiscal years 2023 through 2026. Our Non-PEO NEOs for 2026 were Mr. Anthony Lewis and Ms. Belinda Nucifora, and our Non-PEO NEO for 2023 through 2025 was Ms. Belinda Nucifora. |
(5) | “Peer Group Total Shareholder Return” represents the weighted average total shareholder return according to the respective companies’ stock market capitalization at the beginning of each period for which a return is indicated. This “Peer Group” reflects the same Peer Group reported in the performance graph included in IREN’s Annual Report on Form 10-K for the fiscal year ended June 30, 2026. Beginning in 2026, the Peer Group includes the following companies: Bitdeer Technologies, Cipher Digital (formerly known as Cipher Mining), CleanSpark, CoreWeave, Hut 8, Keel Infrastructure (formerly known as Bitfarms), MARA Holdings, Nebius Group, Riot Platforms, and TeraWulf. Before 2026, the Peer Group included the following companies: Bitdeer Technologies, Cipher Digital, CleanSpark, Hut 8, Keel Infrastructure, MARA Holdings, and Riot Platforms. The prior peer group indexed TSR was 2023 - $225, 2024 - $297, 2025 - $270, and 2026 - $652. |
(5) | “Peer Group Total Shareholder Return” represents the weighted average total shareholder return according to the respective companies’ stock market capitalization at the beginning of each period for which a return is indicated. This “Peer Group” reflects the same Peer Group reported in the performance graph included in IREN’s Annual Report on Form 10-K for the fiscal year ended June 30, 2026. Beginning in 2026, the Peer Group includes the following companies: Bitdeer Technologies, Cipher Digital (formerly known as Cipher Mining), CleanSpark, CoreWeave, Hut 8, Keel Infrastructure (formerly known as Bitfarms), MARA Holdings, Nebius Group, Riot Platforms, and TeraWulf. Before 2026, the Peer Group included the following companies: Bitdeer Technologies, Cipher Digital, CleanSpark, Hut 8, Keel Infrastructure, MARA Holdings, and Riot Platforms. The prior peer group indexed TSR was 2023 - $225, 2024 - $297, 2025 - $270, and 2026 - $652. |
(3) | Amounts reported in these columns represent compensation actually paid, or “CAP”; adjustments were made to the amounts reported in the SCT for the applicable year. A reconciliation of the adjustments for our Co-PEOs and, on average, for the Non-PEO NEOs for Fiscal 2026 is set forth in the following table. Each adjustment, as prescribed by SEC rules, is made to calculate CAP from the amounts reported in the SCT. |
Fiscal Year 2026 | |||||||||||
W. Roberts Co-PEO | D. Roberts Co-PEO | Average Non-PEO NEOs | |||||||||
Summary Compensation Table Total | $49,899,354 | $49,988,498 | $3,336,242 | ||||||||
Minus Equity Award Value & Option Award Value Reported in the SCT for the Fiscal Year | ($46,032,491) | ($46,032,491) | ($2,591,896) | ||||||||
Plus Year End Fair Value of Equity Awards Granted During the Fiscal Year that Remain Outstanding and Unvested as of Last Day of the Fiscal Year | $151,486,652 | $151,486,652 | $5,685,513 | ||||||||
Plus Year over Year Change in Fair Value as of the Last Day of the Fiscal Year of Outstanding and Unvested Equity Awards Granted in Prior Years | $109,930,079 | $109,930,079 | $0 | ||||||||
Plus Fair Value as of Vesting Date of Equity Awards Granted and Vested in the Fiscal Year | $0 | $0 | $0 | ||||||||
Plus Year over Year Change in Fair Value as of the Vesting Date of Equity Awards Granted in Prior Years that Vested During the Fiscal Year | $240,637,971 | $240,637,971 | $510,400 | ||||||||
Minus Fair Value at the End of the Prior Year of Equity Awards that Failed to Meet Vesting Conditions in the Fiscal Year | $0 | $0 | ($1,573,092) | ||||||||
Plus Value of Dividends or other Earnings Paid on Equity or Option Awards Not Otherwise Reflected in Fair Value or Total Compensation for the Fiscal Year | $0 | $0 | $0 | ||||||||
Compensation Actually Paid | $505,921,565 | $506,010,709 | $5,367,167 | ||||||||
The fair value of equity awards was calculated in accordance with ASC Topic 718.
(3) | Amounts reported in these columns represent compensation actually paid, or “CAP”; adjustments were made to the amounts reported in the SCT for the applicable year. A reconciliation of the adjustments for our Co-PEOs and, on average, for the Non-PEO NEOs for Fiscal 2026 is set forth in the following table. Each adjustment, as prescribed by SEC rules, is made to calculate CAP from the amounts reported in the SCT. |
Fiscal Year 2026 | |||||||||||
W. Roberts Co-PEO | D. Roberts Co-PEO | Average Non-PEO NEOs | |||||||||
Summary Compensation Table Total | $49,899,354 | $49,988,498 | $3,336,242 | ||||||||
Minus Equity Award Value & Option Award Value Reported in the SCT for the Fiscal Year | ($46,032,491) | ($46,032,491) | ($2,591,896) | ||||||||
Plus Year End Fair Value of Equity Awards Granted During the Fiscal Year that Remain Outstanding and Unvested as of Last Day of the Fiscal Year | $151,486,652 | $151,486,652 | $5,685,513 | ||||||||
Plus Year over Year Change in Fair Value as of the Last Day of the Fiscal Year of Outstanding and Unvested Equity Awards Granted in Prior Years | $109,930,079 | $109,930,079 | $0 | ||||||||
Plus Fair Value as of Vesting Date of Equity Awards Granted and Vested in the Fiscal Year | $0 | $0 | $0 | ||||||||
Plus Year over Year Change in Fair Value as of the Vesting Date of Equity Awards Granted in Prior Years that Vested During the Fiscal Year | $240,637,971 | $240,637,971 | $510,400 | ||||||||
Minus Fair Value at the End of the Prior Year of Equity Awards that Failed to Meet Vesting Conditions in the Fiscal Year | $0 | $0 | ($1,573,092) | ||||||||
Plus Value of Dividends or other Earnings Paid on Equity or Option Awards Not Otherwise Reflected in Fair Value or Total Compensation for the Fiscal Year | $0 | $0 | $0 | ||||||||
Compensation Actually Paid | $505,921,565 | $506,010,709 | $5,367,167 | ||||||||
The fair value of equity awards was calculated in accordance with ASC Topic 718.
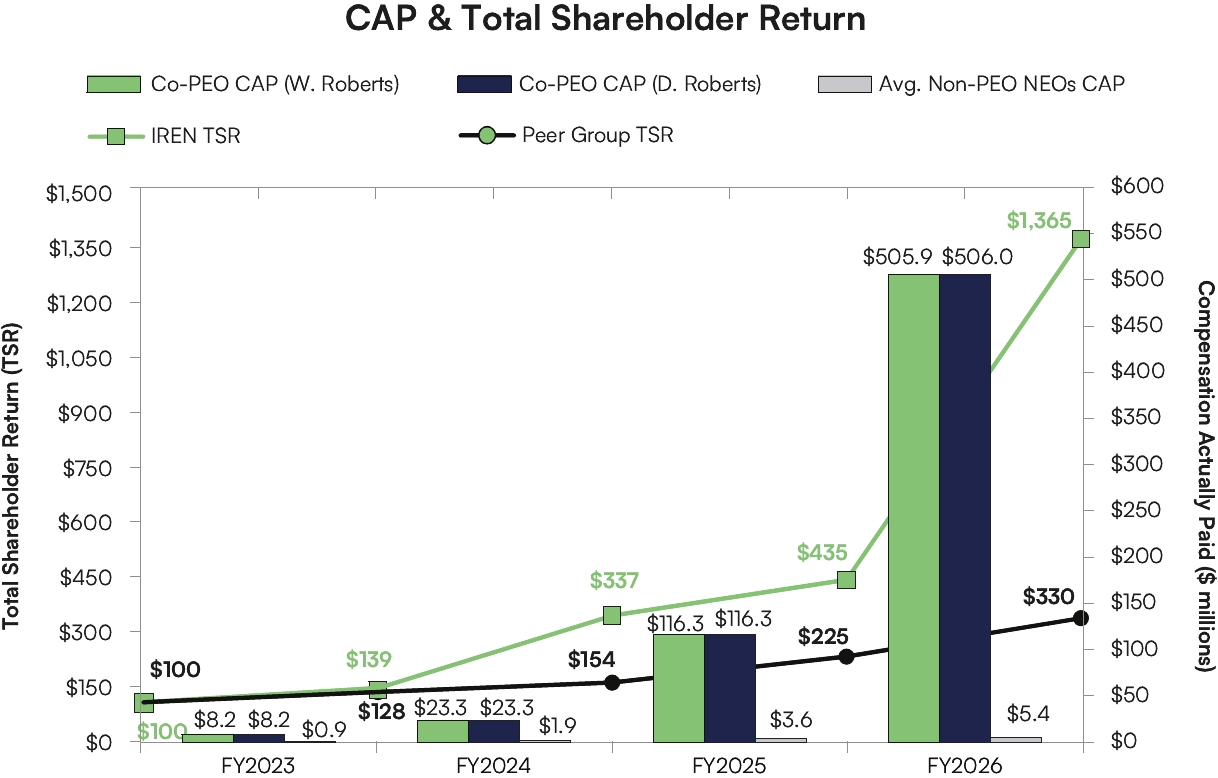
Relationship between CAP and TSR
The graphs below illustrate the relationship between our TSR and the Peer Group TSR, as well as the relationship between CAP and our TSR for the Co-PEOs and Non-PEO NEOs.
Relationship between CAP and GAAP Net Income
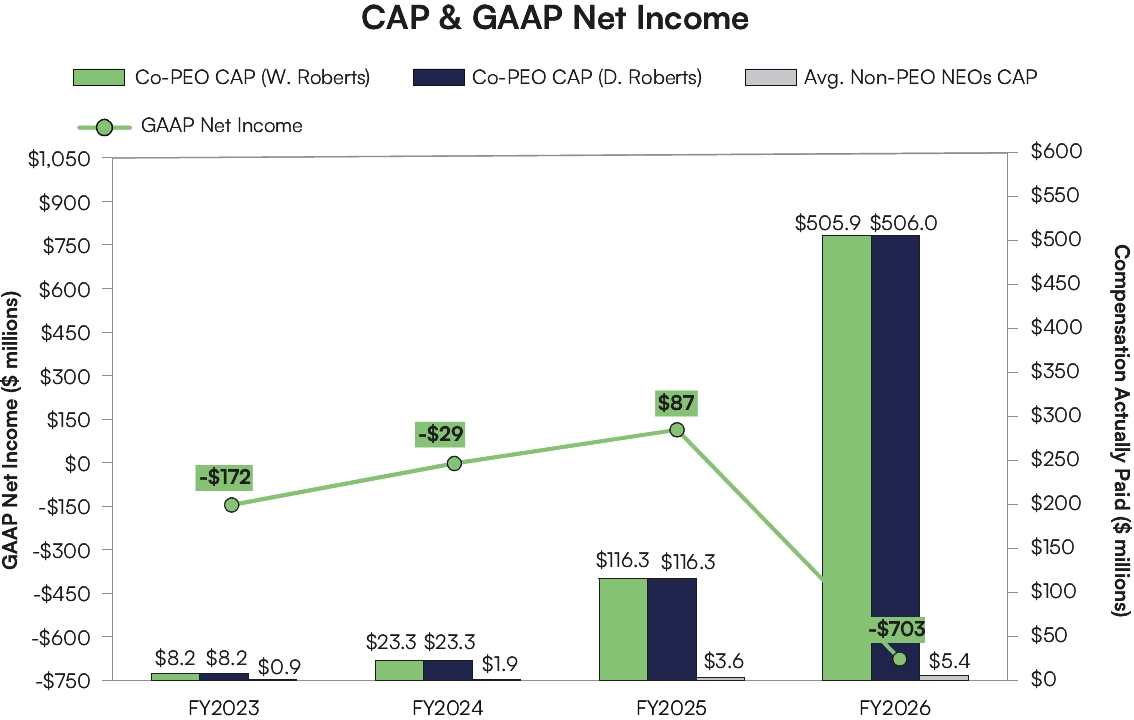
The graph below reflects the relationship between the Co-PEOs and Average Non-PEO NEOs CAP and our GAAP Net Income.
Relationship between CAP and Share Price
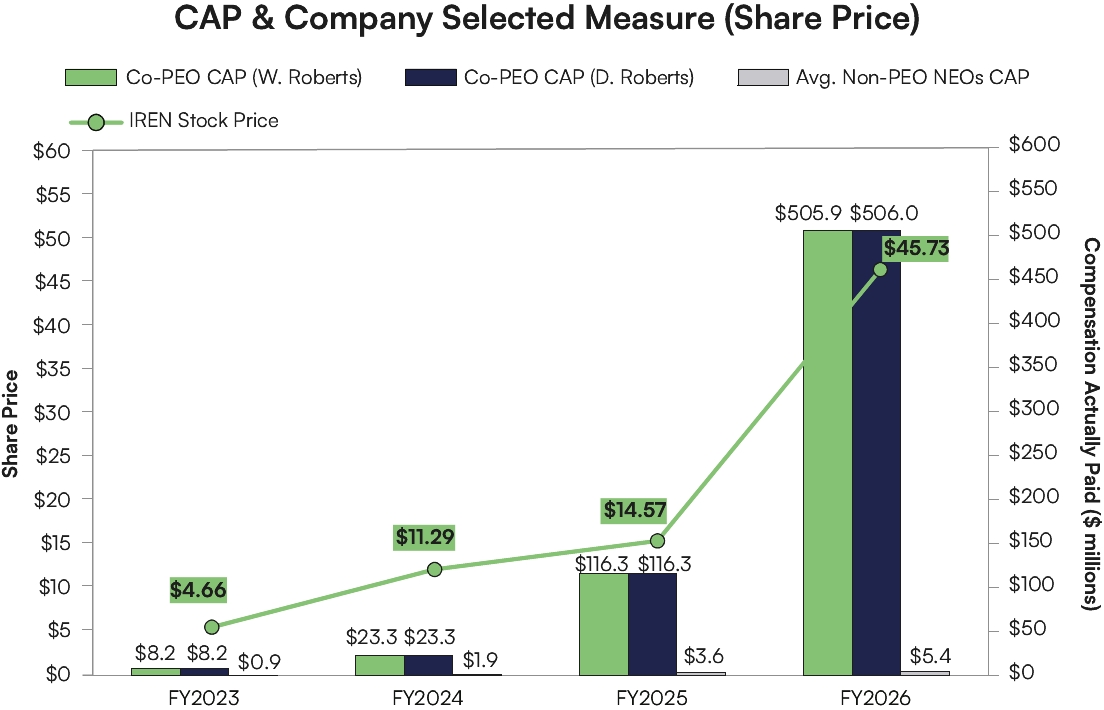
The graph below reflects the relationship between the Co-PEOs and Average Non-PEO NEOs CAP and our Share Price as of fiscal year end.
Relationship between CAP and TSR
The graphs below illustrate the relationship between our TSR and the Peer Group TSR, as well as the relationship between CAP and our TSR for the Co-PEOs and Non-PEO NEOs.
Performance measures used to link IREN performance and CAP
The following is a list of performance measures, which in our assessment represent the most important performance measures used by IREN to link compensation actually paid to the NEOs for Fiscal 2026. Please refer to the CD&A to see how they are used in IREN’s executive compensation program.
Share Price | ||
Relative Total Shareholder Return | ||