Pay vs Performance Disclosure - USD ($)
Dec. 31, 2025
Dec. 31, 2024
Dec. 31, 2023
| Summary Compensation Table Total | Average Summary Compensation Table Total | Value of Initial Fixed $100 Investment | ||||||||||||||||||||||
| Year | for the Principal Executive Officer (“PEO”) (1) | Compensation Actually Paid to the PEO (1)(3) | for Non-PEO Named Executive Officers (“NEOs”) (2) | Average Compensation Actually Paid to the NEOs (2)(3) | Total Shareholder Return (“TSR”) (4) | Net Income (Loss) | ||||||||||||||||||
| 2025 | $ | 858,077 | $ | 432,947 | $ | 510,942 | $ | 310,712 | $ | 141.04 | $ | (7,007,155 | ) | |||||||||||
| 2024 | $ | 446,154 | $ | 942,394 | $ | 245,384 | $ | 494,479 | $ | 242.45 | $ | (11,242,404 | ) | |||||||||||
| 2023 | $ | 657,797 | $ | 579,640 | $ | 353,898 | $ | 314,120 | $ | 88.68 | $ | (2,465,439 | ) | |||||||||||
| (1) | Our Chief Executive Officer, Fawad Maqbool, served as our PEO for all years in the table. | |
| (2) | Our Chief Financial Officer, Louisa Sanfratello, and our Chief Operating Officer, Jorge Flores, served as our Non-PEO NEOs for all years in the table. |
| Year | Executives | Summary Compensation Table Total | Subtract Equity Awards Granted in Covered Year (a) | Add Year-End Fair Value of Equity Awards (b)(f) | Change in Fair Value of Prior Equity Awards (c)(f) | Add Change in Fair Value of Vested Equity Awards (d)(f) | Subtract the Fair Value of Equity Awards that Failed to Meet Vesting Conditions (e) | Total Compensation Actually Paid | ||||||||||||||||||||||
| 2025 | PEO | $ | 858,077 | $ | $ | $ | (280,220 | ) | $ | (144,910 | ) | $ | $ | 432,947 | ||||||||||||||||
| 2025 | NEOs | $ | 510,942 | $ | $ | $ | (129,550 | ) | $ | (70,680 | ) | $ | $ | 310,712 | ||||||||||||||||
| 2024 | PEO | $ | 446,154 | $ | $ | $ | 528,380 | $ | (32,140 | ) | $ | $ | 942,394 | |||||||||||||||||
| 2024 | NEOs | $ | 245,384 | $ | $ | $ | 265,570 | $ | (16,475 | ) | $ | $ | 494,479 | |||||||||||||||||
| 2023 | PEO | $ | 657,797 | $ | (157,797 | ) | $ | 172,000 | $ | (65,280 | ) | $ | (27,080 | ) | $ | $ | 579,640 | |||||||||||||
| 2023 | NEOs | $ | 353,898 | $ | (78,898 | ) | $ | 86,000 | $ | (33,305 | ) | $ | (13,575 | ) | $ | $ | 314,120 | |||||||||||||
| a) | Subtract amounts reported in “Stock Awards” and “Option Awards” columns of the Summary Compensation Table. | |
| b) | For any equity awards granted in the covered fiscal year that are outstanding and unvested as of the end of the covered fiscal year, add the year-end fair value. | |
| c) | For any awards granted in prior years that are outstanding and unvested as of the end of the covered fiscal year, add the increase (or subtract the decrease) in fair value by comparing the fair value at the end of the fiscal year with the fair value at the end of the prior fiscal year. | |
| d) | For awards that are granted and vest in the same covered fiscal year, add the fair value as of the vesting date. For awards granted in prior years that vest in the covered fiscal year, add the increase (or subtract the decrease) in fair value by comparing the fair value on the vesting date with the fair value at the end of the prior fiscal year. | |
| e) | Subtract the prior fiscal year fair value of equity awards granted during prior years that fail to meet the applicable vesting conditions during the covered fiscal year. | |
| f) | The fair value of stock options at each measurement date was determined using the Black-Scholes option pricing model. The assumptions used (expected volatility, risk-free interest rate, and expected term) differ materially from those used at the grant date because they reflect market conditions and the remaining term of the awards at each measurement date. |
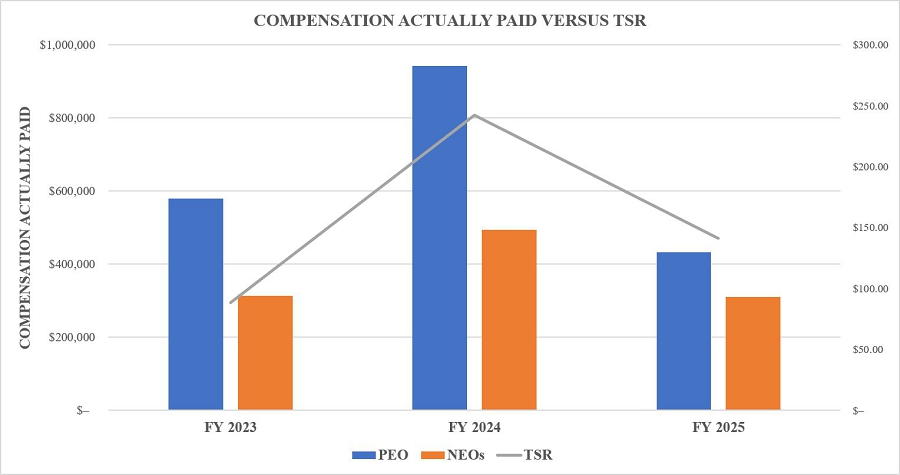
The chart below highlights the alignment between “compensation actually paid” to our Named Executive Officers and our total shareholder return performance for the past three fiscal years.
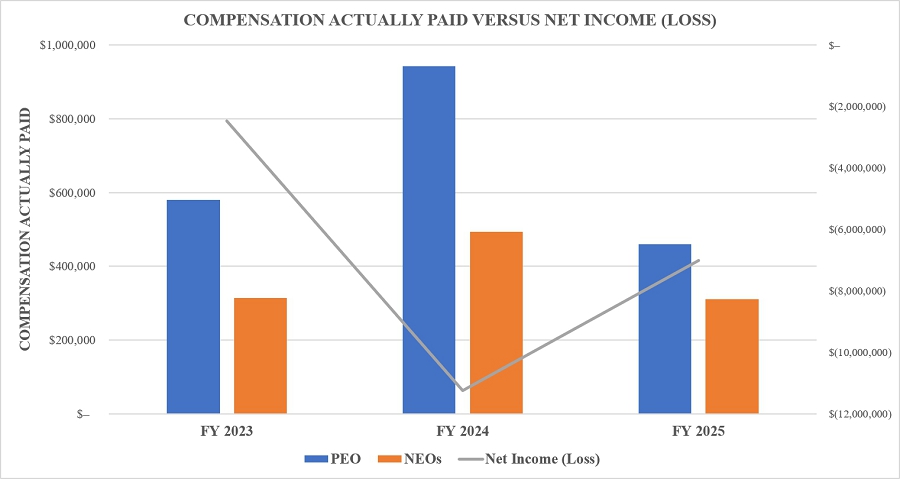
The chart below highlights the alignment between “compensation actually paid” to our Named Executive Officers and our net income performance for the past three fiscal years.
| [1] | Our Chief Executive Officer, Fawad Maqbool, served as our PEO for all years in the table. |
| [2] | To calculate “compensation actually paid” for our PEO and other NEOs the following adjustments were made to Summary Compensation Table total pay: |
| [3] | Our Chief Financial Officer, Louisa Sanfratello, and our Chief Operating Officer, Jorge Flores, served as our Non-PEO NEOs for all years in the table. |
| [4] | Total shareholder return is calculated as the cumulative value of a fixed $100 investment in our common stock, measured from the closing price on December 30, 2022, the last trading day before the earliest fiscal year in the table, through the last trading day of each fiscal year shown. We did not pay dividends during the period. |
| [5] | Subtract amounts reported in “Stock Awards” and “Option Awards” columns of the Summary Compensation Table. |
| [6] | For any equity awards granted in the covered fiscal year that are outstanding and unvested as of the end of the covered fiscal year, add the year-end fair value. |
| [7] | The fair value of stock options at each measurement date was determined using the Black-Scholes option pricing model. The assumptions used (expected volatility, risk-free interest rate, and expected term) differ materially from those used at the grant date because they reflect market conditions and the remaining term of the awards at each measurement date. |
| [8] | For any awards granted in prior years that are outstanding and unvested as of the end of the covered fiscal year, add the increase (or subtract the decrease) in fair value by comparing the fair value at the end of the fiscal year with the fair value at the end of the prior fiscal year. |
| [9] | For awards that are granted and vest in the same covered fiscal year, add the fair value as of the vesting date. For awards granted in prior years that vest in the covered fiscal year, add the increase (or subtract the decrease) in fair value by comparing the fair value on the vesting date with the fair value at the end of the prior fiscal year. |
| [10] | Subtract the prior fiscal year fair value of equity awards granted during prior years that fail to meet the applicable vesting conditions during the covered fiscal year. |