Pay Versus Performance Disclosure
The information below presents the relationship between the compensation of the Company’s NEOs and certain performance measures in accordance with Item 402(v) of SEC’s Regulation S-K.
| Year | Summary | Compensation | Average | Average | Value of | Net Income | ||||||||||||
| (a) | (b) | (d) | (f) | (g) | (h) | (i) | ||||||||||||
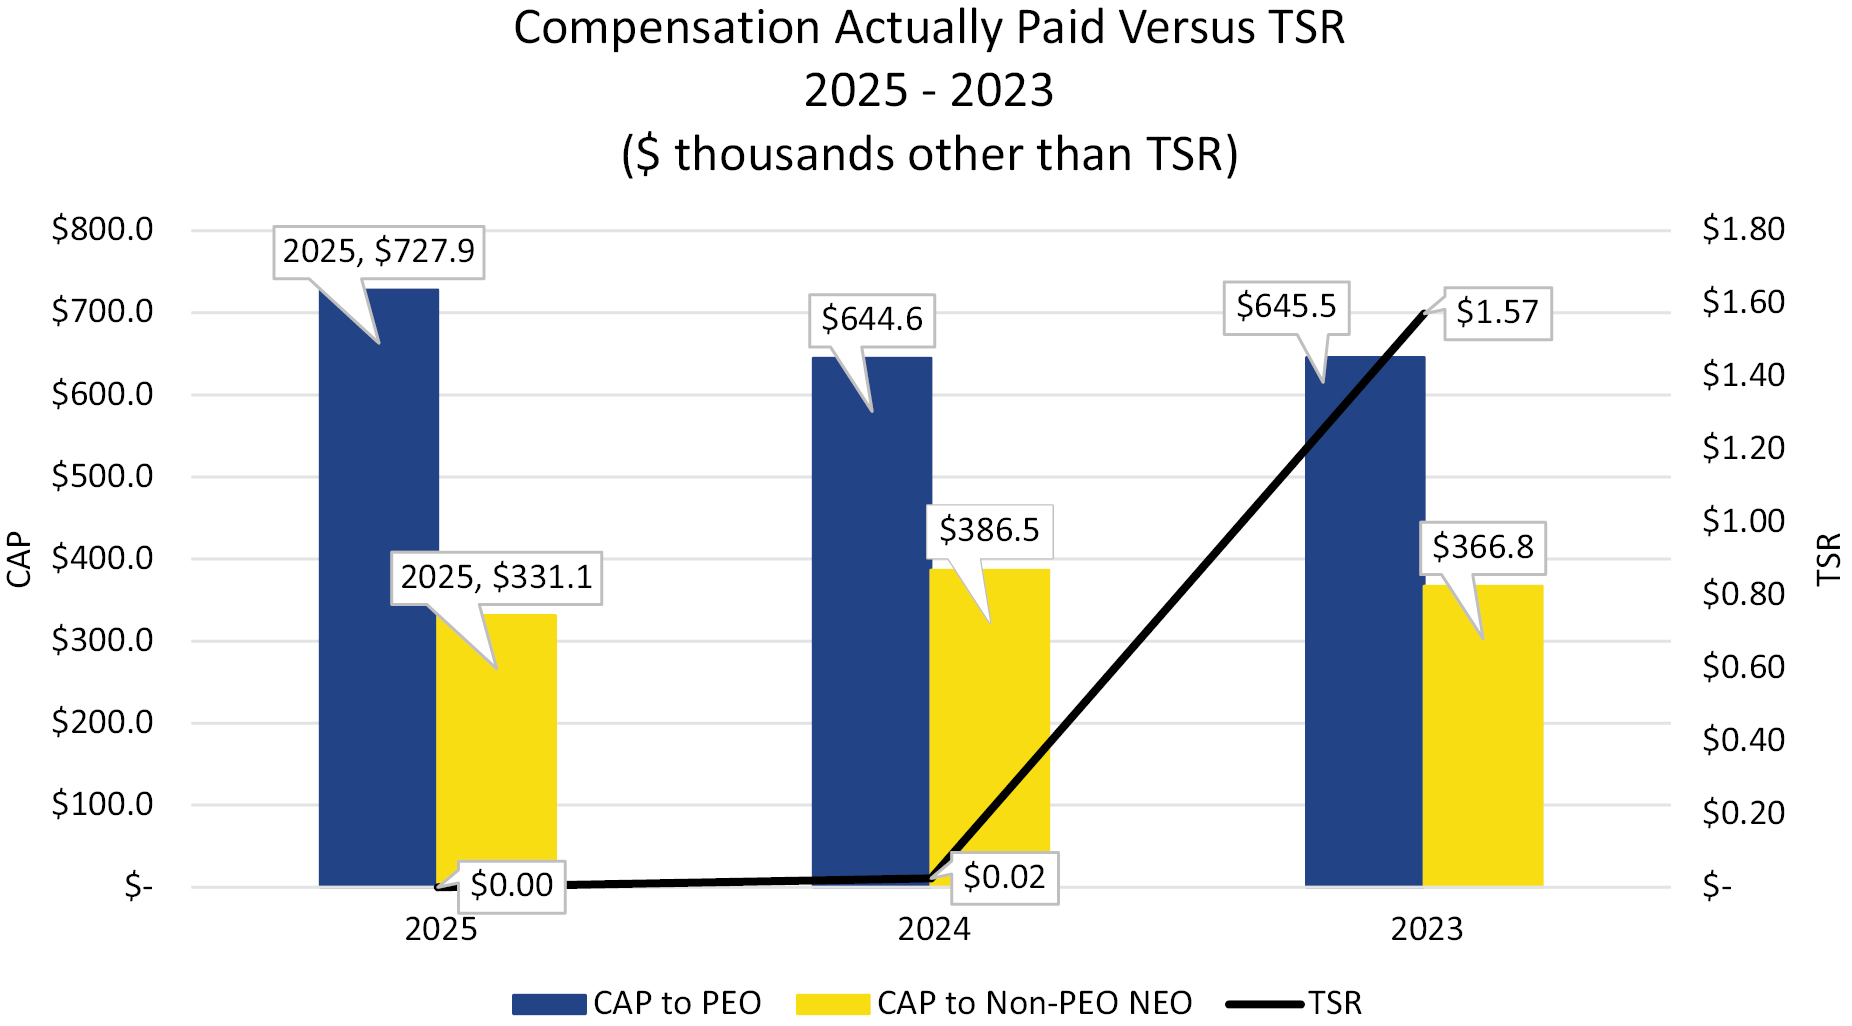
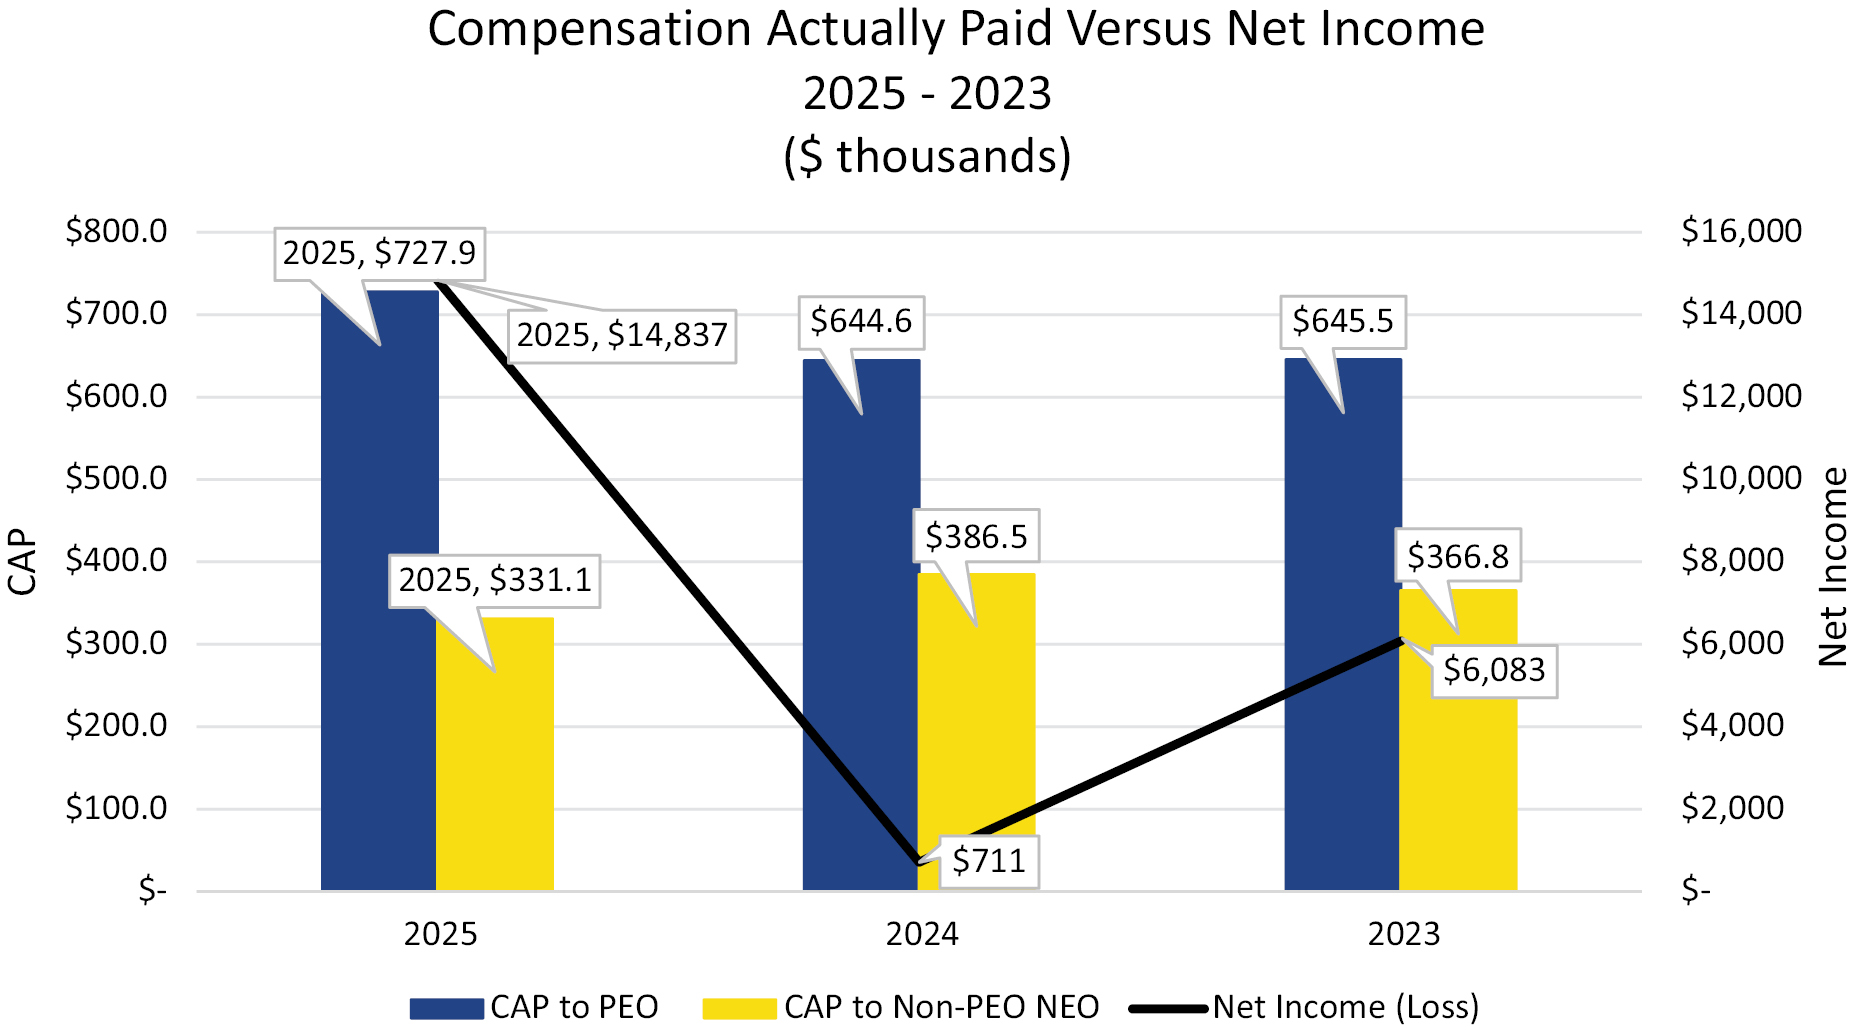
| 2025 | $ | 727,872 | $ | 727,872 | $ | 331,076 | $ | 331,076 | $ | 0.02 | $ | 14,837 | ||||||
| 2024 | $ | 644,626 | $ | 644,626 | $ | 386,947 | $ | 386,490 | $ | 0.02 | $ | 711 | ||||||
| 2023 | $ | 645,466 | $ | 645,466 | $ | 387,319 | $ | 366,837 | $ | 1.57 | $ | 6,083 | ||||||
____________
(1) Reflects only Ms. Plum because she was the only named executive officer (“NEO”) other than the PEO during the applicable years.
(2) Compensation Actually Paid (“CAP”) is the Summary Compensation Table total for the applicable officer as adjusted pursuant to SEC rules in respect of equity compensation, which is applicable to Ms. Plum only. Ms. Plum’s Average Summary Compensation Table total was reduced by the decrease in value of $458 and $20,483 of her unvested shares during 2024 and 2023, respectively. The unvested shares expired in 2024. Accordingly, “compensation actually paid” does not necessarily represent the actual amount of compensation earned by or paid to the NEOs during the applicable year.
(3) Total Shareholder Return is calculated assuming a $100 investment in the Company on December 31, 2022, calculated through the end of each of 2023, 2024 or 2025, as applicable, based on the Company’s share price.
| [1] | Reflects only Ms. Plum because she was the only named executive officer (“NEO”) other than the PEO during the applicable years. |
| [2] | Compensation Actually Paid (“CAP”) is the Summary Compensation Table total for the applicable officer as adjusted pursuant to SEC rules in respect of equity compensation, which is applicable to Ms. Plum only. Ms. Plum’s Average Summary Compensation Table total was reduced by the decrease in value of $458 and $20,483 of her unvested shares during 2024 and 2023, respectively. The unvested shares expired in 2024. Accordingly, “compensation actually paid” does not necessarily represent the actual amount of compensation earned by or paid to the NEOs during the applicable year. |
| [3] | Total Shareholder Return is calculated assuming a $100 investment in the Company on December 31, 2022, calculated through the end of each of 2023, 2024 or 2025, as applicable, based on the Company’s share price. |