
Exhibit 99.1
S-K 1300 Technical Report Summary
Marigold Complex, Nevada, USA
SSR Mining Inc.
SLR Project No.: 138.020810.00001
Effective Date:
May 1, 2026
Signature Date:
October 9, 2026
Prepared by:
SLR International Corporation

| SSR Mining Inc. | Marigold Complex | October 9, 2026 |
| S-K 1300 Technical Report Summary | SLR Project No.: 138.020810.00001 |
Cautionary Note Regarding Forward-Looking Statements:
Certain statements contained in this report are "forward-looking statements" within the meaning of Section 27A of the Securities Act of 1933, as amended (the “Securities Act”), and Section 21E of the Securities Exchange Act of 1934, as amended (the “Exchange Act”), and are intended to be covered by the safe harbor provided for under these sections. Forward looking statements can be identified with words such as “may,” “will,” “could,” “should,” “expect,” “plan,” “anticipate,” “believe,” “intend,” “estimate,” “projects,” “predict,” “potential,” “continue” and similar expressions, as well as statements written in the future tense. Forward-looking statements are based on information known at such time and/or with a good faith belief with respect to future events. Such statements are subject to risks and uncertainties that could cause actual performance or results to differ materially from those expressed in the forward-looking statements. Many of these risks and uncertainties cannot be controlled or predicted. Given these risks and uncertainties, readers are cautioned not to place undue reliance on forward-looking statements. Forward-looking statements include, among things: metal price assumptions, cash flow forecasts, projected capital and operating costs, metal recoveries, mine life and production rates, and other assumptions used in this report.
Such forward-looking information and statements are based on a number of material factors and assumptions, including, but not limited to: the inherent speculative nature of exploration results; the ability to explore; communications with local stakeholders; maintaining community and governmental relations; status of negotiations of joint ventures; weather conditions at our operations; commodity prices; the ultimate determination of and realization of Mineral Reserves; existence or realization of Mineral Resources; the development approach; availability and receipt of required approvals, titles, licenses and permits; sufficient working capital to develop and operate the mines and implement development plans; access to adequate services and supplies; foreign currency exchange rates; interest rates; access to capital markets and associated cost of funds; availability of a qualified work force; ability to negotiate, finalize, and execute relevant agreements; lack of social opposition to our mines or facilities; lack of legal challenges with respect to our properties; the timing and amount of future production; the ability to meet production, cost, and capital expenditure targets; timing and ability to produce studies and analyses; capital and operating expenditures; economic conditions; availability of sufficient financing; the ultimate ability to mine, process, and sell mineral products on economically favorable terms; and any and all other timing, exploration, development, operational, financial, budgetary, economic, legal, social, geopolitical, regulatory and political factors that may influence future events or conditions. While we consider these factors and assumptions to be reasonable based on information currently available to us, they may prove to be incorrect.
The above list is not exhaustive list of the factors that may affect any of the forward-looking statements and information included in this report, and such statements and information will not be updated to reflect events or circumstances arising after the date of such statements or to reflect the occurrence of anticipated or unanticipated events.
This technical report summary also contains financial measures which are not recognized under U.S. generally accepted accounting principles.
| i |  |
| SSR Mining Inc. | Marigold Complex | October 9, 2026 |
| S-K 1300 Technical Report Summary | SLR Project No.: 138.020810.00001 |
Table of Contents
| 1.0 Executive Summary | 1-1 |
| 1.1 Summary | 1-1 |
| 1.2 Economic Analysis | 1-11 |
| 1.3 Technical Summary | 1-14 |
| 2.0 Introduction | 2-1 |
| 2.1 Site Visits | 2-1 |
| 2.2 Sources of Information | 2-2 |
| 2.3 List of Abbreviations | 2-3 |
| 3.0 Property Description | 3-1 |
| 3.1 Location | 3-1 |
| 3.2 Land Tenure | 3-3 |
| 3.3 Encumbrances and Royalties | 3-14 |
| 3.4 Required Permits and Status | 3-15 |
| 3.5 Other Significant Factors and Risks | 3-15 |
| 4.0 Accessibility, Climate, Local Resources, Infrastructure and Physiography | 4-1 |
| 4.1 Accessibility | 4-1 |
| 4.2 Climate | 4-1 |
| 4.3 Local Resources | 4-1 |
| 4.4 Infrastructure | 4-1 |
| 4.5 Physiography | 4-2 |
| 5.0 History | 5-1 |
| 5.1 Ownership, Exploration, and Development History | 5-1 |
| 5.2 Past Production | 5-7 |
| 6.0 Geological Setting, Mineralization, and Deposit | 6-1 |
| 6.1 Regional Geology | 6-1 |
| 6.2 Local Geology | 6-3 |
| 6.3 Property Geology | 6-8 |
| 6.4 Deposit Type | 6-28 |
| 7.0 Exploration | 7-1 |
| 7.1 Geophysical and Geochemical Surveys | 7-2 |
| 7.2 Drilling | 7-4 |
| 8.0 Sample Preparation, Analyses, and Security | 8-1 |
| 8.1 Sample Preparation and Analysis | 8-1 |
| i | |
| SSR Mining Inc. | Marigold Complex | October 9, 2026 |
| S-K 1300 Technical Report Summary | SLR Project No.: 138.020810.00001 |
| 8.2 Quality Assurance and Quality Control | 8-5 |
| 8.3 Sample Security | 8-14 |
| 8.4 QP Opinion | 8-15 |
| 9.0 Data Verification | 9-1 |
| 9.1 Marigold Database Migration | 9-1 |
| 9.2 QP Opinion | 9-2 |
| 10.0 Mineral Processing and Metallurgical Testing | 10-1 |
| 10.1 Marigold | 10-1 |
| 10.2 Buffalo Valley | 10-5 |
| 10.3 QP Opinion | 10-6 |
| 11.0 Mineral Resource Estimates | 11-1 |
| 11.1 Summary | 11-1 |
| 11.2 Marigold | 11-3 |
| 11.3 Buffalo Valley | 11-25 |
| 12.0 Mineral Reserve Estimates | 12-1 |
| 12.1 Summary | 12-1 |
| 12.2 Marigold | 12-2 |
| 12.3 Buffalo Valley | 12-5 |
| 13.0 Mining Methods | 13-1 |
| 13.1 Geotechnical, Hydrological, Pit, and Other Design Parameters | 13-1 |
| 13.2 Pit Phases and Timing | 13-8 |
| 13.3 Production Rates, Mine Life, Dimensions, and Dilution Factors | 13-13 |
| 13.4 Stripping Requirements | 13-13 |
| 13.5 Required Mining Fleet and Machinery | 13-15 |
| 13.6 Ore Control Drilling and Method | 13-16 |
| 13.7 Drilling and Blasting | 13-17 |
| 13.8 Loading Operations | 13-17 |
| 13.9 Hauling Operations | 13-18 |
| 13.10 Mine Support | 13-32 |
| 13.11 Mine Maintenance | 13-32 |
| 13.12 Mine General and Administration | 13-33 |
| 13.13 Mine Safety | 13-33 |
| 13.14 Mine Dewatering | 13-33 |
| 13.15 Mine Workforce | 13-37 |
| ii | |
| SSR Mining Inc. | Marigold Complex | October 9, 2026 |
| S-K 1300 Technical Report Summary | SLR Project No.: 138.020810.00001 |
| 13.16 QP Opinion | 13-37 |
| 14.0 Processing and Recovery Methods | 14-1 |
| 14.1 Marigold | 14-1 |
| 14.2 Buffalo Valley | 14-6 |
| 14.3 QP Opinion | 14-9 |
| 15.0 Infrastructure | 15-1 |
| 15.1 Marigold Infrastructure | 15-1 |
| 15.2 Buffalo Valley Infrastructure | 15-7 |
| 15.3 QP Opinion | 15-14 |
| 16.0 Market Studies | 16-1 |
| 16.1 Marketing and Metal Prices | 16-1 |
| 16.2 Contracts | 16-1 |
| 17.0 Environmental Studies, Permitting, and Plans, Negotiations, or Agreements with Local Individuals or Groups | 17-1 |
| 17.1 Summary | 17-1 |
| 17.2 Marigold | 17-1 |
| 17.3 Buffalo Valley | 17-6 |
| 18.0 Capital and Operating Costs | 18-1 |
| 18.1 Capital Costs | 18-1 |
| 18.2 Operating Costs | 18-2 |
| 19.0 Economic Analysis | 19-1 |
| 19.1 Economic Criteria | 19-1 |
| 19.2 Cash Flow Analysis | 19-2 |
| 19.3 Sensitivity Analysis | 19-4 |
| 20.0 Adjacent Properties | 20-1 |
| 21.0 Other Relevant Data and Information | 21-1 |
| 22.0 Interpretation and Conclusions | 22-1 |
| 22.1 Geology and Mineral Resources | 22-1 |
| 22.2 Mining and Mineral Reserves | 22-2 |
| 22.3 Mineral Processing | 22-4 |
| 22.4 Infrastructure | 22-6 |
| 22.5 Environment | 22-7 |
| 22.6 Capital and Operating Costs | 22-8 |
| 23.0 Recommendations | 23-1 |
| 23.1 Geology and Mineral Resources | 23-1 |
| iii | |
| SSR Mining Inc. | Marigold Complex | October 9, 2026 |
| S-K 1300 Technical Report Summary | SLR Project No.: 138.020810.00001 |
| 23.2 Mining and Mineral Reserves | 23-1 |
| 23.3 Mineral Processing | 23-2 |
| 23.4 Infrastructure | 23-2 |
| 23.5 Environment | 23-3 |
| 23.6 Capital and Operating Costs | 23-3 |
| 24.0 References | 24-1 |
| 25.0 Reliance on Information Provided by the Registrant | 25-1 |
| 26.0 Date and Signature Page | 26-1 |
| 27.0 Appendix 1 | 27-1 |
Tables
| Table 1-1: After-Tax Cash Flow Summary | 1-13 |
| Table 1-2: Summary of Marigold Mine and Buffalo Valley Mineral Resources | 1-19 |
| Table 1-3: Summary of Marigold Mineral Reserves Estimate as of May 1, 2026 | 1-20 |
| Table 1-4: Capital Costs Summary | 1-25 |
| Table 1-5: Operating Costs Summary | 1-26 |
| Table 3-1: List of Land Package Areas (in hectares) | 3-3 |
| Table 3-2: MMC Surface Lands | 3-5 |
| Table 3-3: MMC-Owned Unpatented Mining Claims within the Marigold Mine Project Area | 3-6 |
| Table 3-4: MMC-Owned Unpatented Mining Claims within the Sterling Project Area | 3-7 |
| Table 3-5: Decker Lease Unpatented Mining Claims | 3-10 |
| Table 3-6: Vek & Andrus Lease Unpatented Mining and Millsite Claims | 3-10 |
| Table 3-7: Euro-Nevada Lease Unpatented Mining Claims | 3-11 |
| Table 3-8: Franco-Nevada Lease Unpatented Mining Claims | 3-12 |
| Table 3-9: Nevada North Lease Unpatented Mining Claims | 3-13 |
| Table 3-10: New Nevada 2006 Unpatented Mining Claims | 3-13 |
| Table 3-11: Hardrock Exploration 2024 Lease Unpatented Mining Claims | 3-14 |
| Table 5-1: Summary of Historical Exploration | 5-5 |
| Table 5-2: Marigold Historical Production from August 1989 to April 1, 2014 | 5-7 |
| Table 5-3: Marigold Production from April 1, 2014 to March 31, 2026 | 5-7 |
| Table 7-1: Summary of Exploration Completed by SSR | 7-1 |
| Table 7-2: Summary of Drilling at Marigold | 7-5 |
| Table 7-3: Summary of Drilling at Buffalo Valley | 7-5 |
| iv | |
| SSR Mining Inc. | Marigold Complex | October 9, 2026 |
| S-K 1300 Technical Report Summary | SLR Project No.: 138.020810.00001 |
| Table 7-4: Summary of Drilling at Trenton Canyon | 7-6 |
| Table 8-1: Analytical Methods for Gold for the Marigold Assay Resource Database | 8-3 |
| Table 8-2: Comparison of Valmy Deposit NN Mean Gold Grades | 8-9 |
| Table 8-3: List of CRM Standards used between 2023 and June 2026 | 8-11 |
| Table 10-1: Gold Recovery by Lithology | 10-6 |
| Table 11-1: Summary of Marigold Mine and Buffalo Valley Mineral Resources | 11-2 |
| Table 11-2: Capping and Outlier Restriction Values and Distance for Various Domains | 11-5 |
| Table 11-3: Statistics Raw vs. Composites inside Mineralized Envelope | 11-6 |
| Table 11-4: Variogram Parameters | 11-7 |
| Table 11-5: Block Model Parameters | 11-8 |
| Table 11-6: Block Model Attributes | 11-8 |
| Table 11-7: Search Parameters for In Situ Estimation | 11-10 |
| Table 11-8: Search Parameters for Mineralized Stockpile | 11-10 |
| Table 11-9: Summary of Density for Different Material | 11-11 |
| Table 11-10: Resource Classification Parameters | 11-12 |
| Table 11-11: Estimation Variance Statistics, not depleted | 11-17 |
| Table 11-12: Marigold Resource Pit Parameters and Cut-off Grade | 11-21 |
| Table 11-13: Details of Marigold Mineral Resources Estimate Exclusive of Mineral Reserves as of May 1, 2026 | 11-22 |
| Table 11-14: Length Weighted Gold Assays (g/t) Statistics of Raw Samples by Estimation Domain | 11-28 |
| Table 11-15: Capping Values AUBEST (g/t) | 11-29 |
| Table 11-16: Variogram Models (AUBEST) | 11-30 |
| Table 11-17: Length Weighted Gold Assays (g/t) Statistics of Composite Samples by Domain | 11-31 |
| Table 11-18: AUCE Regression Summary Applied to AUFA Values | 11-36 |
| Table 11-19: Block Model Parameters (Mine Grid X, Y, Z in meters) | 11-36 |
| Table 11-20: Estimated Variables | 11-37 |
| Table 11-21: Volumetric Models Generated for Estimation Domaining and Grade Estimation | 11-37 |
| Table 11-22: Estimation Domain Boundary Types | 11-39 |
| Table 11-23: Grade Interpolation Parameters for AUBEST/AUCE | 11-40 |
| Table 11-24: Density Assignments | 11-40 |
| Table 11-25: Classification Rules | 11-41 |
| Table 11-26: Statistical Summary of Gold Grade Estimates (g/t) | 11-46 |
| Table 11-27: Buffalo Valley Resource Pit Parameters and Cut-off Grades | 11-51 |
| v | |
| SSR Mining Inc. | Marigold Complex | October 9, 2026 |
| S-K 1300 Technical Report Summary | SLR Project No.: 138.020810.00001 |
| Table 11-28: Details of Buffalo Valley Mineral Resources Estimate Exclusive of Mineral Reserves as of May 1, 2026 | 11-52 |
| Table 12-1: Summary of Marigold Mineral Reserves Estimate as of May 1, 2026 | 12-2 |
| Table 12-2: Key Economic Parameters for Mineral Reserves Estimate - Marigold | 12-4 |
| Table 12-3: Key Economic Parameters for Mineral Reserves Estimate – Buffalo Valley | 12-6 |
| Table 13-1: Overall Slope Angles by Azimuth – Marigold Mine | 13-6 |
| Table 13-2: Overall Slope Angles by Azimuth – Buffalo Valley Mine | 13-7 |
| Table 13-3: Design Parameters by Each Area – Marigold Mine | 13-7 |
| Table 13-4: Design Parameters by Each Area – Buffalo Valley Mine | 13-8 |
| Table 13-5: Mining Phase Design Summary | 13-9 |
| Table 13-6: Annual Production Schedule Tonnes Mined | 13-14 |
| Table 13-7: Marigold Mining Complex - Fleet Equipment List | 13-15 |
| Table 13-8: LOM Average Maintenance KPI of the MMC Equipment Fleet | 13-32 |
| Table 13-9: RIB Design Criteria – Marigold Mine | 13-36 |
| Table 16-1: Economic Analysis Metal Price Assumptions | 16-1 |
| Table 17-1: Marigold Mine Baseline Studies Supporting the EA | 17-2 |
| Table 17-2: Marigold Mine Environmental Permits for Operation | 17-2 |
| Table 17-3: Marigold Mine Reclamation Cost Estimate/Bond | 17-6 |
| Table 17-4: Baseline Studies Supporting the EIS | 17-7 |
| Table 17-5: Buffalo Valley Environmental Permits for Operation | 17-10 |
| Table 18-1: Capital Costs Summary | 18-1 |
| Table 18-2: Operating Costs Summary | 18-2 |
| Table 18-3: Mine Operating Cost Summary | 18-3 |
| Table 18-4: Process Operating Cost Summary | 18-3 |
| Table 18-5: G&A Operating Cost Summary | 18-4 |
| Table 18-6: Current Workforce | 18-4 |
| Table 18-7: LOM Workforce Levels | 18-4 |
| Table 19-1: After-Tax Cash Flow Summary | 19-3 |
| Table 19-2: After-Tax Sensitivity Analyses | 19-5 |
| Table 20-1: Past Production and Mineral Resources for Adjacent Properties | 20-1 |
Figures
| Figure 3-1: Location Map | 3-2 |
| Figure 3-2: Marigold and Sterling Land Package Map | 3-4 |
| vi | |
| SSR Mining Inc. | Marigold Complex | October 9, 2026 |
| S-K 1300 Technical Report Summary | SLR Project No.: 138.020810.00001 |
| Figure 5-1: View to the East–Southeast over the Cyanide Leach Tanks from the Marigold Mine prior to World War II | 5-1 |
| Figure 5-2: Location of Marigold Exploration Targets and Mining Areas | 5-4 |
| Figure 6-1: Location of the Marigold Mine in North-Central Nevada within the Basin and Range Physiographic Province | 6-1 |
| Figure 6-2: Location of Marigold and the Battle Mountain Mining District on the Battle Mountain-Eureka Mineral Trend | 6-4 |
| Figure 6-3: Stratigraphic Column for the Marigold Complex | 6-7 |
| Figure 6-4: Plan View Map Showing Distribution of Paleozoic Units at Marigold | 6-10 |
| Figure 6-5: Top Surface of the Valmy Formation with the Current Property Boundary | 6-12 |
| Figure 6-6: Cross Section 11,200N Highlighting Inferred Permian Growth Fault and Associated Antithetic Normal Faults with a Steep West Dip | 6-13 |
| Figure 6-7: Plan View of the Marigold Mine Area showing the Spatial Distribution of 1.0 g/t Au Grade Shells Over an 8 km Northerly Trend | 6-15 |
| Figure 6-8: Geologic Map of the Buffalo Valley Mine Area | 6-18 |
| Figure 6-9: Schematic Cross Section Buffalo Valley Deposit | 6-20 |
| Figure 6-10: Geologic Map of Trenton Canyon Area | 6-23 |
| Figure 6-11: Schematic Cross Section through Trenton Canyon | 6-27 |
| Figure 6-12: Model Illustrating Inferred Processes Related to Formation of Carlin-Type Gold Deposits (CTGD) and Distal Disseminated Silver–Gold Deposits | 6-29 |
| Figure 7-1: Plan View of All Drilling to End of May 2026 | 7-7 |
| Figure 8-1: Scatter Plot Between FA Gold Values with AA Finish and Gravimetric Finish | 8-6 |
| Figure 8-2: Q-Q Plot between FA Gold Values with AA Finish and Gravimetric Finish | 8-6 |
| Figure 8-3: Cross-Section with SSR Drill Holes and Historical Drill Holes Along Section 8000N | 8-8 |
| Figure 8-4: Cumulative Normal Distribution Comparing Composites from SSR Drilling and Historical Drilling | 8-9 |
| Figure 8-5: Z-Scores of all CRM Results (2023 – June 2026) | 8-11 |
| Figure 8-6: Field Duplicate HARD Plot for Fire Assay (AuFA) | 8-12 |
| Figure 8-7: Blank Results (January 2023 – June 2026) | 8-13 |
| Figure 8-8: Umpire Analytical Duplicate HARD Plot for Fire Assay (AuFA) of Original vs. Umpire Results | 8-14 |
| Figure 10-1: Column Test Results – Marigold | 10-2 |
| Figure 10-2: Bottle Roll vs. Column Recovery – Marigold | 10-2 |
| Figure 10-3: Exploration Database (2017) AuCN vs AuFA – All Data | 10-4 |
| Figure 10-4: Buffalo Valley Au Recovery by Size for each Lithology | 10-6 |
| vii | |
| SSR Mining Inc. | Marigold Complex | October 9, 2026 |
| S-K 1300 Technical Report Summary | SLR Project No.: 138.020810.00001 |
| Figure 11-1: Mineralized Envelopes and Dynamic Anisotropy Trend, 10400N, Red Dot area | 11-4 |
| Figure 11-2: Valmy Classification Cross Section (1100N) | 11-13 |
| Figure 11-3: Visual Validation, >= 0.002 opt, Not Depleted, Section -3850N | 11-15 |
| Figure 11-4: Visual Validation, AUKR >= 0.002 (opt), not depleted, Level 4400 | 11-16 |
| Figure 11-5: Swath Plot Along East, comparing Assay, Kriged Value and NN | 11-18 |
| Figure 11-6: Swath Plot Along North, comparing Assay, Kriged Value and NN | 11-19 |
| Figure 11-7: Swath Plot Along Elevation, comparing Assay, Kriged Value and NN | 11-20 |
| Figure 11-8: Buffalo Valley Estimation Domains (Plan View Elevation 5100) | 11-26 |
| Figure 11-9: Buffalo Valley Geology (Mine Grid Section -32,400 N) | 11-27 |
| Figure 11-10: Boxplot of AUFA by Domain (grade in opt) | 11-32 |
| Figure 11-11: Boxplot of AUCN by Domain (grade in opt) | 11-33 |
| Figure 11-12: Histograms of AUBEST By Domains (grade in opt) | 11-34 |
| Figure 11-13: Log Probability Plots of AUBEST By Domains (grade in opt) | 11-35 |
| Figure 11-14: Buffalo Valley-Dore Hills Mineralized Shell Boundary Conditions | 11-38 |
| Figure 11-15: FFOZ Boundary Conditions | 11-39 |
| Figure 11-16: Classification – Buffalo Valley Deposit (Looking N at 31550N With a 25’ Window) | 11-42 |
| Figure 11-17: Cross Section Buffalo Valley Deposit (-31550N, $2500 Resource Shell, 25ft Section Window, MII Only) | 11-44 |
| Figure 11-18: Cross Section Buffalo Valley Deposit (-32400N, $2500 Resource Shell, 25ft Section Window, MII Only) | 11-45 |
| Figure 11-19: Swath Plot X for AUBEST | 11-48 |
| Figure 11-20: Swath Plot Y for AUBEST | 11-49 |
| Figure 11-21: Swath Plot Elevation for AUBEST | 11-50 |
| Figure 13-1: End of Mine Life Reserve Pits- Marigold Mine | 13-11 |
| Figure 13-2: End of Mine Life Reserve Pits- Buffalo Valley Mine | 13-12 |
| Figure 13-3: Mine Annual Production Schedule | 13-15 |
| Figure 13-4: End of Production Year 2026 – Marigold Mine | 13-19 |
| Figure 13-5: End of Production Year 2027 – Marigold Mine | 13-20 |
| Figure 13-6: End of Production Year 2028 – Marigold Mine | 13-21 |
| Figure 13-7: End of Production Year 2029 – Marigold Mine | 13-22 |
| Figure 13-8: End of Production Year 2030 – Marigold Mine | 13-23 |
| Figure 13-9: End of Production Year 2031 – Marigold Mine | 13-24 |
| Figure 13-10: End of Production Year 2032 – Marigold Mine | 13-25 |
| Figure 13-11: End of Production Year 2040 (LOM) – Marigold Mine | 13-26 |
| viii | |
| SSR Mining Inc. | Marigold Complex | October 9, 2026 |
| S-K 1300 Technical Report Summary | SLR Project No.: 138.020810.00001 |
| Figure 13-12: End of Production Year 2029 – Buffalo Valley Mine | 13-27 |
| Figure 13-13: End of Production Year 2030 – Buffalo Valley Mine | 13-28 |
| Figure 13-14: End of Production Year 2031 – Buffalo Valley Mine | 13-29 |
| Figure 13-15: End of Production Year 2032 – Buffalo Valley Mine | 13-30 |
| Figure 13-16: End of Production Year 2034 – Buffalo Valley Mine | 13-31 |
| Figure 13-17: Marigold Dewatering Well Locations | 13-35 |
| Figure 13-18: Marigold RIB Locations and Monitoring System | 13-36 |
| Figure 14-1: Simplified Marigold Processing Flowsheet | 14-1 |
| Figure 14-2: Average Annual Reagent Consumption | 14-5 |
| Figure 14-3: Marigold Heap Leach Pad Gold Recovery (March 1990 through April 2026) | 14-5 |
| Figure 14-4: Buffalo Valley Process Flowsheet | 14-7 |
| Figure 14-5: Plan View of the Buffalo Valley Process Facility | 14-8 |
| Figure 15-1: Infrastructure Site Map | 15-4 |
| Figure 15-2: Freshwater Well Sites | 15-5 |
| Figure 15-3: LOM Site Schematic Showing Final Pit Limits, OBSA, and Leach Pad | 15-6 |
| Figure 15-4: Buffalo Valley Site Layout | 15-8 |
| Figure 15-5: Buffalo Valley Plan Boundary | 15-10 |
| Figure 15-6: Routing of Marigold to Buffalo Valley Connector Road | 15-12 |
| Figure 19-1: After-Tax Sensitivity Analysis | 19-4 |
| Figure 20-1: Adjacent Properties | 20-2 |
| ix | |
| SSR Mining Inc. | Marigold Complex | October 9, 2026 |
| S-K 1300 Technical Report Summary | SLR Project No.: 138.020810.00001 |
| 1.0 | Executive Summary |
| 1.1 | Summary |
SLR International Corporation (SLR) was retained by SSR Mining Incorporated (SSR) to prepare an independent Technical Report Summary (TRS) on the Marigold Complex (Marigold or the Property), located in Humboldt and Lander counties, Nevada, USA. The Marigold Complex includes the Marigold Mine (including Mackay, Valmy, and New Millenium) and the Buffalo Valley and Trenton Canyon deposits. SSR holds a 100% interest in the Property through its wholly owned subsidiary, Marigold Mining Company (MMC).
The purpose of this TRS is to disclose the results of the Mineral Resource and Mineral Reserve estimates for the Property with an effective date of May 1, 2026. This TRS conforms to United States Securities and Exchange Commission’s (SEC) Modernized Property Disclosure Requirements for Mining Registrants as described in Subpart 229.1300 of Regulation S-K, Disclosure by Registrants Engaged in Mining Operations (S-K 1300) and Item 601 (b)(96) Technical Report Summary. SLR visited the Property from June 10 to 12, 2026.
SSR has a diversified portfolio of operating, development and exploration assets across the Americas, including four operating mines in the USA, Canada, and Argentina. SSR is listed on the NASDAQ Global Select Market (NASDAQ:SSRM) and the Toronto Stock Exchange (TSX:SSRM).
SSR’s Marigold Complex is located approximately five kilometers (km) south–southwest of the town of Valmy, and approximately 24 km northwest of Battle Mountain. The open pit heap leach gold mine has been in production since 1989 and has produced over five million ounces of gold. The operation consists of several open pits, overburden storage areas (OBSA), leach pads, a carbon-in-column (CIC) adsorption facility, and a carbon processing and gold refining facility.
| 1.1.1 | Conclusions |
SLR offers the following conclusions by area.
| 1.1.1.1 | Geology and Mineral Resources |
| · | The Mineral Resource estimates for Marigold and Buffalo Valley have been prepared using accepted industry practices and conform to the requirements of SEC Regulation S-K 1300. |
| · | The estimates are supported by extensive drilling, validated geological and assay databases, appropriate metallurgical assumptions, robust estimation methodologies, and reasonable economic parameters. |
| · | The assigned Mineral Resource classifications appropriately reflect the level of geological confidence and estimation uncertainty inherent in each deposit. |
| · | Additional drilling and ongoing geological studies have the potential to expand the known mineralized footprint, improve classification confidence, and support future conversion of Mineral Resources to Mineral Reserves. |
| · | The Marigold Complex contains two distinct mineral deposit styles. Marigold and Trenton Canyon are classified as Carlin-type gold deposits, while Buffalo Valley is classified as a distal disseminated silver-gold deposit associated with felsic porphyry dikes, structural corridors, and favorable host rocks. |
| 1-1 | |
| SSR Mining Inc. | Marigold Complex | October 9, 2026 |
| S-K 1300 Technical Report Summary | SLR Project No.: 138.020810.00001 |
| · | Geological understanding of the Marigold Complex is supported by more than three decades of mining operations, extensive exploration programs, geologic mapping, geophysical surveys, metallurgical testing, production history, and ongoing resource definition drilling. |
| · | The current geological interpretations adequately define lithologic, structural, oxidation, alteration, and mineralization controls and provide a suitable basis for Mineral Resource estimation and classification. |
| · | Exploration, delineation, and resource development programs completed by SSR and predecessor operators have resulted in more than 13,000 drill holes and over 2.6 million meters of drilling across Marigold, Buffalo Valley, and Trenton Canyon. Recent drilling programs continue to support resource growth, conversion, and refinement of geological models. |
| · | The drilling density and spatial distribution of drill holes are sufficient to support the current geological interpretations and Mineral Resource classifications at both Marigold and Buffalo Valley. |
| · | The SLR Qualified Person considers the drilling methods, sampling practices, sample preparation procedures, analytical methods, quality assurance and quality control programs, and database management systems to be consistent with accepted industry standards and suitable for Mineral Resource estimation. |
| · | Independent verification procedures completed by SLR indicate that the geological, assay, density, and survey databases are sufficiently accurate, complete, and reliable for use in Mineral Resource estimation. |
| · | There are no Measured Resources at the Property. |
| · | The level of uncertainty has been adequately reflected in the classification of Mineral Resources for the Property. The MRE presented may be materially impacted by any future changes in the break-even cut-off grade, which may result from changes in mining method selection, mining costs, processing recoveries and costs, metal price fluctuations, or significant changes in geological knowledge. |
| · | The SLR QP is of the opinion that, with consideration of the recommendations summarized in Sections 1 and 23 of this TRS, any issues relating to all relevant technical and economic factors likely to influence the prospect of economic extraction can be resolved with further work. |
Marigold
| · | Mineral Resources were constrained within an optimized open pit shell that reflects reasonable prospects for eventual economic extraction using a gold price assumption of US$2,500/oz and a reporting cut-off grade of 0.069 g/t Au. |
| · | Effective May 1, 2026, the Marigold Mineral Resource estimate exclusive of Mineral Reserves comprises approximately 125.0 Mt of Indicated Mineral Resources at an average grade of 0.39 g/t Au and 18.1 Mt of Inferred Mineral Resources at an average grade of 0.30 g/t Au. No Measured Mineral Resources are reported. |
| · | Validation and reconciliation reviews demonstrate that the Marigold resource model provides reasonable predictions of grade and tonnage and is appropriate for mine planning and Mineral Reserve conversion activities. |
| 1-2 | |
| SSR Mining Inc. | Marigold Complex | October 9, 2026 |
| S-K 1300 Technical Report Summary | SLR Project No.: 138.020810.00001 |
| · | The SLR QP considers the geological interpretation, estimation methodology, classification criteria, and validation results to appropriately support the reported Marigold Mineral Resources. |
Buffalo Valley
| · | Mineral Resources were constrained within optimized pit shells using lithology-specific cut-off grades ranging from 0.10 g/t Au to 0.32 g/t Au and a gold price assumption of US$2,500/oz. |
| · | Effective May 1, 2026, the Buffalo Valley Mineral Resource estimate exclusive of Mineral Reserves comprises approximately 5.6 Mt of Indicated Mineral Resources grading 0.53 g/t Au and 11.2 Mt of Inferred Mineral Resources grading 0.31 g/t Au. No Measured Mineral Resources are reported. |
| · | Metallurgical testing confirms that gold recoveries vary by lithology and particle size and supports the recovery assumptions used in the Mineral Resource estimate. |
| · | The SLR QP considers the Buffalo Valley geological model, estimation methodology, resource classification criteria, and metallurgical assumptions to be appropriate for the style of mineralization and sufficient to support the reported Mineral Resources. |
| 1.1.1.2 | Mining and Mineral Reserves |
Marigold
| · | Marigold anchors the Complex with 240.44 Mt of Probable Reserves grading 0.46 g/t Au, containing 3.52 Moz. Including stockpiles and leach pad inventory, the total Mineral Reserve estimate is 3.96 Moz. The updated $2,200/oz gold price assumption triggered a 73% increase in contained gold compared to previous estimates. |
| · | Mining at Marigold is executed across 15.2 m benches (or 7.6 m for smaller shovels to control dilution) using automated blasthole sampling, rigorous fire assay-to-cyanide-soluble regression, and continuous radar slope monitoring. Individual pit stripping varies, averaging 7.4:1 in North Mackay and 6.2:1 in New Millenium, supported by established geotechnical design criteria and active dewatering in deeper cutbacks like Mackay and Red Dot Phase 3. |
Buffalo Valley
| · | Buffalo Valley contributes 45.33 Mt of Probable Reserves grading 0.46 g/t Au, containing 0.67 Moz of gold. Its lower strip ratio of 3.9:1 helps temper the broader Complex's overall stripping requirements. |
| · | Located approximately 15 miles from the main Marigold operation, Buffalo Valley operates as a standalone satellite facility complete with its own dedicated heap leach facility and separate Overburden Storage Area (OBSA). |
| · | Mining at Buffalo Valley is planned using the same bench heights as at the Marigold Mine (15.2 m) to maintain operational consistency and equipment synergies, enabling the planned transfer of hydraulic shovels and haul trucks between the two operations. |
| · | Mining operations at Buffalo Valley are currently unpermitted, with the schedule assuming permitting activities will be successfully completed to support active production which begins in 2029 for a 5.3-year operational window that slots directly into the middle years of the active mining timeline. |
| 1-3 | |
| SSR Mining Inc. | Marigold Complex | October 9, 2026 |
| S-K 1300 Technical Report Summary | SLR Project No.: 138.020810.00001 |
| · | Structured across three distinct geotechnical domains with inter-ramp angles ranging from 32° to 48° governed by structural bedding orientations, Buffalo Valley's operational success is tightly bound to securing environmental permits ahead of 2029 and adapting proven grade control and blasting methodologies to its unique sedimentary and dike-controlled lithology. |
Integrated Operations
| · | Backed by SSR’s extensive operational experience at the site, the Complex benefits from well-established geotechnical parameters, active site-wide dewatering programs, and sufficient storage capacity within the expanded OBSA to accommodate the higher LOM waste volumes. |
| · | The LOM plan targets an expanded average mining rate of 380,000 tpd (peaking at 505,000 tpd), supporting 15 years of active mining followed by 5 years of processing the heap leach pad inventory for a total 20-year LOM. During full production years, annual mine production averages 138.3 Mtpa (reaching 165.0 Mtpa over the first seven years), yielding a complex-wide LOM strip ratio of 5.3:1 (waste-to-ore) over the 15-year active schedule (which includes the partial start in 2026 and final wind-down in 2040). |
| · | Sustaining higher material movement and increased stripping requires a major capital fleet expansion, including a LeTourneau L-1850 loader in 2026 as replacement, a Liebherr 9600-class shovel in 2027, a second P&H 4100-sized shovel in Q1 2028, and scaling the 300 st haul truck fleet with 19 additional units to reach a peak of 45 trucks. Rather than requiring an isolated capital fleet, Buffalo Valley shares equipment synergy with Marigold, allowing two Komatsu PC7000 hydraulic shovels and 8 to 10 haul trucks to transfer to Buffalo Valley in 2029 for its duration before returning to Marigold. |
| · | The Complex operates with a total established workforce of 540 personnel, distributed across Mine Operations (279), Mine Maintenance (119), Process & Laboratory (61), General & Administration (51), and Technical Services (30). Success over the 20-year LOM relies on maintaining disciplined short-term sequencing, executing the 2027–2028 equipment ramp-up smoothly, successfully securing the Buffalo Valley permit ahead of 2029, and managing workforce retention and skills training to support elevated material movement without compromising mechanical availability or slope stability. |
| · | The LOM production schedule is reasonable and will be supported by robust short-term planning, sequencing, and operational discipline to be successful. |
| · | An appropriate mining equipment fleet, maintenance facilities, and workforce are in place, with various options for additions and replacements estimated to meet the LOM production schedule requirements. |
| · | The SLR QP reviewed the assumptions, parameters, and methods used to prepare the Mineral Reserves Statement and is of the opinion that the Mineral Reserves are estimated and prepared in accordance with S-K 1300 standards. |
| 1-4 | |
| SSR Mining Inc. | Marigold Complex | October 9, 2026 |
| S-K 1300 Technical Report Summary | SLR Project No.: 138.020810.00001 |
| 1.1.1.3 | Mineral Processing |
Marigold
| · | The Marigold processing facilities comprise conventional run-of-mine (ROM) cyanide heap leaching, CIC adsorption, electrowinning, and refining circuits (ADR) to produce a final precious metal product. The heap leach pad was originally constructed in 1990 and with ongoing expansions has operated very consistently throughout the years providing an excellent library of operating data. |
| · | The mineralogy of the ore and deportment of the gold along fracture surfaces of the rock rather than in the rock matrix, provides rapid access of leach solutions to the gold particles and relatively fast gold extraction independent of rock size. The SLR QP agrees that the ore is uniquely favorable to ROM heap leaching, which has been employed for the life of the mine. |
| · | Gold recovery is determined from both historical operating performance and from laboratory column and bottle roll leach testing. Gold recovery is consistent and is predicted using a relationship between fire assay and cyanide soluble gold analyses. It is the SLR QP’s opinion that the Marigold operating practices are consistent with industry standards, and the ROM method of operation and the methods of determining gold recovery and reagent consumptions are appropriate for this deposit. |
| · | Average LOM Au recovery at Marigold is 74% based on production records. The ratio of cyanide soluble gold to total gold (AuCN/AuFA) using the 2017 database of assay pairs (i.e., samples that have been assayed using both fire assay and cyanide-soluble gold assay methods) was approximately 0.8 (80%). Using the ratio to determine the actual LOM recovery of 74% results in a factor of 0.92. |
| · | The current model to predict Marigold heap leach recovery is Heap Leach Recovery = (AuCN/AuFA) x 0.92. |
| · | Cumulative gold production from the Marigold leach pad (through April 2026) is equivalent to 72.7% recovery. |
| · | Gold recovery from future ore from Marigold, including stockpile and leach pad inventory, is estimated to be 72.4%, based on a review of historical assay and recovery data, as well as metallurgical test work on future ore. |
| · | Test work has been conducted on a variety of Marigold ore samples, including representative pit samples taken by ore-control geologists, leach pad grab samples from mine production, and various pit blasthole drill cuttings. Bottle roll test work has also been conducted on exploration reverse circulation (RC) drill samples to determine expected gold recovery from deposits that will be mined in the future. |
| · | A large number of column leach tests and bottle roll tests have been performed on the same samples to determine the relationship between their results. Column leach test work continues; however, bottle roll tests can be performed to generate metallurgical data in days rather than the months that are required for column leach tests. |
| · | Permeability testing has been performed on ore samples with varying fines content. The testing simulated compaction under multiple lifts of ore stacked up to 200 m; the current maximum height of the heap leach pads above the liner elevation is 122 m. Overall, the tested blends demonstrated relatively consistent permeability on increasing loads over 50 m and acceptable permeabilities with material blended to a 40% fines to 60% durable ratio. Flow rates for the blends ranged from 178 L/h/m2 to 284 L/h/m2 under no load. Under 122 m effective height loading, flow rates ranged from 34 L/h/m2 up to 188 L/h/m2. All tests resulted in low, but acceptable permeabilities. |
| 1-5 | |
| SSR Mining Inc. | Marigold Complex | October 9, 2026 |
| S-K 1300 Technical Report Summary | SLR Project No.: 138.020810.00001 |
Buffalo Valley
| · | SSR designed Buffalo Valley metallurgical testing programs in 2023, 2024, and 2025 to build on historical information, including new test areas and testing specific lithologies without blending. The 2024 and 2025 programs also targeted lower-grade composites. Finally, the 2025 program expanded lithologic targets to previously untested units at depth, including base limestone and a new sulfidic lithology, VDFX. |
| · | Buffalo Valley mineralization shows a strong crush-size dependence. This dependence is likely due to gold particles being encapsulated by skarns and other silicate minerals, which can only be liberated by grinding. A portion of the gold deportment is also refractory to cyanide. Scanning electron microscope (SEM) analysis shows that arsenopyrite can be a significant host of submicron gold, even in samples with well-oxidized pyrite. In 200-mesh bottle roll tests, almost all tests show more than 80% recovery of the contained gold, with only a few sulfidic-refractory samples. |
| · | The laboratory test recoveries are scaled to the anticipated production size, either 38 mm crushed or 304 mm ROM. Individual test recoveries are plotted to generate crush size versus recovery curves for each lithology. The recoveries are then discounted by 4% to account for heap leach inefficiency and other scale-up effects. The results are used to determine the gold recovery for each material type for resource calculations. |
| 1.1.1.4 | Infrastructure |
Marigold
| · | Marigold is readily accessible via Interstate Highway 80 in northern Nevada and is approximately 5 km south–south-west of Valmy in Humboldt County. The site access road supports two lanes of traffic and consists of hard packed clay and gravel. |
| · | The infrastructure facilities at Marigold include ancillary buildings, offices and support buildings, access roads into the plant site, power distribution, source of fresh water and water distribution, fuel supply, storage and distribution, waste management and communications. The infrastructure facilities are sufficient for supporting the current Marigold operations. |
| · | The power supply for Marigold is provided by NV Energy Inc. via a 120 kV transmission line to site. Site power draw is 5 MW. After exiting the main substation, power is distributed through a 25 kV distribution grid. Power supply is consistent and dependable and is not a limiting factor for current operations. |
| · | Marigold has sufficient groundwater rights and water well capacity to support the ongoing process operations. The water is primarily consumed by retention in the heap leach pad, evaporation, processing operations and dust suppression. |
| · | Marigold has sufficient disposal capacity and non-consumptive water rights to manage dewatering flows that are not consumed for operational needs. The water that is not consumed is returned to the groundwater system through the rapid infiltration basins (RIBs) and considered non-consumptive use. |
| 1-6 | |
| SSR Mining Inc. | Marigold Complex | October 9, 2026 |
| S-K 1300 Technical Report Summary | SLR Project No.: 138.020810.00001 |
| · | It is the SLR QP’s opinion that it is reasonable to rely on the information provided by SSR as outlined above for use in the TRS because the Property has been in operation for a number of years, and SSR employs professionals and other personnel with responsibility in these areas that have a good understanding of the operating requirements for the Property. |
Buffalo Valley
| · | The initial site layout for Buffalo Valley was developed from the Newmont Plan of Operations acquired as part of the purchase of the property. |
| · | The need for a connector road from Marigold to Buffalo Valley was confirmed and fully engineered by WSP during the feasibility study completed by SSR Mining in 2026 (SSR 2026b, the Feasibility Study). |
| · | Given the short initial mine life of Buffalo Valley, SSR decided to use the Marigold truck shop rather than build a new truck shop at Buffalo Valley. No other maintenance facilities are planned at Buffalo Valley. |
| · | Currently, the North Peak substation is fed from the existing Marigold Mine substation, which is supplied by NV Energy. Buffalo Valley will need to construct approximately 14.5 km (9 mi) of 24.9 kV power line from the existing North Peak power line to service the Project site. Line power will be stepped down to 4,160 V, 480 V, and 110 V as required with power primarily distributed at 4,160 V or 480 V to motor control centers serving the respective process areas. |
| · | Three site-area transformers will be required at different locations throughout Buffalo Valley. The anticipated transformer-connected loads are 6.53 MW, and the calculated demand loads are 4.61 MW (including the crushing circuit and pit dewatering pumps). |
| · | The new overhead power line from North Peak to Buffalo Valley will be routed along the new Marigold/Buffalo Valley connector road. |
| 1.1.1.5 | Environment |
Marigold
| · | Specific federal, state, and local (Humboldt County, Nevada) regulatory and permitting requirements apply to Marigold, including the following: |
| o | The Plan of Operations (PoO) permitted via the United States (U.S.) Bureau of Land Management (BLM) |
| o | The Water Pollution Control Permit (WPCP) issued by the Nevada Department of Environmental Protection (NDEP) |
| o | The temporary discharge permit allowing for the discharge of dewatering water to rapid infiltration basins (RIBs) issued by NDEP |
| o | The reclamation permit issued by the Nevada Bureau of Mining Regulation and Reclamation (BMRR) |
| 1-7 | |
| SSR Mining Inc. | Marigold Complex | October 9, 2026 |
| S-K 1300 Technical Report Summary | SLR Project No.: 138.020810.00001 |
| · | MMC currently holds and is in compliance with active, valid permits for all current facets of the Marigold mining operation. |
| · | At present, there are no known environmental issues that impact the ability to extract Mineral Resources at the Property. |
| · | All activities associated with Marigold require an approved reclamation plan that includes a Reclamation Cost Estimate (RCE) for all permitted facilities and activities. This was updated and approved by federal and state agencies in 2026. |
| · | MMC is actively engaged with the local communities and stakeholders and there are no outstanding negotiations or social commitments for the operation of the Marigold mine. |
| · | The SLR QP’s opinion is that it is reasonable to rely on the information provided by SSR as outlined above for use in the TRS because significant environmental and social analyses have been conducted for the Property over an extended period, the Property has been in operation for a number of years, and SSR employs professionals and other personnel with responsibility in these areas that have a good understanding of the permitting, regulatory, and environmental requirements for the Property. |
Buffalo Valley
| · | Specific federal, state, and local (Humboldt County and Lander County, Nevada) regulatory and permitting requirements apply to Buffalo Valley, including the following: |
| o | The exploration PoO permitted via the U.S. BLM (active) |
| o | PoO for the Buffalo Valley mining operation permitted via the BLM (required) |
| o | The WPCP issued by the NDEP (required) |
| o | The temporary discharge permit allowing for the discharge of dewatering water to RIBs issued by NDEP (required) |
| o | The reclamation permit issued by the BMRR (required) |
| · | MMC currently holds and is in compliance with active, valid permits for all current facets of the exploration operation. |
| · | At present, there are no known environmental issues that impact the ability to extract Mineral Resources at the Property. |
| · | Exploration activities associated with Buffalo Valley require an approved reclamation plan, including a Reclamation Cost Estimate (RCE) for all permitted facilities and activities. This was updated and approved by federal and state agencies in 2026. |
| · | The Buffalo Valley mining operation will require an RCE prior to commencing mining |
| · | MMC is actively engaged with the local communities and stakeholders and there are no outstanding negotiations or social commitments for the operation of the mine. |
| · | The SLR QP’s opinion is that it is reasonable to rely on the information provided by SSR as outlined above for use in the TRS because significant environmental and social analyses have been conducted for the Property over an extended period, the Property has been in operation for a number of years, and SSR employs professionals and other personnel with responsibility in these areas that have a good understanding of the permitting, regulatory, and environmental requirements for the Property. |
| 1-8 | |
| SSR Mining Inc. | Marigold Complex | October 9, 2026 |
| S-K 1300 Technical Report Summary | SLR Project No.: 138.020810.00001 |
| 1.1.1.6 | Capital and Operating Costs |
| · | SSR’s forecasted capital and operating costs estimates related to the development of Mineral Reserves are derived from annual budgets and historical actuals over the long life of the current operation. These estimates were classified by SSR according to the American Association of Cost Engineers (AACE) classifications as Class 1 with an accuracy range of -3% to -10% to +3% to +15%. |
| · | Future growth capital costs are forecast to be $542 million, sustaining capital is forecast to be $669 million, and reclamation costs are forecast to be $175 million for the life of mine, for a total life of mine capital costs of $1,385 million. |
| · | Construction is ongoing for the growth capital projects, including the expansion of the mine fleet and leach pads, and the development of Buffalo Valley. Costs prior to May 1, 2026, are considered sunk. |
| 1.1.2 | Recommendations |
SLR offers the following recommendations by area.
| 1.1.2.1 | Geology and Mineral Resources |
The SLR QP offers the following recommendations regarding advancement of the Property and improvement of the Resource model.
| 1 | SSR has proposed a two-year exploration drilling (2027 and 2028) program with a total budget of US$10,000,000 to advance development of exploration target areas in Marigold Mine and Buffalo Valley. The objective of the exploration program will be to target potential gold-bearing structures to expand the mineralization footprint and convert the current Resource to Reserve. The SLR QP agrees with the objectives and overall scope of this exploration program. |
| 2 | Conduct an additional infill drilling of 10,000 m drilling at MMC every year, where there are opportunities to increase orebody knowledge and confidence of Mineral Resource estimates. |
| 3 | Continue pit mapping and use the data to refine structural and redox models. |
| 4 | Continue to carry out preg-rob/LECO assays along the oxide-sulfide boundaries. |
| 1.1.2.2 | Mining and Mineral Reserves |
| 1 | Continuously optimize haulage profiles and pit sequencing across the Complex, prioritizing lower-strip-ratio phases and targeted interior pit options, to smooth annual ore production profiles, reduce operational volatility, and mitigate reliance on excessive fleet expansion while providing an operational buffer against potential permitting delays at Buffalo Valley. |
| 2 | Advance dewatering, depressurization programs, and pore pressure monitoring ahead of active mining fronts in deeper Marigold pits like Mackay and Red Dot Phase 3 to maintain required slope stability factors of safety. |
| 3 | Advance geotechnical studies, ongoing groundwater monitoring, and structural modeling at Buffalo Valley, specifically addressing pitward-dipping bedding in domains 1 through 3 and high-plasticity clay horizons in the overburden, to ensure stable slope performance. |
| 1-9 | |
| SSR Mining Inc. | Marigold Complex | October 9, 2026 |
| S-K 1300 Technical Report Summary | SLR Project No.: 138.020810.00001 |
| 4 | Maintain rigorous grade control procedures, blasthole sampling, and fire-assay-to-cyanide-soluble regressions across active Marigold areas, while establishing equivalent protocols for Buffalo Valley prior to production. |
| 5 | Execute the planned 2026–2028 fleet expansion and capital additions on schedule (including the LeTourneau L-1850 loader, Liebherr 9600 shovel, second P&H 4100 shovel, and additional 300 short ton (st) haul trucks) to support the increased LOM mining rate and inter-pit equipment transfers. |
| 6 | Prioritize equipment maintenance, asset reliability, and proactive workforce retention to manage heavy utilization rates, aging baseline assets, and the dynamic rotation of the shovel and truck fleet between Marigold and Buffalo Valley. |
| 1.1.2.3 | Mineral Processing |
| 1 | Conduct regular assessments of the AuCN/AuFA ratio using updated exploration and blast hole data. |
| 2 | Continue to conduct column and bottle roll metallurgical testing on heap leach feed composites to determine maximum possible gold recovery. |
| 3 | Conduct metallurgical test work on any future ore sources to develop a geometallurgical model including material properties and metallurgical parameters. |
| 4 | Complete further studies and assessment of heap leach recoverable gold inventory. |
| 5 | Complete targeted technical and metallurgical studies on durable ore materials to better understand their physical characteristics and leach kinetics, ensuring stacking performance, solution percolation, and gold recovery reconcile closely with production forecasts. |
| 1.1.2.4 | Infrastructure |
| 1 | Continue to maintain the infrastructure facilities in good working order to ensure that critical services such as power and water management, pumping and storage facilities are fully available for potential upset conditions. |
| 2 | Ensure the storage volume available in the process ponds is regularly evaluated and increased when required to maintain regulatory compliance and manage risks associated with increasing water inventory due to growth of the heap and barren solution pumping capacity. |
| 3 | Ensure that consumptive water rights holdings are periodically re-evaluated relative to the potential growth in site water demands. |
| 4 | Confirm HLF configuration and remaining capacity, including reconciliation of the current HLF footprint, stack geometry, ore inventory, approved development limits, and remaining stacking capacity with the LOM plan, and documentation of the relationship between available HLF capacity and the Mineral Reserve production schedule. |
| 5 | Review, and update where appropriate, SSR's governance policies related to the HLF, including maintaining appropriate Engineer of Record (EOR) oversight, defining site ownership and technical responsibilities, implementing management of change (MOC) procedures, conducting periodic independent reviews, and incorporating risk assessments into facility management and decision-making. |
| 1-10 | |
| SSR Mining Inc. | Marigold Complex | October 9, 2026 |
| S-K 1300 Technical Report Summary | SLR Project No.: 138.020810.00001 |
| 6 | Expand the current Operation, Maintenance, and Surveillance (OMS) framework to include additional HLF-specific requirements, including inspection and maintenance requirements, performance monitoring, including continuous survey slope stability monitoring, record keeping, escalation procedures, and development of risk-based Trigger Action Response Plans (TARPs) for key performance indicators such as slope performance, seepage, drainage, pond freeboard, and extreme weather events. |
| 7 | Develop a Design Basis Report (DBR) document for the HLF, including consolidation of key design criteria, design assumptions, liner configurations, stack geometry limitations, pond containment requirements, and evaluation of the impacts of the current and planned HLF configuration on facility performance (e.g., stability, drainage, seepage, solution management, and water balance). |
| 8 | Continue to perform design verification and performance confirmation, including verification that current operating conditions and ore characteristics remain consistent with the assumptions used in the original design, and evaluating the implications of any material changes on HLF performance. |
| 9 | Evaluate options for additional heap leach facilities to allow further optimization of haulage networks. |
| 10 | Evaluate water balance and capacity management, including maintaining a current site-wide HLF water balance model that incorporates active and planned leach areas, solution inventories, pond capacities, design storm events, evaporation, draindown, operational freeboard, and closure assumptions. The model should support operating decisions, capacity evaluations, emergency planning, and future expansion studies. |
| 1.1.2.5 | Environment |
| 1 | Progress the environmental permitting process for Buffalo Valley to ensure approvals are secured ahead of its scheduled 2029 operational entry, utilizing flexible Marigold internal sequencing as a direct operational buffer against potential permitting delays. |
| 1.1.2.6 | Capital and Operating Costs |
SLR has no recommendations related to capital and operating costs.
| 1.2 | Economic Analysis |
An after-tax Cash Flow Projection has been generated from the Life of Mine production schedule and capital and operating cost estimates and is summarized in Table 1-1. A summary of the key criteria is provided below. The complete cash flow is presented in Section 27.0 Appendix.
| 1.2.1 | Economic Criteria |
| 1.2.1.1 | Revenue |
| · | Approximately 58,000 tonnes ore per day stacked (approximately 21 Mt per year) at an average stacked grade of 0.44 g/t Au, for 4.26 Moz contained stacked. |
| · | LOM stacked ore recovery averages 72.0%, resulting in 3.06 Moz recoverable stacked during mining (May 1, 2026, through 2040) |
| 1-11 | |
| SSR Mining Inc. | Marigold Complex | October 9, 2026 |
| S-K 1300 Technical Report Summary | SLR Project No.: 138.020810.00001 |
| · | LOM total of 3.34 Moz Au produced at an average of 196 koz per year during stacking. A total of 392 koz Au are produced during the final five-year rinsing period after mining ceases. Approximately 272 koz Au are recovered from work-in-progress inventory over the LOM. |
| · | Metal price: US$3,948 per ounce gold (LOM realized), US$3,710 per ounce gold long term price (2031+). |
| · | Gold at refinery 99.97% payable. |
| · | Net Smelter Return includes doré refining, transport, and insurance costs. |
| · | Revenue is recognized at the time of gold production. |
| 1.2.1.2 | Costs |
| · | Mine life: 20 years, including 2026 (fifteen years of mining and five years of heap leach pad rinsing). |
| · | Life of Mine production plan is summarized in Table 13-6. |
| · | LOM growth capital totals $542.2 million. |
| · | LOM sustaining capital totals $668.6 million. |
| · | Final reclamation costs total $174.6 million. |
| · | Average operating cost, including royalties and offsite costs, over the mine life is $20.27 per tonne stacked. |
| 1.2.1.2.1 | Taxation and Royalties |
Marigold is subject to Nevada Net Proceeds of Minerals Tax, Nevada property and sales taxes, and U.S. federal income tax. The economic analysis calculates these taxes in accordance with legislation enacted as of January 1, 2022. Property and sales taxes are accounted for in the operating costs of the mine.
Nevada Gross Proceeds Tax
In 2021, the State of Nevada enacted Assembly Bill 495, effective July 1, 2021, which is an annual excise tax on gold and silver revenue. Under the bill, the tax rates vary based on the taxpayer’s Nevada gross revenue. A 0.75% rate is imposed on Nevada gross revenue of more than $20 million but not more than $150 million in a taxable year (defined as the calendar year). A rate of 1.10% applies to Nevada gross revenue exceeding $150 million in any tax year. The LOM average rate for Marigold Mining Complex during stacking is approximately 1.0% and averages $7.9 million per year over the fifteen years of mine operation.
Nevada Net Proceeds Tax
The State of Nevada imposes a 5% net proceeds tax on the value of all minerals extracted in the State. This tax is calculated and paid based on a prescribed net income formula applied only to income and expenses from mining, disallowing deductions for exploration and related-party financing costs. This tax is a deductible expense for U.S. federal income tax calculations and averages $17.8 million per year over the fifteen years of mine operation.
| 1-12 | |
| SSR Mining Inc. | Marigold Complex | October 9, 2026 |
| S-K 1300 Technical Report Summary | SLR Project No.: 138.020810.00001 |
US Federal Income Tax
Federal income tax is determined under regulations that came into effect on January 1, 2022. Under these regulations, which removed alternative minimum tax, the mine is subject to a federal income tax rate of 21%. SLR utilized Unit of Production depreciation, depletion allowances, and Net Operating Losses (NOL) as deductions. Total U.S. federal tax payable averages $23.1 million per year over the fifteen years of mine operation.
Royalties
Marigold is subject to a variety of NSR royalty payments, payable to various parties under the terms of the leases, as described in Section 3. The annual average NSR royalty payment is about 6.9% of gross revenue and averages $52.3 million per year over the fifteen years of mine operation. Net Smelter Return (NSR) royalty payments for the Buffalo Valley deposit are fixed at 3.5% of the value of production net of off-site refining costs.
| 1.2.2 | Cash Flow Analysis |
Considering the Complex on a stand-alone basis, the undiscounted pre-tax cash flow totals $5,747 million over the mine life. The after-tax Net Present Value (NPV) at a 5% discount rate (midpoint with May 1, 2026, as time zero) is $3,334 million, as shown in Table 1-1.
| Table 1-1: | After-Tax Cash Flow Summary |
| Description | LOM |
| Realized Market Prices | |
| Au ($/oz) – Average | $3,948 |
| Payable Metal | |
| Au (koz) | 3,335 |
| Cash Flow Summary | US$ million |
| Total Gross Revenue | 13,166 |
| Mining and Maintenance Cost | (3,741) |
| Process Cost | (804) |
| G & A Cost | (451) |
| Refining/Freight | (5) |
| Mining Royalties | (903) |
| NGPT1 | (131) |
| Total Operating Costs | (6,034) |
| Operating Margin (EBITDA) | 7,132 |
| Cash Taxes Payable | (834) |
| Working Capital2 | 0 |
| Operating Cash Flow | 6,298 |
| Development (Growth) Capital | (542) |
| 1-13 | |
| SSR Mining Inc. | Marigold Complex | October 9, 2026 |
| S-K 1300 Technical Report Summary | SLR Project No.: 138.020810.00001 |
| Description | LOM |
| Sustaining Capital | (669) |
| Total Closure/Reclamation Capital | (175) |
| Pre-tax Free Cash Flow | 5,747 |
| Pre-tax NPV @ 5% | 3,878 |
| After-tax Free Cash Flow | 4,913 |
| After-tax NPV @ 5% | 3,334 |
Notes: 1. Nevada Gross Proceeds Tax 2. All working capital adjustments net to zero at end of mine life.
| |
The World Gold Council Adjusted Operating Cost (AOC) is $1,809/oz Au. The mine life capital unit cost, including sustaining and closure/reclamation, is $253/oz, for an All in Sustaining Cost (AISC) of $2,062/oz Au. The average annual gold production during operation, excluding rinsing phase, is 196 koz per year over the fifteen year mine life and 78 koz per year during the five-year rinsing phase.
| 1.2.3 | Sensitivity Analysis |
Project risks can be identified in both economic and non-economic terms. Key economic risks were examined by running cash flow sensitivities:
| · | Head grade |
| · | Metallurgical recovery |
| · | Gold price |
| · | Operating costs |
| · | Capital costs |
After-tax IRR sensitivity over the base case has been calculated for -20% to +20% variations for head grade, recovery, and gold price and operating and capital costs. The Project is most sensitive to changes in head grade, metallurgical recovery, and metal price (usually with same magnitude of impact) followed by operating cost and finally capital costs.
Economics for the operating Marigold gold mine complex are robust with respect to price, head grade, recovery, capital, and operating costs. The operations benefit from a long history of experience with mining heap leach gold recovery operations, and higher gold prices than originally planned.
| 1.3 | Technical Summary |
| 1.3.1 | Property Description |
Marigold is located in southeastern Humboldt County along the Interstate Highway 80 corridor in the northern foothills of the Battle Mountain Range, Nevada, U.S. Activities at the Property are centered at approximately 40°45′ N Latitude and 117°8′ W Longitude.
| 1-14 | |
| SSR Mining Inc. | Marigold Complex | October 9, 2026 |
| S-K 1300 Technical Report Summary | SLR Project No.: 138.020810.00001 |
The Property is situated approximately five kilometers south–southwest of the town of Valmy, Nevada, at Exit 216 off Interstate Highway 80. Other nearby municipalities include Winnemucca and Battle Mountain, Nevada, which lie approximately 58 km to the northwest and 24 km to the southeast of the Property, respectively.
| 1.3.2 | Land Tenure |
The Marigold Complex includes two main land packages, the Marigold Land Package and the Sterling Land Package, collectively, the Property or project areas.
The Marigold Land Package encompasses approximately 10,440 hectares (ha), including the properties within the Marigold Mine Plan of Operations (PoO). The Sterling Land Package (9,169 ha) includes properties associated with the Trenton Canyon Mine and Buffalo Valley Mine.
Land and mineral ownership within the project areas are within the corridor initially governed by the Pacific Railroad Act of 1862, and, as such, these areas generally have a “checkerboard” ownership pattern. Mineral claims in Nevada are managed federally by the BLM. SSR holds a 100% interest in the Property through its wholly-owned subsidiary, MMC. Surface and mineral rights at the Property comprise the following: real property owned by MMC; unpatented mining claims owned by MMC; and leasehold rights held by MMC with respect to unpatented mining claims, mill site claims, and certain surface lands.
Some of the leases require MMC to make certain net smelter return (NSR) royalty payments to the lessors and comply with other obligations, including completing certain work commitments or paying taxes levied on the underlying properties. The NSR royalty payments are based on the specific gold-extraction areas and are payable when the corresponding gold ounces are extracted, produced, and sold. The NSR royalty payments vary between 0% and 10.0% of the value of gold production, net of off-site refining costs, which equates to an annual average ranging from 3.3% to 10.0% and a weighted average of 6.9% over the life-of-mine (LOM).
| 1.3.3 | History |
The first recorded gold production from the Property near Valmy, Nevada, occurred in 1938 when the Marigold Mining Company, owned by Frank Horton, operated an underground mine which came to be known as Marigold. The Horton family processed approximately 9,000 t of ore averaging about 6.85 g/t Au before World War II halted production. In 1943, Mr. Horton’s estate sold its interest in the Property and claims. Several unsuccessful attempts were made to open and operate the mine before exploration activities began again in 1968.
From 1968 through 1985, several companies conducted exploration programs in the Marigold area and completed a total of 126 exploratory drill holes. Records document the activities of Homestake (1968), St. Joe (1979), Decker Exploration (1979), Placer Amex (1979–1980), True North, Marigold Development Company (MDC) (1981–1983), Welcome North (1984), and Nevada North Resources (USA) Inc. (1985–1986). Other groups that conducted work in the area include Newmont, Kerr-McGee, SFP Minerals Corporation, Cordex/Rayrock Mines, and Vek/Andrus Associates (partnership between Vic Kral, Ralph Roberts, Bob Reeve, and Bill Andrus composed of Vek Associates and Andrus Resources Corporation).
The operating partner Cordex, an exploration syndicate composed of Dome Exploration (U.S.) Ltd., Lacana Gold Inc. (Lacana) and Rayrock Mines, leased the Vek/Andrus Associates claim block in September 1985 and began a drilling program in November 1985. Drill holes NM-3 and NM-4 intersected 21.3 m of 2.40 g/t Au and 25.9 m of 7.54 g/t Au, respectively. These were the discovery holes for the 8 South (8S) orebody.
| 1-15 | |
| SSR Mining Inc. | Marigold Complex | October 9, 2026 |
| S-K 1300 Technical Report Summary | SLR Project No.: 138.020810.00001 |
Following further drilling in the 8S deposit in the spring of 1986, a joint venture was formed between SFP Minerals and the Cordex group, which consolidated some of the land holdings over the Marigold area.
In late-1986, the Cordex group leased other claims, including the historical Marigold mine, Mackay (Top Zone, East Hill, and Red Rock) area from various claim holders.
In March 1988, Rayrock Mines (operating company for Cordex) made a production decision on the 8S deposit, and, by September 1988, it began stripping on the 8S pit (McGibbon, 2004).
In August 1989, the first gold doré bar was poured at the Marigold mill.
In March 1992, Rayrock Mines purchased a two-thirds ownership interest in the Property, and Homestake Mining Company (Homestake), which had taken Lacana’s interest through previous corporate mergers, held the remaining one third ownership interest in the Property.
In 1994, mining of the 8S deposit was completed, and the Marigold mill was no longer used to process ore. At this point, Marigold became a ROM heap leach operation.
In March 1999, Glamis Gold Ltd. (Glamis Gold) purchased all the assets of Rayrock Mines, resulting in Glamis Gold holding a two thirds ownership interest in Marigold, and Homestake continuing to hold a one third ownership interest. By January 2001, a total of one million ounces of gold had been recovered from the Property.
In 2006, Glamis Gold merged with Goldcorp Inc. (Goldcorp), resulting in a Goldcorp subsidiary holding a two-thirds ownership interest in Marigold and being the operator. Homestake, which had been acquired by Barrick Gold Corporation (Barrick) in 2001, continued to hold the remaining one-third ownership interest. In 2007, discovery holes were drilled in the Red Dot deposit.
By mid-2009, two million ounces of gold had been recovered from Marigold.
On April 4, 2014, SSR (formerly Silver Standard Resources Inc.) completed the acquisition of Marigold from subsidiaries of Goldcorp and Barrick.
In August 2015, Marigold mine acquired 2,844 ha of adjacent land from Newmont. This land included previously mined areas known as the Mud pit, NW pit, and the Valmy pits. Exploration drilling in the area had been completed by a combination of companies including Hecla Mining Company (Hecla), SFP Minerals, and Newmont.
In June 2019, SSR acquired the Trenton Canyon and Buffalo Valley properties from Newmont Goldcorp Corporation (Newmont). The Trenton Canyon target is located approximately four kilometers south of New Millenium and the Buffalo Valley target is located approximately 10 km southwest of New Millenium. Both properties are included in an 8,900 ha parcel that is contiguous to the south boundary of the Marigold property.
| 1.3.4 | Geological Setting, Mineralization, and Deposit |
Marigold is located in the Battle Mountain district of north-central Nevada within the Basin and Range physiographic province bounded by Sierra Nevada to the west and the Colorado Plateau to the east. Paleozoic basement rocks of north-central to north-eastern Nevada generally comprise four distinct tectonostratigraphic assemblages: the eastern carbonate assemblage; the slope or transitional assemblage; the western siliceous and volcanic assemblage; and the overlap assemblage (Roberts, 1964). These rocks record a complex history of compressional and extensional tectonics and magmatism affecting the western margin of North America from the early Paleozoic through present. The Battle Mountain district hosts numerous mineral occurrences, including porphyry copper–gold, porphyry copper–molybdenum, skarn, placer gold, distal disseminated silver-gold, and Carlin-type gold systems.
| 1-16 | |
| SSR Mining Inc. | Marigold Complex | October 9, 2026 |
| S-K 1300 Technical Report Summary | SLR Project No.: 138.020810.00001 |
The gold deposits at Marigold are best characterized as Carlin-type deposits and cumulatively define a north-trending alignment of gold mineralized rock more than eight kilometers long. Gold mineralizing fluids were primarily controlled by fault structure and lithology, with tertiary influence by fold geometry. Within the Valmy Formation, higher gold grades are observed in the hinge zones of open folds that trend west-northwest and plunge gently. When viewed down plunge, the undulation of these folds is mimicked by gold mineralized horizons. The deposition of gold was restricted to fault zones and quartzite dominant horizons within the Valmy Formation and high permeability units within the Antler sequence.
The Buffalo Valley gold deposit is a distal disseminated silver-gold deposit and formed along a southeast trending zone of felsic porphyry dikes and faults. Gold occurs in arsenian iron sulfide overgrowths on pyrite in sheeted quartz+sericite+pyrite (QSP) veinlets within the central granodiorite and dacite porphyry dikes, subparallel to dike margins in the country rock, and within faults (e.g., the Front fault). Outboard of the intrusions, gold mineralization is stratiform in receptive horizons of Havallah sequence metasedimentary rocks.
Gold mineralization at Trenton Canyon is best described as a Carlin-type deposit and primarily hosted in a network of transtensional faults locally intruded by Eocene dikes and sills. Hydrothermal and/or phreatomagmatic breccias within these structures typically contain increased concentrations of gold. Gold mineralization is well confined to structures, although a small (several meter) halo of lower grade, more disseminated mineralization may be present. Quartz veining, illite, iron oxides, and iron hydroxides (goethite) are the primary indicators of gold mineralization where oxidized.
| 1.3.5 | Exploration |
Since acquiring the Property in April 2014, SSR has conducted several surface exploration programs including soil sampling, geophysics, and in-fill/delineation drilling.
Reverse Circulation (RC) and Core (Diamond Drilling-DD) drilling on the Property is the principal method of exploration and delineation of gold mineralization after initial targeting using soil sampling and geophysical surveys. Drilling can generally be conducted year-round on the Property.
As of the effective date of this TRS, SSR and its predecessor companies have completed over 2.6 million meters of drilling in approximately 13,000 drillholes across the Marigold, Buffalo Valley, and Trenton Canyon areas.
Since 2022, exploration at the Property has focused on the following:
| · | Exploration drilling to expand Mineral Resources and Mineral Reserves through systematic step out drilling. |
| · | Infill drilling to increase the confidence of Mineral Resource estimates, specifically targeting areas with widely spaced drilling (approximately 35m to 50 m) and around drill holes drilled prior to 2006 with missing assays. |
| · | Drilling to confirm the final position of the pit highwall. |
| 1-17 | |
| SSR Mining Inc. | Marigold Complex | October 9, 2026 |
| S-K 1300 Technical Report Summary | SLR Project No.: 138.020810.00001 |
| · | Defining mineralization at Trenton Canyon and Buffalo Valley. |
Since the last technical report (SLR 2024), 731 holes have been drilled (663 RC holes and 68 diamond core holes), totaling 157,220 m.
| 1.3.6 | Mineral Resource Estimates |
Mineral Resources have been classified in accordance with the definitions for Mineral Resources in S-K 1300. SLR has reviewed, audited, and accepted the Mineral Resource estimates prepared by SSR and Red Pennant Geoscience Consulting (Red Pennant) for Marigold and Buffalo Valley, respectively. The Mineral Resource estimates are based on block model values developed from assays on the mineralized properties. The Marigold Mine and Buffalo Valley Mineral Resources as of May 1, 2026, are summarized in Table 1-2.
The Mineral Resource estimates were completed using Seequent’s Leapfrog Geo (Leapfrog Geo) software for Marigold and Buffalo Valley.
Estimates were validated using standard industry techniques, including statistical comparisons with composite samples and parallel inverse distance squared (ID2) and nearest neighbor (NN) estimates, swath plots, and visual reviews in cross-section and plan. A visual review comparing blocks to drill holes was completed after the block modeling work was performed to ensure general lithologic and analytical conformance and was peer reviewed prior to finalization.
| 1-18 | |
| SSR Mining Inc. | Marigold Complex | October 9, 2026 |
| S-K 1300 Technical Report Summary | SLR Project No.: 138.020810.00001 |
| Table 1-2: | Summary of Marigold Mine and Buffalo Valley Mineral Resources |
| Deposit | Measured
Mineral Resources |
Indicated
Mineral Resources |
Measured
+ Indicated Mineral Resources |
Inferred Mineral Resources | Cut-off
Grade (g/t Au) | ||||||||
| Amount (Mt) |
Grade (g/t Au) |
Rec. (%) |
Amount (Mt) |
Grade (g/t Au) |
Rec. (%) |
Amount (Mt) |
Grade (g/t Au) |
Rec. (%) |
Amount (Mt) |
Grade (g/t Au) |
Rec. (%) | ||
| Marigold | 0.0 | 0.000 | 0.0 | 125.0 | 0.39 | 74.0% | 125.0 | 0.39 | 74.0% | 18.1 | 0.30 | 71.6% | 0.069 |
| Buffalo Valley | 0.0 | 0.000 | 0.0 | 5.6 | 0.53 | 59.1% | 5.6 | 0.53 | 59.1% | 11.2 | 0.31 | 64.4% | 0.10 to 0.32 |
| Total | 0.0 | 0.000 | 0.0 | 130.6 | 0.40 | 73.3% | 130.6 | 0.40 | 73.3% | 29.3 | 0.31 | 68.8% | |
Notes: 1. The Mineral Resource estimate was prepared in accordance with S-K 1300. 2. The effective date of Mineral Resources at Marigold is May 1, 2026, and the effective date of Mineral Resources at Buffalo Valley is May 1, 2026. 3. Marigold Mine is based on an optimized pit shell at a cut-off grade of 0.069 g/t payable gold (gold assay factored for recovery, royalty, and net proceeds). Buffalo Valley is based on a cut-off grade of 0.10 g/t to 0.32 g/t contained gold, depending on material type. 4. Marigold metallurgical recoveries vary with gold grade. Buffalo Valley metallurgical recoveries vary with gold grade and lithology. 5. For Marigold, bulk densities (in t/m3) were assigned by lithologies: alluvium = 2.10, Havallah = 2.48, Valmy/Antler = 2.4076+(0.0001*DEPTH), and Valmy = 2.64, below 533 m. For Buffalo Valley, bulk densities (in t/m3) were assigned by lithology, ranging from a low of 2.095 (Overburden) to a high of 2.725 (Basalt). 6. The Mineral Resources estimate is reported below the as-mined surface as of May 1, 2026, for Marigold, and below the as-mined surface as of May 1, 2026, for Buffalo Valley. 7. The point of reference for Mineral Resources is the entry to the carbon columns in the processing facility. 8. Mineral Resources are reported exclusive of Mineral Reserves. 9. SSR has 100% ownership of the Marigold Complex. 10. Gold grades are given in grams per metric tonne (g/t). 11. Totals may vary due to rounding.
| |||||||||||||
| 1-19 | |
| SSR Mining Inc. | Marigold Complex | October 9, 2026 |
| S-K 1300 Technical Report Summary | SLR Project No.: 138.020810.00001 |
| 1.3.7 | Mineral Reserve Estimates |
Mineral Reserves in this TRS are derived from the current Mineral Resources. The Mineral Reserves are reported as contained gold and are based on open pit mining from Marigold and Buffalo Valley Mines. The Proven and Probable Mineral Reserves for Marigold are estimated as of May 1, 2026, and summarized in Table 1-3.
| Table 1-3: | Summary of Marigold Mineral Reserves Estimate as of May 1, 2026 |
| Proven | Probable | Total | Cut-off Grade (g/t) |
Metallurgical Recovery (%) | |||||
| Tonnage (Mt) |
Au
Grade (g/t) |
Tonnage (Mt) |
Au
Grade (g/t) |
Tonnage (Mt) |
Au
Grade (g/t) |
Contained
Gold (Moz) | |||
| Marigold | - | - | 240.44 | 0.46 | 240.44 | 0.46 | 3.52 | 0.069 | 73.5% |
| Buffalo Valley | - | - | 45.33 | 0.46 | 45.33 | 0.46 | 0.67 | 0.069˟ | 65.9% |
| Stockpile | - | - | 11.96 | 0.17 | 11.96 | 0.17 | 0.06 | 0.069 | 56.3% |
| Leach Pad Inventory | - | - | 61.01 | 0.19 | 61.01 | 0.19 | 0.37 | - | 65.2% |
| Total | - | - | 358.74 | 0.40 | 358.74 | 0.40 | 4.63 | 0.069 | 71.5% |
Notes: 1. The Mineral Reserve estimate was prepared in accordance with S-K 1300 definitions. 2. The Marigold Mine Mineral Reserve estimate is based on a metal price assumption of $2,200/oz gold and is reported at a cut-off grade of 0.069 g/t payable Au (Au assay factored for recovery, royalty, and net proceeds). 3. ˟The Buffalo Valley Mineral Reserve estimate assumes ROM heap leach processing and a gold price of $2,200/oz. Cut-off grades range from 0.069 to 1.767 g/t payable Au, and metallurgical recoveries range from 3.1% to 79.2%, both varying by lithology/metallurgical domain. 4. No mining dilution is applied to the grade of the Mineral Reserves. Dilution intrinsic to the Mineral Reserves estimate is considered sufficient to represent the mining selectivity considered. 5. Bulk densities (in t/m3) were assigned by lithologies: alluvium = 2.10, Havallah = 2.48, Valmy/Antler = 2.4076+(0.0001*DEPTH), and Valmy = 2.64. For Buffalo Valley, bulk densities (in t/m3) were assigned by lithology ranging from a low of 2.426 (Overburden) to a high of 2.737 (Basalt) with a weighted average of 2.63. 6. The Property is 100% owned by SSR through its subsidiary MMC. 7. All ounces reported represent troy ounces, and g/t represents grams per metric tonne. 8. The point of reference for Mineral Reserves is the entry to the carbon columns in the processing facility. 9. Totals may vary due to rounding. | |||||||||
SLR is not aware of any risk factors associated with, or changes to, any aspects of the modifying factors such as mining, metallurgical, infrastructure, permitting, or other relevant factors that could materially affect the Mineral Reserve estimate.
| 1.3.8 | Mining Methods |
Marigold Mine is mined using conventional surface mining methods. The Marigold Mine uses large 300 st mining trucks, and some areas of the pit require long hauls to the leach pads. The surface operations include:
| · | Clearing and grubbing |
| · | Overburden removal |
| · | Drilling and blasting |
| · | Loading and haulage |
| 1-20 | |
| SSR Mining Inc. | Marigold Complex | October 9, 2026 |
| S-K 1300 Technical Report Summary | SLR Project No.: 138.020810.00001 |
The Mineral Reserve is based on the ongoing annual average ore production from the Mackay (includes the Red Dot area), Valmy, DG80, North Mackay, and New Millenium areas, as well as Buffalo Valley – a satellite pit with a planned commencement in 2029 -delivering an average of approximately 200 koz recovered over the 15 years of active mining.
Mining and processing operations are scheduled 24 hours per day, and the mine production is scheduled to directly feed the leach pads.
The current LOM plan for the Marigold Mine and Buffalo Valley Mine provides 20 years of operational life, including 15 years of active mining followed by an additional five years of processing the heap leach pad inventory. The average stripping ratio from the pits, excluding the stockpile ore, is 5.3 waste units to 1 unit of ore (5.3:1 stripping ratio).
There are 33 mining pits/phases in the four mining areas of the Marigold Mine with varying dimensions, with a maximum depth of approximately 460 m attained in the Red Dot pit area. In addition, the Buffalo Valley area will comprise two additional phases for Buffalo Valley and Ore Hills.
Primary production for all mine pits includes drilling 22.2 cm diameter blast holes. A production blast hole of 16.7 m depth is drilled. Burden and spacing vary depending on the material being drilled. The holes are filled with explosives and blasted. A combination of hydraulic excavators and electric shovels load the broken material into 300 st-payload mining trucks for transport from the pit to the overburden storage areas (OBSAs) and leach pads.
The major pieces of pit equipment include electric shovels, hydraulic excavators, front end loaders, haul trucks, drills, bulldozers, and graders. Extensive maintenance facilities are available at the mine site to service mine equipment.
Marigold headcount is 540 persons, which includes personnel in mine operations, mine maintenance, geology, process and laboratory, and general and administration. For the 2027 to 2040 LOM period, the workforce is projected to increase to a total of 686 personnel, comprising 578 employees and 109 contractors.
| 1.3.9 | Processing and Recovery Methods |
Marigold
The Marigold processing facilities combine industry standard ROM cyanide heap leaching, recovery of gold from the leach solution using carbon adsorption, desorption, electrowinning, and refining circuits (ADR) to produce a final precious metal product.
The heap leach pad was originally constructed in 1990 and has since expanded as required, with ongoing expansion of solution processing facilities to match production rate and leach area. Approximately 427 hectares of heap leach pads are divided into 27 cells, along with six pregnant (gold-bearing) solution ponds and two barren solution ponds. There are 17 cells currently active.
ROM ore is delivered from the mine at a rate of approximately 20 Mt per year to the leach pad by mine haul trucks and stacked in 6 m to 12 m lifts.
Barren leach solution is pumped to the leach pad by two independent barren solution distribution systems. Combined barren solution flow capacity from the two pumping systems is 3,400 m3/h. In 2026, upgrades are underway to increase barren solution pumping capacity to 4,540 m3/h. Drip tubing is used to distribute the barren solution from the main barren solution pipelines to each cell. Solution is applied to the ore at a rate of 4.6 L/h/m2 to 8.6 L/h/m2 using drip emitters, impact sprinklers, wobblers, or drip emitters are used to irrigate the side slopes of the heap.
| 1-21 | |
| SSR Mining Inc. | Marigold Complex | October 9, 2026 |
| S-K 1300 Technical Report Summary | SLR Project No.: 138.020810.00001 |
Pregnant solution from the leach pad is collected in the pregnant solution ponds and pumped to the carbon-in-column (CIC) adsorption plant located on the north side of Barren Pond No. 1 to recover the gold by adsorption. The carbon adsorption circuit consists of seven parallel carbon column trains, each with five columns. Four new trains are being installed in 2026 to match the barren pumping upgrades currently underway.
Loaded carbon from carbon adsorption is transported by a dedicated truck to the nearby carbon processing facility where gold is eluted (re-dissolved) from the carbon in two 2.7 t capacity carbon elution vessels. Gold is eluted from the carbon using the Pressure Zadra process where a hot caustic solution at approximately 140°C is circulated under pressure through the elution column, from bottom to top. The resulting rich gold eluant flows through two parallel 2.8 m3 electrowinning cells to recover the gold. The barren eluant discharging the electrowinning cells is recirculated through heat exchangers to the bottom of the elution vessel to strip more gold. The process continues until the majority of the gold is recovered from the carbon.
The stripped carbon is acid washed with hydrochloric acid. The acidified carbon is then neutralized with water in the same column. The carbon is discharged from the column and transferred to the reactivation kiln. The carbon is reactivated as required by heating in a rotary kiln at 750°C. The reactivated carbon is quenched and screened before being returned to the carbon adsorption circuit to be reloaded with gold.
The plated material (sludge) resulting from electrowinning is collected in a filter press and then retorted for drying and mercury removal. After retorting, the sludge is mixed with flux and smelted in a propane fired furnace for final precious metal recovery.
Buffalo Valley
The design of the Buffalo Valley processing facilities follows the same philosophy as is utilized at Marigold. A multi-cell heap leach pad, designed to accommodate the expected mining rate up to 14 Mtpa, will be truck-stacked either with ROM or crushed ore in 7.5 m to 12.5 m lifts. Cyanide solution will be applied to the surface at a nominal rate of 8 L/h/m2, which will percolate through the ore, dissolving precious metals, before being collected in a drain network at the plastic liner.
Pregnant solution will flow by gravity directly into a pregnant solution tank, then be pumped to three CIC carbon column trains for adsorption. It was determined that three 9,779 m3/h trains, with five 9,779 m3/h columns per train, provide the best balance of maintenance and production flexibility.
Loaded carbon from the carbon adsorption circuit will be transferred to a loaded carbon storage tank, which will then be pumped into a carbon transfer truck and transported to the Marigold elution facility for acid washing, elution, and reactivation.
Barren carbon will be loaded into the carbon transfer truck and returned to the Buffalo Valley process plant. Barren carbon will be pumped from the carbon transfer truck into a barren carbon storage tank before being returned to the adsorption circuit.
Barren process solution will be pumped to the irrigation system from a barren solution concrete vault using vertical turbine pumps. After percolating through the ore, the gold-bearing pregnant leach solution will drain by gravity to a pregnant solution tank, where it will be collected and pumped to the carbon adsorption circuit for metal recovery.
| 1-22 | |
| SSR Mining Inc. | Marigold Complex | October 9, 2026 |
| S-K 1300 Technical Report Summary | SLR Project No.: 138.020810.00001 |
| 1.3.10 | Infrastructure |
Marigold
Marigold is accessible via Interstate Highway 80 in northern Nevada and is approximately 5 km south-southwest of Valmy in Humboldt County. The site access road supports two lanes of traffic and consists of hard packed clay and gravel.
The infrastructure facilities at Marigold include ancillary buildings, offices and support buildings, access roads into the plant site, power distribution, source of fresh water and water distribution, fuel and reagents supply, storage and distribution, waste management and communications.
The power supply for Marigold is provided by NV Energy Inc. via a 120 kV transmission line to site. Site power draw is 5 MW. After exiting the main substation, power is distributed through a 25 kV distribution grid.
Water for Marigold is supplied from three existing groundwater wells located near the access road to the Property and the site’s network of pit dewatering wells. Marigold owns groundwater rights and collectively allows up to 3.134 million m3 of water consumption annually for site operations. Total water consumption by the site has averaged 1.52 million m3 per annum, over the past five years. The water is primarily consumed by retention in the heap leach pad, evaporation, processing operations and dust suppression.
The following buildings and facilities are in the main plant and offices area:
| · | Truck shop and mobile maintenance warehouse |
| · | Carbon elution and regeneration / refinery building |
| · | Heap leach carbon columns |
| · | Wash bay |
| · | Administration building and light vehicle (old) shop |
| · | Assay laboratory |
| · | Metallurgical laboratory |
| · | Health & Safety Building |
| · | Radio Shop |
| · | Motor control center (MCC) |
| · | Solution ponds |
Additional buildings and facilities on site include:
| · | Explosives magazine |
| · | Leach pads and solution ponds |
| · | Liquid cyanide storage tank, truck receiving, and distribution |
| · | Overburden storage areas |
| · | Operations ponds (for supplying dust control and drilling) |
| 1-23 | |
| SSR Mining Inc. | Marigold Complex | October 9, 2026 |
| S-K 1300 Technical Report Summary | SLR Project No.: 138.020810.00001 |
| · | Rapid Infiltration Basins (RIBs) |
| · | Site access building |
| · | Potable water treatment building |
| · | Process line-out building |
| · | Crusher |
| · | Radio shop |
| · | Safety building |
| · | Hose shop and storage |
| · | Tire pad |
| · | Fuel stations |
| · | Welding and fabrication shop |
| · | Section 20 line-out building |
| · | Dispatch/MineCare office and Mine Operations building |
| · | GPS dispatch receiver |
| · | Diesel tanks and fueling station |
Buffalo Valley
The initial site layout for Buffalo Valley was developed from the Newmont Plan of Operations acquired as part of the purchase of the property. The need for a Marigold to Buffalo Valley connector road was confirmed and fully engineered by WSP during the Feasibility Study (SSR 2026b).
SSR conducted trade-off studies to evaluate site warehouse and haul truck maintenance shop locations. Given the short mine life of Buffalo Valley, SSR decided to use the Marigold truck shop rather than build a new truck shop at Buffalo Valley. No other maintenance facilities are planned at Buffalo Valley.
Buffalo Valley will need to construct approximately 14.5 km of 24.9 kV power line from the existing North Peak power line to service the Buffalo Valley site. Line power will be stepped down to 4,160 V, 480 V, and 110 V as required with power primarily distributed at 4,160 V or 480 V to motor control centers serving the respective process areas.
Currently, the North Peak substation is fed from the existing Marigold mine substation, supplied by NV Energy. Three site-area transformers will be required at different locations throughout Buffalo Valley. The anticipated transformer-connected loads are 6.53 MW, and the calculated demand loads are 4.61 MW (including the crushing circuit and pit dewatering pumps). The new overhead power line from North Peak to Buffalo Valley will be routed along the new Marigold/Buffalo Valley connector road.
| 1.3.11 | Market Studies |
The Marigold Mine produces gold and silver contained in doré. Marigold is an active producer and has been for over three decades.
Gold is the principal commodity at the Marigold Mine and is freely traded at prices that are widely known, so that prospects for sale of any production are virtually assured. A gold price of $2,200/oz Au was used for estimation of Mineral Reserves and a long-term price of $3,948/oz Au was used for the economic analysis.
| 1-24 | |
| SSR Mining Inc. | Marigold Complex | October 9, 2026 |
| S-K 1300 Technical Report Summary | SLR Project No.: 138.020810.00001 |
| 1.3.12 | Environmental Studies, Permitting and Plans, Negotiations, or Agreements with Local Individuals or Groups |
Specific federal, state, and local (Humboldt County, Nevada) regulatory and permitting requirements apply to MMC, including the Plan of Operations (PoO) permitted via the United States (U.S.) Bureau of Land Management (BLM); the Water Pollution Control Permit (WPCP) issued by the Nevada Department of Environmental Protection (NDEP); the temporary discharge permit allowing for the discharge of dewatering water to rapid infiltration basins (RIBs) issued by NDEP; and the reclamation permit issued by the Nevada Bureau of Mining Regulation and Reclamation (BMRR).
MMC currently holds active, valid permits for all current facets of the mining operation. MMC is currently in compliance with all permits. At present, there are no known environmental issues that impact the ability to extract Mineral Resources at the Property. All activities associated with MMC require an approved reclamation plan that includes a Reclamation Cost Estimate (RCE) for all permitted facilities and activities. This was updated and approved by federal and state agencies in 2026. MMC is actively engaged with the local communities and stakeholders and there are no outstanding negotiations or social commitments for the operation of the mine.
| 1.3.13 | Capital and Operating Cost Estimates |
SSR’s forecasted capital and operating cost estimates related to the development of Mineral Reserves are derived from annual budgets and historical actuals over the life of the current operation. According to the American Association of Cost Engineers (AACE) classifications, these estimates would be Class 1 with an accuracy range of -3% to -10% to +3% to +15%.
LOM project capital costs, which considers all costs incurred before May 1, 2026, as sunk, are summarized in Table 1-4.
| Table | 1-4: Capital Costs Summary |
| Capital Costs | Total ($ million) |
| Growth CAPEX | 542.2 |
| Subtotal Growth CAPEX | 542.2 |
| Mining Equipment Replacement | 98.1 |
| Equipment/Building Maintenance | 436.4 |
| Administration | 2.8 |
| Processing/Lab | 40.1 |
| Permitting/Geotech | 34.1 |
| Exploration | 57.2 |
| Subtotal Sustaining Capital | 668.6 |
| Reclamation | 174.6 |
| Total Capital Costs | 1,385.4 |
| 1-25 | |
| SSR Mining Inc. | Marigold Complex | October 9, 2026 |
| S-K 1300 Technical Report Summary | SLR Project No.: 138.020810.00001 |
The LOM (from May 1, 2026) operating costs estimate is $16.78/t of stacked ore, as shown in Table 1-5.
| Table 1-5: | Operating Costs Summary |
| Description | Total LOM ($ million)* | $/t stacked* |
| Mining and Maintenance | 3,741 | 12.57 (1.99/t moved) |
| Processing | 804 | 2.70 |
| Site Support | 451 | 1.51 |
| Total | 4,996 | 16.78 |
| *From May 1, 2026 | ||
| 1-26 | |
| SSR Mining Inc. | Marigold Complex | October 9, 2026 |
| S-K 1300 Technical Report Summary | SLR Project No.: 138.020810.00001 |
| 2.0 | Introduction |
SLR International Corporation (SLR) was retained by SSR Mining Inc. (SSR) to prepare an independent Technical Report Summary (TRS) on the Marigold Complex (Marigold or the Property), located in Humboldt and Lander counties, Nevada, USA. The Marigold Complex includes the Marigold Mine (including Mackay, Valmy, and New Millenium) and the Buffalo Valley and Trenton Canyon deposits. SSR holds a 100% interest in the Property through its wholly owned subsidiary, Marigold Mining Company (MMC).
This TRS conforms to United States Securities and Exchange Commission’s (SEC) Modernized Property Disclosure Requirements for Mining Registrants as described in Subpart 229.1300 of Regulation S-K, Disclosure by Registrants Engaged in Mining Operations (S-K 1300) and Item 601 (b)(96) Technical Report Summary.
SSR has a diversified portfolio of operating, development and exploration assets across the Americas, including four operating mines in the USA, Canada, and Argentina. SSR is listed on the NASDAQ Global Select Market (NASDAQ:SSRM) and the Toronto Stock Exchange (TSX:SSRM).
SSR’s 100% owned Marigold Complex is an open pit heap leach gold mine operation, which has been in production since 1989 and has produced over five million ounces of gold. The operation consists of several open pits, overburden storage areas (OBSAs), leach pads, a carbon-in-column (CIC) adsorption facility, and a carbon processing and gold refining facility.
| 2.1 | Site Visits |
SLR qualified persons (QPs) visited the site on June 10 to 12, 2026. During the site visit, the SLR QPs received a project overview by site management with specific activities as follows:
The SLR geology QP toured operational areas and project offices, inspected various parts of the property and infrastructure, inspected the core handling facility, reviewed sampling procedures, and interviewed key personnel involved in the collection, interpretation, and processing of geological data and in the preparation of the Mineral Resource estimates.
The SLR mining QP toured operational areas and project offices, inspected various parts of the mining operations and infrastructure, and interviewed key personnel involved in the operations and in the technical services involved in the preparation of the Mineral Reserve estimates and Life of Mine (LOM) plan.
On behalf of the SLR metallurgy QP, a SLR Principal Metallurgist conducted a site visit of the operational areas and project offices. The site visit tour included the in-operation heap leach pad, the inactive heap leach cells, the barren and pregnant solution ponds, the carbon-in-columns (CIC) system, and the acid wash, elution, and regeneration plant. During the tour, the SLR Principal Metallurgist interviewed the operations superintendent, senior metallurgist, and environmental manager. Based on these conversations, SLR understands that SSR is expanding CIC capacity by adding four CIC trains and upgrading the barren solution booster pumping system, and that SSR is conducting some debottlenecking in the acid wash, elution, and regeneration circuit by installing a separate scrubber in the gold room. More copper has recently been present in the doré. The SLR Principal Metallurgist also met with the chief metallurgist to discuss future column test equipment, planned column testing, and aspects of the heap leach recovery model.
| 2-1 | |
| SSR Mining Inc. | Marigold Complex | October 9, 2026 |
| S-K 1300 Technical Report Summary | SLR Project No.: 138.020810.00001 |
| 2.2 | Sources of Information |
During the preparation of this TRS, discussions were held with personnel from SSR:
| · | Rex Brommecker, SVP Exploration and Geology, SSR |
| · | Jonathan Holden, VP Innovation and Technical Services, SSR |
| · | Matt Taylor, VP Projects, SSR |
| · | Christa Zaharias, P.E., Study Director, SSR |
| · | Karthik Rathnam, Director Resource Geology, SSR |
| · | Stacey Leclerc, Principal Resource Geologist, SSR |
| · | Brandon Heser, P.E., Director, Mine Technical Services, SSR |
| · | Ryan Meany, Senior Mine Engineer, SSR |
| · | David Christianson, VP FP&A, SSR |
| · | Daniel Kern, Finance Director, SSR |
| · | Nitin Laddha, Finance, Manager, SSR |
| · | Allen Morris, Senior Director, Innovation and Mineral Processing, SSR |
| · | James Harrold, P.E., Principal Process Engineer, SSR |
| · | Osman Uludağ, Director Resource Development, SSR |
| · | Jerry Johnson, Technical Services Manager, SSR |
| · | James Madson, Superintendent Mine Engineering, SSR |
| · | Jessie Barto, Environmental Manager, SSR |
| · | Chuck Yarbrough, Study Manager, SSR |
This report is an update of a Technical Report Summary with a report date of February 12, 2024 (SLR 2024).
This TRS was prepared by SLR QPs. The TRS is based on information and data supplied to the QPs by SSR and other parties where necessary. The documentation reviewed and other sources of information are listed at the end of this TRS in Section 24.0 References.
| 2-2 | |
| SSR Mining Inc. | Marigold Complex | October 9, 2026 |
| S-K 1300 Technical Report Summary | SLR Project No.: 138.020810.00001 |
| 2.3 | List of Abbreviations |
Units of measurement used in this TRS conform to the metric system or the US Common system. All currency in this TRS is US dollars (US$) unless otherwise noted.
| μ | micron | kVA | kilovolt-amperes |
| μg | microgram | kW | kilowatt |
| a | annum | kWh | kilowatt-hour |
| A | ampere | L | liter |
| bbl | barrels | lb | pound |
| Btu | British thermal units | L/s | liters per second |
| °C | degree Celsius | L/h/m2 | liters per hour per square meter |
| C$ | Canadian dollars | m | meter |
| cal | calorie | M | mega (million); molar |
| cfm | cubic feet per minute | m2 | square meter |
| cm | centimeter | m3 | cubic meter |
| cm2 | square centimeter | MASL | meters above sea level |
| d | day | m3/h | cubic meters per hour |
| dia | diameter | mi | mile |
| dmt | dry metric tonne | min | minute |
| dwt | dead-weight ton | μm | micrometer |
| °F | degree Fahrenheit | mm | millimeter |
| ft | foot | mph | miles per hour |
| ft2 | square foot | MVA | megavolt-amperes |
| ft3 | cubic foot | MW | Megawatt |
| ft/s | foot per second | MWh | megawatt-hour |
| g | gram | oz | troy ounce (31.1035 g) |
| G | giga (billion) | oz/st, opt | ounce per short ton |
| gal | US gallon | ppb | part per billion |
| g/L | gram per liter | ppm | part per million |
| gpm | US gallons per minute | psia | pound per square inch absolute |
| g/t | gram per tonne | psig | pound per square inch gauge |
| gr/ft3 | grain per cubic foot | RL | relative elevation |
| gr/m3 | grain per cubic meter | s | second |
| ha | hectare | st | short ton |
| hp | horsepower | stpa | short ton per year |
| h | hour | stpd | short ton per day |
| Hz | hertz | t | metric tonne |
| in. | inch | tpa | metric tonne per year |
| in2 | square inch | tpd | metric tonne per day |
| J | joule | US$ | United States dollar |
| k | kilo (thousand) | V | volt |
| kcal | kilocalorie | W | watt |
| kg | kilogram | wmt | wet metric tonne |
| km | kilometer | wt% | weight percent |
| km2 | square kilometer | yd3 | cubic yard |
| km/h | kilometer per hour | yr | year |
| kPa | kilopascal |
| 2-3 | |
| SSR Mining Inc. | Marigold Complex | October 9, 2026 |
| S-K 1300 Technical Report Summary | SLR Project No.: 138.020810.00001 |
| 3.0 | Property Description |
| 3.1 | Location |
Marigold is located in southeastern Humboldt County along the Interstate Highway 80 corridor in the northern foothills of the Battle Mountain Range, Nevada, U.S. Activities at the Property are centered at approximately 40°45′ N Latitude and 117°8′ W Longitude.
The Property (Figure 3-1) is situated approximately five kilometers south–southwest of the town of Valmy, Nevada, at Exit 216 off Interstate Highway 80. Other nearby municipalities include Winnemucca and Battle Mountain, Nevada, which lie approximately 58 km to the northwest and 24 km to the southeast of the Property, respectively.
| 3-1 | |
| SSR Mining Inc. | Marigold Complex | October 9, 2026 |
| S-K 1300 Technical Report Summary | SLR Project No.: 138.020810.00001 |
| Figure 3-1: | Location Map |
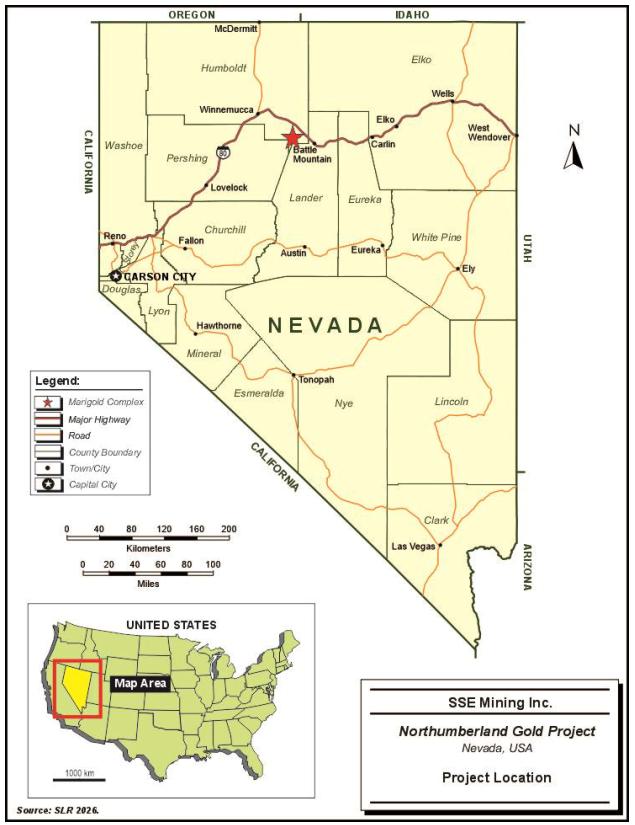
| 3-2 | |
| SSR Mining Inc. | Marigold Complex | October 9, 2026 |
| S-K 1300 Technical Report Summary | SLR Project No.: 138.020810.00001 |
| 3.2 | Land Tenure |
SSR holds 100% interest in the Property through its wholly owned subsidiary, Marigold Mining Company (MMC). Surface and mineral rights at the Property comprise real property owned by MMC; unpatented mining claims owned by MMC; and leasehold rights held by MMC with respect to unpatented mining claims and mill site claims and surface lands.
The properties described herein are associated with one of two main land packages, the Marigold Land Package and the Sterling Land Package (both also referred to as project areas) totalling approximately 19,609 ha (Table 3-1, Figure 3-2). The Marigold Land Package (10,440 ha) includes the properties within the Marigold Mine PoO. The Sterling Land Package (9,169 ha) includes properties associated with the Trenton Canyon Mine or Buffalo Valley Mine.
| Table 3-1: | List of Land Package Areas (in hectares) |
| Property Name | Total (ha) |
Public (ha) |
Private (ha) |
| Sterling Land Package Total | 9,169 | 4,711 | 4,458 |
| Buffalo Valley Mine and Exploration | 2,331 | 1,408 | 923 |
| Trenton Canyon Mine | 1,756 | 696 | 1,060 |
| Trenton Canyon Exploration | 1,424 | 778 | 646 |
| Sterling Boundary | 3,658 | 1,829 | 1,829 |
| Marigold | 10,440 | 5,101 | 5,339 |
| Total Land Package (Sterling + Marigold) | 19,609 | 9,812 | 9,797 |
Land and mineral ownership within the PoO are within the corridor initially governed by the Railroad Act, and, as such, these areas generally have a “checkerboard” ownership pattern. Mineral claims in Nevada are managed federally by the Bureau of Land Management (BLM).
| 3-3 | |
| SSR Mining Inc. | Marigold Complex | October 9, 2026 |
| S-K 1300 Technical Report Summary | SLR Project No.: 138.020810.00001 |
| Figure 3-2: | Marigold and Sterling Land Package Map |
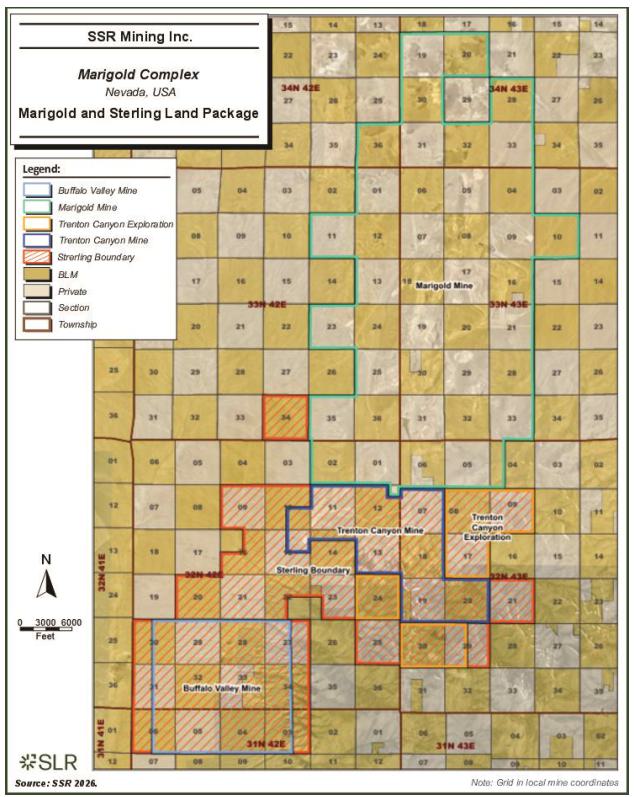
| 3-4 | |
| SSR Mining Inc. | Marigold Complex | October 9, 2026 |
| S-K 1300 Technical Report Summary | SLR Project No.: 138.020810.00001 |
| 3.2.1 | Owned Real Property |
Surface lands at Marigold owned by MMC are listed in Table 3-2.
| Table 3-2: | MMC Surface Lands |
| Parcel Number | Hectares | Location | Ownership Type | Project Area |
| 010-400-03 | 259.0 | Section 03, T.31N, R.42E | Minerals Only | Sterling |
| 07-0491-14 | 194.3 | Section 17, T.32N, R.43E | Fee Simple | Sterling |
| 07-0401-25 | 65.3 | SE1/4 Section 22, T.34N, R.43E | Surface Only | Marigold |
| 07-0404-10, 07-0404-11, 007-0404-12, 07-0404-13 (Lot 8, Parcel 1-4), 07-0404-05 (Lot 11), 07-0404-06 (Lot 12), 07-0404-09 (Lot 15) | 65.7 | Section 33, T.34N, R.43E | Surface Only | Marigold |
| 07-0403-03 (Lot 3) | 18.7 | Section 33, T.34N, R.43E | Surface Only | Marigold |
| 07-0403-04 (Lot 4) | 18.72 | Section 33, T.34N, R.43E | Surface Only | Marigold |
| 07-0403-07, 07-0403-08, 07-0403-09, 07-0403-10 | 18.71 | Section 33, T.34N, R.43E | Surface Only | Marigold |
| 07-0461-09 | 259.0 | Section 9, T.33N, R.43E | Surface Only | Marigold |
| 07-0461-14 | 259.0 | Section 17, T.33N, R.43E | Surface Only | Marigold |
| 07-0461-42 (Parcel A) and 07-0461-43 (Parcel B) | 259.0 | Section 21, T.33N, R.43E | Fee Simple | Marigold |
| 07-0461-44 (Parcel C) and 07-0461-45 (Parcel D) | 259.0 | Section 29, T.33N, R.43E | Fee Simple | Marigold |
| 07-0461-39 | 16.2 | Section 16, T.33N, R.43E | Fee Simple | Marigold |
| 07-0461-41 | 32.4 | Section 30, T.33N, R.43E | Fee Simple | Marigold |
| 07-0481-06 | 254.4 | Section 1, T.32N, R.42E | Fee Simple | Marigold |
| 07-0481-11 | 259.0 | Section 11, T.32N, R.42E | Fee Simple | Sterling |
| 07-0481-13 | 16.2 | Section 12, T.32N, R.42E | Fee Simple | Marigold |
| 07-0481-17 | 194.3 | Section 15, T.32N, R.42E | Fee Simple | Sterling |
| 07-0481-19 | 194.3 | Section 13, T.32N, R.42E | Fee Simple | Sterling |
| 07-0491-02 | 64.8 | Section 6, T.32N, R.43E | Fee Simple | Marigold |
| 07-0491-03 | 277.9 | Section 5, T.32N, R.43E | Fee Simple | Marigold |
| 07-0491-07 | 259.0 | Section 7, T.32N, R.43E | Fee Simple | Sterling |
| 07-0491-09 | 259.0 | Section 9, T.32N, R.43E | Fee Simple | Sterling |
| 010-200-02 | 64.8 | Section 15, T.32N, R.42E | Fee Simple | Sterling |
| 010-200-04 | 64.8 | Section 13, T.32N, R.42E | Fee Simple | Sterling |
| 010-200-10 | 257.5 | Section 25, T.32N, R.42E | Fee Simple | Sterling |
| 3-5 | |
| SSR Mining Inc. | Marigold Complex | October 9, 2026 |
| S-K 1300 Technical Report Summary | SLR Project No.: 138.020810.00001 |
| Parcel Number | Hectares | Location | Ownership Type | Project Area |
| 010-200-12 | 145.7 | Section 33, T.32N, R.42E | Fee Simple | Sterling |
| 010-210-02 | 64.8 | Section 17, T.32N, R.43E | Fee Simple | Sterling |
| 010-210-06 | 259.0 | Section 21, T.32N, R.43E | Fee Simple | Sterling |
| 010-210-12 | 259.0 | Section 29, T.32N, R.43E | Fee Simple | Sterling |
| 010-230-01 | 8.1 | Section 19, T.32N, R.43E | Fee Simple | Sterling |
| 010-230-03 | 210.1 | Section 19, T.32N, R.43E | Fee Simple | Sterling |
| 3.2.2 | Owned Unpatented Mining Claims |
MMC owns a total of 347 unpatented mining claims within the Marigold project area, as shown in Table 3-3, and 499 unpatented mining claims within the Sterling (Trenton Canyon and Buffalo Valley) project area, as shown in Table 3-4.
All claims, which are renewed annually in September of each year, are in good standing until September 1, 2027 (at which time they will be renewed for the following year as a matter of course). All unpatented mining claims are subject to an annual federal mining claim maintenance fee of $200 per claim plus approximately $12 per claim for county filing fees to the BLM.
| Table 3-3: | MMC-Owned Unpatented Mining Claims within the Marigold Mine Project Area |
| BLM Serial Numbers | Claims | Total Number of Claims |
| NMC371561 to NMC371573 | APRI # 1 to APRI # 13 | 13 |
| NMC519580 | APRI # 14 | 1 |
| NMC552229 | APRI # 15 | 1 |
| NMC361136 to NMC361161 | VAL #237 to VAL #262 | 26 |
| NMC600391 to NMC600402 | VAL #1013 to VAL #1024 | 12 |
| NMC371574 to NMC371609 | TYLER # 1 to TYLER # 36 | 36 |
| NMC454876 to NMC454911 | REMARY #237 to REMARY #272 | 36 |
| NMC552228 | REMARY FRACTION | 1 |
| NMC359040 to NMC359057 | MARY # 73 to MARY # 90 | 18 |
| NMC400277 to NMC400288 | HS #123 to HS #134 | 12 |
| NMC400289 | HS #134A | 1 |
| NMC358968 to NMC359003 | MARY# 1 to MARY # 36 | 36 |
| NMC371610 | BONZ # 1 | 1 |
| NMC371612 | BONZ # 3 | 1 |
| NMC371614 | BONZ # 5 | 1 |
| NMC371616 | BONZ # 7 | 1 |
| 3-6 | |
| SSR Mining Inc. | Marigold Complex | October 9, 2026 |
| S-K 1300 Technical Report Summary | SLR Project No.: 138.020810.00001 |
| BLM Serial Numbers | Claims | Total Number of Claims |
| NMC371618 to NMC371627 | BONZ # 9 to BONZ # 18 | 10 |
| NMC371630 to NMC371639 | BONZ # 21 to BONZ # 30 | 10 |
| NMC451485 to NMC451488 | BONZ # 33 to BONZ # 36 | 4 |
| NMC487422 | REBONZ # 2 | 1 |
| NMC487423 | REBONZ # 4 | 1 |
| NMC487424 | REBONZ # 6 | 1 |
| NMC487425 | REBONZ # 8 | 1 |
| NMC487426 to NMC487427 | REBONZ # 19 to REBONZ # 20 | 2 |
| NMC487428 | REBONZ # 31 | 1 |
| NMC524363 | REBONZ # 32 | 1 |
| NMC1112641 to NMC1112686 | GINGER #1 to GINGER #46 | 46 |
| NMC362237 to NMC362272 | LCL #1 to LCL #36 | 36 |
| NMC684371 to NMC674382 | EJM #1 to EJM #12 | 12 |
| NV106305030 to NV106305053 | CB 1 to CB 24 | 24 |
| Total Number of Claims | 347 | |
Notes: 1. Claims require an annual maintenance fee / renewal notification in September each year. 2. All claims expire on August 31, 2027 at 11:59:59 A.M. | ||
| Table 3-4: | MMC-Owned Unpatented Mining Claims within the Sterling Project Area |
| BLM
Serial Numbers (NMC prefix are Legacy Serial Numbers) |
Claims | Total
Number of Claims |
| NMC408889 to NMC408906 | AP # 1 to AP # 18 | 18 |
| NMC408907 to NMC408924 | AP # 37 to AP # 54 | 18 |
| NMC670367 to NMC670368 | AP #9A to AP #10A | 2 |
| NMC689220 and NMC689221 | AP 1R and AP 3R | 2 |
| NMC632168 to NMC632170 | AP 200 to AP 202 | 3 |
| NMC632172 to NMC632173 | AP 204 to AP 205 | 2 |
| NMC689222 to NMC689224 | AP 202R, AP 204R to AP 205R | 3 |
| NMC663238 | AP 207 | 1 |
| NMC454061 to NMC454096 | APTC # 1 to APTC # 36 | 36 |
| NMC643209 to NMC643212 | Barb # 1 to Barb # 4 | 4 |
| NMC1192488 to NMC1192495 | BERNAL 1 to BERNAL 8 | 8 |
| NMC933184 to NMC933201 | Calf 1 to Calf 18 | 18 |
| NMC952352 to NMC952369 | CALF 19 to CALF 36 | 18 |
| NMC639207 to NMC639265 | CAPE #1 to CAPE #59 | 59 |
| 3-7 | |
| SSR Mining Inc. | Marigold Complex | October 9, 2026 |
| S-K 1300 Technical Report Summary | SLR Project No.: 138.020810.00001 |
| BLM
Serial Numbers (NMC prefix are Legacy Serial Numbers) |
Claims | Total
Number of Claims |
| MC639266 to NMC639268 | CAPE #78 to CAPE #80 | 3 |
| NMC639271 to NMC639277 | CAPE #83 to CAPE #89 | 7 |
| NV105732218 to NV105762251 | CB 25 to CB 58 | 34 |
| NMC976967 to NMC976968 | FAIR 1 to FAIR 2 | 2 |
| NMC728801 to NMC728812 | FM 97 to FM 108 | 12 |
| NMC398105 to NMC398112 | FOR # 1 to FOR # 8 | 8 |
| NMC479569 to NMC479572 | FOR # 9 to FOR # 12 | 4 |
| NMC663239 to NMC663245 | FORTOO 1 to FORTOO 7 | 7 |
| NMC663248 to NMC663253 | FORTOO 10 to FORTOO 15 | 6 |
| NMC672352 to NMC672353 | FORTOO NO 16 to FORTOO NO 17 | 2 |
| NMC812860 to NMC812861 | FORTOO 18 to FORTOO 19 | 2 |
| NMC1192496 to NMC1192498 | Hatcher 1 to Hatcher 3 | 3 |
| NMC639282 to NMC639301 | HGS #37 to HGS #56 | 20 |
| NMC639318 to NMC639320 | HGS #284 to HGS #286 | 3 |
| NMC639321 to NMC639323 | HGS #288 to HGS #290 | 3 |
| NMC639324 to NMC639326 | HGS #292 to HGS #294 | 3 |
| NMC639327, NMC415697, NMC415698 | HGS #296, HGS #305, HGS #306 | 3 |
| NMC415702 to NMC415703 | HGS #310 to HGS #311 | 2 |
| NMC479550, NMC479551, NMC409749 | Karen # 1, Karen # 3, Karen # 4 | 3 |
| NMC479552, NMC409750, NMC479553 | Karen # 5, Karen # 6, Karen # 7 | 3 |
| NMC409751, NMC409752 | Karen # 8, Karen # 10 | 2 |
| NMC1192499 to NMC1192516 | KUHN 1 to KUHN 18 | 18 |
| NMC639365 to NMC639382 | MAG #47 to MAG #64 | 18 |
| NMC1001050 to NMC1001066 | NP 1 to NP 17 | 17 |
| NMC479554 to NMC409748 | Peg #1 to Peg #10 | 10 |
| NMC918807 to NMC918826 | PEG 1 to PEG 20 | 20 |
| NMC541209 to NMC541255 | PF # 1 to PF # 47 | 47 |
| NMC556959 to NMC556963 | RCL #173 to RCL #177 | 5 |
| NMC1192517 to NMC1192518 | TBJ 8A to TBJ 9A | 2 |
| NMC216402 to NMC216435 | TCL # 1 to TCL # 34 | 34 |
| NMC639278 to NMC639281 | WP 1 to WP 4 | 4 |
| Total Number of Claims | 499 | |
Notes: 1. Claims require an annual maintenance fee / renewal notification in September each year. 2. All claims expire on August 31, 2027 at 11:59:59 A.M. | ||
| 3-8 | |
| SSR Mining Inc. | Marigold Complex | October 9, 2026 |
| S-K 1300 Technical Report Summary | SLR Project No.: 138.020810.00001 |
| 3.2.3 | Leasehold Rights |
MMC holds leasehold rights in each of the following leases:
| · | Mineral Lease Agreement made and entered into as of June 20, 1986, by and between Donald J. Decker and Suzanne R. Decker, as lessors, Nevada North Resources (USA) Inc., as lessee, and Nevada North Resources Inc. (as amended, the “Decker Lease”). |
| · | Lease Agreement made and entered into as of September 15, 1985, by and between Vek Associates, as lessor, and Rayrock Mines, doing business as Cordex, as lessee (as amended, the “Vek & Andrus Lease”). |
| · | Lease Agreement made and entered into as of August 1, 1988, by and between Euro-Nevada Mining Corp., Inc., as lessor, and Rayrock Mines, doing business as Cordex, as lessee (as amended, the “Euro-Nevada Lease”). |
| · | Lease Agreement made and entered into as of August 1, 2018, by and between the Board of Regents of the Nevada System of Higher Education on behalf of the University of Nevada, Reno, as lessor, and Marigold Mining Company, as lessee (the “University of Nevada Lease”). |
| · | Minerals Lease dated and effective June 17, 1988, by and between SFP Minerals Corporation, as lessor, and Santa Fe Pacific Mining, Inc., as lessee (the “SFP Lease”). |
| · | Minerals Lease dated and effective as of February 19, 1986, by and between Southern Pacific Land Company, as lessor, and SFP Minerals Corporation, as lessee (the “Southern Pacific Land Company Lease”). |
| · | Minerals Sublease dated and effective April 30, 1986, by and between SFP Minerals Corporation, as sublessor, and Santa Fe Pacific Mining, Inc., as sublessee (as amended, the “Southern Pacific Land Company Sublease” and, together with the Decker Lease, the Vek & Andrus Lease, the Euro-Nevada Lease, the University of Nevada Lease, the SFP Lease and the Southern Pacific Land Company Lease, collectively, the “Leases”). |
| · | Minerals Lease Agreement made and entered into as of June 5, 1987, by and between Donald J. Decker and Suzanne R. Decker, as lessors, Nevada North Resources (USA) Inc. and Welcome North Mines (U.S.) Inc., as lessees (the “Franco-Nevada Lease”). |
| · | Minerals Lease Agreement made and entered into as of December 20, 1994, by and between Nevada North Resources (USA), Inc., as lessors, and Santa Fe Pacific Gold Corporation, as lessee (the “Nevada North Lease”). |
| · | Minerals Lease Agreement made and entered into as of June 1, 2006, by and between Nevada North Resources (USA), Inc., as lessor, and Newmont USA Limited, d/b/a Newmont Mining Corporation, as lessee (as amended, the “New Nevada 2006 Lease”) |
| · | Minerals Lease Agreement made and entered into as of October 16, 2012, by and between New Nevada Resources, LLC and New Nevada Lands, LLC, as lessors, and Newmont Mining Company, as lessee (the “New Nevada 2012 Lease”). |
| · | Minerals Lease Agreement made and entered into as of December 3, 2014, by and between New Nevada Resources, LLC and New Nevada Lands, LLC, as lessors, and Newmont Mining Company, as lessee (the “New Nevada 2014 Lease”). |
| · | Exploration Lease & Option to Purchase Agreement made and entered into as of July 31, 2024, by and between John Steen, as lessor, and Marigold Mining Company, a Nevada corporation, as lessee (the “Hardrock Exploration 2024 Lease”). |
| 3-9 | |
| SSR Mining Inc. | Marigold Complex | October 9, 2026 |
| S-K 1300 Technical Report Summary | SLR Project No.: 138.020810.00001 |
| 3.2.3.1 | Decker Lease Claims |
Pursuant to the Decker Lease dated June 20, 1986, MMC has leasehold rights to 170 unpatented mining claims, as shown in Table 3-5. The initial term for the Decker Lease was through May 25, 1991, and thereafter, as long as operations continue.
| Table 3-5: | Decker Lease Unpatented Mining Claims |
| BLM Serial Numbers (1), (2), (3) | Claims | Total Number of Claims |
| NMC48409 to NMC48412 | RED # 21 to RED #24 | 4 |
| NMC48415 to NMC48426 | RED # 27 to RED # 38 | 12 |
| NMC56187 to NMC56198 | RED # 39 to RED # 50 | 12 |
| NMC56199 to NMC56216 | RED # 52 to RED # 69 | 18 |
| NMC271665 to NMC271688 | RED #201 to RED #224 | 24 |
| NMC271689 to NMC271716 | RED #601 to RED #628 | 28 |
| NMC365642 to NMC365677 | KIT # 1 to KIT # 36 | 36 |
| NMC678030 to NMC678047 | RED 1801A to RED 1818A | 18 |
| NMC678055 to NMC678063 | RED 1826A to RED 1834A | 9 |
| NMC552226 to NMC552227 | RED # 23A to RED # 24A | 2 |
| NMC871541 to NMC871547 | NURED 1819 to NURED 1825 | 7 |
| Total Number of Claims | 170 | |
Notes: 1. Claims require an annual maintenance fee / renewal notification in September each year. 2. All claims expire on August 31, 2027 at 11:59:59 A.M. | ||
| 3.2.3.2 | Vek & Andrus Lease Claims |
Pursuant to the Vek & Andrus Lease dated September 15, 1985, MMC has leasehold rights to 205 unpatented mining and millsite claims, as shown in Table 3-6. The initial term for the Vek & Andrus Lease was through September 15, 1995, and may be renewed for up to eight successive ten-year periods, upon giving the lessor prior written notice. The Vek & Andrus Lease was renewed for its fifth successive ten-year period by providing prior written notice to the lessor on June 11, 2025.
| Table 3-6: | Vek & Andrus Lease Unpatented Mining and Millsite Claims |
| BLM Serial Numbers (1), (2), (3) | Claims | Total Number of Claims |
| NMC271972 to NMC272007 | COT # 1 to COT # 36 | 36 |
| NMC275733 | COT # 38 | 1 |
| NMC275750 to NMC275753 | COT # 55 to COT # 58 | 4 |
| NMC275755 | COT # 60 | 1 |
| NMC275757 | COT # 62 | 1 |
| NMC275759 to NMC275767 | COT # 64 to COT # 72 | 9 |
| 3-10 | |
| SSR Mining Inc. | Marigold Complex | October 9, 2026 |
| S-K 1300 Technical Report Summary | SLR Project No.: 138.020810.00001 |
| BLM Serial Numbers (1), (2), (3) | Claims | Total Number of Claims |
| NMC342068 to NMC342071 | COT # 73 to COT # 76 | 4 |
| NMC297554 to NMC297571 | VAL # 1 to VAL # 18 | 18 |
| NMC347463 to NMC347475 | VAL # 19 to VAL # 31 | 13 |
| NMC297572 to NMC297607 | VAL # 37 to VAL # 72 | 36 |
| NMC361164 to NMC361172 | COT FRAC # 1 to COT FRAC # 9 | 9 |
| NMC371559 to NMC371560 | COT # 75A to COT # 76A | 2 |
| NMC822614 | RECOT 37 | 1 |
| NMC822615 to NMC822619 | RECOT 39 to RECOT 43 | 5 |
| NMC822620 | RECOT 45 | 1 |
| NMC822621 | RECOT 47 | 1 |
| NMC822622 to NMC822626 | RECOT 50 to RECOT 54 | 5 |
| NMC822627 | RECOT 59 | 1 |
| NMC822628 | RECOT 61 | 1 |
| NMC822629 | RECOT 63 | 1 |
| NMC822630 | RECOT 63B | 1 |
| NMC822560 to NMC822613 (2) | GMMCMS 1 to GMMCMS 54 | 54 |
| Total Number of Claims | 205 | |
Notes: 1. NMC822560 to NMC822613 are Mill Site Claims and require an annual maintenance fee / renewal notification in September each year. 2. Claims require an annual maintenance fee / renewal notification in September each year. 3. All claims expire on August 31, 2027 at 11:59:59 A.M. | ||
| 3.2.3.3 | Euro-Nevada Lease Claims |
Pursuant to the Euro-Nevada Lease dated August 1, 1988, MMC has leasehold rights to 36 unpatented mining claims, as shown in Table 3-7. The original term for the Euro-Nevada Lease was five years, and, at the lessee’s option, the Euro-Nevada Lease may be renewed for up to 10 additional and successive five-year periods, upon giving the lessor prior written notice. The Euro-Nevada Lease was renewed for its eighth successive five-year period by providing prior written notice to the lessor on May 24, 2023.
| Table 3-7: | Euro-Nevada Lease Unpatented Mining Claims |
| BLM Serial Numbers (1), (2) | Claims | Total Number |
| NMC373649 to NMC373684 | SAR# 37 to SAR# 72 | 36 |
| Total Number of Claims | 36 | |
Notes: 1. Claims require an annual maintenance fee / renewal notification in September each year. 2. All claims expire on August 31, 2027 at 11:59:59 A.M. | ||
| 3-11 | |
| SSR Mining Inc. | Marigold Complex | October 9, 2026 |
| S-K 1300 Technical Report Summary | SLR Project No.: 138.020810.00001 |
| 3.2.3.4 | University of Nevada Lease Claims |
Pursuant to the University of Nevada Lease dated August 1, 2018, MMC has leasehold rights to property in Section 19, T.33N., R.43E., Humboldt County, Nevada, identified as Humboldt County Assessor’s parcel number 007 461 19. The initial term of the University of Nevada Lease is for twenty years, and the lessee may renew the lease for up to two successive ten-year periods upon providing the lessor with prior written notice.
| 3.2.3.5 | SFP Lease Claims |
Pursuant to the SFP Lease, MMC has leasehold rights to property in Sections 5, 9, 17, and 31, T.33N., R.43E., Humboldt County, Nevada. The initial term of the SFP Lease was for 20 years or for so long, thereafter, as mining is conducted on a continuous basis.
| 3.2.3.6 | Southern Pacific Land Company Sublease Claims |
Pursuant to the Southern Pacific Land Company Sublease, MMC has leasehold rights to certain property in Sections 19 and 31, T.34N., R.43E.; Section 7, T.33N., R.43E.; and Sections 1, 13, and 25, T.33N., R.42E., Humboldt County, Nevada. The initial term of the Southern Pacific Land Company Sublease was for 25 years beginning on April 30, 1986, and for so long, thereafter, as the lessee exercises any rights granted by such sublease.
| 3.2.3.7 | Franco-Nevada Lease Claims |
Pursuant to the Franco-Nevada Lease, MMC has leasehold rights to 82 unpatented mining claims, as set out in Table 3-8. The initial term for the Franco-Nevada Lease was from June 5, 1987, for a period of 50 years and for so long, thereafter, as the lessee exercises any rights granted by such lease.
| Table 3-8: | Franco-Nevada Lease Unpatented Mining Claims |
| BLM Serial Numbers (1), (2) | Claims | Total Number of Claims |
| NMC379514 to NMC379585 | N-1 to N-72 | 72 |
| NMC623992 to NMC623995 | N-109 to N-112 | 4 |
| NMC676435 | N-20A | 1 |
| NMC676436 | N-22A | 1 |
| NMC676437 to NMC676440 | N-28A to N-31A | 4 |
| Total Number of Claims | 82 | |
Notes:
1. Claims require an annual maintenance fee / renewal notification in September each year. 2. All claims expire on August 31, 2027 at 11:59:59 A.M. | ||
| 3-12 | |
| SSR Mining Inc. | Marigold Complex | October 9, 2026 |
| S-K 1300 Technical Report Summary | SLR Project No.: 138.020810.00001 |
| 3.2.3.8 | Nevada North Lease |
Pursuant to the Nevada North Lease, MMC has leasehold rights to 48 unpatented mining claims, as set out in Table 3-9. The initial term for the Nevada North Lease was from December 20, 1994, for a period of 10 years and for so long, thereafter, as long as the lessee exercises any rights granted by such lease.
| Table 3-9: | Nevada North Lease Unpatented Mining Claims |
| BLM Serial Numbers (1), (2) | Claims | Total Number of Claims |
| NMC409224 to NMC409235 | BC-1 to BC-12 | 12 |
| NMC409236 to NMC409271 | BC-13 to BC-48 (Sterling) | 36 |
| Total Number of Claims | 48 | |
Notes:
1. Claims require an annual maintenance fee / renewal notification in September each year. 2. All claims expire on August 31, 2027 at 11:59:59 A.M. | ||
| 3.2.3.9 | New Nevada 2006 Lease Claims |
Pursuant to the New Nevada 2006 Lease, MMC has leasehold rights to 112 unpatented mining claims in Sections 33, T.33N, R.43E, Humboldt County, Nevada, as set out in Table 3-10. The initial term for the New Nevada 2006 Lease was from June 1, 2006, for a period of 20 years and for so long, thereafter, as long as the lessee exercises any rights granted by such lease.
| Table 3-10: | New Nevada 2006 Unpatented Mining Claims |
| BLM Serial Numbers (1), (2) | Claims | Total Number of Claims |
| NMC750721 to NMC750736 | CHU 17 to CHU 32 | 16 |
| NMC752847 to NMC752882 | MB 82 to MB 117 | 36 |
| NMC780924 to 780959 | LOU 1 to LOU 36 | 36 |
| NMC821539 to NMC821562 | BISON # 1 to BISON # 24 | 24 |
| Total Number of Claims | 112 | |
Notes: 1. Claims require an annual maintenance fee / renewal notification in September each year. 2. All claims expire on August 31, 2027 at 11:59:59 A.M. | ||
| 3.2.3.10 | New Nevada 2012 Lease |
Pursuant to the New Nevada 2012 Lease, MMC has leasehold rights to property in Sections 33, T.33N, R.43E, Humboldt County, Nevada. The initial term for the New Nevada 2012 Lease was from October 16, 2012, for a period of 20 years and for so long, thereafter, as long as the lessee exercises any rights granted by such lease.
| 3.2.3.11 | New Nevada 2014 Lease |
Pursuant to the New Nevada 2014 Lease, MMC has leasehold rights to property in Section 5 T.31N., R.42E.; Sections 9, 21, 27, 29, 31, and a portion of Section 23 T.32N., R42E; Sections 11, 23, and 35 T.33N, R.42E, Humboldt County, Nevada. The initial term for the New Nevada 2014 Lease was from December 3, 2014, for a period of 20 years and for so long, thereafter, as long as the lessee exercises any rights granted by such lease.
| 3-13 | |
| SSR Mining Inc. | Marigold Complex | October 9, 2026 |
| S-K 1300 Technical Report Summary | SLR Project No.: 138.020810.00001 |
| 3.2.3.1 | Hardrock Exploration 2024 Lease Claims |
Pursuant to the Hardrock Exploration 2024 Lease dated July 31, 2024, MMC has leasehold rights to 20 unpatented mining claims located in Sections 5 and 6, T.33N, R.43E; Sections 31 and 32, T.34N, R.43E, Humboldt County, Nevada, as set out in Table 3-11. The initial term is for a five-year period unless MMC exercises the option to purchase the claims before the end of the term.
| Table 3-11: | Hardrock Exploration 2024 Lease Unpatented Mining Claims |
| BLM Serial Numbers (1), (2) | Claims | Total Number of Claims |
| NV101624003 | HARDROCK # 1A | 1 |
| NV101601034 | HARD ROCK # 2 | 1 |
| NV101479290 | HARD ROCK # 3 | 1 |
| NV101624004 to NV101624006 | HARDROCK #4A to HARDROCK #6A | 3 |
| NV101478479 | HARDROCK # 7 | 1 |
| NV101608743 | HARDROCK # 8 | 1 |
| NV101780647 | HARDROCK # 9 | 1 |
| NV101497377 | HARDROCK # 10 | 1 |
| NV101452764 | HARDROCK # 11 | 1 |
| NV101493895 | HARDROCK # 12 | 1 |
| NV101455533 | HARDROCK #13 | 1 |
| NV101624007 to NV101624013 | HARDROCK #14 to HARDROCK #20 | 7 |
| Total Number of Claims | 20 | |
Notes: 1. Claims require an annual maintenance fee / renewal notification in September each year. 2. All claims expire on August 31, 2027 at 11:59:59 A.M. | ||
| 3.3 | Encumbrances and Royalties |
Some of the leases require MMC to make certain net smelter return (NSR) royalty payments to the lessors and comply with certain other obligations, including completing certain work commitments or paying taxes levied on the underlying properties. These NSR royalty payments are based on the specific gold-extraction areas and are payable when the corresponding gold ounces are extracted, produced, and sold. The NSR royalty payments vary between 0% and 10.0% of the value of gold production net of off-site refining costs, which equates to an annual average ranging from 3.3% to 10.0% and a weighted average of 6.9% over the life-of-mine (LOM). Net Smelter Return (NSR) royalty payments for the Buffalo Valley deposit are fixed at 3.5% of the value of production net of off-site refining costs.
| 3-14 | |
| SSR Mining Inc. | Marigold Complex | October 9, 2026 |
| S-K 1300 Technical Report Summary | SLR Project No.: 138.020810.00001 |
| 3.4 | Required Permits and Status |
Mining activities at Marigold are authorized by and conducted under both federal and state regulatory requirements, notably the General Mining Law of 1872, the National Environmental Policy Act of 1970, and the Federal Land Policy and Management Act of 1976. All requirements are administered by the BLM, along with applicable statutes and regulations within the Nevada Revised Statutes and Nevada Administrative Code, administered by the Nevada Division of Environmental Protection.
Further discussion regarding the Property’s mineral and surface rights, including leasehold rights under the Leases, is provided in Section 3.2. Further discussion regarding permitting requirements with respect to the Property is provided in Section 17.0. MMC holds active, valid permits for all facets of the current mining operation as required by county, state, and federal regulations. MMC performs duties on leased lands pursuant to all federal and state requirements, and all the Leases are maintained in good standing. As part of the Nevada permitting process, MMC engages in concurrent reclamation practices and is bonded for all permitted features.
| 3.5 | Other Significant Factors and Risks |
SLR is not aware of any environmental liabilities on the property. SSR Mining Inc. has all required permits to conduct the proposed work on the property. SLR is not aware of any other significant factors and risks that may affect access, title, or the right or ability to perform the proposed work program on the property.
| 3-15 | |
| SSR Mining Inc. | Marigold Complex | October 9, 2026 |
| S-K 1300 Technical Report Summary | SLR Project No.: 138.020810.00001 |
| 4.0 | Accessibility, Climate, Local Resources, Infrastructure and Physiography |
| 4.1 | Accessibility |
Access to the Property is via a five kilometer public road (hard-packed clay and gravel) off the Valmy exit (Exit 216) on Interstate Highway 80. The area around the Property is a well-developed mining area close to necessary, all-season infrastructure and resources.
| 4.2 | Climate |
The climate is typical of the Great Basin region of the western U.S., with temperatures ranging from highs of 40°C in summer to lows of -7°C in winter. Annual precipitation is relatively low, ranging from 15 cm to 20 cm per year, with approximately 50% of precipitation occurring as snowfall during the months of December through March.
The climate presents no restrictions on the operating season, and Marigold operates year-round.
| 4.3 | Local Resources |
The nearby towns of Winnemucca and Battle Mountain host the majority of the skilled labor workforce. Contractor support, transportation, accommodation, meals, bulk fuel, heavy equipment rental, and general suppliers are all readily available in these communities as well as in Elko, which is located approximately 142 km east of Marigold and serves as a major hub for mining operations in northern Nevada. Employees are transported to the Property primarily by contract buses and light-duty vehicles owned by MMC.
| 4.4 | Infrastructure |
Marigold has been in continuous operation since 1989. There is significant existing infrastructure on-site for delivering power and water to the various mine shops, leach pad, and process and ancillary facilities. The Property is located in a favorable area for natural resource development with significant resources in place to support the mining industry.
Water for Marigold is supplied from three existing groundwater production wells located near the access road to the Property and dewatering wells located around the pits. Marigold owns groundwater rights that collectively allow up to 3.134 million m3 of water consumption annually for site operations. Total water consumption by the site has averaged 1.52 million m3 over the past five years. The water is primarily consumed by retention in the heap leach pad, evaporation, processing operations, and dust suppression.
A portion of the site’s dewatering flows is used for makeup water for process operations and dust suppression. A pipeline has been constructed to connect the dewatering circuit to the process circuit so the dewatering water can be used as make-up supply water to the process. This connection minimizes the need to supply makeup water to the process circuit from the three production wells, which will only be used for backup as needed.
A significant amount of the flow from the dewatering wells is not consumed and is sent to the rapid infiltration basins (RIBs) for infiltration back into the aquifer.
Marigold also owns 0.893 Mm3 annually of surface water storage rights associated with the Trout Creek Dam (J-666). In addition, in October 2019, Marigold was issued water right permits associated with the activities described in the Plan of Operations – Mackay Optimization Project Amendment, including permits for the dewatering during mine operations and evaporative losses from a future pit lake that will develop in closure.
| 4-1 | |
| SSR Mining Inc. | Marigold Complex | October 9, 2026 |
| S-K 1300 Technical Report Summary | SLR Project No.: 138.020810.00001 |
The power supply for Marigold is provided by NV Energy Inc. via a 120 kV transmission line to site. Site power draw is 5 MW. After exiting the main substation, power is distributed through a 25 kV distribution grid.
The tailings storage facility (TSF) has been decommissioned and reclaimed. The only remaining activity concerning the TSF is ongoing monitoring.
Details regarding completed, in progress, and future OBSAs at Marigold can be found in Section 13. The leach pad is discussed in detail in Section 14. Further discussion on the Property’s infrastructure is provided in Section 15.
| 4.5 | Physiography |
Elevations at Marigold range from approximately 1,372 meters above mean sea level (MASL) to 1,890 MASL. Terrain varies from a relatively flat alluvial plain to sloped foothills at the base of the Battle Mountain Range. Vegetation mainly comprises sagebrush, rabbit brush, and a variety of grasses and forbs. Fauna is not abundant on the Property primarily due to the lack of surface water and limited forage. No threatened or endangered plant or animal species have been noted within the Property’s operating area.
| 4-2 | |
| SSR Mining Inc. | Marigold Complex | October 9, 2026 |
| S-K 1300 Technical Report Summary | SLR Project No.: 138.020810.00001 |
| 5.0 | History |
| 5.1 | Ownership, Exploration, and Development History |
The first recorded gold production from the Property near Valmy, Nevada, occurred in 1938 when the Marigold Mining Company, owned by Frank Horton, operated an underground mine which came to be known as Marigold. Figure 5-1 shows the Marigold mine prior to World War II.
| Figure 5-1: | View to the East–Southeast over the Cyanide Leach Tanks from the Marigold Mine prior to World War II |
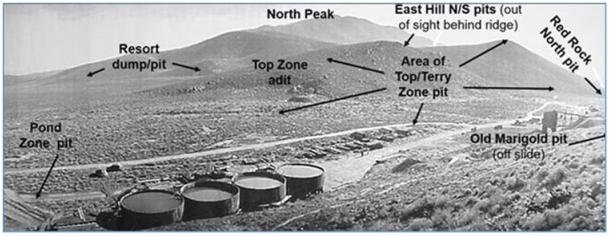
Source: SSR 2017
The Horton family processed approximately 9,000 t of ore averaging about 6.85 g/t Au before World War II halted production. In 1943, Mr. Horton’s estate sold its interest in the Property and claims. Several unsuccessful attempts were made to open and operate the mine before exploration activities began again in 1968.
From 1968 through 1985, several companies conducted exploration programs in the Marigold area and completed a total of 126 exploratory drill holes. Records document the activities of Homestake (1968), St. Joe (1979), Decker Exploration (1979), Placer Amex (1979–1980), True North, Marigold Development Company (MDC) (1981–1983), Welcome North (1984), and Nevada North Resources (USA) Inc. (1985–1986). Other groups that conducted work in the area include Newmont, Kerr-McGee, SFP Minerals Corporation, Cordex/Rayrock Mines, and Vek/Andrus Associates (partnership between Vic Kral, Ralph Roberts, Bob Reeve, and Bill Andrus composed of Vek Associates and Andrus Resources Corporation).
From 1983 through 1984, MDC excavated a small open pit over the historical Marigold underground workings, producing 2,812 t of ore containing 271 oz of gold (McGibbon 2004).
In 1985, Vek/Andrus Associates drilled three holes under the supervision of Ralph Roberts in the Section 8 area of the Property, just northeast of the old underground mine. Roberts invited Andy Wallace of Cordex to view the drilling results, and Wallace was encouraged by the deep level of oxidation, presence of favorable rock units, anomalous indicator elements, and anomalous gold values. The operating partner Cordex, an exploration syndicate composed of Dome Exploration (U.S.) Ltd., Lacana Gold Inc. (Lacana) and Rayrock Mines, leased the Vek/Andrus Associates claim block in September 1985 and began a drilling program in November 1985. Drill holes NM-3 and NM-4 intersected 21.3 m of 2.40 g/t Au and 25.9 m of 7.54 g/t Au, respectively. These were the discovery holes for the 8 South (8S) orebody (Roberts 2002).
| 5-1 | |
| SSR Mining Inc. | Marigold Complex | October 9, 2026 |
| S-K 1300 Technical Report Summary | SLR Project No.: 138.020810.00001 |
The Property is within the “checkerboard” railway lands, where the U.S. Government originally awarded the surface, water, and mineral rights for alternate sections (2.5 km2 of land) to the Santa Fe Pacific Railroad as an incentive to develop the transcontinental railway project in the 1860s. Santa Fe Pacific Railroad eventually became the parent company of SFP Minerals. Following further drilling in the 8S deposit in the spring of 1986, a joint venture was formed between SFP Minerals and the Cordex group, which consolidated some of the land holdings over the Marigold area.
In late-1986, the Cordex group leased other claims, including the historical Marigold mine, Mackay (Top Zone, East Hill, and Red Rock) area from various claim holders.
In March 1988, Rayrock Mines (operating company for Cordex) made a production decision on the 8S deposit, and, by September 1988, it began stripping on the 8S pit (McGibbon 2004).
In August 1989, the first gold doré bar was poured at the Marigold mill.
In March 1992, Rayrock Mines purchased a two thirds ownership interest in the Property, and Homestake Mining Company (Homestake), which had taken Lacana’s interest through previous corporate mergers, held the remaining one third ownership interest in the Property.
In 1994, mining of the 8S deposit was completed, and the Marigold mill was no longer used to process ore. At this point, Marigold became a run-of-mine (ROM) heap leach operation.
In March 1999, Glamis Gold Ltd. (Glamis Gold) purchased all the assets of Rayrock Mines, resulting in Glamis Gold holding a two thirds ownership interest in Marigold, and Homestake continuing to hold a one third ownership interest. In the same year, the Basalt, Antler, and Target II deposits were discovered at the south end of the Property in Section 31. These deposits were mined and partially backfilled with the unmined East Basalt deposit which is currently under development as an easterly extension of the original Basalt pit.
By January 2001, a total of one million ounces of gold had been recovered from the Property. In July 2001, Glamis Gold released a revised NI 43-101 Technical Report (Glamis Gold 2001) to report the Mineral Resources and Mineral Reserves for Section 31 of the Property.
In 2006, Glamis Gold merged with Goldcorp Inc. (Goldcorp), resulting in a Goldcorp subsidiary holding a two thirds ownership interest in Marigold and being the operator. Homestake, which had been acquired by Barrick Gold Corporation (Barrick) in 2001, continued to hold the remaining one third ownership interest.
In 2007, discovery holes were drilled in the Red Dot deposit.
By mid-2009, two million ounces of gold had been recovered from Marigold.
On April 4, 2014, SSR (formerly Silver Standard Resources Inc.) completed the acquisition of Marigold from subsidiaries of Goldcorp and Barrick, and prepared updated Mineral Resources and Mineral Reserves estimates (Silver Standard 2014).
In August 2015, Marigold mine acquired 2,844 ha of adjacent land from Newmont. This land included previously mined areas known as the Mud pit, NW pit, and the Valmy pits. Exploration drilling in the area had been completed by a combination of companies including Hecla Mining Company (Hecla), SFP Minerals, and Newmont.
| 5-2 | |
| SSR Mining Inc. | Marigold Complex | October 9, 2026 |
| S-K 1300 Technical Report Summary | SLR Project No.: 138.020810.00001 |
In June 2019, SSR acquired the Trenton Canyon and Buffalo Valley properties from Newmont Goldcorp Corporation (Newmont). The Trenton Canyon target is located approximately four kilometers south of New Millenium, and the Buffalo Valley target is located approximately 10 km southwest of New Millenium. Both properties are included in an 8,900 ha parcel that is contiguous to the south boundary of the Marigold property
A summary of the historical exploration work carried out on the Property is shown in Table 5-1. Figure 5-2 presents the exploration targets and mining areas for the Property.
| 5-3 | |
| SSR Mining Inc. | Marigold Complex | October 9, 2026 |
| S-K 1300 Technical Report Summary | SLR Project No.: 138.020810.00001 |
| Figure 5-2: | Location of Marigold Exploration Targets and Mining Areas |
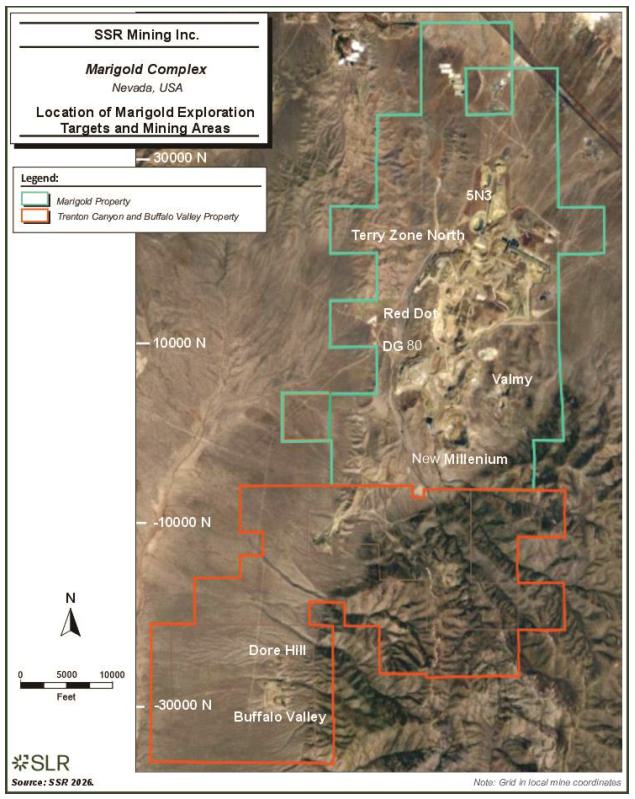
| 5-4 | |
| SSR Mining Inc. | Marigold Complex | October 9, 2026 |
| S-K 1300 Technical Report Summary | SLR Project No.: 138.020810.00001 |
| Table 5-1: | Summary of Historical Exploration |
| Year | Property | Company | Exploration Type | Details |
| 1968–1985 | Marigold | Various exploration and mining groups | Drilling | 7,037.2 m in 126 drill holes. |
| 1985–1999 | Marigold | Cordex and Rayrock Mines | Drilling | 335,500.7 m in 2,358 drill holes. |
| Geophysics | 1989 – CSAMT survey conducted by Quantec Geoscience using Zonge CSAMT System covering 33 EW and NW-SE lines, spaced 300.3 m and 499.9 m. A total of 59.2 km covered. | |||
| 1997/1999 – CSAMT survey conducted by Zonge Geoscience using Zonge CSAMT System covering 33 EW and NW–SE lines, spaced 300.3 m and 499.9 m. A total of 51.8 km covered. | ||||
| 1998 – Gravity survey conducted by Zonge Geoscience using Scintrex Gravity Meter, Trimble GPS System survey conducted on 150 m square grid and data collected from a total of 1,252 stations. | ||||
| 1999 – Induced Polarization conducted by Zonge Geoscience using Zonge IP system, Dipole-Dipole Array, A = 182.9 m, one line N20W. A total of 3.0 km covered. | ||||
| 1999–2006 | Marigold | Glamis Gold | Drilling | 486,648.9 m in 2,506 drill holes. |
| Geophysics | 2004 – Airborne Magnetic conducted by Pearson, deRidder & Johnson, Inc. using Ultra Light System / 75.0 m EW flight lines, 300.3 m NS tie lines. A total of 323.5 km covered. |
| 5-5 | |
| SSR Mining Inc. | Marigold Complex | October 9, 2026 |
| S-K 1300 Technical Report Summary | SLR Project No.: 138.020810.00001 |
| Year | Property | Company | Exploration Type | Details |
| 2006–2013 | Marigold | Goldcorp | Drilling | 528,225.7 m in 1,870 drill holes. |
| Geophysics | 2009 – Magneto-telluric/Induced Polarization survey conducted by Quantec Geoscience, using Quantec Titan System. 11 lines in various orientations. A total of 46.4 km covered. | |||
| 2010 – Induced Polarization conducted by Zonge Geoscience using Zonge IP system, Dipole-Dipole Array, A= 150.0 m and 200.0 m, 27 lines EW, spaced 300.3 m –1,499.9 m. A total of 117.5 km covered. | ||||
| 2009–2010 – Review of all geophysical survey data and compilation of Marigold geophysical data by J L Wright Geophysics. | ||||
| 2006–2013 | Marigold | Goldcorp | MMI Survey | 2007–2009 – Initial survey in 2007 covered Red Dot area, and, in 2008–2009, most of undisturbed land within Marigold was covered. A total of 11,493 samples were taken. Samples collected every 15.2 m along 117 EW lines separated by 30.5 m. In 2007, samples were analyzed for Ag, As, Au, Ba, Cd, Co, Cu, Pb, Pd, Sm, Y, Zn, and Zr. In 2008, Pd was dropped. In 2009, Co, Sm, Y, and Zr were dropped and replaced with Mg, Sr, and Sb. |
| 1985–2006 | Valmy property | Newmont (including Hecla and SFP Minerals) | Drilling | 109,363 m in 867 drill holes. Data was acquired from Newmont with the acquisition of the 2,844 ha Valmy property in 2015. |
| 1980–2012 | Buffalo Valley and Trenton Canyon | Newmont (including Fairmile, Hecla and others) | Drilling | 1574 RC and Core drill holes for 183,079 m at Buffalo Valley
1,149 RC and Core drill holes for 153,701 m at Trenton Canyon.
|
| 1980–2012 | Buffalo Valley and Trenton Canyon | Newmont (including Fairmile, Hecla and others) | Geophysics | Multiple geophysical surveys were carried over Buffalo Valley and Trenton Canyon properties by 5 different contractors and Newmont; these include – Airborne Electromagnetic Survey (AEM), Aero magnetic survey (AMAG), Airborne Radiometric Survey (ARAD), Controlled Source Audio Magneto-telluric Survey (CSMAT), Gravity (GRAV). |
| 5-6 | |
| SSR Mining Inc. | Marigold Complex | October 9, 2026 |
| S-K 1300 Technical Report Summary | SLR Project No.: 138.020810.00001 |
| 5.2 | Past Production |
| 5.2.1 | Marigold |
Gold recovery at Marigold was initially done by a milling circuit with a carbon-in-leach (CIL) process and then a ROM heap leach process where the ore was dumped on a lined leach pad and irrigated with a diluted cyanide solution. The tonnes, grade, and contained and recovered ounces from the start of commercial production in August 1989 to April 1, 2014, is provided in Table 5-2; operations included both milled and leach pad processing. The tonnes, grade, and contained and recovered ounces from April 1, 2014, when SSR acquired the Complex, to May 1, 2026, is provided in Table 5-3. Processing from April 1, 2014, to date is leach pad only.
The overall average recovery for the milling circuit was 95%, and it was calculated at 70.6% for the ROM heap leach process for the period August 1989 to May 1, 2026.
| Table 5-2: | Marigold Historical Production from August 1989 to April 1, 2014 |
| Process Type | Tonnes (Mt) |
Au
Grade (g/t) |
Contained
Gold (koz) |
Produced
Gold (koz) |
| Leach Pad | 146.1 | 0.67 | 3,139 | 2,265 |
| Milled | 4.6 | 3.13 | 483 | 458 |
| Total | 150.7 | 0.75 | 3,622 | 2,723 |
| Table 5-3: | Marigold Production from April 1, 2014 to March 31, 2026 |
| Year | Tonnes (Mt) |
Au
Grade (g/t) |
Contained
Gold (koz) |
Gold
Produced (koz) |
| 2014 | 11.20 | 0.60 | 215 | 130 |
| 2015 | 20.61 | 0.44 | 294 | 207 |
| 2016 | 23.56 | 0.46 | 345 | 205 |
| 2017 | 25.59 | 0.35 | 285 | 202 |
| 2018 | 27.53 | 0.37 | 324 | 205 |
| 2019 | 25.68 | 0.40 | 327 | 220 |
| 2020 | 23.56 | 0.39 | 297 | 234 |
| 2021 | 20.00 | 0.41 | 263 | 235 |
| 2022 | 18.06 | 0.56 | 323 | 195 |
| 2023 | 21.85 | 0.45 | 316 | 278 |
| 2024 | 27.69 | 0.28 | 249 | 168 |
| 2025 | 19.32 | 0.39 | 242 | 154 |
| 2026 (Q1) | 4.95 | 0.26 | 41 | 39 |
| Total | 269.60 | 0.41 | 3,521 | 2,472 |
| 5-7 | |
| SSR Mining Inc. | Marigold Complex | October 9, 2026 |
| S-K 1300 Technical Report Summary | SLR Project No.: 138.020810.00001 |
| 5.2.2 | Trenton Canyon |
The Trenton Canyon property operated as an open pit ROM heap leach operation from 1996 to 2001 producing approximately 290,000 ounces of gold from the North Peak, West, and South pits.
| 5.2.3 | Buffalo Valley |
Mining and heap leaching was carried out on the Buffalo Valley property from 1989 to 1991, producing approximately 50,000 ounces of gold.
| 5-8 | |
| SSR Mining Inc. | Marigold Complex | October 9, 2026 |
| S-K 1300 Technical Report Summary | SLR Project No.: 138.020810.00001 |
| 6.0 | Geological Setting, Mineralization, and Deposit |
The following sections contained in this TRS have been derived, and in some instances extracted, from documentation (OreWin 2022) and information supplied to SLR by SSR for review and audit.
| 6.1 | Regional Geology |
Marigold is located in north-central Nevada within the Basin and Range physiographic province bounded by Sierra Nevada to the west and the Colorado Plateau to the east (Figure 6-1).
| Figure 6-1: | Location of the Marigold Mine in North-Central Nevada within the Basin and Range Physiographic Province |
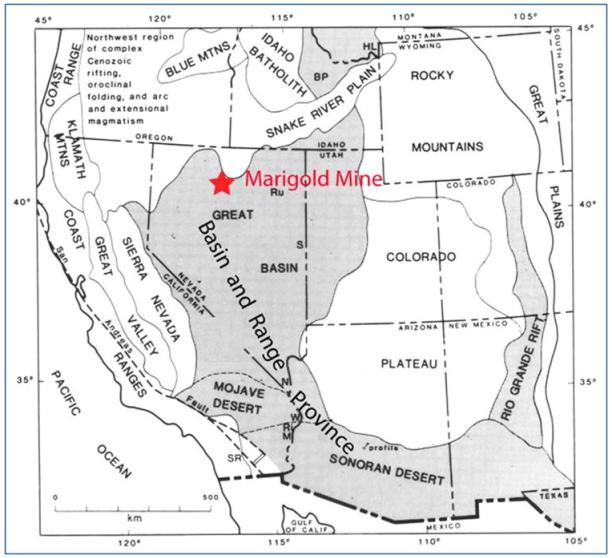
Source: Modified after Hamilton (1987)
Paleozoic basement rocks of north-central to north-eastern Nevada generally comprise four distinct tectonostratigraphic assemblages: the eastern carbonate assemblage; the slope or transitional assemblage; the western siliceous and volcanic assemblage; and the overlap assemblage (Roberts 1964).
| 6-1 | |
| SSR Mining Inc. | Marigold Complex | October 9, 2026 |
| S-K 1300 Technical Report Summary | SLR Project No.: 138.020810.00001 |
In north-central Nevada, western assemblage rocks are tectonically emplaced over slope and eastern assemblage rocks along the Roberts Mountain thrust, although the legitimacy of the thrust is disputed (Ketner 2013). Uplift and erosion of the Antler highland in the Pennsylvanian shed clasts of western assemblage rocks into a foreland basin, forming basal units of the Pennsylvanian-Permian overlap assemblage.
Marine sedimentary rocks and submarine volcanic rocks accumulated in a basin west of the Antler orogenic belt from the Mississippian to the Permian. These rocks were transported eastward and structurally emplaced on top of western assemblage and overlap assemblage rocks along the Golconda thrust during the Permo-Triassic Sonoma orogeny (Roberts 1964). The mechanism for compression resulting in the Sonoma orogeny is controversial, and modern work by Ketner (2008) has called into question the relationship between the Sonoma orogeny and the Golconda thrust.
Compression during the Jurassic and Early Cretaceous resulted in subduction of oceanic plate material beneath continental crust of western North America, generating large volumes of intermediate to felsic melts along a magmatic arc and emplacement of plutons into the Sierra Nevada batholith. Continued compression resulted in accretion of oceanic arc terrane onto the continental margin, forming thrust belts and ophiolite sequences. Collectively, these Andean and Cordilleran style compression events are known as the Nevadan orogeny. The Nevadan orogeny resulted in substantial back-arc shortening and formation of the Luning-Fencemaker fold-thrust belt in Nevada (Wyld et al. 2003). A major mode of felsic plutonism also occurred in Nevada during the late Jurassic (~155–160 Ma) (du Bray 2007).
Late Jurassic and Cretaceous compression formed an extensive fold and thrust belt further east in Utah and Wyoming during the Sevier orogeny. Flat-slab subduction of the Farallon plate underneath North America from the late Cretaceous to Eocene resulted in thick-skinned deformation and uplift of the Rocky Mountains from New Mexico to British Columbia during the Laramide orogeny. The second major mode of felsic plutonism occurred in Nevada during this time (~90–95 Ma) (du Bray 2007), associated with porphyry-style base metal mineralization events.
As the Laramide orogeny waned into the Eocene, there was a major transition from compressional to extensional tectonic regimes in Nevada. Extensional tectonic stresses resulted in the development of basin and range physiography seen throughout central Nevada. The landform is characterized by a series of horsts and grabens that created narrow north–north-east oriented ranges separated by flat bottomed valleys. Extension and resultant crustal thinning are associated with the third major magmatic pulse in Nevada, during which time several porphyry copper–gold systems developed. In addition, the famous Carlin-type gold deposits (CTGD) of northern Nevada are thought to have formed during this time (~36–42 Ma) (Cline et al. 2005).
Magmatism of andesitic to rhyolitic affinity dominated from the Late Eocene to Early Miocene with the production of voluminous ash flowsheets, plutons, hypabyssal intrusives and calderas. Volcanic arc-related andesitic igneous activity continued in western Nevada from early to late Miocene. Further east in central and eastern Nevada, rift-related bimodal rhyolite and tholeiitic basalt were emplaced in the mid-Miocene and are related to epithermal silver–gold deposits in the region.
| 6-2 | |
| SSR Mining Inc. | Marigold Complex | October 9, 2026 |
| S-K 1300 Technical Report Summary | SLR Project No.: 138.020810.00001 |
| 6.2 | Local Geology |
The Property is in the Battle Mountain mining district on the northern end of the Battle Mountain-Eureka trend, a conspicuous lineament of sedimentary-hosted gold deposits (Figure 6-2). The Battle Mountain district hosts numerous mineral occurrences, including porphyry copper–gold, porphyry copper–molybdenum (Cu-Mo), skarn, placer gold, distal disseminated silver-gold, and Carlin-type gold systems.
| 6-3 | |
| SSR Mining Inc. | Marigold Complex | October 9, 2026 |
| S-K 1300 Technical Report Summary | SLR Project No.: 138.020810.00001 |
| Figure 6-2: | Location of Marigold and the Battle Mountain Mining District on the Battle Mountain-Eureka Mineral Trend |
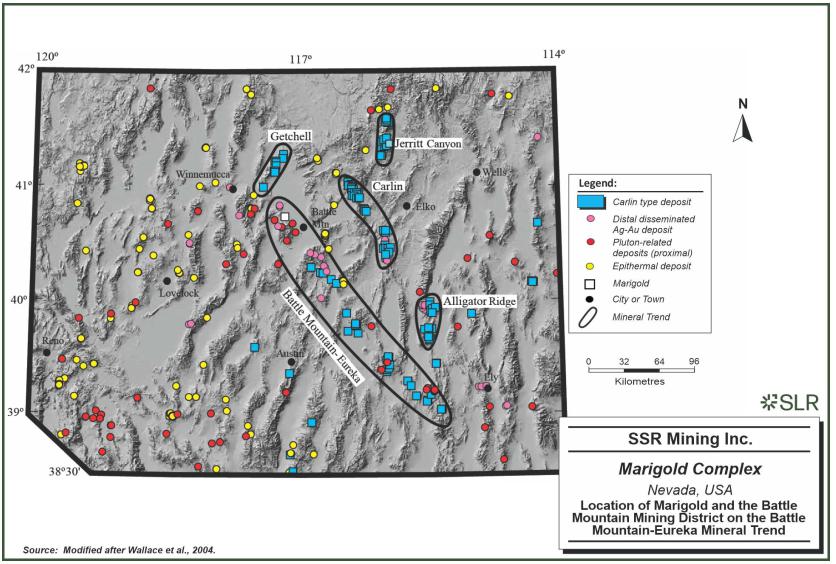
| 6-4 | |
| SSR Mining Inc. | Marigold Complex | October 9, 2026 |
| S-K 1300 Technical Report Summary | SLR Project No.: 138.020810.00001 |
| 6.2.1.1 | Stratigraphy |
The Battle Mountain mining district is underlain by Paleozoic metasedimentary and metavolcanic rocks that are cut by Jurassic, Cretaceous, and Eocene intrusions. Post-mineralization tuff, volcanic rock, and detritus were deposited and preserved in structural and paleotopographic lows. The oldest rocks in the Battle Mountain mining district are para-autochthonous Cambro-Ordovician carbonate, clastic, and volcanic rocks in the footwall of the Roberts Mountain allochthon; these are assigned to the Comus-Preble Formation (Cook 2015). The Comus-Preble Formation comprises fine-grained siliciclastic turbidite sequences, mudstone, siltstone, limey mudstone, limestone, debris flows, and mafic volcanic flows.
Rocks of the Roberts Mountain allochthon were thrust eastward during the Devonian-Mississippian Antler orogeny. This event resulted in intense deformation, including folding and intra-formational thrusting of the metasedimentary units that comprise the Roberts Mountain allochthon. Rocks of the allochthonous clastic assemblage in the Battle Mountain district were previously separated into the Cambrian Scott Canyon Formation, Cambrian Harmony Formation, and the Ordovician Valmy Formation, complicating the understanding of Paleozoic tectonic processes affecting the district. Recent work by Ketner (2008; 2013) proposed the abandonment of the Scott Canyon Formation and reassignment of these rocks to the Valmy and Harmony Formations. Ketner (2008) demonstrated the Harmony Formation conformably overlies the Valmy Formation, eliminating the necessity for the Dewitt thrust mapped by Roberts (1964) and Theodore (1991).
Unconformably overlying rocks of the clastic assemblage is the autochthonous Antler overlap sequence: a Pennsylvanian-Permian package of conglomerate, limestone, siltstone, and debris flow. Basal Antler sequence rocks were deposited as material eroded off the Antler highland into a foreland basin during the Antler orogeny. The base of the Antler sequence, the Battle Formation, is a coarse conglomerate up to approximately 220 m thick (Roberts 1964) that contains clasts derived from the Roberts Mountain allochthon and underlying para-autochthonous rocks. The Battle Formation was deposited in a fluvial-to-shallow marine environment, with coarse, locally derived boulders at the base and interbedded limestone and siltstone units toward the top.
Disconformably overlying the Battle Formation is the Antler Peak Limestone Formation, a package of shallow marine carbonate rocks over 180 m thick at its type locality (Roberts 1964). The Antler Peak Limestone Formation contains abundant brachiopod, coral, and crinoid fossils. The type of section for the Antler Peak Limestone Formation is in the Battle Mountain Range at Antler Peak.
The Permian Edna Mountain Formation disconformably overlies the Antler Peak Formation and consists of locally present basal debris flow and brown weathering phosphatic siltstone (McGibbon, 2005) at least 120 m thick. Unoxidized Edna Mountain Formation is black in color and difficult to differentiate from unoxidized siltstone of the Havallah sequence in drill cuttings and in the field.
Allochthonous rocks of the Mississippian-Permian Havallah sequence were tectonically emplaced over rocks of the Antler sequence, Valmy Formation, and Preble-Comus Formation during the Permo-Triassic Sonoma orogeny (Theodore 2000; McGibbon 2005). The Havallah sequence includes chert, siltstone, limestone, conglomerate, sandstone, and submarine volcanic rocks. The total thickness of the sequence is thought to exceed 2.8 km (Roberts 1964).
| 6-5 | |
| SSR Mining Inc. | Marigold Complex | October 9, 2026 |
| S-K 1300 Technical Report Summary | SLR Project No.: 138.020810.00001 |
Igneous Rocks
The oldest igneous rocks in the district are submarine pillow basalts within the Cambro-Ordovician Preble-Comus and Ordovician Valmy Formations.
Volcanic rocks within the Preble-Comus are only known from drill core and consist of submarine pillow basalt and volcaniclastic units derived from a continental source. These rocks are typically highly altered due to their age, submarine emplacement, present surface to near-surface position, and exposure to hydrothermal systems.
Metabasalt belonging to the Valmy Formation outcrops in the vicinity of Trout Creek south of the Oyarbide fault. On the east side of the district at Elder Creek, diorite dikes of Devonian age are inferred based on cross-cutting relationships. Mesozoic igneous rocks include a relatively unaltered Jurassic lamprophyric dike (Fithian 2015) and an abundance of north-west striking Cretaceous granodiorite and quartz monzonite porphyry dikes and stocks.
Late Cretaceous granodiorite and quartz monzonite porphyry rocks are associated with molybdenum mineralizing systems at Buckingham, Trenton Canyon, and Buffalo Valley (Doebrich and Theodore 1996).
Cenozoic igneous activity coincided with the onset of extensional tectonism throughout the Basin and Range province and normal reactivation of north and north-west striking faults in the Battle Mountain district (Doebrich and Theodore 1996).
Late Eocene to Early Oligocene granodiorite to monzogranite intrusive stocks and dikes are associated with copper-gold mineralizing systems in the district, such as those at Converse and Copper Canyon. Intrusive dikes and sills are typically low relief slope forming units with very little outcrop in part due to argillic alteration where it has been exposed to hydrothermal fluids.
Tertiary volcanic rocks in the district are post-mineralization. Oligocene to Miocene rhyolitic tuff and basaltic andesite flows are intercalated with Tertiary gravels and are locally ridge-forming units. The youngest volcanic rock, Pliocene (2.8–3.3 Ma) basalt, is present south-east of Copper Canyon (Doebrich and Theodore, 1996).
The Project stratigraphy is illustrated in Figure 6-3.
| 6-6 | |
| SSR Mining Inc. | Marigold Complex | October 9, 2026 |
| S-K 1300 Technical Report Summary | SLR Project No.: 138.020810.00001 |
| Figure 6-3: | Stratigraphic Column for the Marigold Complex |
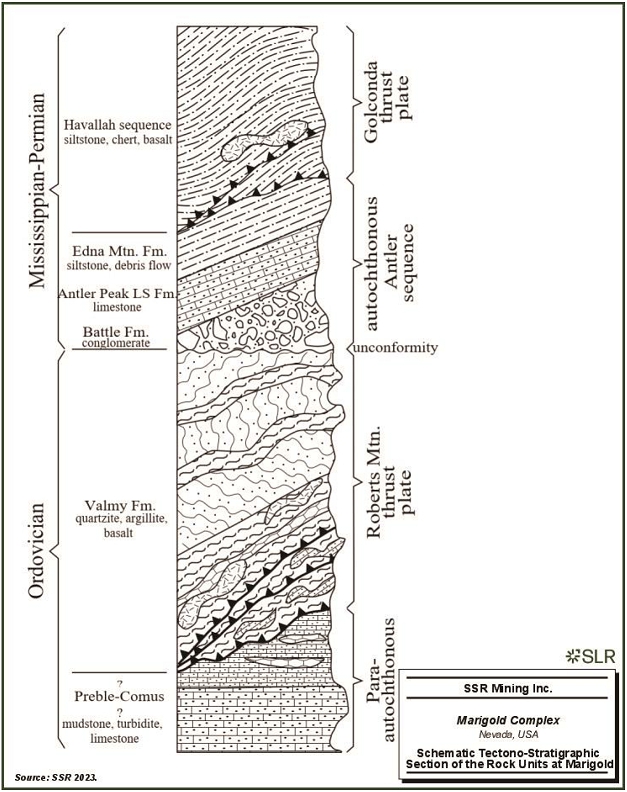
| 6-7 | |
| SSR Mining Inc. | Marigold Complex | October 9, 2026 |
| S-K 1300 Technical Report Summary | SLR Project No.: 138.020810.00001 |
| 6.2.2 | Structure |
Geophysical and isotopic evidence indicate that broad structural zones within the Battle Mountain-Eureka trend may be related to large-scale tectonic processes affecting the western margin of North America from the late Proterozoic through Mesozoic (Grauch et al. 2003). These features may be associated with deep crustal faults that originated as rift or transform faults during Proterozoic breakup of Rodinia, or as faults accommodating late Paleozoic compressional tectonic events (Grauch et al. 2003). Within the Battle Mountain-Eureka trend, deep crustal normal faults with a north-west, north, and north-east strike have influenced sedimentation, deformation, magmatism, extension, and mineralization (Grauch et al. 2003).
In the Battle Mountain mining district, the most prominent surface fault expressions are thrust faults related to Paleozoic-Mesozoic compressional tectonism, and normal faults related to Cenozoic extensional tectonic regimes. There is evidence of a more cryptic late Paleozoic transtensional fault system throughout the district, which is potentially late to post-Antler orogeny. These structures do not display significant slip in post-Permian aged rocks, and as a result are commonly concealed. Structures related to the transtensional fault system are responsible for preservation of thick wedges of Antler sequence rocks.
The Permo-Triassic Golconda thrust fault is traceable throughout the entire Battle Mountain range. Onset of the latest crustal extension began in the late Eocene and has continued sporadically to present. The most prominent extensional faults in the district are the range-bounding normal faults that define the Battle Mountain range, including the post-mineralization, south-west striking Oyarbide fault (Doebrich and Theodore 1996).
At least four generations of folding are recorded in Ordovician rocks of the Roberts Mountain allochthon, including tight-to-isoclinal overturned F1 folds with north-west–south-east fold axes, open and upright F2 folds with west–north-west fold axes, large-scale open and upright F4 folds with north–north-east fold axes, and roll-over anticline style F5 folds that affect the entire rock package. Fold events F1 and F2 pre-date deposition of Antler sequence rocks. The F3 fold event is restricted to the Havallah sequence. F4 folds are thought to be related to Mesozoic tectonics and affect Comus-Preble Formation, Valmy Formation, Antler sequence, and Havallah sequence rocks, while F5 folds appear to affect the entire rock package including Tertiary rocks.
| 6.3 | Property Geology |
| 6.3.1 | Marigold |
| 6.3.1.1 | Property Stratigraphy |
Sedimentary Rocks
Four packages of Paleozoic sedimentary and metasedimentary rocks are present at Marigold. In ascending tectono-stratigraphic order, they include: the Cambro-Ordovician Comus-Preble Formation; the Ordovician Valmy Formation of the Roberts Mountain allochthon; the Pennsylvanian-Permian Antler overlap sequence; and the Mississippian-Permian Havallah sequence of the Golconda allochthon. The distribution of these Paleozoic units is shown in plan view in Figure 6-4.
There are no Mesozoic sedimentary rocks in the Marigold mine area; however, approximately two thirds of the Property is covered by Tertiary to Quaternary intercalated gravel and volcanic material.
| 6-8 | |
| SSR Mining Inc. | Marigold Complex | October 9, 2026 |
| S-K 1300 Technical Report Summary | SLR Project No.: 138.020810.00001 |
Comus-Preble Formation
The assignment of rocks to the Comus-Preble Formation at Marigold is the result of an extensive effort to explore the depths of the Marigold system. On the basis of lithology and deformation style, rocks believed to be positioned below the Roberts Mountain Thrust were assigned to the Comus-Preble Formation.
The Comus-Preble Formation consists of fine-grained siliciclastic turbidite sequences, mudstone, siltstone, limey mudstone, limestone, debris flows, and mafic volcanic flows. Based on data compiled from downhole televiewer logs, abrupt lithologic change from overlying rocks correlates with a transition from tight, east-vergent, overturned folds to open folds.
Valmy Formation
The Valmy Formation consists of quartzite, argillite, and lesser chert and metabasalt, all of which are complexly folded and faulted in the Marigold mine area. The total thickness of the Valmy Formation is approximately 450 m at Marigold, although true thickness of the section is likely less than 200 m.
Fold deformation in the Valmy Formation is characterized by tight, east-vergent, and overturned folds. This fold deformation has resulted in shattering of quartzite beds and ductile deformation of argillite. Where the contact is not eroded or structurally displaced, the top of the Valmy Formation is unconformably overlain by rocks of Pennsylvanian age. Silurian and Devonian rocks are not present either due to nondeposition or erosion.
Antler Sequence
The Antler overlap sequence is composed of Pennsylvanian to Permian-aged rocks assigned to three formations: the basal Battle Formation; the Antler Peak Limestone Formation; and the Edna Mountain Formation. These Formations represent a transgressive sequence of fluvial-to-shallow marine rocks that include conglomerate, sandstone, limestone, siltstone, and debris flows. There is evidence the Antler sequence was locally deposited into sub-basins developed by normal offset on growth faults of likely Late Pennsylvanian to Early Permian age.
Antler sequence rocks are relatively undeformed, except for offset and rotation along Basin and Range normal faults and potentially low-amplitude, long-wavelength (kilometers to tens of kilometers) F4 folding likely related to Mesozoic deformation. The Antler sequence is in thrust contact with the overlying and partially contemporaneous Havallah sequence.
Havallah Sequence
The uppermost package of Paleozoic rocks exposed at Marigold is the Mississippian-Permian Havallah sequence. The Havallah sequence is an assemblage dominated by siltstone, metabasalt, chert, sandstone, conglomerate, and carbonate rocks. These marine sedimentary rocks were deposited in a fault-bounded deep-water trough (Ketner 2008) and subsequently obducted over the Antler sequence along the Golconda thrust (Roberts 1964). Fold deformation in the Havallah sequence is highly variable, ranging from relatively undeformed to tight to isoclinal, overturned and recumbent F3 folds.
| 6-9 | |
| SSR Mining Inc. | Marigold Complex | October 9, 2026 |
| S-K 1300 Technical Report Summary | SLR Project No.: 138.020810.00001 |
| Figure 6-4: | Plan View Map Showing Distribution of Paleozoic Units at Marigold |
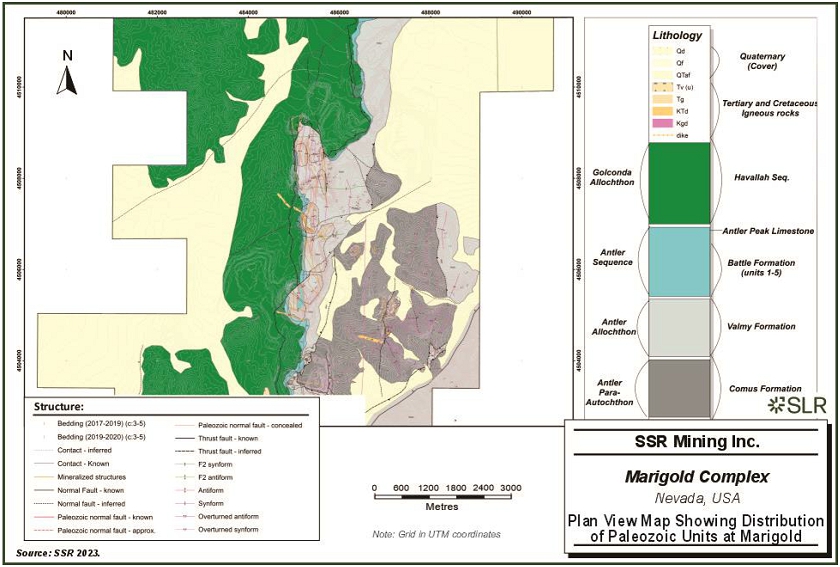
| 6-10 | |
| SSR Mining Inc. | Marigold Complex | October 9, 2026 |
| S-K 1300 Technical Report Summary | SLR Project No.: 138.020810.00001 |
Igneous Rocks
A 2 m interval of an extremely biotite-rich intrusive rock, interpreted to be lamprophyre, was intersected in a single drill hole approximately 1,100 m below the pre-mining topography. Even though the rock is relatively unaltered, the lamprophyre is Jurassic in age (160.7 ± 0.1 Ma Ar-Ar of biotite) (Fithian, 2018) and is age-equivalent to lamprophyre intrusions in northern Nevada.
A series of Late Cretaceous (~92.22 ± 0.05 Ma to 97.63 ± 0.05 Ma, CA-TIMS of zircon) (Fithian, 2015) porphyritic quartz-monzonite dikes crosscut the Paleozoic rock package at Marigold. The intrusions are up to tens of meters wide, and several can be traced along strike for hundreds of meters. The dikes strike south-east to north–south and are typically steeply dipping. No alteration aureole related to these intrusive rocks has been identified at Marigold (Fithian 2015). The dikes contain phenocrysts of plagioclase feldspar, biotite, hornblende, and quartz. The mafic phenocrysts have all been altered to secondary mineral assemblages to varying degrees.
Oligocene (~31.8 ± 0.8, 31.4 ± 1.0 Ma) (Theodore 2000) basaltic andesite is present on the Property, and forms a small, mesa-like landform between Trout and Cottonwood Creeks. The basaltic andesite is crudely columnar in this location.
Late Oligocene to Early Miocene (22.9 ± 0.7 Ma) (McKee 2000) post-mineralization rhyolite tuff is intercalated with gravel throughout the Property. The tuff contains phenocrysts of biotite and is typically altered to white clay. The tuff provides a minimum age of mineralization at Marigold, as it is unmineralized and immediately overlies the orebody at the 8S deposit (Theodore 2000; McGibbon and Wallace 2000).
| 6.3.1.2 | Property Structure |
The main structural corridor and apparent primary controlling feature for the localization of the deposits at Marigold is a 1.5 km wide by >10 km long half graben rotated no more than 045° to the west and bound by east dipping early Permian growth faults and younger (post-Triassic) east dipping faults. This half graben structure is cut by north-west to north-east striking pre-mineralization structures with relatively minor offset and a series of south-west striking post-mineralization extensional normal faults parallel to the Oyarbide fault (Figure 6-5).
Valmy Formation rocks are highly deformed, with interpreted imbricate low-angle intra-plate thrust faults and at least two generations of pre-Pennsylvanian folding. The first generation of deformation related to folding of the Valmy Formation, D1, is characterized by tight, east verging folds with approximately north-west–south-east to north–south striking fold axes. The second deformation event, D2, is defined by open folds with approximately east–west striking fold axes. Folds of this orientation are best defined on the southernmost part of the property, including the Basalt pit area.
Although D1 and D2 folds are described individually because of their unique character, it is possible that these fold sets are the product of the same deformation event. The areas of confluence of D1 and D2 folds are thought to have played a role in the localization of mineralizing fluids.
Argillite beds within the Valmy Formation deformed plastically while brittle quartzite beds shattered, creating open fracture space amenable for precipitation of auriferous iron sulfides. Antler sequence rocks are cut by, and rotated along, Early Permian and Cenozoic normal faults. The timing of the proposed Early Permian growth faults is based on preservation of Battle Formation, Antler Limestone Formation, and a thicker wedge of Edna Mountain Formation in the hanging wall of east dipping normal faults, with little-to-no appreciable offset of the overlying Havallah sequence (Figure 6-6).
| 6-11 | |
| SSR Mining Inc. | Marigold Complex | October 9, 2026 |
| S-K 1300 Technical Report Summary | SLR Project No.: 138.020810.00001 |
| Figure 6-5: | Top Surface of the Valmy Formation with the Current Property Boundary |
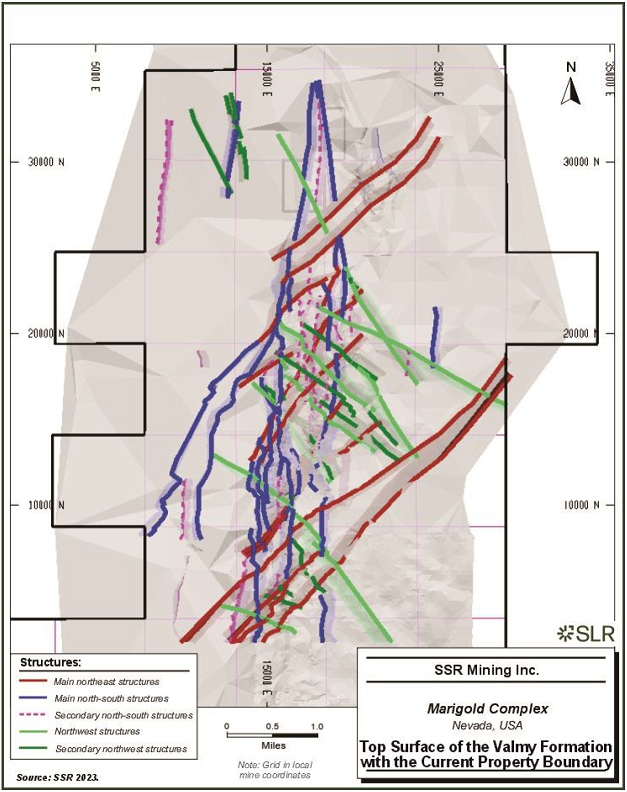
| 6-12 | |
| SSR Mining Inc. | Marigold Complex | October 9, 2026 |
| S-K 1300 Technical Report Summary | SLR Project No.: 138.020810.00001 |
| Figure 6-6: | Cross Section 11,200N Highlighting Inferred Permian Growth Fault and Associated Antithetic Normal Faults with a Steep West Dip |
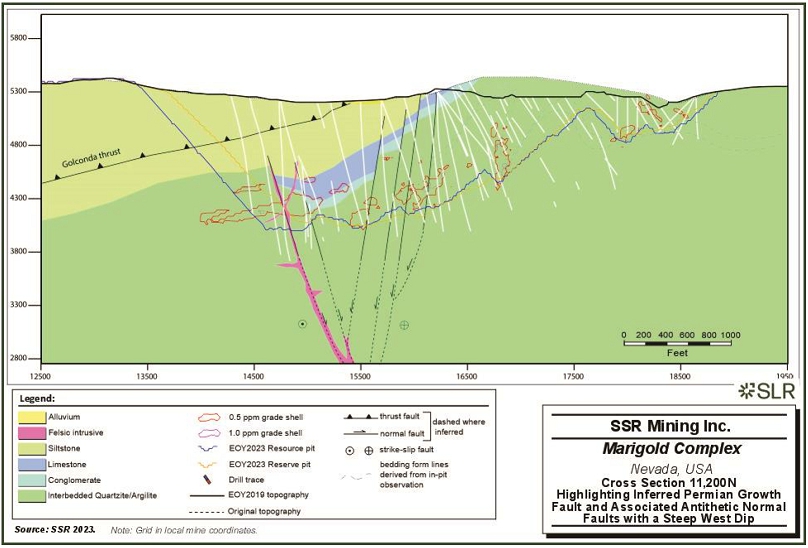
| 6-13 | |
| SSR Mining Inc. | Marigold Complex | October 9, 2026 |
| S-K 1300 Technical Report Summary | SLR Project No.: 138.020810.00001 |
Rocks of the Antler sequence are deformed by F4 and F5 folds, which are not easily recognized in the field. Despite the position between two inferred major allochthonous packages, the Antler sequence does not display more-intense fold deformation akin to F1 and F2 folds.
Havallah sequence rocks were deformed by thrusting and folding related to compression during the Permo-Triassic Sonoma orogeny. An extensive series of thrust faults and folds are documented by Theodore (1991) in the Valmy and North Peak quadrangles west of the Marigold mine area.
Deformation of the Havallah sequence is apparently unrelated to gold mineralization at Marigold. Development of basin and range normal faults and reactivation of Paleozoic faults during the Cenozoic affected the entire stratigraphic section at Marigold, including displacement of post-mineralization Oligocene tuff and Quaternary gravel.
| 6.3.1.3 | Property Mineralization |
The gold deposits at Marigold are considered Carlin-type and cumulatively define a north-trending alignment of gold mineralized rock more than eight kilometers long (Figure 6-7).
Gold mineralizing fluids were primarily controlled by fault structure and lithology, with tertiary influence by fold geometry. Within the Valmy Formation, higher gold grades are observed in the hinge zones of open folds that trend west–north-west and plunge gently. When viewed down plunge, the undulation of these folds is mimicked by gold mineralized horizons. The deposition of gold was restricted to fault zones and quartzite dominant horizons within the Valmy Formation and high permeability units within the Antler sequence.
In unoxidized rocks, gold occurs in arsenic-enriched overgrowths on pre-ore pyrite. Arsenopyrite is also present on pre-ore pyrite grains but is not auriferous. Geochemically, the gold mineralization event is characterized by elevated arsenic, barium, antimony, and mercury, among others. Gangue minerals include quartz, arsenopyrite, stibnite, calcite, clay, and barite. Hypogene sulfide minerals do not occur in ore as these gold-bearing phases are not amenable to heap leaching.
In oxidized rocks, gold occurs natively in fractures associated with iron oxide. Rocks within the Marigold mine area are oxidized to a maximum depth of approximately 450 m. The redox boundary is not consistent throughout the property and is substantially influenced by lithology. Shale, argillite, and siltstone units are frequently unoxidized adjacent to pervasively oxidized quartzite horizons.
A silver and base metal mineralizing event at Marigold includes a mineral association of chalcopyrite, argentiferous tennantite, galena, and sphalerite. The absolute age of this event is unclear, although it may be related to late Cretaceous magmatism in the district.
| 6-14 | |
| SSR Mining Inc. | Marigold Complex | October 9, 2026 |
| S-K 1300 Technical Report Summary | SLR Project No.: 138.020810.00001 |
| Figure 6-7: | Plan View of the Marigold Mine Area showing the Spatial Distribution of 1.0 g/t Au Grade Shells Over an 8 km Northerly Trend |
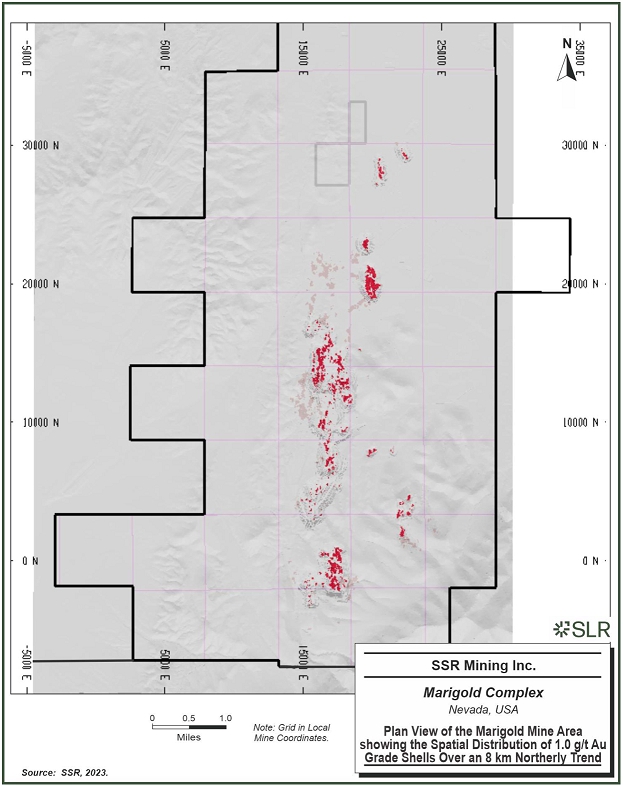
| 6-15 | |
| SSR Mining Inc. | Marigold Complex | October 9, 2026 |
| S-K 1300 Technical Report Summary | SLR Project No.: 138.020810.00001 |
| 6.3.1.4 | Property Alteration |
Alteration of rocks includes silicification along mineralizing structures and decalcification of carbonate horizons (primarily in the Antler sequence). Argillic alteration of quartz monzonite intrusive bodies occurs in fault zones and areas of high hydrothermal fluid flow (Fithian 2015). The intensity of alteration decreases towards the core of the intrusions.
Studies have demonstrated a spatial correlation between gold mineralized rock and increased white mica crystallinity index (Kester 2015). There is evidence for large volumes of quartz precipitation within and outboard of gold mineralized zones, including jasperoid bodies, cryptic silicification, and quartz vein breccias.
| 6.3.2 | Buffalo Valley |
The Buffalo Valley project is located approximately 14 km southwest of the Mackay complex at Marigold and eight kilometers southwest of Trenton Canyon on the immediate western flank of the Battle Mountains. Early works relating to deposit genesis have variably ascribed the Buffalo Valley gold system to distal disseminated silver-gold, porphyry copper-molybdenum, and gold skarn deposit models. Recent work tends to favor the distal disseminated silver-gold model as most of the gold mineralization is associated with quartz+sericite+pyrite (QSP) veins and veinlets that postdate development of the various hornfels and skarn alteration assemblages. The Buffalo Valley deposit is hosted by Eocene felsic dikes and metasedimentary rocks and basalt of the Mississippian-Permian Havallah sequence that are pervasively altered to skarn and hornfels in the vicinity of the deposit area.
| 6.3.2.1 | Property Stratigraphy |
Sedimentary Rocks
In the Buffalo Valley mine area, there are three distinct metasedimentary units of the Havallah sequence (Figure 6-3). The three units are extensively metasomatically altered and metamorphosed proximal to felsic intrusive phases throughout the project area. The protolith equivalents of the three units are as follows:
| · | The lower unit consists of limestone, ribbon chert, and calcareous siltstone. This unit occurs below the base of the historical open pit and does not crop out in the immediate mine area; however, it is well documented by deeper drilling. |
| · | The middle unit consists of interbedded sandstone, siltstone, and chert and is colloquially referred to as the “sandy” unit by the mine geology group. |
| · | The upper unit structurally overlies the middle unit and consists of interbedded chert, siltstone, and limestone. In the mine area, the base of the upper unit is marked by pillow-textured basalt that appears to be faulted out of the sequence at depth to the west of the mine. The upper unit is thought to be tectonically thickened due to fold and thrust deformation. |
Bedding in the Buffalo Valley mine area generally dips to the southwest between 40° and 60°. Chemical, textural, and mineralogical data support interpretation of multi-phase emplacement of felsic intrusions.
| 6-16 | |
| SSR Mining Inc. | Marigold Complex | October 9, 2026 |
| S-K 1300 Technical Report Summary | SLR Project No.: 138.020810.00001 |
Intrusive Rocks
Havallah sequence rocks were intruded and altered by a swarm of northwest striking granodiorite and dacite porphyry dikes in the late Eocene to early Oligocene (Reid et al. 2010). Spatially related to the gold deposit is a porphyry dike system with two primary splays that strike southeast (approximately 140°) and steeply dip to the southwest. The western dike is described by previous workers as fine-grained granodiorite porphyry while the eastern dike is described as dacite porphyry. This dike system is continuous along strike for at least one kilometer, although the west dike appears to coalesce with the east dike near the northwestern extent of the pit. Both east and west dike splays are disrupted by a dacite porphyry plug south of the historical pit that is chemically similar to a dacite stock east of the pit. A quartz diorite stock and associated dikes crop out west of the pit area. Small lamprophyre and pebble dikes are also documented by previous workers (Reid et al. 2010).
Volcanic Rocks
Beds of Cenozoic airfall and ash-flow tuff are intercalated with alluvium and exposed on surface north of the historical pit. Cenozoic strata are thickened in the immediate hanging wall of the range front fault that defines the western flank of the Battle Mountains and in the structural block west of the deposit that is downdropped into the geographic Buffalo Valley on the Front fault. The base of the volcanic tuff sequence is marked by a welded conglomerate that contains subrounded clasts of quartzite and chert (Figure 6-8).
| 6-17 | |
| SSR Mining Inc. | Marigold Complex | October 9, 2026 |
| S-K 1300 Technical Report Summary | SLR Project No.: 138.020810.00001 |
| Figure 6-8: | Geologic Map of the Buffalo Valley Mine Area |
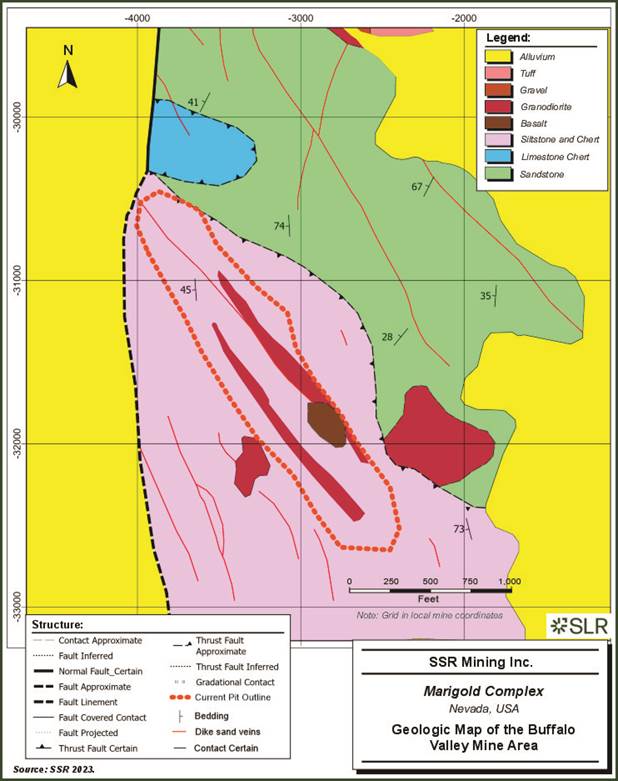
| 6-18 | |
| SSR Mining Inc. | Marigold Complex | October 9, 2026 |
| S-K 1300 Technical Report Summary | SLR Project No.: 138.020810.00001 |
| 6.3.2.2 | Property Structure |
The most prominent fault set in the Buffalo Valley project area are south striking structures that define the range bounding fault system. The structural block that hosts the Buffalo Valley deposit is bound by the Range Front fault to the east and the moderately dipping (34 to 48 degrees) Front fault to the west (Seedorff et al. 1991). Bedrock in this block is exposed at surface and may indicate increased transfer of slip to the Front fault or other subsidiary faults in the vicinity of the deposit. The Front fault is mineralized but also offsets Quaternary alluvium, constraining the minimum age of initiation to the early Oligocene and latest slip to the Quaternary. Dikes and hydrothermal fluids exploited dilational SE-striking relay structures related to N-S oriented master fault structures (Rhys 2022; internal communication). This fault zone is well characterized by a large aeromagnetic anomaly that can be traced for more than seven kilometers (Doebrich and Theodore 1996).
| 6.3.2.3 | Property Mineralization |
The Buffalo Valley gold deposit formed along a southeast trending zone of felsic porphyry dikes and faults. Gold occurs in arsenian iron sulfide overgrowths on pyrite in sheeted QSP veinlets within the central granodiorite and dacite porphyry dikes, subparallel to dike margins in the country rock, and within faults (e.g., the Front fault). Outboard of the intrusion’s gold mineralization is stratiform in receptive horizons of Havallah sequence metasedimentary rocks (Figure 6-9). In general, gold concentration decreases with increasing distance from the granodiorite and dacite porphyry dike system. Although most of the gold mineralization at Buffalo Valley occurs in QSP veinlets that overprint skarn alteration assemblages, a lesser amount of gold is documented as native grains within garnet and amphibole crystals associated with prograde skarn development (Reid et al. 2010). Minerals associated with gold mineralization in oxidized zones include scorodite, manganese and iron oxides, calcite, and clay.
| 6-19 | |
| SSR Mining Inc. | Marigold Complex | October 9, 2026 |
| S-K 1300 Technical Report Summary | SLR Project No.: 138.020810.00001 |
| Figure 6-9: | Schematic Cross Section Buffalo Valley Deposit |
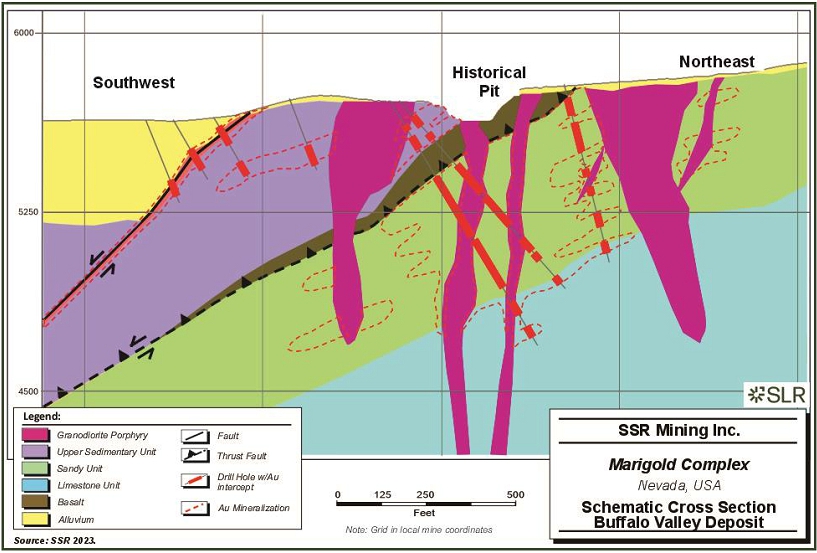
| 6-20 | |
| SSR Mining Inc. | Marigold Complex | October 9, 2026 |
| S-K 1300 Technical Report Summary | SLR Project No.: 138.020810.00001 |
| 6.3.2.4 | Property Alteration |
The alteration styles and assemblages at Buffalo Valley are well documented by Reid et al., 2010 and is, in part, summarized here. The most intense alteration at Buffalo Valley is focused on the SE-striking relay structures that, in part, controlled Eocene to Oligocene dike emplacement. Proximal to these structures’ limestone and other carbonate-bearing protoliths were altered to prograde exoskarn assemblages including Fe-rich pyroxene, Ca and Fe-rich garnet, quartz, and calcite. Prograde endoskarn assemblages include Mg-rich pyroxene, actinolite, biotite, quartz, and chlorite. Sulfide minerals associated with prograde skarn include chalcopyrite, pyrrhotite, sphalerite, galena, and pyrite. Retrograde skarns are manifested in shallower levels of the deposit and are characterized by potassic alteration assemblages that include shreddy biotite and K-feldspar. Sulfide minerals associated with retrograde skarn include pyrrhotite, pyrite, and chalcopyrite. A late QSP event overprints skarn and hornfels and is associated with most of the gold mineralization. Oxidation is the last alteration event to affect the rock package, extending from surface to depths of over 200 m proximal to the central Buffalo Valley fault system. Oxidation is a critically important process for liberation of gold nanoparticles locked in arsenian iron sulfide phases.
| 6.3.3 | Trenton Canyon |
The Trenton Canyon property is located approximately 5 km south of the Marigold deposit and comprises an area of approximately 34 km2. Trenton Canyon is separated from Marigold by the southwest-striking Oyarbide fault, a range-bounding fault on the northern flank of the Battle Mountains. Gold deposits at Trenton Canyon are hosted by siliciclastic and carbonate rocks of Cambro-Ordovician and Pennsylvanian-Permian age proximal to potentially genetically related Eocene felsic dikes. The gold deposits are on the margin of a calc-silicate and hornfels alteration aureole attributed to emplacement of the Cretaceous Trenton Canyon stock, exposed on surface approximately one kilometer southwest of the historical South pit.
| 6.3.3.1 | Property Stratigraphy |
The general lithotectonic stratigraphy of Paleozoic sedimentary rocks exposed at Trenton Canyon is reasonably well constrained (Figure 6-3) by decades of aggregate knowledge of the lithotectonic stratigraphy at the adjacent Marigold mine complex. The succession is underlain by allochthonous to parautochthonous lower Paleozoic marine slope and basin lithofacies rocks provisionally assigned to the Valmy and Comus Formations. These rocks are unconformably overlain by Pennsylvanian to Permian, non-marine to marine conglomerate of the Battle Formation and limestone of the Antler Peak Limestone Formation, both of which belong to the Antler overlap sequence. These two lithotectonic packages are structurally overridden by the Mississippian to Permian Havallah sequence, which includes submarine basalt, chert, argillite, sandstone, siltstone, calcareous sandstone, gritstone, and conglomerate of the Golconda allochthon. The paucity of coherent intraformational lithostratigraphy, due to fold and fault deformation as well as inferred localized deposition during sedimentation, inhibits intraformational lithostratigraphic correlation on the property scale.
Early Paleozoic Rocks
Use of the term Comus Formation for rocks at Trenton Canyon is provisional and serves as a placeholder assignment of Cambro-Ordovician rocks atypical of the Valmy Formation in the district. The formation outcrops very poorly across the property and is best studied along road cuts and where it is present in open pits. At Trenton Canyon, the Comus Formation is a sequence of siliciclastic and carbonate marine rocks and basalt deposited on the slope and basal slope of the passive margin. These rocks formed distal to the Comus carbonate seamount to the north, but record influx of carbonate detritus into the basin at least as far south as Trenton Canyon. The Comus and Valmy Formations are quasi-time equivalent rock packages and are intercalated at the base of slope. In the district, the Comus Formation is distinguished from the Valmy Formation by the presence of carbonate and preservation of higher energy features like debris flows, turbidites, slumps and large rip-up clasts.
| 6-21 | |
| SSR Mining Inc. | Marigold Complex | October 9, 2026 |
| S-K 1300 Technical Report Summary | SLR Project No.: 138.020810.00001 |
Sedimentary units of the Valmy Formation are restricted to deep water chert, massive quartz arenite or quartzite, and argillite units that do not display sedimentary features indicative of higher energy slope facies. The simplistic stratigraphy of the Valmy Formation is a basal massive quartzite that is devoid of bedding and other sedimentary features. The quartzite unit is overlain by a highly contorted thin to medium bedded green to grey chert. Above the chert unit is typically a massive pillow basalt unit. This unit is discontinuous across the property and is best observed on Hollywood Ridge and the North Fork of Trout Creek at Trenton Canyon. The intraformational units of the Valmy Formation are certainly more complex than described above but broadly adhere to this succession in the vicinity of Trenton Canyon.
There are no known Silurian or Devonian rocks at Trenton Canyon.
Late Paleozoic Rocks
At the type locality approximately five kilometers south-southeast of Trenton Canyon, the transgressive Pennsylvanian Battle Formation consists of up to 250 m of alluvial and marine conglomerate, sandstone, mudstone, and lesser limestone (Saller and Dickinson 1982). All these lithologies are recognized at Trenton Canyon despite the drastic northwestward thinning of the formation from the type-locality to the footwall of the Oyarbide fault at Relay Ridge where the strata are either absent or no more than five meters thick. Based primarily on clast composition and sedimentary structures, five informal map units (Pb1-5) and one marker bed within the Battle Formation at Trenton Canyon are recognized. Mapped relations of Battle Formation subunits suggest deposition was synchronous with crustal extension in the Pennsylvanian.
The Havallah Sequence is a Mississippian to Permian sedimentary succession that includes submarine basalt, chert, argillite, sandstone, siltstone, calcareous sandstone, gritstone, and conglomerate. This succession of clastic marine rocks makes up the Golconda allochthon emplaced during the Sonoma Orogeny. The succession is highly deformed by tight to isoclinal overturned folds hindering the understanding of intraformational lithostratigraphy.
Igneous Rocks
The Cretaceous Trenton Canyon stock is the most prominent intrusion on surface in the Trenton Canyon project area. The medium-grained crystalline monzonite stock has a bulbous surface exposure and weathers recessively. The stock has altered the adjacent country rock resulting in a contact metamorphic aureole discernable in regional geophysics. Local base metal (Cu-Mo-Ag-Zn) mineralization also occurs along the periphery of the stock (Figure 6-10).
| 6-22 | |
| SSR Mining Inc. | Marigold Complex | October 9, 2026 |
| S-K 1300 Technical Report Summary | SLR Project No.: 138.020810.00001 |
| Figure 6-10: | Geologic Map of Trenton Canyon Area |
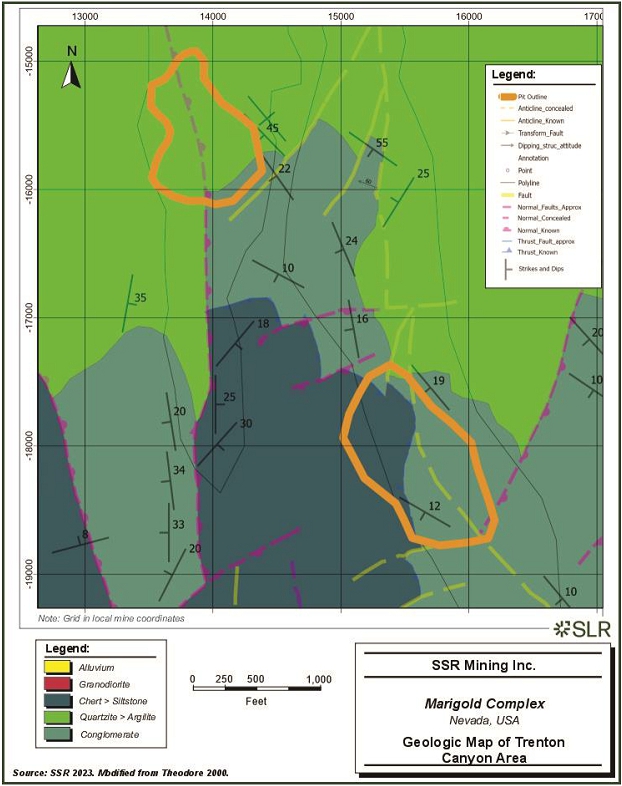
| 6-23 | |
| SSR Mining Inc. | Marigold Complex | October 9, 2026 |
| S-K 1300 Technical Report Summary | SLR Project No.: 138.020810.00001 |
Eocene granodiorite dikes up to several meters in width also occur within the Trenton Canyon area. The dikes intrude a network of north to northwest striking faults and primarily dip to the east at approximately 55 degrees but locally exploit south to southeast striking structures with similar to slightly more inclined dips. Phreatomagmatic textures are observed on dike margins on surface, in road cuts, and in drill core. The breccias primarily contain irregularly shaped clasts of the intrusion, suggesting a degree of plasticity at the time of brecciation, and lesser quartzite and argillite clasts in a matrix of igneous rock flour. The dike margins and phreatomagmatic breccias are locally well mineralized. In addition to phreatomagmatic brecciation, melting and incorporation of country rock is also evident on the margins of some dikes. The dikes at Trenton Canyon may have played a role in the localization of gold mineralizing fluids as deposit geometry typically mimics the spatial distribution pattern of the intrusions.
Lamprophyre dikes are also observed in the project area. The lamprophyres are assumed to be Jurassic in age, based on geochronologic analysis of lamprophyre at Marigold and the temporal distribution of lamprophyre in northern Nevada. The lamprophyres are medium-grained crystalline, often with a felted texture and chilled margins. These lamprophyres do not seem to be associated with gold mineralization and are more often observed in deeper drill holes.
| 6.3.3.2 | Property Structure |
A generalized model of the deformation history preserved at Trenton Canyon is described below. Sections are in chronological order and describe fault systems from oldest to youngest. It is important to note that these fault and fold systems likely experienced a complex protracted and reactivated history making a formal chronologic breakout challenging.
Irregularities in basement architecture are likely responsible for the development of structural complexities, e.g., stress localization and ramp development during orogenesis. The surficial expression of these structures is difficult to delineate, though it is interpreted that the large-scale anticlinorium and imbricated thrust sheets present at Trenton Canyon formed in response to a basement cored irregularity where stress localized during the emplacement of the Antler allochthon. Later, Cenozoic extension inherited the architecture of the anticlinorium forming a horst-block, i.e., sets of west and east dipping faults along the strike length of the deposit. The anticlinorium and overprinting horst-block has an inherent control on mineralization. Understanding the structural style and geometry of the lateral and frontal ramps is critical, as the frontal ramp domains are likely to have undergone greater structural preparation, thereby enhancing permeability and providing preferential pathways for mineralizing fluids. Detailed understanding of the internal stratigraphy of the Battle Formation was critical in demonstrating syn-depositional extension accommodated along NW- and NE- to E–W-trending fault systems..
Expressions of deformation related to the Antler orogeny include tight F1 folds and internal Valmy Formation thrust faults. In addition, thrust faults exposed on surface at Trenton Canyon demonstrate the imbricated nature of Cambro-Ordovician rocks interpreted to have formed in quiescent and high energy depositional environments.
Following Antler orogenesis, deposition of the Antler overlap sequence occurred in extensional basins along the Antler Highlands. Understanding the internal stratigraphy of the Battle Formation was instrumental in demonstrating syn-depositional extension along a NW- and NE- to east-west trending fault system. These Pennsylvanian-age faults preserve proximal growth stratigraphy of the lower Battle Formation subunits and are onlapped by the upper units. The NW and NE Paleozoic fault system documented at Trenton Canyon displays a complex array of NE to EW transfer zones (or relay faults) connecting the long NW grain. This complexity in the fault system lends to increased clastic sedimentation at transfer zones. Due to the fault-tip propagation style of growth stratigraphy displayed in the lower subunits, this fault set is interpreted to be deep-seated and potentially linked to older basement-cored architectures. The NW long-grain and east-west short-grain are typically gold mineralized, with grade enhancement at intersections with the Eocene NNE fault set (described below).
| 6-24 | |
| SSR Mining Inc. | Marigold Complex | October 9, 2026 |
| S-K 1300 Technical Report Summary | SLR Project No.: 138.020810.00001 |
Quasi-contemporaneous with deposition of Antler sequence rocks, Havallah sequence rocks formed in the Havallah basin to the west of the Antler highlands. The Sonoma Orogeny structurally juxtaposed the Havallah sequence east over the Antler overlap sequence and lower Paleozoic assemblages along the Golconda thrust. Two major Sonoma aged thrust faults are recognized at Trenton Canyon, as well as multiple internal thrusts and folds. The structurally lowest thrust is the Golconda thrust. The Golconda thrust juxtaposes siltstones and gritstones on top of the Antler Sequence (Battle Formation and Antler Peak LS Formation). The Willow Creek thrust forms a structurally higher plate, emplacing a deeper-water succession of green-brown chert and siltstone over the underlying siltstone-gritstone succession. The Willow Creek thrust coalesces with the Golconda thrust to the south where the siltstone/gritstone unit is structurally removed and the chert/siltstone package is in contact with the Antler Peak Limestone.
Cretaceous contractional deformation is interpreted to be recorded by a set of north- trending upright and open folds. Felsic dikes (NW- trending) and stocks intrude the Battle Mountains at approximately 98 Ma. It is uncertain whether this igneous event is due to the advancing flat subducting Farallon slab during the Sevier-Laramide orogenies, or if the retro-arc was undergoing extension which introduced peraluminous magmas into the middle crust.
A major N-S to NNE- SSW fault set at Trenton Canyon is thought to be related to early Eocene extension. These faults switch polarity from west to east dipping and inherit their architecture from deformation attributed to the Antler orogeny. The result of this extension is the formation of a horst block throughout the project area. The most notable N-NNE- trending fault at Trenton Canyon is the Windy Ridge fault system that hosts economic gold mineralization in the historical West Pit. This fault set is occupied locally by Eocene intrusions.
Post mineral faulting is best demonstrated by the Oyarbide Fault and associated parallel faults. These structures trend NE–SW and clearly record a younger phase of displacement, evidenced by the development of topographic facets and offsets to mineralization. Although the most recent fault movement post-dates gold mineralization, the fault system likely records multiple phases of deformation and appears to be influenced by deeper basement architecture, with both directly demonstrated and inferred structural connections to basement faults.
Blasthole patterns indicate gold mineralization in the previously mined South and West pits was localized where principal faults branch into antithetic and synthetic splays and relays. Enhanced permeability related to curvature of horsetail structures promoted gold mineralization (Rhys, 2022; internal communication).
Folding
The first generation (F1) of folding observed in the Battle Mountains is a set of tight to isoclinal overturned folds with short wavelengths and high amplitudes, that trend NW-SE to NNW-SSE. This fold set is recording allochthonous deformation of upper-plate siliciclastic rocks along the Roberts Mountains Thrust (RMT) during the Antler orogeny. F1 folds primarily deform Valmy Formation chert, argillite, and quartzite; but is not limited to upper-plate rocks. RMT equivalent thrust faults in the area demonstrate a complex nature of imbricated panels that deform earlier thrust faults and lower-plate rocks.
| 6-25 | |
| SSR Mining Inc. | Marigold Complex | October 9, 2026 |
| S-K 1300 Technical Report Summary | SLR Project No.: 138.020810.00001 |
The second generation (F2) of folding observed is an open and upright set of folds that trend 250° to 300° and plunge very shallowly. F2 folds are best observed in the Basalt pit but are documented across Marigold and Trenton Canyon. Intersections of F2 hinge lines with F1 hinge lines form type-1 fold interference patterns, or domes and basins. This style of fold interference has led to significant ground preparation of the area and controls the distribution of mineralization. F2 is not observed in the Antler overlap sequence rocks. Therefore, it is interpreted that F2 is time equivalent with F1 and formed in response to the development of lateral thrust ramps during the Antler orogenesis.
The third generation (F3) of folding documented is a set of tight to isoclinal, overturned and recumbent folds that trend approximately north-south. This set is restricted to allochthonous Havallah sequence rocks emplaced during the Sonoma Orogeny. This deformation event had very little effect on autochthonous rocks below the Golconda Thrust.
The fourth generation (F4) of folding is observed on a much larger scale. This folding event formed a set of open broad and upright folds that trend approximately N-NW to S-SW. F4 folds deform the entire rock package present at Marigold and Trenton Canyon on a Mountain Range scale. This deformation event is interpreted to be related to Mesozoic tectonics during the Sevier and Laramide orogeneses, though timing constraints are poor.
| 6.3.3.3 | Property Mineralization |
A Cretaceous base metal mineralization event, interpreted to be associated with emplacement of the Trenton Canyon stock, is characterized by a sulfide association of pyrrhotite, chalcopyrite, and pyrite in unoxidized samples, and a gangue association of tremolite, calcite, muscovite, diopside, and garnet. This event pre-dates Eocene gold mineralization at Trenton Canyon, which is characterized by a sulfide association of auriferous arsenic-bearing iron sulfides and argentiferous tennantite, and a gangue association of quartz, carbonate, phyllosilicates, clays, carbon, and stibnite.
Gold mineralization at the South, West, and East pit areas is primarily hosted in a network of transtensional faults locally intruded by Eocene dikes and sills. Hydrothermal and/or phreatomagmatic breccias within these structures typically contain increased concentrations of gold. Gold mineralization is strongly structurally controlled, although a narrow, several-meter-wide halo of lower-grade disseminated mineralization may be present adjacent to the mineralized structures. Quartz veins, illite, iron oxides, and iron hydroxides (goethite) are the primary indicators of gold mineralization where oxidized.
At Cottonwood Ridge there is a complex interplay of stratigraphic control, intrusive influence, and structure that localizes mineralization. Relay Ridge mineralization is primarily strata bound but hosted close to the intersection with the regional scale Oyarbide and Havallah West faults, which likely played a role in enhancing permeability. Oxidation boundaries at Trenton Canyon are complex and influenced by structure-induced permeability. The inherently low permeability of the Valmy formation results in a relatively shallow supergene phreatic oxidation/reduction boundary; however, secondary permeability created by faulting enables oxidation at depth. Figure 6-11 is a cross section through Trenton Canyon showing the interplay of faulting, intrusives, mineralization, and oxidation.
| 6-26 | |
| SSR Mining Inc. | Marigold Complex | October 9, 2026 |
| S-K 1300 Technical Report Summary | SLR Project No.: 138.020810.00001 |
| Figure 6-11: | Schematic Cross Section through Trenton Canyon |
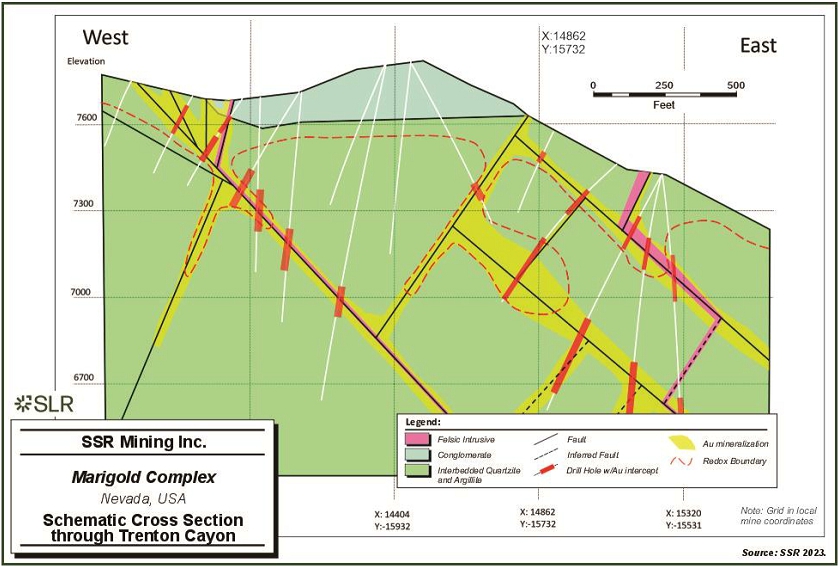
| 6-27 | |
| SSR Mining Inc. | Marigold Complex | October 9, 2026 |
| S-K 1300 Technical Report Summary | SLR Project No.: 138.020810.00001 |
| 6.3.3.4 | Property Alteration |
The dominant forms of alteration observed at Trenton Canyon represent both metasomatic (calc-silicate) and isochemical (hornfels) processes associated with the contact aureole of the Cretaceous Trenton Canyon stock. Alteration related to the Eocene hydrothermal system locally overprinted the calc-silicate and hornfels assemblages.
Alteration associated with gold mineralization is well constrained to fault zones, intrusions, and intrusion margins. Silicification in the form of drusy quartz, quartz stockwork veins and veinlets is present within and around fault zones. Iron oxides and hydroxides, including goethite, hematite, and limonite, as well as clays (illite, kaolinite) are associated with these veins. Eocene dikes are quartz, sericite, pyrite (QSP) altered in the deposit area and often have Liesegang banding where oxidized.
| 6.4 | Deposit Type |
Doebrich and Theodore (1996), Theodore (1998), and Theodore (2000) described the deposits at Marigold as distal disseminated silver–gold deposits. These deposits are disseminated equivalents of polymetallic vein deposits, characterized by a geochemical signature that includes silver, gold, lead, manganese, zinc, copper, antimony, arsenic, mercury, and tellurium (Cox and Singer 1990). Typically, they contain substantially more silver relative to gold than other types of disseminated gold deposits and may feature supergene enrichment of silver if significantly oxidized.
In Nevada, distal disseminated silver–gold deposits are proximal to Jurassic, Cretaceous, and mid-Tertiary granitoid intrusions (Hofstra and Cline 2000). A fundamental requirement of the distal disseminated silver–gold model necessitates a genetic link between silver–gold mineralization and causative intrusions (Hofstra and Cline 2000); however, no such relationship has been conclusively demonstrated at Marigold (Fithian 2015).
A Carlin-type gold deposit (CTGD) is a unique type of disseminated, sedimentary rock-hosted gold deposit. The genesis of CTGDs is currently not well understood. In Nevada, CTGDs occur along several main mineralization trends, including the Carlin trend and Battle Mountain-Eureka trend, and are primarily hosted by silty carbonate rocks.
Gold in a CTGD occurs in arsenian pyrite rims on pyrite grains and is associated with arsenic, sulfur, antimony, mercury, and thallium (Cline et al. 2005). There is considerable debate regarding the source of gold in CTGDs. Leading theories include a magmatic-hydrothermal origin (e.g., Sillitoe and Bonham 1990; Johnston and Ressel 2004; Ressel and Henry 2006; Muntean et al. 2011) and gold sourced from the sedimentary host package (e.g., Ilchik and Barton 1997; Emsbo et al. 2003; Large et al. 2011). Even though the genesis of CTGDs remains enigmatic, there is consensus that all CTGDs in Nevada formed during the Eocene period (42 to 36 Ma) (Cline et al. 2005).
Distal disseminated silver–gold deposits may share similarities with CTGDs, including orebody morphology, structural setting, and alteration styles, but drastically differ with respect to alteration zonation, geochemical signature, hypogene mineralogy, and endowment. Distal disseminated silver–gold deposits show a more definitive magmatic signature than CTGDs that includes zoning of alteration relative to felsic hypabyssal intrusions, base metal enrichment, significantly higher Ag/Au ratios, and distinctive hypogene ore mineralogy (e.g., base metal sulfides, native gold and silver, electrum, silver sulfides, and silver sulfosalts; Cox and Singer 1990, Cox 1992, Hofstra and Cline 2000), and are typically much smaller in terms of gold endowment.
| 6-28 | |
| SSR Mining Inc. | Marigold Complex | October 9, 2026 |
| S-K 1300 Technical Report Summary | SLR Project No.: 138.020810.00001 |
There is increasing support for a model that proposes a continuum between CTGDs, distal disseminated silver–gold deposits, and epithermal deposits. This model implies a magmatic source for heat and metal. Marigold and Trenton Canyon show characteristics closer to the CTGD endmember, and Buffalo Valley shows characteristics closer to the distal disseminated silver-gold endmember.
Figure 6-12 is a diagrammatic representation of the deposit model.
| Figure 6-12: | Model Illustrating Inferred Processes Related to Formation of Carlin-Type Gold Deposits (CTGD) and Distal Disseminated Silver–Gold Deposits |
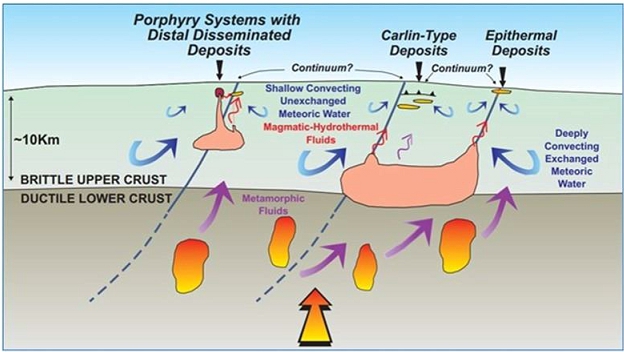
Source: Muntean and Cline 2018
| 6-29 | |
| SSR Mining Inc. | Marigold Complex | October 9, 2026 |
| S-K 1300 Technical Report Summary | SLR Project No.: 138.020810.00001 |
| 7.0 | Exploration |
Since acquiring the Property in April 2014, SSR has conducted several surface exploration programs, including soil sampling and geophysics, as summarized in Table 7-1.
| Table 7-1: | Summary of Exploration Completed by SSR |
| Year | Property | Company | Exploration Type |
Details |
| 2014 | Marigold | SSR | Geophysics | Magee Geophysical Services LLC conducted field data collection. The gravity measurements were collected from 1,358 stations using two LaCoste and Romberg Model-G gravity meters at a grid spacing of 150 m x 150 m. (Magee, 2014). J. L. Wright Geophysics processed and interpreted the data. |
| 2016 | Marigold | SSR | Geophysics | Gravity survey conducted by Magee Geophysical Services LLC. A total of 1,806 stations were acquired on a 150 m square grid and a 150 m x 300 m staggered grid. Relative gravity measurements were made with LaCoste and Romberg Model-G gravity meters. Topographic surveys were performed with Trimble Real-Time Kinematic (RTK) and Fast-Static GPS. (Magee, 2016). J. L. Wright Geophysics processed and interpreted the data. |
| 2020 | Marigold and Trenton Canyon | SSR | Geophysics | Two reflection seismic lines covering 16.9 km. The lines were surveyed by Riolada Surveying LLC, and Xtreme Drilling completed the shot holes. Bird Seismic acquired the data, and processing was completed by SubTerraSeis and Wright Geophysics. |
| 2021 | Trenton Canyon | SSR | Geophysics / Soil Samples | In 2021, a proprietary airborne hyperspectral dataset was acquired with district-scale coverage. This dataset includes mineral maps generated from short and long-wave infrared sources. A soil sampling program was completed by North American Exploration on behalf of SSR Mining, consisting of 3,284 soil samples covering 14.5 km2 of mountainous terrain predominantly east of the previously mined pits at Trenton Canyon. |
| 2023 | Buffalo Valley, Trenton Canyon, and Marigold | SSR | Geophysics | EarthEx completed a UAV-borne magnetic survey of the Buffalo Valley, North Peak, and New Millenium areas. The project encompassed 3,324.7 line-km at 25 m line spacing and 250 m tie line spacing with mean terrain clearance of 20 m |
| 7-1 | |
| SSR Mining Inc. | Marigold Complex | October 9, 2026 |
| S-K 1300 Technical Report Summary | SLR Project No.: 138.020810.00001 |
| Year | Property | Company | Exploration Type |
Details |
| 2024 | Buffalo Valley and Marigold | SSR | Geophysics | Magee Geophysical Services LLC conducted the field data collection for an infill ground gravity survey. Four LaCoste & Romberg Model-G gravity meters with a resolution of 0.01 mGal were used to complete the survey. In total, 3,429 stations were added to the dataset. Data was combined with historic survey data and processed by Terra Resources to produce merged gravity and magnetic surveys across the property. |
| 2024 | Buffalo Valley and Marigold | SSR | Geophysics | CSAMT measurements were acquired by Zonge International on 17 lines, for a total of 56.8 line kilometers of data coverage. Four transmitter dipoles were deployed to cover the survey area, using a scalar array of four electric-field dipoles and a magnetic-field antenna located at the center. The dipole length (spacing) was 50 m, and data were acquired from 1 to 8,192 Hz for each receiver spread. Terra Resources processed and interpreted the data. |
| 2025 | Marigold | SSR | Soil Samples | 387 soil samples in the northern part of the Marigold property on a 100 m x 100 m offset grid. |
| 7.1 | Geophysical and Geochemical Surveys |
| 7.1.1 | Gravity |
| 7.1.1.1 | 2016 |
After finalizing the purchase of Valmy in 2015 (additional Newmont-owned land to the east and west of the previous land boundary), SSR in 2016 expanded the geophysical gravity survey to include this new ground, resulting in a total of 1,806 additional gravity stations collected on variable station spacing on a 150 m square grid and a 150 m x 300 m staggered grid. The purpose of the survey was to assist in delineation of structures in the area in conjunction with geologic mapping and exploration drilling.
| 7.1.1.2 | 2019 |
The acquisition of Buffalo Valley and Trenton Canyon from Newmont in 2019 resulted in the addition of 952 gravity stations to the Marigold database.
| 7.1.1.3 | 2020 |
In 2020, 766 gravity stations were acquired by Magee Geophysical Services on a 122 m x 244 m grid at Trenton Canyon. Relative gravity measurements were made with LaCoste & Romberg Model-G gravity meters. Topographic surveying was performed with Trimble (RTK) and Fast-Static GPS. The gravity survey is tied to the US Department of Defense gravity base Battle Mountain (DoD reference number 2344-2) via an intermediate base established on the property.
| 7-2 | |
| SSR Mining Inc. | Marigold Complex | October 9, 2026 |
| S-K 1300 Technical Report Summary | SLR Project No.: 138.020810.00001 |
The Marigold gravity database now contains a total of 6,665 stations.
| 7.1.1.4 | 2024 |
The 2024 gravity survey was designed to infill gaps between prior surveys and collect data in areas not previously covered to compile a merged gravity data set across the entire Marigold property. The survey was completed on a 200 m x 200 m offset grid. In total 3,429 new gravity stations were acquired across the property. The merged data set was completed by MaGee Geophysical Services LLC and compiled the 2024 data with historical data sets collected between 1994 and 2020. Post processing was completed by Terra Resources to provide color maps of gravity features.
Gravity measurements were collected with LaCoste and Romberg Model-G gravity meters with topographic surveying completed with Trimble Real-Time Kinematic (RTK) and Fast-Static (FS) GPS units. Gravity data were post processed to complete Bouguer gravity (CBG).
| 7.1.2 | CSAMT (Controlled-Source Audio-frequency Magnetotellurics) |
| 7.1.2.1 | 2024 |
In 2024, CSAMT surveys were designed to infill gaps in the historic data to compile a merged data set across the Marigold property for 3D modeling. In total 56.8 line kilometers of data were collected on 50 m dipole spacing. Four transmitter dipoles were deployed to cover the survey area, using a scalar array of four electric-field dipoles and one magnetic field antenna located at the center. Data were acquired from 1-8192 Hz for each receiver spread.
| 7.1.3 | Seismic |
In August 2020, two reflection seismic lines were completed to assess the utility of reflection seismic for imaging structural and lithological domains in a challenging geological setting. The test program included two lines totaling approximately 16.9 line kilometers (line-km). The survey was conducted by Bird Seismic of Globe, Arizona, and processed by SubTerraSeis of Reno, Nevada. Results were finalized and interpreted by Wright Geophysics of Elko, Nevada.
| 7.1.4 | Soil Sampling |
In 2020, North American Exploration of Layton, Utah, was contracted to collect 3,284 soil samples covering approximately 14.5 km2 at Trenton Canyon.
In 2025, Rangefront Mining Services collected 387 soil samples in the northern part of the Property on a 100 m x 100 m offset grid.
| 7.1.5 | Drone-based Magnetic |
In 2022 and 2023, EarthEx Geophysical Solutions of Selkirk, Manitoba, was contracted to complete a drone-based magnetic survey over portions of Buffalo Valley, Trenton Canyon, and Marigold. Approximately 3,325 line-km were flown at a spacing of 25 m with a mean terrain clearance of 20 m. The purpose of the survey was to help delineate the structure and intrusions in the area.
| 7-3 | |
| SSR Mining Inc. | Marigold Complex | October 9, 2026 |
| S-K 1300 Technical Report Summary | SLR Project No.: 138.020810.00001 |
| 7.2 | Drilling |
Reverse Circulation (RC) and Core (Diamond Drilling-DD) drilling on the Property is the principal method of exploration and delineation of gold mineralization after initial targeting using soil sampling and geophysical surveys. Drilling can generally be conducted year-round on the Property.
As of the effective date of this TRS, SSR and its predecessor companies have completed over 2.6 million meters of drilling in 13,371 drill holes across the Marigold, Buffalo Valley, and Trenton Canyon areas, as summarized in Table 7-2, Table 7-3, and Table 7-4.
Exploration at the Property has focused on the following:
| · | Exploration drilling to expand Mineral Resources and Mineral Reserves through systematic step-out drilling. |
| · | Infill drilling to increase the confidence of Mineral Resource estimates, specifically targeting areas with widely spaced drilling (approximately 35 m to 50 m) and around drill holes drilled prior to 2006 with missing assays. |
| · | Drilling to confirm the final position of the pit highwall. |
| · | Defining mineralization at Trenton Canyon and Buffalo Valley. |
Since the last technical report (SLR 2024), 731 holes have been drilled (663 RC holes and 68 diamond core holes), totaling 157,220 m.
Figure 7-1 illustrates all drilling completed by year on the Property as of the effective date of this TRS.
| 7-4 | |
| SSR Mining Inc. | Marigold Complex | October 9, 2026 |
| S-K 1300 Technical Report Summary | SLR Project No.: 138.020810.00001 |
| Table 7-2: | Summary of Drilling at Marigold |
| Drilling Program |
Company | No.
of RC Holes |
RC Drilling (m) |
No.
of Diamond Holes |
Diamond Drilling (m) |
Total Holes |
Total Drilling (m) |
| 1968–1985 | Various exploration and mining groups | 126 | 7,037 | 126 | 7,037 | ||
| 1985–1999 | Cordex and Rayrock Mines | 2,350 | 333,325 | 8 | 2,176 | 2,358 | 335,501 |
| 1999–2006 | Glamis Gold | 2,498 | 484,619 | 8 | 2,030 | 2,506 | 486,649 |
| 2006–2013 | Goldcorp | 1,856 | 520,163 | 14 | 8,063 | 1,870 | 528,226 |
| 1968–2006 | Various1 | 852 | 108,326 | 15 | 1,037 | 867 | 109,363 |
| 2014 | SSR | 116 | 21,653 | 1 | 1,235 | 117 | 22,888 |
| 2015 | SSR | 171 | 39,070 | 4 | 4,270 | 175 | 43,340 |
| 2016 | SSR | 231 | 55,147 | 1 | 955 | 232 | 56,102 |
| 2017 | SSR | 188 | 54,814 | 1 | 1,128 | 189 | 55,942 |
| 2018 | SSR | 259 | 93,276 | 0 | 0 | 259 | 93,276 |
| 2019 | SSR | 183 | 63,629 | 25 | 10,265 | 208 | 73,893 |
| 2020 | SSR | 109 | 37,955 | 0 | 0 | 109 | 37,955 |
| 2021 | SSR | 150 | 52,579 | 6 | 1,636 | 156 | 52,214 |
| 2022 | SSR | 200 | 55,628 | 0 | 0 | 200 | 55,628 |
| 2023 | SSR | 185 | 40,038 | 14 | 3,302 | 199 | 43,340 |
| 2024 | SSR | 133 | 31,236 | 1 | 387 | 134 | 31,623 |
| 2025 | SSR | 138 | 34,154 | 24 | 5,285 | 162 | 39,439 |
| Q1 2026 | SSR | 51 | 13,162 | 4 | 1,108 | 55 | 14,270 |
| Total Drilling | 9,796 | 2,045,811 | 126 | 42,877 | 9,922 | 2,086,686 | |
Notes:
1. Newmont and other mining groups (Valmy property) | |||||||
| Table 7-3: | Summary of Drilling at Buffalo Valley |
| Drilling
Program |
Company | No.
of RC Holes |
RC
Drilling (m) |
No.
of Diamond Holes |
Diamond Drilling (m) |
Total Holes |
Total Drilling (m) |
| 1980–2011 | Newmont and other mining groups | 1,550 | 178,892 | 24 | 4,187 | 1,574 | 183,079 |
| 2019 | SSR | 0 | 0 | 0 | 0 | 0 | 0 |
| 2020 | SSR | 0 | 0 | 0 | 0 | 0 | 0 |
| 2021 | SSR | 0 | 0 | 3 | 837 | 3 | 837 |
| 2022 | SSR | 36 | 14,426 | 7 | 3,315 | 43 | 17,741 |
| 7-5 | |
| SSR Mining Inc. | Marigold Complex | October 9, 2026 |
| S-K 1300 Technical Report Summary | SLR Project No.: 138.020810.00001 |
| Drilling
Program |
Company | No.
of RC Holes |
RC
Drilling (m) |
No.
of Diamond Holes |
Diamond Drilling (m) |
Total Holes |
Total Drilling (m) |
| 2023 | SSR | 80 | 20,822 | 16 | 4,745 | 96 | 25,567 |
| 2024 | SSR | 104 | 16,887 | 13 | 2,884 | 117 | 19,771 |
| 2025 | SSR | 43 | 7,996 | 9 | 1,911 | 52 | 9,584 |
| 2026 H1 | SSR | 28 | 2,462 | 3 | 594 | 31 | 3,056 |
| Total Drilling | 1,841 | 241,485 | 75 | 18,473 | 1,916 | 259,635 |
| Table 7-4: | Summary of Drilling at Trenton Canyon |
| Drilling Program |
Company | No.
of RC Holes |
RC Drilling (m) |
No.
of Diamond Holes |
Diamond Drilling (m) |
Total Holes |
Total Drilling (m) |
| 1991–2011 | Newmont
and other mining groups |
1,143 | 152,792 | 6 | 909 | 1,149 | 153,701 |
| 2019 | SSR | 64 | 19,112 | 0 | 0 | 64 | 19,112 |
| 2020 | SSR | 97 | 28,840 | 7 | 5,902 | 104 | 34,742 |
| 2021 | SSR | 86 | 24,844 | 3 | 1,518 | 89 | 26,362 |
| 2022 | SSR | 64 | 18,983 | 10 | 3,984 | 74 | 22,967 |
| 2023 | SSR | 37 | 8,232 | 6 | 1442 | 43 | 9,674 |
| 2024 | SSR | 10 | 2,931 | 0 | 0 | 10 | 2,931 |
| Total Drilling | 1,501 | 255,734 | 32 | 13,755 | 1,533 | 269,489 |
| 7-6 | |
| SSR Mining Inc. | Marigold Complex | October 9, 2026 |
| S-K 1300 Technical Report Summary | SLR Project No.: 138.020810.00001 |
| Figure 7-1: | Plan View of All Drilling to End of May 2026 |
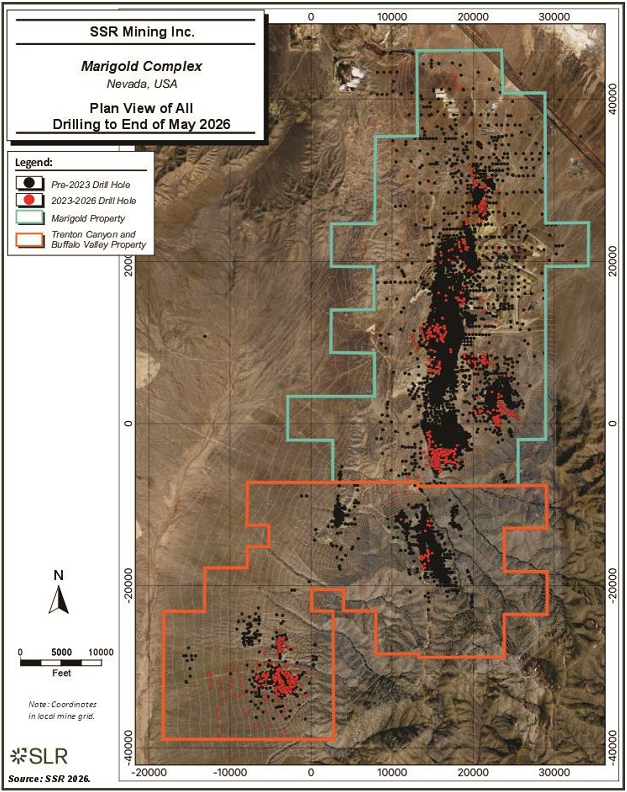
| 7-7 | |
| SSR Mining Inc. | Marigold Complex | October 9, 2026 |
| S-K 1300 Technical Report Summary | SLR Project No.: 138.020810.00001 |
| 7.2.1 | QP Opinion |
The SLR QP is of the opinion that the drilling and sampling procedures adopted at Marigold are consistent with generally recognized industry best practices. The resultant drilling pattern is sufficiently dense to interpret the geometry and the boundaries of gold mineralization with confidence. The reverse circulation (RC) samples were collected by trained personnel using procedures meeting generally accepted industry best practices. The process was conducted or supervised by suitably qualified geologists.
The SLR QP is of the opinion that the samples are representative of the source materials, and there is no evidence that the sampling process introduced a bias. Accordingly, there are no known sampling or recovery factors that could materially impact the accuracy and reliability of drilling results.
| 7-8 | |
| SSR Mining Inc. | Marigold Complex | October 9, 2026 |
| S-K 1300 Technical Report Summary | SLR Project No.: 138.020810.00001 |
| 8.0 | Sample Preparation, Analyses, and Security |
Exploration activities conducted by three companies between 1985 and 2013 have contributed to most assays in the Marigold database. Sampling and analytical procedures for this period are known and documented, and it can be assumed that analytical information acquired prior to 1985 will not affect the current Mineral Resources, since these sampled volumes collected prior to 1985 have been mined out.
Most of the samples that inform the resource database were generated from RC drill cuttings. In general, the process for collecting RC samples has changed very little since 1985; however, over time, numerous improvements have been made in sample preparation, security, and analysis. As an operating mine, Marigold generally follows and continues to follow industry best practice standards.
At the Property, there is an extensive sample storage facility that preserves raw sample material supporting the resource database. Most of the laboratory pulp reject (since 1987), coarse reject (since 2006), and split diamond drill core are cataloged and stored securely in shipping containers on the Property.
A detailed account of the pre-2014 sampling and analytical protocols is described in Silver Standard (2014). The following sections in this TRS have been derived, updated, and, in some instances, extracted from documentation from OreWin (2022) and standard operating procedures (SOPs) supplied to SLR by SSR for review and audit.
| 8.1 | Sample Preparation and Analysis |
A summary of historical analytical methods and assay results that comprise the Marigold database is presented in Table 8-1. Except for the Marigold, Pinson, and Dee Mine site laboratories, all laboratories listed in Table 8-1 are commercial laboratories that were independent from SSR.
Until the end of 1999, fire assay (FA) with gravimetric finish was the preferred analytical method for determining gold in samples. Since then, all samples have been subjected to first-pass gold cyanide solution (CN) assay; if results were greater than 0.17 g/t Au, samples were also subjected to either FA determination with gravimetric finish at the on-site Marigold mine laboratory or FA with atomic absorption (AA) finish and FA with gravimetric finish for over-limits at commercial laboratories.
All the Newmont-provided samples used to populate the Valmy area resource database were assayed at various commercial laboratories. The preferred assay method was FA with AA spectroscopy finish, followed by gold cyanide solution assay on select samples within the mineralized zone.
| 8-1 | |
| SSR Mining Inc. | Marigold Complex | October 9, 2026 |
| S-K 1300 Technical Report Summary | SLR Project No.: 138.020810.00001 |
Since 2014, all exploration samples from Marigold have been analyzed at American Assay Laboratories (AAL), an ISO 17025 certified facility in Sparks, Nevada. AAL is independent from SSR. All samples are subjected to first pass FA determination with an AA finish and FA with a gravimetric finish for over-limits. This is followed by a gold cyanide solution assay with an AA finish for samples with FA values greater than or equal to 0.03 g/t Au. In 2019 and 2020, Marigold Mine submitted drill samples to Paragon Geochemical Laboratories, a privately held corporation located in Sparks, Nevada. The analytical procedures utilized are ISO/IEC 17025:2017-accredited and ISO 9001:2015-certified. Samples were prepared under strictly controlled processes, and 30g aliquots were fire assayed with lead collection. The analytical determinations were with aqua regia digestion and inductively coupled plasma (ICP) – optical emission spectroscopy (OES) analysis (Au-OES30). Results greater than 8 g/t were fire-assayed with a gravimetric finish (Au-GR30). Quality control utilizes layers of embedded indicators that are monitored during operations and used for final certification. Paragon is independent of SSR.
| 8-2 | |
| SSR Mining Inc. | Marigold Complex | October 9, 2026 |
| S-K 1300 Technical Report Summary | SLR Project No.: 138.020810.00001 |
| Table 8-1: | Analytical Methods for Gold for the Marigold Assay Resource Database |
| Period | Laboratory | Preparation | Analytical Method | Reported DL (Au g/t) |
| 1985–1989 | Pinson or Dee Mine site labs | Undocumented | 30 g FA, gravimetric finish | 0.17 |
| 1990–1999 | Pinson or Dee Mine site labs or Inspectorate Labs | Undocumented | 30 g FA, gravimetric finish | 0.17 |
| 1980-2010
(Buffalo Valley Historic) |
Multiple Laboratories | Undocumented | 30 g FA, AA finish, and/or 15 g CN assay on select samples | Unknown |
| 1987–1998
(Valmy + Trenton Canyon) |
Barringer Laboratories | Undocumented | 30 g FA, AA finish 15 g cyanide gold (CN) assay on select samples | FA: 0.17 |
| CN assay: 0.17 | ||||
| X-Ray Assay Laboratories | Undocumented | 30 g FA, gravimetric finish 15 g CN assay on select samples | FA: 0.03 | |
| CN assay: 0.03 | ||||
| Rocky Mountain Geochemical Nevada | Undocumented | 30 g FA, gravimetric finish 15 g CN assay on select samples | FA (AA): 0.03–0.003 | |
| CN assay: 0.03 | ||||
| Chemex Labs Ltd. | Undocumented | 15 g FA, AA finish 30 g FA, gravimetric finish 15 g CN assay on select samples | FA (AA): 0.06–0.003 | |
| CN assay: 0.03 | ||||
| 2000–2004
(Valmy + Trenton Canyon) |
Chemex Labs Ltd. | Dry, crush, and riffle split for pulverizing; pulverize to 100 µ | All samples 30 g FA, AA finish 15 g CN assay on select samples | FA (AA): 0.01 |
| CN assay: 0.03 | ||||
| 2000–2006 | Marigold Mine laboratory | Dry 6–12 hr at 310°F; crush >95% –2 mm; riffle split to collect 250 g – 400 g for pulverizing; pulverize to >90% –75 µ | All samples 10 g CN assay, AA finish if CN assay >0.17 g/t, the 2nd pulp split at 30 g FA, gravimetric finish | 0.03 |
| American Assay or Inspectorate Labs | Dry 6–12 hr at 310°F; crush (using jaw and roll) >90% –2 mm; riffle split to collect 500–1,000 g for pulverizing; pulverize to >90% –100 µ | All samples 15 g CN assay, AA finish If CN assay >0.17 g/t, the 2nd pulp split at 30 g FA, AA finish over-limits by 30 g FA, gravimetric finish | 0.03 | |
| 2006–2013 | Marigold Mine laboratory | Dry 6–12 hr at 310°F; crush >95% –2 mm; riffle split to collect 250 g – 400 g for pulverizing; pulverize to >90% –75µ | All samples 10 g CN assay, AA finish. If the CN assay >0.17 g/t, the 2nd pulp split at 30 g FA, gravimetric finish | 0.03 |
| American Assay or Inspectorate Labs | Dry 6–12 hr at 310°F; crush (using jaw and roll) >90% –2 mm; riffle split to collect 500 g –1,000 g for pulverizing; pulverize to >90% –100µ | All samples 15 g CN assay, AA finish. If CN assay >0.17 g/t, the 2nd pulp split at 30 g FA, AA finish over-limits by 30 g FA, gravimetric finish | 0.03 |
| 8-3 | |
| SSR Mining Inc. | Marigold Complex | October 9, 2026 |
| S-K 1300 Technical Report Summary | SLR Project No.: 138.020810.00001 |
| Period | Laboratory | Preparation | Analytical Method | Reported DL (Au g/t) |
| 2014–2023 | American Assay Laboratories | Dry 6–12 hr at 310°F; crush (using jaw and roll) >90% –2 mm; riffle split to collect 500 g – 1,000 g for pulverizing; pulverize to >90% –100µ | All samples 30 g FA, AA finish over-limits by 30 g FA, gravimetric finish. If FA >0.03 g/t, the 2nd pulp split at 15 g CN assay, AA finish | FA: 0.003 |
| CN assay: 0.03 | ||||
| 2019-2020 | Paragon Laboratories | Dry – 6 to 12 hr at 310°F; crush (using jaw and roll) >90% minus 2 mm; riffle split to collect 500 g to 1,000 g for pulverizing; pulverize to >85% minus 75µ | All samples 30 g FA, AA finish Over-limits by 30 g FA, gravimetric finish. If FA >0.03 g/t, the 2nd pulp split at 15 g CN assay, AA finish | FA, 0.003 |
| CN assay, 0.03 | ||||
| 2023-2026 | American Assay Laboratories | Dry 6–24 hr at 185°F; crush (using jaw and roll) >70% –2 mm; riffle split to collect 250 g–300 g for pulverizing; pulverize to >85% –75µ | IO-FAAu30 – 30 g sample Au by fire assay and ICP-OES | FA: 0.003-10 |
| IO-CNAu215/AuCN15 – 15g sample to 30 mL of solution Au by cyanide leach with ICP-OES finish 15 g sample digested for 2 hours using 0.3% NaCN and 0.3% NaOH solution | CN assay: 0.01-100 | |||
| ALS – Only Pulp re-assays | Au-ICP21 – 30g sample Au by fire assay and ICP-AES | FA: 0.001-10; | ||
| Au-AA13 – 30g sample Au by cyanide leach with AAS finish 30g sample is added to a closed vessel and agitated for 1 hour 0.25% NaCN/0.05% NaOH | CN assay: 0.03-50 | |||
| Notes: DL = Detection Limit | ||||
| 8-4 | |
| SSR Mining Inc. | Marigold Complex | October 9, 2026 |
| S-K 1300 Technical Report Summary | SLR Project No.: 138.020810.00001 |
| 8.2 | Quality Assurance and Quality Control |
Quality assurance (QA) consists of evidence to demonstrate that the assay data have precision and accuracy within generally accepted limits for the sampling and analytical method(s) used in order to have confidence in a resource estimate. Quality control (QC) consists of procedures used to ensure an adequate level of quality throughout the collection, preparation, and assay of exploration drilling samples. In general, QA/QC programs are designed to prevent or detect contamination and allow assaying (analytical), precision (repeatability), and accuracy to be quantified. In addition, a QA/QC program can disclose the overall sampling-assaying variability of the sampling method itself.
| 8.2.1 | QA/QC Procedures Pre-2014 |
| 8.2.1.1 | Historical Marigold Assay – Analysis of Low Detection Limit |
The oldest hole in the Marigold exploration database dates back to 1968. Over time, QA procedures for the drill hole database have been inconsistent with current industry standards and best practices.
The lower detection limit for cyanide-soluble gold assays has changed over time as the ROM cut-off grade has been reduced. Prior to 2009, assay values below detection were entered into the database as 0.0 oz/t. This data artifact underrepresented the mineralized volume of the Mineral Resources estimate in the low-grade range of the analytical distribution and contributed to the positive reconciliation experienced at Marigold.
Because the historical QA/QC procedures at Marigold did not meet current-day best practices, the issue of below-detection-limit analyses in the database was addressed through a systematic assay program implemented by SSR in 2015 and 2016 (the Assay Program). SSR selected a spatial and temporal representation of samples from the well-preserved drill hole sample pulps (from the years 1987 to 2013) stored at Marigold. A total of 1,974 samples collected between 1987 and 2003 were re-assayed for FA with AA finish and gravimetric finish analysis at the ISO 17025-certified AAL facility in Sparks, Nevada. Drill hole sample pulp material was not available for the period 1968 to 1987.
Of these 1,974 assay pairs, 1,029 samples were below the as-mined topography and within the mineralized envelopes. This represents 12% of samples within the mineralized envelope and below the previously estimated mined-out topography, which was set at 0.0 troy ounce per short ton (opt) or deemed waste. The assay results for both finishes were compared, and the results are presented in Figure 8-1 and Figure 8-2. The scatter in the data is acceptable (R2 = 0.9982), and the reduced major axis (RMA) regression indicates a bias of 3.7% for all assay pairs below the mined-out topography.
| 8-5 | |
| SSR Mining Inc. | Marigold Complex | October 9, 2026 |
| S-K 1300 Technical Report Summary | SLR Project No.: 138.020810.00001 |
| Figure 8-1: | Scatter Plot Between FA Gold Values with AA Finish and Gravimetric Finish |
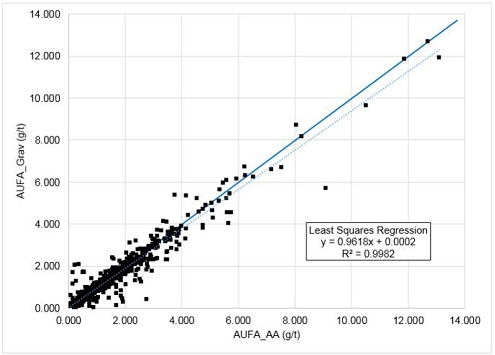
Source: SSR 2023
| Figure 8-2: | Q-Q Plot between FA Gold Values with AA Finish and Gravimetric Finish |
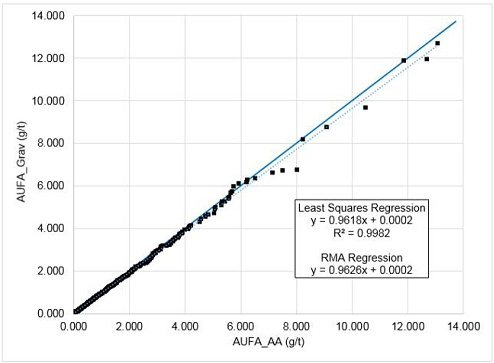
Source: SSR 2023
| 8-6 | |
| SSR Mining Inc. | Marigold Complex | October 9, 2026 |
| S-K 1300 Technical Report Summary | SLR Project No.: 138.020810.00001 |
Between 2015 and 2016, an Assay Program was carried out in which a total of 153,023 pulp samples from pre-2009 drill holes reporting a 0.0 opt gold cyanide soluble result and located within the reserve pits were recovered from storage and analyzed for gold at AAL. Certified standards and blanks were inserted into the pulp sample list at a rate of one standard in 20 samples and one blank in 50 samples. The samples were analyzed using a one assay ton (30 g) FA with an AA finish, followed by a gold cyanide solution assay with an AA finish for those samples that returned FA results of 0.03 g/t or greater.
| 8.2.1.2 | Valmy Property |
As at Marigold, the QA/QC procedures followed at the Valmy property between 1987 and 1998 did not meet current industry standards and best practices. Newmont began inserting certified standards in the sample stream in 2000. A total of three QC samples were used, but SSR was unable to evaluate the assay accuracy without the expected gold values for these samples.
Because the historical QA/QC procedures for the Valmy property did not meet current industry standards, SSR drilled 8 drill holes within a 200 m by 150 m resource block. A total of 11 historical drill holes were within the same block. The cross-section comparing the SSR drilling to the historical drilling is presented in Figure 8-3.
The cumulative normal distribution comparing the SSR drill composites to the composite from the historical drill holes is provided in Figure 8-4.
| 8-7 | |
| SSR Mining Inc. | Marigold Complex | October 9, 2026 |
| S-K 1300 Technical Report Summary | SLR Project No.: 138.020810.00001 |
| Figure 8-3: | Cross-Section with SSR Drill Holes and Historical Drill Holes Along Section 8000N |
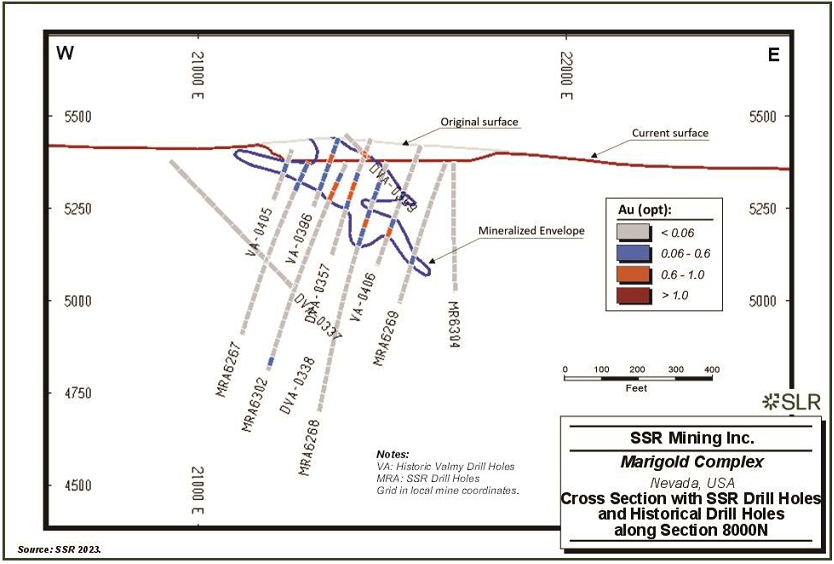
| 8-8 | |
| SSR Mining Inc. | Marigold Complex | October 9, 2026 |
| S-K 1300 Technical Report Summary | SLR Project No.: 138.020810.00001 |
| Figure 8-4: | Cumulative Normal Distribution Comparing Composites from SSR Drilling and Historical Drilling |
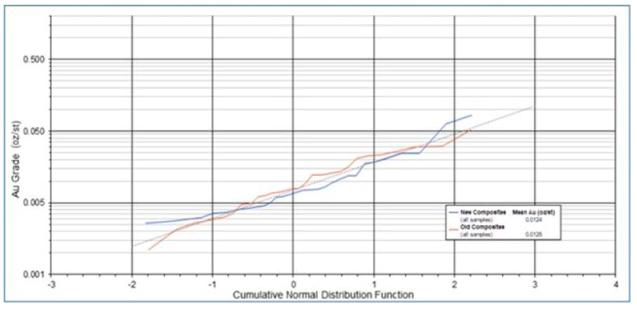
Source: SSR 2018
The nearest-neighbor (NN) gold-grade model estimates were also compared with assay results from historical drilling and new drilling. To compare historical Newmont data with SSR data, two NN models were developed: one that estimated only assay results from the historical database, and the other that used only assay results from the SSR drill holes within the same mineralized envelope. The percentage difference between historical and SSR results was approximately less than 4% (Table 8-2).
| Table 8-2: | Comparison of Valmy Deposit NN Mean Gold Grades |
| Estimate | Mean
Gold Grade (g/t) |
| Nearest Neighbor with Historical Composites | 0.624 |
| Nearest Neighbor with SSR Composites | 0.600 |
SSR concluded that there was no systematic error or bias in the accuracy and precision of analytical assays under the historical sampling and assaying methodology compared to current practices, and that the assays are suitable for use in Mineral Resource estimation.
| 8.2.1.3 | Buffalo Valley Historical Data |
In 2011, before SSR’s acquisition of the Buffalo Valley property, AMEC Americas Ltd. (AMEC) conducted an audit of Newmont’s Buffalo Valley drill hole database and found good agreement between the database and the original data sources. The database was comprised of data from numerous drilling campaigns between 1980 and 2011, with drill holes from multiple campaigns selected for the audit. The drill hole data from Newmont was directly imported into SSR’s new Seequent MX Deposit (MX Deposit) database.
| 8-9 | |
| SSR Mining Inc. | Marigold Complex | October 9, 2026 |
| S-K 1300 Technical Report Summary | SLR Project No.: 138.020810.00001 |
| 8.2.2 | QA/QC Procedures 2014-2026 |
SSR’s QA/QC protocol involves the insertion of a certified reference material standard (CRM) every 20th sample, the insertion of a blank sample every 50th sample, the collection of field duplicates every 50th sample for RC holes, and the re-analysis of returned pulverized material at the original laboratory, as well as at an umpire laboratory. SSR’s protocol targets the total number of QA/QC samples, comprised of the above-mentioned sample types, to exceed 15% of the total number of original samples. To simplify plotting, results from 2014-2022 have been excluded from the following sections.
| 8.2.2.1 | Certified Standards |
Results from regular CRM submissions are used to identify issues with specific sample batches and laboratory biases.
Certified reference materials (CRMs) were used to evaluate the analytical accuracy and precision of AAL. CRMs were inserted every 20th sample, which represents 5% of the total samples submitted. Three different CRMs were used in any one submission. The CRMs were selected based on the cut-off grade and gold distribution at the Marigold mine:
| · | cut-off grade (0.1 g/t) |
| · | mean grade (0.45 g/t) |
| · | 90th percentile (2.3 g/t) |
Between 2023 and June 2026, eleven different CRMs, purchased from ROCKLABS, Geo Chem Laboratories, and OREAS were used. CRMs purchased from Ore Research & Exploration Pty Ltd. were used only for a short period in 2014. The CRMs were assigned sample numbers in sequence with their accompanying drill samples and inserted into the drill-sample stream. The list of CRMs used between 2023 and June 2026 is shown in Table 8-3.
Exploration personnel monitor assay results in real time and import the data into the Geology database. Internal validation checks in the database highlight any certified standard assay failures. For normally distributed data, 95% of the standard assay results are expected to lie within 2 standard deviations of the certified value. All samples outside the three-standard-deviation limits were considered failures. Failures trigger a re-run of five samples above and five samples below the failed standards, including the failed standard.
| 8-10 | |
| SSR Mining Inc. | Marigold Complex | October 9, 2026 |
| S-K 1300 Technical Report Summary | SLR Project No.: 138.020810.00001 |
| Table 8-3: | List of CRM Standards used between 2023 and June 2026 |
| CRM Standard | Years in Use | Expected
Gold Value (g/t) |
Standard
Deviation (g/t) |
No.
of Samples Assayed |
| OxB146 | 2023 | 0.132 | 0.006 | 204 |
| OxB186 | 2023–2026 | 0.121 | 0.003 | 925 |
| OxE166 | 2022–2026 | 0.652 | 0.016 | 792 |
| Oxi164 | 2023–2025 | 1.79 | 0.036 | 895 |
| Oxi177 | 2023–2026 | 1.811 | 0.037 | 247 |
| OREAS 235b | 2024 | 1.63 | 0.053 | 14 |
| OREAS 238b | 2024 | 3.08 | 0.085 | 11 |
| OREAS 264 | 2024 | 0.307 | 0.011 | 13 |
| Total Samples | 2,891 |
CRM Z-score assay values received from the lab are routinely plotted temporally to monitor potential analytical drift over time at the main laboratory (Figure 8-5).
| Figure 8-5: | Z-Scores of all CRM Results (2023 – June 2026) |
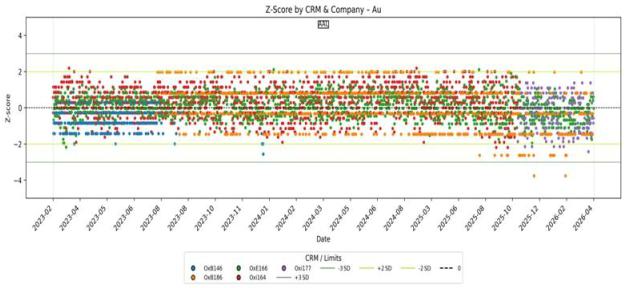
Source: SLR 2026
| 8-11 | |
| SSR Mining Inc. | Marigold Complex | October 9, 2026 |
| S-K 1300 Technical Report Summary | SLR Project No.: 138.020810.00001 |
| 8.2.2.2 | Field Duplicates |
Duplicate samples are used to monitor preparation, assay precision, and grade variability as a function of sample homogeneity and laboratory error.
Field duplicate samples were collected every 50th sample, and two sample bags marked “A” or “B” were provided to collect an original and a duplicate sample. The secondary sample was obtained from the secondary opening in the rotary sampler. Between 2023 and June 2026, 526 duplicate samples were collected and assayed. Absolute relative difference (ARD) was used to estimate precision; results are presented in Figure 8-6.
| Figure 8-6: | Field Duplicate HARD Plot for Fire Assay (AuFA) |
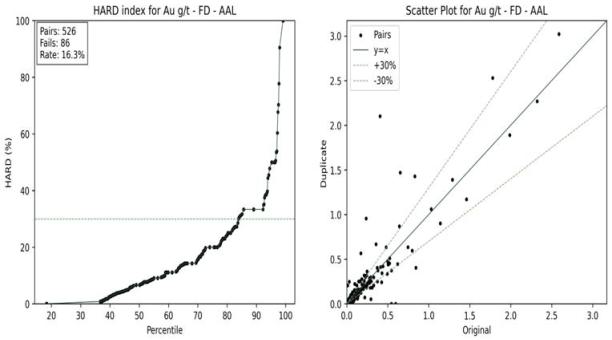
Source: SLR 2026
| 8.2.2.3 | Blanks |
Blank material is used to assess contamination or cross-contamination during sample preparation and to identify sample-numbering errors.
The blanks were similar in size to the RC samples and processed through the same crushing and pulverizing stages as the drill samples. The blank samples were placed in every 50 samples. Blank results exceeding 5 times the lower detection limit (LDL) were typically considered failures requiring further investigation and possible re-assaying of associated drill samples. The lower detection limit of AAL analyses is 0.0034 g/t, therefore blank samples assaying in excess of 0.017 g/t were considered to be failures.
Between 2023 and 2026, 1,904 blanks were inserted into the sample stream, with less than 1% resulting in failures. The protocol followed for failures was to re-prepare and assay five samples above and below the failures. The new assays were entered into the database for the samples. The assay results for the blank samples between January 2023 and May 2026, are shown in Figure 8-7.
| 8-12 | |
| SSR Mining Inc. | Marigold Complex | October 9, 2026 |
| S-K 1300 Technical Report Summary | SLR Project No.: 138.020810.00001 |
| Figure 8-7: | Blank Results (January 2023 – June 2026) |
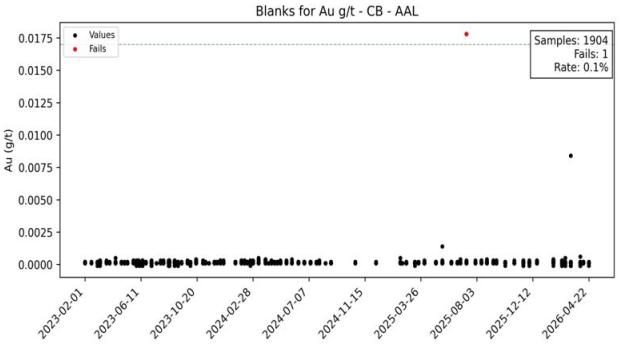
Source: SSR 2023.
| 8.2.2.4 | Re-Assay and Umpire Samples |
After completing original assays/analysis, the primary laboratory returns coarse rejects and pulverized material to Marigold for storage. From the pulverized material, analytical duplicates are selected for a re-assay (original lab), an umpire assay (second lab), or both. Samples are selected based on their original grade, such that the secondary assay results form a distribution representative of the grades seen at Marigold. Re-assays are sent back to the same laboratory that conducted the original assay and are used to monitor precision attributable to the analytical process. Since 2022, re-assays have been completed by American Assay Laboratories, whereas ALS has been used for umpire analysis.
Figure 8-8 shows a HARD plot of the re-assay samples for the period from 2023 through May 2026, comparing AAL and ALS.
| 8-13 | |
| SSR Mining Inc. | Marigold Complex | October 9, 2026 |
| S-K 1300 Technical Report Summary | SLR Project No.: 138.020810.00001 |
| Figure 8-8: | Umpire Analytical Duplicate HARD Plot for Fire Assay (AuFA) of Original vs. Umpire Results |
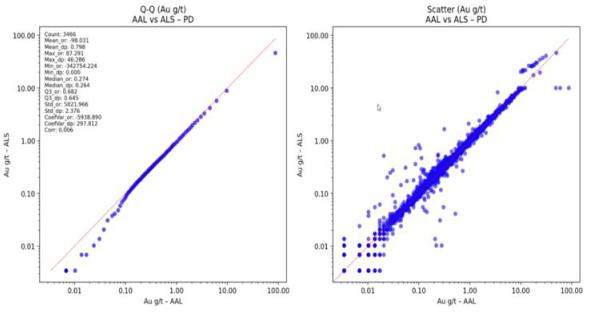
Source: SLR 2026.
| 8.3 | Sample Security |
| 8.3.1 | Sample Security until 2013 |
The bulk of the data in the Marigold resource assay database was for samples analyzed at the secure on-site Marigold mine laboratory. Samples shipped off-site were either delivered to the commercial lab by an MMC Exploration Department geologist or technician, or samples were collected from the mine by a laboratory employee. All samples were sent with a manifest listing the number of samples included in the shipment. Exploration personnel were unaware of any instances of tampering with samples either on-site or in transit to a laboratory.
| 8.3.2 | Sample Security Newmont Projects |
Newmont provided scanned copies of drillers’ logs, sample manifest sheets, and signed assay sheets from commercial laboratories and geologist logging sheets for all the drill holes that inform the resource database for the Valmy and Buffalo Valley properties. Based on the documented evidence, the likelihood of tampering with the samples either on-site or in transit was negligible.
| 8.3.3 | Security 2014–2026 |
All exploration samples were collected from the mine site by employees of the external laboratories (either AAL, Paragon, or ALS). All sample dispatches included a manifest listing the sample identifiers and the number of samples included in the shipment. AAL/Paragon electronically acknowledged receipt of the samples within 24 hours of physically reconciling them with the manifest. SSR exploration personnel are unaware of any instances of tampering with samples either on-site or in transit to a laboratory.
| 8-14 | |
| SSR Mining Inc. | Marigold Complex | October 9, 2026 |
| S-K 1300 Technical Report Summary | SLR Project No.: 138.020810.00001 |
| 8.4 | QP Opinion |
After review, the SLR QP’s opinion is that the sample preparation, security, and analytical procedures meet industry standards, and that the QA/QC program, as designed and implemented at Marigold, is in line with industry best practices. Based on data validation and the results of the standard, blank, and duplicate analyses, SLR believes that the assay and bulk density databases are of high quality and suitable for mineral resource estimation. SLR is not aware of any drilling, sampling, or recovery factors that could materially impact the accuracy and reliability of the results. Neither the SSR in-house quality control nor SSR predecessor’s quality control yielded any indication of quality concerns.
| 8-15 | |
| SSR Mining Inc. | Marigold Complex | October 9, 2026 |
| S-K 1300 Technical Report Summary | SLR Project No.: 138.020810.00001 |
| 9.0 | Data Verification |
Data verification is the process of confirming that data has been generated in accordance with proper procedures, transcribed accurately from its original source into the project database, and is suitable for use as described in this TRS.
SLR was not directly involved in the exploration drilling, logging, and sampling programs that formed the basis for collecting the data used to support the geological model and MRE for the Property.
| 9.1 | Marigold Database Migration |
Since publishing the 2022 TRS (OreWin 2022), all drill hole data have been migrated to an MX Deposit database and audited by the SLR QP for completeness and validity. Migrated data were extensively validated by SSR for errors or missing values, comparing old tables to the new. The new database was configured to streamline the collection, validation, and use of all data, maximizing efficiency and minimizing errors by limiting data handling and manual entry.
All new drill hole data collected after the migration, with the exception of lithology logging, were imported directly into the geological database without any keyboard input. Data validation was conducted after import, but before the locking and subsequent use of the data in any model, analysis, interpretation, etc. Geologic logging is done directly in the database, with data validation performed weekly.
The verification for the exploration data collected before SSR acquired Marigold includes the results of AMEC Americas Ltd.’s external review and data verification to identify any material issues with the database used to generate the Mineral Resource estimate.
SSR subsequently acquired the adjacent Valmy and Buffalo Valley properties, and the associated data was appended to the Marigold drill hole database.
The appended data for Valmy comprises collar, downhole survey, lithology, and assay information (provided in comma-delimited digital files) for 867 drill holes drilled by Newmont, Hecla, and Santa Fe Pacific Corp. Newmont provided this information in hardcopy or scanned versions of the originals, which were used to verify the database.
MMC’s exploration personnel manually checked the entire drill hole database against the original documents for data entry errors. Less than 1% of the drill holes had any issues, and these were subsequently corrected.
As an additional check, SSR acquired the chip trays for 687 drill holes, pulps from 57 drill holes, and sample rejects from 66 drill holes, of which 5% were reviewed for lithology and alteration. The original logging was deemed accurate and was used to construct the lithological models.
The collar positions of 43 Valmy drill holes were verified using differential GPS. Subsequent to AMEC’s 2011 audit of the Buffalo Valley drilling database, SSR verified the collar location of eight holes drilled by Newmont and one hole drilled by Fairmile that included a drill hole identification marker in the field. The results showed a maximum variance of 4 m in the X/Y planes (easting and northing) and <1 m in the Z dimension (elevation). This error shift is less than half the size of a resource model cell and is not material to any resulting estimate. The Valmy and Buffalo Valley data, as appended, were deemed accurate and precise, and appropriate for resource estimation purposes.
| 9-1 | |
| SSR Mining Inc. | Marigold Complex | October 9, 2026 |
| S-K 1300 Technical Report Summary | SLR Project No.: 138.020810.00001 |
For data collected after April 2014, the following verification steps were completed to support the estimation of Mineral Resources:
| · | The location of planned drill holes was compared to the location of as-built drill holes in real time. Regular field checks were completed on the drill and sampling systems. |
| · | Downhole survey intervals that encountered major deviations were reviewed and validated (AMEC, 2014). |
| · | Precision and accuracy of laboratory assay results were verified using a QA/QC program that followed an industry standard protocol using the blind insertion of blanks and certified standards. |
| · | The elevation of all surveyed drill hole collar coordinates was checked against the original/current/depleted topographic surface to identify any variations of more than one meter. No discrepancies were found. |
| · | Profiles of all mined-out pits, backfilled pits, and OBSA were cross-checked, updated annually, and incorporated into the current topography. |
Assay results for all drill holes are individually plotted and examined for cyclicity and decay, which are forms of downhole contamination. Any hole with confirmed contamination will have the contaminated samples removed from resource estimation.
| 9.1.1 | Data Verification Procedures |
SLR was provided with a digital drill hole database for the Property in a series of Microsoft Excel comma-delimited files (“CSV” format) and Seequent Leapfrog GEO digital files. The SLR QP used the information provided to validate the Mineral Resource interpolation, tonnage, grade, and classification.
As part of the data verification procedure, drill data was spot checked and audited by the SLR QP for completeness and validity using standard database validation tests. In addition, the SLR QP reviewed the QA/QC methods and results, verified assay certificates against the database assay table, and conducted one site visit, including a review of drill core. No limitations were placed on SLR’s data verification process. The review of the QA/QC program and results is presented in Section 8.0, Sample Preparation, Analyses, and Security.
The SLR QP performed the following digital queries. No significant issues were identified.
| · | Header table: searched for incorrect or duplicate collar coordinates and duplicate hole IDs. |
| · | Survey table: searched for duplicate entries, survey points past the specified maximum depth in the collar table, and abnormal dips and azimuths. |
| · | Core recovery table: searched for core recoveries greater than 100% or less than 80%, overlapping intervals, missing collar data, negative lengths, and data points past the specified maximum depth in the collar table. |
| · | Lithology: searched for duplicate entries, intervals past the specified maximum depth in the collar table, overlapping intervals, negative lengths, missing collar data, missing intervals, and incorrect logging codes. |
| 9.2 | QP Opinion |
The SLR QP was provided unlimited access for data verification purposes by SSR during this Mineral Resource estimate audit. The SLR QP is of the opinion that database verification procedures for Marigold comply with industry standards and are adequate for the purposes of Mineral Resource estimation.
| 9-2 | |
| SSR Mining Inc. | Marigold Complex | October 9, 2026 |
| S-K 1300 Technical Report Summary | SLR Project No.: 138.020810.00001 |
| 10.0 | Mineral Processing and Metallurgical Testing |
| 10.1 | Marigold |
When production began at Marigold in 1989, ore was processed primarily with a rod-and-ball-mill grinding circuit with gold recovery by carbon-in-leach (CIL). In March 1990, heap leaching commenced at Marigold. Since April 1999, all Marigold ore has been processed via truck dump, ROM heap leaching.
Cumulative gold production from the Marigold leach pad through April 2026 is equivalent to 72.7% recovery.
Gold production data from the leach pad operation provides the best information for predicting future processing recoveries because the ore type has been consistent since 1999. Gold recovery for future Marigold ore, including stockpile and leach pad inventory, is estimated to be 72.4% based on a review of historical assay and recovery data as well as metallurgical test work on future ore.
| 10.1.1 | Metallurgical Test Work |
The objectives of metallurgical testing activities at Marigold are to determine methods to improve gold recovery, to generate information to guide short and long-range production planning, to optimize reagent additions, and to minimize processing costs. The studies comprise both small column leach (25.4 cm diameter by 1.2 m high, with minus 51 mm ore) and standard bottle roll leach tests with P100 2 mm samples. Testing has been performed on a variety of Marigold ores, including representative pit samples taken by ore-control geologists, leach pad grab samples from mine production, and various pit blasthole drill cuttings. Bottle roll test work (at P100 2mm) has also been conducted on exploration reverse-circulation (RC) drill samples to determine the expected gold recovery from deposits that will be mined in the future.
Historical gold recovery versus gold grade results for all laboratory column tests are shown in Figure 10-1. In addition to column leach tests, bottle roll tests were completed on the same samples, crushed to P100 2 mm, to develop a correlation between column and bottle roll results. The relationship is shown in Figure 10-2. The use of bottle roll tests in place of column leach tests enables more metallurgical tests to be undertaken in a shorter time frame (i.e., days for bottle rolls versus months for columns).
| 10-1 | |
| SSR Mining Inc. | Marigold Complex | October 9, 2026 |
| S-K 1300 Technical Report Summary | SLR Project No.: 138.020810.00001 |
| Figure 10-1: | Column Test Results – Marigold |
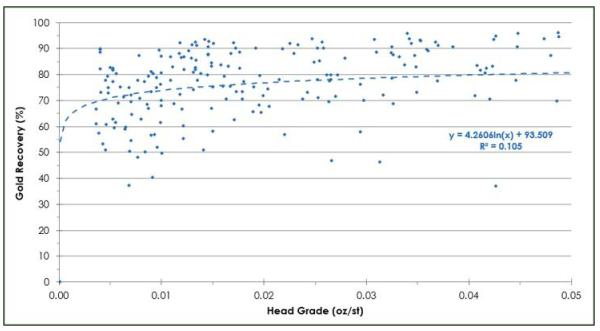
Source: SSR 2023
| Figure 10-2: | Bottle Roll vs. Column Recovery – Marigold |
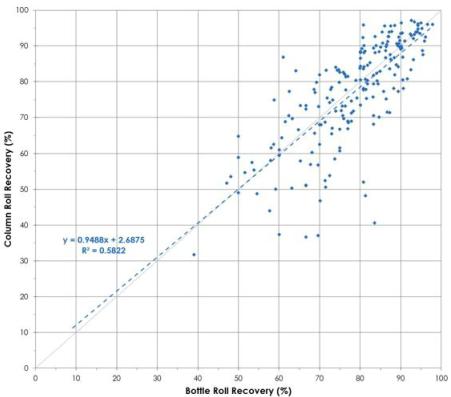
Source: SSR 2023
| 10-2 | |
| SSR Mining Inc. | Marigold Complex | October 9, 2026 |
| S-K 1300 Technical Report Summary | SLR Project No.: 138.020810.00001 |
| 10.1.1.1 | Marigold Process Optimization Metallurgical Test Work |
Additional test work, such as permeability testing, reagent dosage, solution application rate, and carbon activity, is conducted to optimize the processing variables that are controllable on a large heap leach pad and plant.
Permeability testing has been performed on ore samples with varying fines content. The testing simulated compaction under multiple lifts of ore stacked up to 200 m. Overall, the blends tested demonstrated relatively consistent permeability on increasing loads. Flow rates for the blends ranged from 178.8 L/h/m2 to 284.2 L/h/m2 under no load. Under 122 m effective height loading, flow rates ranged from 34.4 L/h/m2 up to 188 L/h/m2. All tests resulted in low, but acceptable permeabilities.
| 10.1.1.2 | Marigold Gold Recovery Modeling |
Marigold uses two assay methods: fire assay that measures the total contained gold in a sample (AuFA) and a second method known as ‘cyanide-soluble gold’ (AuCN). The latter technique generates a value that represents the grade of the ore in terms of the amount of gold in a finely ground sample that can be dissolved by a strong sodium cyanide solution, or the maximum cyanide soluble gold content.
All Marigold blasthole samples are assayed for cyanide soluble gold. Samples ending in the numbers 0, 3, and 7 inside ore control shapes are selected for additional fire assay analysis. Therefore, some samples have two assay values: an AuCN (cyanide soluble) value and an AuFA (fire assay) value. The ratio of AuCN to AuFA provides the theoretical maximum gold recovery that can be achieved. For example, if the AuFA ore grade is 0.10 g/t, and the AuCN ore grade is 0.08 g/t, the ratio is 0.08/0.01 = 0.80. This indicates that the maximum gold recovery using cyanide leaching from this ore sample is 80%.
Test work has demonstrated that, generally, all ore at Marigold behaves similarly. The ratio of AuCN/AuFA is an important characteristic determined for each ore block in the geologic model.
The most recent assessment of the predicted recovery for Marigold ore was conducted in 2017. The 2017 exploration database contains approximately 155,000 pairs of fire assays (field AUFA in the database) and cyanide soluble assays (field AUAA in the database). These assay pairs represent all the mine ore types. On an individual ore block basis, the ratio AuCN/AuFA includes all the local geological variables for that ore block (rock type, degree of oxidation, head grade, etc.). The result is the best estimate of maximum recovery. Figure 10-3 shows AuFA plotted against AuCN for all data pairs through 2017.
A best-fit linear regression shows the AuCN/AuFA ratio is 0.80. The LOM historical leach pad recovery, based on ounces poured, was 74.0% at the time of this analysis.
An adjustment factor can be calculated using the chemical maximum AuCN/AuFA recovery and the actual pad recovery:
Actual: 74% / Chemical: 80% = 0.92
Therefore, the estimated recovery from the ROM heap leach can be expressed as:
Heap Leach Recovery = AuCN / AuFA x 0.92
| 10-3 | |
| SSR Mining Inc. | Marigold Complex | October 9, 2026 |
| S-K 1300 Technical Report Summary | SLR Project No.: 138.020810.00001 |
Figure 10-3: Exploration Database (2017) AuCN vs AuFA – All Data
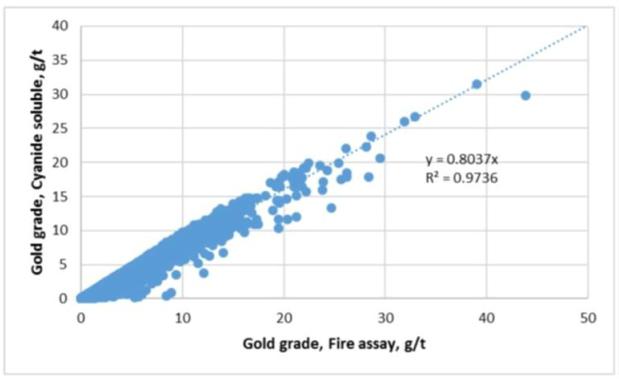
Source: SSR 2018
| 10.1.1.3 | Marigold Preg-Rob Test Program |
Preg-robbing is the loss of leached gold cyanide complex from solution by adsorption onto natural carbon contained in the ore. Current control measures to mitigate preg-rob material issues on the heap leach pad include blasthole analysis and logging, training of shovel operators to identify black rock (preg-rob material), and ore control routing for segregation of material on the pad. A study is being conducted to assist with further understanding preg-rob material in the Marigold ore bodies with respect to evaluating current test procedures and the correlation to both leach cycle time and particle size. This study includes the standardized preg-rob procedure conducted in the Marigold Analytical Lab, coarse bottle rolls, and a column test with samples containing preg-robbing material.
One of the objectives of this study is to assess whether the placement of preg-robbing material on the Marigold heap leach facility is being adequately accounted for in the current AuCN/AuFA ratio and ore control practices. If it is found that preg-robbing material is not being accounted for, then it will be necessary to assess what additional factors may need to be applied to the metallurgical recovery equation.
The study work program includes the following test work:
| · | Standard preg-rob test with extended leaching times and increased gold spike concentrations. |
| · | Standard bottle roll procedure using a coarser particle size sample with the addition of goldspike to mirror the laboratory SOP for preg-rob. |
| · | Standard column procedure with addition of gold spike in barren solution. |
| 10-4 | |
| SSR Mining Inc. | Marigold Complex | October 9, 2026 |
| S-K 1300 Technical Report Summary | SLR Project No.: 138.020810.00001 |
| 10.2 | Buffalo Valley |
| 10.2.1 | Metallurgical Test Work |
| 10.2.1.1 | Historical Test Work |
The Buffalo Valley deposit has mainly been analyzed as an oxide heap leach with bottle roll and column leach tests being the most common, though there are some tests conducted for alternative processing. Mineralogy and geochemical data have also been reliably procured during testing. The results of testing have shown strong lithological control, with recovery being predicted by different factors in each unit; some are predicted by the cyanide to fire assay (CN/FA) ratio with no crush size dependency while others rely very strongly on crush size to obtain reasonable recovery. All units perform similarly when pulverized to 75 µm. Overall, 12 test programs have been conducted since 1982, including 122 x 2 mm bottle roll tests and 96 column tests (52 at 19 mm, 42 at 38 mm, and 2 at 300 mm).
Historical mining (1987 to 1990) primarily took place in the main dike intrusives above the Greenstone basalt layer. The 1982 KCA test program indicated excellent recovery, 80 to 90% in the near-surface intrusive unit.
Testing commissioned by Fairmile and Newmont was focused primarily on the continuation of the core of the orebody below the historical mining, in the Sandy sedimentary unit and Main Dike intrusive unit. While this is the main component of the ore, the spatial coverage away from this region was lacking. Composites also typically skew to the higher grades which would have been economic at that time, with limited tests performed near the currently anticipated cutoff grade of 0.1 g/t (0.003 opt).
SSR designed programs in 2023, 2024, and 2025 to address these issues, spreading the test work away from historical test areas with a focus on targeting specific lithologies with no blending. The 2024 and 2025 programs also targeted lower grade composites. Finally, the 2025 program expanded the lithological targets to previously untested units at depth, base limestone and a new sulfidic lithology, VDFX.
| 10.2.1.2 | Gold Recovery by Size Results |
Most of the ore at Buffalo Valley shows a very strong crush size dependency. This size dependence is likely due to gold particles being encapsulated by skarns and other silicate minerals. Scanning electron microscope (SEM) evidence shows that moderately size gold particles can be fully covered by garnet and pyroxene that can only be fully liberated with grinding. This is most evident in samples from the calc-silicate hornfels (CSHF) units in the upper sediments. There is also a portion of the gold deportment that is refractory to cyanide. From SEM analysis, it is seen that arsenopyrite can be a significant host of sub-atomic gold, even in samples with well-oxidized pyrite. In P80 74 micron bottle roll tests, almost all tests show more than 80% recovery of the contained gold, with only a few sulfidic-refractory samples.
The laboratory test recoveries need to be scaled to the anticipated production size, either 38 mm crushed or 304 mm ROM. The individual test recoveries are plotted against the log of the P80 particle size in Figure 10-4 to generate crush size vs recovery curves for each lithology. These are then discounted to 96% to account for heap leach inefficiency and other scale-up effects. Table 10-1 presents the recovery of contained gold (AuFA) at a crush size of 38 mm or ROM size of 304 mm. Both of these sizes are conservative and are open for optimization in design and mine planning; Marigold ROM P80 is 144 mm, so there is an opportunity to increase recovery with drill and blast practices.
| 10-5 | |
| SSR Mining Inc. | Marigold Complex | October 9, 2026 |
| S-K 1300 Technical Report Summary | SLR Project No.: 138.020810.00001 |
Preg-rob testing has been conducted at most project stages, with minimal preg-rob behavior noted in the assay or bottle roll testing. Organic carbon assays are also very low for all samples.
| Table 10-1: | Gold Recovery by Lithology |
| Metallurgical
Unit |
Lithology | AuFA Recovery (%) | Recovery
Equation by Size | |
| Crush (38 mm) | ROM (304 mm) | |||
| Intrusive | Granodiorite | 85.73 | 84.20 | 88.40 – 1.692 * Log10(x) |
| Sandy | Sandstone | 73.09 | 68.61 | 80.94 – 4.966 * Log10(x) |
| Greenstone | Basalt | 34.00 | 15.09 | 67.08 – 20.94 * Log10(x) |
| CSHF | Limestone Chert | 28.60 | 8.46 | 63.83 – 22.30 * Log10(x) |
| SHF | Chert | 58.76 | 48.04 | 77.51 – 11.87 * Log10(x) |
| Front Fault | n/a | 76.81 | 71.79 | 85.60 – 5.561 * Log10(x) |
| Limestone | Limestone | 39.82 | 26.82 | 62.57 – 14.40 * Log10(x) |
| Figure 10-4: | Buffalo Valley Au Recovery by Size for each Lithology |
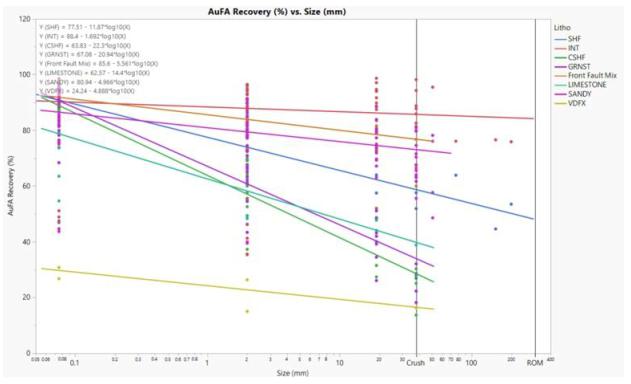
Source: SSR 2023
| 10.3 | QP Opinion |
The SLR QP opines that the metallurgical test programs conducted by SSR, along with the historical test reports and extensive operating data and experience with the Marigold mineralization, are adequate to support the TRS. The Buffalo Valley deposit is more complex than Marigold, and the recoveries of the seven ore types are dependent on crush size. Recovery curves have been developed for each of the material types, allowing extrapolation of recoveries from 38 mm to ROM material (304 mm). The method used is standard and acceptable, though there are recovery risks associated with ROM extrapolation and the definition of ROM size. The deleterious elements in these deposits are mercury and arsenic, which are mitigated in the carbon regeneration and refining processes.
| 10-6 | |
| SSR Mining Inc. | Marigold Complex | October 9, 2026 |
| S-K 1300 Technical Report Summary | SLR Project No.: 138.020810.00001 |
| 11.0 | Mineral Resource Estimates |
| 11.1 | Summary |
Mineral Resources have been classified in accordance with the definitions for Mineral Resources in S-K 1300. SLR has reviewed, audited, and accepted the Mineral Resource estimates prepared by SSR for Marigold and Buffalo Valley (Table 11-1). The Mineral Resource estimates are based on block model values developed from assays on the mineralized properties.
The Mineral Resource estimates were completed using a conventional block modeling approach in Seequent’s Leapfrog EDGE (Leapfrog Geo) software.
Estimates were validated using standard industry techniques, including statistical comparisons with composite samples and parallel inverse distance squared (ID2) and nearest neighbor (NN) estimates, swath plots, and visual reviews in cross-section and plan. A visual review comparing blocks to drill holes was completed after the block modeling work was performed to ensure general lithologic and analytical conformance and was peer reviewed prior to finalization.
In the opinion of the SLR QP, the resource evaluation reported herein is an appropriate representation of the gold Mineral Resources found at the Marigold Complex at the current level of sampling. The SLR QP is of the opinion that, with consideration of the recommendations summarized in Sections 1 and 23 of this TRS, any issues relating to all relevant technical and economic factors likely to influence the prospect of economic extraction can be resolved with further work.
| 11-1 | |
| SSR Mining Inc. | Marigold Complex | October 9, 2026 |
| S-K 1300 Technical Report Summary | SLR Project No.: 138.020810.00001 |
| Table 11-1: | Summary of Marigold Mine and Buffalo Valley Mineral Resources |
| Deposit | Measured
Mineral Resources |
Indicated
Mineral Resources |
Measured
+ Indicated Mineral Resources |
Inferred
Mineral Resources |
Cut-off
Grade (g/t Au) | ||||||||
| Amount (Mt) |
Grade (g/t Au) |
Rec. (%) |
Amount (Mt) |
Grade (g/t Au) |
Rec. (%) |
Amount (Mt) |
Grade (g/t Au) |
Rec. (%) |
Amount (Mt) |
Grade (g/t Au) |
Rec. (%) | ||
| Marigold | 0.0 | 0.000 | 0.0 | 125.0 | 0.39 | 74.0% | 125.0 | 0.39 | 74.0% | 18.1 | 0.30 | 71.6% | 0.069 |
| Buffalo Valley | 0.0 | 0.000 | 0.0 | 5.6 | 0.53 | 59.1% | 5.6 | 0.53 | 59.1% | 11.2 | 0.31 | 64.4% | 0.10 to 0.32 |
| Total | 0.0 | 0.000 | 0.0 | 130.6 | 0.40 | 73.3% | 130.6 | 0.40 | 73.3% | 29.3 | 0.31 | 68.8% | |
Notes:
1. The Mineral Resource estimate was prepared in accordance with S-K 1300. 2. The effective date of Mineral Resources at Marigold is May 1, 2026, and the effective date of Mineral Resources at Buffalo Valley is May 1, 2026. 3. Marigold Mine is based on an optimized pit shell at a cut-off grade of 0.069 g/t payable gold (gold assay factored for recovery, royalty, and net proceeds). Buffalo Valley is based on a cut-off grade of 0.10 to 0.32 g/t contained gold, depending on material type. Gold price of US $2,500 per ounce was used to generate the optimized pit shell. 4. Marigold metallurgical recoveries vary with gold grade. Buffalo Valley metallurgical recoveries vary by gold grade and lithology. Marigold Mine and Buffalo Valley average recovery is 73.7% and 62.6%, respectively. 5. For Marigold, bulk densities (in t/m3) were assigned by lithologies: alluvium = 2.10, Havallah = 2.48, Valmy/Antler = 2.4076+(0.0001*DEPTH), and Valmy = 2.64, below 533m. For Buffalo Valley, bulk densities (in t/m3) were assigned by lithology, ranging from a low of 2.095 (Overburden) to a high of 2.725 (Basalt). 6. The Mineral Resources estimate is reported below the as-mined surface as of May 1, 2026, for Marigold, and below the as-mined surface as of May 1, 2026, for Buffalo Valley. 7. The point of reference for Mineral Resources is the entry to the carbon columns in the processing facility. 8. Mineral Resources are reported exclusive of Mineral Reserves. 9. SSR has 100% ownership of the Marigold Complex. 10. All ounces reported represent troy ounces, and g/t represents grams per metric tonne. 11. Totals may vary due to rounding. | |||||||||||||
| 11-2 | |
| SSR Mining Inc. | Marigold Complex | October 9, 2026 |
| S-K 1300 Technical Report Summary | SLR Project No.: 138.020810.00001 |
| 11.2 | Marigold |
SSR prepared the Mineral Resource estimate with an effective date of May 1, 2026. The Mineral Resource estimate is based on all available data for Marigold as of March 17, 2026. The SLR QP has reviewed and accepted this information for use in this TRS.
Mineral Resources are reported exclusive of Mineral Reserves. Mineral Resources that are not Mineral Reserves do not have demonstrated economic viability. Due to the uncertainty associated with Inferred Mineral Resources, it cannot be assumed that all or any part of an Inferred Mineral Resource will be upgraded to an Indicated or Measured Mineral Resource as a result of continued exploration.
| 11.2.1 | Resource Database |
SSR uses MX Deposit, a commercially available geology database management system.
The digital drill hole database used for this estimate contains 9,796 drill holes totaling 2,045,811 m. A total of 19 drill holes, totaling 3,786 m, do not contain assays.
The project resource database, dated March 17, 2026, comprises collar coordinates, downhole survey data, lithological, and assay results. The database incorporates all available gold assay and reassay results from Assay Programs conducted in 2015, 2016, and 2025–2026, as well as the complete dataset for the Valmy property acquired from Newmont. All relevant validation and integrity checks were performed during data compilation and import. Following data import, the database was further reviewed and validated using the built-in validation tools within Seequent Leapfrog to identify and resolve any remaining errors or inconsistencies.
| 11.2.2 | Geological Interpretation |
| 11.2.2.1 | Geological Interpretation |
Gold mineralization at Marigold is closely associated with the intersection of high-angle fault structures and favorable stratigraphic horizons. Favorable host rocks within the Antler Sequence include the debris-flow horizon of the Edna Mountain Formation; interbedded limestone, sandstone, siltstone, and conglomerate units of the Antler Peak Formation; and conglomerate of the Battle Formation. Favorable host rocks within the Valmy Formation include quartzite and interbedded quartzite-argillite.
The geological model was created using lithological logging data along with mapping. The following formational units were modeled: Havallah, Edna Mountain, Antler Peak Limestone, Battle Conglomerate, and Valmy. Apart from the major formation units, a few dykes and basalt units were also modeled. Structural trends were interpreted from logging data, pit mapping, and blasthole information.
The base of the oxidized and transition zones was interpreted based on geological logging and analytical data.
| 11.2.2.2 | Domain Models |
Geological interpretation of mineralized envelopes was completed using the Indicator Radial Basis Function (RBF) tool within Leapfrog. Mineralized envelope was developed using composited (25’) data at a cut-off grade of 0.0025 opt Au (0.09 g/t) and an iso-value (ISO) probability of 0.435. A gold trend surface was developed using lithology, structures were mapped, and blasthole information was used to guide the generation of mineralized envelopes.
The mineralized envelopes exhibit good continuity and can be validated through pit mapping and production data. In areas where the implicit modeling process either omitted mineralized zones or included waste intervals, manual adjustments were made. Figure 11-1 shows a representative cross-section of the mineralized envelope modeled.
| 11-3 | |
| SSR Mining Inc. | Marigold Complex | October 9, 2026 |
| S-K 1300 Technical Report Summary | SLR Project No.: 138.020810.00001 |
Figure 11-1: Mineralized Envelopes and Dynamic Anisotropy Trend, 10400N, Red Dot area
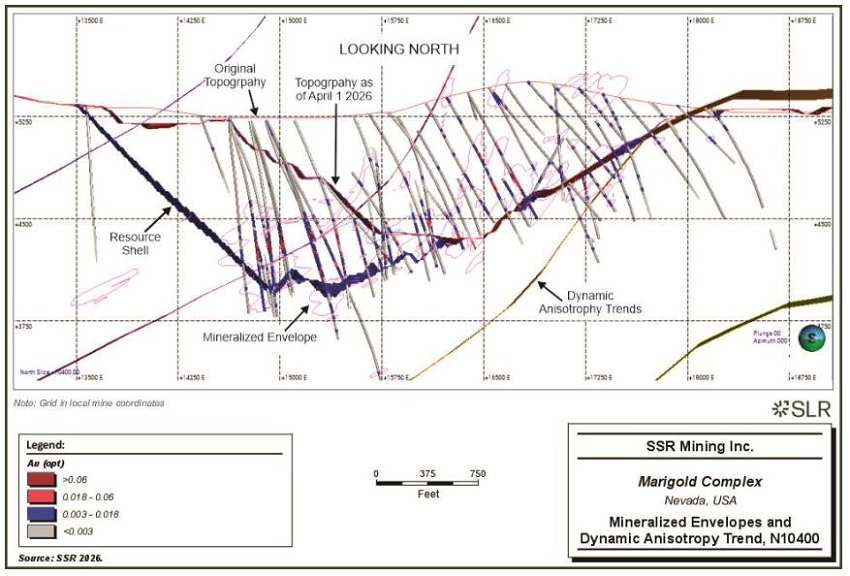
| 11-4 | |
| SSR Mining Inc. | Marigold Complex | October 9, 2026 |
| S-K 1300 Technical Report Summary | SLR Project No.: 138.020810.00001 |
| 11.2.3 | Treatment of High-Grade Assays |
The SLR QP is of the opinion that the influence of high-grade assays must be reduced or controlled, and that a number of industry best-practice methods can be used to achieve this goal.
| 11.2.3.1 | Capping Levels and Outlier Restriction |
When assay distributions are positively skewed or log-normal, erratic high-grade assay values can disproportionately affect the average grade of a deposit. One method for reducing these outliers' influence on the average grade is to cap them at a specific grade level.
Grade capping is a technique used to mitigate the potential effect of a small population of high-grade sample outliers on grade estimation.
The spatial distribution of the high-grade populations suggests that these elevated grades are clustered and are likely associated with high-angle structures and favorable rock types. These high-grade structures are narrow and difficult to model due to the short-range variability unless close-spaced drilling is available, and hence these high-grade populations within the mineralized envelopes were capped to 13.71 g/t (0.44 opt) to avoid smearing of these higher grades.
In addition to capping thresholds, a secondary approach to reducing the influence of high-grade composites is to restrict the search ellipse dimension (i.e., high yield restriction) during estimation.
A few samples with gold grades greater than 0.09 g/t (0.002 opt) that were not included within the mineralized envelopes were estimated as part of the waste domain using lower cap and outlier restrictions. The capping values and outlier restrictions used are presented in Table 11-2.
| Table 11-2: | Capping and Outlier Restriction Values and Distance for Various Domains |
| Domain | Clamp
Distance (% search, 1st pass, 2nd pass) |
Cap Value (g/t) |
| Within Mineralized envelopes | N/A | 13.71 |
| AUFE Waste | 0.34 g/t – 10% of search | 13.71 |
| 0.34 g/t – 20% of search | 13.71 | |
| Mineralized Dumps | 0.34 g/t – 10% of search | 13.71 |
| 11.2.4 | Compositing |
The samples were composited downhole to a length of 7.6 m. Residual lengths less than 3.8m were set to be distributed equally. The composite length was set to the minimum mining bench height. Composites with Au>=0.09g/t were used to define the mineralized envelope rather than raw drill hole intercepts, as selective mining is not considered feasible. The summary statistics comparing the raw and composites inside the mineralized envelope are presented in Table 11-3.
| 11-5 | |
| SSR Mining Inc. | Marigold Complex | October 9, 2026 |
| S-K 1300 Technical Report Summary | SLR Project No.: 138.020810.00001 |
| Table 11-3: | Statistics Raw vs. Composites inside Mineralized Envelope |
| Statistic | Assays (g/t) | Composites (g/t) |
| Count | 274,327 | 55,058 |
| Mean | 0.44 | 0.44 |
| SD | 1.18 | 0.86 |
| CV | 2.67 | 1.94 |
| Variance | 0.04 | 0.02 |
| Minimum | 0.00 | 0.00 |
| Q1 | 0.05 | 0.12 |
| Q2 | 0.16 | 0.21 |
| Q3 | 0.41 | 0.45 |
| Maximum | 190 | 83 |
| 11.2.5 | Trend Analysis |
| 11.2.5.1 | Variography |
A back-transformed variogram was used in the estimation of Mineral Resources to describe the spatial continuity of gold grades, specifically the strength of spatial similarity as a function of separation distance and direction. A variogram quantifies the variance between data values as a function of their separation distance and orientation.
A variogram was generated from the full dataset in Seequent Leapfrog EDGE. Structural information derived from geological mapping, together with interpreted structural orientations based on gold grade distributions, was used to guide the selection of along-strike, across-strike, and down-dip directions for variogram modeling.
A single variogram was developed for the whole Marigold deposit, and the parameters are shown in Table 11-4.
| 11-6 | |
| SSR Mining Inc. | Marigold Complex | October 9, 2026 |
| S-K 1300 Technical Report Summary | SLR Project No.: 138.020810.00001 |
| Table 11-4: | Variogram Parameters |
| Type | Plunge (°) |
Trend (°) |
Nugget | Structure 1 | Structure 2 |
Dip
(°) |
Azimuth (°) |
Pitch (°) | ||||||
| Sill | Major
(m) |
Semi- major (m) |
Minor (m) |
Sill | Major (m) |
Semi-major
(m) |
Minor
(m) | |||||||
| Spherical | 10 | 335 | 0.7289 | 0.2166 | 21.9 | 17.7 | 16.8 | 0.1221 | 43.9 | 38.1 | 30.5 | 20 | 274 | 149 |
| 11-7 | |
| SSR Mining Inc. | Marigold Complex | October 9, 2026 |
| S-K 1300 Technical Report Summary | SLR Project No.: 138.020810.00001 |
| 11.2.6 | Search Strategy and Grade Interpolation Parameters |
A regularized whole-block approach was used, assigning each block to the domain containing its centroid. The Mineral Resource block model was initially constructed in Leapfrog Edge using US Customary units within the local mine coordinate system and was subsequently converted to metric units for reporting purposes. A summary of the block model extents is provided in Table 11-5. The model attributes are shown in Table 11-6.
| Table 11-5: | Block Model Parameters |
| Orientation | Min (m) | Max (m) | Extent (m) | Cell Size (m) | Number of Cells |
| Easting | 2,316 | 8,992 | 6,675 | 6.1 | 1,095 |
| Northing | -2,377 | 9,906 | 12,283 | 7.62 | 1,612 |
| Elevation | 914 | 2,621 | 1,707 | 7.62 | 224 |
| Table 11-6: | Block Model Attributes |
| Field | Description |
| AUALL | Gold grade in situ |
| AUKR | Gold grade below current topographic surface |
| AUPAY | Payable Au grade below current topographic surface |
| AUREC | Recoverable Au grade below current topographic surface |
| AUPL3 | NN Au gold |
| CNNN | CN NN for ore blocks |
| CAT | Classification, 2 - Ind, 3 - Inf, 4 - not classified |
| ELEV | Block bottom Elevation (Bench) |
| DEPTH | Centroid depth from original topo |
| DWT | Ground water table as of EOY 2025, 1 - above, 2 below |
| ORE | Current ore = 1, waste = 10 |
| ORE% | Current % ore within a block |
| RCODE | Rock Code, 1 - Cover, 2 - Havallah, 3 - Antler Peak LS, 4 - Valmy, 6- waste/backfill/mineralized stockpile, 7 - Battle Mountain, 8 - Edna, 9 - Clay Seams, 10 - RD Dyke |
| REC | Recovery, decimal (0-1) |
| REDOX | Redox surface, 1 - oxidized, 2- transitional, 3 - reduced |
| ROYL% | Royalty, % |
| TCF | Tonnage factor, ft3 / short ton |
| TOORG | Original Topo |
| TOPO | Topo as of EOM February 2026, % |
| TOPOD | Depleted Topo as of EOM February 2026, % |
| 11-8 | |
| SSR Mining Inc. | Marigold Complex | October 9, 2026 |
| S-K 1300 Technical Report Summary | SLR Project No.: 138.020810.00001 |
| 11.2.6.1 | Estimation Domaining |
A histogram of composite grades within the modeled mineralized envelope was generated. The resulting distributions are positively skewed, with approximately 11% of the bench composites across all domains reporting gold grades below 0.0686 g/t (0.002 opt). These low-grade composites are interpreted to represent internal dilution within the mineralized envelopes.
Before the blocks were estimated, the cell model was tagged for the following:
| · | The depleted pre-mining topography as of February 28, 2026, was used to tag the percentage of in situ material, followed by the February 28, 2026, end-of-month surface. The space between these surfaces was considered an overburden storage area (OBSA), a backfill area, or a mineralized stockpile. |
| · | The formation solids were used to tag the RCODE variable in the cell model. |
| · | The surface developed for the top of the sulfide/transitional zone and oxidized material was used to tag the REDOX variable in the model. |
The cells were then estimated for gold using ordinary kriging.
The mineralized waste areas, M9 and 8Sx, were identified in 2014 and 2015 and are located below OBSA.
Material contained within the OBSA was mined during the late 1990s and early 2000s, a period when cut-off grades were higher than those currently applied. During drilling of the M9 and 8Sx areas, samples collected from the OBSAs were also assayed for gold, with the majority returning grades above the current cut-off grade. To verify these results, an additional 37 sonic drill holes were completed in 2016, which confirmed the presence and grade of gold mineralization within the historical OBSA.
A total of 372 drill holes completed between 2010 and 2017 within the OBSAs were incorporated into the Mineral Resource estimation. The mineralized material within the historical OBSAs (referred to as the mineralized stockpile) was constrained using the original and current topographic surfaces. Samples located within these constraints were selected and composited to 7.62 m bench intervals. Gold grades were subsequently estimated into the block model using inverse distance squared (ID2) interpolation, applied in two separate estimation passes.
| 11.2.6.2 | Search Neighborhood Design |
The search parameters used to estimate the cells within the mineralized stockpile are shown in Table 11-7 and Table 11-8.
| 11-9 | |
| SSR Mining Inc. | Marigold Complex | October 9, 2026 |
| S-K 1300 Technical Report Summary | SLR Project No.: 138.020810.00001 |
| Table 11-7: | Search Parameters for In Situ Estimation |
| Search | Min
No. of Composites |
Max
No. of Composites |
Outlier Range (%) |
Outlier Au (g/t) |
Search Ellipsoid Distance | Search Orientations |
Max Samples per Hole | ||
| X
Search (m) |
Y
Search (m) |
Z
Search (m) |
|||||||
| Pass 1 within the mineralized envelope | 3 | 6 | 76.2 | 45.7 | 30.5 | Dynamic Anisotropy | 2 | ||
| Pass 2 within the mineralized envelope | 1 | 8 | 229 | 137 | 91.4 | ||||
| Pass 1 outside mineralized envelope | 3 | 6 | 10 | 0.343 | 38.1 | 22.9 | 15.2 | 1 | |
| Pass 2 outside mineralized envelope | 1 | 8 | 20 | 0.343 | 228.6 | 137.2 | 91.4 | ||
Notes: Orientation is based on Au trend surfaces.
| Table 11-8: | Search Parameters for Mineralized Stockpile |
| Search | Min
No. of Composites |
Max
No. of Composites |
Outlier Range (%) |
Outlier Au (g/t) |
Search Ellipsoid Distance and Orientation | ||||||
| X Search (m) | Y Search (m) | Z Search (m) | Max Search (m) | X Axis | Y Axis | Z Axis | |||||
| Pass 1 | 3 | 8 | 10 | 0.343 | 91 | 91 | 15 | 91 | 0 | 0 | 0 |
| Pass 2 | 1 | 8 | 20 | 0.343 | 150 | 150 | 15 | 150 | 0 | 0 | 0 |
| 11-10 | |
| SSR Mining Inc. | Marigold Complex | October 9, 2026 |
| S-K 1300 Technical Report Summary | SLR Project No.: 138.020810.00001 |
| 11.2.7 | Bulk Density |
Bulk density or specific gravity (SG) is used globally to convert volume to tonnage and, in some cases, to estimate block grade.
A total of 713 core samples were collected from diamond core drillholes for dry bulk density determinations at the Marigold onsite laboratory. Out of the total of 713 samples, 98 samples represented Antler sequence, 604 samples represented Valmy Formation, and 11 samples were from late Cretaceous intrusives.
The following methodology was used to measure the bulk density of the half-core samples:
| · | A thoroughly dry core sample is weighed in air. |
| · | The sample is saturated with water, and |
| · | After saturation, the sample is weighed while suspended in water, and then the saturated sample is weighed in air. |
The three weights (dry in air, saturated in water, and saturated in air) are then used to calculate the sample's dry bulk density (Silver Standard, 2014).
The density used in the cell model at depth (from the original topographic surface) for different materials is summarized in Table 11-9.
| Table 11-9: | Summary of Density for Different Material |
| Material | Depth (m) | Density (t/m3) |
| Alluvium/Backfill | >0.00 | 2.10 |
| Havallah | >0.00 | 2.48 |
| Valmy/Antler | 0.0 to 533 | y=2.4076+(0.0001*DEPTH) |
| Valmy | >533 | 2.64 |
| 11.2.8 | Classification |
A Mineral Resource is defined as a concentration or occurrence of material of economic interest in or on the Earth’s crust in such form, grade or quality, and quantity that there are reasonable prospects for economic extraction. A Mineral Resource is a reasonable estimate of mineralization, considering relevant factors such as cut-off grade, likely mining dimensions, location, or continuity, that with the assumed and justifiable technical and economic conditions, are likely to, in whole or in part, become economically extractable. It is not merely an inventory of all mineralization drilled or sampled.
Based on this definition of Mineral Resources, the Mineral Resources estimated in this TRS have been classified according to the definitions below based on geology, grade continuity, and drill hole spacing.
Measured Mineral Resource is that part of a mineral resource for which quantity and grade or quality are estimated based on conclusive geological evidence and sampling. The level of geological certainty associated with a measured mineral resource is sufficient to allow a qualified person to apply modifying factors, as defined in this section, in sufficient detail to support detailed mine planning and final evaluation of the economic viability of the deposit. Because a measured mineral resource has a higher level of confidence than the level of confidence of either an indicated mineral resource or an inferred mineral resource, a measured mineral resource may be converted to a proven mineral reserve or to a probable mineral reserve.
| 11-11 | |
| SSR Mining Inc. | Marigold Complex | October 9, 2026 |
| S-K 1300 Technical Report Summary | SLR Project No.: 138.020810.00001 |
Indicated Mineral Resource is that part of a mineral resource for which quantity and grade or quality are estimated based on adequate geological evidence and sampling. The level of geological certainty associated with an indicated mineral resource is sufficient to allow a qualified person to apply modifying factors in sufficient detail to support mine planning and evaluation of the economic viability of the deposit. Because an indicated mineral resource has a lower level of confidence than the level of confidence of a measured mineral resource, an indicated mineral resource may only be converted to a probable mineral reserve.
Inferred Mineral Resource is that part of mineral resource for which quantity and grade or quality are estimated based on limited geological evidence and sampling. The level of geological uncertainty associated with an inferred mineral resource is too high to apply relevant technical and economic factors likely to influence the prospects of economic extraction in a manner useful for evaluating economic viability. Because an inferred mineral resource has the lowest level of geological confidence of all Mineral Resources, which prevents the application of the modifying factors in a manner useful for evaluation of economic viability, an inferred mineral resource may not be considered when assessing the economic viability of a mining project and may not be converted to a mineral reserve.
The factors that can affect the uncertainty associated with each classification of Mineral Resources include, but are not limited to:
| · | reliability of sampling data |
| · | confidence in interpretation |
| · | modeling of geological and estimation domains |
| · | confidence in block grade estimates. |
The average distance to the three nearest drill holes was used as a criterion for Mineral Resource classification. Based on the drill spacing and the interpreted continuity and characteristics of mineralization, the available data does not support the classification of any Mineral Resources in the Measured category (Table 11-10 and Figure 11-2).
| Table 11-10: | Resource Classification Parameters |
| Average distance to 3 nearest holes | Indicated (m) | Inferred (m) | Not classified (m) |
| Inside Envelope | <= 45.7 | < = 67.1 | > 67.1 |
| Outside envelope | <= 22.9 | <= 33.5 | > 33.5 |
| 11-12 | |
| SSR Mining Inc. | Marigold Complex | October 9, 2026 |
| S-K 1300 Technical Report Summary | SLR Project No.: 138.020810.00001 |
| Figure 11-2: | Valmy Classification Cross Section (1100N) |
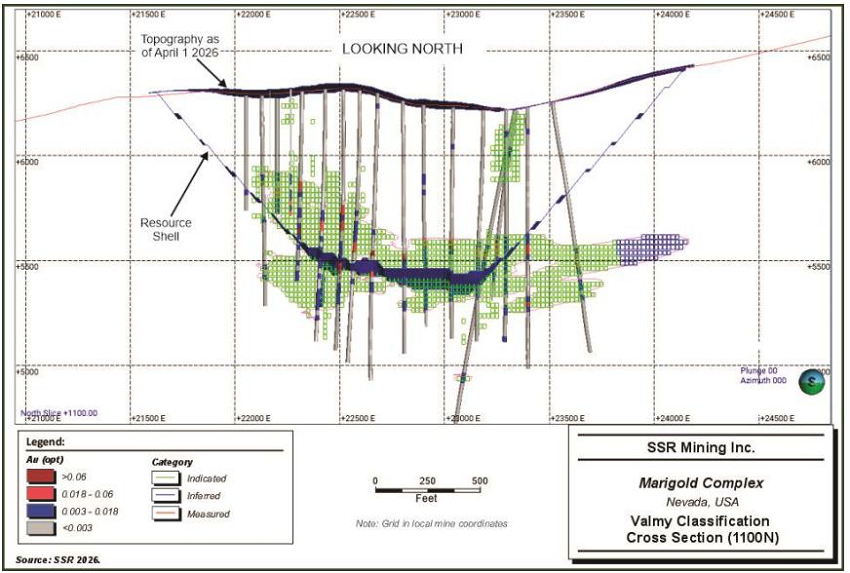
| 11-13 | |
| SSR Mining Inc. | Marigold Complex | October 9, 2026 |
| S-K 1300 Technical Report Summary | SLR Project No.: 138.020810.00001 |
| 11.2.8.1 | QP Comments on Classification |
In the SLR QP’s opinion, the classification of Mineral Resources is reasonable and appropriate for Mineral Resource disclosure, and there is a reasonable expectation that the majority of Inferred Mineral Resources could be upgraded to Indicated Mineral Resources with continued exploration.
| 11.2.9 | Estimation Validation |
The Marigold block model estimates were validated using industry standard techniques, including:
| · | Local validation using visual inspections on sections and plans, viewing composites versus block estimates |
| · | Global validation by comparison of composite statistics versus block estimates |
| · | Local validation by comparison of average assay grades with average block estimates along different directions (swath plots) |
SLR reviewed and audited the validation steps performed by SSR resource geologists and found grade continuity to be reasonable and confirmed that the block grades were reasonably consistent with local drill hole composite grades.
| 11.2.9.1 | Visual Inspection |
Visual validation included comparing the composites and the estimated model grades in both plan and section. Plans and sections were also checked for smearing of grades across stacked ore/mineralized zones, and no smearing was identified. This validates the kriging parameters used to estimate the cells. A typical cross-section and a plan view with estimated grades are shown in Figure 11-3 and Figure 11-4, respectively.
| 11-14 | |
| SSR Mining Inc. | Marigold Complex | October 9, 2026 |
| S-K 1300 Technical Report Summary | SLR Project No.: 138.020810.00001 |
| Figure 11-3: | Visual Validation, >= 0.002 opt, Not Depleted, Section -3850N |
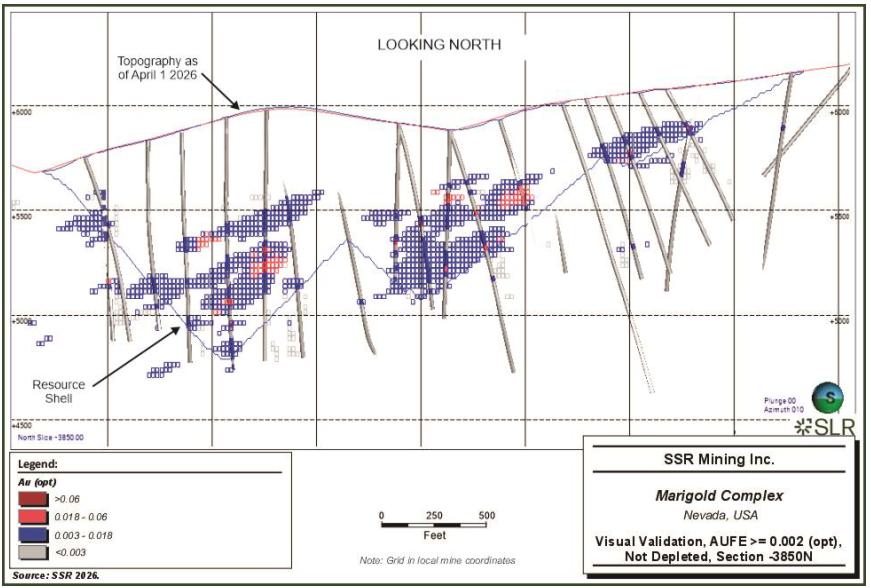
| 11-15 | |
| SSR Mining Inc. | Marigold Complex | October 9, 2026 |
| S-K 1300 Technical Report Summary | SLR Project No.: 138.020810.00001 |
| Figure 11-4: | Visual Validation, AUKR >= 0.002 (opt), not depleted, Level 4400 |
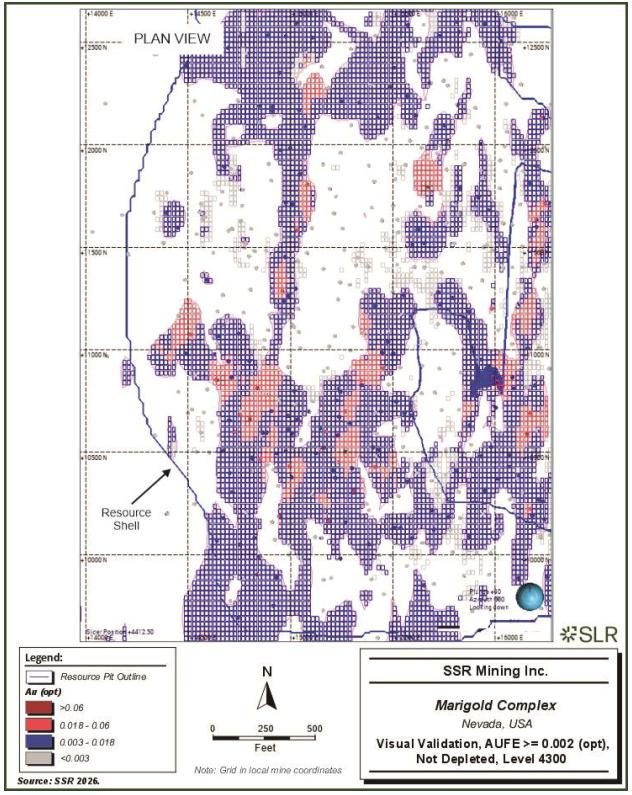
| 11-16 | |
| SSR Mining Inc. | Marigold Complex | October 9, 2026 |
| S-K 1300 Technical Report Summary | SLR Project No.: 138.020810.00001 |
| 11.2.9.2 | Estimation Statistics |
Checks for global bias were conducted on a domain basis, and the relative percent differences of the kriged mean gold grades were checked against the Nearest Neighbor (NN) estimates; the difference was less than ±0.021% (Table 11-11).
Table 11-11: Estimation Variance Statistics, not depleted
| Classification | Kriging
Au (g/t) |
NN
Au (g/t) |
Variance (%) |
| Indicated and Inferred | 0.45 | 0.45 | 0.021 |
| 11.2.9.3 | Swath Plots |
Swath plots were generated to compare the current model estimate with the previous model, including kriged Au values from the current model, kriged Au values from the previous model, nearest-neighbor (NN) Au values from the previous model, and 25-ft Au composites.
These plots, presented as Figure 11-5, Figure 11-6, and Figure 11-7, demonstrate good correlation.
| 11-17 | |
| SSR Mining Inc. | Marigold Complex | October 9, 2026 |
| S-K 1300 Technical Report Summary | SLR Project No.: 138.020810.00001 |
| Figure 11-5: | Swath Plot Along East, comparing Assay, Kriged Value and NN |
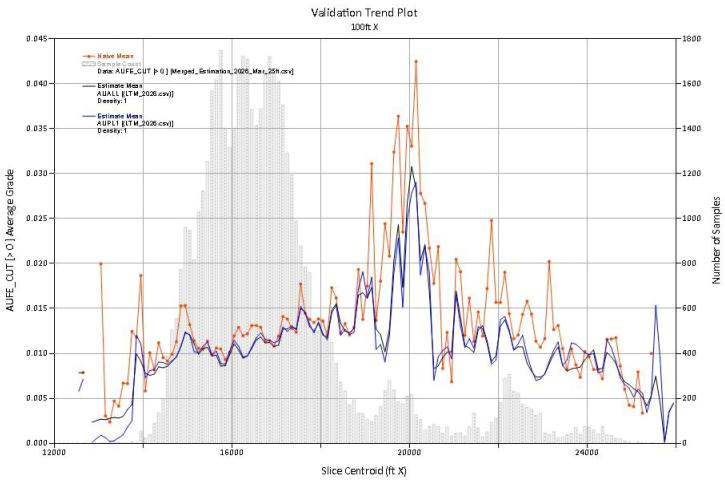
Source: SSR 2026
Note: Grade in opt and distance in feet.
| 11-18 | |
| SSR Mining Inc. | Marigold Complex | October 9, 2026 |
| S-K 1300 Technical Report Summary | SLR Project No.: 138.020810.00001 |
| Figure 11-6: | Swath Plot Along North, comparing Assay, Kriged Value and NN |
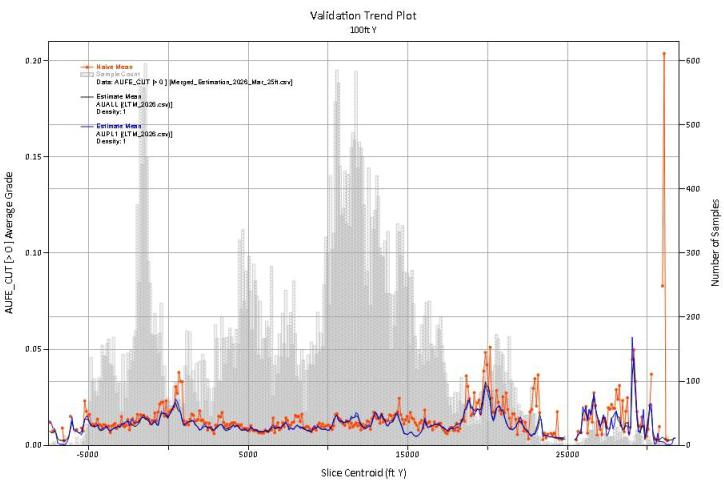
Source: SSR 2026
Note: Grade in opt and distance in feet.
| 11-19 | |
| SSR Mining Inc. | Marigold Complex | October 9, 2026 |
| S-K 1300 Technical Report Summary | SLR Project No.: 138.020810.00001 |
| Figure 11-7: | Swath Plot Along Elevation, comparing Assay, Kriged Value and NN |
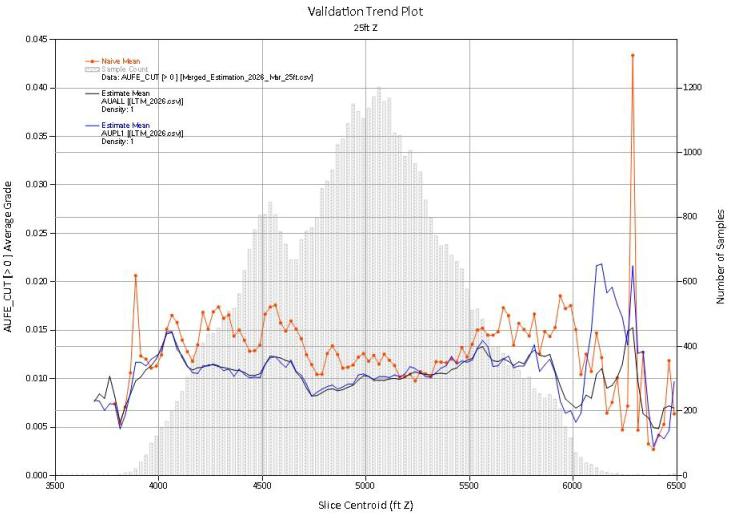
Source: SSR 2026
Note: Grade in opt and distance in feet.
| 11-20 | |
| SSR Mining Inc. | Marigold Complex | October 9, 2026 |
| S-K 1300 Technical Report Summary | SLR Project No.: 138.020810.00001 |
| 11.2.10 | Prospects of Economic Extraction for Mineral Resources |
Mineral Resources must demonstrate reasonable prospects for economic extraction (RPEE), which generally implies that the quantity and grade estimates meet certain economic thresholds and that the Mineral Resources are reported at an appropriate cut-off grade, taking into account extraction scenarios.
Metal prices used for reserves are based on consensus, long-term forecasts from banks, financial institutions, and other sources. For resources, metal prices used are slightly higher than those for reserves.
A reporting cut-off grade for the Marigold Mine based on assumed costs for open pit extraction and heap leach processing, and commodity prices that provide a reasonable basis for establishing the prospects of economic extraction for Mineral Resources was established and reviewed by the SLR QP.
| 11.2.10.1 | Cut-off Grade Estimation and Whittle Parameters |
Mineral Resources for Marigold were calculated based on a Whittle optimized pit at a payable gold grade of 0.069 g/t (Au assay factored for recovery, royalty, and net proceeds per cell) using an assumed gold price of $2,500/oz. Input parameters for the Whittle pit optimization are provided in Table 11-12.
| Table 11-12: | Marigold Resource Pit Parameters and Cut-off Grade |
| Marigold | Unit | Value |
| Gold Price | US$/oz | 2,500 |
| Gold Sales, Insurance, Legal, and Social | US$/oz | incl in Payable Au |
| Royalties | US$/oz | incl in Payable Au |
| Processing Au Recovery | % | incl in Payable Au |
| Payable Au | % | 100.00% |
| Mining Dilution | % | 1.00 |
| Processing Cost* | US$/t | 2.35 |
| Rehandling Cost | US$/t | 0 |
| Total | US$/t | 2.35 |
| Cut-off Grade – Marginal | g/t | 0.05 |
| Internal Cut-off Used | g/t | 0.069 |
| Mining Cost* | US$/t | 1.35* |
| Cut-off Grade- Full | g/t | 0.078 |
| * G&A included in both mining and processing costs | ||
| 11-21 | |
| SSR Mining Inc. | Marigold Complex | October 9, 2026 |
| S-K 1300 Technical Report Summary | SLR Project No.: 138.020810.00001 |
The gold price of $2,500/oz was selected after consideration of the pricing information described in Section 16, including the time frame used for the selection and the reasons for selecting that time frame. The metal price reflects the range of publicly reported price estimates for Mineral Resource cut-offs. The Marigold Mineral Resource is assumed to be mined by open pit.
By definition, the estimation of Mineral Resources has considered environmental, permitting, legal, title, taxation, mining, metallurgical, infrastructure, socio-economic, marketing, and political factors and other constraints, as discussed in various sections of the TRS.
| 11.2.11 | Mineral Resource Reporting |
SLR is unaware of any current environmental, permitting, legal, title, taxation, socio- economic, marketing, political, or other relevant factors that could materially affect the Mineral Resources estimate for Marigold (exclusive of Mineral Reserves) as of May 1, 2026, presented in Table 11-13 .
| Table 11-13: | Details of Marigold Mineral Resources Estimate Exclusive of Mineral Reserves as of May 1, 2026 |
| Category | Tonnes (Mt) |
Grade (g/t Au) |
Contained
Metal (Au Moz) |
Cut-off
Grade (Au g/t) |
Metallurgical
Recovery (%) |
| Measured | 0.0 | 0.0 | 0.00 | 0.069 | 0.0 |
| Indicated | 125.0 | 0.39 | 1.57 | 0.069 | 74.0% |
| Total Measured + Indicated | 125.0 | 0.39 | 1.57 | 0.069 | 74.0% |
| Inferred | 18.1 | 0.30 | 0.18 | 0.069 | 71.6% |
Notes:
1. The Mineral Resource estimate was prepared in accordance with S-K 1300. 2. The effective date of Mineral Resources at Marigold is May 1, 2026, 3. Marigold Mine is based on an optimized pit shell at a cut-off grade of 0.069 g/t payable gold (gold assay factored for recovery, royalty, and net proceeds). 4. Marigold metallurgical recoveries vary with gold grade. Marigold Mine’s average recovery is 73.7%. 5. For Marigold, bulk densities (in t/m3) were assigned by lithologies: alluvium = 2.10, Havallah = 2.48, Valmy/Antler = 2.4076+(0.0001*DEPTH), and Valmy = 2.64 below 533m . 6. The Mineral Resources estimate is reported below the as-mined surface as of May 1, 2026, for Marigold. 7. The point of reference for Mineral Resources is the entry to the carbon columns in the processing facility. 8. Mineral Resources are reported exclusive of Mineral Reserves. 9. SSR has 100% ownership of the Marigold Complex 10. All ounces reported represent troy ounces, and g/t represents grams per metric tonne. 11. Totals may vary due to rounding. | |||||
| 11.2.12 | Comparison with Previous Estimates |
The 2026 Mineral Resource, exclusive of Mineral Reserves, has been compared with the previous December 31, 2025 Mineral Resource estimate as reported in SSR’s 2025 Form 10-K filing (SSR 2025) for Marigold Mine.
| 11-22 | |
| SSR Mining Inc. | Marigold Complex | October 9, 2026 |
| S-K 1300 Technical Report Summary | SLR Project No.: 138.020810.00001 |
There has been a decrease in Indicated contained gold ounces of 167 koz and a reduction in Inferred gold ounces of 233 koz. The change can be attributed to the following:
| · | Conversion of Resources to Reserves due to increased reserve prices and infill drilling |
| · | Re-interpretation of the mineralized envelopes using the most updated drill hole and geological mapping information |
| 11.2.13 | Mineral Resource Uncertainty |
Mineral Resources are not Mineral Reserves and do not have demonstrated economic viability, nor is there certainty that all or any part of the Mineral Resource estimated here will be converted to Mineral Reserves through further study.
Sources of uncertainty that may affect the reporting of Mineral Resources include sampling or drilling methods, data processing and handling, geologic modeling, and estimation. There are sources of uncertainty in the MRE at the Marigold Mine that depend on the assigned classification. The SLR QP has not identified any relevant technical and/or economic factors that require resolution with regard to the Mineral Resource estimate.
The SLR QP is of the opinion that with consideration of the recommendations summarized in Sections 1 and 23 of this TRS, any issues relating to all relevant technical and economic factors likely to influence the prospect of economic extraction can be resolved with further work.
| 11.2.14 | QP Opinion |
In the SLR QP’s opinion, the resource estimation reported herein is an appropriate representation of the gold Mineral Resources at the current level of drilling and sampling. The Mineral Resource model is suitable for Mineral Reserve estimation.
The SLR QP reviewed the assumptions, parameters, and methods used to prepare the Mineral Resources Statement and is of the opinion that the Mineral Resources are estimated and prepared in accordance with S-K 1300.
| 11-23 | |
| SSR Mining Inc. | Marigold Complex | October 9, 2026 |
| S-K 1300 Technical Report Summary | SLR Project No.: 138.020810.00001 |
| 11.3 | Buffalo Valley |
The Buffalo Valley resource estimation was conducted by SSR with an effective date of May 1, 2026. The Mineral Resource estimate is based on all available data as of March 17, 2026. The SLR QP has reviewed and accepted this information for use in this TRS.
| 11.3.1 | Resource Database |
The digital drill hole database used for this estimate contains a total of 1,841 drill holes; 797 additional holes are located in the surrounding Buffalo Valley model but not used to build the geological model and estimation. SSR uses MX Deposit, a commercially available database management system. The drill campaigns represented in the data were completed over more than 42 years, from 1980 through to March 17, 2026.
| 11.3.2 | Geological Interpretation |
The Buffalo Valley project area is approximately 2.5 miles long north-south, and 1.7 miles wide east-west.
| 11.3.2.1 | Domains and Grade Shells |
Most of the gold mineralization at Buffalo Valley is hosted along a system of northwest-trending dikes and faults. Mineralization occurs both adjacent to dikes as well as bedding-parallel in receptive sedimentary units.
A total of four mineralized domains were defined for gold estimations and one for the Quaternary alluvium. Figure 11-8 and Figure 11-9 show a plan map and cross-section through the Buffalo Valley pit showing the locations of these domains. Probability envelopes (at least 40% probability of AUBEST exceeding 0.004 opt) were developed to best constrain the mineralization for estimation:
| · | FFOZ – Front Fault ore zone |
| · | Min BV DH - Mineralized envelope in Buffalo Valley and Dore Hills |
| · | Min WH – Mineralized in Warthog |
| · | LG – Material outside Mineralized envelope |
| · | Ovb – Quaternary alluvium |
| 11-25 | |
| SSR Mining Inc. | Marigold Complex | October 9, 2026 |
| S-K 1300 Technical Report Summary | SLR Project No.: 138.020810.00001 |
| Figure 11-8: | Buffalo Valley Estimation Domains (Plan View Elevation 5100) |
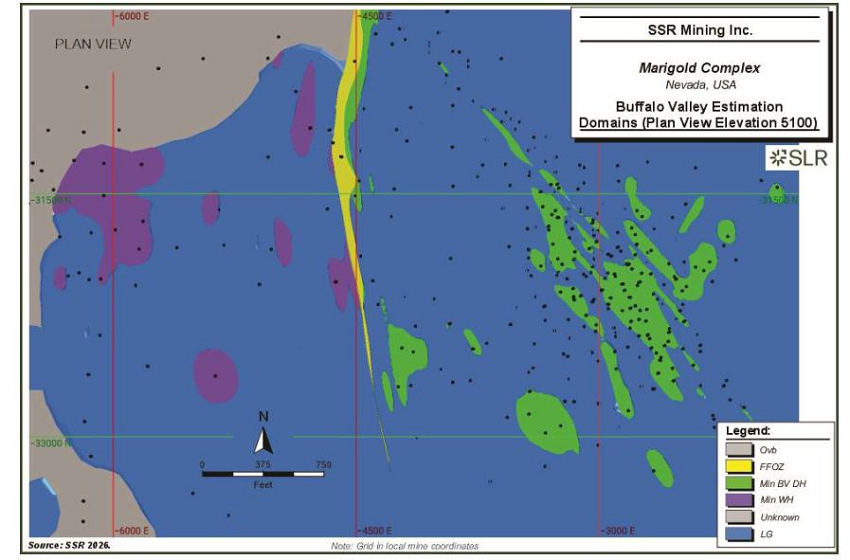
| 11-26 | |
| SSR Mining Inc. | Marigold Complex | October 9, 2026 |
| S-K 1300 Technical Report Summary | SLR Project No.: 138.020810.00001 |
| Figure 11-9: | Buffalo Valley Geology (Mine Grid Section -32,400 N) |
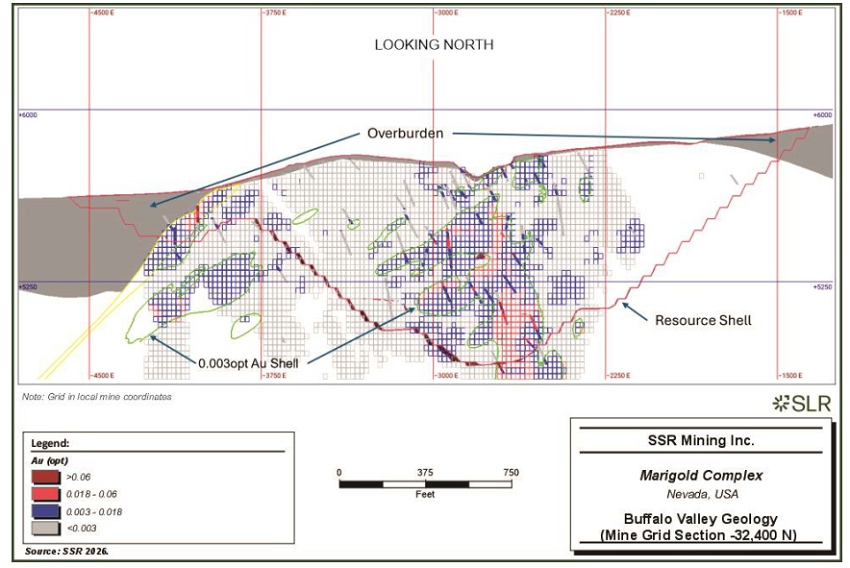
| 11-27 | |
| SSR Mining Inc. | Marigold Complex | October 9, 2026 |
| S-K 1300 Technical Report Summary | SLR Project No.: 138.020810.00001 |
The drill hole data included fire assay (AUFA) and cyanide soluble (AUCN) intervals (Table 11-14). Most data consisted of matched pairs (59,263), but 15,995 AUCN values have no corresponding AUFA values.
AUBEST was used for estimation due to unequal sampling preferences for fire-assay and cyanide-soluble assays. AUBEST prioritizes fire assay values where they exist, and merges in cyanide soluble assay values where fire assay does not exist. By combining the assays into a single variable, the estimation is informed by the most robust and slightly conservative information.
The length-weighted gold assay (g/t) and interval length statistics for sample intervals are summarized in Table 11-14.
| Table 11-14: | Length Weighted Gold Assays (g/t) Statistics of Raw Samples by Estimation Domain |
| Name | Element | Count | Mean
(g/t) |
SD | CV | Variance | Min (g/t) |
Median (g/t) |
Max
(g/t) |
| FFOZ | AUCN | 2,497 | 0.43 | 0.0393 | 3.1327 | 0.0015 | 0.02 | 0.14 | 43.03 |
| AUFA | 1,809 | 0.51 | 0.0465 | 3.1381 | 0.0022 | 0 | 0.17 | 44.5 | |
| AUBEST | 3,090 | 0.48 | 0.0412 | 2.9671 | 0.0017 | 0 | 0.17 | 44.5 | |
| AUCE | 3,090 | 0.41 | 0.0377 | 3.1543 | 0.0014 | 0 | 0.14 | 43.03 | |
| Interval Length | 3,194 | 4.8561 | 1.5723 | 0.3238 | 2.4722 | 0.1 | 5 | 58.5 | |
| Min_BV_DH | AUCN | 21,222 | 0.53 | 0.0587 | 3.8255 | 0.0034 | 0 | 0.14 | 119.25 |
| AUFA | 21,064 | 0.65 | 0.0641 | 3.3705 | 0.0041 | 0 | 0.17 | 125.11 | |
| AUBEST | 27,102 | 0.62 | 0.0624 | 3.4558 | 0.0039 | 0 | 0.17 | 125.11 | |
| AUCE | 27,102 | 0.5 | 0.0546 | 3.7717 | 0.003 | 0 | 0.14 | 119.25 | |
| Interval Length | 27,491 | 4.7002 | 1.2744 | 0.2711 | 1.624 | 0.1 | 5 | 80 | |
| Min_WH | AUCN | 2,110 | 0.38 | 0.0272 | 2.4748 | 0.0007 | 0.02 | 0.17 | 29.35 |
| AUFA | 4,023 | 0.46 | 0.0428 | 3.1783 | 0.0018 | 0 | 0.22 | 83.8 | |
| AUBEST | 4,040 | 0.46 | 0.0427 | 3.1629 | 0.0018 | 0 | 0.22 | 83.8 | |
| AUCE | 4,040 | 0.33 | 0.0228 | 2.3593 | 0.0005 | 0.01 | 0.17 | 29.35 | |
| Interval Length | 4,055 | 4.8917 | 2.1777 | 0.4452 | 4.7426 | 1 | 5 | 135 | |
| LG | AUCN | 49,429 | 0.08 | 0.0085 | 3.5106 | 0.0001 | 0 | 0.03 | 15.09 |
| AUFA | 81,127 | 0.07 | 0.0105 | 5.1572 | 0.0001 | 0 | 0.03 | 60 | |
| AUBEST | 89,786 | 0.07 | 0.0102 | 4.7683 | 0.0001 | 0 | 0.03 | 60 | |
| AUCE | 89,786 | 0.06 | 0.007 | 3.8985 | 0 | 0 | 0.03 | 15.09 | |
| Interval Length | 93,186 | 4.8493 | 1.7135 | 0.3533 | 2.9359 | 0.1 | 5 | 200 |
| 11-28 | |
| SSR Mining Inc. | Marigold Complex | October 9, 2026 |
| S-K 1300 Technical Report Summary | SLR Project No.: 138.020810.00001 |
| 11.3.3 | Treatment of High-Grade Assays |
| 11.3.3.1 | Capping Levels |
When the assay distribution is positively skewed or log-normal, erratic high-grade assay values can disproportionately affect the average grade of a deposit. One method for reducing these outliers' influence on the average grade is to cap them at a specific grade level.
Grade capping is a technique used to mitigate the potential effect of a small population of high-grade sample outliers on grade estimation. These high-grade samples are not considered representative of the general population and are therefore capped to a level more representative of the general data population. Although subjective, grade capping is a common industry practice when estimating grades for deposits with significant grade variability. In the absence of production data to calibrate the capping level, inspection of the assay distribution can be used to estimate a “first pass” cutting level.
Grade capping values were assigned by reviewing log histograms for the metal values for each domain. Capping values were determined to limit the upper range of estimation data to a level where the histogram maintains a reasonable structure.
For example, the capping values for AUBEST are summarized by estimation domain in Table 11-15.
| Table 11-15: | Capping Values AUBEST (g/t) |
| Domain | AUBEST (g/t) |
| FFOZ | 2.74 |
| Min_BV_DH | 10.29 |
| Min_WH | 2.06 |
| LG | 0.51 |
| 11.3.4 | Compositing |
The composite for all estimations is set to 7.62 m to represent a bench height composite for the anticipated mining.
Compositing was applied on the basis that if residual end intervals for a domain intercept are shorter than 50% of the standard composite length, then the residual lengths are distributed over the entire intercept, reducing the bias risk for last composites in holes.
| 11.3.5 | Trend Analysis |
| 11.3.5.1 | Variography |
Gold variograms were developed for each lithology domain using normal scores (NS) in Leapfrog EDGE. The NS variograms were back-transformed to real space for estimation purposes. Orientations were rotated into local ‘variable orientation’ to conform to the local environment. Variogram models for AUBEST are summarized in Table 11-16. All variogram models are spherical.
| 11-29 | |
| SSR Mining Inc. | Marigold Complex | October 9, 2026 |
| S-K 1300 Technical Report Summary | SLR Project No.: 138.020810.00001 |
| Table 11-16: | Variogram Models (AUBEST) |
| Variogram Name | Rotation | Nugget | Structure 1 | Structure 2 | ||||||||
| Dip | Dip Azi. | Pitch | Sill | Major (m) | Semi-major (m) | Minor (m) | Sill | Major (m) | Semi-major (m) | Minor (m) | ||
| AuBEST in BV_DH 2026_1: Transformed Variogram Model | 85 | 235 | 67 | 0.001066 | 0.000343 | 7.62 | 7.62 | 4.57 | 0.00006 | 30.48 | 30.48 | 12.19 |
| AuBEST in FFOZ 2026_1: Transformed Variogram Model | 45 | 270 | 173 | 0.000344 | 0.000116 | 13.50 | 7.62 | 4.57 | 0.000123 | 51.30 | 30.48 | 8.48 |
| AuBEST in LG 2026_1: Transformed Variogram Model | 86 | 61 | 110 | 0.000013 | 0.000005 | 12.19 | 6.10 | 4.57 | 0.000004 | 27.43 | 18.29 | 16.76 |
| AuBEST in WH 2026_1: Transformed Variogram Model | 89 | 85 | 108 | 0.000348 | 0.000092 | 6.10 | 6.10 | 4.57 | 0.000034 | 30.48 | 30.48 | 12.19 |
| 11-30 | |
| SSR Mining Inc. | Marigold Complex | October 9, 2026 |
| S-K 1300 Technical Report Summary | SLR Project No.: 138.020810.00001 |
| 11.3.6 | Exploratory Data Analysis |
Length-weighted gold statistics are summarized in Table 11-17
| Table 11-17: | Length Weighted Gold Assays (g/t) Statistics of Composite Samples by Domain |
| Domain | Element | Count | Mean
(g/t) |
SD | CV | Min
(g/t) |
Median
(g/t) |
Max (g/t) |
| FFOZ | AUCN | 516 | 0.431 | 0.0252 | 2.0011 | 0.017 | 0.192 | 12.706 |
| AUFA | 372 | 0.513 | 0.0280 | 1.8696 | 0.003 | 0.233 | 13.356 | |
| AUBEST | 639 | 0.476 | 0.0256 | 1.8487 | 0.003 | 0.211 | 13.356 | |
| AUCE | 639 | 0.410 | 0.0237 | 1.9814 | 0.010 | 0.178 | 12.706 | |
| AUBEST_CAP | 639 | 0.429 | 0.0159 | 1.2746 | 0.003 | 0.211 | 2.743 | |
| Interval Length | 639 | 4.8561 | 4.8140 | 0.2083 | 0.1 | 5 | 58.5 | |
| Min_BV_DH | AUCN | 4,223 | 0.528 | 0.0349 | 2.2650 | 0.017 | 0.229 | 29.651 |
| AUFA | 4,015 | 0.656 | 0.0381 | 1.9923 | 0.003 | 0.288 | 31.625 | |
| AUBEST | 5,270 | 0.623 | 0.0375 | 2.0658 | 0.003 | 0.268 | 31.625 | |
| AUCE | 5,270 | 0.500 | 0.0326 | 2.2376 | 0.003 | 0.219 | 29.651 | |
| AUBEST_CAP | 5,270 | 0.603 | 0.0297 | 1.6899 | 0.003 | 0.268 | 10.286 | |
| Interval Length | 5,270 | 4.7002 | 4.2824 | 0.1815 | 0.1 | 5 | 80 | |
| Min_WH | AUCN | 435 | 0.369 | 0.0184 | 1.7085 | 0.027 | 0.204 | 9.943 |
| AUFA | 803 | 0.457 | 0.0240 | 1.8047 | 0.019 | 0.267 | 19.354 | |
| AUBEST | 807 | 0.458 | 0.0240 | 1.7959 | 0.019 | 0.268 | 19.354 | |
| AUCE | 807 | 0.329 | 0.0150 | 1.5580 | 0.021 | 0.192 | 9.943 | |
| AUBEST_CAP | 807 | 0.409 | 0.0240 | 1.7959 | 0.019 | 0.268 | 2.057 | |
| Interval Length | 807 | 4.8917 | 3.4327 | 0.1419 | 1 | 5 | 135 | |
| LG | AUCN | 9,791 | 0.081 | 0.0048 | 2.0210 | 0.003 | 0.047 | 6.231 |
| AUFA | 15,941 | 0.069 | 0.0058 | 2.8967 | 0.002 | 0.034 | 14.229 | |
| AUBEST | 17,820 | 0.072 | 0.0057 | 2.7060 | 0.002 | 0.040 | 14.229 | |
| AUCE | 17,820 | 0.060 | 0.0040 | 2.2893 | 0.003 | 0.034 | 6.231 | |
| AUBEST_CAP | 17,820 | 0.064 | 0.0023 | 1.2127 | 0.002 | 0.040 | 0.514 | |
| Interval Length | 17,820 | 4.8493 | 3.0339 | 0.1248 | 0.1 | 5 | 200 |
Figure 11-10 and Figure 11-11 show the boxplots for fire assay and cyanide soluble gold on four domains representing one lithological population in the Front Fault Ore Zone (FFOZ), the material within a probability shell of greater than 0.4 of AUBEST grade of at least 0.1028 g/t (0.003 opt) within the Buffalo Valley/Dore Hills area (Min_BV_DH), similarly constrained material within the Warthog area (Min_WH), and the remaining low grade (LG) material outside of the mineralized shells.
| 11-31 | |
| SSR Mining Inc. | Marigold Complex | October 9, 2026 |
| S-K 1300 Technical Report Summary | SLR Project No.: 138.020810.00001 |
| Figure 11-10: | Boxplot of AUFA by Domain (grade in opt) |
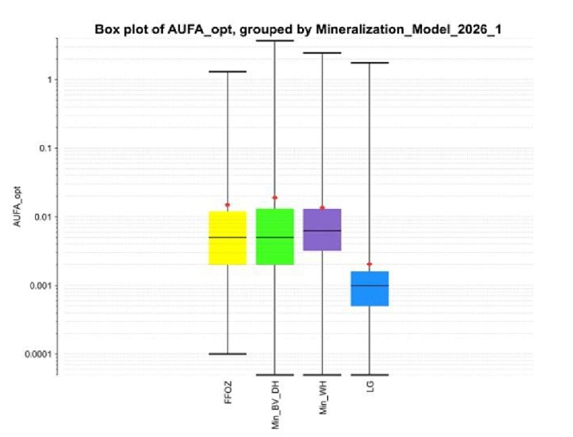
Source: SSR 2026
| 11-32 | |
| SSR Mining Inc. | Marigold Complex | October 9, 2026 |
| S-K 1300 Technical Report Summary | SLR Project No.: 138.020810.00001 |
| Figure 11-11: | Boxplot of AUCN by Domain (grade in opt) |
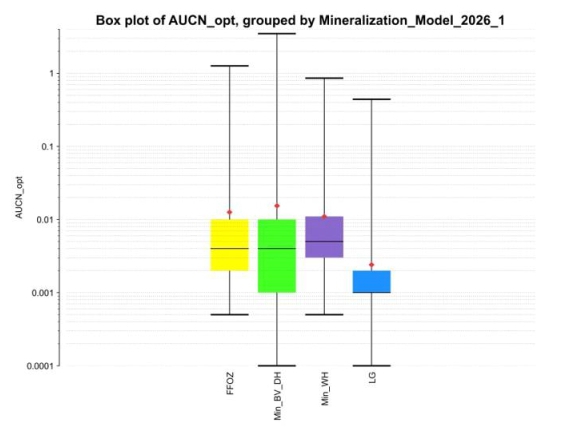
Source: SSR 2026
| 11-33 | |
| SSR Mining Inc. | Marigold Complex | October 9, 2026 |
| S-K 1300 Technical Report Summary | SLR Project No.: 138.020810.00001 |
The naïve histograms for AUBEST inside probability greater than 0.47 of AUBEST grade at least 0.1244 g/t (0.004 opt) for the four domains are shown in Figure 11-12. The log probability plots for AUBEST are shown in Figure 11-13.
| Figure 11-12: | Histograms of AUBEST By Domains (grade in opt) |
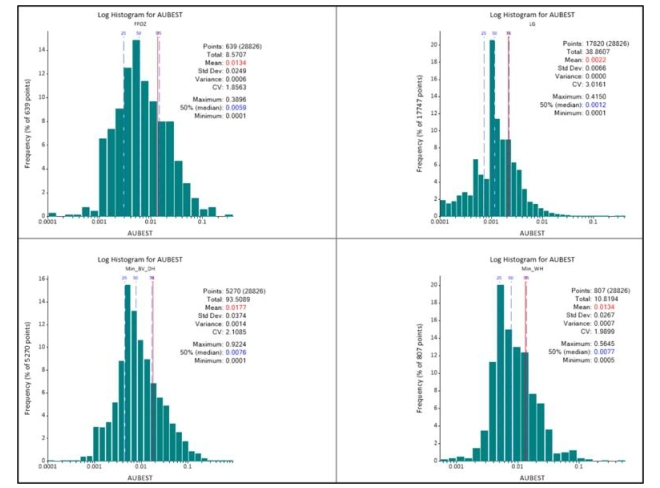
Source: SSR 2026
| 11-34 | |
| SSR Mining Inc. | Marigold Complex | October 9, 2026 |
| S-K 1300 Technical Report Summary | SLR Project No.: 138.020810.00001 |
| Figure 11-13: | Log Probability Plots of AUBEST By Domains (grade in opt) |
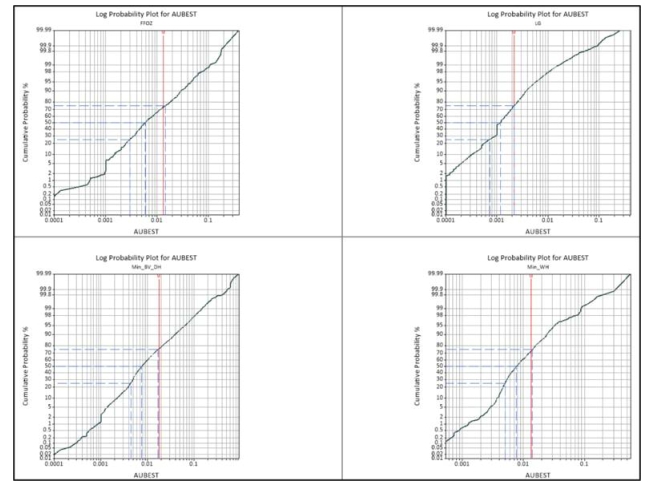
Source: SSR 2026
| 11-35 | |
| SSR Mining Inc. | Marigold Complex | October 9, 2026 |
| S-K 1300 Technical Report Summary | SLR Project No.: 138.020810.00001 |
The AUCE variable is built from AUCN assays where they exist and regressed AUFA assays as available. The regressions were applied by lithology and are summarized in Table 11-18.
| Table 11-18: | AUCE Regression Summary Applied to AUFA Values |
| Lithology | Variable | Slope | Intercept | |
| Base limestone | AUFA | 0.80812 | -0.002337 | |
| Crosscut west | AUFA | 0.75895 | -0.000129 | |
| East stock | AUFA | 0.8714 | 0.000014 | |
| East stock dike 1 | AUFA | 0.97863 | -0.000518 | |
| East stock dike 3 | AUFA | 0.90019 | -0.000025 | |
| Hav Basalt | AUFA | 0.92026 | -0.000572 | |
| Main dike east | AUFA | 0.82324 | -0.000204 | |
| Main dike west | AUFA | 0.69406 | -0.000432 | |
| Overburden | AUFA | 0.7142 | 0.000082 | |
| Sandy unit | AUFA | 0.83864 | -0.000204 | |
| SH | AUFA | 0.91817 | -0.00049 | |
| Upper sed unit | AUFA | 0.8341 | -0.000672 | |
| Other | AUFA | 0.70766 | 0.000235 |
| 11.3.7 | Search Strategy and Grade Interpolation Parameters |
Resource estimation was completed within an area encompassing the deposit with block model geometry and extents as presented in Table 11-19 using Leapfrog EDGE software with US Customary units. A parent block size of 6.10 m in the X (across strike) by 7.62 m in the Y (along strike) directions by 7.62 m in the Z (vertical) direction was chosen for the model.
| Table 11-19: | Block Model Parameters (Mine Grid X, Y, Z in meters) |
| BV_20x25x25 2026_1 Parameter | X (m) | Y (m) | Z (m) | |
| Extents | Block | 6.10 | 7.62 | 7.62 |
| Base Point | -5,028.95 | -11,002.74 | 1,920.15 | |
| Boundary | 5,028.95 | 4,084.12 | 1,280.10 | |
| Rotation | Azimuth | Dip | Pitch | |
| 0 | 0 | 0 | ||
The estimated variables in the cell model are listed in Table 11-20.
| 11-36 | |
| SSR Mining Inc. | Marigold Complex | October 9, 2026 |
| S-K 1300 Technical Report Summary | SLR Project No.: 138.020810.00001 |
| Table 11-20: | Estimated Variables |
| Element | Variable
Name |
Description | Domains | Remarks |
| Au | AuBEST | Au Fire Assay Merged with Au Cyanide Leachable | Lithology/Au-grade shell-based | Estimated from composite values of AUFA with missing values replaced with cyanide leachable assays where they exist. |
| AUCE | Au Cyanide Leachable Equivalent | Lithology/Au-grade shell-based | Calculated from AUCN with missing values replaced with cyanide leachable assay equivalent values calculated using cyanide leachable – fire assay regressions. | |
| AUFA | Au Fire Assay | Lithology/Au-grade shell-based | Estimated directly from Au fire assay composite data | |
| AUCN | Au Cyanide Leachable | Lithology/Au-grade shell-based | Estimated directly from Au cyanide leachable composite data | |
| Cu | CU | Cu grades | Lithology/Cu-grade shell-based | Estimated from ICP composites |
| S | STOT | S grades | Lithology/S-grade shell-based | Estimated from LECO composites |
| TCF | TCF | Bulk density (ft3 / st) | Lithology-based | Assigned from averages of relevant domain |
| 11.3.7.1 | Estimation Domaining |
Six 3D volumetric models were constructed to serve as estimation domains, as listed in Table 11-21.
| Table 11-21: | Volumetric Models Generated for Estimation Domaining and Grade Estimation |
| Model Name | Target | Number
of Components |
Construction
Elements |
| Buffalo Valley Live Model | AUFA/AUBEST/AUCN/AUCE | 14 | lithologies |
| Buffalo Valley Live Model NOTOPO | AUFA/AUBEST/AUCN/AUCE | 14 | lithologies |
| Mineralization Model 2026_1 | AUBEST/AUCE | 5 | lithologies/Au grade shell domains |
| Cu_2026_1 | Cu ppm | 4 | lithologies/Cu grade shell domains |
| Topo Model | topography | 2 | topography |
| Mineralization Model | STOT ppm (LECO) | 3 | grade isoshells |
| 11-37 | |
| SSR Mining Inc. | Marigold Complex | October 9, 2026 |
| S-K 1300 Technical Report Summary | SLR Project No.: 138.020810.00001 |
| 11.3.7.2 | Contact Analysis |
Contact analysis for exploration composites was used to investigate the extension of the hard or soft domain boundaries.
The boundary analysis graph for the Mineralized Au domain representing Buffalo Valley – Dore Hills is interpreted as suitable for hard boundary estimation and is shown in Figure 11-14.
| Figure 11-14: | Buffalo Valley-Dore Hills Mineralized Shell Boundary Conditions |
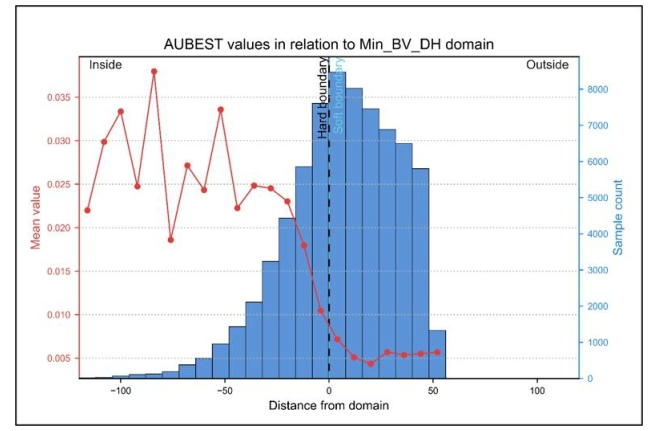
Source: SSR 2026
Note: Distance is given in feet; grade is given in ounce per short ton.
The boundary analysis graph for the Front Fault Ore Zone into the surrounding mineralized domain is interpreted as suitable for soft 1.52 m boundary estimation and is shown in Figure 11-15.
| 11-38 | |
| SSR Mining Inc. | Marigold Complex | October 9, 2026 |
| S-K 1300 Technical Report Summary | SLR Project No.: 138.020810.00001 |
| Figure 11-15: | FFOZ Boundary Conditions |
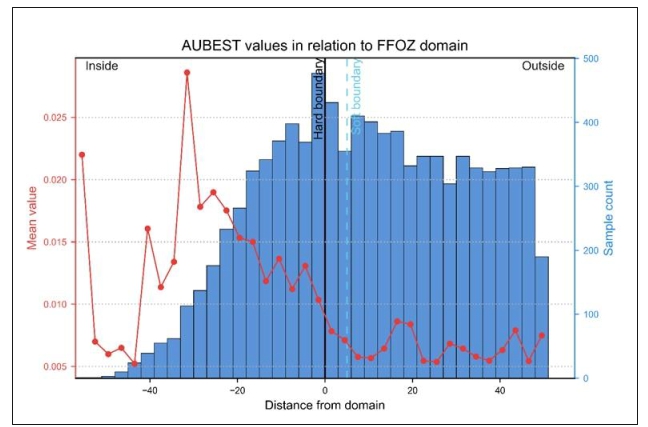
Source: SSR 2026
Note: Distance is given in feet; grade is given in ounce per short ton.
Boundary conditions are often ambiguous due to the large size of the mineralized domains due to the very low cutoff grade defining them. Consequently, domain boundaries with ambiguous character were assigned hard boundaries.
The types of boundaries used by domain are outlined in Table 11-22.
| Table 11-22: | Estimation Domain Boundary Types |
| Domain | Boundary Type | Range
(m) |
| FFOZ | Soft | 1.52 |
| Min_BV_DH | Hard | 0 |
| Min_WH | Hard | 0 |
| LG | Hard | 0 |
| OVB | Hard | 0 |
| 11-39 | |
| SSR Mining Inc. | Marigold Complex | October 9, 2026 |
| S-K 1300 Technical Report Summary | SLR Project No.: 138.020810.00001 |
| 11.3.7.3 | Search Neighborhood Design |
An initial estimate for AUBEST was carried out using the relevant variogram range as the upper limit. This was found to be too restrictive, and subsequently, estimates were made to a range limit of twice the variogram range.
Most domains were estimated with variable search and variogram orientations based on the local lithological and grade trends. Some domains with limited or ambiguous data were estimated using fixed orientations.
A minimum of three and a maximum of 12 composites, drawn from a maximum of two composites per drill hole, were used for estimation. This ensured that at least two holes were used for estimating each block.
Grade interpolation parameters for the kriging estimators for AUBEST are summarized in Table 11-23.
| Table 11-23: | Grade Interpolation Parameters for AUBEST/AUCE |
| Domain | Ellipse Ranges | Ellipsoid
Directions |
Variable
Orientation |
Sample Limits | ||||||
| Max
(m) |
Int (m) |
Min (m) |
Dip | Dip Azi. |
Pitch | Min | Max | Max
Samples per Hole | ||
| BV_DH | 200 | 200 | 80 | Variable Orientation BV_DH | 3 | 12 | 2 | |||
| FFOZ | 330 | 200 | 50 | Variable Orientation FFOZ | 3 | 12 | 2 | |||
| LG | 180 | 120 | 100 | Variable Orientation BV_DH_Warthog Blend | 3 | 12 | 2 | |||
| Ovb | 920 | 760 | 100 | 6 | 270 | 155 | None | 3 | 12 | 2 |
| WH | 200 | 200 | 80 | Variable Orientation Warthog | 3 | 12 | 2 | |||
| 11.3.8 | Bulk Density |
Table 11-24 shows the density assigned by geological formation. The average density for each formation has been assigned to blocks. Lithologies with no data have been assigned to be 2.564 t/m3 and in the absence of updates, the density for the dump material was assigned to be 1.908 t/m3.
| Table 11-24: | Density Assignments |
| Name | Density
(t/m3) |
| Base limestone | 2.610 |
| Crosscut west | 2.688 |
| Hav Basalt | 2.725 |
| 11-40 | |
| SSR Mining Inc. | Marigold Complex | October 9, 2026 |
| S-K 1300 Technical Report Summary | SLR Project No.: 138.020810.00001 |
| Name | Density
(t/m3) |
| Overburden | 2.095 |
| Sandy unit | 2.564 |
| Cs | 2.679 |
| Sh | 2.608 |
| Default | 2.564 |
| Dump | 1.908 |
| 11.3.9 | Classification |
Mineral Resources have been classified in accordance with the definitions presented in Section 11.2.8. Classification of the Mineral Resources reported in this TRS is based on the QP's assessment of geological confidence, grade continuity, data quality, and drill hole spacing. Based on these factors, Mineral Resources have been categorized as Measured, Indicated, or Inferred
Mineral Resource material was classified using criteria based on the average distance to the closest three informing composites as summarized in Table 11-25.
| Table 11-25: | Classification Rules |
| Material | Measure | Threshold | Outcome |
| Mineralized Stockpile | Not in Resources | ||
| In Situ | Average distance to 3 closest composites | <= 27.43m | Indicated |
| Average distance to 3 closest composites | 27.43<x<=39.62 | Inferred | |
| All other mineralized material | >39.62 | Not in Resources |
| 11-41 | |
| SSR Mining Inc. | Marigold Complex | October 9, 2026 |
| S-K 1300 Technical Report Summary | SLR Project No.: 138.020810.00001 |
| Figure 11-16: | Classification – Buffalo Valley Deposit (Looking N at 31550N With a 25’ Window) |
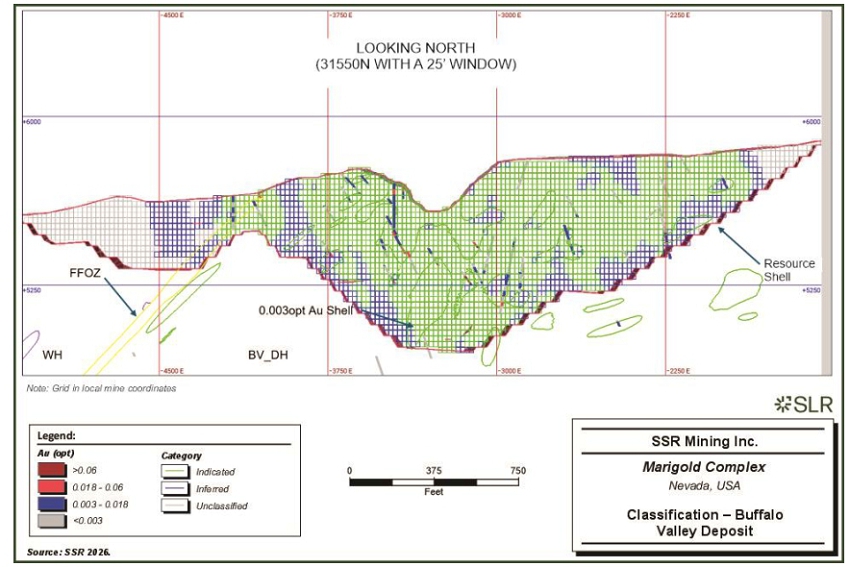
| 11-42 | |
| SSR Mining Inc. | Marigold Complex | October 9, 2026 |
| S-K 1300 Technical Report Summary | SLR Project No.: 138.020810.00001 |
| 11.3.9.1 | QP Comments on Classification |
In the SLR QP’s opinion, the classification of Mineral Resources is reasonable and appropriate for Mineral Resource disclosure, and there is a reasonable expectation that the majority of Inferred Mineral Resources could be upgraded to Indicated Mineral Resources with continued exploration.
| 11.3.10 | Estimation Validation |
The Buffalo Valley block model estimates were validated using industry standard techniques, including:
| · | Local validation using visual inspections on sections and plans, viewing composites versus block estimates. |
| · | Global validation by comparison of composite statistics versus block estimates. |
| · | Local validation by comparison of average assay grades with average block estimates along different directions (swath plots). |
The SLR QP found grade continuity to be reasonable and confirmed that the block grades were reasonably consistent with local drill hole composite grades.
| 11.3.10.1 | Visual Inspection |
The block model estimates were reviewed by W-E and N-S sections and reasonably conform to the composite data. Examples for AUBEST, in the W-E sections, are shown in Figure 11-17.
| 11.3.10.2 | Estimation Statistics |
The statistical summary of gold grade estimates is summarized in Table 11-26.
| 11-43 | |
| SSR Mining Inc. | Marigold Complex | October 9, 2026 |
| S-K 1300 Technical Report Summary | SLR Project No.: 138.020810.00001 |
| Figure 11-17: | Cross Section Buffalo Valley Deposit (-31550N, $2500 Resource Shell, 25ft Section Window, MII Only) |
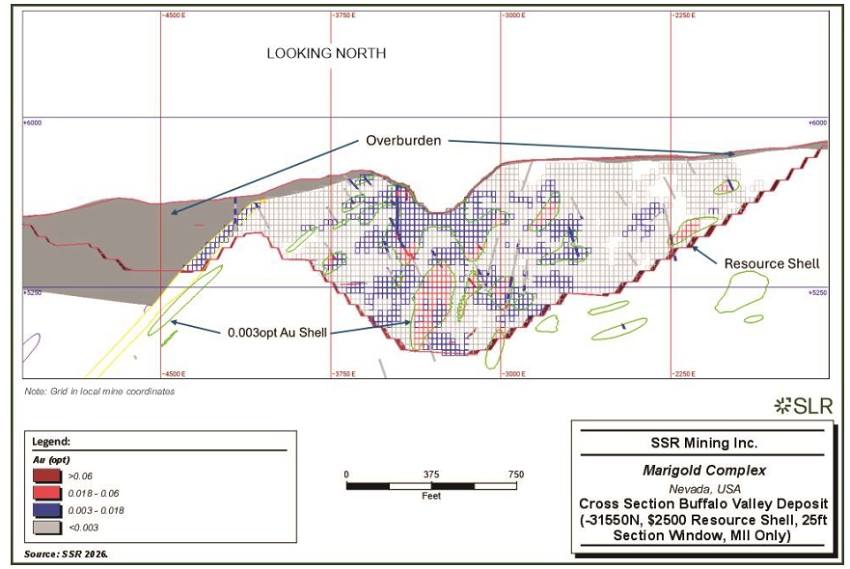
| 11-44 | |
| SSR Mining Inc. | Marigold Complex | October 9, 2026 |
| S-K 1300 Technical Report Summary | SLR Project No.: 138.020810.00001 |
| Figure 11-18: | Cross Section Buffalo Valley Deposit (-32400N, $2500 Resource Shell, 25ft Section Window, MII Only) |
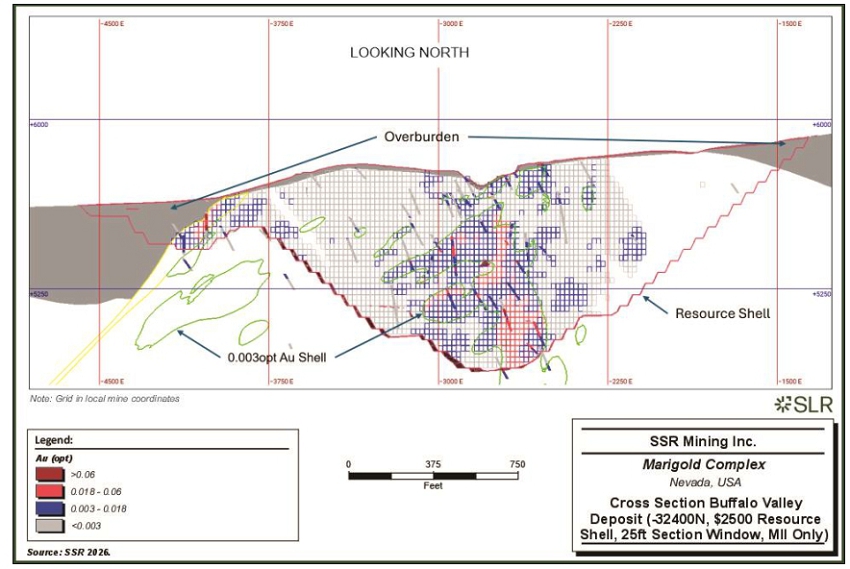
| 11-45 | |
| SSR Mining Inc. | Marigold Complex | October 9, 2026 |
| S-K 1300 Technical Report Summary | SLR Project No.: 138.020810.00001 |
| Table 11-26: | Statistical Summary of Gold Grade Estimates (g/t) |
| Domain | AUBEST Composites | NN Estimates | ID2 Estimates | OK Estimates | |||||||||||||
| Count | Mean | Variance | Min | Max | Mean | Variance | Min | Max | Mean | Variance | Min | Max | Mean | Variance | Min | Max | |
| (g/t) | (g/t) | (g/t) | (g/t) | (g/t) | (g/t) | (g/t) | (g/t) | (g/t) | (g/t) | (g/t) | (g/t) | ||||||
| FFOZ | 1,613 | 0.470 | 0 | 0.003 | 13.356 | 0.269 | 0 | 0.003 | 2.743 | 0.200 | 0 | 0.013 | 2.658 | 0.216 | 0 | 0.017 | 2.203 |
| Min_BV_DH | 888 | 0.621 | 0 | 0.003 | 31.625 | 0.534 | 0 | 0.006 | 10.286 | 0.429 | 0 | 0.017 | 8.538 | 0.438 | 0 | 0.017 | 5.201 |
| Min_WH | 58 | 0.459 | 0 | 0.019 | 19.354 | 0.354 | 0 | 0.017 | 2.057 | 0.155 | 0 | 0.017 | 2.049 | 0.172 | 0 | 0.017 | 5.904 |
| LG | 225 | 0.072 | 0 | 0.002 | 14.229 | 0.018 | 0 | 0.002 | 0.514 | 0.017 | 0 | 0.002 | 0.506 | 0.017 | 0 | 0.003 | 0.359 |
| 11-46 | |
| SSR Mining Inc. | Marigold Complex | October 9, 2026 |
| S-K 1300 Technical Report Summary | SLR Project No.: 138.020810.00001 |
| 11.3.10.3 | Swath Plots |
Swath plots were generated for strategic domains and for the global estimates and grade patterns they are reasonable in comparison with the composite data and alternative estimation methods (inverse distance squared and nearest neighbor).
Swath plots for AUBEST estimates in the Buffalo Valley – Dore Hills Mineralized shell domain is shown in Figure 11-19 to Figure 11-21, inclusive. The black line represents composite data, purple = Kriged estimates, green = inverse distance to the second power and red represents nearest neighbor. The grey histogram represents the number of blocks per swath.
| 11-47 | |
| SSR Mining Inc. | Marigold Complex | October 9, 2026 |
| S-K 1300 Technical Report Summary | SLR Project No.: 138.020810.00001 |
| Figure 11-19: | Swath Plot X for AUBEST |
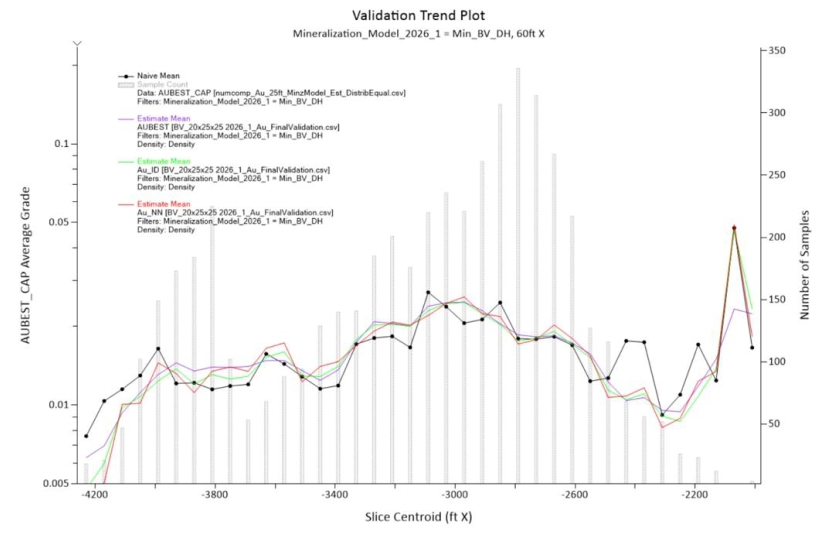
Source: SSR 2026
Note: grade in opt and distance in feet.
| 11-48 | |
| SSR Mining Inc. | Marigold Complex | October 9, 2026 |
| S-K 1300 Technical Report Summary | SLR Project No.: 138.020810.00001 |
| Figure 11-20: | Swath Plot Y for AUBEST |
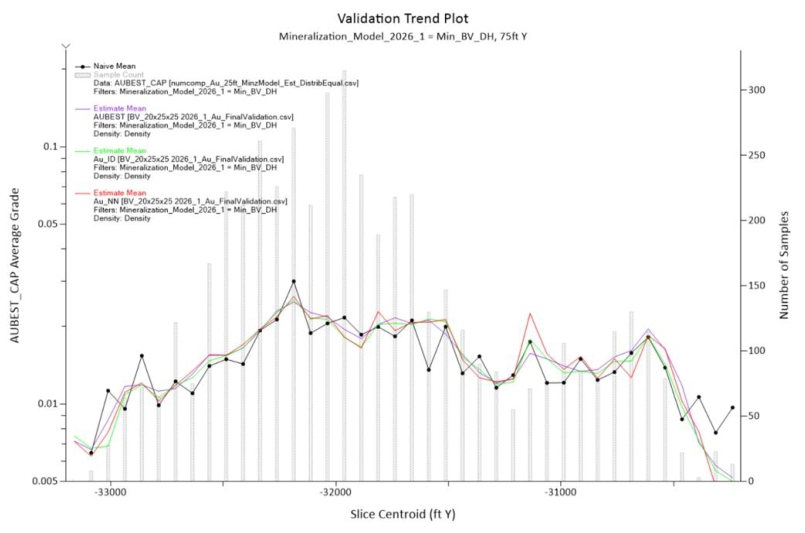
Source: SSR 2026
Note: grade in opt and distance in feet.
| 11-49 | |
| SSR Mining Inc. | Marigold Complex | October 9, 2026 |
| S-K 1300 Technical Report Summary | SLR Project No.: 138.020810.00001 |
| Figure 11-21: | Swath Plot Elevation for AUBEST |
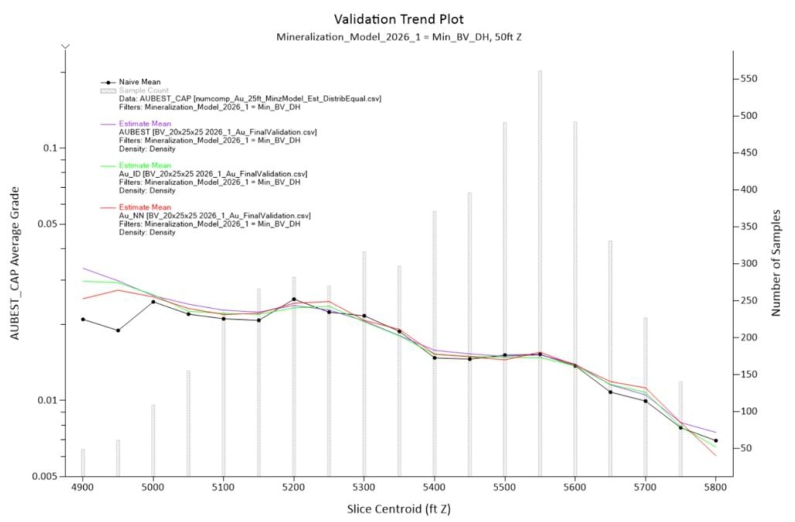
Source: SSR 2026
Note: grade in opt and distance in feet.
| 11-50 | |
| SSR Mining Inc. | Marigold Complex | October 9, 2026 |
| S-K 1300 Technical Report Summary | SLR Project No.: 138.020810.00001 |
| 11.3.11 | Prospects of Economic Extraction for Mineral Resources |
Mineral Resources must demonstrate reasonable prospects for economic extraction (RPEE), which generally implies that the quantity and grade estimates meet certain economic thresholds and that the Mineral Resources are reported at an appropriate cut-off grade, taking into account extraction scenarios.
Metal prices used for reserves are based on consensus, long-term forecasts from banks, financial institutions, and other sources. For resources, metal prices used are slightly higher than those for reserves.
A reporting cut-off grade for the Buffalo Valley deposit based on assumed costs for open-pit extraction and heap leach processing and commodity prices that provide a reasonable basis for establishing the prospects of economic extraction for Mineral Resources was established and reviewed by the SLR QP.
| 11.3.11.1 | Cut-Off Grade Estimation with Whittle Optimization Parameters |
Mineral Resources for Buffalo Valley were calculated based on an optimized pit using a regularized block model set to the parent block size of 7.62 m in the X (across strike) by 7.62 m in the Y (along strike) by 7.62 m in the Z (vertical) at cut-off grades based on lithology type using an assumed gold price of $2,500/oz. Input parameters for optimization are provided in Table 11-27.
| Table 11-27: | Buffalo Valley Resource Pit Parameters and Cut-off Grades |
| Parameters (*) | Unit | Value |
| Gold Price | US$/oz | 2,500 |
| Refining | US$/oz | 1.43 |
| Royalties | 3.5% | |
| Processing Au Recovery | % | 3.1% – 81.0% |
| Payable Au | % | 100.00% |
| Mining Dilution | % | 1 |
| Processing Cost* | US$/t ore | 2.66 |
| Mining Cost* | US$/t ore | 1.76 |
| Cut-off Grade - Full | g/t | 0.1g/t – 0.32g/t |
| * Mineral Resources for Buffalo Valley were calculated using a Hexagon MinePlan-optimized pit and a regularized block model at cut-off grades based on lithology type, factored for recovery, royalty, and net proceeds, with an assumed gold price of $2,500/oz. | ||
The gold price of $2,500/oz was selected after consideration of the pricing information described in Section 16, including the time frame used for the selection and the reasons for selecting that time frame. The metal price reflects the range of publicly reported price estimates for Mineral Resource cut-offs. The Marigold Mineral Resource is assumed to be mined by open pit.
| 11-51 | |
| SSR Mining Inc. | Marigold Complex | October 9, 2026 |
| S-K 1300 Technical Report Summary | SLR Project No.: 138.020810.00001 |
By definition, the estimation of Mineral Resources has considered environmental, permitting, legal, title, taxation, mining, metallurgical, infrastructure, socio-economic, marketing, and political factors and other constraints, as discussed in various sections of the TRS.
| 11.3.12 | Mineral Resource Reporting |
Mineral Resources are reported from Minesight software using a regularized block model. SLR is unaware of any current environmental, permitting, legal, title, taxation, socio- economic, marketing, political, or other relevant factors that could materially affect the Mineral Resources estimate for Marigold (exclusive of Mineral Reserves) as of May 1, 2026, presented in Table 11-28.
| Table 11-28: | Details of Buffalo Valley Mineral Resources Estimate Exclusive of Mineral Reserves as of May 1, 2026 |
| Category | Tonnes (Mt) |
Grade (g/t Au) |
Contained
Metal (Moz Au) |
Cut-off
Grade (g/t Au) |
Metallurgical
Recovery (%) |
| Measured | 0.0 | 0.0 | 0.00 | 0.10 to 0.32 | 0.0% |
| Indicated | 5.6 | 0.53 | 0.09 | 0.10 to 0.32 | 59.1% |
| Total Measured + Indicated | 5.6 | 0.53 | 0.09 | 0.10 to 0.32 | 59.1% |
| Inferred | 11.2 | 0.31 | 0.11 | 0.10 to 0.32 | 64.4% |
Notes: 1. The Mineral Resource estimate was prepared in accordance with S-K 1300. 2. The effective date of Mineral Resources at Buffalo Valley is May 1, 2026. 3. Buffalo Valley is based on a cut-off grade of 0.10 to 0.32 g/t contained gold, depending on material type. 4. Buffalo Valley metallurgical recoveries vary by gold grade and lithology. Buffalo Valley's average recovery is 62.6%. 5. For Buffalo Valley, bulk densities (in t/m3) were assigned by lithology, ranging from a low of 2.095 (Overburden) to a high of 2.725 (Basalt). 6. The Mineral Resources estimate is reported below the as-mined surface as of May 1, 2026, for Buffalo Valley. 7. The point of reference for Mineral Resources is the entry to the carbon columns in the processing facility. 8. Mineral Resources are reported exclusive of Mineral Reserves. 9. SSR has 100% ownership of the Marigold Complex. 10. All ounces reported represent troy ounces, and g/t represents grams per metric tonne. 11. Totals may vary due to rounding.
| |||||
| 11.3.13 | Comparison with Previous Estimate |
The 2026 Mineral Resource exclusive of Mineral Reserves has been compared with the previous December 31, 2025 Mineral Resource estimate as reported in SSR’s 2025 Form 10-K filing (SSR 2025) for Buffalo Valley.
There has been an increase in Indicated contained gold ounces of 24 koz and an increase in Inferred gold ounces of 64 koz. The change can be attributed to the following:
| · | Conversion of Resources to Reserves due to increased reserve prices and infill drilling |
| · | Re-interpretation of the mineralized envelopes using the most updated drill hole and geological mapping information |
| 11-52 | |
| SSR Mining Inc. | Marigold Complex | October 9, 2026 |
| S-K 1300 Technical Report Summary | SLR Project No.: 138.020810.00001 |
| 11.3.14 | Mineral Resource Uncertainty |
Mineral Resources are not Mineral Reserves and do not have demonstrated economic viability, nor is there certainty that all or any part of the Mineral Resource estimated here will be converted to Mineral Reserves through further study.
Sources of uncertainty that may affect the reporting of Mineral Resources include sampling or drilling methods, data processing and handling, geologic modeling, and estimation. There are sources of uncertainty in the MRE for the Buffalo Valley deposit that depend on the assigned classification. The SLR QP has not identified any relevant technical and/or economic factors that require resolution with regard to the Mineral Resource estimate.
| 11.3.15 | QP Opinion |
The SLR QP reviewed the assumptions, parameters, and methods used to prepare the Mineral Resources Statement and is of the opinion that the Mineral Resources are estimated and prepared in accordance with S-K 1300.
The SLR QP is of the opinion that, with consideration of the recommendations summarized in Sections 1 and 23 of this TRS, any issues relating to all relevant technical and economic factors likely to influence the prospect of economic extraction can be resolved with further work.
| 11-53 | |
| SSR Mining Inc. | Marigold Complex | October 9, 2026 |
| S-K 1300 Technical Report Summary | SLR Project No.: 138.020810.00001 |
| 12.0 | Mineral Reserve Estimates |
| 12.1 | Summary |
The Mineral Reserve estimate (MRE) for Marigold and Buffalo Valley, as of May 1, 2026, was completed by the site technical department, and is presented in Table 12-1.
The SLR QP reviewed the assumptions, parameters, and methods used to prepare the Mineral Resources Statement and is of the opinion that the Mineral Resources are estimated and prepared in accordance with the U.S. Securities and Exchange Commission (US SEC) Regulation S-K subpart 1300 rules for Property Disclosures for Mining Registrants (S-K 1300).
The SLR QP considers that the knowledge of the deposit setting, lithologies, structural controls on mineralization, and the mineralization style and setting is sufficient to support the MRE to the level of classification assigned.
The SLR QP considers that the integration of the reserve cut-off grade, operational cost parameters, metallurgical recoveries, and practical mine plan shapes including engineered pit designs and pushbacks, effectively established the economic viability of the Mineral Reserve. These parameters accurately delineate the portions of the Measured and Indicated Mineral Resources that can be mined and processed economically, which aligns with the bulk-mineable, disseminated nature of the gold mineralization at the Property.
The level of uncertainty has been adequately reflected in the classification of Mineral Resources for the Property. The MRE presented may be materially impacted by any future changes in the break-even cut-off grade, which may result from changes in mining method selection, mining costs, processing recoveries and costs, metal price fluctuations, or significant changes in geological knowledge.
| 12-1 | |
| SSR Mining Inc. | Marigold Complex | October 9, 2026 |
| S-K 1300 Technical Report Summary | SLR Project No.: 138.020810.00001 |
| Table 12-1: | Summary of Marigold Mineral Reserves Estimate as of May 1, 2026 |
| Proven | Probable | Total | Cut- off Grade (g/t) |
Metallurgical Recovery (%) | |||||
| Tonnage (Mt) |
Au
Grade (g/t) |
Tonnage (Mt) |
Au
Grade (g/t) |
Tonnage (Mt) |
Au
Grade (g/t) |
Contained
Gold (Moz) | |||
| Marigold | - | - | 240.44 | 0.46 | 240.44 | 0.46 | 3.52 | 0.069 | 73.5% |
| Buffalo Valley | - | - | 45.33 | 0.46 | 45.33 | 0.46 | 0.67 | 0.069˟ | 65.9% |
| Stockpile | - | - | 11.96 | 0.17 | 11.96 | 0.17 | 0.06 | 0.069 | 56.3% |
| Leach Pad Inventory | - | - | 61.01 | 0.19 | 61.01 | 0.19 | 0.37 | - | 65.2% |
| Total | - | - | 358.74 | 0.40 | 358.74 | 0.40 | 4.63 | 0.069 | 71.5% |
Notes: 1. The Mineral Reserve estimate was prepared in accordance with S-K 1300 definitions. 2. The Marigold Mine Mineral Reserve estimate is based on a metal price assumption of $2,200/oz gold and is reported at a cut-off grade of 0.069 g/t payable Au (Au assay factored for recovery, royalty, and net proceeds). 3. °The Buffalo Valley Mineral Reserve estimate assumes ROM heap leach processing and a gold price of $2,200/oz. Cut-off grades range from 0.069 to 1.767 g/t payable Au, and metallurgical recoveries range from 3.1% to 79.2%, both varying by lithology/metallurgical domain. 4. No mining dilution is applied to the grade of the Mineral Reserves. Dilution intrinsic to the Mineral Reserves estimate is considered sufficient to represent the mining selectivity considered. 5. Bulk densities (in t/m3) were assigned by lithologies: alluvium = 2.10, Havallah = 2.48, Valmy/Antler = 2.4076+(0.0001*DEPTH), and Valmy = 2.64. For Buffalo Valley, bulk densities (in t/m3) were assigned by lithology ranging from a low of 2.426 (Overburden) to a high of 2.737 (Basalt) with a weighted average of 2.63. 6. The Property is 100% owned by SSR through its subsidiary MMC. 7. All ounces reported represent troy ounces, and g/t represents grams per metric tonne. 8. The point of reference for Mineral Reserves is the entry to the carbon columns in the processing facility. 9. Totals may vary due to rounding.
| |||||||||
The SLR QP is unaware of any current environmental, permitting, legal, title, taxation, socio-economic, marketing, political, or other relevant factors that could materially affect the Mineral Reserves estimate as of May 1, 2026.
This section describes the methodology and parameters used to estimate the Mineral Reserves for Marigold and Buffalo Valley. The Mineral Reserves estimate as of May 1, 2026, considers all information used in the Mineral Resources estimate as of May 1, 2026, as presented in Section 11.
| 12.2 | Marigold |
| 12.2.1 | Conversion to Mineral Reserves |
Mineral Reserves have been classified in accordance with the U.S. Securities and Exchange Commission (US SEC) Regulation S-K subpart 1300 rules for Property Disclosures for Mining Registrants (S-K 1300). The Mineral Reserves estimate is summarized in Table 12-1.
Pit optimizations were run on the Mineral Resources cell model using Pseudoflow algorithm to generate optimal pit limits based on block value at a range of gold prices.
The ultimate pits and subsequent phase designs were developed from the $2,200/oz optimization runs. The gold price assumption was based on an internal assessment of recent market prices, long-term forward curve prices, and consensus among analysts regarding price estimates.
| 12-2 | |
| SSR Mining Inc. | Marigold Complex | October 9, 2026 |
| S-K 1300 Technical Report Summary | SLR Project No.: 138.020810.00001 |
At Marigold, inter-ramp angles (IRAs) for the final pit design are between 35° and 38° in mined fill and range between 45° and 49° in rock.
Mining costs are based on historical values and budgeted costs that include an incremental haulage component using estimated haul cycle times and pit depths. Processing and general and administrative (G&A) costs were estimated based on historical values and budgeted costs. Estimated sustaining capital costs, royalties, severance taxes, and reclamation costs were also included in the optimization costs.
The Mineral Reserves for Marigold were estimated using the as-mined surface at May 1, 2026, with the following assumptions and parameters:
| · | There are no Measured Resources in the Mineral Resources model. Indicated Mineral Resources within the final pit design are converted to Probable Mineral Reserves. Inferred Mineral Resources are not considered in the Mineral Reserves estimation. |
| · | The mining recovery is 100% within the pit design. |
| · | The Mineral Resources were not diluted. Internal dilution included in the Mineral Resource estimate is considered adequate. |
| · | The Mineral Reserves estimate assumes that mining operations will continue to use the current Marigold mining methods, as described in Section 13. |
| · | The estimated cut-off grade was 0.069 g/t (0.002 opt) payable Au (Au assay factored for recovery, royalty, and net proceeds). |
| · | The leach pad inventory of 0.374 Moz Au is included in the Mineral Reserves, in addition to the material that is placed on top of the leach pads. |
| 12.2.1.1 | Stockpiles |
On the surface of the mining phase areas 8S Extension (8Sx) and M7 are historical OBSA from material mined during the late 1990s and early 2000s when cut-off grades were higher than the current cut-off grades. While drilling the HideOut and 8Sx targets, samples from these OBSA were also assayed for gold, with a majority of these samples returning gold values higher than the current cut-off grade. To confirm the grades, 37 sonic drill holes were drilled in 2016. These drill holes confirmed the gold grades in the historical OBSA, hereinafter referred to as “mineralized stockpiles” or “stockpiles”.
| 12.2.2 | Cut-off Grade |
The estimated cut-off grade for Mineral Reserves was based on a $2,200/oz gold price. The gold price of $2,200/oz was selected following current industry guidelines and corporate strategy. The metal price is representative of the range of price estimates publicly reported for Mineral Reserve cut-offs. Factors used to estimate the cut-off grade are outlined in Table 12-2, and include refining charges, royalties, and net proceeds tax. Operating costs were based on historical costs and budgeted estimates.
An average recovery rate of 72.6% was used to estimate the cut-off grade based on the average of model recoveries from an audit completed by SLR in January 2026, noting that individual block recoveries are determined using the model formula presented in Table 12-2.
| 12-3 | |
| SSR Mining Inc. | Marigold Complex | October 9, 2026 |
| S-K 1300 Technical Report Summary | SLR Project No.: 138.020810.00001 |
| Table 12-2: | Key Economic Parameters for Mineral Reserves Estimate - Marigold |
| Parameters | Unit | Marigold Value |
| Gold Price | US$/oz | 2,200 |
| Gold Sales, Insurance, Legal and Social | US$/oz | N/A1 |
| Royalties | US$/oz | 0–10% (0–220)1 |
| Total Selling Cost | US$/oz | 0–10% (0–220)1 |
| Processing Au Recovery | % | AuCN/AuFA * 0.921 |
| Payable Au | % | 100.0% |
| Mining Dilution | % | 1.00 |
| Processing Cost | US$/t | 2.16 |
| Sustaining CAPEX | US$/t | 0.18 |
| Operational Support (G&A) | US$/t | 0.17 |
| Total | US$/t | 2.53 |
| Marginal Cut-off Grade | g/t | 0.061 |
| Rounded Cut-Off Grade2 | g/t | 0.069 |
Notes: 1. The cut-off grade is calculated based on the AUPAY variable from the Mineral Resource Block Model. The processing recovery is included in the AUPAY variable as AUCN/AUFA * 0.92 (both are Nearest Neighbor estimates), Refining Charges, Royalties and Net Proceeds Tax. 2. The laboratory assay methods have three decimal precision, rounding the last number where relevant. This results in the cut-off being rounded down to 0.002 opt (0.069 g/t). 3. The total cost structure itemizes processing, sustaining capital, and operational support costs separately as shown in the table above. 4. The Mining Costs are based on historical values, coded into a script using a Python library to calculate costs.
| ||
| 12.2.3 | Royalties, Net Proceeds and Excise Tax |
NSR royalty payments vary between 0% and 10% of the value of production net of off-site refining costs, which is equal to an annual average range of 3.3% to 10% and a weighted average of 6.9% over the LOM.
The State of Nevada imposes a yearly tax on the net proceeds of all mining operations conducted within the state, plus a yearly property tax on all fixed and mobile equipment used by the mining operation. The net proceeds tax is based on the income from the sale of all products from the mine minus: the royalties; mine, plant, and administration expenses sourced in the State of Nevada; development expenses paid during the year; prescribed depreciation of tangible assets according to set, pre-defined classifications contained in state regulations; and reclamation expenditures incurred during the year of the tax. A net proceeds tax of 5% was applied to the Mineral Reserves estimation.
In 2021, the State of Nevada enacted Assembly Bill 495, effective July 1, 2021, which is an annual excise tax on gold and silver revenue. Under the bill, the tax rates vary based on the taxpayer’s Nevada gross revenue. A 0.75% rate is imposed on Nevada gross revenue of more than $20 million; however, not more than $150 million in a taxable year (defined as the calendar year). A rate of 1.10% applies to Nevada gross revenue exceeding $150 million in any tax year. The LOM average rate for Marigold is approximately 1.0%.
| 12-4 | |
| SSR Mining Inc. | Marigold Complex | October 9, 2026 |
| S-K 1300 Technical Report Summary | SLR Project No.: 138.020810.00001 |
| 12.2.4 | Dilution |
No mining dilution was applied to the grade of the blocks. Dilution intrinsic to the Mineral Resources model is considered sufficient to represent the stated mining selectivity.
| 12.2.5 | Mining Recovery |
Mining recovery was assumed to be 100% of the Indicated Mineral Resources. Inferred Mineral Resources were assigned as waste.
| 12.2.6 | Comparison with Previous Estimates |
The Mineral Reserve estimate has been compared to the previous December 31, 2025 Mineral Reserve estimate as reported in SSR’s 2025 Form 10-K filing (SSR 2026), which was based on the EOY 2025 pit surface. Comparison of the current Mineral Reserve with the 2025 Mineral Reserve shows a net increase in contained gold of 1,668 koz (+73%) in the Proven and Probable categories. Changes have occurred from mine depletion, minor resource model updates, minor cost assumption changes, and most significantly, an increase in the gold price assumption from $1,700/oz to $2,200/oz combined with infill and resource conversion drilling, with new areas added to Reserves including DG 80, New Millennium, and Red Dot phase extensions.
| 12.2.7 | QP Opinion |
The SLR QP reviewed the assumptions, parameters, and methods used to prepare the Mineral Reserves Statement and is of the opinion that the Mineral Reserves are estimated and prepared in accordance with the U.S. Securities and Exchange Commission (US SEC) Regulation S-K subpart 1300 rules for Property Disclosures for Mining Registrants (S-K 1300).
The total Probable Mineral Reserves at the Marigold Mine including stockpiles are estimated to be 252.4 Mt grading 0.44 g/t Au, containing 3.58 Moz Au. Buffalo Valley is an additional 45.3 Mt grading 0.46 g/t Au, containing 0.67 Moz Au. The total Mineral Reserve is 358.7 Mt grading 0.40 g/ Au containing 4.63 Moz Au including 61.0 Mt grading 0.19 g/t Au containing 0.37 Moz Au of the Leach Pad inventory. The Marigold Mine Mineral Reserves support a LOM over 20 years of operational life, including fifteen years of active mining followed by an additional five years of processing the heap leach pad inventory, which currently contains 374 koz of gold. The 15 year period of active mining includes Buffalo Valley in the scheduling, for which mining starts in 2029 and lasts 5.3 years.
| 12.3 | Buffalo Valley |
| 12.3.1 | Conversion to Mineral Reserves |
Mineral Reserves have been classified in accordance with the U.S. Securities and Exchange Commission (US SEC) Regulation S-K subpart 1300 rules for Property Disclosures for Mining Registrants (S-K 1300). The Mineral Reserves estimate is summarized in Table 12-1.
Pit optimizations were run on the Mineral Resources cell model using Pseudoflow algorithm to generate optimal pit limits based on block value at a range of gold prices.
The ultimate pits and subsequent phase designs were developed from the $2,200/oz optimization runs. The gold price assumption was based on an internal assessment of recent market prices, long-term forward curve prices, and consensus among analysts regarding price estimates.
| 12-5 | |
| SSR Mining Inc. | Marigold Complex | October 9, 2026 |
| S-K 1300 Technical Report Summary | SLR Project No.: 138.020810.00001 |
At Buffalo Valley, inter-ramp angles (IRAs) for the final pit design are 34° in mined fill and range between 32° and 48° in rock at Buffalo Valley.
Mining costs are based on historical values of Marigold mine and budgeted costs that include an incremental haulage component using estimated haul cycle times and pit depths. Processing and general and administrative (G&A) costs were estimated based on historical values and budgeted costs. Estimated sustaining capital costs, royalties, severance taxes, and reclamation costs were also included in the optimization costs.
The Mineral Reserves for Buffalo Valley were estimated using the topographical surface at May 1, 2026 (incorporating historical as-mined surfaces), with the following assumptions and parameters:
| · | There are no Measured Resources in the Mineral Resources model. Indicated Mineral Resources within the final pit design are converted to Probable Mineral Reserves. Inferred Mineral Resources are not considered in the Mineral Reserves estimation. |
| · | The mining recovery is 100% within the pit design. |
| · | The Mineral Resources were not diluted. Internal dilution included in the Mineral Resource estimate is considered adequate. |
| · | The Mineral Reserves estimate assumes that mining operations will continue to use the current Marigold mining methods, as described in Section 13. |
| · | The estimated cut-off grade was 0.069 g/t (0.002 opt) payable Au (Au assay factored for recovery, royalty, and net proceeds). |
| 12.3.2 | Cut-off Grade |
The estimated cut-off grade for Mineral Reserves was based on a $2,200/oz gold price. The gold price of $2,200/oz was selected following current industry guidelines and corporate strategy. The metal price is representative of the range of price estimates publicly reported for Mineral Reserve cut-offs. Factors used to estimate the cut-off grade are outlined in Table 12-3, and include refining charges, royalties, and net proceeds tax. Operating costs were based on historical costs and budgeted estimates.
An average recovery rate of 66.5% was used to estimate the cut-off grade based on the average of model recoveries for ROM heap leach processing.
| Table 12-3: | Key Economic Parameters for Mineral Reserves Estimate – Buffalo Valley |
| Parameters | Unit | Buffalo Valley Value |
| Gold Price | US$/oz | 2,200 |
| Gold Sales, Insurance, Legal and Social | US$/oz | N/a |
| Royalties | US$/oz | 3.5% (77) |
| Total Selling Cost | US$/oz | 3.5% (77) |
| Processing Au Recovery | % | 3.1%–79.2% |
| Payable Au | % | 100.0% |
| Mining Dilution | % | 1.00 |
| Processing Cost | US$/t | 2.16 |
| 12-6 | |
| SSR Mining Inc. | Marigold Complex | October 9, 2026 |
| S-K 1300 Technical Report Summary | SLR Project No.: 138.020810.00001 |
| Parameters | Unit | Buffalo Valley Value |
| Sustaining CAPEX | US$/t | 1.08 |
| Operational Support (G&A) | US$/t | 0.17 |
| Total | US$/t | 3.74 |
| Marginal Cut-off Grade | g/t | 0.069 |
| Rounded Cut-Off Grade2 | g/t | 0.069 |
Notes: 1. The cut-off grade is calculated based on the AUKR variable from the Mineral Resource Block Model. This represents the majority cut-off; refer to the Mineral Reserve table 12-1 notes for domain specific ranges. 2. The processing cost includes sustaining capital and full site reclamation costs. 3. The mining costs are based on historical values of the current Marigold Mine, coded into a script using a Python library to calculate costs.
| ||
| 12.3.3 | Royalties, Net Proceeds and Excise Tax |
Net Smelter Return (NSR) royalty payments for the Buffalo Valley deposit are fixed at 3.5% of the value of production net of off-site refining costs.
State-level taxation, including the Nevada Net Proceeds Tax (applied at 5% for the Mineral Reserves estimation) and the Nevada Assembly Bill 495 annual excise tax, is governed under the same statutory framework described for the Marigold mine. A 0.75% rate is imposed on Nevada gross revenue of more than $20 million, however, not more than $150 million in a taxable year (defined as the calendar year). A rate of 1.10% applies to Nevada gross revenue exceeding $150 million in any tax year. The LOM average rate for Marigold is approximately 1.0%.
| 12.3.4 | Dilution |
The methodology and assumptions regarding mining dilution for the Buffalo Valley deposit are identical to those applied at the Marigold mine.
| 12.3.5 | Mining Recovery |
The mining recovery assumptions and application for the Buffalo Valley deposit are identical to those described for the Marigold mine.
| 12.3.6 | Comparison with Previous Estimates |
The Mineral Reserve estimate has been compared to the previous December 31, 2025 Mineral Reserve estimate as reported in SSR’s 2025 Form 10-K filing (SSR 2026). Comparison with the December 31, 2025 Mineral Reserves shows a net increase in contained gold of 107 koz (+19%) in the Proven and Probable Categories. The key change is attributable to the increase in the metal price assumption from $1,700/oz in December 2025 to $2,200/oz for the current TRS declaration.
The total Probable Mineral Reserves at the Buffalo Valley mine are estimated to be 45.3 million tonnes grading 0.46 g/t Au containing 0.67 Moz Au. Buffalo Valley is not yet permitted and is planned to contribute for 5.3 years of the total 15 years of active mining of the Marigold Complex, starting in 2029.
| 12-7 | |
| SSR Mining Inc. | Marigold Complex | October 9, 2026 |
| S-K 1300 Technical Report Summary | SLR Project No.: 138.020810.00001 |
| 12.3.7 | QP Opinion |
The SLR QP reviewed the assumptions, parameters, and methods used to prepare the Mineral Reserves Statement and is of the opinion that the Mineral Reserves are estimated and prepared in accordance with the U.S. Securities and Exchange Commission (US SEC) Regulation S-K subpart 1300 rules for Property Disclosures for Mining Registrants (S-K 1300).
| 12-8 | |
| SSR Mining Inc. | Marigold Complex | October 9, 2026 |
| S-K 1300 Technical Report Summary | SLR Project No.: 138.020810.00001 |
| 13.0 | Mining Methods |
Marigold uses standard open pit mining methods. Loading operations are currently performed using one electric shovel and three hydraulic shovels. Waste and ore haulage is performed with a fleet of 300 st payload primary haul trucks.
The previous LOM plan averaged a sustained mining rate of approximately 238,000 tonnes per day (tpd) with a max of 296,000 tpd and an active mine life of approximately 9 years. The LOM plan presented in this updated TRS has increased the mining rate to an average of 380,000 tpd with a peak of 505,000 tpd. The LOM has also increased to 15 years of active mining, without considering leach pad drawdown. The increase in daily rates is attributed to additional fleet purchases starting with 300 st payload haul trucks in 2027 and culminating in an additional P&H 4100-sized shovel purchase in Q1 2028. There will also be a Liebherr 9600-class front shovel added in 2027, and various support equipment. These additions eliminate the need for a separate fleet, which was originally thought necessary at Buffalo Valley.
Loading operations are currently performed using one electric shovel and three hydraulic shovels. Waste and ore haulage is performed with a fleet of 300 st payload primary haul trucks.
The mine conducts conventional drilling and blasting activities with a free face trim row blast to ensure stable wall rock conditions. Electronic detonators are used to control the timing of the blasthole detonation.
Drilling and blasting occur on benches with a height of 15.2 m. One grade control sample is taken from each blasthole with the sub-drilling excluded. Mining occurs on the full bench height (15.2 m) when pre-stripping waste or mining ore areas with the electric shovel. When using the smaller hydraulic shovels, mining is done on a bench height of 7.6 m to minimize the dilution that would otherwise occur from dozing a 15.2 m high face to these smaller shovels. Blasting is done with an ammonium nitrate and fuel oil (ANFO) blend and a sensitized ANFO emulsion. The ore control mark-out procedure includes blast movement analysis for 90% of ore production blasts.
The Marigold geotechnical management plan (GMP) includes highwall monitoring using three radar systems, which provide full coverage for the Mackay pit, the largest pit, or which can be deployed in the smaller pits, if required. Routine monitoring of OBSA, leach pads, and inactive pits using INSAR (interferometric synthetic-aperture radar) data is performed by a third party on a monthly basis.
Equipment maintenance is performed on site for all equipment. There are no contract mining operations on site, other than for blasting as detailed in Section 13.7.
| 13.1 | Geotechnical, Hydrological, Pit, and Other Design Parameters |
Geotechnical design criteria for the Marigold operation are based on historical slope performance, ongoing geotechnical monitoring, geotechnical drilling programs, laboratory testing, structural characterization, hydrogeologic investigations, and site-specific slope stability analyses. Open pit slope designs are developed according to lithology, structural orientation, groundwater conditions, and rock mass quality, with inter-ramp slope angles (45° to 49°) varying by geotechnical domain and wall orientation. The primary host rock across much of the operation remains the Valmy Formation, which generally supports steeper slope configurations where structural conditions are favorable. More recent investigations have demonstrated that locally flatter slopes may be required in areas affected by adverse structural conditions, weak clay horizons, altered tuff units, or elevated groundwater conditions.
| 13-1 | |
| SSR Mining Inc. | Marigold Complex | October 9, 2026 |
| S-K 1300 Technical Report Summary | SLR Project No.: 138.020810.00001 |
Since the previous TRS (SLR 2024), additional geotechnical investigations have been completed for the 5N1, 5N2, H1, Red Dot Phase 3, M7, and New Millenium mining areas. These programs included geotechnical core drilling, laboratory testing, televiewer surveys, structural mapping, groundwater monitoring, pore pressure assessments, and limit equilibrium slope stability analyses. The results have been incorporated into pit design, mine planning, geotechnical risk management, and groundwater control strategies. Collectively, the studies indicate that planned pit slopes satisfy applicable design acceptance criteria when appropriate operational controls and groundwater management practices are maintained.
The Marigold GMP remains the primary framework for managing geotechnical risks and is continuously updated as mining progresses. Slope performance is monitored using radar systems that provide continuous coverage of active mining areas and allow geotechnical personnel to identify and respond to developing instabilities. Monitoring is supplemented by routine field inspections, geological mapping, geotechnical reconciliation, and groundwater monitoring. Threshold movement criteria are established for monitored slopes and are integrated with operational response procedures.
Groundwater management remains an important component of slope design and mine planning. Mining below the regional groundwater table continues to be supported through active dewatering and depressurization programs. Recent pore pressure sensitivity analyses completed for Red Dot Phase 3 demonstrated that current groundwater conditions satisfy applicable slope stability criteria, although the analyses confirmed that slope stability remains sensitive to increases in pore pressure, particularly within upper slope areas. Continued groundwater monitoring and depressurization programs are therefore maintained to support long-term slope performance. The Plan of Operations (PoO) Amendment approved in 2019 permitted dewatering to allow mining below the water table. The mine dewatering plan is discussed in Section 13.14.
Haul roads, overburden storage areas, and leach pad facilities continue to be designed in accordance with established site criteria.
Haul road and ramp widths are designed for two-way traffic that accommodates 300 st class haul trucks. The total road width, including berms and ditches, is 36.4 m. The roads follow topography external to the pit and do not exceed a 10% grade. Ramps inside the pits are also designed at a 10% maximum grade.
Waste rock is placed in lifts of 15.2 m to 45.5 m high, with benches left on the outside edges to accommodate the final OBSA 3:1 slope design. There have been no OBSA stability issues on the Property. Sufficient storage capacity for waste rock material has been identified to support the mining production and LOM.
The leach pad is built with lifts of 6.1 m to 12.2 m high, with benches left on the outside edges for a final 3:1 slope pushdown. The leach pad is generally permitted to a 152.4 m height above the plastic liner at the base. As each new leach pad cell is designed and permitted, a geotechnical analysis is completed. There have been no leach pad stability issues on the Property.
No significant geotechnical stability issues have been identified in OBSAs or leach pad facilities during the reporting period.
| 13-2 | |
| SSR Mining Inc. | Marigold Complex | October 9, 2026 |
| S-K 1300 Technical Report Summary | SLR Project No.: 138.020810.00001 |
| 13.1.1 | Open Pit Geotechnical Reports Review |
Since completion of the previous Technical Report Summary, several geotechnical investigations have been completed to support slope design, groundwater management, and mine planning activities. Significant studies completed during this period include the following:
| · | CNI Analysis of Soil Slopes – H1, 5N1, and 5N2 (CNI 2021) |
| · | CNI Red Dot Phase 3 Pore Pressure Sensitivity Analysis (CNI 2024) |
| · | CNI Preliminary M7 Analysis Results (CNI 2025) |
| · | WSP Preliminary Pit Slope Design Recommendations for the New Millenium Expansion (WSP 2026a) |
| · | Marigold Waste Rock Dump Slope Stability Assessment (SSR 2026). |
These studies incorporated geotechnical drilling, laboratory testing, structural characterization, groundwater assessments, geotechnical logging, televiewer surveys, and limit equilibrium analyses. The study results have been integrated into pit and waste dump design criteria, groundwater management strategies, and mine planning activities.
| 13.1.1.1 | Overview of Geotechnical Report Review |
Recent investigations confirmed that geotechnical performance across the Marigold operation is governed by a combination of rock mass characteristics, structural controls, groundwater conditions, and the occurrence of localized weak materials. The principal geotechnical risks vary by mining area and include weak clay horizons within alluvial materials, altered tuff units, adverse bedding orientations, fault zones, and groundwater pressures.
Investigations completed in the northern pit areas (5N1, 5N2, and H1) identified significant clay horizons and localized tuff units within the alluvial sequence. Stability analyses demonstrated that these materials represent the primary controls on soil slope performance and may require reduced inter-ramp slope angles relative to historical Marigold designs. The studies concluded that slope stability in these areas is highly dependent on the geometry, continuity, and orientation of clay and tuff units.
A pore pressure sensitivity assessment completed for Red Dot Phase 3 confirmed that all evaluated slope sections currently satisfy the applicable design factor of safety (FoS) criteria. The analyses demonstrated that groundwater conditions remain an important control on long-term slope performance and support continuation of site dewatering and groundwater monitoring programs.
The M7 geotechnical program included drilling, structural characterization, geotechnical logging, and slope stability analyses. Results indicate that the current slope design satisfies required design acceptance criteria. The primary geotechnical concern identified for M7 is adverse pitward-dipping bedding along portions of the eastern wall, which may contribute to localized bench-scale instability. Groundwater conditions were found to be below planned mining elevations and are not expected to adversely affect slope stability under current assumptions.
The New Millenium geotechnical investigation included eleven geotechnical drill holes, laboratory testing, structural characterization, kinematic assessments, and slope stability analyses. The investigation concluded that acceptable slope performance can be achieved using sector-specific slope criteria. Structural controls, faulting, altered tuff horizons, and locally weak rock mass conditions were identified as the principal geotechnical design considerations. Preliminary recommendations support inter-ramp slope angles of approximately 46° to 49° within bedrock sectors and approximately 30° within alluvial and tuff materials.
| 13-3 | |
| SSR Mining Inc. | Marigold Complex | October 9, 2026 |
| S-K 1300 Technical Report Summary | SLR Project No.: 138.020810.00001 |
Overall, the recent geotechnical investigations support the current mine planning assumptions and indicate that pit slope performance can be effectively managed through site-specific slope design criteria, groundwater management, ongoing monitoring, and periodic updates to geologic and geotechnical models.
The current operations at Marigold Mine mostly focus on the interim pit phases. There has been minimal mining to the final highwall in the Mackay Pit area over the last few years, with the notable exception of the east wall, which has a lower IRA due to expected west-dipping bedding conditions. The vast majority of the west interim walls are designed shallower than the 45° to 49° overall slope angle (OSA). Blasting typically uses a production presplit pattern; however, trim shots are used to protect the integrity of the ramp when mining the first few benches of each phase.
The batter compliance data is skewed by delays in the compliance measurements, which occur after mining has advanced through the area. However, in practice, much of the rill is mined out by shovel mining with dozer support as required. For final highwalls, trim blasting is used rather than production presplit patterns.
| 13.1.1.2 | Buffalo Valley Geotechnical Design Criteria |
Buffalo Valley is located approximately 8 mi south of the Marigold operation and forms part of the greater Marigold Complex. A geotechnical feasibility study was completed by Call & Nicholas, Inc. (CNI) in 2025 and 2026 to support mine planning and slope design for the Buffalo Valley deposit. The investigation included geotechnical drilling, televiewer surveys, geotechnical logging, laboratory testing, hydrogeologic assessment, structural interpretation, and two-dimensional and three-dimensional slope stability analyses.
Geologic conditions at Buffalo Valley are broadly similar to those encountered elsewhere within the Marigold district and are dominated by Havallah sequence sedimentary rocks, limestone, metabasalt, intrusive rocks, and overburden deposits. Geotechnical investigations identified bedding orientation as the principal control on slope stability. Three geotechnical domains were established based on structural orientation, and pit slope designs were developed using sector-specific criteria that account for bedding orientation, groundwater conditions, and local geologic characteristics.
Groundwater conditions were incorporated into slope stability analyses using site hydrogeologic models and monitoring data. Investigations also identified localized high-plasticity clay horizons within portions of the overburden sequence that may influence slope performance where exposed in future pit walls. Continued groundwater monitoring, geotechnical drilling, and refinement of geologic and structural models were recommended as project development advances.
Overall slope stability analyses demonstrated that the recommended pit designs satisfy the adopted design acceptance criteria following localized slope optimization where required. Recommended inter-ramp slope angles generally range from approximately 32° to 48° depending on geotechnical domain and wall orientation, while overburden slopes are limited to a maximum continuous slope height of approximately 122 m (400 ft). The study concluded that acceptable slope performance can be achieved through implementation of the recommended slope design criteria and ongoing geotechnical monitoring programs.
| 13-4 | |
| SSR Mining Inc. | Marigold Complex | October 9, 2026 |
| S-K 1300 Technical Report Summary | SLR Project No.: 138.020810.00001 |
| 13.1.2 | Overburden Storage Facility Stability |
A comprehensive overburden storage facility slope stability assessment was completed in 2026 for seven OBSAs, including CNNWTC, M8, North Dump-5N, NWTC, RD1, Resort Dump, and SWTC (SSR 2026). The assessment utilized two-dimensional limit equilibrium analyses of both existing as-built OBSA configurations and the planned M8 ultimate configuration.
Under expected-average waste rock strength assumptions, all evaluated waste dumps demonstrated overall factors of safety at or above, or marginally below, the adopted acceptance criterion of 1.3. The M8 OBSA represented the controlling as-built condition and was the only evaluated facility to exhibit a factor of safety marginally below the adopted criterion (FoS = 1.254); accordingly, ongoing monitoring, waste placement controls, and periodic geotechnical reassessment were recommended, while no specific design modifications were identified in this assessment. The North Dump-5N, NWTC, and SWTC facilities exhibited the highest stability margins under the evaluated loading conditions.
The planned M8 ultimate design was assessed separately and demonstrated improved stability relative to the existing configuration. The analyses concluded that the planned geometry satisfies the adopted slope stability acceptance criteria under expected material strength assumptions, although stability remains sensitive to waste rock quality, seismic loading assumptions, and groundwater conditions.
The assessment concluded that the existing waste rock storage facilities generally exhibit acceptable overall stability under current operating conditions and provide a suitable basis for long-term mine planning. Recommendations include continued monitoring of active OBSA, ongoing waste rock characterization, maintenance of groundwater monitoring programs, periodic reassessment of dump stability, and implementation of material placement practices that preferentially place weaker and finer-grained material within interior dump areas while reserving more competent material for exterior slope construction. Particular attention should continue to be directed toward the M8 facility because of its comparatively lower stability margin and ongoing development.
The QP has reviewed the 2026 slope stability assessment prepared by WSP personnel (WSP 2026a), considers the methodologies and assumptions to be appropriate, and concurs with the conclusions and recommendations presented herein.
| 13.1.3 | Pit Optimizations and Designs |
Pit optimizations and subsequent pit designs were completed by personnel from MMC and corporate SSR in April 2026 using the updated Mineral Reserve gold price (US$2,200/oz) and updated block model. Pit optimization analyses incorporated current geotechnical design criteria developed from historical operating experience and updated geotechnical investigations completed across the operation. Sector-specific slope configurations reflecting bedrock conditions, structural controls, groundwater considerations, and localized weak materials were incorporated where applicable. Optimized pit shells and final designs were developed using slope design criteria considered appropriate for the geologic, hydrogeologic, and geotechnical conditions anticipated within each mining area
Optimizations used the Pseudoflow algorithm. Marigold personnel developed operating mining costs for the existing mining fleet during the pit optimization process. Ore and waste haulage costs were incorporated into the block model. The mining cost for the pit shells was based on the total mining cost net of haulage mining costs, which are presented in Table 12-2 and Table 12-3.
| 13-5 | |
| SSR Mining Inc. | Marigold Complex | October 9, 2026 |
| S-K 1300 Technical Report Summary | SLR Project No.: 138.020810.00001 |
For the Marigold mine, the ROM leach recovery model, as developed by SSR, was also incorporated into the Mineral Resources cell model. To facilitate the calculations and the Mineral Resources tabulations, variables were incorporated into the model for recovered gold [gold x recovery] and payable gold [gold x recovery x (1–royalty)]. Payable gold cut-off grades were established at 0.069 g/t Au and 0.104 g/t Au, respectively, for incremental cut-off and breakeven cut-off. Incremental cut-off is based on pit rim routing, so the only mining cost change is the increment between the ore and waste mining costs. Breakeven cut-off includes the ore mining cost.
For the Buffalo Valley deposit, ROM heap leach recoveries, which were derived from metallurgical test work, and a fixed royalty of 3.5% were incorporated to calculate cut-off grades across various lithological and metallurgical domains. Resulting cut-off grades range from 0.069 g/t Au to 1.767 g/t Au for incremental cut-off, and 0.102 g/t Au to 2.6065 g/t Au for breakeven cut-off, reflecting the variability in domain-specific recovery and cost parameters.
The mining costs for the evaluation include sustaining capital costs as well as costs associated with the Marigold analytical laboratory as most of the on-site laboratory work involves assaying production blastholes for ore control. The processing costs also include sustaining capital and the full site reclamation costs.
Overall slope angles used in the optimization are presented in Table 13-1 and Table 13-2.
| Table 13-1: | Overall Slope Angles by Azimuth – Marigold Mine |
| Pit | Slope Angle (Degrees) |
| Area 1: Red Dot / Mackay / Terry Zone (TZ) / 8Sx | |
| Area 1 – All Pits in Reserves | 45–49 |
| East Wall Mackay | 45 |
| Fill Material | 35 |
| Area 2: Valmy N / Valmy S / Mud | |
| Area 2 – All Pits in Reserves | 45–48 |
| West Wall | 45 |
| Fill Material | 35 |
| Area 3: East Basalt / Battle Cry | |
| Area 3 – All Pits in Reserves | 45–49 |
| East Wall | 45 |
| Fill Material | 35–38 |
|
Notes:
1. Area 1: Created a 90° envelope at 45° IRA to account for the shear zone. 2. Area 2: Created a 30° envelope North and South at 45° IRA for the shear zone running through Valmy North and Valmy South. 3. Area 3: Exploration encountered Tuff in the region, leading to a flatter 38° slope in certain areas. | |
| 13-6 | |
| SSR Mining Inc. | Marigold Complex | October 9, 2026 |
| S-K 1300 Technical Report Summary | SLR Project No.: 138.020810.00001 |
| Table 13-2: | Overall Slope Angles by Azimuth – Buffalo Valley Mine |
| BV Pit | Slope
Angle (Degrees) |
| Area 1: Domain 1 | |
| Area 1 – All Pits in Reserves | 40–48 |
| Fill Material | 34 |
| Area 2: Domain 2 | |
| Area 2 – All Pits in Reserves | 36–48 |
| Fill Material | 34 |
| Area 3: Domain 3 | |
| Area 3 – All Pits in Reserves | 32–48 |
| Fill Material | 34 |
Notes:
1. Area 1: Created a 90° envelope at 45° IRA to account for the shear zone. 2. Area 2: Created a 30° envelope North and South at 45° IRA for the shear zone running through Valmy North and Valmy South. 3. Domain 1 mean dip 51°; pitward-dipping bedding present. 4. Domain 2 mean dip 44°; pitward-dipping bedding present. 5. Domain 3 mean dip 37°; bedding dipping into wall. 6. Eight critical cross-sections were analyzed on the new recommended rosettes; Recommendations were based on adverse bedding dipping pitward along the east and southeast walls. | |
Table 13-3 and Table 13-4 also shows the design parameters for each area with the exact bench width, slope angle, face angle, and rosette bearing for Marigold Mine and Buffalo Valley Mine, respectively.
| Table 13-3: | Design Parameters by Each Area – Marigold Mine |
| By Zone | Bearing | Bench
Width |
Slope
Angle (IRA) |
Face Angle |
| Red Dot M7&9 (Mackay); 5N; East Basalt; Battle Cry and Antler (New Millenium)} | 10°–40° | 32.3 | 47 | 74 |
| 40°–130° | 31.8 | 45 | 70 | |
| 130°–160° | 32.3 | 47 | 74 | |
| 160°–210° | 30.7 | 48 | 74 | |
| 210°–270° | 32.3 | 47 | 74 | |
| 270°–360° | 29.1 | 49 | 74 | |
| Valmy North, Valmy South and Mud | 15°–165° | 30.7 | 48 | 74 |
| 165°–195° | 31.8 | 45 | 70 | |
| 195°–345° | 30.7 | 48 | 74 | |
| 345°–360° | 35.7 | 45 | 74 | |
| Fill/Alluvium | n/a - Slope Code 3 | 45.3 | 34 | 60 |
| 13-7 | |
| SSR Mining Inc. | Marigold Complex | October 9, 2026 |
| S-K 1300 Technical Report Summary | SLR Project No.: 138.020810.00001 |
| Table 13-4: | Design Parameters by Each Area – Buffalo Valley Mine |
| By Zone | Bearing | Bench
Width |
Slope
Angle (IRA) |
Face Angle |
Buffalo Valley – Domain 1/SLOPE 1 - CNI Update FEB 2026 |
0°–20° | 24.8 | 48 | 68 |
| 20°–50° | 27.4 | 44 | 64 | |
| 50°–100° | 28.3 | 40 | 58 | |
| 100°–360° | 24.8 | 48 | 68 | |
Buffalo Valley – Domain 2/SLOPE 2 – CNI Update FEB 2026
|
0°–100° | 24.8 | 48 | 68 |
| 100°–160° | 33.8 | 36 | 55 | |
| 160°–360° | 28.3 | 40 | 58 | |
Buffalo Valley – Domain 3/SLOPE 3 - CNI Update FEB 2026
|
0°–20° | 24.8 | 48 | 68 |
| 20°–50° | 28.3 | 40 | 58 | |
| 50°–110° | 30.0 | 32 | 45 | |
| 110°–360° | 24.8 | 48 | 68 |
Several pit optimizations were run at different gold prices. The $2,200/oz gold price pit shell was selected as a guide to develop the ultimate pit and subsequent pit phase designs.
Berm/catch bench widths range from 7.2 m to 8.2 m in rock and from 7.2 m to 15.4 m in fill and are designed for every 15.2 m bench height.
| 13.2 | Pit Phases and Timing |
The Marigold Mine pit optimization for the LOM plan used a Pseudoflow algorithm with an internal recoverable gold value of 0.069 g/t. The optimized pit was used to guide the ultimate pit design, which includes access and takes into account geotechnical considerations for designed highwall angles.
The overall Marigold Mine design has four distinct areas: the main Mackay pit (includes the Red Dot and DG80 areas), the North Mackay pits, the Valmy pits, and New Millenium area pits.
The Mackay ultimate pit is an expansion, consolidation, and deepening below the water table of four existing pits into a single pit of approximately 4.9 km long, 1.7 km wide, and 460 m deep. It contains more than 60% of the Marigold Mine Mineral Reserve tonnage. For sequencing purposes, the ultimate pits are designed into 15 logical development stages.
Similarly, the Buffalo Valley Mine pit optimization used a Pseudoflow algorithm with a cut-off grade of 0.069 g/t, the outcome of which guided the ultimate pit design, which incorporates access and geotechnical considerations. The Buffalo Valley Mine has two distinct areas: the main Buffalo Valley pit and the Dore Hills pit area to the north.
Tonnages for each mining phase are shown in Table 13-5. Figure 13-1 and Figure 13-2 show the end of mine life reserve pits for the Marigold Mine and Buffalo Valley Mine, respectively.
| 13-8 | |
| SSR Mining Inc. | Marigold Complex | October 9, 2026 |
| S-K 1300 Technical Report Summary | SLR Project No.: 138.020810.00001 |
| Table 13-5: | Mining Phase Design Summary |
| Phase Name | Waste
Tonnes (kt) |
Ore
Tonnes (kt) |
Total
Tonnes (kt) |
Strip Ratio |
| Marigold | ||||
| 5N3 | 41,588 | 3,755 | 45,343 | 11.1 |
| 8Sext | 67,047 | 8,730 | 75,777 | 7.7 |
| Antler Ph1 | 93,499 | 10,488 | 103,987 | 8.9 |
| Antler Ph2 | 63,615 | 15,910 | 79,525 | 4.0 |
| DG80 Ph1 | 15,331 | 59 | 15,390 | 259.1 |
| DG80 Ph2 | 135,253 | 5,422 | 140,675 | 24.9 |
| DG80 Ph3 | 1,918 | 218 | 2,136 | 8.8 |
| DG80 Ph4 | 118,058 | 43,118 | 161,176 | 2.7 |
| EB1 | 46,633 | 1,369 | 48,002 | 34.1 |
| EB2 | 17,090 | 2,585 | 19,675 | 6.6 |
| EB3 | 21,067 | 8,708 | 29,775 | 2.4 |
| M7 | 112,315 | 21,568 | 133,883 | 5.2 |
| M7 Old | 213 | 63 | 275 | 3.4 |
| Mud1 | 4,232 | 614 | 4,846 | 6.9 |
| Mud2 | 753 | 412 | 1,165 | 1.8 |
| RD2 | 7,183 | 7,912 | 15,095 | 0.9 |
| RD3a | 918 | 918 | ||
| RD3b | 9,422 | 9,422 | ||
| RD3c | 13,438 | 29 | 13,467 | 471.2 |
| RD3d | 10,735 | 10,735 | ||
| RD3e | 25,679 | 780 | 26,459 | 32.9 |
| RD3f | 7,062 | 688 | 7,750 | 10.3 |
| RD3g | 6,732 | 5,234 | 11,966 | 1.3 |
| RD3h | 6,173 | 5,797 | 11,971 | 1.1 |
| RD3i | 2,657 | 5,068 | 7,725 | 0.5 |
| RD3j | 4,525 | 8,422 | 12,947 | 0.5 |
| RD4a | 103,489 | 771 | 104,260 | 134.3 |
| RD4b | 101,998 | 46,072 | 148,070 | 2.2 |
| RD5 | 126,619 | 9,480 | 136,099 | 13.4 |
| TZ | 101,666 | 16,019 | 117,684 | 6.3 |
| VN | 13,502 | 5,354 | 18,856 | 2.5 |
| 13-9 | |
| SSR Mining Inc. | Marigold Complex | October 9, 2026 |
| S-K 1300 Technical Report Summary | SLR Project No.: 138.020810.00001 |
| Phase Name | Waste
Tonnes (kt) |
Ore
Tonnes (kt) |
Total
Tonnes (kt) |
Strip Ratio |
| VS | 54,742 | 10,663 | 65,405 | 5.1 |
| VSext | 72,146 | 7,090 | 79,236 | 10.2 |
| Marigold Total | 1,407,297 | 252,398 | 1,659,695 | 5.6 |
| Buffalo Valley | ||||
| Buffalo Valley | 169,643 | 43,841 | 213,484 | 3.9 |
| Dore Hills | 6,258 | 1,491 | 7,750 | 4.2 |
| Buffalo Valley Total | 175,902 | 45,332 | 221,234 | 3.9 |
Notes:
1. Totals may not match due to rounding. | ||||
| 13-10 | |
| SSR Mining Inc. | Marigold Complex | October 9, 2026 |
| S-K 1300 Technical Report Summary | SLR Project No.: 138.020810.00001 |
| Figure 13-1: | End of Mine Life Reserve Pits- Marigold Mine |
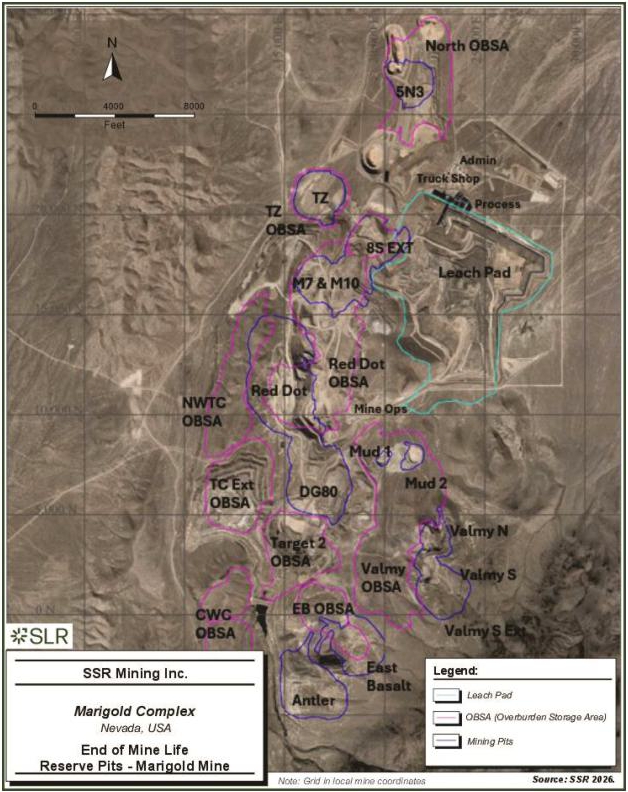
| 13-11 | |
| SSR Mining Inc. | Marigold Complex | October 9, 2026 |
| S-K 1300 Technical Report Summary | SLR Project No.: 138.020810.00001 |
| Figure 13-2: | End of Mine Life Reserve Pits- Buffalo Valley Mine |
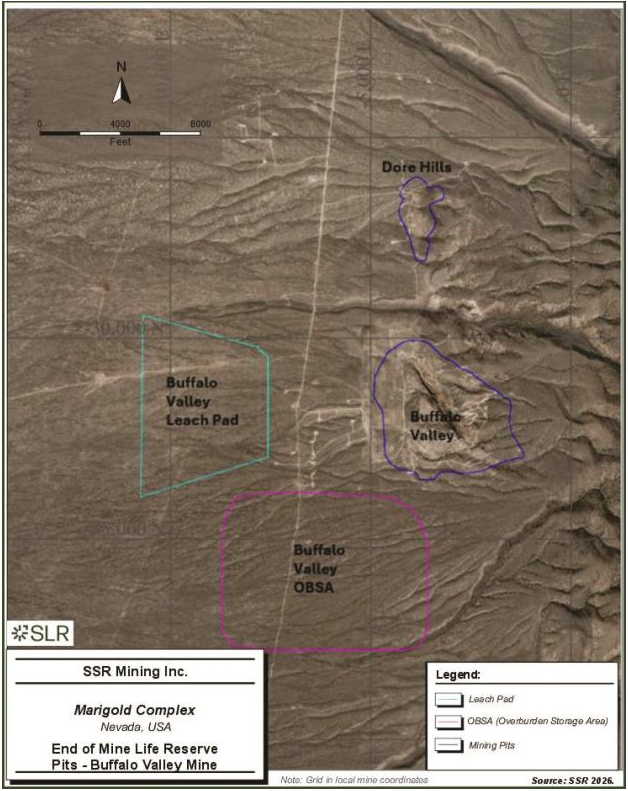
| 13-12 | |
| SSR Mining Inc. | Marigold Complex | October 9, 2026 |
| S-K 1300 Technical Report Summary | SLR Project No.: 138.020810.00001 |
| 13.3 | Production Rates, Mine Life, Dimensions, and Dilution Factors |
Mining is scheduled 24 hours per day, 363 days per year on a rotation of two 12-hour shifts. The current mine plan provides approximately 20 years of operational life, including fifteen years of active mining followed by an additional five years of processing the heap leach pad.
The haul fleet will expand from thirty 300 st class units at the end of 2026 to a peak of 45 trucks. This updated LOM includes 19 additional trucks starting in 2027, retiring the remaining older Hitachi Trucks by mid year 2027 and an additional LeTourneau 1850 front end loader in 2026, a Liebherr 9600 class front shovel in 2027, and a second P&H 4100 sized shovel in Q1 2028. Buffalo Valley is planned to start in 2029, which is based on the anticipated permitting timeline. Initially a separate fleet was considered for mining Buffalo Valley; however, procuring additional trucks and loading units in 2027 allows for accelerated waste stripping in Marigold and provides enough equipment to maintain Marigold and mine Buffalo Valley with the same fleet. Equipment planned for Buffalo Valley mining is estimated to be two hydraulic shovels and 8 to 10 trucks over the span of the 5.3 year mine life. When mining at Buffalo Valley is complete, the fleet will then return to Marigold.
The average sustained total material mining rate is 165.0 Mtpa over the first seven years (starting 2027), with the full production years of mining averaging 138.3 Mtpa (excluding part of 2026 and the final year 2040) as the tonnage drops off in later years. Average payable gold production over the 15 years of mining is approximately 200,000 ounces per year.
The Marigold Mine mineralized zones are structurally controlled and strike in a generally northern direction. They vary in width throughout the Property from one meter or less up to 40 m long and 49 m wide.
The Buffalo Valley mineralized zones are structurally controlled by northwest-trending dikes and faults. Mineralization occurs both adjacent to dikes and within favorable sedimentary units and varies in thickness and continuity throughout the deposit.
In the LOM model, there is no dilution or mining loss added to the Mineral Reserves for planning and scheduling. Based on the chosen mining method and size of equipment used, dilution intrinsic to the Mineral Resource model is considered sufficient, and a mining recovery of 100% is considered achievable in this kind of deposit. This assumption is supported by historical reconciliation data and is consistent with previous Technical Report Summaries (TRS) and Mineral Resources and Mineral Reserves (MRMR) declarations.
| 13.4 | Stripping Requirements |
Increasing the reserve gold price from $1,700/oz to $2,200/oz to reflect current market conditions increased the Mineral Reserve at the Marigold Complex as well as the associated waste required for extraction. The increase in material volume was not proportional between ore and waste, resulting in an increase in the life-of-mine strip ratio from 4.0:1 to 5.3:1 (waste to ore), including Buffalo Valley. The additional waste tonnes, together with longer haul distances required to accommodate expanded overburden storage areas, increased the mining fleet requirements.
Stripping requirements over the life of the North Mackay pit area averaged 7.4:1; the stripping ratio for New Millenium is 6.2:1; and the stripping requirements for the other two areas, Mackay and Valmy, are planned to be slightly higher, bringing the average up. The Buffalo Valley strip ratio is 3.9:1, which lowers the overall average. Table 13-6 and Figure 13-3 show the annual production schedule for the LOM, including ore tonnes mined, waste tonnes mined, and strip ratio.
| 13-13 | |
| SSR Mining Inc. | Marigold Complex | October 9, 2026 |
| S-K 1300 Technical Report Summary | SLR Project No.: 138.020810.00001 |
The pit areas mentioned above comprise the following pits:
| · | Mackay Area: Red Dot phases (RD5/RD4/RD3/RD2/), DG80, M7, and M7 old |
| · | Valmy Area: Valmy North (VN), Valmy South (VS), Valmy South Extension (VSExt), Mud1 and Mud 2 |
| · | Mackay North Area: 8S Extension (8S Ext) and Terry Zone (TZ) and 5N |
| · | New Millenium Area: East Basalt (EB1 & EB2 & EB3) and Antler (Ant Ph1 & Ant Ph2) |
Buffalo Valley is a satellite pit from the rest of the Marigold Complex
| Table 13-6: | Annual Production Schedule Tonnes Mined |
| Year | Ore (kt) |
Au
Grade (g/t) |
Waste (kt) |
Total (kt) |
Strip Ratio | 2024
TRS Total (kt) |
| 2026(1) | 11,891 | 0.406 | 51,102 | 62,993 | 4.3 | 63,635 |
| 2027 | 20,903 | 0.512 | 107,186 | 128,089 | 5.1 | 100,083 |
| 2028 | 20,812 | 0.486 | 162,640 | 183,452 | 7.8 | 111,117 |
| 2029 | 22,849 | 0.646 | 139,565 | 162,414 | 6.1 | 93,524 |
| 2030 | 14,178 | 0.593 | 162,766 | 176,944 | 11.5 | 93,089 |
| 2031 | 20,240 | 0.397 | 143,355 | 163,595 | 7.1 | 76,606 |
| 2032 | 27,442 | 0.320 | 137,893 | 165,335 | 5.0 | 50,639 |
| 2033 | 24,325 | 0.442 | 150,610 | 174,935 | 6.2 | - |
| 2034 | 24,047 | 0.446 | 118,262 | 142,308 | 4.9 | - |
| 2035 | 23,541 | 0.380 | 87,126 | 110,667 | 3.7 | - |
| 2036 | 25,589 | 0.394 | 74,364 | 99,952 | 2.9 | - |
| 2037 | 20,301 | 0.330 | 73,901 | 94,203 | 3.6 | - |
| 2038 | 16,367 | 0.422 | 83,655 | 100,022 | 5.1 | - |
| 2039 | 18,182 | 0.381 | 77,554 | 95,736 | 4.3 | - |
| 2040 | 7,064 | 0.804 | 13,218 | 20,283 | 1.9 | - |
| Total(2) | 297,730 | 0.445 | 1,583,198 | 1,880,929 | 5.3 | 588,693 |
Notes:
1. 2026 Totals are for the period between May and December 2026. 2. Totals may not match due to rounding. | ||||||
| 13-14 | |
| SSR Mining Inc. | Marigold Complex | October 9, 2026 |
| S-K 1300 Technical Report Summary | SLR Project No.: 138.020810.00001 |
| Figure 13-3: | Mine Annual Production Schedule |
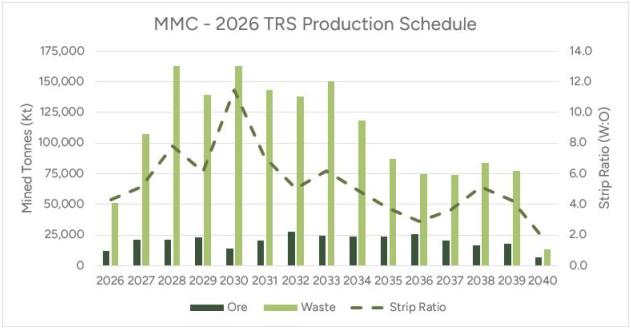
Source: SSR 2026
Notes:
| 1. | 2026 totals are for the period between May and December 2026. |
| 13.5 | Required Mining Fleet and Machinery |
The equipment list for the mining fleet is presented in Table 13-7, and includes both the existing fleet and the additional equipment required to support the LOM plan. Sustaining capital is not planned within the last five years of the LOM plan because it is assumed that equipment life can be stretched out and replacements are difficult to justify near the end of the Property life, as demonstrated by the operation’s long history. The sustaining capital replacement costs are included in the reserve optimization calculation costs. Capital costs are discussed in Section 18.1. As of the date of this TRS, MMC does not employ contract mining services, except with respect to blasting, as discussed in Section 0.
| Table 13-7: | Marigold Mining Complex - Fleet Equipment List |
| Number of Items | Equipment Name and Class |
| Existing Fleet | |
| 1 | P&H 4100 XPC electric shovel |
| 2 | Komatsu PC7000 hydraulic shovels |
| 1 | Hitachi EX5500 hydraulic shovel |
| 1 | Caterpillar 992-wheel loader |
| 5 | Hitachi EH5000 300 st haul trucks |
| 26 | Komatsu 930E 300 st haul trucks |
| 1 | Caterpillar 789B haul truck |
| 13-15 | |
| SSR Mining Inc. | Marigold Complex | October 9, 2026 |
| S-K 1300 Technical Report Summary | SLR Project No.: 138.020810.00001 |
| Number of Items | Equipment Name and Class |
| 3 | Caterpillar 789B water trucks |
| 3 | Ingersoll Rand DML drills |
| 3 | Atlas Copco PV271 drills |
| 4 | Caterpillar 834- and 854-wheel dozers |
| 3 | Lube / fuel trucks |
| 1 | Caterpillar 637 scraper |
| 1 | Caterpillar 789 Lowboy heavy hauler |
| 1 | Caterpillar D8 Track Dozers |
| 5 | Caterpillar D10 Track Dozers |
| 2 | Caterpillar D11 Track Dozer |
| 3 | Caterpillar 16H and 16M Motor Graders |
| 1 | Caterpillar 18M Motor Graders |
| Growth / Fleet Additions | |
| 1 | Electric shovel (P&H 4100 XPC or equivalent) |
| 1 | Hydraulic Shovel (Liebherr 9600 or equivalent) |
| 1 | Letourneau L1850 Front Loader |
| 4 | Track Dozer (Kom 375A-8 or CAT D10T2) |
| 3 | Rubber Tire Dozer (CAT WD854 or equivalent) |
| 3 | Surface Drill (Atlas Copco PV 271 or equivalent) |
| 2 | Water Truck (HD1500 or equivalent) |
| 3 | Grader (Komatsu 955 or CAT 18M or equivalent) |
| 19 | 300 st Trucks (930E or equivalent) |
| 13.6 | Ore Control Drilling and Method |
Blasthole sampling is used to define ore zones. A grade control sample is taken every 15.2 m of drilling. The sample is manually collected from a cross-section of the cone of drill cuttings. The procedure includes removal of the sub-drill material. Ore Control personnel periodically audit the performance of the blast hole samplers and provide feedback on compliance to standard.
Benches are mined at a height of 15.2 m with an electric or hydraulic shovel in stripping and bulk ore mining areas. If ore is encountered in the stripping areas on the 15.2 m benches, it is mined at that bench height to maintain pit productivity.
Each blasthole sample is analyzed for gold at the on-site laboratory facility. A cyanide digestion is performed on each sample to determine the quantity of cyanide soluble gold contained in the sample. The cyanide digestion only provides a measure of cyanide soluble gold within a sample, not total gold. At Marigold, about one in every five blasthole samples containing 0.10 g/t (0.003 opt) cyanide soluble gold is assayed for total gold content using fire assay (FA) with an AA finish. Samples from each ore polygon delineated by ore control are selected for fire assay based on the grade distribution for the polygon tonnage and targeting one sample per every 2,000 st of ore. The FA results (Au g/t) from the blastholes in the pit area, and cyanide soluble assay results (Au g/t) are used to determine a fire-assay-to-cyanide-soluble regression for the pit area. This regression is applied to all remaining cyanide soluble assays in the blast to calculate a total gold value contained in each blasthole.
| 13-16 | |
| SSR Mining Inc. | Marigold Complex | October 9, 2026 |
| S-K 1300 Technical Report Summary | SLR Project No.: 138.020810.00001 |
Fire assay grades associated with each blasthole are entered into the grade control (blasthole) model. The blast pattern is then converted to a blasthole cell model with cell sizes of 3.05 m x 3.05 m x 7.6 m. The blasthole data is kriged using ordinary kriging (OK) in two dimensions on the bench. If there is sufficient volume above the cut-off grade to make a mineable shape of ore, this shape is blocked out and surveyed in the pit (indicated by ore flags for mining) to be sent to the leach pad for processing.
The ore control practices described herein represent the current operating methodology at the Marigold Mine. For Buffalo Valley, ore control drilling, sampling, grade control modeling, and ore delineation procedures will be developed prior to the planned start of mining in 2029 and are expected to be generally consistent with Marigold's established practices, subject to modification based on the specific geological and operational requirements of the Buffalo Valley deposit.
| 13.7 | Drilling and Blasting |
Blasthole drilling is performed with three Atlas Copco PV271 rigs that drill with both rotary and hammer drill bits as well as three Ingersoll Rand DML rigs that drill with hammer bits. Three additional Atlas Copco PV271 or equivalent drills will be added to the fleet in 2027. The rigs drill 22.2 cm diameter blastholes. The PV271 rigs can drill to 16.8 m in a single pass. The DML rigs can drill to 10.4 m in a single pass.
The normal explosive is a heavy ANFO (blend of ANFO and emulsion), which is placed by a combination of both contractor and Marigold employees. An emulsion product is also used for wet holes to manage groundwater in the winter and fall and help break up the rock in areas of the pit that are more difficult to dig.
The blast patterns are adjusted for rock conditions. Typically, the patterns are 6.7 m x 7.8 m for the 15.2 m benches. To help break the toe of the bench, 1.5 m of sub drilling is added to each hole. The ore host rock generally breaks easily with blasting, and this provides a good ROM leach feed to the pad. Electronic detonators are used to control the timing of the blasthole detonation. The typical fragmentation is P80 20.3 cm.
A trim blast is performed around the limits of the mining on final highwall configurations. This configuration is a four-row pattern that is shot to a free face to minimize blast damage and vibration into the highwalls. A new crest and catch bench, ranging in width from 6.7 m to 9.1 m depending on the highwall angle, are formed every 15.2 vertical meters of mining.
| 13.8 | Loading Operations |
Loading operations are performed with one electric P&H 4100 XPC rope shovel with a 52.8 m3 dipper, two diesel hydraulic Komatsu PC7000 hydraulic shovels, and one diesel hydraulic Hitachi EX5500 shovel. Double-sided loading is typically used where there is adequate working room. Digging faces are defined by ore control and are marked in the field with flags and on maps that are provided to the operators. All loading units are equipped with a high-precision digging screen that is a component of the Modular Dispatch system. The screen, located in the operator’s cab, updates in real time to show the location and grade of the ore material being mined. Dig boundaries are typically adjusted to allow for movement associated with blasting.
| 13-17 | |
| SSR Mining Inc. | Marigold Complex | October 9, 2026 |
| S-K 1300 Technical Report Summary | SLR Project No.: 138.020810.00001 |
To accommodate the increase in reserves, additional equipment was added to the fleet to address the increase in strip ratio and higher targeted production rates. A LeTourneau 1850 front loader, a Liebherr 9600 class front shovel, and a second P&H 4100 will provide the required additional loading capacity. In 2029, the two Komatsu PC 7000 shovels will relocate to Buffalo Valley for approximately 5 years.
| 13.9 | Hauling Operations |
Excavated rock is loaded into haul trucks and sent to either an OBSA or a leach heap, based on the average gold grade of the material. Waste rock is hauled to the multiple OBSA locations or to previously mined-out areas for backfilling pits. Pit backfilling, where not mandated by permit to eliminate pit lakes in certain satellite pits, has positive impacts at Marigold: it reduces costs associated with haulage distance and helps address the lack of areas for waste rock storage space due to permitting restrictions and current land position. Backfilling plans are reviewed and adjusted to minimize the potential for sterilizing future mineralization. Minimizing the waste haulage distance to the nearest facility improves mining productivity and minimizes haulage costs. Ore is hauled to the leach pad facility and stacked in lifts for processing. Select year-end positions for mining and OBSA are presented in Figure 13-4 through Figure 13-11 for the Marigold Mine, and Figure 13-12 through Figure 13-16 for the Buffalo Valley Mine.
MMC has a mixed fleet of Hitachi and Komatsu 300 st class haulage trucks for ore and waste haulage, which will be shared with Buffalo Valley when mining begins there in 2029. The Hitachi trucks will gradually be phased out once all added trucks are in production, with retirement planned no later than 2029.
A Modular Dispatch system is used to optimize fleet management at the Marigold Mine, and a dedicated or expanded dispatch solution may be required for the standalone Buffalo Valley operation when mining commences there.
Annually, from December to February, there is snow, fog, and freezing temperatures at the Property. However, there is a minimal amount of haulage downtime due to the weather in most years.
| 13-18 | |
| SSR Mining Inc. | Marigold Complex | October 9, 2026 |
| S-K 1300 Technical Report Summary | SLR Project No.: 138.020810.00001 |
| Figure 13-4: | End of Production Year 2026 – Marigold Mine |
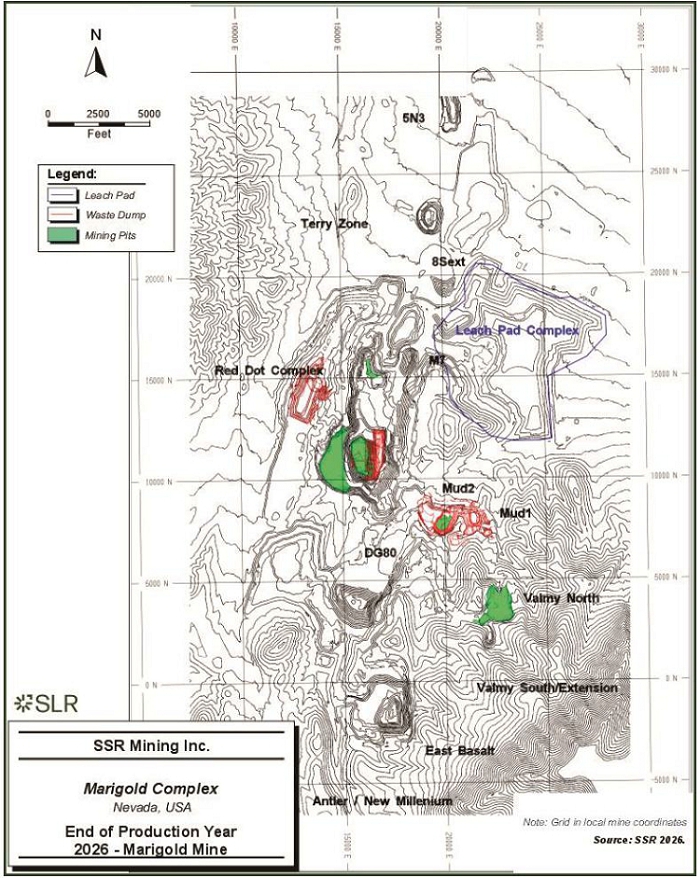
| 13-19 | |
| SSR Mining Inc. | Marigold Complex | October 9, 2026 |
| S-K 1300 Technical Report Summary | SLR Project No.: 138.020810.00001 |
| Figure 13-5: | End of Production Year 2027 – Marigold Mine |
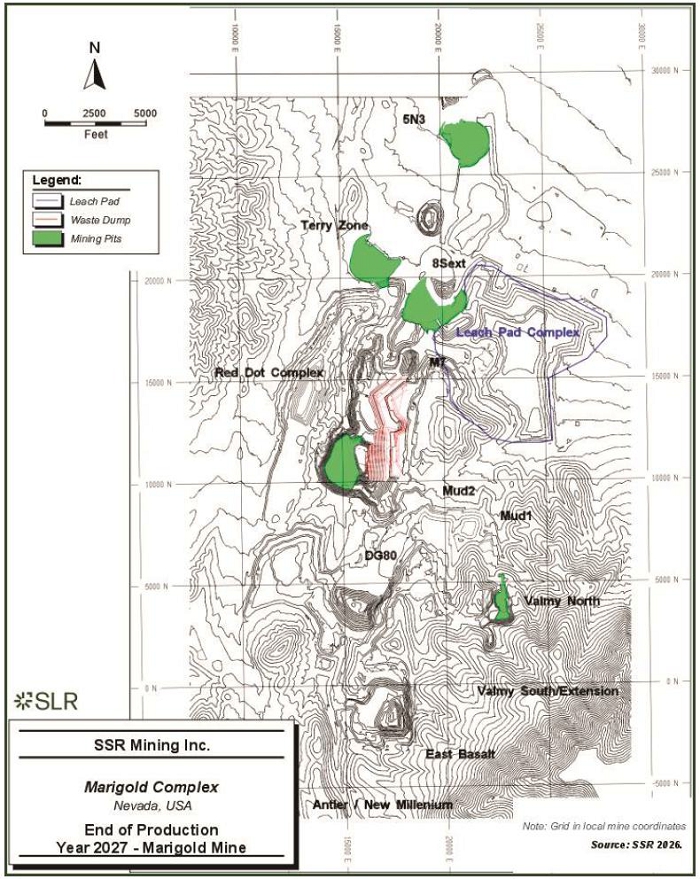
| 13-20 | |
| SSR Mining Inc. | Marigold Complex | October 9, 2026 |
| S-K 1300 Technical Report Summary | SLR Project No.: 138.020810.00001 |
| Figure 13-6: | End of Production Year 2028 – Marigold Mine |
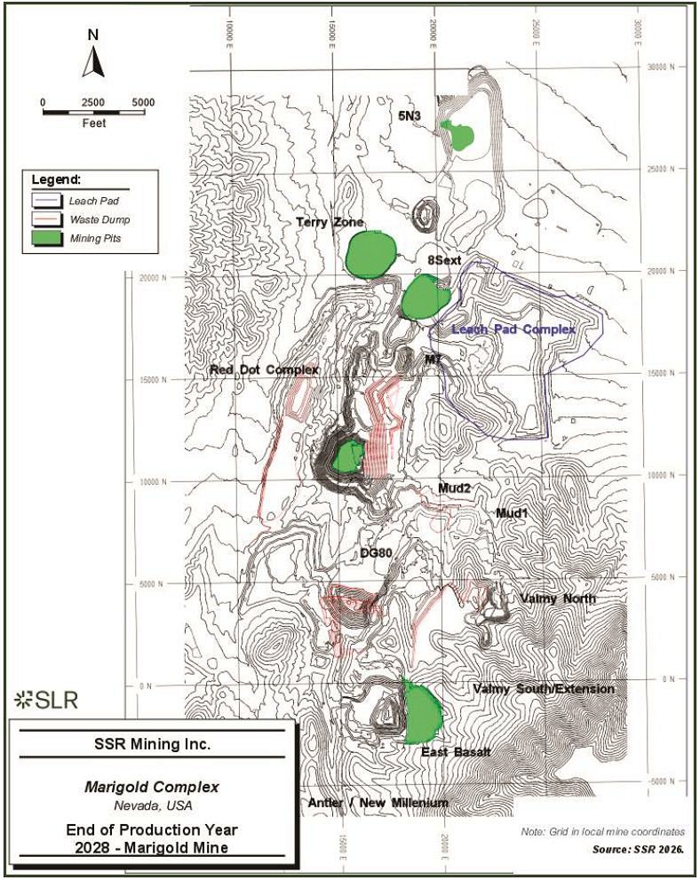
| 13-21 | |
| SSR Mining Inc. | Marigold Complex | October 9, 2026 |
| S-K 1300 Technical Report Summary | SLR Project No.: 138.020810.00001 |
| Figure 13-7: | End of Production Year 2029 – Marigold Mine |
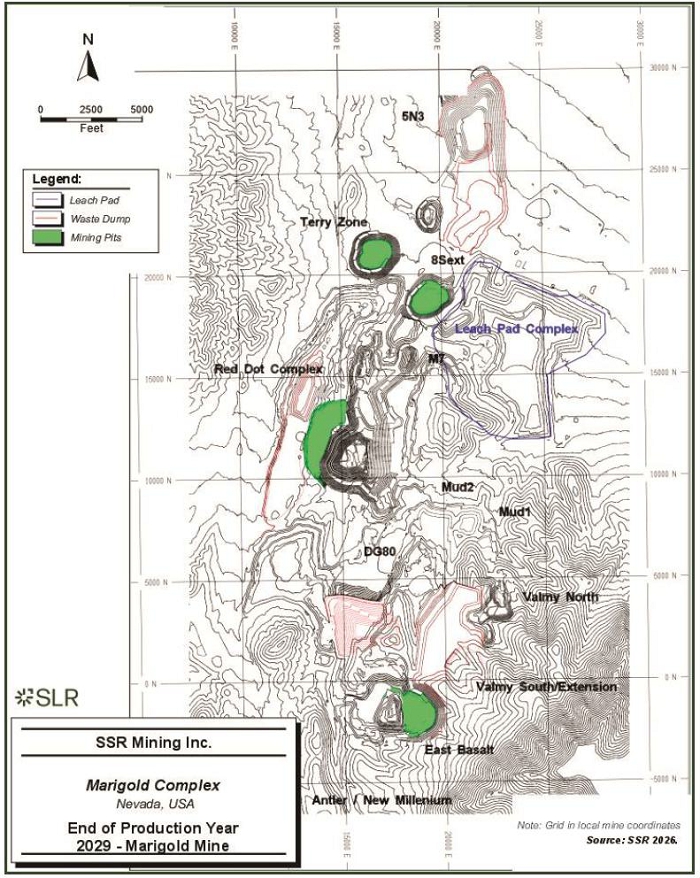
| 13-22 | |
| SSR Mining Inc. | Marigold Complex | October 9, 2026 |
| S-K 1300 Technical Report Summary | SLR Project No.: 138.020810.00001 |
| Figure 13-8: | End of Production Year 2030 – Marigold Mine |
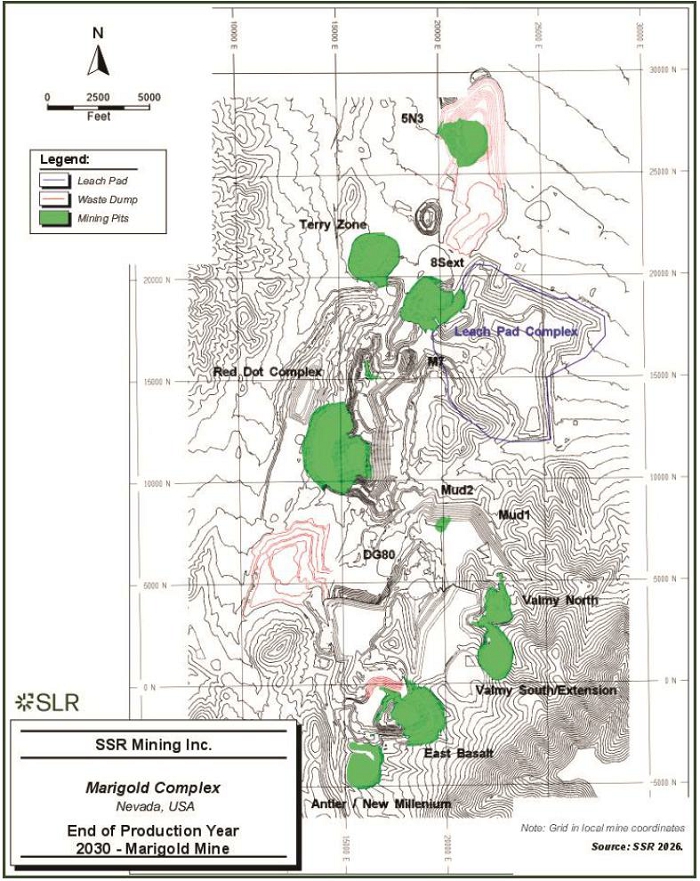
| 13-23 | |
| SSR Mining Inc. | Marigold Complex | October 9, 2026 |
| S-K 1300 Technical Report Summary | SLR Project No.: 138.020810.00001 |
| Figure 13-9: | End of Production Year 2031 – Marigold Mine |
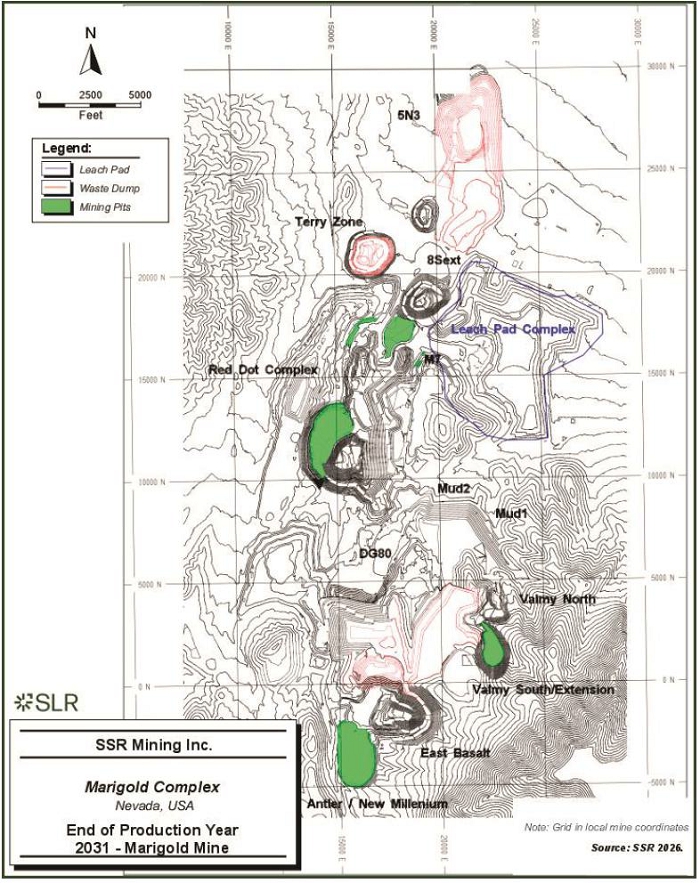
| 13-24 | |
| SSR Mining Inc. | Marigold Complex | October 9, 2026 |
| S-K 1300 Technical Report Summary | SLR Project No.: 138.020810.00001 |
| Figure 13-10: | End of Production Year 2032 – Marigold Mine |
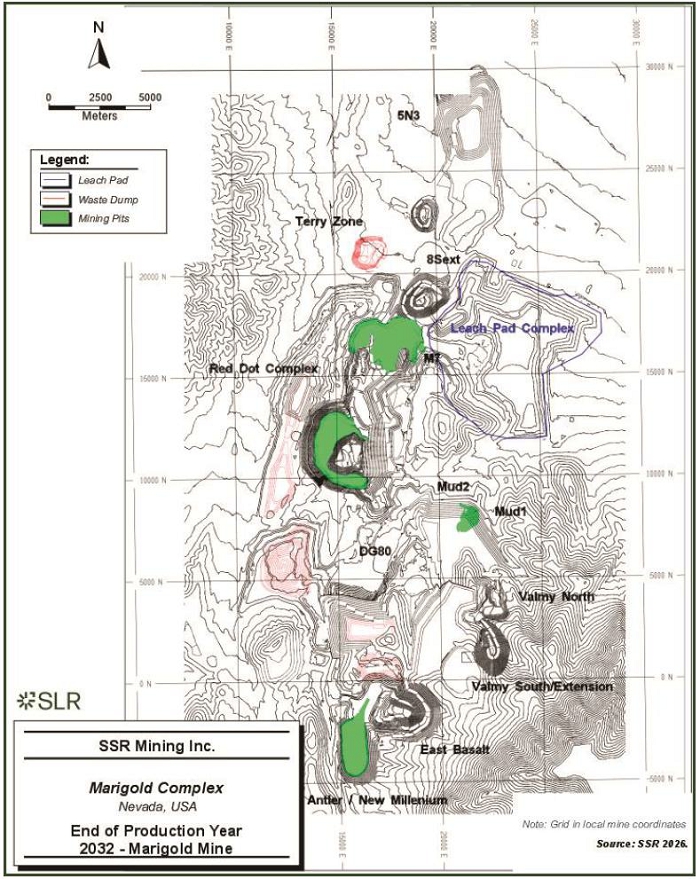
Note: Grid in Local Mine Coordinates.
| 13-25 | |
| SSR Mining Inc. | Marigold Complex | October 9, 2026 |
| S-K 1300 Technical Report Summary | SLR Project No.: 138.020810.00001 |
| Figure 13-11: | End of Production Year 2040 (LOM) – Marigold Mine |
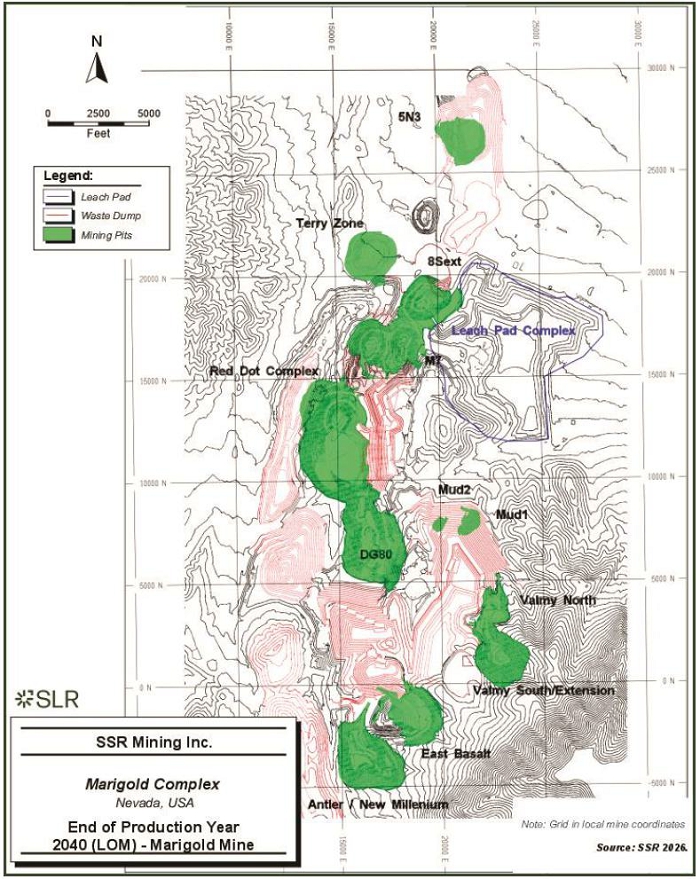
| 13-26 | |
| SSR Mining Inc. | Marigold Complex | October 9, 2026 |
| S-K 1300 Technical Report Summary | SLR Project No.: 138.020810.00001 |
| Figure 13-12: | End of Production Year 2029 – Buffalo Valley Mine |
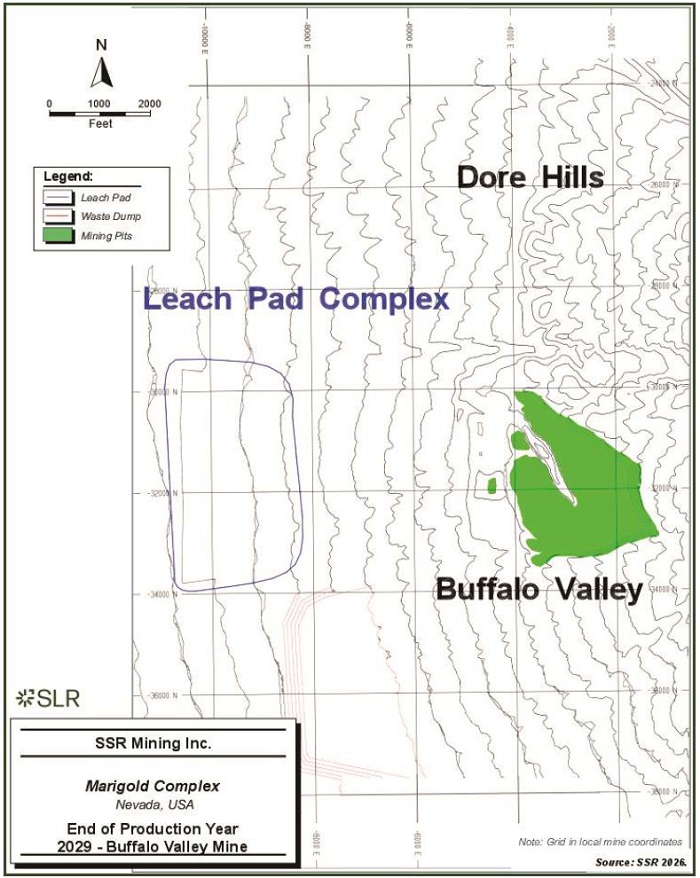
| 13-27 | |
| SSR Mining Inc. | Marigold Complex | October 9, 2026 |
| S-K 1300 Technical Report Summary | SLR Project No.: 138.020810.00001 |
| Figure 13-13: | End of Production Year 2030 – Buffalo Valley Mine |
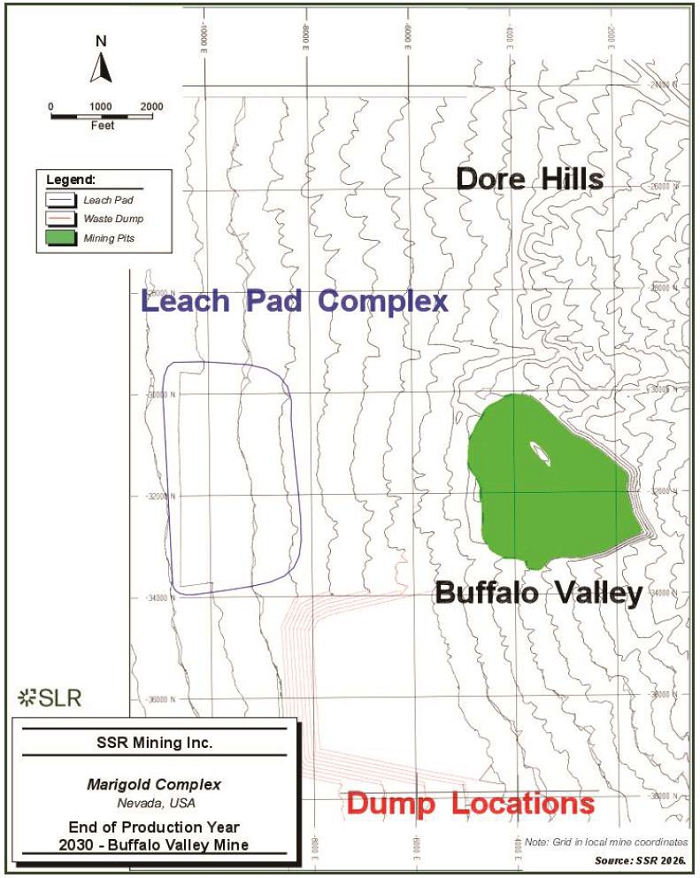
| 13-28 | |
| SSR Mining Inc. | Marigold Complex | October 9, 2026 |
| S-K 1300 Technical Report Summary | SLR Project No.: 138.020810.00001 |
| Figure 13-14: | End of Production Year 2031 – Buffalo Valley Mine |
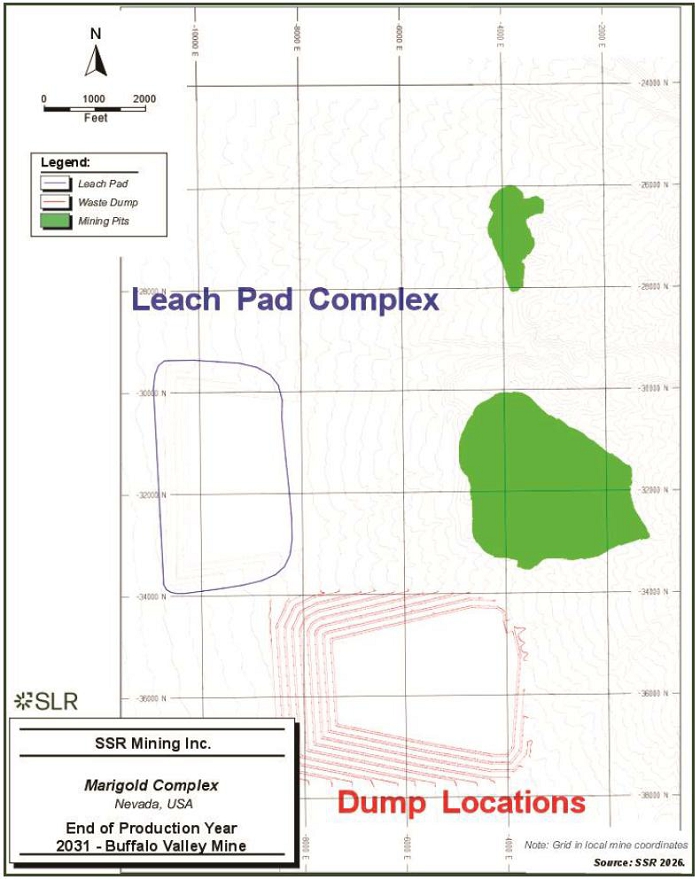
| 13-29 | |
| SSR Mining Inc. | Marigold Complex | October 9, 2026 |
| S-K 1300 Technical Report Summary | SLR Project No.: 138.020810.00001 |
| Figure 13-15: | End of Production Year 2032 – Buffalo Valley Mine |
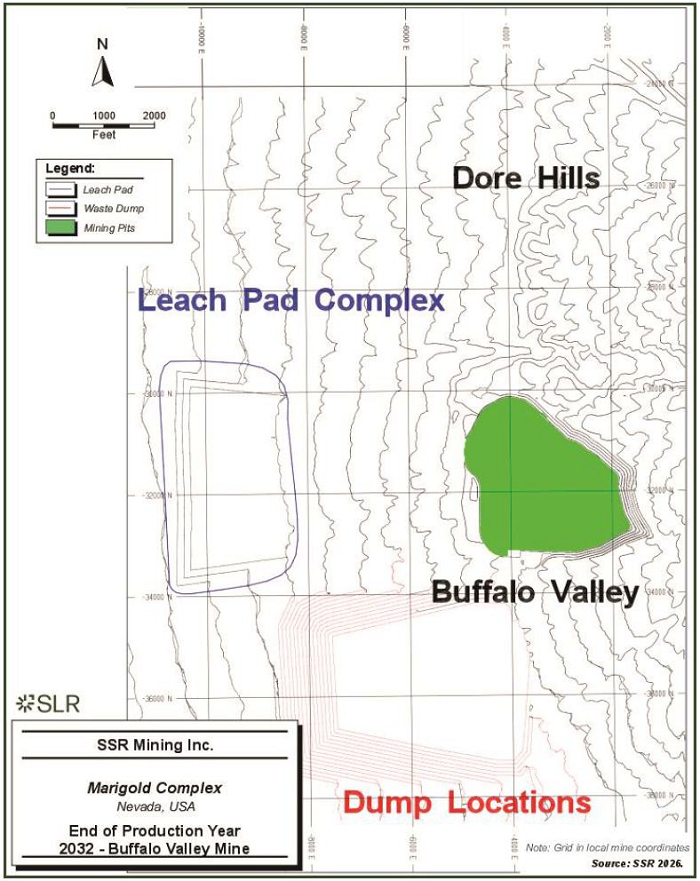
| 13-30 | |
| SSR Mining Inc. | Marigold Complex | October 9, 2026 |
| S-K 1300 Technical Report Summary | SLR Project No.: 138.020810.00001 |
| Figure 13-16: | End of Production Year 2034 – Buffalo Valley Mine |
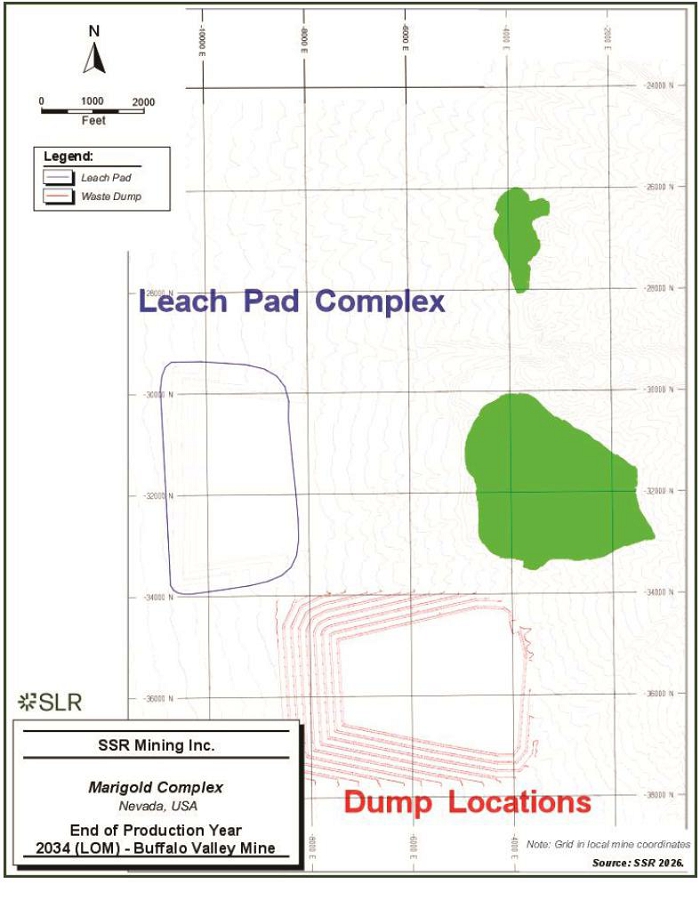
| 13-31 | |
| SSR Mining Inc. | Marigold Complex | October 9, 2026 |
| S-K 1300 Technical Report Summary | SLR Project No.: 138.020810.00001 |
| 13.10 | Mine Support |
Mine support functions are performed using different quantities and types of equipment. These include water trucks, dozers, and graders as well as other non-operated ancillary equipment such as the radar highwall monitoring units. Mine support functions include ripping leach pads after a panel is completed, monitoring slope stability, maintaining roads and access points, and developing exploration drill pads. This work is completed with a fleet of Caterpillar D8, D10, and D11 class track dozers and Caterpillar 18, 16H, and 18M motor graders.
Current mine support fleet numbers are included in Table 13-7
| 13.11 | Mine Maintenance |
Mine maintenance is an integral function of the mining operations and relates to the day-to-day upkeep of the mining equipment. Activities such as preventive maintenance, equipment rebuilds and fixing equipment on breakdowns are all included in the mine maintenance function. The objective is to provide efficient maintenance of the mining fleet, thereby increasing reliability and availability of the equipment through effective strategies, planning, and continuous improvement. High levels of equipment availability and reliability facilitate operational and delivery performance, resulting in asset intensity reduction, and reduced direct operational and maintenance costs.
Equipment maintenance is performed onsite for all mining equipment. The Marigold Complex has all the infrastructure required for maintaining the fleet described in Table 13-7 and has an adequate maintenance workforce to ensure the equipment are able to meet the requirements of the operations.
Table 13-8 shows the LOM average key performance indicators (KPI) of the fleet used at Marigold Mine.
| Table 13-8: | LOM Average Maintenance KPI of the MMC Equipment Fleet |
| Mine Equipment | Availability (%) |
Use
of Availability (%) |
| Drills | 81.84% | 69.63% |
| Loading Equipment | ||
| Hitachi 5500 | 85.4% | 88.0% |
| Komatsu PC7000 | 75.4% | 87.8% |
| Electric Shovel | 86.1% | 87.3% |
| LeTourneau 1850 | 82.8% | 87.2% |
| Liebherr 9600 class | 88.2% | 87.8% |
| Electric Shovel #2 | 86.4% | 87.8% |
| Hauling Equipment | ||
| EH5000 ACII (5 Trucks) | 55.1% | 83.9% |
| 930E-4 (14 Trucks) | 82.5% | 83.8% |
| 930E-5 (12 Trucks) | 82.5% | 83.8% |
| 930E-5 New (19 Trucks) | 86.8% | 83.8% |
| 13-32 | |
| SSR Mining Inc. | Marigold Complex | October 9, 2026 |
| S-K 1300 Technical Report Summary | SLR Project No.: 138.020810.00001 |
| Mine Equipment | Availability (%) |
Use
of Availability (%) |
| CAT 789 | 69.1% | 25.03% |
| Support Equipment | ||
| Dozers | 83.8% | 81.4% |
| Graders | 74.0% | 65.5% |
| RTD | 82.4% | 74.5% |
| Water Truck | 86.1% | 66.8% |
| Loader (992) | 79.5% | 66.8% |
| Scraper | 73.3% | 3.3% |
The current fleet is to be maintained with replacement units (930E Haul Trucks and Drills being the major equipment to be replaced) as the current equipment reaches its maximum operating hours. In general, the major mining equipment requirement scales down with production, towards the end of the LOM plan.
| 13.12 | Mine General and Administration |
Mine G&A refers to all day-to-day supervision and engineering support of mining operation activity. Expenses included in the mine G&A are mine salary labor charges and fringe benefits, mine office supplies, safety supplies, equipment rentals and leases, light-vehicle tires, miscellaneous contract services, travel expenses, training, and tax and freight charges.
| 13.13 | Mine Safety |
MMC has one mine rescue and emergency response team, which is trained to competently assess accident conditions and fight fires. There is one ambulance and one small fire truck available onsite and a rescue trailer that is used in emergencies. The Property is set up with hydrants and appropriate connectors, hoses, and wrenches at strategic locations. For mobile equipment fires, the Property is set up with large water trucks equipped with water cannons.
MMC also has access to and can call either the Valmy Fire Department (5 km away) or Battle Mountain Fire Department (24 km away), when required. There is a monthly training session for the MMC rescue team to ensure effective participation in any recovery operations in the event of a mine incident.
| 13.14 | Mine Dewatering |
| 13.14.1 | Marigold |
The Marigold Mine Plan of Operations (PoO) – Mackay Optimization Project Amendment Record of Decision (RoD) in October 2019 allowed mining to be carried out below the water table in the expanded Mackay pit. The approved dewatering system incorporated a pit dewatering design by Piteau Associates, consisting of a series of dewatering wells located around the periphery of the ultimate pit to extract water for mine operations and infiltration. Infiltration is by means of a series of rapid infiltration basins (RIBs) located in an area of deep alluvium cover approximately five kilometers north of the operations area. The dewatering system and RIBs are authorized under Water Pollution Control Permit (WPCP) NEV2022118. A total of 14 RIBs have been authorized, and eight have been constructed. The eight RIBs have been operating reliably with no reported issues and require only minimal operational maintenance. Additional RIBs may be constructed based on dewatering needs.
| 13-33 | |
| SSR Mining Inc. | Marigold Complex | October 9, 2026 |
| S-K 1300 Technical Report Summary | SLR Project No.: 138.020810.00001 |
The dewatering was developed in stages with the initial design incorporating 14 dewatering wells and currently planned to only run 10 wells, each with a nominal sustainable pumping rate of 113.5 m3/h. The Marigold dewatering system is currently operating with 10 optimized wells around the Red Dot and Terry Zone, producing a combined rate of 1,000 m³/h, or an average of 100 m³/h per pump. The 2025 groundwater model calibration aligns closely with observed water levels and indicates that the existing system will remain effective. With WW-11 and WW-19 completed in 2025, additional well development has been deferred until 2027, when two additional dewatering wells are proposed, but not yet permitted. There is potential for three further dewatering wells to be added in later years to support the LOM as planned pit expansions will interfere with the existing well network and the pit floor elevations go deeper than originally planned when designing the dewatering network. These three additional dewatering wells have also not yet been permitted.
Figure 13-17 shows existing well sites at Marigold Mine. New wells are developed in advance of the mining elevations required to support the LOM plan.
Some dewatering water is diverted for mine use with the majority delivered by pipeline to the RIB field north of the mine for infiltration. The RIBs are located in areas of thick alluvium which facilitates rapid infiltration back into the aquifer and also provides the benefit of attenuation of naturally occurring arsenic in the groundwater before it reaches the existing water table. An attenuation study was conducted and approved showing that water treatment will not be necessary prior to infiltration (Piteau 2020a, 2020b).
Rapid Infiltration Basins (RIBs) were initially permitted and constructed in 2022 to verify infiltration performance and support final design of the dewatering discharge system. Subsequent operating experience has confirmed RIB performance and informed design refinements for additional basin construction. As of 2025, eight operable RIB cells are available for managing excess mine dewatering water, with operating records demonstrating sustained infiltration performance, adequate freeboard, and effective capacity to manage site dewatering discharges. Updated design criteria are summarized in Table 13-9, and the current RIB layout is shown on Figure 13-18.
| 13-34 | |
| SSR Mining Inc. | Marigold Complex | October 9, 2026 |
| S-K 1300 Technical Report Summary | SLR Project No.: 138.020810.00001 |
| Figure 13-17: | Marigold Dewatering Well Locations |
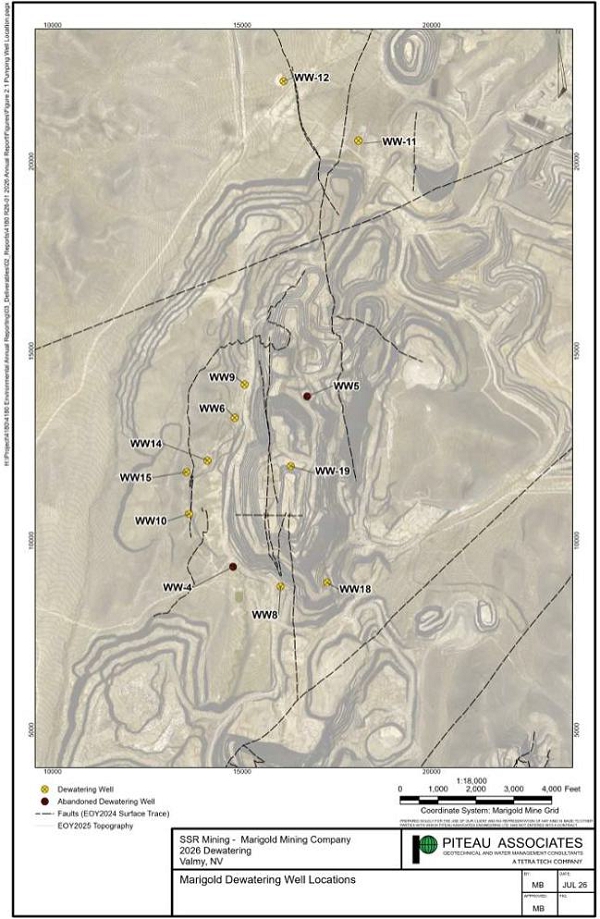
Source: SSR 2026.
| 13-35 | |
| SSR Mining Inc. | Marigold Complex | October 9, 2026 |
| S-K 1300 Technical Report Summary | SLR Project No.: 138.020810.00001 |
| Table 13-9: | RIB Design Criteria – Marigold Mine |
| RIB Cell Design Attribute | Unit | Dimensions |
| Basin floor length | m | 210 |
| Basin floor width | m | 59 |
| Basin crest length | m | 247 |
| Basin crest width | m | 106 |
| Minimum basin depth | m | 6.1 |
| Excavation/dump slope | H:V | 3:1 |
| Minimum spacing between cells | m | 122 |
| Access road width | m | 7.3 |
| Infiltration capacity | m/day | 0.43 |
| Infiltration capacity per cell | m3/min | 3.8 |
| Cell availability | % | 50 |
| Figure 13-18: | Marigold RIB Locations and Monitoring System |
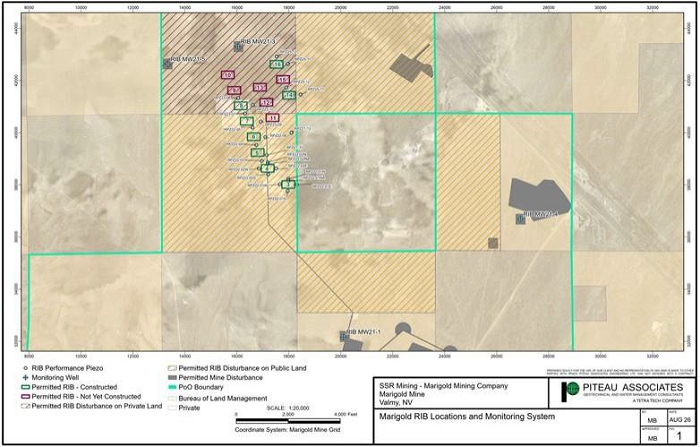
Source: SSR 2026.
| 13-36 | |
| SSR Mining Inc. | Marigold Complex | October 9, 2026 |
| S-K 1300 Technical Report Summary | SLR Project No.: 138.020810.00001 |
| 13.14.2 | Buffalo Valley |
WSP’s ‘Preliminary Dewatering Plan Technical Memorandum’ (WSP 2026b) outlines a pit dewatering strategy for the Buffalo Valley Mine Project based on hydrogeologic assessment, groundwater modeling, and a risk-based management approach. The plan recommends five deep dewatering wells located outside the pit crest to maintain groundwater control and dry mining conditions throughout the approximately seven-year mine life, with pumping commencing at a combined rate of 1,250 gpm and decreasing over time as drawdown is achieved. Performance will be evaluated through a monitoring network of nine piezometers, with quarterly reporting and adaptive management measures, including supplemental wells and accelerated dewatering if required. Surplus water not required for operations will be directed to three RIB cells, each capable of receiving the full dewatering discharge of up to 1,250 gpm. Expected discharge to the RIBs may reach approximately 700 gpm and average about 200 gpm, while modeling based on an 800 gpm infiltration rate predicted a groundwater mound of approximately 0.6m (2 ft) beneath the facility. The RIBs provide a mechanism for returning excess water to the aquifer, supporting groundwater sustainability and reducing the need for additional groundwater extraction. Together with the 110-million-gallon Operations Pond, which provides more than 100 days of water supply at peak operational demand, these facilities form a flexible and resilient water management system capable of supporting both dewatering and operational water requirements throughout the Buffalo Valley LOM.
| 13.15 | Mine Workforce |
The current mining workforce totals 540, and is summarized as follows:
| · | Mine Operations – 279 |
| · | Mine Maintenance – 119 |
| · | Process & Laboratory – 61 |
| · | Technical Services – 30 |
| · | General & Administration – 51 |
To support the Buffalo Valley expansion, total workforce requirements are projected to peak at 686 persons, representing an increase of 146 personnel as detailed further in Section 18.
| 13.16 | QP Opinion |
The SLR QP has reviewed the mining methods, fleet selection, equipment performance parameters, infrastructure requirements, mine workforce, and dewatering strategies presented in this section for both the Marigold Mine and the Buffalo Valley deposit.
It is the QP’s opinion that:
| · | The mining methods, pit designs, and operational plans are appropriate for the deposit characteristics and align with current industry standards and successful operating practices at the Marigold Complex. |
| · | The equipment fleet sizing, productivity estimates, and maintenance key performance indicators (KPIs) are reasonable, well-supported by historical operating data, and capable of meeting the production schedules defined in the LOM plan. |
| · | The dewatering strategies and water management infrastructure—including well networks, rapid infiltration basins (RIBs), and storage facilities—are adequately engineered to maintain dry operating conditions, though future permits will need to be secured as scheduled to support advanced LOM pit expansions. |
| 13-37 | |
| SSR Mining Inc. | Marigold Complex | October 9, 2026 |
| S-K 1300 Technical Report Summary | SLR Project No.: 138.020810.00001 |
| · | Overall, the data, parameters, and methodologies utilized to develop the mining methods chapter including the integration of the Buffalo Valley deposit, provide a sound operational and technical basis for supporting the Mineral Reserves estimate in accordance with S-K 1300 guidelines. |
| 13-38 | |
| SSR Mining Inc. | Marigold Complex | October 9, 2026 |
| S-K 1300 Technical Report Summary | SLR Project No.: 138.020810.00001 |
| 14.0 | Processing and Recovery Methods |
| 14.1 | Marigold |
The Marigold processing facilities combine industry-standard ROM cyanide heap leaching and recovery of gold from the leach solution using carbon adsorption, desorption, electrowinning, and refining to produce a final precious metal (doré) product.
A simplified process flow diagram of the Marigold heap leaching facilities is provided in Figure 14-1.
| Figure 14-1: | Simplified Marigold Processing Flowsheet |
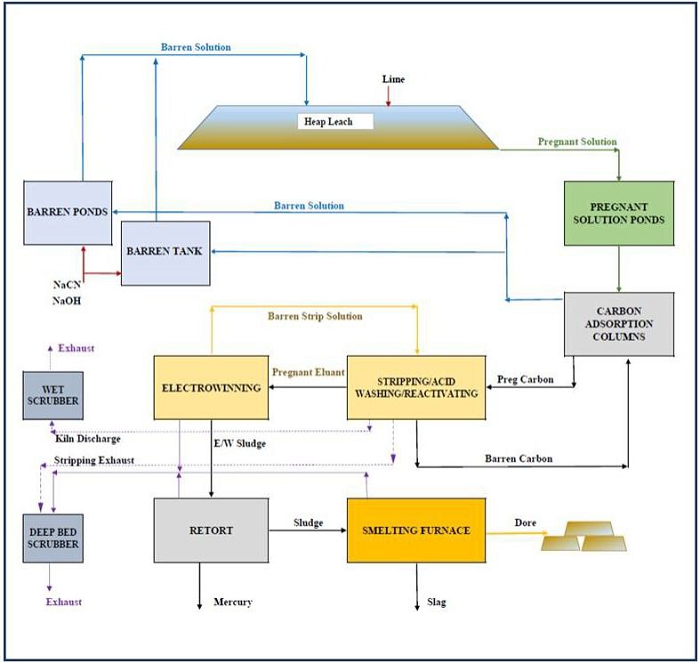
Source: SSR 2023.Heap Leach Pad Description
| 14-1 | |
| SSR Mining Inc. | Marigold Complex | October 9, 2026 |
| S-K 1300 Technical Report Summary | SLR Project No.: 138.020810.00001 |
The heap leach pad was originally constructed in 1990 and has since expanded as required, with ongoing expansion of solution processing facilities to match production rate and leach area. The leach pad area is divided into cells of specific sizes for inventory and irrigation control. Approximately 427 ha of heap leach pad (divided into 27 cells), six pregnant solution holding ponds, one storm water event pond, and two barren solution ponds have been constructed at Marigold. There are 17 cells currently active. Permitted stacking heights for heap leach Cells 1 to 10 are 106 m, and for Cells 11 to 27 are 122 m high.
The existing and authorized heap leach cells and ancillary facilities include Cells 1 through 27.
Associated process ponds, stormwater ponds, conveyance ditches, carbon column trains, storage tanks, and plant facilities.
| 14.1.1 | Process Descriptions |
| 14.1.1.1 | Ore Stacking on Leach Pad |
ROM ore is delivered from the mine at a rate of approximately 20 Mtpa to the leach pad by mine haul trucks and stacked in lifts of approximately 6 m to 12 m. Dry quicklime (CaO) at approximately 1.2 kg/t ore is added for pH control to the ore in loaded haul trucks from lime storage silos and delivery chutes located on the side of the haul road prior to dumping on the heap leach. Mixing is accomplished by end dumping and spreading of the material with a dozer. The fresh ore is ripped and cross-ripped to a depth of at least 1.3 m using a dozer with a long shank to break up compacted pad surface material to enhance percolation prior to placement of leach solution distribution piping.
| 14.1.1.2 | Leaching |
The available leach pad area is divided into cells with separate drainages for inventory and irrigation control. The heap leach operating parameters include quantity and lift height of ore placed, barren solution (a very low gold grade cyanide leach solution) irrigation rate per unit area, duration of irrigation (leach cycle), and time between lifts to manage future ore placement. Barren solution is applied selectively to each cell. At any given time, approximately 65 ha of pad area is being leached, with other areas draining or being made ready to accept ore for the next lift.
Barren leach solution is pumped to the leach pad by two independent barren solution distribution systems. Combined barren solution flow capacity from the two pumping systems is 3,400 m3/h; upgrades are underway to increase the pumping capacity to 4,540 m3/h. A series of header and sub-header pipelines supplying irrigation drip tubing are used to distribute the barren solution from the main barren solution pipelines to each cell. Solution is applied to the ore at a rate of 4.6 L/h/m2 to 8.6 L/h/m2 using drip emitters. Impact sprinklers, wobblers, or drip emitters are used to irrigate the side slopes of the heap.
The barren solution percolates through the ore, collecting precious metals, and exits the heap material at one of several collection areas as pregnant solution. Upon exiting the heap, the pregnant solution is routed to the pregnant solution ponds.
Leaching is conducted concurrently with ore stacking to allow progressive lifts to be constructed and operated in a similar manner. The ratio of ore stacked to ore being leached is maintained to provide the amount of solution applied and retention time required for the leach cycle. The pH and cyanide concentrations are adjusted to 10.5 and 300 g (NaCN)/t solution, respectively. in either the barren solution pond or by injection into the barren solution line at the toe of the heap.
| 14-2 | |
| SSR Mining Inc. | Marigold Complex | October 9, 2026 |
| S-K 1300 Technical Report Summary | SLR Project No.: 138.020810.00001 |
| 14.1.1.3 | Description of Ponds |
Solution management consists of six authorized pregnant solution ponds (Pregnant Ponds No. 1 to 6) and one storm water event pond, which are interconnected with synthetic-lined channels. Pregnant Pond No. 1 is only used during significant events. There are also two barren solution ponds (Barren Pond No. 1 and 2), which are interconnected with a synthetic-lined channel. The process solution ponds have been designed to hold the working volume of solution while maintaining a two-foot freeboard after a 100-year storm event and 24-hour power outage. Construction is currently underway to expand pond 6 into a new pond 7 to allow for additional storage of process water at the higher barren pumping rates.
Ancillary facilities include solution pumps and piping, two separate sodium cyanide addition facilities, two sodium hydroxide addition systems (barren solution pH adjustment), and four locations for antiscalant addition.
| 14.1.1.4 | Carbon Adsorption |
Pregnant solution from the leach pad is collected in the pregnant solution ponds and pumped to the CIC adsorption plant located on the north side of Barren Pond No. 1 to recover the gold. The CIC adsorption plant consists of seven parallel trains of carbon columns, each with five columns. In 2026, four new trains are being added to process the higher pregnant solution return rates expected by the barren pumping upgrades. Each train is designed to process 450 m3/h of pregnant solution. Column discharge solution reports to the barren ponds, where fresh and reclaim water is added to maintain the appropriate water balance, before the solution is recycled back to the leach pad. The plant also contains carbon storage tanks, a liquid cyanide storage tank, and a liquid caustic soda storage tank.
| 14.1.1.5 | Carbon Elution and Electrowinning |
Loaded carbon from carbon adsorption is transported by a dedicated truck to the carbon processing facility where gold is eluted (re-dissolved) from the carbon in two 2.7 t capacity carbon elution vessels. Gold is eluted from the carbon using the Pressure Zadra process, where a hot caustic solution at approximately 140°C and with a pH of 13 or greater is circulated through the elution column, from bottom to top, under pressure. The resulting gold-rich eluate flows from the top of the column to a rich electrolyte tank, from which it is pumped through two parallel 2.8 m3 electrowinning cells to recover the gold. The barren eluant discharging the electrowinning cells is recirculated through heat exchangers to the bottom of the elution vessel to strip more gold. The process continues until most of the gold is recovered from the carbon.
| 14.1.1.6 | Carbon Regeneration |
The eluted carbon is acid washed in an acid wash column with hydrochloric acid to remove carbonate scale and inorganics. The acidified carbon is then neutralized with water in the same column. The carbon is discharged from the column and transferred to the reactivation kiln. The carbon is reactivated, as required, by heating in a rotary kiln at 750°C. The reactivated carbon is quenched and screened before being returned to the carbon adsorption circuit to be reloaded with gold.
| 14.1.1.7 | Refining |
The plated material (sludge) resulting from electrowinning is collected in a filter press and then retorted for drying and mercury removal. After retorting, the sludge is mixed with flux and smelted in a propane fired furnace for final precious metal doré recovery.
| 14-3 | |
| SSR Mining Inc. | Marigold Complex | October 9, 2026 |
| S-K 1300 Technical Report Summary | SLR Project No.: 138.020810.00001 |
| 14.1.1.8 | Ventilation |
Ventilation from the strip circuit pregnant and barren solution tanks, electrowinning cells, retort, and smelting furnace is directed to a deep bed scrubber (sulfur-impregnated activated carbon) where any vaporized mercury is recovered prior to exhaust.
The kiln discharge is vented to a wet scrubber that uses water mist to condense mercury and recover it as elemental mercury. After demisting, the air is also passed through sulfur-impregnated carbon to recover any remaining vaporized mercury prior to exhaust.
| 14.1.2 | Planned Upgrade Projects |
Several ongoing improvement projects are listed:
| · | With the increasing height of the heap leach pads and distance from the primary pump locations, barren booster pumps are planned to be installed to maintain solution flow rates at 3,180 m3/hr. Upgrades are currently underway to increase near-term pumping capacity to 4,540 m3/hr while maintaining the ability to route appropriate volumes of barren solution to higher areas of the pad in the future. |
| · | Installation of mobile telemetry and instrumentation, as well as telemetry on primary pregnant and barren flowmeters, is planned to be able to remotely monitor individual area barren application rates. |
| · | Modification of CIC bubble plates to assist with equalizing solution distribution across the column and increasing flow rate of solution through the CICs while maintaining the carbon inventory in the columns and adsorption efficiencies. |
| 14.1.3 | Reagents |
Reagent consumption rates are within industry norms for the types of ores processed. Average annual unit consumption rates of the reagents for the period 2010 to April 2026 are shown in Figure 14-2. The increase in lime and antiscalant consumption during 2025 and 2026 represents increasing ore production and higher sulfide content in the ore.
| 14-4 | |
| SSR Mining Inc. | Marigold Complex | October 9, 2026 |
| S-K 1300 Technical Report Summary | SLR Project No.: 138.020810.00001 |
| Figure 14-2: | Average Annual Reagent Consumption |
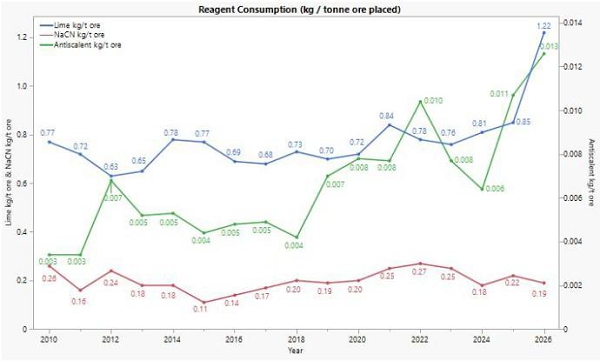
Source: SSR 2026
| 14.1.4 | Gold Recovery |
From March 1990 through April 2026, gold recovery from the heap leach pad is 72.7%. This recovery was achieved with 90- to 120-day primary leach cycles and an overall mass-of-solution to mass-of-ore ratio of 1.29:1. The Marigold project-to-date heap leach gold recovery trend from March 1990 through April 2026 from the Marigold heap leach is shown in Figure 14-3.
| Figure 14-3: | Marigold Heap Leach Pad Gold Recovery (March 1990 through April 2026) |
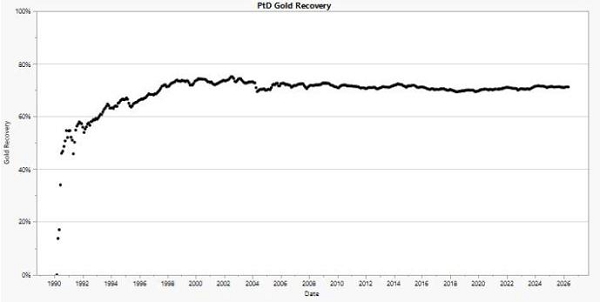
Source: SSR 2026
| 14-5 | |
| SSR Mining Inc. | Marigold Complex | October 9, 2026 |
| S-K 1300 Technical Report Summary | SLR Project No.: 138.020810.00001 |
| 14.2 | Buffalo Valley |
The design of the Buffalo Valley processing facilities follows the same philosophy as is utilized at Marigold. A multi-cell heap leach pad, designed to accommodate the expected mining rate up to 14 Mtpa, will be truck-stacked either with ROM or crushed ore in 7.5 m to 12.5 m lifts. Cyanide solution will be applied to the surface at a nominal rate of 8 L/h/m2, and approximately 300 g NaCN/t of solution will percolate through the ore, dissolving precious metals, before being collected in a drain network at the plastic liner.
Pregnant solution will flow by gravity directly into a pregnant solution tank, then be pumped to three CIC carbon column trains for adsorption. It was determined that 3 x 9,997 m3/h trains, with 5 x 9,997 m3/h columns per train, provide the best balance of maintenance and production flexibility. Construction of the third train can be delayed until year 3 to support production in year 4 of the LOM, or it can be omitted if production at the end of the LOM is slowed. A process flow diagram and a layout of the CIC circuit are shown in Figure 14-4 and Figure 14-5, respectively.
Loaded carbon from the carbon adsorption circuit will be transferred to a loaded carbon storage tank, which will then be pumped into a carbon transfer truck and transported to the Marigold elution facility for acid washing, elution, and reactivation.
Barren carbon will be loaded into the carbon transfer truck and returned to the Buffalo Valley process plant. Barren carbon will be pumped from the carbon transfer truck into a barren carbon storage tank before being returned to the adsorption circuit.
Barren process solution will be pumped to the irrigation system from a barren solution concrete vault using vertical turbine pumps. After percolating through the ore, the gold-bearing pregnant leach solution will drain by gravity to a pregnant solution tank, where it will be collected and pumped to the carbon adsorption circuit for metal recovery.
Process solution ponds, including a Process and Stormwater Pond, have been designed to allow for variable solution flow and to collect contact solution from storm events or upset conditions. Solution collected will be used as make up solution to the process. Solution from the ponds can either be pumped back to the Barren vault or directly back to the heap leach.
| 14-6 | |
| SSR Mining Inc. | Marigold Complex | October 9, 2026 |
| S-K 1300 Technical Report Summary | SLR Project No.: 138.020810.00001 |
| Figure 14-4: | Buffalo Valley Process Flowsheet |
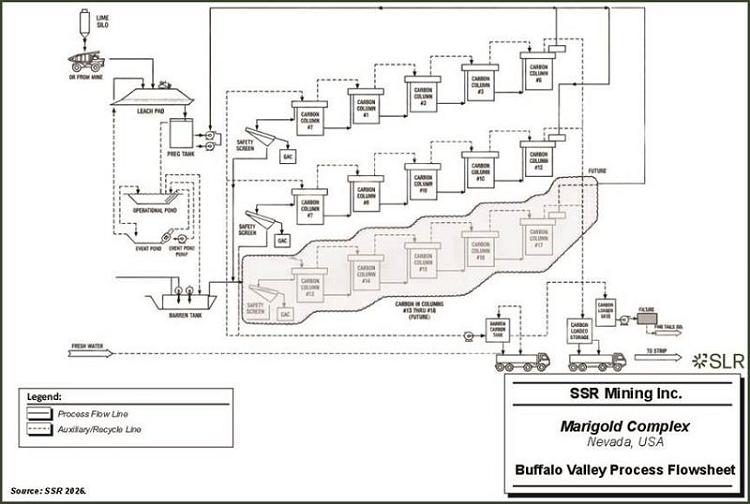
| 14-7 | |
| SSR Mining Inc. | Marigold Complex | October 9, 2026 |
| S-K 1300 Technical Report Summary | SLR Project No.: 138.020810.00001 |
| Figure 14-5: | Plan View of the Buffalo Valley Process Facility |
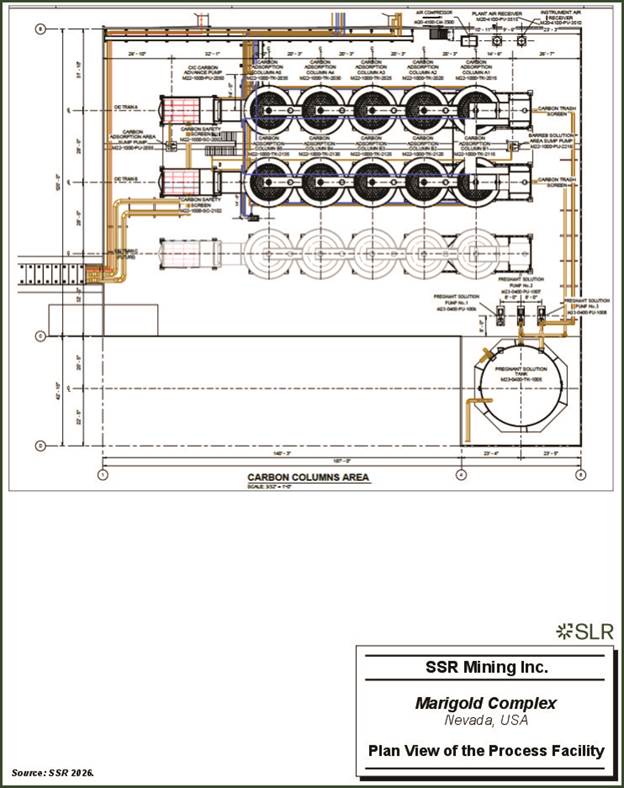
| 14-8 | |
| SSR Mining Inc. | Marigold Complex | October 9, 2026 |
| S-K 1300 Technical Report Summary | SLR Project No.: 138.020810.00001 |
| 14.3 | QP Opinion |
The Marigold Mine is a conventional ROM heap leach operation that has been operating since 1990. The ore has been very consistent during this period. SSR operators track solution grades, metal recoveries, and reagent consumption daily, and future recoveries are projected from operating data, cyanide-soluble gold analyses, and supplemental column leach testing. Upgrades to the barren solution pumping system and carbon columns are being installed to support a planned increase in mine production and ore placement. The QP has reviewed the LOM mining schedule and solution application rates, and both are within the designed ranges.
The adjacent Buffalo Valley heap-leach project was also reviewed by the QP. The Buffalo Valley process facilities will be designed and operated similarly to Marigold, leveraging Marigold personnel and experience. SSR has developed a feasibility study for the Buffalo Valley Project (SSR 2026b). Key design considerations are included in the TRS.
| 14-9 | |
| SSR Mining Inc. | Marigold Complex | October 9, 2026 |
| S-K 1300 Technical Report Summary | SLR Project No.: 138.020810.00001 |
| 15.0 | Infrastructure |
| 15.1 | Marigold Infrastructure |
| 15.1.1 | Site Access, Power, and Water |
| 15.1.1.1 | Site Access |
Marigold is accessible via Interstate Highway 80 in northern Nevada and is approximately five kilometers south–southwest of Valmy in Humboldt County. The site access road supports two lanes of traffic and consists of hard-packed clay and gravel.
| 15.1.1.2 | Power |
The power supply for Marigold is provided by NV Energy Inc. via a 120 kV transmission line to site. Site power draw is 5 MW. After exiting the main substation, power is distributed through a 25 kV distribution grid. The location of the main electrical substation is shown in Figure 15-1.
| 15.1.1.3 | Operations Water Supply |
Water for Marigold is supplied by three groundwater production wells located near the site access road and ten dewatering wells located around the perimeter of the mining operations. Flows from the dewatering wells are used to supplement the production wells when needed, and the remainder of the flows are routed to the RIBs. Well locations are shown in Figure 15-2 for the production wells and in Figure 13-17 for the dewatering wells.
Additional details on the existing and planned mine dewatering infrastructure is provided in Section 13.14.
Water is used across the operation for process makeup, dust suppression, and other operational needs such as drilling and equipment washing. MMC holds groundwater rights authorizing annual consumptive use of up to 3.14 million m³ under the Marigold Plan of Operations. These water rights are limited to points of use located within the Clovers Hydrographic Basin. Historical total water use by the site (2021 to 2025) has averaged 1.52 million m³ per year, corresponding to an average water intensity of 0.07 m³ per tonne stacked on the heap leach facility. Under the TRS mine plan, the peak annual water consumption is projected to reach approximately 2.55 million m³ in 2030.
Discussion of the extraction and infiltration of pit water is included in Section 13.14.
| 15-1 | |
| SSR Mining Inc. | Marigold Complex | October 9, 2026 |
| S-K 1300 Technical Report Summary | SLR Project No.: 138.020810.00001 |
| 15.1.2 | Buildings and Facilities |
| 15.1.2.1 | Buildings and Facilities in Main Plant and Offices Area |
The buildings and facilities described below are located in the main plant and offices area, as shown in Figure 15-1:
| · | Truck shop and mobile maintenance warehouse: The Marigold truck shop complex is located near the mine entrance. It is a four-bay shop sized for 300 st class haul trucks. The shop contains a tool crib, oil and lubricant bulk storage, ten offices, locker rooms, training room, and warehouse. A covered warehouse storage yard is located adjacent to the admin building complex. |
| · | Mill building: The mill building consists of facilities supporting the metal recovery operations, including the refinery and metallurgical laboratory. Adjacent to the mill building is the thickener water storage tank and remaining CIL tanks from the 1989 flowsheet. Liquid cyanide is delivered by truck to a storage tank adjacent to the ADR plant. |
| · | Crushing plant: The crushing plant is used to produce stemming for blastholes, road material, and over liner for heap leach pad. The crusher is a remnant from the 1989 flowsheet. |
| · | Heap leach carbon columns: The heap leach carbon columns are an integral part of the gold recovery process, which is detailed in Section 14. |
| · | Wash bay: The wash bay is located next to the truck shop and consists of one covered bay. The wash bay building also contains a settling pond for water recycling. |
| · | Administration building and light vehicle (old) shop: The main administration building encompasses most site-support departments and includes a small warehouse facility, core shed, the shovel and drill shop (former truck shop), light-vehicle maintenance bay and the assay laboratory. The assay laboratory supports ongoing mine operations, including grade control and gold solution analysis. Adjacent to this building are trailers that provide additional office space. |
| · | Motor control center (MCC): The MCC houses controls for the pumps and boosters for the barren and pregnant solution ponds. |
| · | Lime storage silos: Located on the side of the haul road prior to dumping on the heap leach. |
| 15.1.2.2 | Additional Buildings and Facilities on Site |
Additional buildings and facilities on site include:
| · | Site access building |
| · | Potable water treatment building |
| · | Process line-out building |
| · | Radio shop |
| · | Safety building |
| · | Hose shop and storage |
| · | Tire pad |
| · | Fuel stations |
| 15-2 | |
| SSR Mining Inc. | Marigold Complex | October 9, 2026 |
| S-K 1300 Technical Report Summary | SLR Project No.: 138.020810.00001 |
| 15.1.2.3 | Additional Facilities on Section 20 |
Additional facilities are located on Section 20, which is identified in Figure 15-3 as the Mine Ops area. These facilities include:
| · | Welding and fabrication shop |
| · | Dispatch/MineCare office and mine operations line-out building |
| · | GPS dispatch receiver |
| · | Diesel tanks and fueling station |
| 15.1.3 | Explosives Magazine |
The explosives magazine is located a safe distance from the plant and the office area.
| 15.1.4 | Tailings Storage Facility and Water Diversion |
The Tailings Storage Facility (TSF) was decommissioned and reclaimed. The only remaining activity concerning the TSF is ongoing monitoring.
The Trout Creek water diversion structure and flood control dam is located west of the former Basalt Pit. It is designed for a 100-year storm event.
| 15.1.5 | Leach Pads and Solution Ponds |
The leach pad is discussed in detail in Sections 14, and its location is shown in Figure 15-3.
Details on the barren and pregnant solution ponds can be found in Section 14.0.
| 15.1.6 | Overburden Storage Areas |
Details on completed, in progress, and future overburden storage area (OBSA) are included in Section 13.0. The general location of planned and current OBSA is shown in Figure 15-3.
| 15-3 | |
| SSR Mining Inc. | Marigold Complex | October 9, 2026 |
| S-K 1300 Technical Report Summary | SLR Project No.: 138.020810.00001 |
| Figure 15-1: | Infrastructure Site Map |
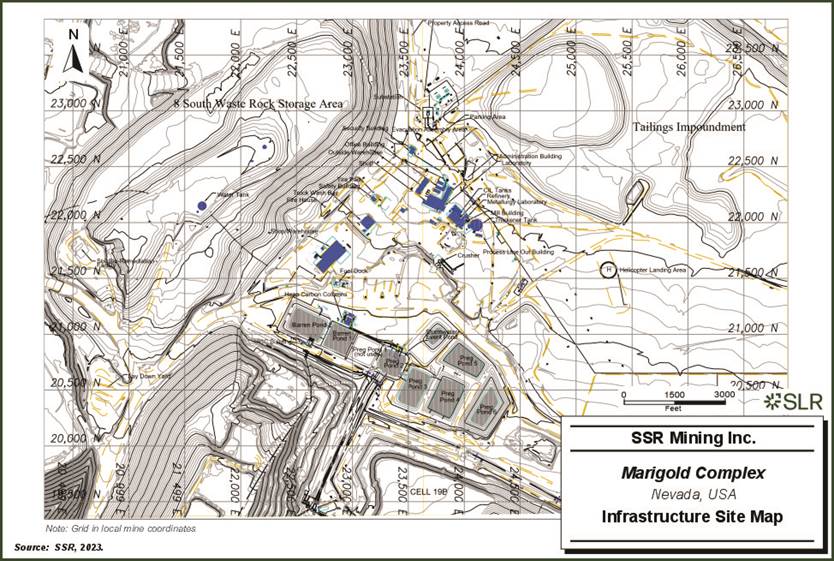
| 15-4 | |
| SSR Mining Inc. | Marigold Complex | October 9, 2026 |
| S-K 1300 Technical Report Summary | SLR Project No.: 138.020810.00001 |
| Figure 15-2: | Freshwater Well Sites |
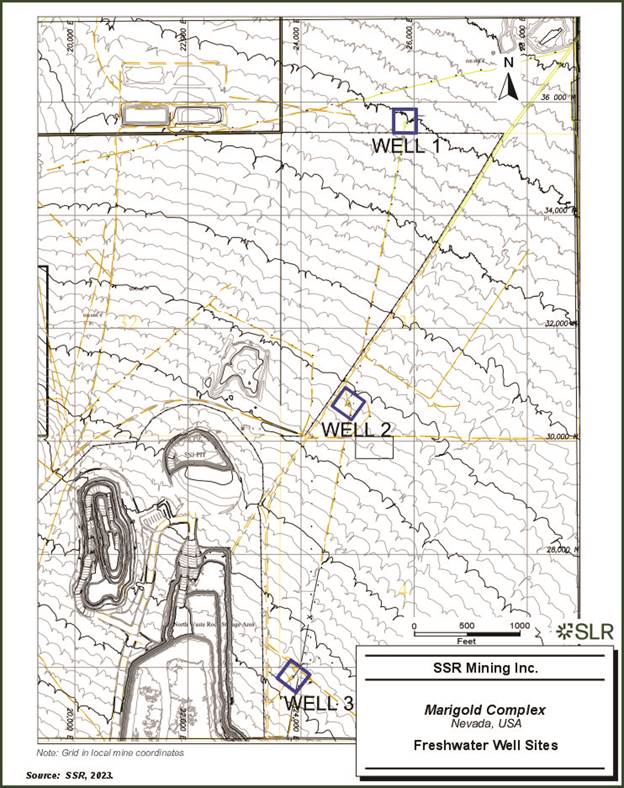
| 15-5 | |
| SSR Mining Inc. | Marigold Complex | October 9, 2026 |
| S-K 1300 Technical Report Summary | SLR Project No.: 138.020810.00001 |
| Figure 15-3: | LOM Site Schematic Showing Final Pit Limits, OBSA, and Leach Pad |
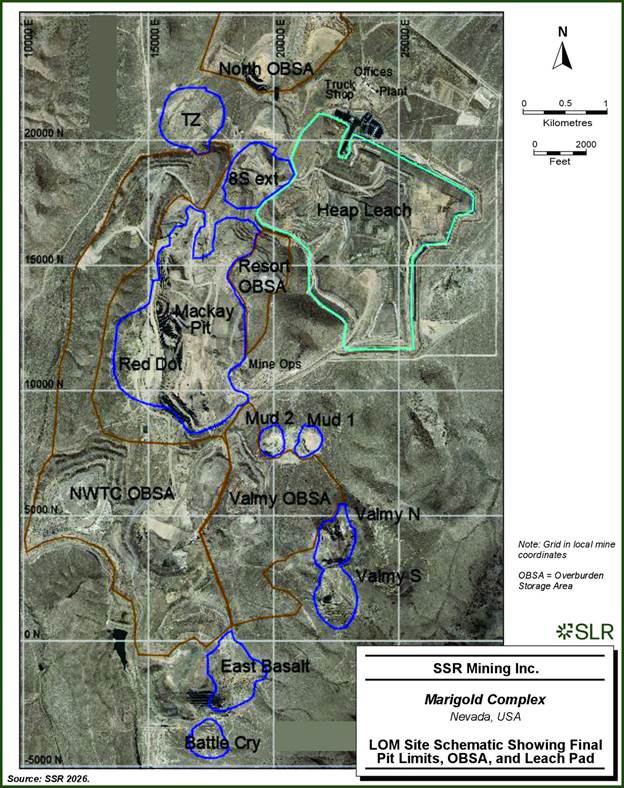
| 15-6 | |
| SSR Mining Inc. | Marigold Complex | October 9, 2026 |
| S-K 1300 Technical Report Summary | SLR Project No.: 138.020810.00001 |
| 15.2 | Buffalo Valley Infrastructure |
| 15.2.1 | Site Layout |
The initial site layout for Buffalo Valley was developed from the Newmont Plan of Operations, acquired as part of the property purchase, and was refined throughout the study phases of the Project. The Plan of Operations site layout is shown in Figure 15-4. SSR determined that it is more economical to perform truck maintenance and parts warehousing at Marigold, with haul trucks returning to Marigold for periodic maintenance. The Mine Ops ponds are sized to meet the facility's process make-up water requirements. Haul roads and light vehicle access roads throughout the site have been included in the design.
| 15-7 | |
| SSR Mining Inc. | Marigold Complex | October 9, 2026 |
| S-K 1300 Technical Report Summary | SLR Project No.: 138.020810.00001 |
| Figure 15-4: | Buffalo Valley Site Layout |
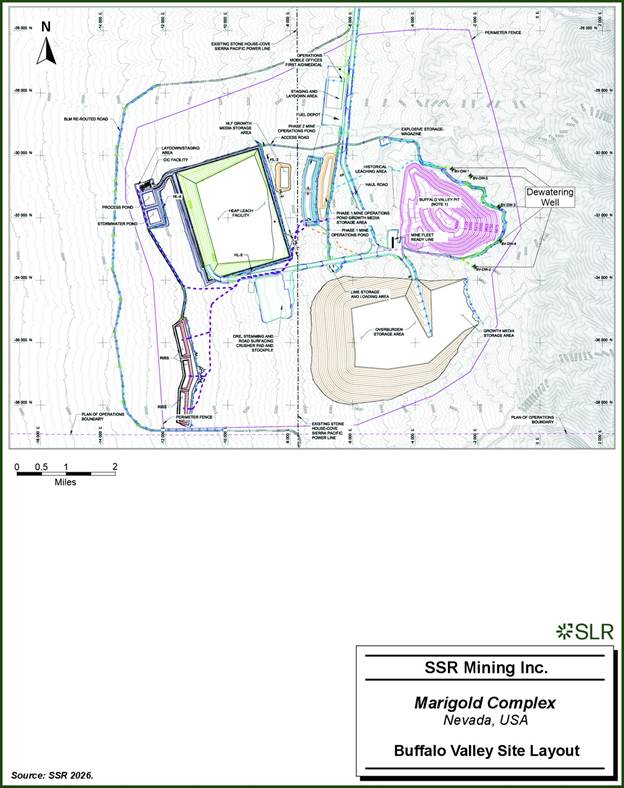
| 15-8 | |
| SSR Mining Inc. | Marigold Complex | October 9, 2026 |
| S-K 1300 Technical Report Summary | SLR Project No.: 138.020810.00001 |
| 15.2.2 | Plan Boundary |
The proposed Buffalo Valley property boundary was finalized during the Feasibility Study (SSR 2026b) and is shown in Figure 15-5.
| 15-9 | |
| SSR Mining Inc. | Marigold Complex | October 9, 2026 |
| S-K 1300 Technical Report Summary | SLR Project No.: 138.020810.00001 |
Figure 15-5: Buffalo Valley Plan Boundary
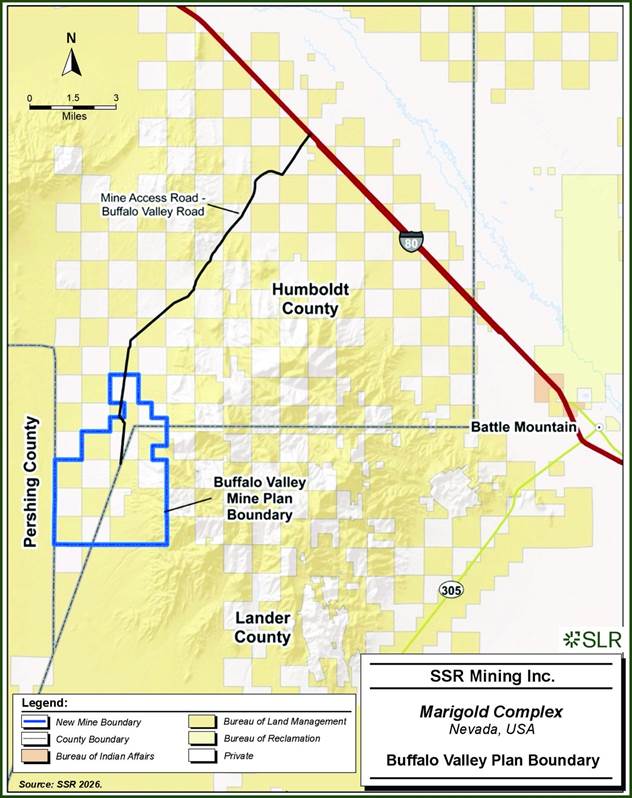
| 15-10 | |
| SSR Mining Inc. | Marigold Complex | October 9, 2026 |
| S-K 1300 Technical Report Summary | SLR Project No.: 138.020810.00001 |
| 15.2.3 | Marigold to Buffalo Valley Connector Road |
The Marigold to Buffalo Valley connector road was fully engineered by WSP during the Feasibility Study (SSR 2026b). The road route and design are shown in Figure 15-6.
| 15-11 | |
| SSR Mining Inc. | Marigold Complex | October 9, 2026 |
| S-K 1300 Technical Report Summary | SLR Project No.: 138.020810.00001 |
Figure 15-6: Routing of Marigold to Buffalo Valley Connector Road
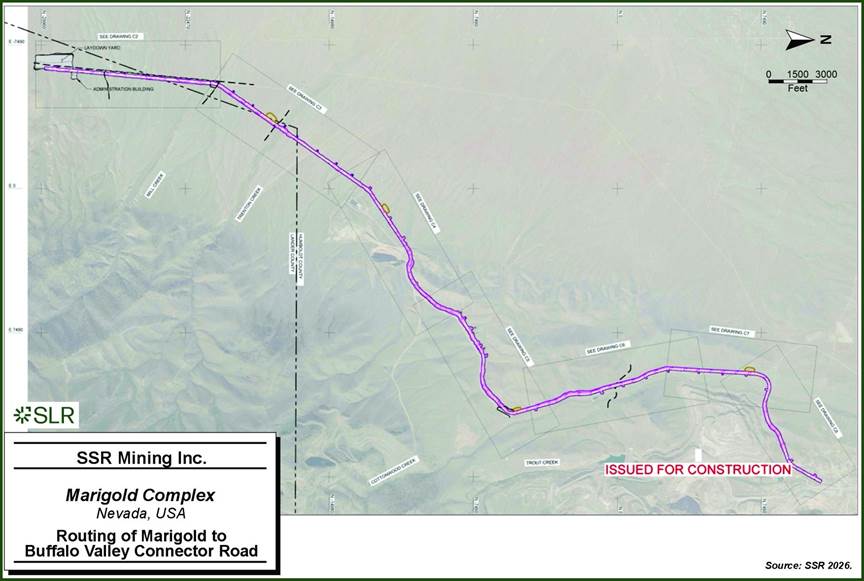
| 15-12 | |
| SSR Mining Inc. | Marigold Complex | October 9, 2026 |
| S-K 1300 Technical Report Summary | SLR Project No.: 138.020810.00001 |
| 15.2.4 | Maintenance Facilities |
SSR conducted trade-off studies to evaluate site warehouse and haul truck maintenance shop locations and the cost difference between using the current shop at Marigold and constructing a new shop at BV. Given Buffalo Valley's short mine life, SSR decided to use the Marigold truck shop rather than build a new one at Buffalo Valley. No other maintenance facilities are planned at Buffalo Valley.
| 15.2.5 | Fuel |
A fuel depot will be installed on the access road south of the operations mobile offices, first-aid and medical offices, and the vehicle staging and laydown area, as shown on the Buffalo Valley Site Layout.
| 15.2.6 | Water Supply |
Water is supplied to Buffalo Valley from pit dewatering infrastructure, including five deep wells and three RIBs. Dewatering well locations are shown in Figure 15-4.
| 15.2.7 | Power |
Buffalo Valley will need to construct approximately 14.5 km of 24.9 kV power line from the existing North Peak substation to service the Buffalo Valley site. Line power will be stepped down to 4,160 V, 480 V, and 110 V as required with power primarily distributed at 4,160 V or 480 V to motor control centers serving the respective process areas.
Power usage for the process and process-related infrastructure was determined from the mechanical equipment load list. Equipment power demands under normal operation were estimated using operating availability and load estimates to determine average energy usage and cost.
| 15.2.7.1 | North Peak Substation Connection |
Currently, the North Peak substation is fed from the existing Marigold Mine substation, supplied by NV Energy. The feeder to the North Peak substation is connected to an existing 15/20/25 MVA power substation transformer. The current 24.9 kV power line can be extended from the transition point at North Peak to supply power to Buffalo Valley. Buffalo Valley is approximately 9.6 km (6 mi) southwest of North Peak.
The power line feeding the North Peak substation from the Marigold substation may need to be upgraded in the future, depending on the need for additional crushing and whether the pit dewatering pumps are included in the design. The cost of this upgrade was included in the project economics for all scenarios that included the crusher and/or pit dewatering.
Three site-area transformers will be required at different locations throughout Buffalo Valley. The anticipated transformer-connected loads are 6.53 MW, and the calculated demand loads are 4.61 MW (including the crushing circuit and pit dewatering pumps). The new overhead power line from North Peak to Buffalo Valley will be routed along the new Marigold-Buffalo Valley connector road.
| 15.2.8 | Explosives Magazine |
The explosives magazine is located a safe distance to the east of the plant and the office area and to the north of the open pit.
| 15-13 | |
| SSR Mining Inc. | Marigold Complex | October 9, 2026 |
| S-K 1300 Technical Report Summary | SLR Project No.: 138.020810.00001 |
| 15.3 | QP Opinion |
The infrastructure supporting the Marigold Mine is well established, well maintained, and has been operating for many years. Infrastructure for the new Buffalo Valley Mine has been developed by leveraging the existing Marigold infrastructure, including the power supply, which is connected to Marigold through the North Peak substation, and maintenance facilities, reducing the number of facilities required at Buffalo Valley. The SLR QP agrees that this is a practical approach, especially during the early stages of mine operation and the relatively short mine life. Infrastructure elements, such as specific maintenance facilities, can be added as required as the mine develops.
| 15-14 | |
| SSR Mining Inc. | Marigold Complex | October 9, 2026 |
| S-K 1300 Technical Report Summary | SLR Project No.: 138.020810.00001 |
| 16.0 | Market Studies |
The Marigold Complex produces gold and silver contained in doré. Marigold is an active producer and has been for over three decades.
| 16.1 | Marketing and Metal Prices |
Gold is the principal commodity at the Marigold Complex and is freely traded at prices that are widely known, so that prospects for sale of any production are virtually assured. Metal prices for the economic analysis were based on the latest available consensus industry metal price forecast and compared to those used in other published studies. The metal prices selected are shown below in Table 16-1.
| Table 16-1: | Economic Analysis Metal Price Assumptions |
| Metal Price | Units | 2026 | 2027 | 2028 | 2029 | 2030 | Long-Term |
| Gold | $/oz | 4,637 | 4,794 | 4,616 | 4,355 | 3,991 | 3,710 |
Doré poured on-site is stored in a vault until it is securely transported by road freight to a refinery where it is refined into gold bullion. The bullion is sold by SSR to banks that specialize in the purchase and sale of gold bullion.
No external consultants or market studies were directly relied on to assist with the sales terms and commodity price projections used in this TRS.
| 16.2 | Contracts |
There are a number of acceptable refineries with the capacity to refine doré. Currently, SSR has entered into a non-exclusive refining agreement with Asahi Refining USA, Inc., and the terms and conditions of this contract, which include transportation and refining costs, are within industry norms.
| 16-1 | |
| SSR Mining Inc. | Marigold Complex | October 9, 2026 |
| S-K 1300 Technical Report Summary | SLR Project No.: 138.020810.00001 |
| 17.0 | Environmental Studies, Permitting, and Plans, Negotiations, or Agreements with Local Individuals or Groups |
| 17.1 | Summary |
Specific federal, state, and local (Humboldt County and Lander County, Nevada) regulatory and permitting requirements apply to MMC. MMC currently holds active, valid permits for all facets of the mining operation at Marigold and is in the process of obtaining permits for mining operations at Buffalo Valley. There is currently an exploration permit for Buffalo Valley. MMC is currently in compliance with all permits at both sites. At present, there are no known environmental or social issues that impact the ability to extract Mineral Resources at the Property.
All activities associated with MMC require an approved reclamation plan that includes a Reclamation Cost Estimate (RCE) for all permitted facilities and activities. The RCE for Marigold was updated and approved by federal and state agencies in 2026. Permitted activities at Buffalo Valley are limited to exploration, and the RCE was updated and approved in 2025. The permitting process for Buffalo Valley, based on of the recent Feasibility Study and growth plan, has begun with the development of a Plan of Operations (PoO), accompanied by environmental baseline studies and an RCE being submitted to BLM and Nevada Division of Environmental Protection–Bureau of Mining Regulation and Reclamation (NDEP-BMRR) in May 2026.
MMC maintains ongoing engagement with local communities, stakeholders, and regulatory agencies. Based on information available at the Effective Report Date, there are no outstanding negotiations or social commitments expected to materially affect current operations or future development of the Project.
| 17.2 | Marigold |
| 17.2.1 | Environmental Studies |
Significant portions of Marigold Mine exist on public lands administered by the BLM. As a result, the majority of environmental studies related to mining activities were conducted under the BLM authority as part of the National Environmental Policy Act (NEPA) regulations, which require various degrees of environmental impact analyses dictated by the scope of the proposed action. The Marigold Mine has undergone several significant NEPA actions in the normal course of operational planning; the most recent was the PoO – Valmy Development Project (the PoO Amendment), approved in 2023, to permit the future mining in the Valmy and New Millenium pits.
The environmental baseline studies to support the Environmental Assessment (EA) process for the PoO Amendment were initiated in 2021. A list of the baseline studies and reports is shown in Table 17-1. Previous baseline studies to support the permitting of Marigold Mine in 2015 included, but was not limited to, socioeconomics, air quality, cultural and archaeological resources, hydrogeology, hydrology, geochemistry, and wildlife.
| 17-1 | |
| SSR Mining Inc. | Marigold Complex | October 9, 2026 |
| S-K 1300 Technical Report Summary | SLR Project No.: 138.020810.00001 |
| Table 17-1: | Marigold Mine Baseline Studies Supporting the EA |
| Study Media | Documents/Reports Included Baseline Studies and Data Compiled for Marigold Mine Valmy Development EA |
| Hydrology/Water Quality/Geochemistry | Hydrogeologic Assessment, Geochemical Testing Workplan |
| Air Quality | Air Quality Assessment |
| Flora/Fauna | Golden Eagles Surveys, Sage Grouse Surveys |
| Socio-Economic | Social Baseline Assessment |
| Cultural Resources | Cultural Resource Survey |
Following the approval of the PoO, MMC obtained approval for modifications to State permits to incorporate the Valmy Development Project in 2024. The Environmental Assessment conducted by BLM resulted in a Finding of No Significant Impact (FONSI) in 2024 as well.
| 17.2.2 | Project Permitting |
Specific federal, state, and local (Humboldt County, Nevada) regulatory and permitting requirements apply to Marigold Mine. The primary permits for Marigold Mine operations include the PoO permitted via the BLM; the Water Pollution Control Permits (WPCP) issued by NDEP-BMRR; and the reclamation permit issued by the NDEP-BMRR. MMC currently holds active, valid permits for all facets of the mining operation, including, but not limited to, those permits listed in Table 17-2.
| Table 17-2: | Marigold Mine Environmental Permits for Operation |
| Agency | Permit Name | Permit Number | Status |
| Bureau of Land Management (BLM) | Plan of Operations | NVN065034 | Active |
| Nevada
Division of Environmental Protection –Bureau of Mining Regulation and Reclamation (NDEP-BMRR) |
Water Pollution Control Permit (including Petroleum Contaminated Soils Permit) | NEV0088040
NEV2022118 |
Active |
| NDEP-BMRR | Reclamation Permit | #0108 | Active |
| Nevada Division of Environmental Protection –Bureau of Water Pollution Control (NDEP-BWPC) | Stormwater General Discharge Permit | NVR300000 | Active |
| Nevada
Division of Environmental Protection –Bureau of Air Pollution Control (NDEP-BAPC) |
Title V Air Quality Operating Permit | AP1041-2967.01 | Active |
| NDEP-BAPC | Class II Air Quality Operating Permit | AP1041-3666 | Active |
| NDEP-BAPC | Mercury Operating Permit to Construct: Phase II air) | AP1041-2254 | Active |
| 17-2 | |
| SSR Mining Inc. | Marigold Complex | October 9, 2026 |
| S-K 1300 Technical Report Summary | SLR Project No.: 138.020810.00001 |
| Agency | Permit Name | Permit Number | Status |
| Nevada Department of Wildlife (NDOW) | Industrial Artificial Pond Permit | 41564 | Active |
| United States Environmental Protection Agency (EPA) | EPA/RCRA ID | NVD986766954 | Active |
| United States Army Corps of Engineers | Not Required | No jurisdictional waters delineated (June 2025) | NA |
| United States Bureau of Alcohol, Tobacco and Firearms | Explosives Permit | 9-NV-013-20-9F-00359 | Active |
| United States Fish and Wildlife Service (USFWS) | Long-term Eagle Incidental Take Permit | MBPER10876492 | Active |
| Federal Communications Commission Permit | Radio Communications Equipment Authorization | WNPA726 | Active |
| Nevada
Division of Environmental Protection –Bureau of Sustainable Materials Management (NDEP-BSMM) |
Class III Landfill Waiver | SW1764 | Active |
| SW1824 | Active | ||
| SW1912 | Active | ||
| Nevada State Fire Marshal | Hazardous Materials Permit (State of Nevada) | 125911 | Active |
| Nevada
Division of Environmental Protection –Bureau of Safe Drinking Water (NDEP-BSDW) |
Potable Water Permit | HU-1103-NTNC | Active |
| NDEP-BWPC | Septic Permit | GNEVOSDS09-0016 | Active |
| GNEVOSDS09-0252 | Active | ||
| United States Department of Transportation | Hazardous Materials Storage and Transportation Registration | 061521550469DF | Active |
| Nevada Board of Regulation of Liquefied Petroleum Gas | Liquefied Petroleum Gas – Class 5 License | 5-3482-01 | Active |
| Nevada Division of Water Resources (NDWR) | Trout Creek Dam Permit | J-666 | Active |
| NDWR | Water Rights | 83256 (Certificate 583) | Active |
| 2324 (Certificate 584) | Active | ||
| 86582 | Active | ||
| 86583 | Active | ||
| 86584 | Active | ||
| 86585 | Active | ||
| 87235-87242 | Active | ||
| 76425S01 | Active | ||
| 76425S02 | Active | ||
| 76425S03 | Active | ||
| 88986 | Active | ||
| 90787 | Active | ||
| 91141 – Central Permit | Active | ||
| 90788 | Active | ||
| Humbolt County Board of Commissioners | County Conditional Use Permit | UH-15-07 | Active |
| 17-3 | |
| SSR Mining Inc. | Marigold Complex | October 9, 2026 |
| S-K 1300 Technical Report Summary | SLR Project No.: 138.020810.00001 |
| 17.2.3 | Environmental Impacts |
MMC is currently in compliance with all permits presented in Table 17-2. At present, there are no known environmental issues that impact the ability to extract Mineral Resources at the Property. Specifically, no threatened or endangered species are known to exist at the site; there are no year-round watercourses on the Property; groundwater impacts due to mining have are being managed and all environmental regulations and permit conditions are continuously being met. Cultural resource surveys have been conducted across the Property, and an approved program of avoidance, distance buffer and mitigation measures are in place as part of the existing PoO.
Overburden is managed in several designated surface storage areas within the Property boundary, which are concurrently reclaimed to 3:1 slopes, when the sequence of mining operations allows, and then covered with growth medium and re-vegetated with native seed mixes. When possible, pits are backfilled with overburden. The majority of overburden encountered at the Marigold Mine is oxide in nature and exhibits sufficient net neutralizing capacity to be classified as non-acid generating, as confirmed through ongoing quarterly geochemical characterization and monitoring. There are no overburden areas with observed erosional or stability concerns.
The Marigold Tailings Storage Facility operated from 1989 to 1999 and has since been fully reclaimed and revegetated. The facility is no longer regulated as a dam by the Nevada State Engineer, and reclamation bonding has been substantially released following successful closure activities. A final vegetation bond release request has been submitted (MMC, 2025), with full bond release anticipated upon regulatory approval. In 2026, Marigold was awarded the Nevada Division of Minerals’ Excellence in Mine Reclamation Award for the successful reclamation of the Tailings Storage Facility.
| 17.2.4 | Environmental Monitoring and Reporting |
Environmental monitoring and reporting programs are conducted in accordance with applicable permits and regulatory requirements, as summarized in Table 17-5. These programs include monitoring of groundwater quantity and quality, surface water, stormwater quality, air quality, including fugitive dust, geochemistry, vegetation, and wildlife. Monitoring results are reported to state and federal regulatory agencies, as required, to document compliance with applicable permit conditions and regulatory obligations. Regulatory compliance inspections are conducted periodically by agencies such as BLM and the Nevada Division of Environmental Protection (NDEP). The Nevada Department of Wildlife (NDOW) may also conduct inspections or site visits, as needed, related to wildlife and habitat management matters.
| 17-4 | |
| SSR Mining Inc. | Marigold Complex | October 9, 2026 |
| S-K 1300 Technical Report Summary | SLR Project No.: 138.020810.00001 |
| 17.2.4.1 | Cyanide Management |
Sodium Cyanide is an essential reagent in the MMC gold recovery process and is managed in accordance with applicable regulatory requirements and industry best practices. The operation is certified under the International Cyanide Management Code (ICMC), which establishes standards for the safe manufacture, transport, storage, handling, use, and disposal of cyanide. Cyanide management is supported through specialized management systems, employee and contractor training, routine inspections and monitoring, and periodic independent audits to verify compliance and continuous improvement.
| 17.2.5 | Community Relations and Social Responsibilities |
There are currently no outstanding negotiations or social requirements regarding operations at Marigold Mine. Federal and state permitting processes, including those conducted under NEPA, provide opportunities for public participation through comment periods and public meetings. Recent permitting activities have generated limited community concern, and local government agencies have generally been supportive of continued mining operations at MMC.
MMC maintains ongoing engagement with local communities and stakeholders, including the communities of Battle Mountain, Winnemucca and Elko, local government representatives, land users, and other interested parties. Permitting processes also provide opportunities for participation by Tribal Nations and other interested stakeholders where applicable. Mine management routinely engages with stakeholders to provide operational updates and discuss community interests, including requests for donations, sponsorships, educational initiatives, and other forms of community support.
Community engagement and outreach programs are well established and include educational activities, community investment initiatives, and regular communication regarding mine operations and future development plans. Based on information available at the Effective Date, there are no stakeholder issues, tribal concerns, negotiations, or social commitments that are expected to materially affect current operations, Mineral Resources, Mineral Reserves, or future development of the Project.
| 17.2.6 | Mine Closure Requirements |
All activities associated with Marigold Mine require an approved reclamation plan that includes an RCE for all permitted facilities and activities. MMC engages in concurrent reclamation practices during operations in an effort to reduce disturbance footprints and reclamation bonding liability. Closure planning is integrated into the life-of-mine planning process and is periodically reviewed and updated to reflect operational changes, regulatory requirements, and closure objectives.
State regulatory requirements mandate a formal closure plan be filed two years before the facility initiates closure. Both BLM and the State require a closure plan and tentative plan for permanent closure as part of normal NEPA and operating permit requirements respectively. MMC has filed and maintained these closure plans, which, in conjunction with standard reclamation and re-vegetation of all disturbed areas, include discussions on removal of most infrastructure, monitoring, and notably long-term heap leach drain down solution management. The currently approved closure plan describes a series of evaporation cells to manage long-term solution drain down following an approximate two-year period of active solution volume reduction through evaporation for the MMC.
| 17-5 | |
| SSR Mining Inc. | Marigold Complex | October 9, 2026 |
| S-K 1300 Technical Report Summary | SLR Project No.: 138.020810.00001 |
The RCE for Marigold Mine was updated in 2026, and reclamation bonding estimates/liabilities are based on published third-party cost estimates to reclaim all permitted features at the Property. BLM, NDEP, and BMRR review and approve the bond estimate, and BLM holds the financial instruments providing the bond backing. The reclamation bond was updated in 2026 and approved by all parties, resulting in a total bond amount of US$102,236,696. Current bonds are presented in Table 17-3.
| Table 17-3: | Marigold Mine Reclamation Cost Estimate/Bond |
| Agency | Bond Reference | Financial Assurance Mechanism | Amount (US$) |
| BLM | NVB106296569001804 | Surety Bond | $61,800,000 |
| BLM | NVB106296570 | Surety Bond | $21,700,000 |
| BLM | NVB106726444 | Surety Bond | $20,000,000 |
| Total | $103,500,000 | ||
| 17.2.7 | QP Opinion |
The SLR QP’s opinion is that it is reasonable to rely on the information provided by SSR as outlined above for use in the TRS because significant environmental and social analyses have been conducted for the Property over an extended period, the Property has been in operation for a number of years, and SSR employs professionals and other personnel with responsibility in these areas that have a good understanding of the permitting, regulatory, and environmental requirements for the Property.
| 17.3 | Buffalo Valley |
| 17.3.1 | Environmental Studies |
Buffalo Valley exists on public lands administered by the BLM and private land controlled by MMC. As a result, the majority of environmental studies related to mining activities were and are conducted under the BLM authority as part of NEPA regulations, which require various degrees of environmental impact analyses dictated by the scope of the proposed action.
The environmental baseline studies to support the Environmental Impact Statement (EIS) process for the PoO and the State permitting process were initiated in 2024. These baseline studies included, but were not limited to, socioeconomics, air quality, cultural and archaeological resources, hydrogeology, hydrology, geochemistry, wildlife, and vegetation. A list of the baseline studies and reports is shown in Table 17-4.
| 17-6 | |
| SSR Mining Inc. | Marigold Complex | October 9, 2026 |
| S-K 1300 Technical Report Summary | SLR Project No.: 138.020810.00001 |
| Table 17-4: | Baseline Studies Supporting the EIS |
| Study Media | Documents/Reports Included Baseline Studies and Data Compiled for Buffalo Balley EIS |
| Geology/Geochemistry | |
| Hydrology | Buffalo Valley Baseline Hydrologic Characterization Report, Seep and Spring Survey |
| Jurisdictional Delineation | Aquatic Resources Delineation Report (No jurisdictional waters delineated) |
| Hydrogeology | Buffalo Valley Baseline Hydrogeologic Characterization Report |
| Vegetation | 2024 Biological Baseline Survey Report |
| Wildlife | 2024 Biological Baseline Survey Report, 2025 Supplemental Biological Baseline Survey Report |
| Air Quality | Buffalo Valley Mine Project NEPA Air Quality Impact Analysis Report |
| Cultural Resources | Class III Cultural Survey |
| Paleontology | Paleontological Resources Evaluation of the Proposed Buffalo Valley Mine Project |
| Socioeconomics | 2025 Social and Economic Value Assessment, Buffalo Valley Project |
| Visual Resources | Visual Resources Baseline Report |
| Land Use | Visual Resources Baseline Report |
| Grazing and Hunting | 2025 Social and Economic Value Assessment, Buffalo Valley Project |
| 17.3.1.1 | Geology/Geochemistry |
Buffalo Valley is bound by the Havallah Hills to the north, the Buffalo Mountains to the northwest, the Tobin Range to the west, and the Battle Mountain Range to the east. Surface geology in the vicinity of the Project includes quaternary alluvial materials in the valley to the west and exposures of a Paleozoic bedrock assemblage consisting primarily of the Permian Havallah Formation on the foothills of the Battle Mountain Range to the east.
The mineral deposit is localized within the upper portion of the Havallah sequence, which has been intruded by granodiorite dikes associated with skarn alteration processes. Mineralization is characterized by both skarn-type and distal-disseminated gold, consistent with regional metallogenic models observed throughout north-central Nevada. The deposit occurs within a fault-bounded structural block that is separated from the main Battle Mountain block to the east by a prominent west-dipping, north–south-trending normal range-front fault. A subsidiary range-front fault bounds the block on the west side, further defining the structural setting of the deposit (Buffalo Valley Mine Plan of Operations and Nevada Reclamation Permit Application, SSR, 2026).
| 17.3.1.2 | Hydrology |
Buffalo Valley is considered a closed drainage. Surface water runoff ultimately flows toward a dry playa lake, south of the Buffalo Valley project area. The valley is dominated by ephemeral streams. A jurisdictional determination was prepared for the Buffalo Valley project area. An Aquatic Resources Delineation Report was prepared on June 26, 2024, in which approximately 1,980 m2 (1,638 linear meters) of intermittent stream were identified to be present within the Buffalo Valley project area. The United States Army Corps of Engineers, Sacramento District (USACE) concurred with the delineation report identifying the intermitted steam as not being a Water of the United States (WOTUS) regulated under Section 404 of the Clean Water Act or under Section 10 of the Rivers and Harbors Act. No WOTUS are present within the Buffalo Valley project area.
| 17-7 | |
| SSR Mining Inc. | Marigold Complex | October 9, 2026 |
| S-K 1300 Technical Report Summary | SLR Project No.: 138.020810.00001 |
Seep and Spring surveys were conducted within a 6.4 km radius of the Buffalo Valley project area in July 2024 and within an 8.0 km radius of the Buffalo Valley project area in May and October 2025. A total of 54 sites were surveyed in the fall of 2025.
| 17.3.1.3 | Hydrogeology |
Precipitation, in the form of rainfall and snowmelt, is the primary source of aquifer recharge to the groundwater system at the Buffalo Valley project area. Recharge of groundwater-bearing units is understood to take place in mountain block bedrock and eventually into the Buffalo Valley alluvium via vertical infiltration in permeable soils and fractures. Groundwater elevations in the area range from approximately 1402 to 1630 MASL6.4 km buffer around a collective boundary consisting of the Buffalo Valley project area, the Marigold Mine project area, and the Trenton Canyon Exploration Area. Ten known leks were surveyed and in total, the amount of observed male GRSG in the Buffalo Valley project area between 2024 and 2025 increased by 15, from 52 males in 2024 to 67 males in 2025. Female counts in the same period decreased, with six found in 2024 and two in 2025 (Greater Sage Grouse Lek Monitoring Report, ERM, 2025). MMC will work with the State of Nevada Sagebrush Ecosystem Program administered by NDOW to develop the necessary mitigation measures and obtain the necessary credits for work within this habitat type.
The Pinyon Jay is a BLM special status species. Surveys were conducted in 2024 resulting in three flocks being observed in the survey area. Pinyon Jay surveys were conducted in 2025 resulting in no pinyon jays being observed visually or aurally during these surveys (2025 Supplemental Biological Baseline Survey Report, Nexus, 2025). An additional round of surveys was conducted in 2025. During the surveys, approximately four to five pinyon jays were observed. No breeding behavior was exhibited by the observed pinyon jays during all studies.
Aquatic Species
Fisheries and benthic macroinvertebrate surveys were conducted in 2024 at five sites: Willow Creek, Trenton Creek, Trout Creek, North Fork of Trout Creek, and Cottonwood Creek. No fish or suitable habitat was identified within the Buffalo Valley project area (2024 Biological Baseline Survey Report, Nexus, 2025).
Springsnail are BLM special status species. Surveys were conducted within four miles of the Buffalo Valley project area in 2024. Of the 44 surface water features located within the project area, 34 were surveyed for springsnails (10 of the sites were dry or had an insufficient amount of water). None of the sites where springsnails were documented are within the Buffalo Valley project area (2024 Biological Baseline Survey Report, Nexus, 2025).
Mammals
Four bat surveys were conducted throughout 2024. The presence of 13 bat species was observed (2024 Biological Baseline Survey Report, Nexus, 2025), all of which are special status species.
Pygmy rabbit is a BLM special status species. Surveys were conducted within the Buffalo Valley project area in 2024 and 2025. No pygmy rabbits or their tracks, burrows, or pellets were observed during the 2024 or 2025 surveys (2024 Biological Baseline Survey Report, Nexus, 2025 and 2025 Supplemental Biological Baseline Survey Report, Nexus, 2025).
Reptiles
Special status reptile surveys were completed in 2024. A total of four different species were incidentally observed, including desert horned lizard, Great Basin gopher snake, sagebrush lizard, and western fence lizard. Sagebrush lizard and western fence lizard within the Buffalo Valley project area. No special status reptiles were observed within the Buffalo Valley project area (2024 Biological Baseline Survey Report, Nexus, 2025).)
| 17-8 | |
| SSR Mining Inc. | Marigold Complex | October 9, 2026 |
| S-K 1300 Technical Report Summary | SLR Project No.: 138.020810.00001 |
| 17.3.1.4 | Air Quality |
The facility-wide potential process source emissions are less than the 226.8 tonne (250 ton) per year threshold (40 CFR § 52.21). Therefore, the Project is considered a minor source for New Source Review. In addition, the facility-wide potential process source emissions are also below the 90.7 tonne (100 ton) per year threshold for the Title V program. The Project will be considered a minor source, which is not subject to Title V permitting. The predicted maximum total ambient concentrations resulting from Project emissions (including background concentration) for all the pollutants and averaging periods are below the applicable National Ambient Air Quality Standards (Buffalo Valley Mine Project NEPA Air Quality Impact Analysis Report, Air Sciences, 2026).
| 17.3.1.5 | Cultural Resources |
A Class III cultural survey has been completed for the Project, and a Historic Properties Treatment Plan has been submitted to BLM and the State Historic Preservation Office (SHPO) for their review and approval. Mitigation of cultural sites will be completed, as necessary, and in coordination with BLM and SHPO.
| 17.3.1.6 | Paleontology |
A paleontological resources assessment to determine the Project’s potential adverse effects on paleontological resources either at the surface or in the subsurface was completed in 2024. This paleontological resource investigation consisted of a desktop review of the most recent geologic mapping, relevant scientific literature, BLM Potential Fossil Yield Classification mapping, museum records of the Nevada State Museum, and online collections data from the University of California Museum of Paleontology. Based on the results of the study, geology in the Buffalo Valley project area is not likely to preserve paleontological resources. Therefore, no negative impact is anticipated on significant fossil-bearing areas.
| 17.3.1.7 | Socioeconomics |
A social and economic assessment was conducted in 2025. Development of Buffalo Valley is anticipated to sustain current socioeconomic conditions and the construction phase is anticipated to have a primarily positive impact as presented in (2025 Social and Economic Value Assessment ERM, 2025).
| 17.3.1.8 | Visual Resources |
Visual resources survey and analysis were conducted in 2024 to be utilized throughout the NEPA process.
| 17.3.2 | Project Permitting |
Specific federal, state, and local (Humboldt & Lander County, Nevada) regulatory and permitting requirements apply to Buffalo Valley. Buffalo Valley currently has an exploration permit issued by BLM and has begun the federal and State permitting processes. The primary permits for Buffalo Valley operations will include the PoO permitted by BLM via a Record of Decision (ROD); WPCPs issued by NDEP-BMRR; and the reclamation permit issued by NDEP-BMRR. The federal and State permitting process were initiated with the submittal of the PoO in May 2026. The anticipated permits and authorizations required for Buffalo Valley operations are listed in Table 17-5.
| 17-9 | |
| SSR Mining Inc. | Marigold Complex | October 9, 2026 |
| S-K 1300 Technical Report Summary | SLR Project No.: 138.020810.00001 |
| Table 17-5: | Buffalo Valley Environmental Permits for Operation |
| Agency | Permit Name | Permit Number | Status |
| BLM | Exploration Permit | NVNV106035326 | Active |
| BLM | Plan of Operations | NVNV106161773 (legacy serial number NVN-067047) | Required |
| NDEP-BMRR | Water Pollution Control Permit (including Petroleum Contaminated Soils Permit) | Required | |
| NDEP-BMRR | Water Pollution Control Permit Dewatering Rapid Infiltration Basin | Required | |
| NDEP-BMRR | Reclamation Permit | Required | |
| NDEP-BWPC | Stormwater General Discharge Permit | Required | |
| NDEP-BAPC | Minor Source Class II Air Quality Operating Permit | Required | |
| NDOW | Industrial Artificial Pond Permit | Required | |
| United States Bureau of Alcohol, Tobacco and Firearms | Explosives Permit | Required | |
| United States Army Corps of Engineers | Not Required | No jurisdictional waters delineated (June 2025) | NA |
| USFWS | Incidental Take Permit | Required | |
| NDEP-BWPC | Septic Permit | Required | |
| Federal Communications Commission Permit | Radio Communications Equipment Authorization | ||
| NDEP-BSDW | Potable Water Permit | Required | |
| NDEP-BSMM | Class III Landfill Waiver | Required | |
| Nevada State Fire Marshal | Hazardous Materials Permit (State of Nevada) | Required | |
| NDWR | Water Rights | 93717 | Active |
| Lander County Board of Commissioners | County Conditional Use Permit | Required | |
| Building Permits | Required | ||
| County Road Use and Maintenance Permit/Agreement | Required | ||
| Humbolt County Board of Commissioners | Special Use Permit (for specific facilities) | Required |
| 17-10 | |
| SSR Mining Inc. | Marigold Complex | October 9, 2026 |
| S-K 1300 Technical Report Summary | SLR Project No.: 138.020810.00001 |
| 17.3.3 | Environmental Impacts |
MMC is currently in compliance with the exploration permit at Buffalo Valley. At present, there are no known environmental issues that impact the ability to extract Mineral Resources at the Property.
| 17.3.4 | Environmental Monitoring and Reporting |
Environmental monitoring and reporting at Buffalo Valley supporting the permitting process have been completed and submitted with the PoO. MMC conducts environmental monitoring and reporting in accordance with its approved operating, reclamation & closure, and environmental permits, including monitoring required under the exploration PoO, and reclamation permit. Baseline environmental studies supporting the mine operations permitting effort are completed. However, monitoring of groundwater, surface water, and some biological studies are voluntarily ongoing to support baseline data collection for future permitting actions or project modifications. MMC also maintains community and environmental stewardship programs as part of its ongoing environmental management system; these programs are separate from regulatory baseline study requirements and do not represent outstanding commitments that are expected to materially affect the operation.
| 17.3.5 | Community Relations and Social Responsibilities |
There are currently no outstanding negotiations or social requirements regarding operations at MMC. Federal and state permitting processes, including those conducted under NEPA, provide opportunities for public participation through comment periods and public meetings. Recent permitting activities have generated limited community concern, and local government agencies have generally been supportive of MMC’s planned operations at Buffalo Valley.
There are four federally recognized tribes in Humboldt and Lander Counties: The Battle Mountain Band Colony, part of the Te-Moak Tribe of Western Shoshone, the Winnemucca Indian Colony, the Summit Lake Paiute Tribe, and the Fort McDermitt Paiute Shoshone Tribe. Invitations for formal consultation will be conducted as a government-to-government (tribes to BLM) basis during the NEPA process.
| 17.3.6 | Mine Closure Requirements |
All activities associated with Buffalo Valley require an approved reclamation plan that includes an RCE for all permitted facilities and activities. The reclamation plan is presented in the PoO and was developed to meet federal and State standards. Where possible, reclamation will occur concurrently with operations. The post-closure land use proposed aligns with current land uses including mineral exploration and development, other natural resource development, livestock grazing, wildlife habitat, hunting, and dispersed recreation.
| 17-11 | |
| SSR Mining Inc. | Marigold Complex | October 9, 2026 |
| S-K 1300 Technical Report Summary | SLR Project No.: 138.020810.00001 |
Open Pit
The pit slopes prohibit the reclamation practice of growth media placement and revegetation due to access logistics and safety concerns. As such, there are no plans to attempt soil placement or revegetation within the open pit. MMC is requesting a reclamation exemption under NAC 519A.250 for the open pit. Access to the open pit will be precluded by the construction of post-mining safety barriers. These barriers will be located at access points and on ramps present at the time of closure to prevent entrance. Pit berms will be constructed along the perimeter of the pit, where necessary, to limit public access and deter livestock and signage will be placed at intervals along the berms. Pit benches will erode and fail over time which should effectively break up linear features and create naturally appearing scree and talus slopes.
Upon cessation of mining and dewatering activities, and precluding the placement of pit backfill, a lake will form in the Buffalo Valley Pit. MMC’s water rights are of sufficient quantity to cover the post-closure consumptive use associated with evaporation from the pit lake in the case that the pit is not backfilled.
Heap Leach Facility
The Heap Leach Facility will be constructed in 7.62 m nominal lifts to a maximum permitted height of 152.5 m. The lifts will be dumped at angle of repose and later re-sloped to meet the final closure design slope angle of 1 m horizontal to 0.3 m vertical (1H:0.3V) configuration resulting in minimal recontouring requirements to final stable landform. Following operation, the facility will be capped with a store and release cover and revegetated. The process solution management pond will be converted to an evaporation cell once the appropriate draindown flow rate has been achieved. Prior to that, loaded carbon will be removed from Buffalo Valley and transferred to the Marigold Mine for processing.
Overburden Storage Areas
At closure, the Overburden and Storage Areas will be regraded to a 3H:1V slope or flatter and capped with six inches of growth media and revegetated. If a petroleum contaminated storage pad is developed in the Overburden Storage Area, the area will be capped with a two foot cover and six inches of growth media and revegetated.
Roads, Yards and Infill Areas
All haul and operational roads, yards, and infill areas including the Buffalo Valley to Marigold Connector Road, will be reclaimed after operations, and when no longer needed for monitoring and maintenance. Roads, culverts, and road crossings areas will be ripped to reduce compaction and regraded to prevent collection of stormwater and promote runoff and generally re-establish pre-mine flow paths. Soil materials will be removed from the berms and redistributed on the deep ripped and regraded roads prior to revegetation.
Rapid Infiltration Basins
Prior to reclamation, any dewatering water present in the Rapid Infiltration Basins (RIBs) will be allowed to infiltrate and backfilled with material previously excavated and stockpiled in nearby berms. The surface will be regraded to blend in with the surrounding topography. Six inches of growth media will be placed over the backfilled area and revegetated.
Buildings and Structures
Buildings and support facilities will be reclaimed during the closure period. Buildings and support structures necessary for the reclamation will remain until these facilities are closed and reclaimed. The main procedures for facility and buildings consist of decommissioning, site demolition, equipment salvaging and disposal off-site in an appropriate facility.
| 17-12 | |
| SSR Mining Inc. | Marigold Complex | October 9, 2026 |
| S-K 1300 Technical Report Summary | SLR Project No.: 138.020810.00001 |
Reclamation Cost Estimate
The RCE for the Buffalo Valley exploration permit, NVNV106035326, was updated in May 2025 and is $934,758, resulting in a surety bond in that amount.
The RCE for Buffalo Valley operations was developed in 2025 and reclamation bonding estimates/liabilities were developed utilizing the Standardized Reclamation Cost Estimator (SRCE) version 1.4.1 and 2025 unit rated provided by NDEP. The RCE is $46,068,611 including direct, indirect and post-closure monitoring cost estimates.
| 17.3.7 | QP Opinion |
The SLR QP’s opinion is that it is reasonable to rely on the information provided by SSR as outlined above for use in the TRS because significant environmental and social analyses have been conducted for the Property over an extended period, the Property has been in operation for a number of years, and SSR employs professionals and other personnel with responsibility in these areas that have a good understanding of the permitting, regulatory, and environmental requirements for the Property.
| 17-13 | |
| SSR Mining Inc. | Marigold Complex | October 9, 2026 |
| S-K 1300 Technical Report Summary | SLR Project No.: 138.020810.00001 |
| 18.0 | Capital and Operating Costs |
SSR’s forecasted capital and operating costs estimates related to the development of Mineral Reserves are derived from annual budgets and historical actuals over the long life of the current operation. According to the American Association of Cost Engineers (AACE) classifications, these estimates would be Class 1 with an accuracy range of -3% to -10% to +3% to +15%.
| 18.1 | Capital Costs |
Growth, sustaining, and reclamation capital costs are summarized in Table 18-1. Growth CAPEX includes capital associated with growth-related activities, including the development of Buffalo Valley and other growth initiatives. Sustaining CAPEX includes capital expenditures associated with activities from mining through ore placement on the heap leach pad, based on an average LOM total material movement rate of approximately 380,000 tpd over the 15-year mining phase, as well as final reclamation costs.
All capital costs incurred prior to May 1, 2026, are considered sunk costs.
Table 18-1: Capital Costs Summary
| Capital Costs | Total ($ million) |
| Growth CAPEX | 542.2 |
| Subtotal Growth CAPEX | 542.2 |
| Mining Equipment Replacement | 98.1 |
| Equipment/Building Maintenance | 436.4 |
| Administration | 2.8 |
| Processing/Lab | 40.1 |
| Permitting/Geotech | 34.1 |
| Exploration | 57.2 |
| Subtotal Sustaining Capital | 668.6 |
| Reclamation | 174.6 |
| Total Capital Costs | 1,385.4 |
| 18.1.1 | Growth Capital |
Under the World Gold Council (WGC) guidance on non-GAAP metrics, capital expenditures associated with a major project at an existing operation can be classified as growth capital where the project is expected to provide a material benefit to the operation. The WGC defines a material benefit as an expected increase of at least 10% in one or more of the following measures:
| · | Annual or LOM production relative to current levels; |
| · | Net present value (NPV) relative to the remaining LOM NPV prior to inclusion of the project; or |
| · | Mineral reserves relative to the reported reserves prior to inclusion of the project. |
| 18-1 | |
| SSR Mining Inc. | Marigold Complex | October 9, 2026 |
| S-K 1300 Technical Report Summary | SLR Project No.: 138.020810.00001 |
The LOM growth capital of $542.2 million includes capital expenditures associated with the major leach pad expansion and related infrastructure at Marigold, development of Buffalo Valley, and the major expansion of the Marigold mining fleet. In total, about $35 million in contingency is included in the growth capital. These investments support the development and mining of Buffalo Valley and enable execution of the larger Marigold pit shell associated with the $2,200 per ounce gold reserve price.
| 18.1.2 | Sustaining Capital |
Sustaining capital costs include the following:
| · | Replacement of mining equipment as it reaches its economic life during the remaining nine years of mining. The majority of the mining equipment replacement costs relates to replacing haul trucks and excavators, but it also covers drills and mine support equipment. |
| · | Major equipment rebuilds and component replacement. In order to maintain equipment availability for the extended equipment lives, major equipment is programmed for rebuilds at set points during its economic life. |
| · | Administration costs such as light vehicle purchases and various site infrastructure improvements. |
| · | Ongoing cost associated with process infrastructure. |
| · | Permitting costs mainly associated with dewatering infrastructure (wells, pipelines, rapid infiltration basins) that are required to lower the water table in advance of planned mine development. |
| · | Exploration/Mine Development costs are mainly capitalized drilling to better refine the grade estimates in the orebody that will be mined during the LOM. |
| 18.1.3 | Reclamation and Closure |
The costs associated with reclamation and closure activities at Marigold were estimated to be $174.6 million (real May 1, 2026 dollars), with the majority of the costs incurred from 2038 to 2050.
| 18.2 | Operating Costs |
As the Property has been in operation for a number of years, the level of project definition for the operating cost estimates is very high. Given the available project performance data and the high project definition, no contingency was included in the cost estimate. The QP considers the operating cost estimate to be in the accuracy range of +/-15%.
The LOM operating costs estimate, inclusive of Buffalo Valley and Marigold, is $16.78/t of stacked ore, as shown in Table 18-2.
| Table 18-2: | Operating Costs Summary |
| Description | Total LOM ($ million)* | $/t stacked* |
| Mining and Maintenance | 3,741 | 12.57 (1.99/t moved) |
| Processing | 804 | 2.70 |
| Site Support | 451 | 1.51 |
| Total | 4,996 | 16.78 |
| *From May 1, 2026 | ||
| 18-2 | |
| SSR Mining Inc. | Marigold Complex | October 9, 2026 |
| S-K 1300 Technical Report Summary | SLR Project No.: 138.020810.00001 |
| 18.2.1 | Mining & Maintenance |
The LOM mine operating cost estimate is shown in Table 18-3 and covers activities from mining to placing ore on the heap pad at an average LOM mining rate of approximately 380,000 tpd moved over the 15-year mining phase.
| Table 18-3: | Mine Operating Cost Summary |
| Description | $/t moved |
| Labor | 0.68 |
| Fuel | 0.44 |
| GET(1) | 0.06 |
| Tires | 0.14 |
| Explosives | 0.13 |
| All Others | 0.55 |
| Total | 1.99 |
| Notes: 1Ground engaging tools | |
Diesel is the largest non-labor input for operating costs at Marigold. Diesel prices for the economic analysis were based on the latest available consensus forward-looking price forecasts and compared to those used in other published studies. Near-term diesel prices average approximately $4.00/gallon before normalizing to $3.00/gallon over the long-term.
| 18.2.2 | Processing |
Processing costs over the LOM include all costs required to recover the gold from the rock after it is mined and placed on the leach pad. This includes the cost of chemicals to process the ore, pumping costs to get the barren solution to the leach pad, pumping costs to get the pregnant solution to the carbon columns for gold recovery after it returns from the leach pad, and the costs associated with the extraction of the gold from the carbon to produce the final doré product shipped from Marigold. The processing cost estimate is shown in Table 18-4 for an average stacking rate of approximately 58 ktpd and includes costs for the LOM, including the 15-year mine life and the final 5-year rinsing phase of the heap leach pad, which starts in 2041 after mining operations has ceased.
| Table 18-4: | Process Operating Cost Summary |
| Description | $/t ore stacked |
| Labor | 0.70 |
| Operating Supplies & Maintenance | 1.67 |
| Total Services & Misc. | 0.34 |
| Total | 2.70 |
| 18.2.3 | G&A |
G&A costs for the LOM include accounting and site administration, warehousing, safety, human resources, and environmental. These costs, presented in Table 18-5, are related to supporting the operations groups in the mine, maintenance, and processing departments.
| 18-3 | |
| SSR Mining Inc. | Marigold Complex | October 9, 2026 |
| S-K 1300 Technical Report Summary | SLR Project No.: 138.020810.00001 |
| Table 18-5: | G&A Operating Cost Summary |
| Description | $/t stacked |
| Labor | 0.54 |
| Supplies/Services | 0.97 |
| Total | 1.51 |
| 18.2.4 | Workforce Summary |
The current Marigold workforce totals 540 persons, consisting of 100 salaried and 440 hourly employees (who are not unionized) as of the effective date of this TRS. The breakdown by department is shown in Table 18-6.
| Table 18-6: | Current Workforce |
| Hourly FTE | Salary FTE | Total | |
| Mine | 267 | 12 | 279 |
| Plant | 49 | 12 | 61 |
| Maintenance | 102 | 17 | 119 |
| G&A | 15 | 36 | 51 |
| Tech Services | 7 | 23 | 30 |
| Total | 440 | 100 | 540 |
The LOM workforce at the Marigold Complex is expected to increase in the near term as mining activities commence at Buffalo Valley (BV) in 2029 and remain elevated through the completion of BV mining in 2034.
Following the completion of mining at BV, the workforce is expected to decline and remain relatively stable throughout the remaining Marigold mining operations from 2035 through 2040. Upon completion of mining at Marigold, the workforce is expected to decrease significantly during the subsequent five-year heap leach pad drain-down period.
The Marigold full time equivalent (FTE) workforce for the years 2023 to 2026 (actuals) and the LOM plan (projected) is summarized in Table 18-7.
| Table 18-7: | LOM Workforce Levels |
| Hourly FTE | Salary FTE | Total | |
| 2023 Actual | 395 | 83 | 478 |
| 2024 Actual | 388 | 88 | 476 |
| 2025 Actual | 400 | 89 | 489 |
| 2026 Actual | 440 | 100 | 540 |
| 2027 to 2040 Projected | 578 | 109 | 686 |
| 18-4 | |
| SSR Mining Inc. | Marigold Complex | October 9, 2026 |
| S-K 1300 Technical Report Summary | SLR Project No.: 138.020810.00001 |
| 19.0 | Economic Analysis |
An after-tax Cash Flow Projection has been generated from the Life of Mine production schedule and capital and operating cost estimates and is summarized in Table 19-1. A summary of the key criteria is provided below. The complete cash flow is presented in Section 27.0 Appendix.
| 19.1 | Economic Criteria |
| 19.1.1 | Revenue |
| · | Approximately 58,000 tonnes ore per day stacked (approximately 21 Mt per year) at an average stacked grade of 0.44 g/t Au, for 4.26 Moz contained stacked. |
| · | LOM stacked ore recovery averages 72.0%, resulting in 3.06 Moz recoverable stacked during mining (May 1, 2026 through 2040) |
| · | LOM total of 3.34 Moz Au produced at an average of 196 koz per year during stacking. A total of 392 koz Au are produced during the final five-year rinsing period after mining ceases. Approximately 272 koz Au are recovered from work-in-progress inventory over the LOM. |
| · | Metal price: US$3,948 per ounce gold (LOM realized), US$3,710 per ounce gold long term price (2031+). |
| · | Gold at refinery 99.97% payable. |
| · | Net Smelter Return includes doré refining, transport, and insurance costs. |
| · | Revenue is recognized at the time of gold production. |
| 19.1.2 | Costs |
| · | Mine life: 20 years, including 2026 (fifteen years of mining and five years of heap leach pad rinsing). |
| · | Life of Mine production plan is summarized in Table 13-6. |
| · | LOM growth capital totals $542.2 million |
| · | LOM sustaining capital totals $668.6 million |
| · | Final reclamation costs total $174.6 million. |
| · | Average operating cost, including royalties and offsite costs, over the mine life is $20.27 per tonne stacked. |
| 19.1.3 | Taxation and Royalties |
Marigold is subject to Nevada Net Proceeds of Minerals Tax, Nevada property and sales taxes, and U.S. federal income tax. The economic analysis calculates these taxes in accordance with legislation enacted as of January 1, 2022. Property and sales taxes are accounted for in the operating costs of the mine.
| 19.1.3.1 | Nevada Gross Proceeds Tax |
In 2021, the State of Nevada enacted Assembly Bill 495, effective July 1, 2021, which is an annual excise tax on gold and silver revenue. Under the bill, the tax rates vary based on the taxpayer’s Nevada gross revenue. A 0.75% rate is imposed on Nevada gross revenue of more than $20 million but not more than $150 million in a taxable year (defined as the calendar year). A rate of 1.10% applies to Nevada gross revenue exceeding $150 million in any tax year. The LOM average rate for Marigold during stacking is approximately 1.0% and averages $7.9 million per year over the fifteen years of mine operation.
| 19-1 | |
| SSR Mining Inc. | Marigold Complex | October 9, 2026 |
| S-K 1300 Technical Report Summary | SLR Project No.: 138.020810.00001 |
| 19.1.3.2 | Nevada Net Proceeds Tax |
The State of Nevada imposes a 5% net proceeds tax on the value of all minerals extracted in the State. This tax is calculated and paid based on a prescribed net income formula applied only to income and expenses from mining, disallowing deductions for exploration and related-party financing costs. This tax is a deductible expense for U.S. federal income tax calculations and averages $17.8 million per year over the fifteen years of mine operation.
| 19.1.3.3 | US Federal Income Tax |
Federal income tax is determined under regulations that came into effect on January 1, 2022. Under these regulations, which removed alternative minimum tax, the mine is subject to a federal income tax rate of 21%. SLR utilized Unit of Production depreciation, depletion allowances, and Net Operating Losses (NOL) as deductions. Total U.S. federal tax payable averages $23.1 million per year over the fifteen years of mine operation.
| 19.1.3.4 | Royalties |
Marigold is subject to a variety of NSR royalty payments, payable to various parties under the terms of the leases, as described in Section 3. The annual average NSR royalty payments is about 6.9% of gross revenue and averages $52.3 million per year over the fifteen years of mine operation. Net Smelter Return (NSR) royalty payments for the Buffalo Valley deposit are fixed at 3.5% of the value of production net of off-site refining costs.
| 19.2 | Cash Flow Analysis |
Considering the Complex on a stand-alone basis, the undiscounted pre-tax cash flow totals $5,747 million over the mine life. The after-tax Net Present Value (NPV) at a 5% discount rate (midpoint with May 1, 2026, as time zero) is $3,334 million, as shown in Table 19-1.
| 19-2 | |
| SSR Mining Inc. | Marigold Complex | October 9, 2026 |
| S-K 1300 Technical Report Summary | SLR Project No.: 138.020810.00001 |
| Table 19-1: | After-Tax Cash Flow Summary |
| Description | LOM |
| Realized Market Prices | |
| Au ($/oz) – Average | $3,948 |
| Payable Metal | |
| Au (koz) | 3,335 |
| Cash Flow Summary | US$ million |
| Total Gross Revenue | 13,166 |
| Mining and Maintenance Cost | (3,741) |
| Process Cost | (804) |
| G & A Cost | (451) |
| Refining/Freight | (5) |
| Mining Royalties | (903) |
| NGPT1 | (131) |
| Total Operating Costs | (6,034) |
| Operating Margin (EBITDA) | 7,132 |
| Cash Taxes Payable | (834) |
| Working Capital2 | 0 |
| Operating Cash Flow | 6,298 |
| Development (Growth) Capital | (542) |
| Sustaining Capital | (669) |
| Total Closure/Reclamation Capital | (175) |
| Pre-tax Free Cash Flow | 5,747 |
| Pre-tax NPV @ 5% | 3,878 |
| After-tax Free Cash Flow | 4,913 |
| After-tax NPV @ 5% | 3,334 |
Notes: 1. Nevada Gross Proceeds Tax 2. All working capital adjustments net to zero at end of mine life.
| |
| 19-3 | |
| SSR Mining Inc. | Marigold Complex | October 9, 2026 |
| S-K 1300 Technical Report Summary | SLR Project No.: 138.020810.00001 |
The World Gold Council Adjusted Operating Cost (AOC) is $1,809/oz Au. The mine life capital unit cost, including sustaining and closure/reclamation, is $253/oz, for an All in Sustaining Cost (AISC) of $2,062/oz Au. The average annual gold production during operation, excluding rinsing phase, is 196 koz per year over the fifteen year mine life and 78 koz per year during the five year rinsing phase.
| 19.3 | Sensitivity Analysis |
Project risks can be identified in both economic and non-economic terms. Key economic risks were examined by running cash flow sensitivities:
| · | Head grade |
| · | Metallurgical recovery |
| · | Gold price |
| · | Operating costs |
| · | Capital costs |
After-tax IRR sensitivity over the base case has been calculated for -20% to +20% variations for head grade, recovery, and gold price and operating and capital costs. The sensitivities are shown in Figure 19-1 and Table 19-2. The Project is most sensitive to changes in head grade, metallurgical recovery, and metal price (usually with same magnitude of impact) followed by operating cost and finally capital costs.
Economics for the operating Marigold gold mine complex are robust with respect to price, head grade, recovery, capital, and operating costs. The operations benefit from a long history of experience with mining heap leach gold recovery operations, and higher gold prices than originally planned.
| Figure 19-1: | After-Tax Sensitivity Analysis |
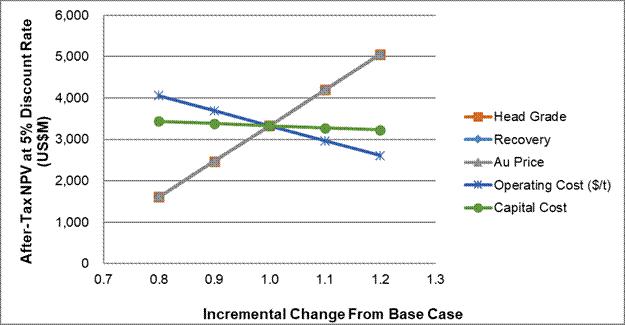
| 19-4 | |
| SSR Mining Inc. | Marigold Complex | October 9, 2026 |
| S-K 1300 Technical Report Summary | SLR Project No.: 138.020810.00001 |
| Table 19-2: | After-Tax Sensitivity Analyses |
| Variance | Head
Grade (g/t Au) |
NPV
at 5% ($ millions) |
| -20% | 0.36 | 1,609 |
| -10% | 0.40 | 2,471 |
| 0% | 0.44 | 3,334 |
| +10% | 0.49 | 4,196 |
| +20% | 0.53 | 5,058 |
| Variance | Gold
Recovery (%) |
NPV
at 5% ($ millions) |
| -20% | 57.6 | 1,609 |
| -10% | 64.8 | 2,471 |
| 0% | 72.0 | 3,334 |
| +10% | 79.2 | 4,196 |
| +20% | 86.4 | 5,058 |
| Variance | LOM
Avg. Metal Prices ($/oz Au) |
NPV
at 5% ($ millions) |
| -20% | 3,158 | 1,609 |
| -10% | 3,553 | 2,471 |
| 0% | 3,948 | 3,334 |
| +10% | 4,342 | 4,196 |
| +20% | 4,737 | 5,058 |
| Variance | Operating
Costs ($/t) |
NPV
at 5% ($ millions) |
| -20% | 13.42 | 4,060 |
| -10% | 15.10 | 3,697 |
| 0% | 16.78 | 3,334 |
| +10% | 18.46 | 2,970 |
| +20% | 20.13 | 2,607 |
| Variance | Capital
Costs ($ millions) |
NPV
at 5% ($ millions) |
| -20% | 1,252 | 3,440 |
| -10% | 1,319 | 3,387 |
| 0% | 1,385 | 3,334 |
| +10% | 1,452 | 3,280 |
| +20% | 1,519 | 3,227 |
| 19-5 | |
| SSR Mining Inc. | Marigold Complex | October 9, 2026 |
| S-K 1300 Technical Report Summary | SLR Project No.: 138.020810.00001 |
| 20.0 | Adjacent Properties |
The SLR QP has not independently verified this information and this information is not necessarily indicative of the mineralization at the Marigold Complex.
Marigold is located near the northern limits of a regional belt of ore deposits commonly referred to as the Battle Mountain-Eureka trend. This north–northwest striking alignment of mines and prospects. It is the second most prolific gold belt in Nevada after the Carlin trend, and it includes variants of Carlin-Type Gold Deposits (CTGD), distal type sediment hosted deposits as well as skarn and copper–gold porphyry systems.
Three major gold deposits lie adjacent to the SSR property. Nevada Gold Mines’ Phoenix mine is approximately 22 km south of the Buffalo Valley deposit, i-80 Gold Corp’s Lone Tree mine is approximately 7 km northwest of Marigold, and Roxmore Resources Inc.’s Converse project is approximately 6 km west of Marigold. There are also several inactive mines and exploration and/or development projects that can be found within a 19 km radius of the property.
Reported production and Mineral Resources for these adjacent properties are presented in Table 20-1.
| Table 20-1: | Past Production and Mineral Resources for Adjacent Properties |
| Property | Owner | Years
of Production |
Gold Produced (Moz) |
Stated Mineral Resources and Mineral Reserves | ||
| Mineral
Reserves |
Measured
and Indicated Mineral Resources |
Inferred
Mineral Resources | ||||
| Phoenix1 | Nevada Gold Mines | 2006–Present | unknown | 3.25
Moz gold
0.37 Mt copper (0.18%)
|
7.15 Moz gold | 0.37 Moz gold |
| Lone Tree Complex2 | i-80 Gold Corp. | 1991–2012 | unknown | n/a | 428 koz at 1.73g/t | 2.77 Moz at 1.64 g/t |
| Converse3 | Roxmore Resources Inc. | – | – | n/a | 2.162 Moz | 3.035 Moz |
Notes:
1. Barrick Gold Corporation. 2026.
2. i-80 Gold Corp. 2024.
3. SLR. 2026.
| ||||||
Phoenix mine is currently operated by Nevada Gold Mines and is a polymetallic Au-Cu-Ag porphyry system that has been in production since 2006. The mine includes various deposit types, all structurally controlled by northwest trending faults.
Lone Tree is considered a distal-disseminated deposit that may be genetically related to a porphyry-type system; mineralization was structurally controlled by north–northwest trending faults.
At Converse, gold mineralization is hosted within a skarn that developed within the Havallah Formation. No production has occurred at Converse to date.
A plan map of mine properties adjacent to Marigold is presented in Figure 20-1.
| 20-1 | |
| SSR Mining Inc. | Marigold Complex | October 9, 2026 |
| S-K 1300 Technical Report Summary | SLR Project No.: 138.020810.00001 |
| Figure 20-1: | Adjacent Properties |
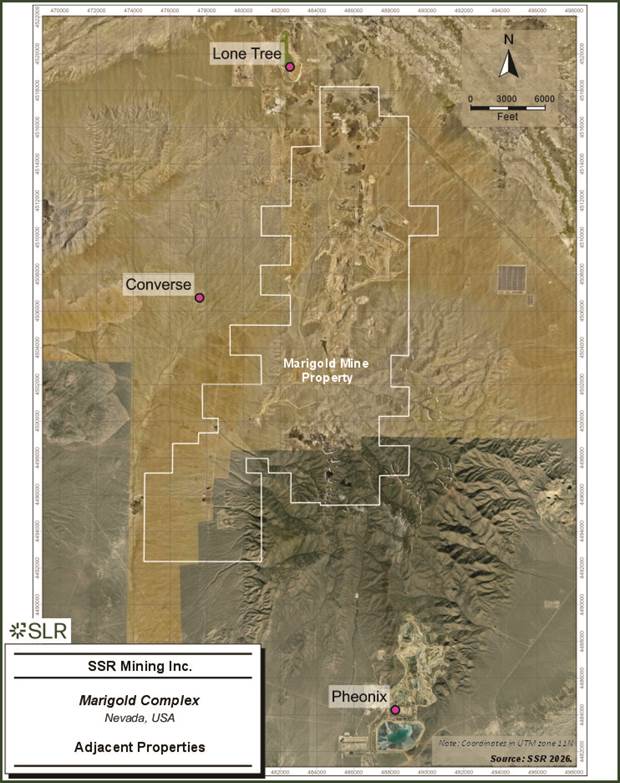
| 20-2 | |
| SSR Mining Inc. | Marigold Complex | October 9, 2026 |
| S-K 1300 Technical Report Summary | SLR Project No.: 138.020810.00001 |
| 21.0 | Other Relevant Data and Information |
No additional information or explanation is necessary to make this TRS understandable and not misleading.
| 21-1 | |
| SSR Mining Inc. | Marigold Complex | October 9, 2026 |
| S-K 1300 Technical Report Summary | SLR Project No.: 138.020810.00001 |
| 22.0 | Interpretation and Conclusions |
SLR offers the following conclusions by area.
| 22.1 | Geology and Mineral Resources |
| · | The Mineral Resource estimates for Marigold and Buffalo Valley have been prepared using accepted industry practices and conform to the requirements of SEC Regulation S-K 1300. |
| · | The estimates are supported by extensive drilling, validated geological and assay databases, appropriate metallurgical assumptions, robust estimation methodologies, and reasonable economic parameters. |
| · | The assigned Mineral Resource classifications appropriately reflect the level of geological confidence and estimation uncertainty inherent in each deposit. |
| · | Additional drilling and ongoing geological studies have the potential to expand the known mineralized footprint, improve classification confidence, and support future conversion of Mineral Resources to Mineral Reserves. |
| · | The Marigold Complex contains two distinct mineral deposit styles. Marigold and Trenton Canyon are classified as Carlin-type gold deposits, while Buffalo Valley is classified as a distal disseminated silver-gold deposit associated with felsic porphyry dikes, structural corridors, and favorable host rocks. |
| · | Geological understanding of the Marigold Complex is supported by more than three decades of mining operations, extensive exploration programs, geologic mapping, geophysical surveys, metallurgical testing, production history, and ongoing resource definition drilling. |
| · | The current geological interpretations adequately define lithologic, structural, oxidation, alteration, and mineralization controls and provide a suitable basis for Mineral Resource estimation and classification. |
| · | Exploration, delineation, and resource development programs completed by SSR and predecessor operators have resulted in more than 13,000 drill holes and over 2.6 million meters of drilling across Marigold, Buffalo Valley, and Trenton Canyon. Recent drilling programs continue to support resource growth, conversion, and refinement of geological models. |
| · | The drilling density and spatial distribution of drill holes are sufficient to support the current geological interpretations and Mineral Resource classifications at both Marigold and Buffalo Valley. |
| · | The SLR Qualified Person considers the drilling methods, sampling practices, sample preparation procedures, analytical methods, quality assurance and quality control programs, and database management systems to be consistent with accepted industry standards and suitable for Mineral Resource estimation. |
| · | Independent verification procedures completed by SLR indicate that the geological, assay, density, and survey databases are sufficiently accurate, complete, and reliable for use in Mineral Resource estimation. |
| · | There are no Measured Resources at the Property. |
| 22-1 | |
| SSR Mining Inc. | Marigold Complex | October 9, 2026 |
| S-K 1300 Technical Report Summary | SLR Project No.: 138.020810.00001 |
| · | The level of uncertainty has been adequately reflected in the classification of Mineral Resources for the Property. The MRE presented may be materially impacted by any future changes in the break-even cut-off grade, which may result from changes in mining method selection, mining costs, processing recoveries and costs, metal price fluctuations, or significant changes in geological knowledge. |
| · | The SLR QP is of the opinion that, with consideration of the recommendations summarized in Sections 1 and 23 of this TRS, any issues relating to all relevant technical and economic factors likely to influence the prospect of economic extraction can be resolved with further work. |
| 22.1.1 | Marigold |
| · | Mineral Resources were constrained within an optimized open pit shell that reflects reasonable prospects for eventual economic extraction using a gold price assumption of US$2,500/oz and a reporting cut-off grade of 0.069 g/t Au. |
| · | Effective May 1, 2026, the Marigold Mineral Resource estimate exclusive of Mineral Reserves comprises approximately 125.0 Mt of Indicated Mineral Resources at an average grade of 0.39 g/t Au and 18.1 Mt of Inferred Mineral Resources at an average grade of 0.30 g/t Au. No Measured Mineral Resources are reported. |
| · | Validation and reconciliation reviews demonstrate that the Marigold resource model provides reasonable predictions of grade and tonnage and is appropriate for mine planning and Mineral Reserve conversion activities. |
| · | The SLR QP considers the geological interpretation, estimation methodology, classification criteria, and validation results to appropriately support the reported Marigold Mineral Resources. |
| 22.1.2 | Buffalo Valley |
| · | Mineral Resources were constrained within optimized pit shells using lithology-specific cut-off grades ranging from 0.10 g/t Au to 0.32 g/t Au and a gold price assumption of US$2,500/oz. |
| · | Effective May 1, 2026, the Buffalo Valley Mineral Resource estimate exclusive of Mineral Reserves comprises approximately 5.6 Mt of Indicated Mineral Resources grading 0.53 g/t Au and 11.2 Mt of Inferred Mineral Resources grading 0.31 g/t Au. No Measured Mineral Resources are reported. |
| · | Metallurgical testing confirms that gold recoveries vary by lithology and particle size and supports the recovery assumptions used in the Mineral Resource estimate. |
| · | The SLR QP considers the Buffalo Valley geological model, estimation methodology, resource classification criteria, and metallurgical assumptions to be appropriate for the style of mineralization and sufficient to support the reported Mineral Resources. |
| 22.2 | Mining and Mineral Reserves |
| 22.2.1 | Marigold |
| · | Marigold anchors the Complex with 240.44 Mt of Probable Reserves grading 0.46 g/t Au, containing 3.52 Moz. Including stockpiles and leach pad inventory, the total Mineral Reserve estimate is 3.96 Moz. The updated $2,200/oz gold price assumption triggered a 73% increase in contained gold compared to previous estimates. |
| 22-2 | |
| SSR Mining Inc. | Marigold Complex | October 9, 2026 |
| S-K 1300 Technical Report Summary | SLR Project No.: 138.020810.00001 |
| · | Mining at Marigold is executed across 15.2 m benches (or 7.6 m for smaller shovels to control dilution) using automated blasthole sampling, rigorous fire assay-to-cyanide-soluble regression, and continuous radar slope monitoring. Individual pit stripping varies, averaging 7.4:1 in North Mackay and 6.2:1 in New Millenium, supported by established geotechnical design criteria and active dewatering in deeper cutbacks like Mackay and Red Dot Phase 3. |
| 22.2.2 | Buffalo Valley |
| · | Buffalo Valley contributes 45.33 Mt of Probable Reserves grading 0.46 g/t Au, containing 0.67 Moz of gold. Its lower strip ratio of 3.9:1 helps temper the broader Complex's overall stripping requirements. |
| · | Located approximately 15 miles from the main Marigold operation, Buffalo Valley operates as a standalone satellite facility complete with its own dedicated heap leach facility and separate Overburden Storage Area (OBSA). |
| · | Mining at Buffalo Valley is planned using the same bench heights as at the Marigold Mine (15.2 m) to maintain operational consistency and equipment synergies, enabling the planned transfer of hydraulic shovels and haul trucks between the two operations. |
| · | Mining operations at Buffalo Valley are currently unpermitted, with the schedule assuming permitting activities will be successfully completed to support active production which begins in 2029 for a 5.3-year operational window that slots directly into the middle years of the active mining timeline. |
| · | Structured across three distinct geotechnical domains with inter-ramp angles ranging from 32° to 48° governed by structural bedding orientations, Buffalo Valley's operational success is tightly bound to securing environmental permits ahead of 2029 and adapting proven grade control and blasting methodologies to its unique sedimentary and dike-controlled lithology. |
| 22.2.3 | Integrated Operations |
| · | Backed by SSR’s extensive operational experience at the site, the Complex benefits from well-established geotechnical parameters, active site-wide dewatering programs, and sufficient storage capacity within the expanded OBSA to accommodate the higher LOM waste volumes. |
| · | The LOM plan targets an expanded average mining rate of 380,000 tpd (peaking at 505,000 tpd), supporting 15 years of active mining followed by 5 years of processing the heap leach pad inventory for a total 20-year LOM. During full production years, annual mine production averages 138.3 Mtpa (reaching 165.0 Mtpa over the first seven years), yielding a complex-wide LOM strip ratio of 5.3:1 (waste-to-ore) over the 15-year active schedule (which includes the partial start in 2026 and final wind-down in 2040). |
| · | Sustaining higher material movement and increased stripping requires a major capital fleet expansion, including a LeTourneau L-1850 loader in 2026 as replacement, a Liebherr 9600-class shovel in 2027, a second P&H 4100-sized shovel in Q1 2028, and scaling the 300 st haul truck fleet with 19 additional units to reach a peak of 45 trucks. Rather than requiring an isolated capital fleet, Buffalo Valley shares equipment synergy with Marigold, allowing two Komatsu PC7000 hydraulic shovels and 8 to 10 haul trucks to transfer to Buffalo Valley in 2029 for its duration before returning to Marigold. |
| 22-3 | |
| SSR Mining Inc. | Marigold Complex | October 9, 2026 |
| S-K 1300 Technical Report Summary | SLR Project No.: 138.020810.00001 |
| · | The Complex operates with a total established workforce of 540 personnel, distributed across Mine Operations (279), Mine Maintenance (119), Process & Laboratory (61), General & Administration (51), and Technical Services (30). Success over the 20-year LOM relies on maintaining disciplined short-term sequencing, executing the 2027–2028 equipment ramp-up smoothly, successfully securing the Buffalo Valley permit ahead of 2029, and managing workforce retention and skills training to support elevated material movement without compromising mechanical availability or slope stability. |
| · | The LOM production schedule is reasonable and will be supported by robust short-term planning, sequencing, and operational discipline to be successful. |
| · | An appropriate mining equipment fleet, maintenance facilities, and workforce are in place, with various options for additions and replacements estimated to meet the LOM production schedule requirements. |
| · | The SLR QP reviewed the assumptions, parameters, and methods used to prepare the Mineral Reserves Statement and is of the opinion that the Mineral Reserves are estimated and prepared in accordance with S-K 1300 standards. |
| 22.3 | Mineral Processing |
| 22.3.1 | Marigold |
| · | The Marigold processing facilities comprise conventional run-of-mine (ROM) cyanide heap leaching, CIC adsorption, electrowinning, and refining circuits (ADR) to produce a final precious metal product. The heap leach pad was originally constructed in 1990 and with ongoing expansions has operated very consistently throughout the years providing an excellent library of operating data. |
| · | The mineralogy of the ore and deportment of the gold along fracture surfaces of the rock rather than in the rock matrix, provides rapid access of leach solutions to the gold particles and relatively fast gold extraction independent of rock size. The SLR QP agrees that the ore is uniquely favorable to ROM heap leaching, which has been employed for the life of the mine. |
| · | Gold recovery is determined from both historical operating performance and from laboratory column and bottle roll leach testing. Gold recovery is consistent and is predicted using a relationship between fire assay and cyanide soluble gold analyses. It is the SLR QP’s opinion that the Marigold operating practices are consistent with industry standards, and the ROM method of operation and the methods of determining gold recovery and reagent consumptions are appropriate for this deposit. |
| · | Average LOM Au recovery at Marigold is 74% based on production records. The ratio of cyanide soluble gold to total gold (AuCN/AuFA) using the 2017 database of assay pairs (i.e., samples that have been assayed using both fire assay and cyanide-soluble gold assay methods) was approximately 0.8 (80%). Using the ratio to determine the actual LOM recovery of 74% results in a factor of 0.92. |
| · | The current model to predict Marigold heap leach recovery is Heap Leach Recovery = (AuCN/AuFA) x 0.92. |
| 22-4 | |
| SSR Mining Inc. | Marigold Complex | October 9, 2026 |
| S-K 1300 Technical Report Summary | SLR Project No.: 138.020810.00001 |
| · | Cumulative gold production from the Marigold leach pad (through April 2026) is equivalent to 72.7% recovery. |
| · | Gold recovery from future ore from Marigold, including stockpile and leach pad inventory, is estimated to be 72.4%, based on a review of historical assay and recovery data, as well as metallurgical test work on future ore. |
| · | Test work has been conducted on a variety of Marigold ore samples, including representative pit samples taken by ore-control geologists, leach pad grab samples from mine production, and various pit blasthole drill cuttings. Bottle roll test work has also been conducted on exploration reverse circulation (RC) drill samples to determine expected gold recovery from deposits that will be mined in the future. |
| · | A large number of column leach tests and bottle roll tests have been performed on the same samples to determine the relationship between their results. Column leach test work continues; however, bottle roll tests can be performed to generate metallurgical data in days rather than the months that are required for column leach tests. |
| · | Permeability testing has been performed on ore samples with varying fines content. The testing simulated compaction under multiple lifts of ore stacked up to 200 m; the current maximum height of the heap leach pads above the liner elevation is 122 m. Overall, the tested blends demonstrated relatively consistent permeability on increasing loads over 50 m and acceptable permeabilities with material blended to a 40% fines to 60% durable ratio. Flow rates for the blends ranged from 178 L/h/m2 to 284 L/h/m2 under no load. Under 122 m effective height loading, flow rates ranged from 34 L/h/m2 up to 188 L/h/m2. All tests resulted in low, but acceptable permeabilities. |
| 22.3.2 | Buffalo Valley |
| · | SSR designed Buffalo Valley metallurgical testing programs in 2023, 2024, and 2025 to build on historical information, including new test areas and testing specific lithologies without blending. The 2024 and 2025 programs also targeted lower-grade composites. Finally, the 2025 program expanded lithologic targets to previously untested units at depth, including base limestone and a new sulfidic lithology, VDFX. |
| · | Buffalo Valley mineralization shows a strong crush-size dependence. This dependence is likely due to gold particles being encapsulated by skarns and other silicate minerals, which can only be liberated by grinding. A portion of the gold deportment is also refractory to cyanide. Scanning electron microscope (SEM) analysis shows that arsenopyrite can be a significant host of submicron gold, even in samples with well-oxidized pyrite. In 200-mesh bottle roll tests, almost all tests show more than 80% recovery of the contained gold, with only a few sulfidic-refractory samples. |
| · | The laboratory test recoveries are scaled to the anticipated production size, either 38 mm crushed or 304 mm ROM. Individual test recoveries are plotted to generate crush size versus recovery curves for each lithology. The recoveries are then discounted by 4% to account for heap leach inefficiency and other scale-up effects. The results are used to determine the gold recovery for each material type for resource calculations. |
| 22-5 | |
| SSR Mining Inc. | Marigold Complex | October 9, 2026 |
| S-K 1300 Technical Report Summary | SLR Project No.: 138.020810.00001 |
| 22.4 | Infrastructure |
| 22.4.1 | Marigold |
| · | Marigold is readily accessible via Interstate Highway 80 in northern Nevada and is approximately 5 km south–south-west of Valmy in Humboldt County. The site access road supports two lanes of traffic and consists of hard packed clay and gravel. |
| · | The infrastructure facilities at Marigold include ancillary buildings, offices and support buildings, access roads into the plant site, power distribution, source of fresh water and water distribution, fuel supply, storage and distribution, waste management and communications. The infrastructure facilities are sufficient for supporting the current Marigold operations. |
| · | The power supply for Marigold is provided by NV Energy Inc. via a 120 kV transmission line to site. Site power draw is 5 MW. After exiting the main substation, power is distributed through a 25 kV distribution grid. Power supply is consistent and dependable and is not a limiting factor for current operations. |
| · | Marigold has sufficient groundwater rights and water well capacity to support the ongoing process operations. The water is primarily consumed by retention in the heap leach pad, evaporation, processing operations and dust suppression. |
| · | Marigold has sufficient disposal capacity and non-consumptive water rights to manage dewatering flows that are not consumed for operational needs. The water that is not consumed is returned to the groundwater system through the rapid infiltration basins (RIBs) and considered non-consumptive use. |
| · | It is the SLR QP’s opinion that it is reasonable to rely on the information provided by SSR as outlined above for use in the TRS because the Property has been in operation for a number of years, and SSR employs professionals and other personnel with responsibility in these areas that have a good understanding of the operating requirements for the Property. |
| 22.4.2 | Buffalo Valley |
| · | The initial site layout for Buffalo Valley was developed from the Newmont Plan of Operations acquired as part of the purchase of the property. |
| · | The need for a connector road from Marigold to Buffalo Valley was confirmed and fully engineered by WSP during the feasibility study completed by SSR Mining in 2026 (SSR 2026b, the Feasibility Study). |
| · | Given the short initial mine life of Buffalo Valley, SSR decided to use the Marigold truck shop rather than build a new truck shop at Buffalo Valley. No other maintenance facilities are planned at Buffalo Valley. |
| · | Currently, the North Peak substation is fed from the existing Marigold Mine substation, which is supplied by NV Energy. Buffalo Valley will need to construct approximately 14.5 km (9 mi) of 24.9 kV power line from the existing North Peak power line to service the Project site. Line power will be stepped down to 4,160 V, 480 V, and 110 V as required with power primarily distributed at 4,160 V or 480 V to motor control centers serving the respective process areas. |
| 22-6 | |
| SSR Mining Inc. | Marigold Complex | October 9, 2026 |
| S-K 1300 Technical Report Summary | SLR Project No.: 138.020810.00001 |
| · | Three site-area transformers will be required at different locations throughout Buffalo Valley. The anticipated transformer-connected loads are 6.53 MW, and the calculated demand loads are 4.61 MW (including the crushing circuit and pit dewatering pumps). |
| · | The new overhead power line from North Peak to Buffalo Valley will be routed along the new Marigold/Buffalo Valley connector road. |
| 22.5 | Environment |
| 22.5.1 | Marigold |
| · | Specific federal, state, and local (Humboldt County, Nevada) regulatory and permitting requirements apply to Marigold, including the following: |
| o | The Plan of Operations (PoO) permitted via the United States (U.S.) Bureau of Land Management (BLM) |
| o | The Water Pollution Control Permit (WPCP) issued by the Nevada Department of Environmental Protection (NDEP) |
| o | The temporary discharge permit allowing for the discharge of dewatering water to rapid infiltration basins (RIBs) issued by NDEP |
| o | The reclamation permit issued by the Nevada Bureau of Mining Regulation and Reclamation (BMRR) |
| · | MMC currently holds and is in compliance with active, valid permits for all current facets of the Marigold mining operation. |
| · | At present, there are no known environmental issues that impact the ability to extract Mineral Resources at the Property. |
| · | All activities associated with Marigold require an approved reclamation plan that includes a Reclamation Cost Estimate (RCE) for all permitted facilities and activities. This was updated and approved by federal and state agencies in 2026. |
| · | MMC is actively engaged with the local communities and stakeholders and there are no outstanding negotiations or social commitments for the operation of the Marigold mine. |
| · | The SLR QP’s opinion is that it is reasonable to rely on the information provided by SSR as outlined above for use in the TRS because significant environmental and social analyses have been conducted for the Property over an extended period, the Property has been in operation for a number of years, and SSR employs professionals and other personnel with responsibility in these areas that have a good understanding of the permitting, regulatory, and environmental requirements for the Property. |
| 22.5.2 | Buffalo Valley |
| · | Specific federal, state, and local (Humboldt County and Lander County, Nevada) regulatory and permitting requirements apply to Buffalo Valley, including the following: |
| o | The exploration PoO permitted via the U.S. BLM (active) |
| o | PoO for the Buffalo Valley mining operation permitted via the BLM (required) |
| o | The WPCP issued by the NDEP (required) |
| 22-7 | |
| SSR Mining Inc. | Marigold Complex | October 9, 2026 |
| S-K 1300 Technical Report Summary | SLR Project No.: 138.020810.00001 |
| o | The temporary discharge permit allowing for the discharge of dewatering water to RIBs issued by NDEP (required) |
| o | The reclamation permit issued by the BMRR (required) |
| · | MMC currently holds and is in compliance with active, valid permits for all current facets of the exploration operation. |
| · | At present, there are no known environmental issues that impact the ability to extract Mineral Resources at the Property. |
| · | Exploration activities associated with Buffalo Valley require an approved reclamation plan, including a Reclamation Cost Estimate (RCE) for all permitted facilities and activities. This was updated and approved by federal and state agencies in 2026. |
| · | The Buffalo Valley mining operation will require an RCE prior to commencing mining. |
| · | MMC is actively engaged with the local communities and stakeholders and there are no outstanding negotiations or social commitments for the operation of the mine. |
| · | The SLR QP’s opinion is that it is reasonable to rely on the information provided by SSR as outlined above for use in the TRS because significant environmental and social analyses have been conducted for the Property over an extended period, the Property has been in operation for a number of years, and SSR employs professionals and other personnel with responsibility in these areas that have a good understanding of the permitting, regulatory, and environmental requirements for the Property. |
| 22.6 | Capital and Operating Costs |
| · | SSR’s forecasted capital and operating costs estimates related to the development of Mineral Reserves are derived from annual budgets and historical actuals over the long life of the current operation. These estimates were classified by SSR according to the American Association of Cost Engineers (AACE) classifications as Class 1 with an accuracy range of -3% to -10% to +3% to +15%. |
| · | Future growth capital costs are forecast to be $542 million, sustaining capital is forecast to be $669 million, and reclamation costs are forecast to be $175 million for the life of mine, for a total life of mine capital costs of $1,385 million. |
| · | Construction is ongoing for the growth capital projects, including the expansion of the mine fleet and leach pads, and the development of Buffalo Valley. Costs prior to May 1, 2026, are considered sunk. |
| 22-8 | |
| SSR Mining Inc. | Marigold Complex | October 9, 2026 |
| S-K 1300 Technical Report Summary | SLR Project No.: 138.020810.00001 |
| 23.0 | Recommendations |
SLR offers the following recommendations by area.
| 23.1 | Geology and Mineral Resources |
The SLR QP offers the following recommendations regarding advancement of the Property and improvement of the Resource model.
| 1 | SSR has proposed a two-year exploration drilling (2027 and 2028) program with a total budget of US$10,000,000 to advance development of exploration target areas in Marigold Mine and Buffalo Valley. The objective of the exploration program will be to target potential gold-bearing structures to expand the mineralization footprint and convert the current Resource to Reserve. The SLR QP agrees with the objectives and overall scope of this exploration program. |
| 2 | Conduct an additional infill drilling of 10,000 m drilling at MMC every year, where there are opportunities to increase orebody knowledge and confidence of Mineral Resource estimates. |
| 3 | Continue pit mapping and use the data to refine structural and redox models. |
| 4 | Continue to carry out preg-rob/LECO assays along the oxide-sulfide boundaries. |
| 23.2 | Mining and Mineral Reserves |
| 1 | Continuously optimize haulage profiles and pit sequencing across the Complex, prioritizing lower-strip-ratio phases and targeted interior pit options, to smooth annual ore production profiles, reduce operational volatility, and mitigate reliance on excessive fleet expansion while providing an operational buffer against potential permitting delays at Buffalo Valley. |
| 2 | Advance dewatering, depressurization programs, and pore pressure monitoring ahead of active mining fronts in deeper Marigold pits like Mackay and Red Dot Phase 3 to maintain required slope stability factors of safety. |
| 3 | Advance geotechnical studies, ongoing groundwater monitoring, and structural modeling at Buffalo Valley, specifically addressing pitward-dipping bedding in domains 1 through 3 and high-plasticity clay horizons in the overburden, to ensure stable slope performance. |
| 4 | Maintain rigorous grade control procedures, blasthole sampling, and fire-assay-to-cyanide-soluble regressions across active Marigold areas, while establishing equivalent protocols for Buffalo Valley prior to production. |
| 5 | Execute the planned 2026–2028 fleet expansion and capital additions on schedule (including the LeTourneau L-1850 loader, Liebherr 9600 shovel, second P&H 4100 shovel, and additional 300 short ton (st) haul trucks) to support the increased LOM mining rate and inter-pit equipment transfers. |
| 6 | Prioritize equipment maintenance, asset reliability, and proactive workforce retention to manage heavy utilization rates, aging baseline assets, and the dynamic rotation of the shovel and truck fleet between Marigold and Buffalo Valley. |
| 23-1 | |
| SSR Mining Inc. | Marigold Complex | October 9, 2026 |
| S-K 1300 Technical Report Summary | SLR Project No.: 138.020810.00001 |
| 23.3 | Mineral Processing |
| 1 | Conduct regular assessments of the AuCN/AuFA ratio using updated exploration and blast hole data. |
| 2 | Continue to conduct column and bottle roll metallurgical testing on heap leach feed composites to determine maximum possible gold recovery. |
| 3 | Conduct metallurgical test work on any future ore sources to develop a geometallurgical model including material properties and metallurgical parameters. |
| 4 | Complete further studies and assessment of heap leach recoverable gold inventory. |
| 5 | Complete targeted technical and metallurgical studies on durable ore materials to better understand their physical characteristics and leach kinetics, ensuring stacking performance, solution percolation, and gold recovery reconcile closely with production forecasts. |
| 23.4 | Infrastructure |
| 1 | Continue to maintain the infrastructure facilities in good working order to ensure that critical services such as power and water management, pumping and storage facilities are fully available for potential upset conditions. |
| 2 | Ensure the storage volume available in the process ponds is regularly evaluated and increased when required to maintain regulatory compliance and manage risks associated with increasing water inventory due to growth of the heap and barren solution pumping capacity. |
| 3 | Ensure that consumptive water rights holdings are periodically re-evaluated relative to the potential growth in site water demands. |
| 4 | Confirm HLF configuration and remaining capacity, including reconciliation of the current HLF footprint, stack geometry, ore inventory, approved development limits, and remaining stacking capacity with the LOM plan, and documentation of the relationship between available HLF capacity and the Mineral Reserve production schedule. |
| 5 | Review SSR's governance policies related to the HLF, including maintaining appropriate Engineer of Record (EOR) oversight, defining site ownership and technical responsibilities, implementing management of change (MOC) procedures, conducting periodic independent reviews, and incorporating risk assessments into facility management and decision-making. |
| 6 | Expand the current Operation, Maintenance, and Surveillance (OMS) framework to include additional HLF-specific requirements, including continuous survey slope stability monitoring, record keeping, escalation procedures, and development of risk-based Trigger Action Response Plans (TARPs) for key performance indicators such as slope performance, seepage, drainage, pond freeboard, and extreme weather events. |
| 7 | Develop a Design Basis Report (DBR) document for the HLF, including consolidation of key design criteria, design assumptions, liner configurations, stack geometry limitations, pond containment requirements, and evaluation of the impacts of the current and planned HLF configuration on facility performance (e.g., stability, drainage, seepage, solution management, and water balance). |
| 8 | Perform design verification and performance confirmation, including verification that current operating conditions and ore characteristics remain consistent with the assumptions used in the original design, and evaluating the implications of any material changes on HLF performance. |
| 23-2 | |
| SSR Mining Inc. | Marigold Complex | October 9, 2026 |
| S-K 1300 Technical Report Summary | SLR Project No.: 138.020810.00001 |
| 9 | Evaluate water balance and capacity management, including maintaining a current site-wide HLF water balance model that incorporates active and planned leach areas, solution inventories, pond capacities, design storm events, evaporation, draindown, operational freeboard, and closure assumptions. The model should support operating decisions, capacity evaluations, emergency planning, and future expansion studies. |
| 23.5 | Environment |
| 1 | Progress the environmental permitting process for Buffalo Valley to ensure approvals are secured ahead of its scheduled 2029 operational entry, utilizing flexible Marigold internal sequencing as a direct operational buffer against potential permitting delays. |
| 23.6 | Capital and Operating Costs |
SLR has no recommendations related to capital and operating costs.
| 23-3 | |
| SSR Mining Inc. | Marigold Complex | October 9, 2026 |
| S-K 1300 Technical Report Summary | SLR Project No.: 138.020810.00001 |
| 24.0 | References |
AACE International. 2012. Cost Estimate Classification System – As applied in the Mining and Mineral Processing Industries, AACE International Recommended Practice No. 47R-11, 17 p.
AMEC Americas Ltd. 2014. Marigold Drill Hole Deviation Study. Memorandum, Prepared for Silver Standard Resources Inc., Dated 21 May 2014.
Barrick Gold Corporation. 2026. Annual Report 2025. February 2026.
Call & Nicholas Inc (CNI). 2019a. Slope Stability Study of the Red Dot Design, Marigold Mine, July 2019.
CNI. 2021. Analysis of Soil Slopes – H1, 5N1, and 5N2. Technical Memorandum. 04 October 2021.
CNI. 2024. Red Dot Phase 3 Pore Pressure Sensitivity Analysis. Presentation. December 16, 2024.
CNI. 2025. Marigold Preliminary M7 Analysis Results, Version 3. June 25, 2025.
Carver, J.N., Rathnam, K., Rice, T., and Yeomans, T.J. 2018. NI 43-101 Technical Report on the Marigold Mine, Humboldt County, Nevada, USA, 31 July 2018.
Cline, J.S., Hofstra, A.H., Muntean, J.L., Tosdal, R.M., and Hickey, K.A. 2005. Carlin-type gold deposits in Nevada: Critical geologic characteristics and viable models, Economic Geology 100th Anniversary Volume, p. 451–484.
CNI. 2021a. Marigold Mine Site Visit Recommendations 6–7 July 2021. August 5, 2019.
CNI. 2021b. Analysis of Soil Slopes – H1, 5N1 and 5N2, October 2021.
Cook, H. E. and Taylor, M. E. 1977. Comparison of continental slope and shelf environments in the Upper Cambrian and lowest Ordovician of Nevada, in The Society of Economic Paleontologists and Mineralogists, Special Publication No. 25 pp. 51 – 81.
Cook, H.E. and Corboy, J.J. 2004. Great Basin Paleozoic carbonate platform; facies, facies transitions, depositional models, platform architecture, sequence stratigraphy, and predictive mineral host models; field trip guidebook; metallogeny of the Great Basin Project, 17–22 August 2003, 135 p.
Cook, H.E. 2015. The Evolution and Relationship of the Western North American Paleozoic Carbonate Platform and Basin Depositional Environments to Carlin-type Gold Deposits in the Context of Carbonate Sequence Stratigraphy, in Pennel, W.M., and Garside, L.J., eds., New Concepts and Discoveries, Geological Society of Nevada Symposium Proceedings, Reno/Sparks, Nevada, May 2015, v. 1, p. 1-80.
Cox, D.P. and Singer, D.A. 1990. Descriptive and grade-tonnage models for distal-disseminated Ag-Au deposits: A supplement to U.S. Geological Survey Bulletin 1693, U.S. Geological Survey Open-File Report 90-282, 7 p.
Cox, D.P. 1992. Descriptive model of distal-disseminated Ag-Au, U.S. Geological Survey Bulletin 2004, 19 p.
Davis, B.M. 1997, Some Methods of Producing Interval Estimates for Global and Local Resources: SME Preprint 97-5, 4p.
| 24-1 | |
| SSR Mining Inc. | Marigold Complex | October 9, 2026 |
| S-K 1300 Technical Report Summary | SLR Project No.: 138.020810.00001 |
Doebrich, J.L. and Theodore, T.G. 1996. Geologic History of the Battle Mountain Mining District, Nevada, and Regional Controls on the Distribution of Mineral Systems in Coyner, A.R., and Faney, P.L., eds., Geology and Ore Deposits of the American Cordillera, Geological Society of Nevada, Symposium Proceedings, Reno/Sparks, Nevada, April 1995, pp. 453-483.
du Bray, E.A. 2007. Time, space, and composition relations among northern Nevada intrusive rocks and their metallogenic implications, Geosphere, v.3, p. 381–405.
Emsbo, P., Hofstra, A.H., Lauha, E.A., Griffin, G.L., and Hutchinson, R.W. 2003. Origin of high-grade gold ore, source of ore fluid components, and genesis of the Meikle and neighboring Carlin-type deposits, northern Carlin trend, Nevada, Economic Geology, v. 98, p. 1069– 1100.
Fithian. 2015. Geology, Geochemistry, and Geochronology of the Marigold Mine, Battle Mountain-Eureka Trend, Nevada, M.Sc. Thesis, Golden, Colorado, Colorado School of Mines, 120 p.
Fithian, M.T., Holley, E.A., and Kelly, N.M., 2018, Geology of gold deposits at the Marigold mine, Battle Mountain district, Nevada: Reviews in Economic Geology, v. 20, p. 121–155.
Glamis Gold Ltd. 2001. Glamis Marigold Mine Millenium Project Section 31 Technical Report and Reserve Summary for the Glamis Marigold Mine July 2001. (Revised).
Grauch V.J.S., Rodriguez B. D., and Wooden J.L. 2003. Geophysical and Isotopic Constraints on Crustal Structure Related to Mineral Trends in North-Central Nevada and Implications for Tectonic History Economic Geology, April 2003, v. 98, pp. 269-286.
Hamilton, W. 1987. Crustal extension in the Basin and Range Province, southwestern United States, in Coward, M.P., Dewey, J.F., and Handcock, P.L., eds., Continental Extensional Tectonics, Geological Society Special Publication No. 28, pp. 155-176.
Harrold, J. 2023, Trenton Canyon Historic Met Recovery, Memorandum, July 14, 2023.
Hofstra, A.H. and Cline, J.S., 2000. Characteristics and models for Carlin-type gold deposits, Reviews in Economic Geology, v. 13, p. 163–220.
Ilchik, R.P. and Barton, M.D. 1997. An amagmatic origin of Carlin-type gold deposits, Economic Geology, v. 92, p. 269-288.
Johnston, M.K. and Ressel, M.W. 2004. Carlin-type and distal disseminated Au-Ag deposits: Related distal expressions of Eocene intrusive centers in north-central Nevada in Controversies on the origin of World-class gold deposits, Part 1: Carlin-type gold deposits in Nevada, by J.L. Muntean, J. Cline, M.K. Johnston, M.W. Ressel, E. Seedorff, and M.D. Barton: Society of Economic Geologists Newsletter, v. 59, p. 12-14.
Kester, M. 2015. On infrared absorption band position variation as a result of gold mineralization in a distal disseminated gold deposit at the Marigold Mine, Humboldt Co., Nevada, Senior Thesis, South Dakota School of Mines and Technology, 29 p.
Ketner, K.B. 2008. The Inskip Formation, the Harmony Formation, and the Havallah Sequence of Northwestern Nevada—An Interrelated Paleozoic Assemblage in the Home of the Sonoma Orogeny. US Department of the Interior U.S. Geological Survey. Professional Paper 1757.
| 24-2 | |
| SSR Mining Inc. | Marigold Complex | October 9, 2026 |
| S-K 1300 Technical Report Summary | SLR Project No.: 138.020810.00001 |
Ketner, K.B. 2013. Stratigraphy of Lower to Middle Paleozoic Rocks of Northern Nevada and the Antler Orogeny US Department of the Interior U.S. Geological Survey. Professional Paper 1799.
Knight Piésold Ltd. (KPL). 2014. Marigold Mine – Review of Rock Mechanic Considerations, dated 24 July 2014. REF. NO. NB101-201/24. Vancouver, British Columbia, Canada.
Large, R.R., Bull, S.W., and Maslennikov, V.V. 2011. A carbonaceous sedimentary source-rock model for Carlin-type and orogenic gold deposits, Economic Geology, v. 106, p. 331–358.
Magee Geophysical Services LLC. 2014. Gravity Survey over the Marigold Mine Property, Humboldt County, Nevada. August 2014.
Magee Geophysical Services LLC. 2016. Gravity Survey over the Marigold Mine Property, Humboldt County, Nevada. September 2016.
McClelland Laboratories, Inc. 2023. Preliminary Report on Buffalo Valley Drill Core Composites – Metallurgical Testing, MLI Job No. 4906, for SSR Mining, July 19, 2023.)
McGibbon, D H. 2005. Geology of the Antler and Basalt Gold Deposits, Glamis-Marigold mine, Humboldt County, Nevada, in Rhoden, H.N., Steininger, R.C., and Vikre, P.G., eds., Geological Society of Nevada Symposium 2005: Window to the World, Reno, Nevada, May 2005, pp. 399–409.
McGibbon, D.H. 2004. Marigold Summary and Tour Guide (Internal report), pp. 1-3.
McGibbon, D.H. and Wallace, A.B. 2000. Geology of the Marigold Mine area: in Theodore, T.G., 2000, Geology of pluton-related gold mineralization at Battle Mountain, Nevada; Monographs in Mineral Resource Science No. 2: Center for Mineral Resources, Tucson, Arizona, pp. 222–240.
McKee, E.H. 2000. Potassium-argon chronology of Cretaceous and Cenozoic igneous activity, hydrothermal alteration, and mineralization, in Theodore, T.G., Geology of pluton-related gold Mineralization at Battle Mountain, Nevada, Monographs in Mineral Resource Science, no. 2, p. 121–143.
Muntean, J.L. and Cline, J.S. 2018, Diversity of Carlin-Style Gold Deposits: Reviews in Economic Geology, v. 20, p. 1-5
Muntean, J.L., Cline, J.S., Simon, A.C., and Longo, A.A. 2011. Magmatic-hydrothermal origin of Nevada’s Carlin-type gold deposits, Nature Geoscience, v. 4, p. 122–127. (
OreWin. 2022. Marigold 2021 Technical Report Summary, September 2022. Filed on EDGAR/available at https://www.sec.gov/edgar.
Pells Sullivan Meynink (PSM) 2021. Geotechnical Review: Marigold Gold Project. Internal memo by PSM Consult Pty Limited.
Piteau Associates Engineering Ltd. (Piteau). 2020a. Marigold Rapid Infiltration Basis Arsenic Attenuation Study. August 2020.
Piteau. 2020b. Marigold RIB Area Alluvial Characterization. October 2020.
Piteau. 2021. Marigold Mine Mackay Pit Dewatering System Design 4180-R03, January 2021.
Reid, R.F., Nicholes, J., Kofoed, R., McComb, J. and Sechrist, K.J., Buffalo Valley Gold Mine: Porphyry copper, gold skarn or distal disseminated precious-metal deposit, in Steininger, Roger, and Pennell, Bill, eds., Great Basin evolution and metallogeny: Geological Society of Nevada Symposium, May 14-22, 2010 [Proceedings], p. 637-656.
| 24-3 | |
| SSR Mining Inc. | Marigold Complex | October 9, 2026 |
| S-K 1300 Technical Report Summary | SLR Project No.: 138.020810.00001 |
Ressel, M.W., and Henry, C.D., 2006. Igneous Geology of the Carlin Trend, Nevada: Development of the Eocene Plutonic Complex and Significance for Carlin-Type Gold Deposits, Economic Geology, v. 101, p. 347-383.
Roberts, R.J. 2002. A Passion for Gold, an Autobiography. University of Nevada press 1st Edition. Reid, R.F.
Roberts, R.J. 1964. Stratigraphy and Structure of the Antler Peak Quadrangle, Humboldt and Lander Counties, Nevada: U.S. Geological Survey Professional Paper 459-A, 93 pp.
Saller, A. and Dickinson, W. 1982. Alluvial to marine facies transition in the Antler overlap sequence, Pennsylvanian and Permian of North-central Nevada: Journal of Sedimentary Research, v. 52, p. 925-940.
Samal, A.R., Arthur, B., Gates, P. 2025. Technical Report on the Mineral Resource Estimates for the Lone Tree Deposit, Nevada, Prepared for i-80 Gold Corp. Effective Date December 31, 2024. March 28, 2025.
Sillitoe, R.H. and Bonham, H.F. 1990. Sediment-hosted gold deposits: Distal products of magmatic-hydrothermal systems, Geology, v. 18, p. 157–161.
Silver Standard. 2014. NI 43-101 Technical Report on the Marigold Mine, Humboldt County, Nevada, Marigold Mining Company, November 19, 2014, p. 233
SLR. 2024. Technical Report Summary on the Marigold Complex, Nevada, USA, SLR Project No.: 138.21581.00002, Prepared for SSR Mining Inc., February 12, 2024, p.268
SLR. 2026. NI 43-101 Technical Report on the Preliminary Economic Assessment, Effective Date May 2, 2026. Prepared for Roxmore Resources Inc. May 29, 2026.
SSR Mining Inc. 2023. Form 10-K. Annual Report for the Fiscal Year Ended December 31, 2022. Filed on EDGAR on February 22, 2023.
SSR. 2026. Slope Stability Assessment of Waste Rock Dumps, Marigold Mine. April 3, 2026.
SSR. 2026b. Marigold Mining Company Buffalo Valley Feasibility Study Report (Draft). Revision B. August 7, 2026
Theodore, T. G. 1991a. Preliminary geologic map of the North Peak Quadrangle, Humboldt and Lander counties, Nevada. USGS Open-File Report. 91-429.
Theodore, T. G. 1991b. Preliminary geologic map of the Valmy Quadrangle, Humboldt and Lander counties, Nevada. USGS Open-File Report. 91-430.
Theodore, T.G. 2000. Geology of Pluton-related Gold Mineralization at Battle Mountain, Nevada. Tucson, Arizona: centre for Mineral Resources, the University of Arizona.
US Securities and Exchange Commission. 2018. Regulation S-K, Subpart 229.1300, Item 1300 Disclosure by Registrants Engaged in Mining Operations and Item 601 (b)(96) Technical Report Summary.
Wallace, A.R., Ludington, S., Mihalasky, M.J., Peters, S.G., Theodore, T.G., Ponce, D.A., John, D.A., and Berger, B.R. 2004. Assessment of metallic mineral resources in the Humboldt River Basin, northern Nevada, U.S. Geological Survey Bulletin 2218, 309 p. (Wallace, 2004)
Waterton Global Resource Management website. 2018. www.watertonglobal.com
| 24-4 | |
| SSR Mining Inc. | Marigold Complex | October 9, 2026 |
| S-K 1300 Technical Report Summary | SLR Project No.: 138.020810.00001 |
Wright, James L. 2016. Marigold Property Gravity Survey.
Wright, James L. 2020. Marigold Property Gravity Survey – 2020 GIS Database, prepared for Silver Standard, April 18, 2020, p. 18
WSP. 2026a. Preliminary Pit Slope Design Recommendations for the New Millenium Expansion, Marigold Mine, Nevada. Technical Memorandum. March 16, 2026.
WSP. 2026b. Preliminary Dewatering Plan Technical Memorandum. Prepared for SSR. March 20, 2026.
Wyld, S.J., Rogers, J.W., and Copeland, P. 2003. Metamorphic Evolution of the Luning-Fencemaker Fold-Thrust Belt, Nevada: Illite Crystallinity, Metamorphic Petrology, and 40Ar/39Ar Geochronology, The Journal of Geology, v. 111, p. 17-38.
Zoback, M.L., McKee, E.H., Blakely, R.J., and Thompson, G.A. 1994. The Northern Nevada rift: Regional tectonomagmatic relations and middle Miocene stress direction, Geological Society of America Bulletin, v. 106, p. 371-38.
| 24-5 | |
| SSR Mining Inc. | Marigold Complex | October 9, 2026 |
| S-K 1300 Technical Report Summary | SLR Project No.: 138.020810.00001 |
| 25.0 | Reliance on Information Provided by the Registrant |
This TRS has been prepared by SLR for SSR. The information, conclusions, opinions, and estimates contained herein are based on:
| · | Information available to SLR at the time of preparation of this TRS. |
| · | Assumptions, conditions, and qualifications as set forth in this TRS. |
| · | Data, reports, and other information supplied by SSR and other third party sources. |
For the purpose of this TRS, SLR has relied on ownership information provided by SSR Mining, Inc.'s Land Manager and Permit Compliance Advisor, as reflected in various land tenure and mining claim title reports, in the Executive Summary and Section 3. SLR has not researched property title or mineral rights for the Property as we consider it reasonable to rely on SSR’s legal counsel, who is responsible for maintaining this information.
SLR has relied on SSR for guidance on applicable taxes, royalties, and other government levies or interests, applicable to revenue or income from the Property in the Executive Summary and Section 19. As the Property has been in operation for over ten years, SSR has considerable experience in this area.
The Qualified Persons have taken all appropriate steps, in their professional opinion, to ensure that the above information from SSR is sound.
Except as provided by applicable laws, any use of this TRS by any third party is at that party’s sole risk.
| 25-1 | |
| SSR Mining Inc. | Marigold Complex | October 9, 2026 |
| S-K 1300 Technical Report Summary | SLR Project No.: 138.020810.00001 |
| 26.0 | Date and Signature Page |
This report titled “S-K 1300 Technical Report Summary” with an effective date of May 1, 2026 was prepared and signed by:
| (Signed) SLR International Corporation | |
| Dated at Lakewood, CO | |
| October 9, 2026 | |
| SLR International Corporation |
| 26-1 | |
| SSR Mining Inc. | Marigold Complex | October 9, 2026 |
| S-K 1300 Technical Report Summary | SLR Project No.: 138.020810.00001 |
| 27.0 | Appendix 1 |
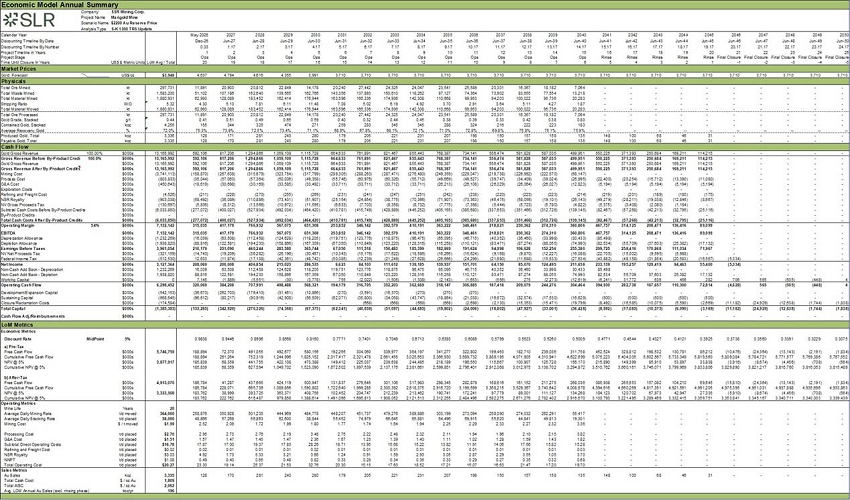
| 27-1 | |