Pay Versus Performance
In accordance with the rules of the Securities and Exchange Commission, the following tables describe how the compensation of our named executive officers aligns with our performance.
| Year | Summary Compensation Table Total for PEO ($) (1)(2) | Compensation Actually Paid to PEO ($)(3) | Average Summary Compensation Table Total for non-PEO Named Executive Officers ($)(2)(4) | Average Compensation Actually Paid to non-PEO Named Executive Officers ($)(2)(5) | Value of Initial Fixed $100 Investment Based on Total Shareholder Return ($)(6) | Net Income ($) (in thousands)(7) | ||||||||||||||||||
| 2026 | $ | 193,766 | $ | 193,776 | $ | 173,559 | $ | 173,559 | $ | 88.16 | $ | 1,909 | ||||||||||||
| 2025 | $ | 201,032 | $ | 201,032 | $ | 126,023 | $ | 126,032 | $ | 46.34 | $ | 181 | ||||||||||||
| 2024 | $ | 200,717 | $ | 200,717 | $ | 114,729 | $ | 114,729 | $ | 50.19 | $ | (1,721 | ) | |||||||||||
| (1) | As reported in the Summary Compensation Table on page 18 of this proxy statement |
| (2) | During fiscal year 2026, our principal executive officer (“PEO” was R. Clay Hulette. During fiscal years 2025 and 2024 our PEO was Don D. Jennings. During fiscal years 2026, our non-PEO Named Executive Officers were Teresa Hulette and Don D. Jennings. During fiscal years 2025 and 2024, our non-PEO Named Executive Officers (“non-PEO NEOs”) were Teresa Hulette and Jaime Coffey. |
| (3) | We had no outstanding equity awards for fiscal years 2026, 2025 and 2024. Accordingly, no equity award adjustments are applicable to the compensation paid to the PEO in 2026, 2025 and 2024. |
| (4) | Average summary compensation total for non-PEO NEOs represents the average of the SCT total compensation paid to the non-PEO NEOs during each of the years in the SCT. |
| (5) | We had no outstanding equity awards for fiscal years 2026, 2025 and 2024. Accordingly, no equity award adjustments are applicable to the compensation paid to the non-PEO named executive officers in 2026, 2025 and 2024. |
| (6) | Cumulative total shareholder return (“TSR”) assumes an initial investment of $100 investment as of market close on June 30, 2023 |
| (7) | Net Income as reported on page 27 of the Company’s Annual Report on Form 10-K for the fiscal year ended June 30, 2026. |
Analysis of the Information Presented in the Pay Versus Performance Table
We generally seek to incentivize long-term performance, and therefore do not specifically align our performance measures with “compensation actually paid” (as computed in accordance with Item 402(v) of Regulation S-K) for a particular year. In accordance with Item 402(v) of Regulation S-K we are providing the following descriptions of the relationships between information presented in the Pay Versus Performance Table.
Compensation Actually Paid (“CAP”) and Company TSR
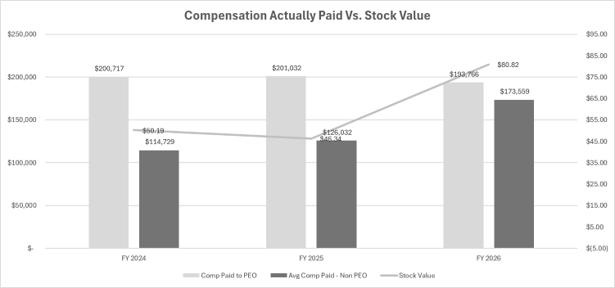
TSR amounts reported in the graph assume an initial fixed investment of $100. CAP to PEO #1, R. Clay Hulette, was $193,766 in 2026, and Don Jennings, was $201,032 in 2025 and $200,717 in 2024. CAP to the non-PEO NEOs averaged $173,559 in 2026, $126,023 in 2025, and $114,729 in 2023. The Company does not use TSR to determine compensation levels or inventive plan payouts, therefore the PEO and non-PEO NEOs CAP does not fluctuate with changes to TSR.
Compensation Actually Paid and Net Income
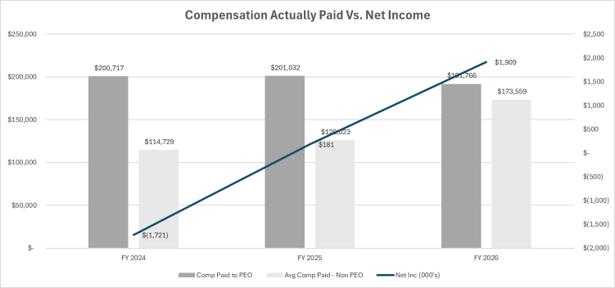
CAP to PEO #1, R. Clay Hulette, was $193,766 in 2026 and Don Jennings, was $201,032 in 2025 and $200,717 in 2024. CAP to the non-PEO NEOs averaged $173,559 in 2026, $126,032 in 2025, and $114,729 in 2024. The Company reported net income of $1.9 million in 2026, $181,000 in 2025, and a net loss of $1.7 million in 2024. The Company does not use net income to determine compensation levels or incentive plan payouts, therefore the PEO and non-PEO NEOs CAP does not fluctuate with changes to net income.
| [1] | As reported in the Summary Compensation Table on page 18 of this proxy statement |
| [2] | During fiscal year 2026, our principal executive officer (“PEO” was R. Clay Hulette. During fiscal years 2025 and 2024 our PEO was Don D. Jennings. During fiscal years 2026, our non-PEO Named Executive Officers were Teresa Hulette and Don D. Jennings. During fiscal years 2025 and 2024, our non-PEO Named Executive Officers (“non-PEO NEOs”) were Teresa Hulette and Jaime Coffey. |
| [3] | We had no outstanding equity awards for fiscal years 2026, 2025 and 2024. Accordingly, no equity award adjustments are applicable to the compensation paid to the PEO in 2026, 2025 and 2024. |
| [4] | Average summary compensation total for non-PEO NEOs represents the average of the SCT total compensation paid to the non-PEO NEOs during each of the years in the SCT. |
| [5] | We had no outstanding equity awards for fiscal years 2026, 2025 and 2024. Accordingly, no equity award adjustments are applicable to the compensation paid to the non-PEO named executive officers in 2026, 2025 and 2024. |
| [6] | Cumulative total shareholder return (“TSR”) assumes an initial investment of $100 investment as of market close on June 30, 2023 |
| [7] | Net Income as reported on page 27 of the Company’s Annual Report on Form 10-K for the fiscal year ended June 30, 2026. |