Shareholder Report
Jul. 31, 2026
USD ($)
Holding
This report describes changes to the Fund that occurred during or after the reporting period.
WHAT WERE THE FUND COSTS FOR THE LAST YEAR?
(Based on a hypothetical $10,000 investment)
| Fund | Costs of a $10,000 investment | Costs paid as a percentage of a $10,000 investment |
| First Trust Municipal High Income ETF | $60 | 0.58% |
HOW DID THE FUND PERFORM LAST YEAR? WHAT AFFECTED THE FUND’S PERFORMANCE?
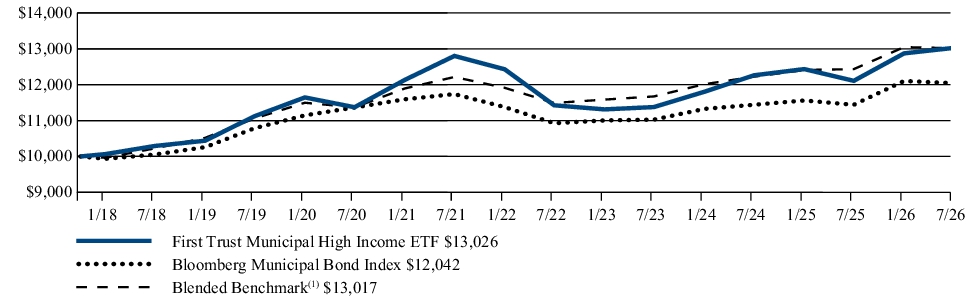
The Fund returned 7.59% for the 12-months ended July 31, 2026. The Fund outperformed its blended benchmark, which consists of the following two indexes: 50% of the Bloomberg High Yield 10-Year Municipal Index (8-12 years), and 50% of the Bloomberg Revenue 10-Year Municipal Index (8-12 years). The blended benchmark returned 4.69% for the same Period.
The following key factors impacted the Fund’s performance relative to the blended benchmark during the Period:
-
Yield Curve Positioning/Duration: During the Period, the Fund’s allocation to bonds with stated final maturities of 18+ years, 14–18 years, and 8–10 years were the primary drivers of outperformance relative to the blended benchmark. In contrast, the Fund’s allocation and selection of bonds with stated final maturities of 10-12 years detracted from relative performance. Regarding effective duration, the Fund’s allocation and selection of bonds with effective durations of 10+ years and 5–10 years were positive contributors to performance relative to the blended benchmark, while its allocation and selection of bonds with effective durations of 0–3 years detracted from relative performance.
-
Interest Rate Hedge: During the reporting period, the use of U.S. Treasury futures to hedge interest rate risk was a modest detractor from performance.
-
Credit Rating: The Fund’s selection and allocation of non-rated municipal bonds was the primary positive contributor to relative performance during the Period. Secondary positive contributors included the Fund’s allocation and selection of BBB-rated, A-rated, and AA-rated municipal securities. In contrast, the Fund’s allocation and selection of B-rated bonds and allocation to cash were modest detractors from performance.
-
Sector/Industry: During the Period, the Fund’s selection and allocation to special tax, industrial development bond, healthcare, and education securities were positive contributors to performance relative to the blended benchmark. No sector was a material negative contributor to performance during the Period.
-
U.S. Treasury Rate Trends: During the Period, 10-year and 30-year U.S. Treasury yields increased by approximately 36 basis points (bps) and 37 bps, respectively, to 4.73% and 5.27%.
-
New Issue Supply: During the Period, primary market supply increased approximately 2.4% to $581.2 billion, compared with $567.5 billion a year ago (Securities Industry and Financial Markets Association, Bloomberg, Barclays Research).
-
Municipal Credit Yields: For the Period, according to Municipal Market Data AAA yield curve data, 10-year municipal yields increased by 5 bps, while 30-year municipal yields decreased by 16 bps, to 3.37% and 4.51%, respectively.
-
Municipal Credit Spreads: During the Period, credit spreads tightened for A-rated, BBB-rated, and high-yield municipal bonds by approximately 7 bps, 13 bps, and 24 bps, respectively.
-
Industry Fund Flows: For the Period, according to data collected by the Investment Company Institute and J.P. Morgan, weekly reporting fund inflows totaled approximately $53 billion. The municipal asset class is highly driven by retail demand. This demand for bonds causes credit spreads to tighten and yields to decline. Both are additive to performance.
FUND PERFORMANCE (November 1, 2017 to July 31, 2026)
The performance line graph below shows the performance of a hypothetical $10,000 initial investment in the Fund over a ten-year period (or for the life of the Fund, if shorter). The subsequent account value as of the end of the Period is listed next to the name of the Fund or index, as applicable. The performance table below shows the average annual total returns of the Fund for the past one-, five-, and ten-year periods, as applicable (or for the life of the Fund, if shorter), as of the end of the Period. Both the line graph and performance table compare the Fund’s performance to an appropriate broad-based index and may compare to additional indices reflecting the market segment(s) in which the Fund invests over the same periods.
Investment Performance of $10,000
|
(1)
|
The Blended Benchmark consists of the following two indexes: 50% of the Bloomberg High Yield 10-Year Municipal Index (8-12 years) which is comprised of bonds with a final maturity between 8 and 12 years that are part of the Bloomberg Municipal Bond High Yield Index; and 50% of the Bloomberg Revenue 10-Year Municipal Index (8-12 years), which is comprised of revenue bonds that have a final maturity between 8 and 12 years that are part of the Bloomberg Municipal Bond Index.
|
| Average Annual Total Returns (as of July 31, 2026) | 1 Year | 5 Year | Since Inception (11/1/17) |
| First Trust Municipal High Income ETF | 7.59% | 0.35% | 3.07% |
| Bloomberg Municipal Bond Index | 5.27% | 0.51% | 2.15% |
| Blended Benchmark(1) | 4.69% | 1.28% | 3.06% |
|
(1)
|
The Blended Benchmark consists of the following two indexes: 50% of the Bloomberg High Yield 10-Year Municipal Index (8-12 years) which is comprised of bonds with a final maturity between 8 and 12 years that are part of the Bloomberg Municipal Bond High Yield Index; and 50% of the Bloomberg Revenue 10-Year Municipal Index (8-12 years), which is comprised of revenue bonds that have a final maturity between 8 and 12 years that are part of the Bloomberg Municipal Bond Index.
|
Visit www.ftportfolios.com/etf/FMHI for more recent performance information.
KEY FUND STATISTICS (As of July 31, 2026)
| Fund net assets | $994,107,054 |
| Total number of portfolio holdings | 732 |
| Total advisory fee paid | $5,079,873 |
| Portfolio turnover rate | 18% |
WHAT DID THE FUND INVEST IN? (As of July 31, 2026)
The tables below show the investment makeup of the Fund, representing the percentage of total investments of the Fund.
Sector Allocation
| Special Assessment | 17.8% |
| Continuing Care Retirement Communities | 13.6% |
| Industrial Development Bond | 8.5% |
| Education | 8.0% |
| Hospital | 7.4% |
| Government Obligation Bond - Limited Tax | 5.7% |
| Airport | 5.5% |
| Dedicated Tax | 3.9% |
| Gas | 3.3% |
| All Other | 26.3% |
Credit Quality (1)
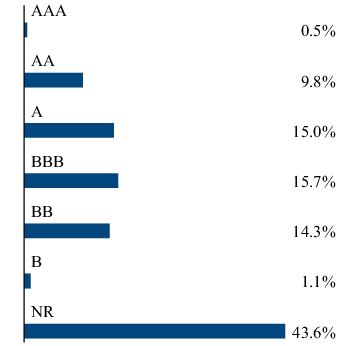
(1) The credit quality and ratings information presented above reflect the ratings assigned by one or more nationally recognized statistical rating organizations (NRSROs), including S&P Global Ratings, Moody’s Investors Service, Inc., Fitch Ratings or a comparably rated NRSRO. For situations in which a security is rated by more than one NRSRO and the ratings are not equivalent, the highest rating is used. Sub-investment grade ratings are those rated BB+/Ba1 or lower. Investment grade ratings are those rated BBB-/Baa3 or higher. “NR” indicates no rating. The credit ratings shown relate to the creditworthiness of the issuers of the underlying securities in the Fund, and not to the Fund or its shares. Credit ratings are subject to change.
HOW HAS THE FUND MATERIALLY CHANGED?
This is a summary of certain changes to the Fund since August 1, 2025. For more complete information, you may review the Fund’s prospectus and any applicable supplements at www.ftportfolios.com/fund-documents/etf/FMHI or upon request at 1-800-621-1675 or info@ftportfolios.com.
Effective February 1, 2026, the Fund’s annual unitary management fee was reduced from 0.70% to 0.49% of the Fund’s average daily net assets. Additionally, the Fund is no longer eligible for any breakpoint discounts described in the Fund’s prospectus or statement of additional information.
Effective February 1, 2026, the Fund’s annual unitary management fee was reduced from 0.70% to 0.49% of the Fund’s average daily net assets. Additionally, the Fund is no longer eligible for any breakpoint discounts described in the Fund’s prospectus or statement of additional information.
This is a summary of certain changes to the Fund since August 1, 2025. For more complete information, you may review the Fund’s prospectus and any applicable supplements at www.ftportfolios.com/fund-documents/etf/FMHI or upon request at 1-800-621-1675 or info@ftportfolios.com.
This report describes changes to the Fund that occurred during or after the reporting period.
WHAT WERE THE FUND COSTS FOR THE LAST YEAR?
(Based on a hypothetical $10,000 investment)
| Fund | Costs of a $10,000 investment | Costs paid as a percentage of a $10,000 investment |
| First Trust Horizon Managed Volatility Developed International ETF | $88 | 0.81%(1) |
|
(1) |
Includes extraordinary expenses. If these extraordinary expenses were not included, the expense ratio would have been 0.80%. |
HOW DID THE FUND PERFORM LAST YEAR? WHAT AFFECTED THE FUND’S PERFORMANCE?
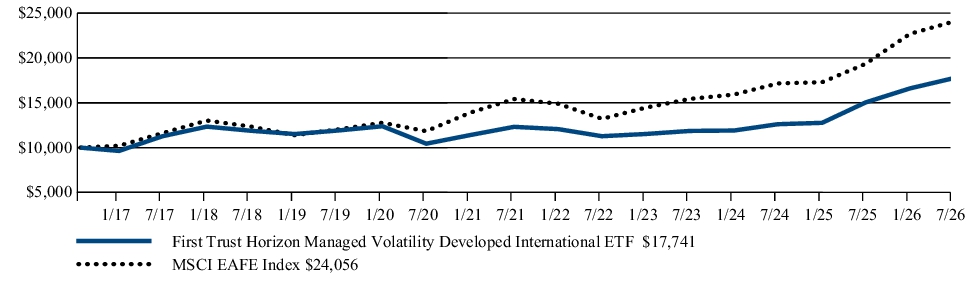
The Fund returned 17.94% for the 12 months ended July 31, 2026. The Fund underperformed its benchmark, the MSCI EAFE Index, which returned 24.33% for the same Period.
The underperformance over the Period was primarily driven by the defensive objective of the strategy capturing less of the return of the benchmark in a period of large gains for the benchmark. Selection of lower volatility securities detracted the most in Japan and Singapore. Selection of lower volatility securities contributed the most in Hong Kong and Sweden. Given the market environment, the Fund performed in-line with expectations, realizing lower drawdowns and lower volatility than the benchmark over the Period.
FUND PERFORMANCE (August 24, 2016 to July 31, 2026)
The performance line graph below shows the performance of a hypothetical $10,000 initial investment in the Fund over a ten-year period (or for the life of the Fund, if shorter). The subsequent account value as of the end of the Period is listed next to the name of the Fund or index, as applicable. The performance table below shows the average annual total returns of the Fund for the past one-, five-, and ten-year periods, as applicable (or for the life of the Fund, if shorter), as of the end of the Period. Both the line graph and performance table compare the Fund’s performance to an appropriate broad-based index and may compare to additional indices reflecting the market segment(s) in which the Fund invests over the same periods.
Investment Performance of $10,000
| Average Annual Total Returns (as of July 31, 2026) | 1 Year | 5 Year | Since Inception (8/24/16) |
| First Trust Horizon Managed Volatility Developed International ETF | 17.94% | 7.57% | 5.94% |
| MSCI EAFE Index | 24.33% | 9.31% | 9.24% |
Visit www.ftportfolios.com/etf/HDMV for more recent performance information.
KEY FUND STATISTICS (As of July 31, 2026)
| Fund net assets | $17,488,277 |
| Total number of portfolio holdings | 151 |
| Total advisory fee paid | $156,752 |
| Portfolio turnover rate | 57% |
WHAT DID THE FUND INVEST IN? (As of July 31, 2026)
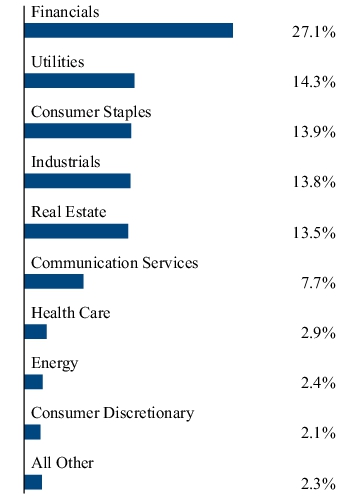
The tables below show the investment makeup of the Fund, representing the percentage of total investments of the Fund.
Top Ten Holdings
| CLP Holdings Ltd. | 2.0% |
| CapitaLand Ascendas REIT | 1.9% |
| Telstra Group Ltd. | 1.9% |
| CapitaLand Integrated Commercial Trust | 1.8% |
| Hong Kong & China Gas Co., Ltd. | 1.8% |
| Oversea-Chinese Banking Corp., Ltd. | 1.4% |
| United Overseas Bank Ltd. | 1.4% |
| Klepierre S.A. | 1.4% |
| DBS Group Holdings Ltd. | 1.3% |
| SoftBank Corp. | 1.3% |
Sector Allocation
Top Ten Holdings
| CLP Holdings Ltd. | 2.0% |
| CapitaLand Ascendas REIT | 1.9% |
| Telstra Group Ltd. | 1.9% |
| CapitaLand Integrated Commercial Trust | 1.8% |
| Hong Kong & China Gas Co., Ltd. | 1.8% |
| Oversea-Chinese Banking Corp., Ltd. | 1.4% |
| United Overseas Bank Ltd. | 1.4% |
| Klepierre S.A. | 1.4% |
| DBS Group Holdings Ltd. | 1.3% |
| SoftBank Corp. | 1.3% |
HOW HAS THE FUND MATERIALLY CHANGED?
This is a summary of certain changes to the Fund since August 1, 2025. For more complete information, you may review the Fund’s prospectus and any applicable supplements at www.ftportfolios.com/fund-documents/etf/HDMV or upon request at 1-800-621-1675 or info@ftportfolios.com.
On September 8, 2026, the Board of Trustees of the Trust (the “Board”) voted to terminate and liquidate HDMV pursuant to a Plan of Liquidation and Termination. The Board determined that the termination and liquidation of HDMV was in the best interests of HDMV. The Fund will liquidate on or around January 15, 2027.
This is a summary of certain changes to the Fund since August 1, 2025. For more complete information, you may review the Fund’s prospectus and any applicable supplements at www.ftportfolios.com/fund-documents/etf/HDMV or upon request at 1-800-621-1675 or info@ftportfolios.com.
WHAT WERE THE FUND COSTS FOR THE LAST YEAR?
(Based on a hypothetical $10,000 investment)
| Fund | Costs of a $10,000 investment | Costs paid as a percentage of a $10,000 investment |
| First Trust Horizon Managed Volatility Domestic ETF | $73 | 0.71%(1) |
|
(1) |
Includes extraordinary expenses. If these extraordinary expenses were not included, the expense ratio would have been 0.70%. |
HOW DID THE FUND PERFORM LAST YEAR? WHAT AFFECTED THE FUND’S PERFORMANCE?
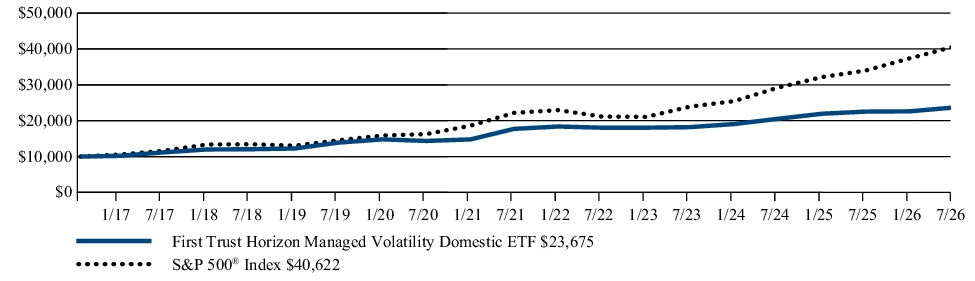
The Fund returned 5.06% for the 12 months ended July 31, 2026. The Fund underperformed its benchmark, the S&P 500® Index, which returned 19.56% for the same Period.
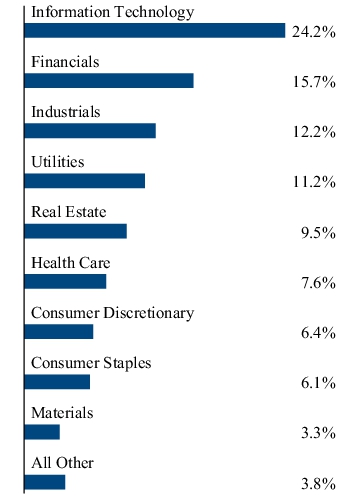
The underperformance over the Period was primarily driven by the defensive objective of the strategy capturing less of the return of the benchmark in a period of large gains for the benchmark. Underweights to more volatile sectors like Information Technology and Communication Services detracted from benchmark relative performance, while overweights to the Utilities and Real Estate sectors had a positive excess contribution to return.
Additionally, over the Period, a concentrated subset of Information Technology stocks within the benchmark primarily drove returns. The Fund’s systematic strategy avoided holding these companies due to their higher volatility and the inherent risks associated with them. This resulted in underweight allocations to some of the industries experiencing the most gains such as the Semiconductors & Semiconductor Equipment. Given the market environment, the Fund performed in-line with expectations, realizing lower drawdowns and lower volatility than the benchmark over the period.
FUND PERFORMANCE (August 24, 2016 to July 31, 2026)
The performance line graph below shows the performance of a hypothetical $10,000 initial investment in the Fund over a ten-year period (or for the life of the Fund, if shorter). The subsequent account value as of the end of the Period is listed next to the name of the Fund or index, as applicable. The performance table below shows the average annual total returns of the Fund for the past one-, five-, and ten-year periods, as applicable (or for the life of the Fund, if shorter), as of the end of the Period. Both the line graph and performance table compare the Fund’s performance to an appropriate broad-based index and may compare to additional indices reflecting the market segment(s) in which the Fund invests over the same periods.
Investment Performance of $10,000
| Average Annual Total Returns (as of July 31, 2026) | 1 Year | 5 Year | Since Inception (8/24/16) |
| First Trust Horizon Managed Volatility Domestic ETF | 5.06% | 5.96% | 9.06% |
| S&P 500® Index | 19.56% | 12.86% | 15.15% |
Visit www.ftportfolios.com/etf/HUSV for more recent performance information.
KEY FUND STATISTICS (As of July 31, 2026)
| Fund net assets | $84,086,007 |
| Total number of portfolio holdings | 102 |
| Total advisory fee paid | $583,835 |
| Portfolio turnover rate | 56% |
WHAT DID THE FUND INVEST IN? (As of July 31, 2026)
The tables below show the investment makeup of the Fund, representing the percentage of total investments of the Fund.
Top Ten Holdings
| Cisco Systems, Inc. | 3.4% |
| Gen Digital, Inc. | 3.0% |
| VeriSign, Inc. | 2.9% |
| Apple, Inc. | 2.8% |
| Microsoft Corp. | 2.8% |
| Roper Technologies, Inc. | 2.6% |
| Teledyne Technologies, Inc. | 2.5% |
| Motorola Solutions, Inc. | 2.2% |
| Coca-Cola (The) Co. | 2.2% |
| Realty Income Corp. | 2.1% |
Sector Allocation
Top Ten Holdings
| Cisco Systems, Inc. | 3.4% |
| Gen Digital, Inc. | 3.0% |
| VeriSign, Inc. | 2.9% |
| Apple, Inc. | 2.8% |
| Microsoft Corp. | 2.8% |
| Roper Technologies, Inc. | 2.6% |
| Teledyne Technologies, Inc. | 2.5% |
| Motorola Solutions, Inc. | 2.2% |
| Coca-Cola (The) Co. | 2.2% |
| Realty Income Corp. | 2.1% |
This report describes changes to the Fund that occurred during or after the reporting period.
WHAT WERE THE FUND COSTS FOR THE LAST YEAR?
(Based on a hypothetical $10,000 investment)
| Fund | Costs of a $10,000 investment | Costs paid as a percentage of a $10,000 investment |
| First Trust California Municipal High Income ETF | $58 | 0.56% |
HOW DID THE FUND PERFORM LAST YEAR? WHAT AFFECTED THE FUND’S PERFORMANCE?
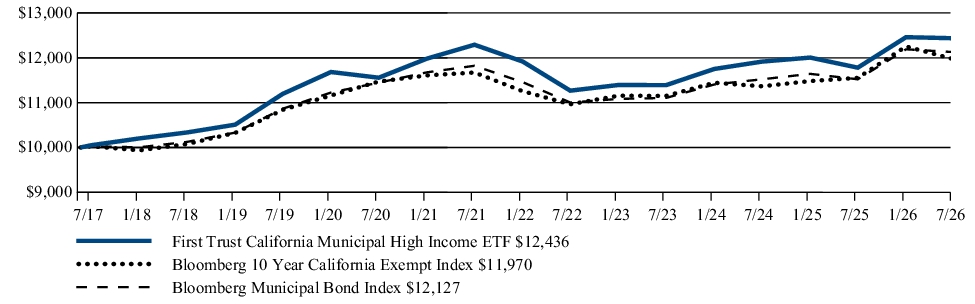
The Fund returned 5.57% for the 12 months ended July 31, 2026. The Fund outperformed its benchmark, the Bloomberg 10 Year California Exempt Index, which returned 3.62% for the same Period.
The following key Fund factors impacted the Fund’s performance relative to the benchmark during the Period:
-
Yield Curve Positioning/Duration: During the Period, the Fund’s allocation to bonds with a stated final maturity of 18+ years and 12-18 years were the primary drivers of the Fund’s outperformance relative to the benchmark. In contrast, the Fund’s selection of bonds with a maturity date of 0-2 years and allocation to cash were detrimental to the Fund’s performance over the Period. Regarding effective duration, the Fund’s allocation and selection of bonds with an effective duration of 10+ years and selection of bonds with an effective duration of 7-10 years and 5-7 years were the predominant reasons for the Fund’s outperformance relative to the benchmark. Contrawise, the Fund’s allocation and selection of bonds with an effective duration of 0-1 years and allocation to cash were detrimental to the Fund’s performance over the Period.
-
Interest Rate Hedge: The Fund’s use of U.S. Treasury futures to hedge interest rate risk was a slightly positive contributor to the Fund’s performance.
-
Credit Rating: The Fund’s selection of AA rated, A rated and BBB rated bonds were positive contributors to the Fund’s outperformance relative to the benchmark over the Period. A secondary positive contributor to the Fund’s outperformance during the Period was the Fund’s allocation to non-rated bonds. No credit rating category was a negative contributor to the Fund’s performance.
-
Sector/Industry: During the Period, the Fund’s selection of special tax, health care, lease, local general obligation, and education sectors were positive contributors to the Fund’s performance relative to the benchmark. No sector was a material negative contributor to the Fund’s performance during the Period.
-
U.S. Treasury Rate Trends: During the Period, 10-year and 30-year U.S. Treasury yields increased by approximately 36 basis points (“bps”) and 37 bps, respectively, to 4.73% and 5.27%, respectively.
-
New Issue Supply: During the Period, primary market supply increased approximately 2.4% to $581.2 billion compared with $567.5 billion a year ago (SIFMA, Bloomberg, Barclays Research).
-
Municipal Credit Yields: For the Period, according to Municipal Market Data AAA yield curve data, 10-year municipal yields increased 5 bps while 30-year municipal yields decreased by 16 bps to 3.37% and 4.51%, respectively.
-
Municipal Credit Spreads: During the Period, credits spreads tightened for A, BBB, and high yield municipals by approximately 7 bps, 13 bps, and 24 bps, respectively.
-
Industry Fund Flows: During the Period, according to data collected by the Investment Company Institute and JP Morgan, weekly reporting fund inflows totaled approximately $53 billion. The municipal asset class is highly driven by retail demand. This demand for bonds causes credit spreads to tighten and yields to decline. Both are additive to performance.
FUND PERFORMANCE (June 20, 2017 to July 31, 2026)
The performance line graph below shows the performance of a hypothetical $10,000 initial investment in the Fund over a ten-year period (or for the life of the Fund, if shorter). The subsequent account value as of the end of the Period is listed next to the name of the Fund or index, as applicable. The performance table below shows the average annual total returns of the Fund for the past one-, five-, and ten-year periods, as applicable (or for the life of the Fund, if shorter), as of the end of the Period. Both the line graph and performance table compare the Fund’s performance to an appropriate broad-based index and may compare to additional indices reflecting the market segment(s) in which the Fund invests over the same periods.
Investment Performance of $10,000
| Average Annual Total Returns (as of July 31, 2026) | 1 Year | 5 Year | Since Inception (6/20/17) |
| First Trust California Municipal High Income ETF | 5.57% | 0.23% | 2.42% |
| Bloomberg 10 Year California Exempt Index | 3.62% | 0.50% | 1.99% |
| Bloomberg Municipal Bond Index | 5.27% | 0.51% | 2.14% |
Visit www.ftportfolios.com/etf/FCAL for more recent performance information.
KEY FUND STATISTICS (As of July 31, 2026)
| Fund net assets | $218,691,665 |
| Total number of portfolio holdings | 278 |
| Total advisory fee paid | $1,130,105 |
| Portfolio turnover rate | 28% |
WHAT DID THE FUND INVEST IN? (As of July 31, 2026)
The tables below show the investment makeup of the Fund, representing the percentage of total investments of the Fund.
Sector Allocation
| Insured | 13.3% |
| Special Assessment | 13.1% |
| Government Obligation Bond - Unlimited Tax | 9.6% |
| Certificates of Participation | 7.7% |
| Airport | 7.6% |
| Water & Sewer | 6.3% |
| Gas | 6.2% |
| Hospital | 6.2% |
| Education | 5.4% |
| All Other | 24.6% |
Credit Quality (1)
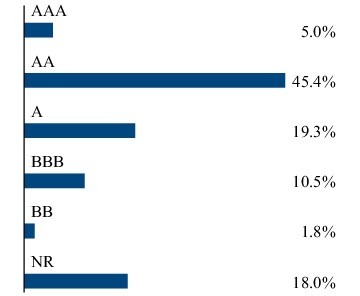
(1) The credit quality and ratings information presented above reflect the ratings assigned by one or more nationally recognized statistical rating organizations (NRSROs), including S&P Global Ratings, Moody’s Investors Service, Inc., Fitch Ratings or a comparably rated NRSRO. For situations in which a security is rated by more than one NRSRO and the ratings are not equivalent, the highest rating is used. Sub-investment grade ratings are those rated BB+/Ba1 or lower. Investment grade ratings are those rated BBB-/Baa3 or higher. “NR” indicates no rating. The credit ratings shown relate to the creditworthiness of the issuers of the underlying securities in the Fund, and not to the Fund or its shares. Credit ratings are subject to change.
HOW HAS THE FUND MATERIALLY CHANGED?
This is a summary of certain changes to the Fund since August 1, 2025. For more complete information, you may review the Fund’s prospectus and any applicable supplements at www.ftportfolios.com/fund-documents/etf/FCAL or upon request at 1-800-621-1675 or info@ftportfolios.com.
Effective February 1, 2026, the Fund’s annual unitary management fee was reduced from 0.65% to 0.49% of the Fund’s average daily net assets. Additionally, the Fund is no longer eligible for any breakpoint discounts described in the Fund’s prospectus or statement of additional information.
Effective February 1, 2026, the Fund’s annual unitary management fee was reduced from 0.65% to 0.49% of the Fund’s average daily net assets. Additionally, the Fund is no longer eligible for any breakpoint discounts described in the Fund’s prospectus or statement of additional information.
This is a summary of certain changes to the Fund since August 1, 2025. For more complete information, you may review the Fund’s prospectus and any applicable supplements at www.ftportfolios.com/fund-documents/etf/FCAL or upon request at 1-800-621-1675 or info@ftportfolios.com.
This report describes changes to the Fund that occurred during or after the reporting period.
WHAT WERE THE FUND COSTS FOR THE LAST YEAR?
(Based on a hypothetical $10,000 investment)
| Fund | Costs of a $10,000 investment | Costs paid as a percentage of a $10,000 investment |
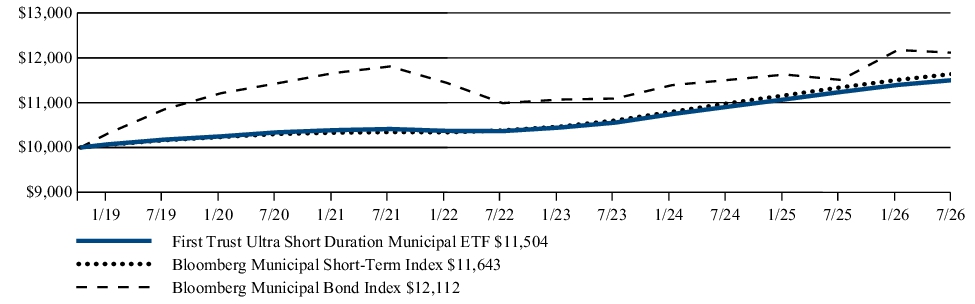
| First Trust Ultra Short Duration Municipal ETF | $36 | 0.36% |
HOW DID THE FUND PERFORM LAST YEAR? WHAT AFFECTED THE FUND’S PERFORMANCE?
The Fund returned 2.37% for the 12 months ended July 31, 2026. The Fund underperformed its benchmark, the Bloomberg Municipal Short-Term Index, which returned 2.67% for the same Period.
The following key factors impacted the Fund’s performance relative to its benchmark during the Period:
-
Credit Rating: The Fund’s underweight allocation and selection of AA-rated bonds was the primary positive contributor to performance relative to the benchmark. The Fund’s overweight selection of A-rated bonds was the primary detractor from relative performance.
-
Years to Maturity: The Fund’s selection of bonds in the 0–2 year maturity range was the primary detractor from performance relative to the benchmark. The Fund’s allocation to bonds in the 2–4 year maturity range was a secondary source of relative underperformance.
-
Effective Duration: The Fund’s selection of bonds with an effective duration of 1–3 years was the primary detractor from performance relative to the benchmark. Bonds with an effective duration of 0–1 years were a secondary source of relative underperformance.
-
Sector/Industry: The Fund’s allocation to state general obligation (“GO”) bonds was the primary positive contributor to performance relative to the benchmark. The Fund’s selection of industrial development bonds (“IDBs”) was the primary detractor, while its selection of healthcare bonds was a secondary detractor from relative performance.
-
U.S. Treasury Rate Trends: During the Period, 10-year and 30-year U.S. Treasury yields increased by approximately 36 basis points (“bps”) and 37 bps, respectively, to 4.73% and 5.27%.
-
New Issue Supply: During the Period, primary market supply increased approximately 2.4% to $581.2 billion, compared with $567.5 billion a year ago (Securities Industry and Financial Markets Association, Bloomberg, Barclays Research).
-
Municipal Credit Yields: For the Period, according to Municipal Market Data AAA yield curve data, 10-year municipal yields increased by 5 bps, while 30-year municipal yields decreased by 16 bps, to 3.37% and 4.51%, respectively.
-
Municipal Credit Spreads: During the Period, credit spreads tightened for A-rated, BBB-rated, and high-yield municipal bonds by approximately 7 bps, 13 bps, and 24 bps, respectively.
-
Industry Fund Flows: For the Period, according to data collected by the Investment Company Institute and Bloomberg, fund outflows totaled approximately $53 billion. The municipal asset class is highly driven by retail demand. The demand for bonds causes credit spreads to tighten and yields to decline. Both are additive to performance.
FUMB did not employ derivatives during the Period.
FUND PERFORMANCE (November 1, 2018 to July 31, 2026)
The performance line graph below shows the performance of a hypothetical $10,000 initial investment in the Fund over a ten-year period (or for the life of the Fund, if shorter). The subsequent account value as of the end of the Period is listed next to the name of the Fund or index, as applicable. The performance table below shows the average annual total returns of the Fund for the past one-, five-, and ten-year periods, as applicable (or for the life of the Fund, if shorter), as of the end of the Period. Both the line graph and performance table compare the Fund’s performance to an appropriate broad-based index and may compare to additional indices reflecting the market segment(s) in which the Fund invests over the same periods.
Investment Performance of $10,000
| Average Annual Total Returns (as of July 31, 2026) | 1 Year | 5 Year | Since Inception (11/1/18) |
| First Trust Ultra Short Duration Municipal ETF | 2.37% | 2.02% | 1.83% |
| Bloomberg Municipal Short-Term Index | 2.67% | 2.40% | 1.98% |
| Bloomberg Municipal Bond Index | 5.27% | 0.51% | 2.50% |
Visit www.ftportfolios.com/etf/FUMB for more recent performance information.
KEY FUND STATISTICS (As of July 31, 2026)
| Fund net assets | $246,416,028 |
| Total number of portfolio holdings | 249 |
| Total advisory fee paid | $816,106 |
| Portfolio turnover rate | 124% |
WHAT DID THE FUND INVEST IN? (As of July 31, 2026)
The tables below show the investment makeup of the Fund, representing the percentage of total investments of the Fund.
Sector Allocation
| Government Obligation Bond - Unlimited Tax | 11.3% |
| Hospital | 10.4% |
| Local Housing | 9.5% |
| Industrial Development Bond | 9.2% |
| Airport | 8.9% |
| Government Obligation Bond - Limited Tax | 8.7% |
| Insured | 7.6% |
| Utility | 6.4% |
| Dedicated Tax | 5.1% |
| All Other | 22.9% |
Credit Quality (1)
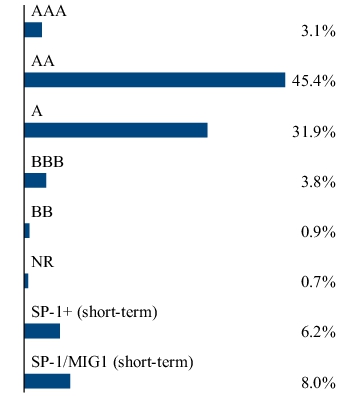
(1) The credit quality and ratings information presented above reflect the ratings assigned by one or more nationally recognized statistical rating organizations (NRSROs), including S&P Global Ratings, Moody’s Investors Service, Inc., Fitch Ratings or a comparably rated NRSRO. For situations in which a security is rated by more than one NRSRO and the ratings are not equivalent, the highest rating is used. Sub-investment grade ratings are those rated BB+/Ba1 or lower. Investment grade ratings are those rated BBB-/Baa3 or higher. “NR” indicates no rating. The credit ratings shown relate to the creditworthiness of the issuers of the underlying securities in the Fund, and not to the Fund or its shares. Credit ratings are subject to change.
HOW HAS THE FUND MATERIALLY CHANGED?
This is a summary of certain changes to the Fund since August 1, 2025. For more complete information, you may review the Fund’s prospectus and any applicable supplements at www.ftportfolios.com/fund-documents/etf/FUMB or upon request at 1-800-621-1675 or info@ftportfolios.com.
Effective February 1, 2026, the Fund’s annual unitary management fee was reduced from 0.45% to 0.29% of the Fund’s average daily net assets. Additionally, the Fund is no longer eligible for any breakpoint discounts described in the Fund’s prospectus or statement of additional information.
Effective February 1, 2026, the Fund’s annual unitary management fee was reduced from 0.45% to 0.29% of the Fund’s average daily net assets. Additionally, the Fund is no longer eligible for any breakpoint discounts described in the Fund’s prospectus or statement of additional information.
This is a summary of certain changes to the Fund since August 1, 2025. For more complete information, you may review the Fund’s prospectus and any applicable supplements at www.ftportfolios.com/fund-documents/etf/FUMB or upon request at 1-800-621-1675 or info@ftportfolios.com.
This report describes changes to the Fund that occurred during or after the reporting period.
WHAT WERE THE FUND COSTS FOR THE LAST YEAR?
(Based on a hypothetical $10,000 investment)
| Fund | Costs of a $10,000 investment | Costs paid as a percentage of a $10,000 investment |
| First Trust Short Duration Managed Municipal ETF | $44 | 0.43% |
HOW DID THE FUND PERFORM LAST YEAR? WHAT AFFECTED THE FUND’S PERFORMANCE?
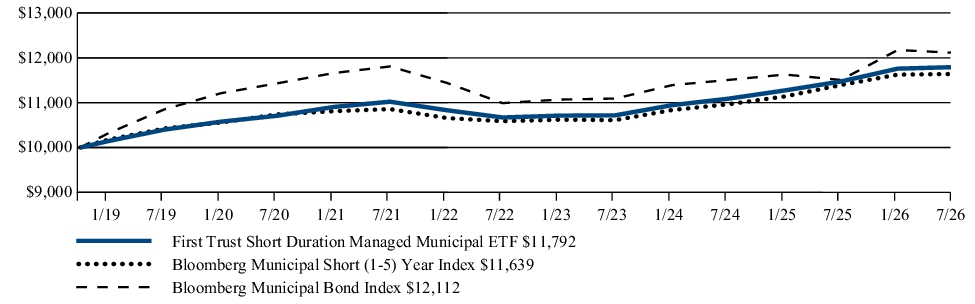
The Fund returned 2.78% for the 12 months ended July 31, 2026. The Fund outperformed its benchmark, the Bloomberg Municipal Short (1-5) Year Index, which returned 2.16% for the same Period.
The following key factors impacted the Fund’s performance relative to the benchmark during the Period:
-
Credit Rating: The Fund’s underweight selection of AA-rated bonds was the primary positive contributor to performance relative to the benchmark, while its overweight allocation and selection of A-rated bonds was a secondary contributor. The Fund’s overweight allocation to BB-rated bonds was the primary detractor from relative performance, followed by its underweight allocation to AAA-rated bonds.
-
Years to Maturity: The Fund’s selection of bonds in the 4–6 year maturity range was the primary source of outperformance relative to the benchmark. The Fund’s allocation to bonds in the 6–8 year maturity range and selection of bonds in the 2–4 year maturity range were secondary sources of outperformance. There were no material sources of underperformance attributable to final maturity.
-
Effective Duration: The Fund’s selection of bonds with an effective duration of 1–3 years, overweight allocation to bonds with an effective duration of 5–7 years and selection of bonds with an effective duration of 3-5 years were the primary sources of outperformance relative to the benchmark. There were no material sources of underperformance attributable to effective duration.
-
Sector/Industry: The Fund’s overweight allocation to industrial development bonds (“IDBs”) was the primary contributor to outperformance relative to the benchmark. The Fund’s overweight selection of healthcare bonds was a secondary positive contributor. There were no material sources of underperformance attributable to sector exposure.
-
U.S. Treasury Rate Trends: During the Period, 10-year and 30-year U.S. Treasury yields increased by approximately 36 basis points (“bps”) and 37 bps, respectively, to 4.73% and 5.27%.
-
New Issue Supply: During the Period, primary market supply increased approximately 2.4% to $581.2 billion, compared with $567.5 billion a year ago (Securities Industry and Financial Markets Association, Bloomberg, Barclays Research).
-
Municipal Credit Yields: For the Period, according to Municipal Market Data AAA yield curve data, 10-year municipal yields increased by 5 bps, while 30-year municipal yields decreased by 16 bps, to 3.37% and 4.51%, respectively.
-
Municipal Credit Spreads: During the Period, credit spreads tightened for A-rated, BBB-rated, and high-yield municipal bonds by approximately 7 bps, 13 bps, and 24 bps, respectively.
-
Industry Fund Flows: For the Period, according to data collected by the Investment Company Institute and Bloomberg, fund outflows totaled approximately $53 billion. The municipal asset class is highly driven by retail demand. The demand for bonds causes credit spreads to tighten and yields to decline. Both are additive to performance.
The Fund’s use of derivatives had a minimal impact on the Fund’s performance of approximately 1 basis point.
FUND PERFORMANCE (November 1, 2018 to July 31, 2026)
The performance line graph below shows the performance of a hypothetical $10,000 initial investment in the Fund over a ten-year period (or for the life of the Fund, if shorter). The subsequent account value as of the end of the Period is listed next to the name of the Fund or index, as applicable. The performance table below shows the average annual total returns of the Fund for the past one-, five-, and ten-year periods, as applicable (or for the life of the Fund, if shorter), as of the end of the Period. Both the line graph and performance table compare the Fund’s performance to an appropriate broad-based index and may compare to additional indices reflecting the market segment(s) in which the Fund invests over the same periods.
Investment Performance of $10,000
| Average Annual Total Returns (as of July 31, 2026) | 1 Year | 5 Year | Since Inception (11/1/18) |
| First Trust Short Duration Managed Municipal ETF | 2.78% | 1.36% | 2.15% |
| Bloomberg Municipal Short (1-5) Year Index | 2.16% | 1.40% | 1.98% |
| Bloomberg Municipal Bond Index | 5.27% | 0.51% | 2.50% |
Visit www.ftportfolios.com/etf/FSMB for more recent performance information.
KEY FUND STATISTICS (As of July 31, 2026)
| Fund net assets | $621,604,971 |
| Total number of portfolio holdings | 553 |
| Total advisory fee paid | $2,280,029 |
| Portfolio turnover rate | 30% |
WHAT DID THE FUND INVEST IN? (As of July 31, 2026)
The tables below show the investment makeup of the Fund, representing the percentage of total investments of the Fund.
Sector Allocation
| Gas | 13.3% |
| Industrial Development Bond | 12.7% |
| Hospital | 11.1% |
| Airport | 10.7% |
| Utility | 9.1% |
| Continuing Care Retirement Communities | 8.3% |
| Housing | 8.2% |
| Special Assessment | 6.4% |
| Insured | 3.1% |
| All Other | 17.1% |
Credit Quality (1)
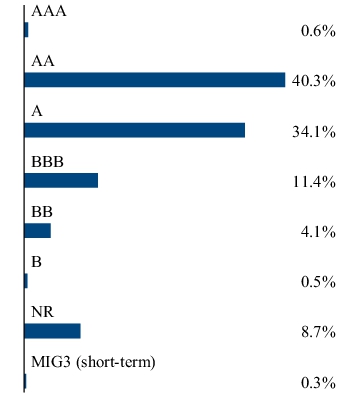
(1) The credit quality and ratings information presented above reflect the ratings assigned by one or more nationally recognized statistical rating organizations (NRSROs), including S&P Global Ratings, Moody’s Investors Service, Inc., Fitch Ratings or a comparably rated NRSRO. For situations in which a security is rated by more than one NRSRO and the ratings are not equivalent, the highest rating is used. Sub-investment grade ratings are those rated BB+/Ba1 or lower. Investment grade ratings are those rated BBB-/Baa3 or higher. “NR” indicates no rating. The credit ratings shown relate to the creditworthiness of the issuers of the underlying securities in the Fund, and not to the Fund or its shares. Credit ratings are subject to change.
HOW HAS THE FUND MATERIALLY CHANGED?
This is a summary of certain changes to the Fund since August 1, 2025. For more complete information, you may review the Fund’s prospectus and any applicable supplements at www.ftportfolios.com/fund-documents/etf/FSMB or upon request at 1-800-621-1675 or info@ftportfolios.com.
Effective February 1, 2026, the Fund’s annual unitary management fee was reduced from 0.55% to 0.34% of the Fund’s average daily net assets. Additionally, the Fund is no longer eligible for any breakpoint discounts described in the Fund’s prospectus or statement of additional information.
Effective February 1, 2026, the Fund’s annual unitary management fee was reduced from 0.55% to 0.34% of the Fund’s average daily net assets. Additionally, the Fund is no longer eligible for any breakpoint discounts described in the Fund’s prospectus or statement of additional information.
This is a summary of certain changes to the Fund since August 1, 2025. For more complete information, you may review the Fund’s prospectus and any applicable supplements at www.ftportfolios.com/fund-documents/etf/FSMB or upon request at 1-800-621-1675 or info@ftportfolios.com.
This report describes changes to the Fund that occurred during or after the reporting period.
WHAT WERE THE FUND COSTS FOR THE LAST YEAR?
(Based on a hypothetical $10,000 investment)
| Fund | Costs of a $10,000 investment(1) | Costs paid as a percentage of a $10,000 investment(1) |
| First Trust Equity Market Neutral ETF | $136(2) | 1.31%(2) |
|
(1) |
Includes dividend expense on investments sold short. |
|
(2) |
Excludes any Acquired Fund Fees and Expenses of the underlying investment companies in which the Fund invests. |
HOW DID THE FUND PERFORM LAST YEAR? WHAT AFFECTED THE FUND’S PERFORMANCE?
The Fund returned 7.90% for the 12 months ended July 31, 2026 (the “Fiscal Period”). The Fund outperformed its benchmark, the ICE BofA 3-Month U.S. Treasury Bill Index, which returned 3.82% for the same Fiscal Period.
As of the close of business on June 23, 2026, the Fund’s name changed from the First Trust Merger Arbitrage ETF to the First Trust Equity Market Neutral ETF and changed its investment strategies and portfolio management team. The First Trust Alternatives Team of First Trust Advisors L.P., the investment advisor to the Fund, assumed portfolio management responsibilities for the Fund, replacing the previous sub-advisor. The Fund no longer pursues a merger arbitrage strategy, instead it seeks an equity market neutral approach where the overall performance of the Fund is driven primarily by the net performance of long and short positions, independent of directional movements in the market. From the close of business on June 23, 2026, through July 31, 2026 (the “Post-Change Period”), the Fund returned 3.50%. During the same Post-Change Period, the Fund’s benchmark returned 0.40%, resulting in Fund outperformance of 3.10 percentage points.
The Fund’s outperformance during the Post-Change Period was primarily attributable to the Fund’s long equity positions outperforming its short equity positions, as well as incremental return from its cash portfolio.
The overall economic backdrop during the Fiscal Period from August 1, 2025, through July 31, 2026, was one of economic growth and strong corporate earnings. During the Fiscal Period, broad-based economic indicators highlighting these trends included:
-
Average annualized GDP growth over the prior four calendar quarters (Q3 2025–Q2 2026) was 2.1%.
-
Basic earnings per share for the S&P 500® Index rose from $218.35 as of July 31, 2025 to $262.51 as of July 31, 2026, an increase of 20.2% over the Fiscal Period.
U.S. equities had strong returns during the Fiscal Period, with two pullbacks (the first in November 2025 and the second in March 2026) unable to derail a solid overall 12 months. For the Fiscal Period, the S&P 500® Index gained 19.56% and the technology-heavy Nasdaq 100®-Index was up 22.58%. Smaller-capitalization stocks performed even better than the larger indexes, posting a return of 34.18% as measured by the Russell 2000® Index. The growth in corporate earnings noted earlier played a large part in boosting equity returns, as did a resilient belief that artificial intelligence will enhance productivity.
The Fund’s new investment strategy, implemented as of the close of business on June 23, 2026, benefitted from the generally positive economic backdrop for U.S. equities, as the S&P 500® Index rose by 1.77% during the Post-Change Period. The Fund’s long stock portfolio was up 4.24% on a total return, fully invested basis, while the short stock positions were up 2.84% on the same basis. The short positions detracted from the Fund’s total return because the Fund was short those positions, which rose in value. The positive spread of 1.40% between the two portfolios contributed to the Fund’s overall total return.
During the Post-Change Period, the Fund’s economic exposure to its long positions was targeted at 195% of total Fund assets, while its economic exposure to the short positions was targeted at 175% of total Fund assets. The additional economic exposure above 100% added 4.02% to the Fund’s total return from its long portfolio and detracted -2.13% from total return from its short portfolio. Overall, including the impact of the additional exposure above 100%, the spread between the long and short portfolios was 3.08%. The Fund also benefited from interest income and trade timing, while financing charges related to the total return swaps detracted from performance.
As of July 31, 2026, the Fund had 232 long positions and 251 short positions. Gross equity exposure for the Fund was 356% of the Fund’s net asset value with 192% being long stock positions and 168% in short stock positions.
FUND PERFORMANCE (February 4, 2020 to July 31, 2026)
The performance line graph below shows the performance of a hypothetical $10,000 initial investment in the Fund over a ten-year period (or for the life of the Fund, if shorter). The subsequent account value as of the end of the Period is listed next to the name of the Fund or index, as applicable. The performance table below shows the average annual total returns of the Fund for the past one-, five-, and ten-year periods, as applicable (or for the life of the Fund, if shorter), as of the end of the Period. Both the line graph and performance table compare the Fund’s performance to an appropriate broad-based index and may compare to additional indices reflecting the market segment(s) in which the Fund invests over the same periods.
Investment Performance of $10,000
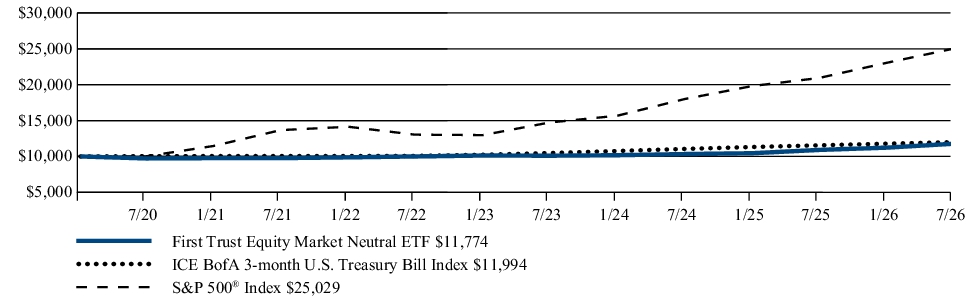
| Average Annual Total Returns (as of July 31, 2026) | 1 Year | 5 Year | Since Inception (2/4/20) |
| First Trust Equity Market Neutral ETF | 7.90% | 3.80% | 2.55% |
| ICE BofA 3-month U.S. Treasury Bill Index | 3.82% | 3.59% | 2.84% |
| S&P 500® Index | 19.56% | 12.86% | 15.20% |
Visit www.ftportfolios.com/etf/NTRL for more recent performance information.
KEY FUND STATISTICS (As of July 31, 2026)
| Fund net assets | $16,257,576 |
| Total number of portfolio holdings | 17 |
| Total advisory fee paid | $384,617 |
| Portfolio turnover rate | 377% |
WHAT DID THE FUND INVEST IN? (As of July 31, 2026)
The table below shows the investment makeup of the Fund, representing the percentage of net assets of the Fund.
Fund Allocation
| Rights | 0.0% |
| Money Market Funds | 83.6% |
| Net Other Assets and Liabilities(1) | 16.4% |
| Total | 100.0% |
Any amount shown as 0.0% represents less than 0.1%.
(1) Includes unrealized appreciation (depreciation) on swap contracts.
HOW HAS THE FUND MATERIALLY CHANGED?
This is a summary of certain changes to the Fund since August 1, 2025. For more complete information, you may review the Fund’s prospectus and any applicable supplements at www.ftportfolios.com/fund-documents/etf/NTRL or upon request at 1-800-621-1675 or info@ftportfolios.com.
In its prospectus dated June 22, 2026 and effective June 24, 2026, the Fund’s name changed from “First Trust Merger Arbitrage ETF” to “First Trust Equity Market Neutral ETF,” and the Fund’s ticker changed from “MARB” to “NTRL.” In connection with the change to the Fund’s name, the Fund’s principal investment strategies and principal risks were revised to reflect the Fund’s new strategy to seek an equity market neutral approach where the overall performance of the Fund is driven primarily by the net performance of long and short positions, independent of directional movements in the market. Additionally, the Fund’s annual unitary management fee was reduced to 0.95% of the Fund’s average daily net assets, the Fund’s portfolio management team changed to members of the First Trust Alternatives Investment Team, and the Fund no longer has a sub-advisor.
This is a summary of certain changes to the Fund since August 1, 2025. For more complete information, you may review the Fund’s prospectus and any applicable supplements at www.ftportfolios.com/fund-documents/etf/NTRL or upon request at 1-800-621-1675 or info@ftportfolios.com.
This report describes changes to the Fund that occurred during or after the reporting period.
WHAT WERE THE FUND COSTS FOR THE LAST YEAR?
(Based on a hypothetical $10,000 investment)
| Fund | Costs of a $10,000 investment | Costs paid as a percentage of a $10,000 investment |
| First Trust Horizon Managed Volatility Small/Mid ETF | $86 | 0.81%(1) |
|
(1) |
Includes extraordinary expenses. If these extraordinary expenses were not included, the expense ratio would have been 0.80%. |
HOW DID THE FUND PERFORM LAST YEAR? WHAT AFFECTED THE FUND’S PERFORMANCE?
The Fund returned 12.80% for the 12 months ended July 31, 2026. The Fund underperformed its benchmark, the S&P 1000® Index, which returned 24.91% for the same Period.
The underperformance over the Period was primarily driven by the defensive objective of the strategy capturing less of the return of the benchmark in a period of large gains for the benchmark. Small and mid-sized stocks in the benchmark generally led larger cap stocks over the same Period, as these companies have exhibited characteristics more sensitive to an improving macro-economic environment. Underweights to more volatile sectors such as Information Technology and Health Care were large benchmark relative detractors, while overweights to Utilities and Real Estate were accretive. Given the market environment, the Fund performed in-line with expectations, realizing lower drawdowns and lower volatility than the benchmark over the Period.
FUND PERFORMANCE (April 6, 2020 to July 31, 2026)
The performance line graph below shows the performance of a hypothetical $10,000 initial investment in the Fund over a ten-year period (or for the life of the Fund, if shorter). The subsequent account value as of the end of the Period is listed next to the name of the Fund or index, as applicable. The performance table below shows the average annual total returns of the Fund for the past one-, five-, and ten-year periods, as applicable (or for the life of the Fund, if shorter), as of the end of the Period. Both the line graph and performance table compare the Fund’s performance to an appropriate broad-based index and may compare to additional indices reflecting the market segment(s) in which the Fund invests over the same periods.
Investment Performance of $10,000
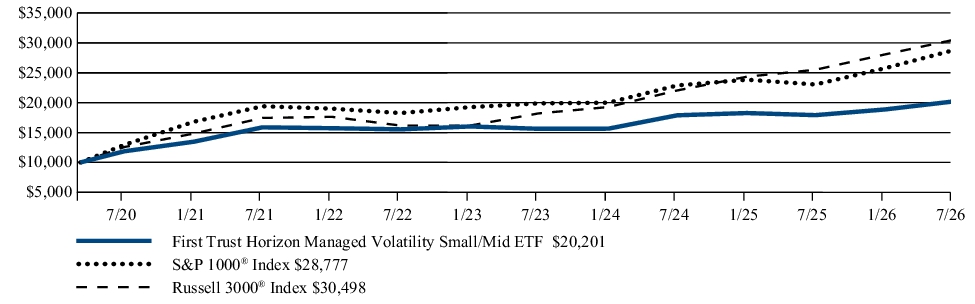
| Average Annual Total Returns (as of July 31, 2026) | 1 Year | 5 Year | Since Inception (4/6/20) |
| First Trust Horizon Managed Volatility Small/Mid ETF | 12.80% | 4.95% | 11.77% |
| S&P 1000® Index | 24.91% | 8.21% | 18.21% |
| Russell 3000® Index | 19.60% | 11.82% | 19.30% |
Visit www.ftportfolios.com/etf/HSMV for more recent performance information.
KEY FUND STATISTICS (As of July 31, 2026)
| Fund net assets | $35,208,002 |
| Total number of portfolio holdings | 151 |
| Total advisory fee paid | $235,393 |
| Portfolio turnover rate | 40% |
WHAT DID THE FUND INVEST IN? (As of July 31, 2026)
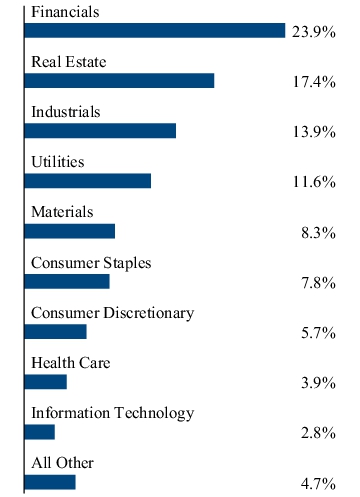
The tables below show the investment makeup of the Fund, representing the percentage of total investments of the Fund.
Top Ten Holdings
| Phillips Edison & Co., Inc. | 2.2% |
| OGE Energy Corp. | 2.0% |
| Ingredion, Inc. | 1.6% |
| NNN REIT, Inc. | 1.5% |
| Ellington Financial, Inc. | 1.5% |
| IDACORP, Inc. | 1.5% |
| Agree Realty Corp. | 1.4% |
| Four Corners Property Trust, Inc. | 1.4% |
| Starwood Property Trust, Inc. | 1.4% |
| Hanover Insurance Group (The), Inc. | 1.2% |
Sector Allocation
Top Ten Holdings
| Phillips Edison & Co., Inc. | 2.2% |
| OGE Energy Corp. | 2.0% |
| Ingredion, Inc. | 1.6% |
| NNN REIT, Inc. | 1.5% |
| Ellington Financial, Inc. | 1.5% |
| IDACORP, Inc. | 1.5% |
| Agree Realty Corp. | 1.4% |
| Four Corners Property Trust, Inc. | 1.4% |
| Starwood Property Trust, Inc. | 1.4% |
| Hanover Insurance Group (The), Inc. | 1.2% |
HOW HAS THE FUND MATERIALLY CHANGED?
This is a summary of certain changes to the Fund since August 1, 2025. For more complete information, you may review the Fund’s prospectus and any applicable supplements at www.ftportfolios.com/fund-documents/etf/HSMV or upon request at 1-800-621-1675 or info@ftportfolios.com.
On September 8, 2026, the Board of Trustees of the Trust (the “Board”) voted to terminate and liquidate HSMV pursuant to a Plan of Liquidation and Termination. The Board determined that the termination and liquidation of HSMV was in the best interests of HSMV. The Fund will liquidate on or around January 15, 2027.
This is a summary of certain changes to the Fund since August 1, 2025. For more complete information, you may review the Fund’s prospectus and any applicable supplements at www.ftportfolios.com/fund-documents/etf/HSMV or upon request at 1-800-621-1675 or info@ftportfolios.com.
This report describes changes to the Fund that occurred during or after the reporting period.
WHAT WERE THE FUND COSTS FOR THE LAST YEAR?
(Based on a hypothetical $10,000 investment)
| Fund | Costs of a $10,000 investment | Costs paid as a percentage of a $10,000 investment |
| First Trust New York Municipal High Income ETF | $57 | 0.55% |
HOW DID THE FUND PERFORM LAST YEAR? WHAT AFFECTED THE FUND’S PERFORMANCE?
The Fund returned 5.85% for the 12 months ended July 31, 2026. The Fund underperformed its benchmark, the Bloomberg Municipal New York 12-17 Years Index, which returned 6.43% for the same Period.
The following key Fund factors impacted Fund performance relative to the benchmark during the Period:
-
Yield Curve Positioning/Duration: Relative to the benchmark, the allocation and selection to bonds with a stated maturity of 16-18 years, the allocation to bonds 6-10 years, the allocation and selection of bonds 0-2 years and the allocation to Cash were the primary factors contributing to the Fund’s underperformance. The allocation to bonds in 2-6 years and 10-12 years were secondary contributors to the Fund’s underperformance. Conversely, the Fund’s allocation to bonds in 18+ years and 12-14 years were the primary positive contributors to the Fund’s performance. Examining effective durations, the Fund’s allocation and selection to bonds with durations of 0-1 years and the allocation to Cash were the primary negative contributors to the Fund’s underperformance. The allocation to bonds in 1-3 years and the allocation and selection to bonds in 3-5 years were secondary contributors to the Fund’s underperformance. The selection of bonds in 7-10 years was the primary source of positive performance relative to the benchmark.
-
Interest Rate Hedge: During the reporting period the use of Treasury futures to hedge interest rate risk was a minor negative contributor to the Fund’s performance.
-
Credit Rating: The Fund’s selection of AA rated, and A rated bonds and the allocation to Cash were the primary contributors to the Fund’s underperformance relative to the benchmark. The Fund’s allocation and selection in AAA rated bonds was the primary positive contributor to the Fund’s performance relative to the benchmark.
-
Sector/Industry: During the Period, the selection in Housing and Industrial Development bonds, the allocation and selection in Local General Obligation bonds and the allocation to Cash, were the primary sources of the Fund’s underperformance. The allocation and selection in Other sector bonds was a secondary negative contributor. The allocation and selection of Special Tax and Healthcare bonds were the primary positive contributors to the Fund’s performance.
-
U.S. Treasury Rate Trends: During the Period, 10-year and 30-year U.S. Treasury yields increased by approximately 36 basis points (“bps”) and 37 bps, respectively, to 4.73% and 5.27%, respectively.
-
New Issue Supply: During the Period, primary market supply increased approximately 2.4% to $581.2 billion compared with $567.5 billion a year ago (SIFMA, Bloomberg, Barclays Research).
-
Municipal Credit Yields: During the Period, according to Municipal Market Data AAA yield curve data, 10-year municipal yields increased 5 bps while 30-year municipal yields decreased by 16 bps to 3.37% and 4.51%, respectively.
-
Municipal Credit Spreads: During the Period, credits spreads tightened for A, BBB, and high yield municipals by approximately 7 bps, 13 bps, and 24 bps, respectively.
-
Industry Fund Flows: During the Period, according to data collected by the Investment Company Institute and Bloomberg, fund outflows totaled approximately $53 billion. The municipal asset class is highly driven by retail demand. This demand for bonds causes credit spreads to tighten and yields to decline. Both are additive to performance.
FUND PERFORMANCE (May 12, 2021 to July 31, 2026)
The performance line graph below shows the performance of a hypothetical $10,000 initial investment in the Fund over a ten-year period (or for the life of the Fund, if shorter). The subsequent account value as of the end of the Period is listed next to the name of the Fund or index, as applicable. The performance table below shows the average annual total returns of the Fund for the past one-, five-, and ten-year periods, as applicable (or for the life of the Fund, if shorter), as of the end of the Period. Both the line graph and performance table compare the Fund’s performance to an appropriate broad-based index and may compare to additional indices reflecting the market segment(s) in which the Fund invests over the same periods.
Investment Performance of $10,000
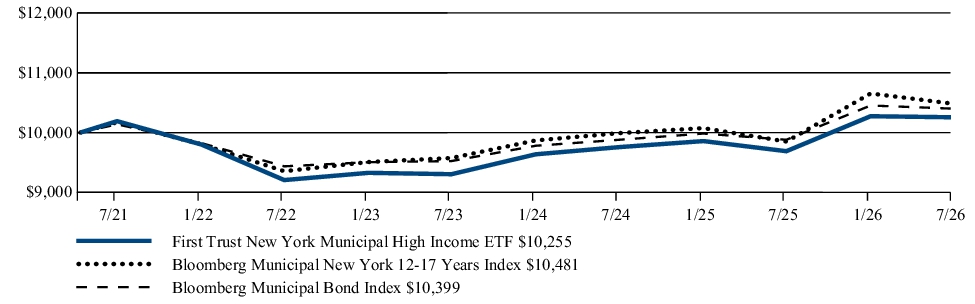
| Average Annual Total Returns (as of July 31, 2026) | 1 Year | 5 Year | Since Inception (5/12/21) |
| First Trust New York Municipal High Income ETF | 5.85% | 0.13% | 0.48% |
| Bloomberg Municipal New York 12-17 Years Index | 6.43% | 0.60% | 0.91% |
| Bloomberg Municipal Bond Index | 5.27% | 0.51% | 0.75% |
Visit www.ftportfolios.com/etf/FMNY for more recent performance information.
KEY FUND STATISTICS (As of July 31, 2026)
| Fund net assets | $38,088,329 |
| Total number of portfolio holdings | 110 |
| Total advisory fee paid | $163,705 |
| Portfolio turnover rate | 24% |
WHAT DID THE FUND INVEST IN? (As of July 31, 2026)
The tables below show the investment makeup of the Fund, representing the percentage of total investments of the Fund.
Sector Allocation
| Dedicated Tax | 12.8% |
| Higher Education | 12.0% |
| Insured | 8.4% |
| Hospital | 7.8% |
| Industrial Development Bond | 6.8% |
| Water & Sewer | 5.5% |
| Utility | 5.4% |
| Government Obligation Bond - Unlimited Tax | 5.4% |
| Certificates of Participation | 5.1% |
| All Other | 30.8% |
Credit Quality (1)
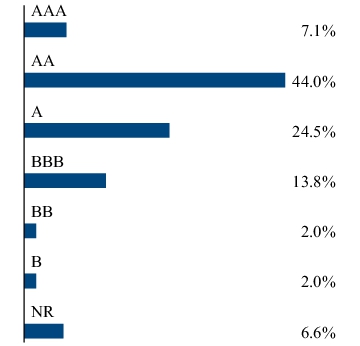
(1) The credit quality and ratings information presented above reflect the ratings assigned by one or more nationally recognized statistical rating organizations (NRSROs), including S&P Global Ratings, Moody’s Investors Service, Inc., Fitch Ratings or a comparably rated NRSRO. For situations in which a security is rated by more than one NRSRO and the ratings are not equivalent, the highest rating is used. Sub-investment grade ratings are those rated BB+/Ba1 or lower. Investment grade ratings are those rated BBB-/Baa3 or higher. “NR” indicates no rating. The credit ratings shown relate to the creditworthiness of the issuers of the underlying securities in the Fund, and not to the Fund or its shares. Credit ratings are subject to change.
HOW HAS THE FUND MATERIALLY CHANGED?
This is a summary of certain changes to the Fund since August 1, 2025. For more complete information, you may review the Fund’s prospectus and any applicable supplements at www.ftportfolios.com/fund-documents/etf/FMNY or upon request at 1-800-621-1675 or info@ftportfolios.com.
Effective February 1, 2026, the Fund’s annual unitary management fee was reduced from 0.65% to 0.49% of the Fund’s average daily net assets. Additionally, the Fund is no longer eligible for any breakpoint discounts described in the Fund’s prospectus or statement of additional information.
Effective February 1, 2026, the Fund’s annual unitary management fee was reduced from 0.65% to 0.49% of the Fund’s average daily net assets. Additionally, the Fund is no longer eligible for any breakpoint discounts described in the Fund’s prospectus or statement of additional information.
This is a summary of certain changes to the Fund since August 1, 2025. For more complete information, you may review the Fund’s prospectus and any applicable supplements at www.ftportfolios.com/fund-documents/etf/FMNY or upon request at 1-800-621-1675 or info@ftportfolios.com.
| [1] | Includes extraordinary expenses. If these extraordinary expenses were not included, the expense ratio would have been 0.80%. |
| [2] | Includes extraordinary expenses. If these extraordinary expenses were not included, the expense ratio would have been 0.70%. |
| [3] | Excludes any Acquired Fund Fees and Expenses of the underlying investment companies in which the Fund invests. |
| [4] | Includes dividend expense on investments sold short. |
| [5] | Includes extraordinary expenses. If these extraordinary expenses were not included, the expense ratio would have been 0.80%. |