ADDITIONAL INFORMATION
This contains important information about the Ranger Small Cap Fund – RFISX (the “Fund”) for the period August 1, 2025 to July 31, 2026.
You can find additional information about the Fund at https://spendlifewiselyfunds.com/documents/. You can also request this information by contacting us at 1-866-458-4744.
expense Information
What were the Fund costs for the past year?
(based on a hypothetical $10,000 investment)
| Fund Name | Costs of a $10,000 investment | Costs paid as a percentage of a $10,000 investment |
| Ranger Small Cap Fund | $120 | 1.17% |
managment’s discussion of fund performance
The recent market environment was defined by geopolitical uncertainty, higher energy prices, shifting expectations for monetary policy, and continued strength in companies tied to the AI infrastructure build-out. The conflict with Iran drove oil prices higher in the first half of 2026 and refocused investor attention on the Strait of Hormuz as a source of global supply disruption. Oil prices remain an important swing factor for both inflation and consumer spending, particularly if elevated gasoline prices persist long enough to pressure household budgets. Recent inflation data reflected some pass-through from higher energy prices as headline CPI accelerated in the first half of 2026. As investors reassessed inflation expectations, bond yields moved higher, with the 30-year Treasury yield reaching over 5.2% in late July, its highest level in 19 years. The increase in long-term rates bears watching, as higher yields can raise the cost of capital and pressure valuation multiples for longer-duration assets. To date, however, equity returns have shrugged off the headwind from higher rates, suggesting investors remain focused on earnings visibility, nominal growth, and the durability of secular investment cycles.
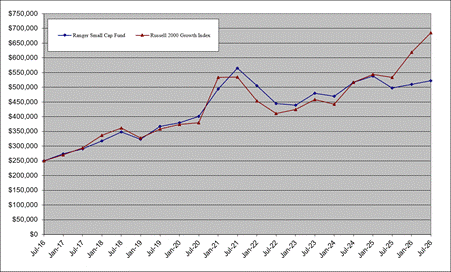
For the fiscal year the Fund returned 5.01% compared with the Russell 2000 Growth index return of 28.42%. Underperformance was due to unprecedented leadership by low-quality companies in the index. For example, non-earning biotech and pharma stocks in the benchmark returned over 102% for the twelve months ended July 31, and non-earning companies across all sectors in the benchmark returned 39%. Most stocks in these categories don’t meet our quality investment criteria, and their performance was a meaningful headwind this fiscal year. On a sector basis, the healthcare and technology sectors were the weakest contributors to performance, while energy was strongest.
The path of monetary policy is now less straightforward than it appeared a year ago. The Fed is balancing renewed inflation risks against signs of more moderate growth, while the bond market is demanding greater compensation for inflation and fiscal uncertainty. Credit spreads remain tight, suggesting the move in yields has been driven more by inflation and policy concerns than by deteriorating public-company credit conditions. For quality growth companies with strong balance sheets, durable margins, and self-funded growth, the environment should continue to reward discipline.
We continue to see meaningful opportunity in the AI infrastructure build-out, but we are looking more deliberately at companies beyond the most obvious hardware beneficiaries. The first phase of the trade rewarded semiconductors, memory, and other direct beneficiaries. As the build-out becomes larger and more complex, we believe investors will increasingly focus on the physical and operational constraints around data center development. These opportunities include critical infrastructure and services required to support the expansion of data center capacity.
Performance graph
AVERAGE ANNUAL RETURNS
| 1 Year | 5 Years | 10 Years | Ending Value | |
| Ranger Small Cap Fund | 5.01% | -1.57% | 7.64% | $521,943 |
| Russell 2000® Growth Index | 28.42% | 5.07% | 10.59% | $684,421 |
Cumulative Performance Comparison of $250,000 Investment
Past performance is not a good predictor of future performance. The returns shown do not reflect taxes that a shareholder would pay on Fund distributions or on the redemption of Fund shares. Updated performance data current to the most recent month-end can be obtained by calling 1-866-458-4744.
Fund statistics
| PORTFOLIO | PORTFOLIO | ADVISORY FEES | |
| NET ASSETS: | HOLDINGS: | TURNOVER: | PAID BY FUND, NET: |
| $12,260,251 | 61 | 64.33% | $91,235 |
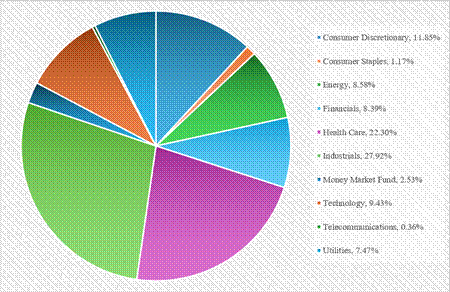
SECTOR WEIGHTINGS
The following chart gives a visual breakdown of the Fund by the sectors the underlying securities represent as a percentage of the portfolio of investments.
top ten holdings (% Of Net Assets)*
| 1. | Ligand Pharmaceuticals, Inc. Class B | 4.53% |
| 2. | SharkNinja, Inc. | 3.39% |
| 3. | UL Solutions, Inc. Class A | 3.34% |
| 4. | Oceaneering International, Inc. | 3.17% |
| 5. | Chime Financial, Inc. Class A | 2.87% |
| 6. | HealthEquity, Inc. | 2.80% |
| 7. | PDF Solutions, Inc. | 2.68% |
| 8. | Triumph Financial, Inc. | 2.51% |
| 9. | Casella Waste Systems, Inc. Class A | 2.50% |
| 10. | Excelerate Energy, Inc. Class A | 2.49% |
| Total % of Net Assets | 30.28% |
* Excludes Short-Term Investments.
ADDITIONAL INFORMATION
This contains important information about the Ranger Micro Cap Fund – RFIMX (the “Fund”) for the period August 1, 2025 to July 31, 2026.
You can find additional information about the Fund at https://spendlifewiselyfunds.com/documents/. You can also request this information by contacting us at 1-866-458-4744.
expense Information
What were the Fund costs for the past year?
(based on a hypothetical $10,000 investment)
| Fund Name | Costs of a $10,000 investment | Costs paid as a percentage of a $10,000 investment |
| Ranger Micro Cap Fund | $145 | 1.30% |
managment’s discussion of fund performance
The recent market environment was defined by geopolitical uncertainty, higher energy prices, shifting expectations for monetary policy, and continued strength in companies tied to the AI infrastructure build-out. The conflict with Iran drove oil prices higher in the first half of 2026 and refocused investor attention on the Strait of Hormuz as a source of global supply disruption. Oil prices remain an important swing factor for both inflation and consumer spending, particularly if elevated gasoline prices persist long enough to pressure household budgets. Recent inflation data reflected some pass-through from higher energy prices as headline CPI accelerated in the first half of 2026. As investors reassessed inflation expectations, bond yields moved higher, with the 30-year Treasury yield reaching over 5.2% in late July, its highest level in 19 years. The increase in long-term rates bears watching, as higher yields can raise the cost of capital and pressure valuation multiples for longer-duration assets. To date, however, equity returns have shrugged off the headwind from higher rates, suggesting investors remain focused on earnings visibility, nominal growth, and the durability of secular investment cycles.
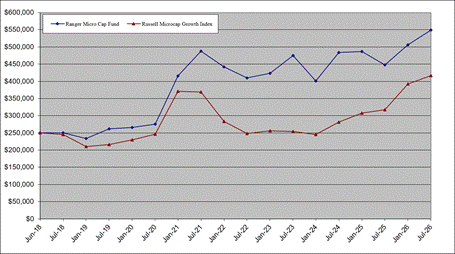
For the fiscal year the Fund returned 22.58% compared with the Russell Microcap Growth index return of 31.4%. Underperformance was due to unprecedented leadership by low-quality companies in the index. For example, non-earning biotech and pharma stocks in the benchmark returned over 86% for the twelve months ended July 31, and non-earning companies across all sectors in the benchmark returned over 52%. Most stocks in these categories don’t meet our quality investment criteria, and their performance was a meaningful headwind this fiscal year. On a sector basis, the healthcare and consumer discretionary sectors were the weakest contributors to performance, while industrials and energy were strongest.
The path of monetary policy is now less straightforward than it appeared a year ago. The Fed is balancing renewed inflation risks against signs of more moderate growth, while the bond market is demanding greater compensation for inflation and fiscal uncertainty. Credit spreads remain tight, suggesting the move in yields has been driven more by inflation and policy concerns than by deteriorating public-company credit conditions. For quality growth companies with strong balance sheets, durable margins, and self-funded growth, the environment should continue to reward discipline.
We continue to see meaningful opportunity in the AI infrastructure build-out, but we are looking more deliberately at companies beyond the most obvious hardware beneficiaries. The first phase of the trade rewarded semiconductors, memory, and other direct beneficiaries. As the build-out becomes larger and more complex, we believe investors will increasingly focus on the physical and operational constraints around data center development. These opportunities include critical infrastructure and services required to support the expansion of data center capacity.
Performance graph
AVERAGE ANNUAL RETURNS
| 1 Year | 5 Years | Since Inception | Ending Value | |
| Ranger Micro Cap Fund | 22.58% | 2.42% | 10.14% | $549,099 |
| Russell Microcap® Growth Index | 31.43% | 2.46% | 6.46% | $416,468 |
Cumulative Performance Comparison of $250,000 Investment
Past performance is not a good predictor of future performance. The returns shown do not reflect taxes that a shareholder would pay on Fund distributions or on the redemption of Fund shares. Updated performance data current to the most recent month-end can be obtained by calling 1-866-458-4744.
Fund statistics
| PORTFOLIO | PORTFOLIO | ADVISORY FEES | |
| NET ASSETS: | HOLDINGS: | TURNOVER: | PAID BY FUND, NET: |
| $11,652,137 | 49 | 52.71% | $29,978 |
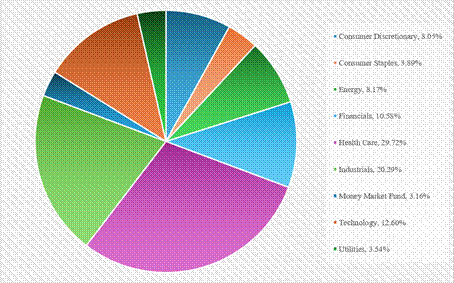
SECTOR WEIGHTINGS
The following chart gives a visual breakdown of the Fund by the sectors the underlying securities represent as a percentage of the portfolio of investments.
top ten holdings (% of Net Assets) *
| 1. | Ligand Pharmaceuticals, Inc. Class B | 5.60% |
| 2. | PDF Solutions, Inc. | 4.05% |
| 3. | Karat Packaging, Inc. | 4.01% |
| 4. | Pennant Group, Inc. | 3.49% |
| 5. | Business First Bancshares, Inc. | 3.10% |
| 6. | Phibro Animal Health Corp. Class A | 3.07% |
| 7. | iRadimed Corp. | 3.06% |
| 8. | Metropolitan Bank Holding Corp. | 2.94% |
| 9. | UFP Technologies, Inc. | 2.79% |
| 10. | Triumph Financial, Inc. | 2.72% |
| Total % of Net Assets | 34.83% |
* Excludes Short-Term Investments.