Pay vs Performance Disclosure - USD ($)
Dec. 31, 2025
Dec. 31, 2024
Dec. 31, 2023
Pay Versus Performance Table
In accordance with rules adopted by the Securities and Exchange Commission (“SEC”), we are providing the following disclosure regarding executive “compensation actually paid,” presented in a manner consistent with the rules applicable to smaller reporting companies. The amounts in the table below are calculated in accordance with SEC rules and do not represent amounts actually earned or realized by our named executive officers (“NEOs”).
Year | Summary Compensation Table Total for PEO (George Ng) ($) | Compensation Actually Paid to PEO (George Ng) ($)(a) | Average Summary Compensation Table Total for Non-PEO NEOs ($)(b) | Average Compensation Actually Paid to Non-PEO NEOs ($)(c) | Value of Initial Fixed $100 Investment Based on the Total Shareholder Return of the Company ($)(d) | Net Income (Loss) ($ in thousands)(e) | ||||||||||||
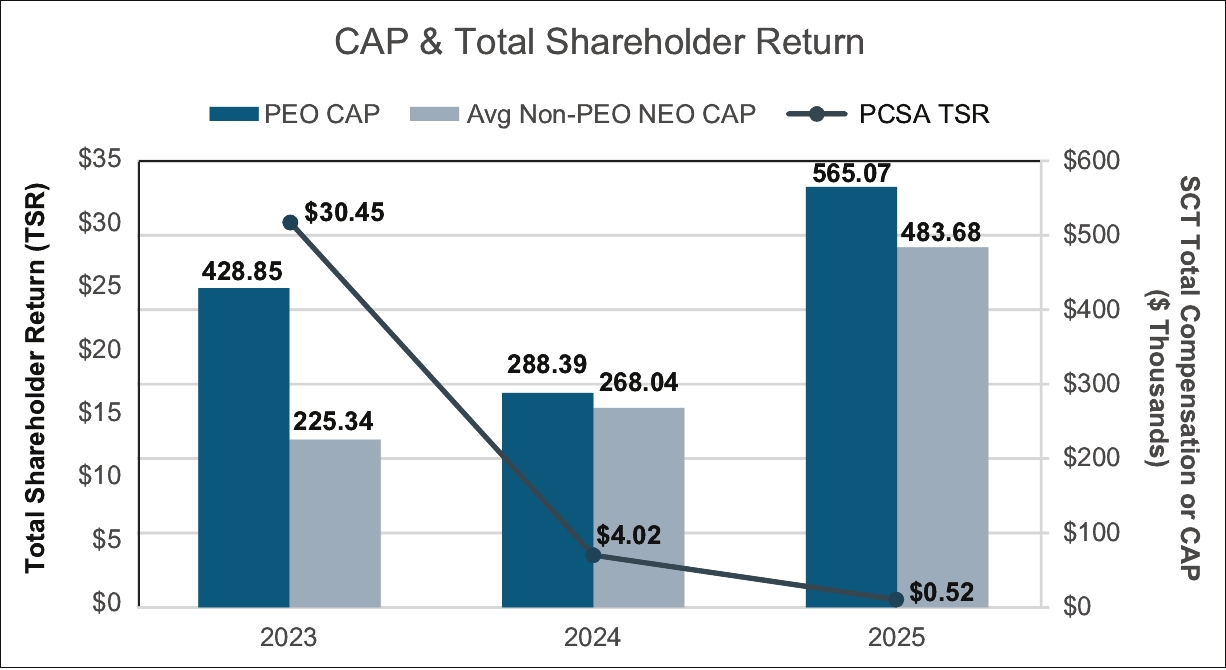
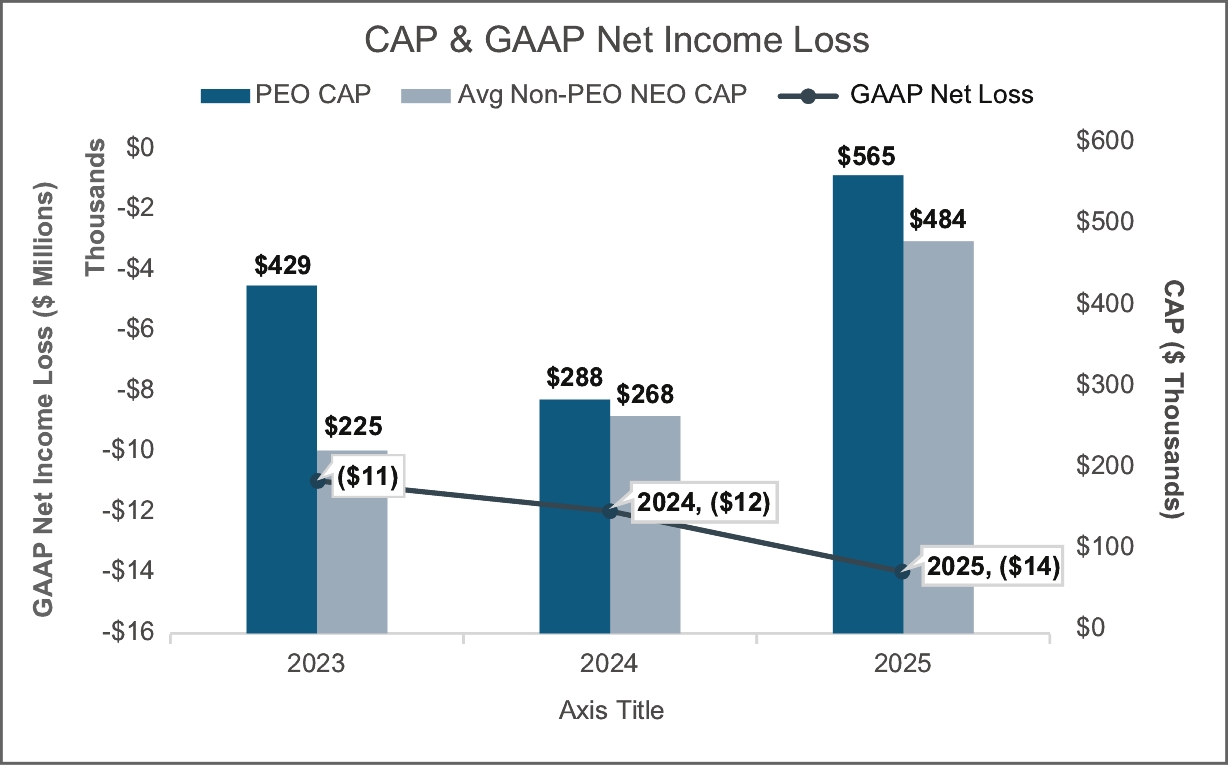
2025 | 673,303 | 565,067 | 530,986 | 483,683 | 2 | (13,564) | ||||||||||||
2024 | 521,033 | 288,393 | 286,239 | 268,038 | 13 | (11,850) | ||||||||||||
2023 | 472,849 | 428,849 | 321,702 | 225,343 | 100 | (11,122) | ||||||||||||
(a) | Compensation actually paid (“CAP”) reflect the adjustments listed in the tables below to the amounts reported in the Summary Compensation Table for our PEO. |
George Ng:
Year | 2023 | 2024 | 2025 | ||||||
SCT Total Compensation ($) | 472,849 | 521,033 | 673,303 | ||||||
Less: Stock and Option Award Values Reported in SCT for the Covered Year ($) | (312,000) | — | (199,373) | ||||||
Plus: Fair Value for Stock and Option Awards Granted in the Covered Year that are Outstanding and Unvested at End of Year ($) | 268,000 | — | 115,047 | ||||||
Change in Fair Value of Outstanding Unvested Stock and Option Awards from Prior Years ($) | — | (180,930) | (3,364) | ||||||
Fair Value as of Vesting Date for Awards Granted that Vested in Same Year ($) | — | — | — | ||||||
Change in Fair Value of Stock and Option Awards from Prior years that Vested in the Covered Year ($) | — | (51,710) | (20,546) | ||||||
Less: Fair Value of Stock and Option Awards Forfeited during the covered Year ($) | — | — | — | ||||||
Less: Aggregate Change in Actuarial Present Value of Accumulated Benefit Under Pension Plans ($) | — | — | — | ||||||
Plus: Aggregate Service Cost and Prior Service Cost for Pension Plans ($) | — | — | — | ||||||
Compensation Actually Paid ($) | 428,849 | 288,393 | 565,067 | ||||||
(b) | The average figures shown include Russell Skibsted and Sian Bigora. |
(c) | Compensation actually paid (CAP) to our non-PEO NEOs reflects the respective amounts set forth in column (d) of the table above, adjusted as set forth in the table below. The assumptions used to calculate the fair values did not differ materially from the assumptions used to calculate the fair values as of the grant dates. |
Year | 2023 | 2024 | 2025 | ||||||
Non-PEO NEOs | See column(c) note above | See column (c) note above | See column (c) note above | ||||||
SCT Total Compensation ($) | 321,702 | 286,239 | 530,986 | ||||||
Less: Stock and Option Award Values Reported in SCT for the Covered Year ($) | (136,837) | (31,742) | (79,495) | ||||||
Plus: Fair Value for Stock and Option Awards Granted in the Covered Year ($) | 41,708 | 15,261 | 45,839 | ||||||
Change in Fair Value of Outstanding Unvested Stock and Option Awards from Prior Years ($) | (596) | (298) | (3,287) | ||||||
Fair Value as of Vesting Date for Awards Granted that Vested in Same Year ($) | — | 759 | — | ||||||
Change in Fair Value of Stock and Option Awards from Prior years that Vested in the Covered Year ($) | (634) | (2,181) | (10,360) | ||||||
Less: Fair Value of Stock and Option Awards Forfeited during the covered Year ($) | — | — | — | ||||||
Less: Aggregate Change in Actuarial Present Value of Accumulated Benefit Under Pension Plans ($) | — | — | — | ||||||
Plus: Aggregate Service Cost and Prior Service Cost for Pension Plans ($) | — | — | — | ||||||
Compensation Actually Paid ($) | 225,343 | 268,038 | 483,683 | ||||||
(d) | Total shareholder return is determined on the value of an initial fixed investment of $100 in our common stock as of January 1, 2023. |
(e) | Reflects “Net Income” in the company’s audited financial statement included in our Annual Reports on Form 10-K for each of the years ended December 31, 2023, 2024 and 2025. |
(b) | The average figures shown include Russell Skibsted and Sian Bigora. |
(a) | Compensation actually paid (“CAP”) reflect the adjustments listed in the tables below to the amounts reported in the Summary Compensation Table for our PEO. |
George Ng:
Year | 2023 | 2024 | 2025 | ||||||
SCT Total Compensation ($) | 472,849 | 521,033 | 673,303 | ||||||
Less: Stock and Option Award Values Reported in SCT for the Covered Year ($) | (312,000) | — | (199,373) | ||||||
Plus: Fair Value for Stock and Option Awards Granted in the Covered Year that are Outstanding and Unvested at End of Year ($) | 268,000 | — | 115,047 | ||||||
Change in Fair Value of Outstanding Unvested Stock and Option Awards from Prior Years ($) | — | (180,930) | (3,364) | ||||||
Fair Value as of Vesting Date for Awards Granted that Vested in Same Year ($) | — | — | — | ||||||
Change in Fair Value of Stock and Option Awards from Prior years that Vested in the Covered Year ($) | — | (51,710) | (20,546) | ||||||
Less: Fair Value of Stock and Option Awards Forfeited during the covered Year ($) | — | — | — | ||||||
Less: Aggregate Change in Actuarial Present Value of Accumulated Benefit Under Pension Plans ($) | — | — | — | ||||||
Plus: Aggregate Service Cost and Prior Service Cost for Pension Plans ($) | — | — | — | ||||||
Compensation Actually Paid ($) | 428,849 | 288,393 | 565,067 | ||||||
(c) | Compensation actually paid (CAP) to our non-PEO NEOs reflects the respective amounts set forth in column (d) of the table above, adjusted as set forth in the table below. The assumptions used to calculate the fair values did not differ materially from the assumptions used to calculate the fair values as of the grant dates. |
Year | 2023 | 2024 | 2025 | ||||||
Non-PEO NEOs | See column(c) note above | See column (c) note above | See column (c) note above | ||||||
SCT Total Compensation ($) | 321,702 | 286,239 | 530,986 | ||||||
Less: Stock and Option Award Values Reported in SCT for the Covered Year ($) | (136,837) | (31,742) | (79,495) | ||||||
Plus: Fair Value for Stock and Option Awards Granted in the Covered Year ($) | 41,708 | 15,261 | 45,839 | ||||||
Change in Fair Value of Outstanding Unvested Stock and Option Awards from Prior Years ($) | (596) | (298) | (3,287) | ||||||
Fair Value as of Vesting Date for Awards Granted that Vested in Same Year ($) | — | 759 | — | ||||||
Change in Fair Value of Stock and Option Awards from Prior years that Vested in the Covered Year ($) | (634) | (2,181) | (10,360) | ||||||
Less: Fair Value of Stock and Option Awards Forfeited during the covered Year ($) | — | — | — | ||||||
Less: Aggregate Change in Actuarial Present Value of Accumulated Benefit Under Pension Plans ($) | — | — | — | ||||||
Plus: Aggregate Service Cost and Prior Service Cost for Pension Plans ($) | — | — | — | ||||||
Compensation Actually Paid ($) | 225,343 | 268,038 | 483,683 | ||||||