Exhibit 99.70
GUNNISON PROJECT Form 43-101F1 Technical Report |
DATE AND SIGNATURES PAGE
The effective date of this report is March 18, 2026. The issue date of this report is March 31, 2026. See Appendix A, Preliminary Economic Assessment Contributors and Professional Qualifications, for certificates of qualified persons. These certificates are considered the date and signature of this report in accordance with Form 43-101F1.
 | M3-PN210313.007 31 March 2026 Revision 0 | ii |
GUNNISON PROJECT Form 43-101F1 Technical Report |
GUNNISON PROJECT
FORM 43-101F1 TECHNICAL REPORT
TABLE OF CONTENTS
| SECTION | PAGE | ||
| DATE AND SIGNATURES PAGE | II | ||
| TABLE OF CONTENTS | III | ||
| LIST OF FIGURES AND ILLUSTRATIONS | XII | ||
| LIST OF TABLES | XVI | ||
| 1 | EXECUTIVE SUMMARY | 1 | |
| 1.1 | KEY DATA | 1 | |
| 1.2 | PROPERTY DESCRIPTION AND LOCATION | 2 | |
| 1.3 | ACCESSIBILITY, CLIMATE, LOCAL RESOURCES, INFRASTRUCTURE AND PHYSIOGRAPHY | 4 | |
| 1.4 | HISTORY | 4 | |
| 1.5 | GEOLOGICAL SETTING AND MINERALIZATION | 5 | |
| 1.6 | DEPOSIT TYPES | 5 | |
| 1.7 | EXPLORATION | 5 | |
| 1.8 | DRILLING | 6 | |
| 1.9 | SAMPLE PREPARATION, ANALYSIS AND SECURITY | 6 | |
| 1.10 | DATA VERIFICATION | 6 | |
| 1.11 | MINERAL PROCESSING AND METALLURGICAL TESTING | 7 | |
| 1.12 | MINERAL RESOURCE ESTIMATE | 8 | |
| 1.13 | MINERAL RESERVE ESTIMATE | 9 | |
| 1.14 | MINING METHODS | 9 | |
| 1.14.1 | Pit Dewatering | 10 | |
| 1.15 | RECOVERY METHODS | 10 | |
| 1.15.1 | Open Pit-Heap Leach Recovery Methods | 10 | |
| 1.16 | PROJECT INFRASTRUCTURE | 11 | |
| 1.17 | MARKET STUDIES AND CONTRACTS | 12 | |
| 1.18 | ENVIRONMENTAL AND PERMITTING | 12 | |
| 1.19 | CAPITAL AND OPERATING COSTS | 13 | |
| 1.19.1 | Capital Costs | 13 | |
| 1.19.2 | Operating Cost (Opex) | 16 | |
| 1.20 | ECONOMIC ANALYSIS | 20 | |
| 1.20.1 | Plant Production Statistics | 20 | |
| M3-PN210313.007 31 March 2026 Revision 0 | iii |
GUNNISON PROJECT Form 43-101F1 Technical Report |
| SECTION | PAGE | ||
| 1.20.2 | Copper Sales | 20 | |
| 1.20.3 | Working Capital | 20 | |
| 1.20.4 | Revenue | 20 | |
| 1.20.5 | Royalty | 20 | |
| 1.20.6 | Property and Severance Taxes | 21 | |
| 1.20.7 | Reclamation and Closure | 21 | |
| 1.20.8 | Income Taxes | 21 | |
| 1.20.9 | Net Present Value (NPV) and Internal Rate of Return (IRR) | 21 | |
| 1.21 | ADJACENT PROPERTIES | 23 | |
| 1.22 | INTERPRETATION AND CONCLUSIONS | 24 | |
| 1.22.1 | Risks | 24 | |
| 1.22.2 | Opportunities | 26 | |
| 1.23 | RECOMMENDATIONS | 27 | |
| 2 | INTRODUCTION | 28 | |
| 2.1 | LIST OF QUALIFIED PERSONS | 30 | |
| 2.2 | DEFINITIONS OF TERMS USED IN THIS TECHNICAL REPORT | 31 | |
| 2.3 | UNITS AND ABBREVIATIONS | 31 | |
| 3 | RELIANCE ON OTHER EXPERTS | 35 | |
| 4 | PROPERTY DESCRIPTION AND LOCATION | 36 | |
| 4.1 | UNPATENTED MINING CLAIMS | 39 | |
| 4.2 | STATE MINERAL LEASE AND PROSPECTING PERMITS | 40 | |
| 4.3 | “CONNIE JOHNSON” DEED | 40 | |
| 4.4 | FEE SIMPLE LAND | 40 | |
| 4.5 | ADDITIONAL ROYALTIES | 41 | |
| 4.5.1 | Greenstone Royalty | 41 | |
| 4.5.2 | Triple Flag | 41 | |
| 4.5.3 | Callinan Royalty | 42 | |
| 4.5.4 | Bowlin Royalty | 42 | |
| 4.5.5 | RG Royalties | 42 | |
| 4.6 | ENVIRONMENT AND PERMITTING | 43 | |
| 4.6.1 | Gunnison Project | 43 | |
| 4.7 | OTHER SIGNIFICANT RISK FACTORS | 43 | |
| 5 | ACCESSIBILITY, CLIMATE, LOCAL RESOURCES, INFRASTRUCTURE AND PHYSIOGRAPHY | 44 | |
| 6 | HISTORY | 46 | |
| 6.1 | 1993 TO 1998: MAGMA COPPER AND PHELPS DODGE | 46 | |
| 6.2 | 1999 - 2006 | 47 | |
| 6.3 | 2007 - 2010: AZTECH MINERALS | 47 | |
| 6.4 | HISTORICAL RESOURCE ESTIMATES | 47 | |
| M3-PN210313.007 31 March 2026 Revision 0 | iv |
GUNNISON PROJECT Form 43-101F1 Technical Report |
| SECTION | PAGE | ||
| 6.5 | ISR DEVELOPMENT PLAN | 48 | |
| 6.6 | STRONG & HARRIS PROJECT EXPLORATION HISTORY | 48 | |
| 6.6.1 | 1954-1957 Coronado Copper and Zinc Co | 48 | |
| 6.6.2 | 1964 - 1972 Cyprus Mining | 48 | |
| 6.6.3 | 1967 - 1971 Continental Exploration | 48 | |
| 6.6.4 | 1971 - 1976 Superior Oil Company | 49 | |
| 6.6.5 | 1980 New Beginnings Resources | 49 | |
| 6.6.6 | 1985-1988 Robert Durham | 49 | |
| 6.6.7 | 1988 - 1989 Arizona Copper Company (“AZCO”) | 49 | |
| 6.6.8 | 1991-1992 AZCO and Manzanita Hills Inc | 49 | |
| 6.6.9 | 2019 - 2026 Gunnison Copper | 49 | |
| 7 | GEOLOGICAL SETTING AND MINERALIZATION | 50 | |
| 7.1 | REGIONAL GEOLOGY | 51 | |
| 7.2 | GUNNISON DEPOSIT GEOLOGY | 53 | |
| 7.2.1 | Limestone and Marble Overburden at Gunnison | 54 | |
| 7.2.2 | Structural Framework of the Gunnison Deposit | 55 | |
| 7.3 | GUNNISON MINERALIZATION | 56 | |
| 7.4 | ONGOING MODELING AND ANALYSIS | 60 | |
| 7.5 | STRONG & HARRIS DEPOSIT GEOLOGY | 61 | |
| 7.6 | STRONG & HARRIS MINERALIZATION | 63 | |
| 8 | DEPOSIT TYPES | 65 | |
| 8.1 | GUNNISON DEPOSIT TYPES | 65 | |
| 8.2 | STRONG & HARRIS DEPOSIT TYPES | 66 | |
| 9 | EXPLORATION | 68 | |
| 9.1.1 | Structural Logging | 68 | |
| 9.1.2 | Down-hole Geophysical Surveys | 68 | |
| 9.1.3 | Fracture Mapping | 69 | |
| 9.1.4 | Structural Analysis | 70 | |
| 9.2 | STRONG & HARRIS EXPLORATION | 72 | |
| 9.2.1 | Historical Data Compilation | 72 | |
| 9.2.2 | Geologic Mapping | 73 | |
| 9.2.3 | GCC Re-Sampling of Historical Drill Core | 73 | |
| 9.2.4 | GCC Geophysics | 73 | |
| 10 | DRILLING | 74 | |
| 10.1 | HISTORICAL DRILLING | 74 | |
| 10.1.1 | Historical Collar Position Surveys | 76 | |
| 10.1.2 | Historical Down - Hole Surveys | 76 | |
| 10.2 | GCC DRILLING 2010 - 2015 | 76 | |
| 10.2.1 | GCC Drill Logging and Sampling Procedures | 80 | |
| M3-PN210313.007 31 March 2026 Revision 0 | v |
GUNNISON PROJECT Form 43-101F1 Technical Report |
| SECTION | PAGE | ||
| 10.2.2 | GCC Core Recovery and RQD | 80 | |
| 10.3 | GCC WELL DRILLING 2018-2019 | 81 | |
| 10.4 | GCC DRILLING SUMMARY STATEMENT | 81 | |
| 10.5 | STRONG & HARRIS DRILLING | 83 | |
| 10.5.1 | Summary | 83 | |
| 10.5.2 | 1954 - 1957 Historical Drilling by Coronado Copper and Zinc Co | 85 | |
| 10.5.3 | 1965 - 1968 Historical Drilling by Cyprus Mining | 85 | |
| 10.5.4 | 1968 - 1970 or 1971 Historical Drilling by Continental Exploration | 85 | |
| 10.5.5 | 1971 - 1976 Historical Drilling by Superior Oil Company | 85 | |
| 10.5.6 | Historical Drilling by New Beginnings Resources | 85 | |
| 10.5.7 | Historical Drilling by Robert C. Durham | 85 | |
| 10.5.8 | Historical Drilling by AZCO/Granges Inc | 85 | |
| 10.6 | DRILL-HOLE COLLAR SURVEYS | 85 | |
| 10.7 | DOWN-HOLE SURVEYS | 86 | |
| 10.8 | SUMMARY STATEMENT | 86 | |
| 11 | SAMPLE PREPARATION, ANALYSES AND SECURITY | 87 | |
| 11.1 | HISTORICAL SAMPLE PREPARATION, ANALYSIS AND SECURITY | 87 | |
| 11.2 | GCC SAMPLE PREPARATION, ANALYSES AND SECURITY | 87 | |
| 11.2.1 | GCC Analytical Methods | 88 | |
| 11.2.2 | GCC Sample Security | 88 | |
| 11.3 | GUNNISON QUALITY ASSURANCE/QUALITY CONTROL PROGRAMS | 88 | |
| 11.3.1 | Historical QA/QC | 88 | |
| 11.3.2 | GCC QA/QC | 88 | |
| 11.3.3 | Certified Standards | 89 | |
| 11.3.4 | Coarse Blanks | 91 | |
| 11.3.5 | Field Duplicates | 91 | |
| 11.3.6 | Replicate Analyses | 93 | |
| 11.3.7 | Check Assays | 95 | |
| 11.3.8 | GCC Inter - Laboratory Check Program | 97 | |
| 11.3.9 | Summary of GCC QA/QC Results | 98 | |
| 11.3.10 | Gunnison QA/QC Recommendations | 99 | |
| 11.4 | STRONG & HARRIS SAMPLE PREPARATION, ANALYSIS, AND SECURITY | 99 | |
| 11.4.1 | Historical Sample Preparation and Analysis | 99 | |
| 11.4.2 | GCC 2021 Sample Preparation and Analysis | 100 | |
| 11.4.3 | Sample Security | 100 | |
| 11.4.4 | Quality Assurance/Quality Control | 100 | |
| 11.4.5 | Summary of Strong & Harris QA/QC Results | 108 | |
| 11.5 | ADEQUACY OF SAMPLE COLLECTION, PREPARATION, SECURITY AND ANALYTICAL PROCEDURES | 108 | |
| 12 | DATA VERIFICATION | 109 | |
| 12.1 | INTRODUCTION | 109 | |
| 12.2 | DATABASE AUDITING | 109 | |
| M3-PN210313.007 31 March 2026 Revision 0 | vi |
GUNNISON PROJECT Form 43-101F1 Technical Report |
| SECTION | PAGE | ||
| 12.2.1 | Collar Table | 109 | |
| 12.2.2 | Survey Table | 110 | |
| 12.2.3 | Assay Table | 110 | |
| 12.2.4 | Resampling of Cyprus - Superior Drill Core | 111 | |
| 12.2.5 | Pulp-Check Analyses and Resampling of Quintana Drill Core | 111 | |
| 12.2.6 | Resampling of Magma Copper Drill Core | 113 | |
| 12.3 | SITE INSPECTIONS | 114 | |
| 12.4 | DISCUSSION OF 2018-2019 PRODUCTION WELLFIELD DRILLING DATA | 114 | |
| 12.5 | GUNNISON DEPOSIT SUMMARY STATEMENT ON DATA VERIFICATION | 115 | |
| 12.6 | STRONG & HARRIS DATA VERIFICATION | 115 | |
| 12.6.1 | Site Visit | 115 | |
| 12.6.2 | Database Verification | 116 | |
| 12.6.3 | Independent Verification of Mineralization | 119 | |
| 12.6.4 | Strong & Harris Summary Statement on Data Verification | 119 | |
| 13 | MINERAL PROCESSING AND METALLURGICAL TESTING | 119 | |
| 13.1 | EARLY LABORATORY TEST PROGRAMS PRE-2006 | 120 | |
| 13.2 | RECENT LABORATORY METALLURGICAL TESTING | 121 | |
| 13.3 | GUNNISON COLUMN TESTS 2013 - 2015 | 124 | |
| 13.4 | RECENT STUDIES TO REDUCE ACID CONSUMPTION AND INCREASE HEAP FEED COPPER GRADE | 129 | |
| 13.5 | GCC MATERIAL SORTING STUDY | 129 | |
| 13.5.1 | Characterization Samples | 130 | |
| 13.5.2 | Bulk Test | 131 | |
| 13.5.3 | Material Sorting Test Summary | 133 | |
| 13.6 | SULFIDE LEACHING | 134 | |
| 13.7 | PREDICTED GUNNISON HEAP LEACHING PERFORMANCE | 134 | |
| 14 | MINERAL RESOURCE ESTIMATES | 136 | |
| 14.1 | INTRODUCTION | 136 | |
| 14.2 | DATA | 138 | |
| 14.3 | DEPOSIT GEOLOGY PERTINENT TO RESOURCE MODELING | 139 | |
| 14.3.1 | Modeling of Geology | 139 | |
| 14.4 | GEOLOGIC AND OXIDATION MODELS | 142 | |
| 14.4.1 | Oxidation Modeling | 143 | |
| 14.4.2 | Fracture - Intensity Modeling | 143 | |
| 14.4.3 | Density Modeling | 144 | |
| 14.4.4 | Total Copper and Soluble Copper Modeling | 146 | |
| 14.4.5 | Cyanide-Soluble Copper Modeling | 151 | |
| 14.5 | DENSITY | 153 | |
| 14.6 | GUNNISON DEPOSIT MINERAL RESOURCES | 153 | |
| M3-PN210313.007 31 March 2026 Revision 0 | vii |
GUNNISON PROJECT Form 43-101F1 Technical Report |
| SECTION | PAGE | ||
| 14.6.1 | Copper Block Model Checks | 159 | |
| 14.6.2 | Comments on the Resource Block Model Estimates | 159 | |
| 14.7 | STRONG & HARRIS DEPOSIT MINERAL RESOURCES | 159 | |
| 14.7.1 | Data | 159 | |
| 14.7.2 | Deposit Geology Pertinent to Resource Block Model | 160 | |
| 14.7.3 | Geologic and Oxidation Models | 160 | |
| 14.7.4 | Density | 160 | |
| 14.7.5 | Mineral Domain Modeling | 161 | |
| 14.7.6 | Assay Coding, Capping, and Compositing | 163 | |
| 14.7.7 | Block Model Coding | 168 | |
| 14.7.8 | Grade Interpolation | 168 | |
| 14.7.9 | Strong & Harris Mineral Resources | 172 | |
| 14.7.10 | Discussion of Resources and Recommendations | 178 | |
| 15 | MINERAL RESERVE ESTIMATES | 179 | |
| 16 | MINING METHODS | 179 | |
| 16.1 | MINE PHASE DESIGN | 181 | |
| 16.2 | DESIGN PARAMETERS | 185 | |
| 16.2.1 | Geotechnical | 185 | |
| 16.2.2 | Tertiary Texas Canyon Quartz Monzonite | 187 | |
| 16.2.3 | Paleozoic rocks | 187 | |
| 16.2.4 | Precambrian rocks | 188 | |
| 16.3 | MINE PRODUCTION SCHEDULE | 188 | |
| 16.3.1 | Material Scheduled to the Primary Crusher | 189 | |
| 16.3.2 | Sorted Material | 190 | |
| 16.3.3 | Waste Material | 191 | |
| 16.3.4 | Limestone Material | 193 | |
| 16.3.5 | Overburden | 193 | |
| 16.4 | CRUSHER | 193 | |
| 16.5 | WASTE STORAGE | 193 | |
| 16.6 | MINE FLEET | 193 | |
| 16.7 | STAFF REQUIREMENTS | 194 | |
| 16.8 | MINE PLAN DRAWINGS | 197 | |
| 16.9 | PIT DEWATERING | 205 | |
| 16.9.1 | Groundwater Flow Model | 205 | |
| 17 | RECOVERY METHODS | 212 | |
| 17.1 | INTRODUCTION | 212 | |
| 17.2 | MATERIAL SORTING | 221 | |
| 17.3 | PRIMARY CRUSHING | 215 | |
| 17.4 | STOCKPILE AND RECLAIM | 215 | |
| M3-PN210313.007 31 March 2026 Revision 0 | viii |
GUNNISON PROJECT Form 43-101F1 Technical Report |
| SECTION | PAGE | ||
| 17.5 | SCREENING PLANT | 215 | |
| 17.6 | MINERALIZED MATERIAL SORTING | 216 | |
| 17.7 | GUNNISON LEACH PAD | 216 | |
| 17.8 | SX-EW PROCESS DESCRIPTION | 220 | |
| 17.8.1 | Solvent Extraction | 220 | |
| 17.8.2 | Electrowinning | 220 | |
| 17.8.3 | Tank Farm | 221 | |
| 17.8.4 | Reagents | 221 | |
| 17.9 | SUPPORTING SYSTEMS | 222 | |
| 17.9.1 | Process Control and Monitoring | 222 | |
| 17.9.2 | Process Ponds | 222 | |
| 18 | PROJECT INFRASTRUCTURE | 224 | |
| 18.1 | ACCESS ROADS | 224 | |
| 18.2 | INTERSTATE 10 RELOCATION | 224 | |
| 18.3 | LEACH PAD & WASTE DUMPS | 226 | |
| 18.4 | PROCESS BUILDINGS | 226 | |
| 18.5 | ANCILLARY FACILITIES | 228 | |
| 18.5.1 | Security Building and Truck Scale | 228 | |
| 18.5.2 | Administration Building and Plant Non-Process Buildings | 228 | |
| 18.5.3 | Mine Services Area | 228 | |
| 18.5.4 | Primary Crusher Pad | 229 | |
| 18.6 | SULFURIC ACID PLANT | 230 | |
| 18.7 | LIMESTONE BY-PRODUCT AND CEMENT PLANT FACILITIES | 231 | |
| 18.7.1 | Limestone Stockpiling and Conveyance | 231 | |
| 18.7.2 | Cement Plant and Limestone Yard | 231 | |
| 18.7.3 | Product Loadout and Logistics | 232 | |
| 18.7.4 | Natural Gas Supply | 232 | |
| 18.8 | RAILROAD FACILITIES | 232 | |
| 18.9 | POWER SUPPLY & DISTRIBUTION | 232 | |
| 18.10 | WATER SUPPLY & DISTRIBUTION | 233 | |
| 18.11 | SANITARY WASTE DISPOSAL | 233 | |
| 18.12 | WASTE MANAGEMENT | 233 | |
| 18.13 | SURFACE WATER CONTROL | 233 | |
| 18.14 | TRANSPORTATION & SHIPPING | 234 | |
| 18.15 | COMMUNICATIONS | 234 | |
| 19 | MARKET STUDIES AND CONTRACTS | 235 | |
| 19.1 | MARKET STUDIES | 235 | |
| M3-PN210313.007 31 March 2026 Revision 0 | ix |
GUNNISON PROJECT Form 43-101F1 Technical Report |
| SECTION | PAGE | ||
| 19.1.1 | Copper Price | 235 | |
| 19.1.2 | Copper Net Premium | 236 | |
| 19.1.3 | Sulfuric Acid Price | 237 | |
| 19.1.4 | Diesel | 242 | |
| 19.2 | CONTRACTS | 243 | |
| 19.3 | CONFIRMATION | 243 | |
| 20 | ENVIRONMENTAL STUDIES, PERMITTING AND SOCIAL OR COMMUNITY IMPACT | 244 | |
| 20.1 | ENVIRONMENTAL STUDIES AND PERMITTING | 244 | |
| 20.2 | WATER AND WASTE MANAGEMENT | 247 | |
| 20.3 | CLOSURE AND RECLAMATION | 248 | |
| 20.4 | COMMUNITY RELATIONS | 249 | |
| 20.5 | ECONOMIC BENEFITS | 249 | |
| 21 | CAPITAL AND OPERATING COSTS | 250 | |
| 21.1 | PROJECT SUMMARY | 250 | |
| 21.2 | CAPITAL COST SUMMARY | 250 | |
| 21.2.1 | Mine Capital Cost | 251 | |
| 21.2.2 | Process Plant Capital Cost | 253 | |
| 21.2.3 | Infrastructure Costs | 255 | |
| 21.2.4 | Cement Plant and Limestone Facilities | 257 | |
| 21.2.5 | Indirect Costs | 258 | |
| 21.2.6 | Owner’s Costs | 259 | |
| 21.2.7 | Environmental Mitigation, Reclamation, and Closure Costs | 260 | |
| 21.2.8 | Contingency | 260 | |
| 21.3 | OPERATING COSTS (OPEX) | 260 | |
| 21.3.1 | Mine Operating Cost | 260 | |
| 21.3.2 | Plant Operating Costs | 262 | |
| 21.3.3 | General and Administrative Costs | 262 | |
| 21.3.4 | Processing Labor | 263 | |
| 21.3.5 | Reagents, Wear Parts, and Electricity Costs | 264 | |
| 21.3.6 | Maintenance Costs | 265 | |
| 21.3.7 | Operating Supply Costs | 265 | |
| 21.3.8 | Cement Plant and Limestone Facilities Operating Cost | 265 | |
| 22 | ECONOMIC ANALYSIS | 267 | |
| 22.1 | PLANT PRODUCTION STATISTICS | 267 | |
| 22.1.1 | Copper Sales | 268 | |
| 22.1.2 | Initial Capital | 268 | |
| 22.1.3 | Expansion Capital | 268 | |
| 22.1.4 | Sustaining Capital | 269 | |
| 22.1.5 | Working Capital | 269 | |
| 22.2 | REVENUE | 269 | |
| 22.3 | TOTAL COPPER OPERATING COST | 269 | |
| M3-PN210313.007 31 March 2026 Revision 0 | x |
GUNNISON PROJECT Form 43-101F1 Technical Report |
| SECTION | PAGE | ||
| 22.4 | TOTAL CEMENT/LIMESTONE CASH COST | 270 | |
| 22.5 | ROYALTIES | 271 | |
| 22.6 | PROPERTY AND SEVERANCE TAXES | 271 | |
| 22.7 | RECLAMATION AND CLOSURE | 272 | |
| 22.8 | INCOME TAXES | 272 | |
| 22.9 | NET PRESENT VALUE (NPV) AND INTERNAL RATE OF RETURN (IRR) | 272 | |
| 23 | ADJACENT PROPERTIES | 274 | |
| 24 | OTHER RELEVANT DATA AND INFORMATION | 275 | |
| 25 | INTERPRETATION AND CONCLUSIONS | 275 | |
| 25.1 | CONCLUSIONS | 275 | |
| 25.2 | PROJECT RISKS | 275 | |
| 25.3 | OPPORTUNITIES | 277 | |
| 26 | RECOMMENDATIONS | 279 | |
| 27 | REFERENCES | 280 | |
| APPENDIX A: PRELIMINARY ECONOMIC ASSESSMENT CONTRIBUTORS AND PROFESSIONAL QUALIFICATIONS | 285 | ||
| APPENDIX B: MINERAL CLAIM DETAIL | |||
| M3-PN210313.007 31 March 2026 Revision 0 | xi |
GUNNISON PROJECT Form 43-101F1 Technical Report |
LIST OF FIGURES AND ILLUSTRATIONS
| FIGURE | DESCRIPTION | PAGE |
| Figure 1-1: | Project Location Map, Gunnison Project Area | 3 |
| Figure 1-2: | Open Pit Capex - Opex NPV Sensitivity - After Tax | 23 |
| Figure 1-3: | Open Pit Capex - Opex IRR Sensitivity - After Tax | 23 |
| Figure 4-1: | Location of the Gunnison Project, Gunnison and South Star Deposits - February 2026 | 37 |
| Figure 4-2: | Project Mineral Rights by Claim Type - February 2026 | 38 |
| Figure 5-1: | Typical Vegetation and Topography of the Gunnison Project (Johnson Camp Mine and Strong & Harris in the background) | 45 |
| Figure 7-1: | Regional Geologic Setting of the Gunnison Project (Modified from King and Beikman, 1974) | 50 |
| Figure 7-2: | Geologic Map of the Little Dragoon Mountains (Modified from Drewes et al, 2001) | 52 |
| Figure 7-3: | Gunnison Deposit Generalized Geological Cross Section (after Kantor, 1977) | 54 |
| Figure 7-4: | Gunnison Generalized Geology in Plan View, Below Basin Fill | 57 |
| Figure 7-5: | Gunnison Deposit East - West Geology Section at 394,400N Looking North | 58 |
| Figure 7-6: | Gunnison Deposit East - West Geology Section at 392,000N, Looking North | 58 |
| Figure 7-7: | Gunnison Deposit North - South Geology Section, Looking East | 59 |
| Figure 7-8: | Photograph of Typical Oxide Mineralization for the Gunnison Deposit Hole J-9 780 to 806 feet | 59 |
| Figure 7-9: | Generalized 3D View of Mineralization Looking South | 60 |
| Figure 7-10: | Property Geologic Setting for the Strong & Harris Project | 61 |
| Figure 7-11: | Stratigraphic Column for the Strong & Harris Project and Vicinity | 62 |
| Figure 8-1: | Porphyry Copper and Skarn Model (from Sillitoe 1989) | 65 |
| Figure 8-2: | Schematic Model | 67 |
| Figure 9-1: | Graphical Example of Geophysical Log | 69 |
| Figure 9-2: | Plan View of Major Faults at Bedrock Surface which Displace Stratigraphy | 70 |
| Figure 9-3: | Contour Plot of Poles to Dip Directions for Structural Features, Excluding Bedding Orientations | 71 |
| Figure 9-4: | Schematic East - West Cross Section Showing the Structural Framework of the Deposit | 72 |
| Figure 10-1: | Gunnison Deposit Drillhole Collar Locations | 75 |
| Figure 10-2: | GCC 2010-2015 Drillhole Collar Locations | 79 |
| Figure 10-3: | Collar Locations with 2018-2019 Drilling in Wellfield Area shown inside the Insert | 82 |
| Figure 10-4: | Map of Strong & Harris Drill Holes | 84 |
| Figure 11-1: | Plot of Certified Standard AMIS0118 Analysis | 90 |
| Figure 11-2: | Core - Duplicate TCu Analyses Relative to Original Assays | 92 |
| Figure 11-3: | Core - Duplicate Analyses Relative to Original ASCu Assays | 93 |
| Figure 11-4: | Replicate TCu Analyses Relative to Original Assays | 94 |
| M3-PN210313.007 31 March 2026 Revision 0 | xii |
GUNNISON PROJECT Form 43-101F1 Technical Report |
| FIGURE | DESCRIPTION | PAGE |
| Figure 11-5: | Replicate ASCu Analyses Relative to Original Assays | 94 |
| Figure 11-6: | ALS Check TCu Assays Relative to Original Skyline Analyses | 95 |
| Figure 11-7: | Plot of ALS Check Assay Analyses of Standard AMIS0118 | 96 |
| Figure 11-8: | AMIS 0200 Copper Analyses | 102 |
| Figure 11-9: | A106013X Copper Analyses | 102 |
| Figure 11-10: | MEG-GB4 Zinc Analyses | 103 |
| Figure 11-11: | CRM Oxide Au Silver Analyses | 104 |
| Figure 11-12: | Coarse Blank Silver Values vs. Silver Values of Previous Samples | 105 |
| Figure 11-13: | Coarse Blank Copper Values vs. Copper Values of Previous Samples | 105 |
| Figure 11-14: | Coarse Blank Zinc Values vs. Zinc Values of Previous Samples | 106 |
| Figure 11-15: | Core-Duplicate Copper Results Relative to Primary Sample Assays | 107 |
| Figure 11-16: | Core-Duplicate Zinc Results Relative to Primary Sample Assays | 107 |
| Figure 11-17: | Core-Duplicate Silver Results Relative to Primary Sample Assays | 108 |
| Figure 12-1: | Skyline TCu Analyses of Core Duplicates Relative to Original Quintana Assays | 111 |
| Figure 12-2: | Skyline ASCu Analyses of Core Duplicates Relative to Original Quintana Assays | 112 |
| Figure 12-3: | Skyline ASCu Analyses of Pulp Relative to Original Quintana Assays | 113 |
| Figure 12-4: | Skyline TCu Analyses of Core Duplicates Relative to Original Magma Assays | 114 |
| Figure 12-5: | Total Copper (“Cu”) Core-Duplicate Analyses Relative to Historical Analyses | 117 |
| Figure 12-6: | Soluble Copper (“CuOx”) Core-Duplicate Analyses Relative to Historical Analyses | 118 |
| Figure 12-7: | Zinc (“Zn”) Core-Duplicate Analyses Relative to Historical Analyses | 118 |
| Figure 13-1: | Martin ASCu Extraction Versus Free Acid and Irrigation Rate | 125 |
| Figure 13-2: | 2013 Martin Acid Consumption at Variable Free Acid and Irrigation Rate | 126 |
| Figure 13-3: | 2015 Abrigo Undivided. ASCu Extraction at 15 gpl Free Acid and 16 lph/m2 | 128 |
| Figure 13-4: | Abrigo Undivided Acid Consumption at 15 gpl Free Acid and 16 lph/m2 for Three Different Samples | 128 |
| Figure 13-5: | Total Copper and Acid Consumption Assay Results for Characterization Samples | 131 |
| Figure 13-6: | Recent Martin formation drill core showing white-colored, unmineralized, high acid consuming internal waste | 131 |
| Figure 14-1: | Cross Section 392000N Showing Gunnison Geologic Model | 140 |
| Figure 14-2: | Cross Section 394400N Showing Gunnison Geologic Model | 141 |
| Figure 14-3: | Oblique Northerly View of Structural - Domain Wire - Frame Solids | 142 |
| Figure 14-4: | Fracture - Intensity Model Cross Section 392000N | 144 |
| Figure 14-5: | Cross Section 392000 N Showing Total - Copper Mineral Domains | 147 |
| Figure 14-6: | Cross Section 394400 Showing Total - Copper Mineral Domains | 148 |
| Figure 14-7: | Gunnison Cross Section 392000 Showing Block Model Copper Grades | 157 |
| M3-PN210313.007 31 March 2026 Revision 0 | xiii |
GUNNISON PROJECT Form 43-101F1 Technical Report |
| FIGURE | DESCRIPTION | PAGE |
| Figure 14-8: | Gunnison Cross Section 394400N Showing Block Model Copper Grades | 158 |
| Figure 14-9: | Cross Section 3800 Showing Strong & Harris Geologic Model | 162 |
| Figure 14-10: | Strong & Harris Cross Section 3800 Showing Copper Mineral Domains | 169 |
| Figure 14-11: | Strong & Harris Cross Section 3800 Showing Zinc Mineral Domains | 170 |
| Figure 14-12: | Strong & Harris Cross Section 3800 Showing Silver Mineral Domains | 171 |
| Figure 14-13: | Plan Map of Strong & Harris Drilling, Mineralization and $4.30/lb Cu Pit Shells | 173 |
| Figure 14-14: | Strong & Harris Cross Section 3800 Showing Block Model Copper Grades | 174 |
| Figure 14-15: | Strong & Harris Cross Section 3800 Showing Block Model Soluble Copper Grades | 175 |
| Figure 14-16: | Strong & Harris Cross Section 3800 Showing Block Model Zinc Grades | 176 |
| Figure 14-17: | Strong & Harris Cross Section 3800 Showing Block Model Silver Grades | 177 |
| Figure 16-1: | Graphical Representation of Gunnison Mine Schedule | 179 |
| Figure 16-2: | Phase Progression of Gunnison Phases (Black) vs LG Pit Shells ($1.80/lb LG-Light Blue, $1.90/lb LG-Dark Blue, $2.00/lb LG-Green, $2.80/lb LG-Orange, $3.60/lb LG-Red, $4,20/lb LG-Pink) | 181 |
| Figure 16-3: | Tonnages of Heap Material and Waste along with Undiscounted Pit Value when all LG pit shells are evaluated at $4.30/lb Cu at Gunnison | 182 |
| Figure 16-4: | Tonnages of Heap Material and Waste along with Undiscounted Pit Value when all LG pit shells are evaluated at $4.30/lb Cu at Strong & Harris | 183 |
| Figure 16-5: | Gila Conglomerate Slope Height verses Slope Angle for Factors of Safety of 1.2 and 1.3 | 187 |
| Figure 16-6: | Tonnage of Mineralized Material Fed to the Primary Crusher by Type | 190 |
| Figure 16-7: | Waste Material Produced from PEA Mine Schedule | 192 |
| Figure 16-8: | Pit and Dump Configuration at the end of Pre-Production Mining | 197 |
| Figure 16-9: | Pit and Dump Configuration at the end of Year 1 of Mining | 198 |
| Figure 16-10: | Pit and Dump Configuration at the end of Year 2 of Mining | 199 |
| Figure 16-11: | Pit and Dump Configuration at the end of Year 4 of Mining | 200 |
| Figure 16-12: | Pit and Dump Configuration at the end of Year 9 of Mining | 201 |
| Figure 16-13: | Pit and Dump Configuration for Gunnison Pit at the end of Year 14 of Mining | 202 |
| Figure 16-14: | Pit and Dump Configuration for Strong & Harris Pit at the end of Year 14 of Mining | 203 |
| Figure 16-15: | Pit and Dump Configuration at the end of Year 19(End of Mine Life) of Mining | 204 |
| Figure 16-16: | Groundwater Flow Model | 206 |
| Figure 16-17: | Final Drain Elevation Gunnison Pit | 207 |
| Figure 16-18: | Final Drain Elevation Strong & Harris Pit | 208 |
| Figure 16-19: | Water Level Elevation for Mining Year 20 Flow Model | 209 |
| Figure 16-20: | Simulated Drainage Flows into Gunnison Pit | 210 |
| Figure 16-21: | Simulated Flow into Strong & Harris Pit | 211 |
| Figure 17-1: | Overall Process Flow Diagram | 213 |
| M3-PN210313.007 31 March 2026 Revision 0 | xiv |
GUNNISON PROJECT Form 43-101F1 Technical Report |
| FIGURE | DESCRIPTION | PAGE |
| Figure 17-2: | Simplified Material Sorting Flowsheet | 214 |
| Figure 17-3: | Gunnison Project Leach Pad | 218 |
| Figure 17-4: | Gunnison Leach Pad and Plant Configuration | 219 |
| Figure 18-1: | Gunnison Open Pit Site Plan | 224 |
| Figure 18-2: | Interstate 10 looking west towards Texas Canyon | 225 |
| Figure 18-3: | Proposed Re-Alignment of Interstate 10 to the North | 225 |
| Figure 18-4: | Typical Roadway Sections showing East Bound and West Bound Lanes of I-10 | 226 |
| Figure 18-5: | Gunnison Process Plant Site | 227 |
| Figure 18-6: | Gunnison Mine Services Area | 229 |
| Figure 18-7: | Primary Crusher Pad | 230 |
| Figure 18-8: | Sulfuric Acid Plant and Railyard | 230 |
| Figure 19-1: | Delivered Acid Correlation to Benchmark | 238 |
| Figure 19-2: | Tampa DEL Historical Price Cycles | 240 |
| Figure 19-3: | Regression Analysis of Red Diesel Prices vs WTI Benchmark Prices | 243 |
| Figure 22-1: | Open Pit Capex - Opex NPV Sensitivity - After Tax | 273 |
| Figure 22-2: | Open Pit Capex - Opex IRR Sensitivity - After Tax | 274 |
| M3-PN210313.007 31 March 2026 Revision 0 | xv |
GUNNISON PROJECT Form 43-101F1 Technical Report |
LIST OF TABLES
| TABLE | DESCRIPTION | PAGE |
| Table 1-1: | Rates of Copper Extraction during Heap Leaching | 7 |
| Table 1-2: | Mineralized Material Waste Percentages Calculated from Sorting Tests | 8 |
| Table 1-3: | Combined Oxide, Transitional, and Sulfide Resources | 8 |
| Table 1-4: | Strong & Harris Mineral Resources | 8 |
| Table 1-5: | Summary of Project Capital Costs ($000’s) | 14 |
| Table 1-6: | Summary of Mine Capital Costs ($000s) | 15 |
| Table 1-7: | Initial Process Direct Capital Cost | 15 |
| Table 1-8: | Infrastructure Capital Cost Summary | 16 |
| Table 1-9: | Indirect Capital Cost Summary | 16 |
| Table 1-10: | Operating and Production Costs | 17 |
| Table 1-11: | Summary of Mine Operating Costs | 18 |
| Table 1-12: | Heap Leach Opex Summary by Cost Element | 18 |
| Table 1-13: | SX-EW Opex Summary by Cost Element | 19 |
| Table 1-14: | Summary General and Administrative Operating Cost | 19 |
| Table 1-15: | Economic Results | 21 |
| Table 1-16: | Sensitivity Analysis - Open Pit | 22 |
| Table 1-17: | Gunnison Project Pre-feasibility Budget | 27 |
| Table 2-1: | Dates of Site Visits and Areas of Responsibility | 30 |
| Table 2-2: | Units, Terms and Abbreviations | 31 |
| Table 4-1: | Summary of Land Packages that Constitute the Gunnison Project | 39 |
| Table 4-2: | Triple Flag Metal Stream Agreement for the Gunnison Project | 41 |
| Table 6-1: | Comparison of Previous Oxide Copper Resource Estimates to AzTech 2010 Estimate | 47 |
| Table 7-1: | Stratigraphy of the Gunnison Project Region (Modified from Weitz, 1979; Clayton, 1978) | 51 |
| Table 10-1: | Pre-Existing Drilling at the Gunnison Deposit (Diamond Drilling Includes Percussion Pre-Collar) | 74 |
| Table 10-2: | List of Assay Laboratories Used by Historical Operations | 76 |
| Table 10-3: | Summary of Historical Borehole Deviation Surveys | 76 |
| Table 10-4: | Listing of GCC Diamond Drilling 2010 - 2015 | 77 |
| Table 10-5: | Core Recovery and RQD for GCC Diamond Drilling 2010 - 2015 | 81 |
| Table 10-6: | Summary of 2018-2019 GCC Drilling | 81 |
| Table 10-7: | Summary of Strong & Harris Historical Drilling | 83 |
| Table 11-1: | GCC Certified Standards | 89 |
| M3-PN210313.007 31 March 2026 Revision 0 | xvi |
GUNNISON PROJECT Form 43-101F1 Technical Report |
| TABLE | DESCRIPTION | PAGE |
| Table 11-2: | Skyline Analyses of Standard AMIS0118 | 90 |
| Table 11-3: | Summary of ALS Analyses of Standards from Check - Assaying Programs | 96 |
| Table 11-4: | Summary of the Inter - Laboratory Check Program | 97 |
| Table 11-5: | Skyline and ALS TCu Analyses of Standards - Inter - Laboratory Program | 98 |
| Table 11-6: | Certified Reference Materials for 2021 Assays | 101 |
| Table 12-1: | Drillhole Data by Company | 109 |
| Table 13-1: | 2011 Column Leaching Tests | 122 |
| Table 13-2: | 2012 Johnson Camp Column Leaching Tests using the Hot Acid Digest Assay Technique | 122 |
| Table 13-3: | 2012 Johnson Camp Column Leaching Tests using the Cold Acid Digest Assay Technique | 124 |
| Table 13-4: | 2013 Gunnison Column Leaching Tests | 127 |
| Table 13-5: | Characterization Sample Assay Results by Major Lithology | 130 |
| Table 13-6: | Summary of Samples Constituting Bulk Test #1 | 131 |
| Table 13-7: | Results of Bulk Sample Test | 132 |
| Table 13-8: | Results of the Bulk Material Sorting of the Martin Formation | 132 |
| Table 13-9: | Mineralized Waste Percentages Calculated by Sorting Results | 133 |
| Table 13-10: | Estimated Acid Consumption and Copper Recoveries | 135 |
| Table 14-1: | Block Model Summary | 139 |
| Table 14-2: | Fracture - Intensity Scale | 143 |
| Table 14-3: | Fracture - Intensity Estimation Parameters | 144 |
| Table 14-4: | Specific Gravity Statistics and Model Coding of Tonnage Factors | 145 |
| Table 14-5: | Approximate Grade Ranges of Total - Copper Mineral Domains | 146 |
| Table 14-6: | Descriptive Statistics of Coded Total - Copper Analyses | 149 |
| Table 14-7: | Total - Copper Assay Caps by Mineral Domain | 149 |
| Table 14-8: | Descriptive Statistics of Total - Copper Composites | 149 |
| Table 14-9: | Descriptive Statistics of Acid - Soluble to Total - Copper Composites | 150 |
| Table 14-10: | Descriptive Statistics of Cyanide - Soluble to Total - Copper Composites | 150 |
| Table 14-11: | Search Ellipse Orientations | 151 |
| Table 14-12: | Estimation Parameters | 152 |
| Table 14-13: | Residual Sulfide Calculation | 152 |
| Table 14-14: | Average SG and Tonnage Factors by Copper Domain | 153 |
| Table 14-15: | Pit Constraint Inputs | 153 |
| Table 14-16: | Gunnison Deposit Total - Copper Resources | 155 |
| Table 14-17: | Gunnison Deposit Classification Parameters | 155 |
| Table 14-18: | Combined Oxide, Transitional, and Sulfide Resources | 156 |
| M3-PN210313.007 31 March 2026 Revision 0 | xvii |
GUNNISON PROJECT Form 43-101F1 Technical Report |
| TABLE | DESCRIPTION | PAGE |
| Table 14-19: | Block Model Extents and Dimensions | 160 |
| Table 14-20: | Average SG and Tonnage Factors by Copper Domain | 161 |
| Table 14-21: | Grade Domain Ranges | 161 |
| Table 14-22: | Grade Caps | 164 |
| Table 14-23: | Coded Copper Assay Statistics | 164 |
| Table 14-24: | Coded Zinc Assay Statistics | 165 |
| Table 14-25: | Coded Silver Assay Statistics | 165 |
| Table 14-26: | Coded Cu Ratio Statistics in Oxide Material | 165 |
| Table 14-27: | Coded Cu Ratio Statistics in Transition Material | 166 |
| Table 14-28: | Coded Cu Ratio Statistics in Sulfide Material | 166 |
| Table 14-29: | Composite Statistics | 167 |
| Table 14-30: | Estimation Area Orientations | 168 |
| Table 14-31: | Estimation Parameters | 168 |
| Table 14-32: | Pit Optimization Parameters | 172 |
| Table 14-33: | Strong & Harris Mineral Resources | 172 |
| Table 14-34: | Strong & Harris In-Pit Mineralization - Mineral Resources by Oxidation Zone | 178 |
| Table 14-35: | Strong & Harris In-Pit Mineralization - Mineral Resources by Lithology | 178 |
| Table 16-1: | Gunnison PEA Annual Mine Schedule | 180 |
| Table 16-2: | Inputs to Computer Generated Pit Shell Used to Guide Phase Design | 183 |
| Table 16-3: | Tabulation of Tonnages by Phase | 184 |
| Table 16-4: | Pit Slope Angles Used in Gunnison Pit Design | 186 |
| Table 16-5: | Calculation of Net of Process Value used as Cut-off Grade | 188 |
| Table 16-6: | Tonnage of Mineralized Material Fed to the Primary Crusher by Type | 189 |
| Table 16-7: | Summary of Tonnage of Material sent to sorting by Year | 191 |
| Table 16-8: | Waste Material Produced from PEA Mine Schedule | 192 |
| Table 16-9: | Expected Major Mining Equipment | 194 |
| Table 16-10: | Gunnison PEA Hourly Staff Requirements | 195 |
| Table 16-11: | Gunnison PEA Salary Staff Requirements | 196 |
| Table 16-12: | Stress Period Setup | 205 |
| Table 19-1: | Copper Price Analyst Consensus | 236 |
| Table 19-2: | LT Net Copper Premium Calculation | 236 |
| Table 19-3: | Sulfuric Acid Price and Benchmark Price | 237 |
| Table 19-4: | LT Sulfuric Acid Purchase Price Assumption | 238 |
| Table 19-5: | Sulfuric Acid Delivered Sales Price | 239 |
| M3-PN210313.007 31 March 2026 Revision 0 | xviii |
GUNNISON PROJECT Form 43-101F1 Technical Report |
| TABLE | DESCRIPTION | PAGE |
| Table 19-6: | Sulfur Benchmark Prices from 1996 to 2025 Inflated to 2026 Real Dollars | 240 |
| Table 19-7: | Union Pacific Freight Rate | 241 |
| Table 19-8: | Railcar Lease per Short Ton | 241 |
| Table 19-9: | Long-Term Molten Sulfur Price | 242 |
| Table 19-10: | Diesel Price | 242 |
| Table 20-1: | Open Pit Environmental Permits | 244 |
| Table 21-1: | Capital Cost Summary | 251 |
| Table 21-2: | Summary of Mine Capital Costs ($000s) | 252 |
| Table 21-3: | Summary of Annual Mine Capital Costs ($000s) | 252 |
| Table 21-4: | Process Plant Direct Capital Cost Summary | 254 |
| Table 21-5: | Infrastructure CAPEX Summary | 255 |
| Table 21-6: | Cement Plant and Limestone Facilities Capital Costs | 258 |
| Table 21-7: | Indirect Capital Cost Summary | 259 |
| Table 21-8: | Operating and Production Costs | 260 |
| Table 21-9: | Mine Operating Costs by Cost Center | 261 |
| Table 21-10: | Heap Leach OPEX Summary by Cost Element | 262 |
| Table 21-11: | SXEW OPEX Summary by Cost Element | 262 |
| Table 21-12: | G&A OPEX Cost | 263 |
| Table 21-13: | Estimated Labor Requirements | 264 |
| Table 21-14: | Summary of Reagents and Wear Parts - Heap Leach, SXEW Plant & Material Sorting | 264 |
| Table 21-15: | Summary of Power Consumption and Cost | 265 |
| Table 21-16: | Cement Plant Operating Costs | 266 |
| Table 22-1: | Initial Capital Requirement | 268 |
| Table 22-2: | Expansion Capital Requirement | 269 |
| Table 22-3: | Sustaining Capital Requirement | 269 |
| Table 22-4: | Life of Copper Operation Operating + Production Costs | 270 |
| Table 22-5: | Life of Cement Operation Operating + Production Costs | 271 |
| Table 22-6: | Economic Results | 272 |
| Table 22-7: | Sensitivity Analysis | 273 |
| Table 26-1: | Pre-feasibility Budget for the Gunnison Project | 279 |
| M3-PN210313.007 31 March 2026 Revision 0 | xix |
GUNNISON PROJECT Form 43-101F1 Technical Report |
LIST OF APPENDICES
| APPENDIX | DESCRIPTION |
| A | Preliminary Economic Assessment Contributors and Professional Qualifications |
| ● Certificate of Qualified Person (“QP”) | |
| B | Mineral Claim Detail |
| M3-PN210313.007 31 March 2026 Revision 0 | xx |
GUNNISON PROJECT Form 43-101F1 Technical Report |
| 1 | EXECUTIVE SUMMARY |
M3 Engineering & Technology Corporation (M3) was commissioned by Gunnison Copper Corp. (GCC) to update their October 2024 Preliminary Economic Assessment (PEA) in accordance with the Canadian National Instrument 43-101 (NI 43-101) standards for reporting mineral properties, for the Gunnison Project (the Project) in Cochise County, Arizona, USA. The updated Project includes a new mine design for the Gunnison Deposit (Gunnison or Gunnison Deposit) as an open pit, using heap leaching to produce PLS that then reports to a Solvent Extraction and Electrowinning (SX-EW) plant. An addition to the mine plan is the Strong & Harris deposit (Strong & Harris or Strong & Harris Deposit) located three miles north of the Gunnison Deposit.
The biggest material change is to include pre-concentration of some of the mineralized materials via mechanical material sorters to reduce the amount of material delivered to the leach pad and to reduce the acid consumption of high-carbonate mineralized material. The plant capacity of the Gunnison Project remains as 175 million pounds per annum (mppa) of cathode copper. The SX-EW plant will be constructed in a single stage of development.
The project includes the construction of a sulfur-burning sulfuric acid plant, as in the previous study. The acid plant is 10% smaller than in the previous study but uses the same technology.
As part of the business plan, GCC has now included a cement plant and limestone plant to sell products from 177 million tons of high purity limestone that will be extracted from the Gunnison and Strong & Harris pits.
The Gunnison Project is located about 62 miles east of Tucson, Arizona on the southeastern flank of the Little Dragoon Mountains in the Cochise Mining District. The property is within the copper porphyry belt of Arizona. The Gunnison Project hosts the Gunnison (formerly known as the I-10) Deposit and contains copper oxide and sulfide mineralization with associated molybdenum in potentially economic concentrations. Oxidized, mineralized bedrock lies 300 to 800 feet beneath of alluvial basin fill.
GCC contracted M3, RESPEC, Independent Mining Consultants, Call & Nicholas Inc, Geo-Logic Associates, Clear Creek Associates, and Burgex to prepare mine plans, mineral resource estimates, process plant designs, complete environmental studies, and cost estimates used for this Technical Report. The costs are based on 1st quarter 2026 U.S. dollars.
| 1.1 | Key Data |
The key results of this PEA for the Project are as follows:
| ● | Copper price: $4.60/lb. A premium of $0.0425/lb has been added for producing Grade A cathode copper. |
| ● | The average annual production for years 1 to 15 is projected to be approximately 174 million pounds of copper. Total life of operation production is projected at approximately 3,187 million pounds of copper. |
| ● | The Project currently has 846.1 million short tons of measured and indicated oxide, transitional, and sulfide mineral resources at an average grade of 0.33% Total Copper (TCu) and inferred oxide, transitional, and sulfide mineral resources of 94 million short tons at an average grade of 0.21% TCu; using a cut-off grade of $0.05% total Copper for oxide and transition materials and 0.1% Total Copper for sulfide materials. The tonnage of material in the Gunnison conceptual mine plan used for this PEA is 641.6 million tons having an average grade of 0.37% TCu. |
| ● | The anticipated heap leach recovery is estimated to be 90% of the AsCu and CNCu copper grade. 60% recovery for copper sulfide (CuS) material but only within the sulfide mineral domain using a sulfide recovery process (minimal CuS recovery in the Oxide or Transition mineral domains). |
| M3-PN210313.007 31 March 2026 Revision 0 | 1 |
GUNNISON PROJECT Form 43-101F1 Technical Report |
| ● | The average direct, life-of-mine operating cost is estimated to be $8.43 per ton of mineralized material mined, which is equivalent to $1.70/lb Cu. The average sustaining cash cost including royalties and sustaining capital costs is $10.20 per ton of mineralized material mined which is equivalent to $2.05/lb Cu. |
| ● | The estimated initial capital cost is $1,555.6 million, including capitalized pre-production costs and acid plant. Expansion of the Leach Pad through Year 10 will add another $200.7 million in direct costs. Additions to Infrastructure and a plant to enhance sulfide leaching will add another $67.4 million. |
| ● | Sustaining capital costs from mine equipment replacement is $51.8M over the LOM. Another $321.4 million is attributable to the addition of a cement/limestone plant that will add revenue and value to the operation in starting in Years 4 & 5. |
| ● | The total cost for reclamation and closure is estimated to be $93.0 million and averages $0.034 per pound of copper recovered. A credit of $65.0 million is expected from salvage value of capital equipment from the mine. Another $26 million credit is included for the salvage value of the sulfuric acid plant and the cement/limestone plant. |
| ● | The economic analysis for the Gunnison open pit after taxes indicates an Internal Rate of Return (IRR) of 22.5% and a payback period of 3.9 years. Based on a long-term average copper price of $4.60 per pound (plus $0.0425 Grade A cathode premium), the Net Present Value (NPV) after taxes is $1,959 million at an 8% discount rate. |
The PEA is preliminary in nature and includes inferred mineral resources that are considered too speculative geologically to have the economic considerations applied to them that would enable them to be categorized as mineral reserves. There is no certainty that the conclusions reached in the PEA will be realized. Mineral resources that are not mineral reserves do not have demonstrated economic viability.
| 1.2 | Property Description and Location |
The Project is located in Cochise County, Arizona, approximately 62 miles east of Tucson and 1.5 miles southeast of the historic Johnson Camp mining district. Figure 1-1 is a general location map and property location near the US Interstate 10 (I-10) freeway. Total area is approximately 18,796 acres (7,606 Ha).
The Project is held by GCC through its wholly owned subsidiary Excelsior Mining Arizona, Inc. (GCAZ). Acquisition of all mineral interest from the James L. Sullivan Trust was completed in January of 2015. These assets represent, among other things, the mineral rights to the Gunnison and Strong & Harris copper deposits (the Gunnison Project).
| M3-PN210313.007 31 March 2026 Revision 0 | 2 |
GUNNISON PROJECT Form 43-101F1 Technical Report |
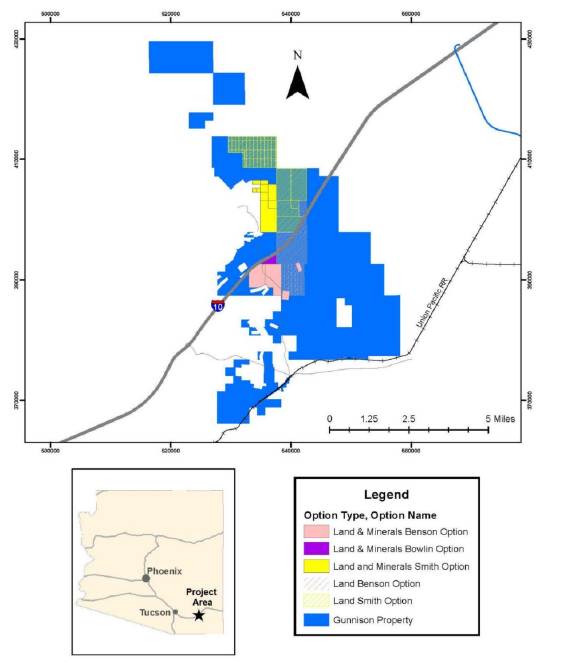
Source: GCC, December 2026
Figure 1-1: Project Location Map, Gunnison Project Area
| M3-PN210313.007 31 March 2026 Revision 0 | 3 |
GUNNISON PROJECT Form 43-101F1 Technical Report |
| 1.3 | Accessibility, Climate, Local Resources, Infrastructure and Physiography |
The Project is located in a sparsely populated, flat to slightly undulating ranching and mining area about 65 road miles east of Tucson, Arizona. The Tucson metropolitan area is a major population center (approximately 1,000,000 persons) with a major airport and transportation hub and well-developed infrastructure and services that support the surrounding copper mining and processing industry. The towns of Benson and Willcox are nearby and combined with Tucson can supply sufficient skilled labor for the Project.
Access to the Project is via the I-10 freeway from Tucson and Benson to the west or Willcox to the east. The Gunnison Deposit can be accessed via good quality dirt roads heading approximately 1 mile east from the south side of “The Thing” travel center and roadside attraction on the Johnson Road exit from I-10. Strong & Harris is reached via the improved unpaved Johnson Road travelling approximately 3.5 miles north from I-10.
The elevation on the property ranges from approximately 4,600 to 4,900 feet above mean sea level in the eastern Basin and Range physiographic province of southeastern Arizona. The climate varies with elevation, but in general the summers are hot and dry, and winters are mild.
Vegetation on the property is typical of the upper Sonoran Desert and includes bunchgrasses, yucca, mesquite, and cacti.
| 1.4 | History |
There is no direct mining history of the Gunnison Deposit or Strong & Harris; however, the district has seen considerable copper, zinc, silver, and tungsten mining beginning in the 1880s and extending to the present day. Modern mining and leaching operations at the Johnson Camp Mine, began in the 1970s by Cyprus Minerals. Successor owners and operators include Arimetco, North Star, Summo Minerals, and Nord Resources Corporation. Nord mined fresh material until mid-2010 and maintained leaching operations until late 2015, when the property was purchased by GCC.
In 1970, a division of the Superior Oil Company (“Superior”) joint ventured into the northern half of the Gunnison Deposit with Cyprus and the private owners (J. Sullivan, pers. com.). During the early 1970s, Superior did most of the drilling and limited metallurgical testing on Gunnison and by early 1974 had defined several million tons of low-grade acid-soluble copper mineralization. According to Parsons (1974), oxide copper mineralization was discovered at what is now the Strong & Harris Deposit in drill cuttings “while a water well was being drilled, perhaps in the early 1960s.” A Mr. Strong and a Mr. Harris subsequently located mining claims on the present property. Modern-era exploration of the Strong & Harris project commenced in 1964. More than 100,000 feet of rotary and core drilling were done by various operators from the mid-1960s through 1992.
The Gunnison Project was previously designed as a copper in-situ recovery (“ISR”) mine using solvent extraction-electrowinning (“SX-EW”) to produce copper cathode. The ISR operation commenced ramp-up to production in 2020; however, it had operational issues related to low flow rates, so the Company began evaluating alternatives and opportunities to fix the ramp-up challenges. Well stimulation (small scale, shallow level, hydraulic fracking), has the potential to fundamentally change the performance of the wellfield and fix many of the low productivity issues. The Company has obtained a permit for well stimulation and the next step would be to conduct field trials. If well stimulation is successful, it could provide an operation with superior economics to the open pit operation and be in copper production much quicker than an open pit. However, due to the substantially improved viability of the open pit operation, GCC intends to focus on the open pit operation as the alternative to ISR. The Company intends to maintain the optionality of future ISR operations and well stimulation trials as this remains an asset to the Company. This includes maintaining full compliance with all regulatory and permit requirements, including maintaining hydraulic control, pumping, monitoring and regulatory reporting.
| M3-PN210313.007 31 March 2026 Revision 0 | 4 |
GUNNISON PROJECT Form 43-101F1 Technical Report |
| 1.5 | Geological Setting and Mineralization |
The Gunnison Project, including the Gunnison and Strong & Harris copper deposits, is situated in the Mexican Highland section of the Basin and Range physiographic province. The province is characterized by fault-bounded mountains, typically with large igneous intrusions at their cores, separated by deep basins filled with Tertiary and Quaternary gravels.
The Gunnison Project (Gunnison Deposit) lies on the eastern edge of the Little Dragoon Mountains. The ages of the rocks range from 1.4-billion-year-old Pinal Group schists to recent Holocene sediments. The southern portion of the Little Dragoon Mountains consists predominately of the Tertiary Texas Canyon Quartz Monzonite whereas the Pinal Group schists and the Paleozoic sediments that host the regional copper mineralization dominate the northern half. The Strong & Harris Deposit is hosted in altered Paleozoic sedimentary rocks which are covered by an average of 425 feet of post-mineral and mostly unconsolidated valley fill near the northeast flank of the Little Dragoon Mountains and about three northwest of the Gunnison oxide copper deposit
At Gunnison, Copper sulfide mineralization has formed preferentially in the proximal (higher metamorphic grade) skarn facies, particularly along stratigraphic units such as the Abrigo and Martin Formations near the contact with the quartz monzonite and within structurally complex zones. Primary mineralization occurs as stringers and veinlets of chalcopyrite and bornite. Primary (unoxidized) mineralization remains “open” (undetermined limits) at depth and to the north, south, and east. Oxidation of the mineralization occurs to a depth of approximately 1,600 feet, resulting in the formation of dominantly chrysocolla and tenorite with minor copper oxides and secondary chalcocite. The bulk of the copper oxide mineralization occurs as chrysocolla, which is formed as coatings on rock fractures and as vein fill. The remainder of the oxide mineralization occurs as replacement patches and disseminations.
Primary copper-zinc-silver mineralization at Strong & Harris is characterized by lenses of sulfide minerals emplaced more-or-less parallel to layering in favorable lithologic units, usually along bedding planes or in disseminated masses and blebs. Sub-units of the Earp Formation, particularly those immediately below its upper contact with the Colina Limestone, were the most favorable sites for deposition of the copper, zinc and silver minerals. However, mineralization is also present in the Colina Limestone above the Earp, as well as in the Horquilla Limestone. The Strong & Harris Deposit has been oxidized to varying degrees that generally decrease with depth. Three oxidation zones are currently recognized in the deposit: the oxide zone, the transition (or mixed) zone, and the sulfide zone.
| 1.6 | Deposit Types |
The Gunnison Deposit is a classic copper-bearing, skarn-type deposit (Einaudi et al., 1980; Meinert et al., 2005). The Strong & Harris copper-zinc-silver deposit is a sub-type of or related to a classic copper skarn. Skarn deposits range in size from a few million to 500 million tons and are globally significant, particularly in the American Cordillera. The Gunnison Deposit is large, being at the upper end of the range of size for skarn deposits and is associated with a mineralized porphyry copper system that has been largely unexplored. Strong & Harris can be sub-categorized as distal skarn related to a porphyry copper system.
| 1.7 | Exploration |
Since Gunnison’s discovery, numerous companies have explored the area. During this time period, extensive drilling, and assaying, magnetic and IP geophysical surveys, metallurgical testing, hydrological studies, ISR tests, and preliminary mine designs and evaluations have occurred. The focus since the 1970’s has been to utilize ISR or a combination of ISR and open pits as a potential mining strategy.
Stephen Twyerould first became involved with the Gunnison Project in mid-2005 and AzTech (later named Excelsior Mining Arizona, Inc.) became involved in mid-2006. Since that time, significant work has been completed such as cataloguing, reviewing, and compiling high-quality historical data spanning over thirty years of investigations by Superior Oil and Gas, Cyprus, Quintana, CF&I, Magma Copper Corporation, Phelps Dodge Corporation, and James Sullivan. GCC conducted detailed ground magnetics over the exploration targets in June 2011.
| M3-PN210313.007 31 March 2026 Revision 0 | 5 |
GUNNISON PROJECT Form 43-101F1 Technical Report |
GCC initiated a re-logging program in December 2010 that was completed in the third quarter of 2011. In addition, a re-assaying program began in March 2011 during which all of the Magma holes were re-assayed. In May 2011, a re-assay program was initiated for the Quintana Minerals holes (DC, S, and T series) to include sequential copper analyses for cyanide-soluble (CNCu) and acid-soluble copper (ASCu). Previous results only included total copper (TCu) assays. From late in 2010 through early 2015, GCC has drilled 54 diamond drillholes, totaling 78,615 ft, for metallurgical samples and copper resource definition and expansion.
GCC has not conducted drilling at the Strong & Harris project. In 2019, GCC began a comprehensive technical review of the reports and project drill data. In 2020-2021, GCC completed a data compilation program to digitize and validate the Strong & Harris data. GCC commissioned Geotech Ltd to complete a helicopter-borne geophysical survey using the versatile time-domain electromagnetic (VTEM™) plus system between October 6th and October 21st, 2020 over the Gunnison Copper Project. Measurements were taken using the VTEM™ Plus system (vertical and in-line components of the EM response) and a horizontal magnetic gradiometer with two caesium sensors. The survey covered several copper deposits in the district, including Strong & Harris.
| 1.8 | Drilling |
The Gunnison Deposit drillhole database includes 217 drillholes totaling 245,509 feet. Among the total drillholes, 88 were historical drillholes that were completed by several companies. These holes extend to a depth of approximately 2,450 ft below the surface at the Gunnison Deposit and cover an area of approximately 310 acres, with additional drilling extending beyond this area. There is a slightly higher density of drilling along the central axis of the Gunnison Deposit.
The author is aware of records for a total of 152 holes drilled within the Strong & Harris project, for a total of approximately 130,679 feet drilled. The author believes these holes were drilled in 1965 through 1992.
| 1.9 | Sample Preparation, Analysis and Security |
The laboratory sample preparation and analysis procedures used by the previous owners of the deposits are unknown; however, major commercial laboratories using best practices at the time completed the majority of analyses.
The data, information, samples, and core from the deposits have been under the control and security of AzTech Minerals since November 2006 and then GCC since October 2010. The original information and samples are stored at the Sullivan’s core storage facility in Casa Grande, with numerous copies held by GCC at its Phoenix, Arizona office. It is the opinion of RESPEC Company LLC (RESPEC) and the qualified person for this section of the report, the reviewer of the assay data for this Technical Report, that the sample procedures, processes, and security are reasonable and adequate.
| 1.10 | Data Verification |
The verification of location and assay data in the drillhole database covers historic drilling and the verification of the data collected by GCC. No significant issues have been identified with respect to the data provided by GCC’s quality assurance/quality control (“QA/QC”) programs. QA/QC data are not available for the historical drilling programs at the Gunnison Deposit, but GCC analyses dominate the assays used directly in the estimation of the mineral resources. Additionally, most of the historical data were generated by well-known mining companies, and the GCC drill data are generally consistent with the results generated by the historical companies.
| M3-PN210313.007 31 March 2026 Revision 0 | 6 |
GUNNISON PROJECT Form 43-101F1 Technical Report |
Assaying and QA/QC procedures were industry standard. The TCu, CNCu, and ASCu assays used to estimate grades in the Gunnison and Strong & Harris models are acceptable for estimating mineral resources, based on RESPEC’s and qualified person’s review of the available data for repeat, check, duplicate, standard and blank assays, and on paired comparisons of assay data from different drilling campaigns.
| 1.11 | Mineral Processing and Metallurgical Testing |
Column tests and other metallurgical testing conducted during the last decade or more, supplemented by recent developments, have supported the following predictions of heap leaching performance for copper-bearing material from the Gunnison resource that has been crushed to a nominal minus 6-inch product.
Copper extractions according to the mineralogical categories defined by assay procedure are as follows: acid-soluble copper (ASCu), 90%; cyanide-soluble copper (CNCu), 90%; and sulfide copper (CuS), 60% (CuS recovery is limited to the sulfide mineral domain). The predicted leaching response of primary sulfide minerals, essentially all chalcopyrite, assumes that accelerated oxidation and de-passivation of chalcopyrite will be at least moderately effective.
However, the copper will dissolve slowly over a period of several years due to kinetic limitations and imperfect solution access. For instance, chrysocolla, the dominant ASCu species, dissolves in two stages with declining rate as copper content in the layer silicate structure diminishes. Accordingly, the following approximate rates are predicted.
Table 1-1: Rates of Copper Extraction during Heap Leaching
Species |
Year 1 (%) | Year
2 (%) |
Year 3 (%) |
| ASCu | 81 | 4.5 | 4.5 |
| CNCu | 81 | 4.5 | 4.5 |
| CuS | 48 | 9 | 3 |
Column tests and other metallurgical tests have indicated that acid consumptions for the dominant rock formations in the Gunnison resource will be as follows, expressed as pounds of 98% H2SO4 per ton of heap feed: Martin, 87.61; Strong & Harris carbonates, 87.51 Upper Abrigo, 48; Middle Abrigo, 48; Lower Abrigo, 24; and TQM/Bolsa/Pinal, 24.
In the Gunnison resource, much of the acid-consuming gangue is comprised of dolomite and/or calcite that contain little copper. This presents an opportunity for reducing acid costs by particle segregation, or “sorting”. Material sorting has been done manually for millennia and has been a common practice for decades in waste segregation, metal recycling, and upgrading of some types of mineralized material. However, major advances have been made during the last few years in sensor efficiency and sorting equipment capacity.
GCC contracted Steinert to conduct material sorting tests on cores selected from the main formations at the Gunnison Deposit. Table 1-2 shows the calculated results of the testing mainly on the Martin dolomite.
1 After material sorting. Pre-mineral sorting, the Martin Formation, and carbonates at Strong & Harris consume 135 lb/ton.
| M3-PN210313.007 31 March 2026 Revision 0 | 7 |
GUNNISON PROJECT Form 43-101F1 Technical Report |
Table 1-2: Mineralized Material: Waste Percentages Calculated from Sorting Tests
| Mineralized Material: Waste Adjustments Based on Testing | |
| % of internal Waste in Martin resource | 50% |
| % of Waste that can be removed by material sorting | 90% |
| Ratio of acid consumed by Waste / acid consumed by Mineralization | 6.01 |
| % or Mineralization lost to Waste | 1% |
| Calculated Martin Mineralization % | 54.5% |
| Calculated Martin Waste % | 45.5% |
| 1.12 | Mineral Resource Estimate |
The Gunnison Deposit Mineral Resources are classified in order of increasing geological and quantitative confidence into Inferred, Indicated, and Measured categories in accordance with the “CIM Definition Standards – For Mineral Resources and Mineral Reserves” and therefore Canadian National Instrument 43-101.
Table 1-3: Combined Oxide, Transitional, and Sulfide Resources
| Total Resources (Oxide + Transitional + Sulfide) | |||
| Resource Class |
Short Tons (millions) | Total Cu (%) | Cu Pounds (millions) |
| Measured | 191.5 | 0.37 | 1,423 |
| Indicated | 654.5 | 0.31 | 3,768 |
| Measured + Indicated | 846.1 | 0.33 | 5,190 |
| Inferred | 94.0 | 0.21 | 397 |
Notes:
| 1. | Mineral Resources that are not Mineral Reserves do not have demonstrated economic viability. |
| 2. | Mineral Resources are reported within an optimized pit at a 0.05% total copper cut-off for oxide and transition material, and 0.1% cut-off for sulfide. |
| 3. | Rounding may result in apparent discrepancies between tons, grade, and contained metal content. |
| 4. | The Effective Date of the Mineral Resource estimate is January 23, 2026. |
The Strong & Harris project resources are summarized in Table 1-4.
Table 1-4: Strong & Harris Mineral Resources
(0.07% Cu cutoff)
| Classification | Short Tons (millions) |
% Cu | % CuOx |
% Zn | oz Ag/ ton | Cu lbs (millions) |
CuOx lbs (millions) |
Zn lbs (millions) |
Ag oz (millions) |
| Inferred | 76.070 | 0.49 | 0.32 | 0.56 | 0.12 | 740.0 | 482.691 | 855.707 | 8.971 |
| 1. | The Effective Date of the mineral resources is January 23, 2026. |
| 2. | The project mineral resources are shown in bold and are comprised of all model blocks at a 0.07% Cu cutoff that lie within optimized resource pits. |
| 3. | Mineral resources that are not mineral reserves do not have demonstrated economic viability. |
| 4. | The estimate of mineral resources may be materially affected by geology, environmental, permitting, legal, title, taxation, sociopolitical, marketing, or other relevant issues. |
| 5. | Rounding as required by reporting guidelines may result in apparent discrepancies between tons, grade, and contained metal content. |
| M3-PN210313.007 31 March 2026 Revision 0 | 8 |
GUNNISON PROJECT Form 43-101F1 Technical Report |
The estimate of mineral resources may be materially affected by geology, environmental, permitting, legal, title, taxation, sociopolitical, marketing, or other relevant issues. Potential risk factors include changes in metal prices, increases in operating costs, fluctuations in labor costs and availability, availability of investment capital, infrastructure failures, changes in government regulations, community engagement and socio-economic community relations, civil disobedience and protest, permitting and legal challenges, and general environmental concerns. However, the author is not aware of any such factors that may materially affect the Gunnison or Strong & Harris mineral resources as of the date of this technical report. The impact of taxation was taken into consideration when establishing cut-off grade.
The Mineral Resources presented herein are inclusive of the Economic Analysis presented in Section 22 which therefore represents a subset of the Mineral Resources under slightly different economic inputs, most notably lower copper price.
| 1.13 | Mineral Reserve Estimate |
The Gunnison Project does not currently have any mineral reserves.
| 1.14 | Mining Methods |
Mining of the Gunnison and Strong & Harris Deposits is planned be accomplished using open pit hard rock mining methods assuming an automated haulage fleet. The mine plan was developed to produce 175 million pounds of recoverable copper per year with mining being completed by an owner-operated fleet. Mining of the deposit is expected to be accomplished with hydraulic front shovels and 320-ton trucks. Mining is planned on 50-ft bench heights in the Gunnison pit and 40-ft bench heights in the Strong & Harris pit.
An annual schedule was developed for the mine plan. Leach material will be dumped into near pit gyratory crushers to be conveyed either directly to the leach pad or through sorting prior to being conveyed to the leach pad. All leach material produced through Year 9 is planned to be treated in a conventional leach operation. Beginning in Year 10, a portion of the leach material is planned to be treated in a sulfide leach operation with the rest of the material treated in a conventional leach operation. The heap tonnage production varies by year as it is based on the requirement of 175 million pounds of recoverable copper being placed on the heap annually.
The mine plan presented in this Technical Report is achieved by mining 9 phase expansions to achieve the ultimate pit limit in the Gunnison Deposit and a single phase at Strong & Harris. The phases are practical expansions of the Gunnison pit incorporating haul road designs, operating room for equipment and all practical mining requirements.
Pit slope angles are based on recommendations provided by Call and Nicholas Inc. (CNI). Overall pit slope angles were provided along with the recommendation that interramp slopes could be up to 3-degrees steeper. The shallow east dipping beds of the Paleozoic rock formations is the controlling factor for the 36-degree overall slopes in these rocks on the west pit wall.
The mine production schedule that is presented in Table 16-1 was developed using the phase designs, and the required leach pad feed rate to produce ~175 million pounds of recoverable copper per year. Sufficient waste is moved during the mine life to assure continued release of the required heap material. The cut-off grade of the mineralized material is generally $0.01 net of process. There are several years where cutoff grade was raised to maintain an annual feed of 175 million pounds of recoverable copper(years 7-10 and 14-19).
The waste storage areas (WRD) are east and west of the Gunnison pit and southeast of the Strong & Harris pit. The waste dumps are planned to be constructed in 50 ft lifts at an angle of 2.5:1.
| M3-PN210313.007 31 March 2026 Revision 0 | 9 |
GUNNISON PROJECT Form 43-101F1 Technical Report |
Mining is planned to be executed using automated haulage with the remainder of the equipment being a conventional open pit mining fleet. The reference to specific equipment manufacturers is to illustrate equipment size and is not to be considered a recommendation by Independent Mining Consultants. Production drilling is expected to be accomplished with 141,000lb pull-down force class drills with mast lengths capable of single pass drilling 50 ft benches. Holes will be loaded with ANFO when dry and an emulsion slurry when wet. Hydraulic front shovels with 38 to 44-yard buckets are planned to load a majority of the material with a 30-yard front-end loader available to provide loading flexibility. The front-end loader is also assumed to re-handle 15% of material at the crusher as necessary. Haul trucks are planned to be 320-ton class trucks with 3,500 hp engines. Haul truck productivities are based on haulage time simulations for annual waste and leach material haul profiles. A fleet of auxiliary equipment to support the main operating equipment will be required. This will be comprised of 500 hp rubber-tired dozers, 600 hp track dozers, motor graders with 24-ft mold boards, 100-ton haul trucks fitted with 20,000-gallon water tanks and other support equipment.
Mine operations and maintenance labor increases to 266 persons at the end of Year 5 and stays between 250 and 300 persons until labor requirements decline in the last year of mining. There are expected to be 48 salaried staff for supervision, engineering, geology, and mineralized material control.
| 1.14.1 | Pit Dewatering |
Pit dewatering will be required during mining because both the Gunnison and the Strong & Harris pits are mostly below the water table in highly fractured bedrock. A groundwater flow model for the Gunnison ISR project was completed as part of the 2016 Aquifer Protection Permit (APP) application reviewed and approved by the Arizona Department of Environmental Quality (ADEQ) and the 2016 Underground Injection Control (UIC) Permit application reviewed and approved by the U.S. Environmental Protection Agency (EPA).
The 2016 groundwater flow model was expanded and updated to allow inclusion of the Strong & Harris open pit. Dewatering flow rates were predicted for both the Gunnison and Strong & Harris open pits by simulating the advancement of the open pits over the life of the mine. The drainage into a pit at the Gunnison Project site is likely to result in significant flows into the pit, up to about 4,500 gpm during the pit advancement. The predicted dewatering rates may be high due to simplifications incorporated in the model simulation. This rate of dewatering is recognized to be high relative to other open pit mines in Arizona. However, the mineralized body at Gunnison is quite fractured and broken relative to other mineralized bodies in Arizona therefore a high rate of dewatering is expected. The pumping rate to maintain a dry pit at the Strong & Harris mine is predicted to rise to between 75 and 100 gpm.
| 1.15 | Recovery Methods |
The open pit mining result in a copper-bearing pregnant leach solution (PLS) from which copper is extracted using the well-established SX-EW process. The Project constructs an SX-EW plant in a single construction period prior to production to produce 175 mppa of cathode copper.
| 1.15.1 | Open Pit-Heap Leach Recovery Methods |
For the open pit-heap leach, mineralized oxide material from the open pit mine is placed on the leach pad as crushed material, described in Section 16. The oxide material will be irrigated with acidified raffinate pumped from the Gunnison Raffinate Pond. Copper-bearing PLS solutions are collected by an overliner collection system and discharged to the Leachate Collection Pond. PLS is pumped from the Leachate Collection Pond to the Gunnison SX Feed Tank.
The Gunnison open pit SX-EW Plant has the capacity to produce 175 mppa of cathode copper. This increase in capacity is accomplished by increasing the size of the SX mixer-settlers and adding additional electrowinning cells to the EW tankhouse. Commensurate increases to the capacities of the piping, tanks, and other equipment are required throughout the Gunnison open pit SX-EW Plant. The PLS from the leach pad provides the feed for the SX-EW process.
| M3-PN210313.007 31 March 2026 Revision 0 | 10 |
GUNNISON PROJECT Form 43-101F1 Technical Report |
The location of the leach pad is southeast of the Gunnison pit in an area where the natural drainage is toward the southeast. The full leach pad will be approximately 909.6 acres in area and oriented to match existing topography so that it allows gravity drainage of solutions down to the southeastern toe of the pad for collection and transport by pumping system to the JCM PLS pond with one set of pumps and to the SX Feed Tank with another set. The Leach Pad will be constructed in four phases. The initial phase of the leach pad consists of approximately 244 acres of lined area and is constructed during the initial construction period for the mine and processing plant. Phase 2 adds an additional 212 acres of lined area of leach pad to be constructed in Year -1. Phase 3 adds an additional 210.8 acres of lined area at the beginning of Year 1. Phase 4 completes the lined area for a total lined footprint of 840.8 acres in Year 3 to provide the capacity for the Life of Mine.
One hundred (100%) percent of the material mined for exploitation will be crushed using mineral sizers to minus 6”. Sixty (60%) of this material will be diverted to a belt conveyor to be stacked mechanically on the leach pad without material sorting. The remaining forty (40%) of the material, which will have been identified as high-carbonate material, will be subjected to material sorting. A preliminary design for a Material Sorting plant consists of 32 sorters that handle three different size fractions. The sorted material will be combined with unsorted mineralization that will be conveyed and stacked on the leach pad. Material sorting was prepared to reject high carbonate mineralization to lower acid consumption on the leach pad. Capital ($220.3 million) and operating costs ($212.2 million LOM) were developed for this study to include material sorting.
GCC plans to employ sulfide leaching using an enhanced leaching technology similar to what is being demonstrated at GCC’s Johnson Camp Mine. Sulfide-rich materials become significant in starting in Year 10 of the mine plan. A location for sulfide leaching plant equipment has been reserved in the Gunnison site plan adjacent to the northeast corner of the leach pad. Sustaining capital of $56 million and operating costs of $0.37 material processed/ton and recoveries of 60% have been estimated for the sulfide leach material.
Sulfuric acid for the heap leach option is provided by a molten sulfur burning sulfuric acid plant constructed prior to operation to provide the acid necessary for leaching and SX-EW process. The acid plant is designed to produce 2,700 short tons per day (stpd) of 98% sulfuric acid which is sufficient to meet the process demand in most years. Molten sulfur is delivered to the plant by rail. In years when the demand exceeds acid plant capacity, sulfuric acid will be delivered by rail tank cars.
| 1.16 | Project Infrastructure |
The northern extent of the Gunnison Pit requires relocation of Interstate 10 to be able to access the northern portion of the Gunnison Deposit. A portion of the freeway approximately 2.7 miles long will be rerouted to the north along with its interchange with Johnson Road. A new prefeasibility study was completed by Kimley Horn to relocate the Interstate. The preferred location of that interchange will be determined during roadway design in consultation with the Arizona Department of Transportation (ADOT), which has control of the Interstate and is the coordinating agency for the relocation design and construction. Access to the Gunnison SX-EW plant will be off Johnson Road south of the pit approximately 1 mile north of Dragoon.
The mine pit is located in the northern portion of the Gunnison Project area and is flanked by waste stockpiles to the east and west to store alluvial overburden and waste rock removed from the pit during the mining operation. Mineralized material removed from the pit is hauled to the leach pad located southeast of the pit. Crushed material is dumped on the leach pad, spread, ripped, and covered with a piping network to deliver acidified leach solution. The leach solution drains out of the southeast toe of the leach pad and collected as PLS in the Leachate Collection Ponds. The PLS is pumped to the SX Feed Tank for extraction in the Gunnison plant.
The Gunnison SX-EW plant will be constructed in the southeast corner of the site with a nominal copper production capacity of 175 mppa. The electrowinning building (tankhouse) will be a steel building with corrugated metal roofing and siding. It will contain 112 electrowinning cells on each end of the building (total of 224 cells) and a single automatic cathode stripping machine.
| M3-PN210313.007 31 March 2026 Revision 0 | 11 |
GUNNISON PROJECT Form 43-101F1 Technical Report |
The Gunnison Tank Farm is located downhill from the SX area and the tankhouse to facilitate gravity drainage of solutions to the Tank Farm. The Tank Farm has a concrete containment that drains to a sump with an oil-water separator to return spilled liquid to the proper location for recycling. There is a Plant Runoff Pond located downstream of the Tank Farm to capture any surface flows in the event of an upset condition at the plant.
Ancillary facilities needed to support the Gunnison Project include buildings, ponds, tanks, and trenches. Ancillary buildings include an Administration Building, Warehouse, Plant Maintenance building, Change House, Security Building (gatehouse), and Sulfuric Acid Plant-Cogeneration complex. Other facilities will include ponds, and tanks. A new assay lab facility will be constructed to handle production samples, solution assays, and cathode sampling.
Power for the facility will be tapped from an existing 69 kilovolt (kV) power line or from a 115 kV line that could be tapped if the power requirements are too high for the 69 kV line. The existing power line will terminate at the new Gunnison Substation. The requirement to feed the SX-EW from a higher voltage transmission line will be evaluated as the project progresses.
For make-up water, mine dewatering water will be pumped to the 500,000 gallon process water/firewater tank. The lower 300,000 gallons in the storage tank will be reserved for fire suppression. Process water for plant use will be taken from the storage tank above this reserve level for fire suppression.
The sulfur-burning sulfuric acid plant will be constructed south of the Gunnison processing plant along with the accompanying rail spur and loading-unloading facilities. The plant design will be increased to produce 2,700 stpd of concentrated sulfuric acid. The waste heat from the acid making process produces steam to generate 38 MW of electrical power from a steam turbine generator. Of that amount, 11.4 MW of power will be required for operation of the acid plant, leaving 26.6 MW for delivery back to the power grid. The sulfuric acid plant includes molten sulfur day tanks, sulfur burner and waste-heat boiler, drying and adsorption tower area, cogeneration building, water treatment building, power distribution building and substation, cooling towers, office building, sulfuric acid storage area, and a rail yard for unloading molten sulfur and sulfuric acid.
| 1.17 | Market Studies and Contracts |
The use of consensus prices obtained by collating the prices used by peers or as provided by industry observers and analysts is recognized by the Canadian Institute of Mining and Metallurgy (CIM) for technical reports and has the advantage of providing prices that are acceptable to a wide body of industry professionals (peers). These prices are generally acceptable for most common commodities, major industrial minerals, and some minor minerals.
The PEA has selected $4.60 per pound copper through the end of mine life. A Grade A cathode credit of $0.0425 per lb has been added to the long-term copper price, bringing the expected copper price to $4.6425 per lb.
Market studies indicate that the long-term prices for the major reagents are as follows.
| Sulfuric Acid | $210/st purchased |
| Sulfuric Acid | $190/st for excess sulfuric acid produced that is sold on open market |
| Molten Sulfur | $160/st delivered to site. |
The price for sulfuric acid is predicted to be $210/st. Based on a delivered sulfur cost of $160/ton, the cost of acid produced in GCC’s sulfuric acid costs are estimated to be $47.46 for the 2,700 stpd acid plant for the Gunnison Project.
| 1.18 | Environmental and Permitting |
The open pit mining and heap leaching option has not been permitted. The open pit requires surface disturbance and relocation of an interstate highway.
| M3-PN210313.007 31 March 2026 Revision 0 | 12 |
GUNNISON PROJECT Form 43-101F1 Technical Report |
Some additional environmental permits are required for an open pit mine at the Project. Federal, state, and local government existing environmental permits are listed in Table 20-1. A permit from ADOT will be required for the planned relocation of Interstate 10. The permit may require additional environmental studies, including cultural, biological, and native plant surveys, depending on the I-10 routing.
An Aquifer Protection permit (APP) exists for the prior ISR mining activities. This permit will require major modifications to accommodate the open pit and discharging facilities that have the possibility of impacting an aquifer. Facilities that may be constructed at Gunnison that may require an amended APP include leach pads, waste rock stockpiles, non-stormwater ponds, process solution ponds (PLS and Raffinate), re-injection wells for a portion of the open pit dewatering, and the acid plant. Open pits are not regulated facilities if passive containment can be demonstrated.
Other existing permits requiring modification include the Arizona Mined Land Reclamation Plan, Air Quality permits, and the existing Underground Injection Control permit to accommodate the open pit.
Water management associated with the open pit mine will include dewatering of the pit and run-on and run-off controls. As discussed in Section 16.9, dewatering is expected to generate up to 4,500 gpm during pit development. This water can be used for a variety of uses including dust control, makeup water for mineralized material leaching, third party use agreements, or reinjected into other areas of the aquifer. The Gunnison Project is located in the Willcox Basin, which was formally designated as an Active Management Area (AMA) by the Arizona Department of Water Resources (ADWR) in January 2025. As such, water use and reinjection may be subject to additional requirements under ADWR’s AMA program. Surface water will be diverted around the pit, leach pad, process plant, and other non-APP facilities. Water will be managed using engineered features such as diversions or retention structures.
Reclamation and closure must be conducted on all APP-regulated facilities in accordance with the stipulations of the APP permit at the end of operations. Non-APP facilities, such as buildings and infrastructure, will be reclaimed in accordance with the approved Mined Land Reclamation Program overseen by the Arizona State Mine Inspector’s Office. Reclamation of the pit (which is not expected to be an APP-regulated facility) will consist of erosion control. At closure, the heap leach pad (an APP-regulated facility) and the waste rock stockpiles (which may be regulated under APP) will be managed to prevent, contain, or control discharges. In the case of the heap leach pad, it is anticipated that closure will include neutralizing or rinsing of all spent mineralized material, elimination of free liquids, stabilization of heap materials, and recontouring of the heap to eliminate ponding. The waste rock stockpile will be recontoured in a similar manner to eliminate ponding and minimize infiltration. Process solution and non-stormwater ponds will be closed in accordance with the approved APP closure plan. Other facilities such as the plant and buildings will be removed and the land surface will be contoured and graded.
| 1.19 | Capital and Operating Costs |
| 1.19.1 | Capital Costs |
Estimated CAPEX, or capital expenditures, include two components: (1) the initial CAPEX to undertake the detailed design, pre-strip, construct, and commission the mine, plant facilities, ancillary facilities, utilities, and complete on and offsite environmental mitigation and remediation; (2) the sustaining CAPEX for facilities expansions, mining equipment replacements, expected replacements of process equipment and ongoing environmental mitigation activities. The Table 1-5 below summarizes the initial and sustaining CAPEX for the Project.
| M3-PN210313.007 31 March 2026 Revision 0 | 13 |
GUNNISON PROJECT Form 43-101F1 Technical Report |
Table 1-5: Summary of Project Capital Costs ($000’s)
Area |
Detail |
Initial CAPEX ($000s) | Sustaining CAPEX ($000s) |
Total CAPEX ($000s) |
Direct Costs |
Mine Costs | 280,302 | 51,802 | 332,104 |
| Processing Plant | 738,540 | 211,583 | 950,123 | |
| Infrastructure | 92,020 | 378,019 | 470,039 | |
| Freight | 55,707 | 15,999 | 71,706 | |
| Indirect Costs | 193,757 | 32,900 | 226,658 | |
| Owner's Costs, First Fills, & Light Vehicles | 23,657 | 0 | 23,657 | |
| Offsite Environmental Mitigation Costs | 0 | 0 | 0 | |
| Onsite Mitigation, Monitoring, and Closure Costs | 0 | 0 | 0 | |
| Total CAPEX without Contingency | 1,383,983 | 690,303 | 2,074,287 | |
| Contingency | 171,635 | 39,072 | 210,707 | |
| Total CAPEX with Contingency | 1,555,618 | 729,376 | 2,284,994 | |
The CAPEX estimate includes direct mining equipment and pre-stripping costs, process plant costs, and infrastructure such as the water systems, main substation, transmission lines, ancillary facilities, cement plant, sulfide plant, and highway relocation. The initial CAPEX also includes indirect costs for detailed design and engineering. Initial CAPEX also includes an estimate of contingency based on the accuracy and level of detail of the cost estimate. The purpose of the contingency provision is to make allowance for uncertain cost elements that may occur but are not included in the cost estimate. These cost elements include uncertainties concerning completeness, accuracy and characteristics or nature of material takeoffs, accuracy of labor and material rates, accuracy of labor productivity expectations, and accuracy of equipment pricing. The CAPEX estimates are considered to have an accuracy range of -25% to +30%.
The primary assumptions used to develop the CAPEX are provided below:
| ● | The estimate is based on 1st quarter 2026 costs. |
| ● | All cost estimates were developed and are reported in United States of America (US) dollars. |
| ● | Units of measure for this project are primarily in Imperial customary units. |
| ● | At the time of this estimate, engineering was approximately 3% complete. |
| ● | Contingency during the pre-production period is specific to each major component of the Project as determined by the various consultants. |
| ● | Qualified and experienced construction contractors will be available at the time of Project execution. |
| ● | No provision has been made for currency fluctuations. |
| 1.19.1.1 | Mine Capital Costs |
The mine capital includes two components: capital for equipment lease down payments/interest payments during pre-production and the cost of pre-stripping. Mine capital costs for mobile equipment were developed from the mine equipment list presented in Section 16. Mine capital costs including equipment and pre-production development are presented in Table 1-6. Initial mine capital is $280.3 million, while sustaining mine capital costs are $51.8 million. An additional $185.6 million of waste stripping costs between the Years 1 and 15 included in Table 1-11 are applied to sustaining capital costs as deferred stripping.
| M3-PN210313.007 31 March 2026 Revision 0 | 14 |
GUNNISON PROJECT Form 43-101F1 Technical Report |
Table 1-6: Summary of Mine Capital Costs ($000s)
Category |
Initial Capital | Sustaining Capital | Total Capital | ||
| Year -2 | Year -1 | Total | |||
| Preproduction Development | 106,742 | 130,829 | 237,571 | 237,571 | |
| Mining Equipment - Leased | 25,687 | 17,053 | 42,731 | 51,802 | 94,533 |
| Total | 132,420 | 147,882 | 280,302 | 51,802 | 332,104 |
| 1. | Assumes equipment lease to purchase at 10% down |
| 2. | Assumes interest only payments during pre-production |
| 1.19.1.2 | Plant Capital Costs |
Capital costs for the processing plant were estimated using budgetary equipment quotes, material take-offs (MTOs) for concrete, steel, and earthwork, estimates from vendors and consultants, and estimates based on experience with similar projects of this type. The direct capital cost estimate for the plant is shown in Table 1-7. Some of the costs and quantity estimates used by M3 were supplied by other consultants.
Table 1-7: Initial Process Direct Capital Cost
| Area Description | Initial ($000s) | Sustaining ($000s) | Total ($000s) |
| Plant General | 25,588 | 10,844 | 25,588 |
| Crushing, Stockpile, Material Sorting | 250,087 | 0 | 250,087 |
| Material Handling/Stacking | 215 | 0 | 215 |
| Leaching, Solution Ponds | 96,266 | 200,739 | 297,005 |
| Solvent Extraction (SX) | 60,024 | 0 | 60,024 |
| Tank Farm | 26,375 | 0 | 26,375 |
| Electrowinning (EW) | 83,160 | 0 | 83,160 |
| Reagents | 400 | 0 | 400 |
| Sulfuric Acid Plant | 196,423 | 0 | 196,423 |
| Plant Direct Capital Total | 738,540 | 211,583 | 950,123 |
The cost for the sulfuric acid plant was derived in 2021 by NORAM Engineering of Vancouver based on a conceptual design for the sulfuric acid plant at a capacity of 1,650 short tons per day (stpd). For the current 2026 Gunnison Open Pit PEA, the sulfuric acid plant cost was adjusted using the Power of 0.725 rule to a plant capacity of 2,700 stpd and then escalated to Q1 2026 dollars. The capital cost for the sulfuric acid plant is estimate at $196.4 million. Additional information regarding the sulfuric acid plant costs can be found in section 21.
A capital cost estimate for the integrated cement plant and limestone distribution infrastructure is included in the financial analysis for this project. Unlike the initial copper operation infrastructure, the cement plant is structured as expansion capital. Construction is scheduled for Years 4 and 5 of the mine life, allowing the facility to be funded entirely from cumulative project free cash flow following the payback of the initial copper project capital. The total direct expansion capital cost to construct the 1.2-million-ton-per-year capacity cement plant and associated limestone handling facilities is estimated at $321.42 million. Additionally, limestone pre-stripping capitalized costs of $4.1million are also included in the financial analysis. Additional information regarding the cement plant costs can be found in section 21.
| M3-PN210313.007 31 March 2026 Revision 0 | 15 |
GUNNISON PROJECT Form 43-101F1 Technical Report |
Infrastructure includes site utilities, ancillary facilities, the cement plant, the sulfide plant, and highway relocation. Table 1-8 summarizes the direct costs for onsite infrastructure. Infrastructure costs that were not estimated by M3 have the source listed in parenthesis.
Table 1-8: Infrastructure Capital Cost Summary
| Onsite Infrastructure | Initial ($000s) | Sustaining ($000s) | Total ($000s) |
| Fresh/Fire Water Systems | 6,288 | 0 | 6,288 |
| Main Substation, Transmission Power Line | 16,115 | 0 | 16,115 |
| Ancillary Facilities | 27,674 | 0 | 27,674 |
| Cement/Limestone Plant (Burgex) | 0 | 321,419 | 321,419 |
| Sulfide Plant (GCC) | 0 | 56,600 | 56,600 |
| Highway Relocation (Kimley Horn) | 41,943 | 0 | 41,943 |
| Total Infrastructure | 92,020 | 378,019 | 470,039 |
Indirect costs are those costs that cannot generally be assigned to a specific work area, as summarized in Table 1-9. This category includes “other indirect costs” that provide oversight and support the construction activities for the project.
Table 1-9: Indirect Capital Cost Summary
| Indirect Cost Items | Initial ($000s) | Sustaining ($000s) | Total ($000s) |
| Contractor Labor/Non-Labor Indirect costs | 55,559 | 13,289 | 68,848 |
| EPCM | 107,423 | 14,452 | 121,875 |
| EPCM Temporary Facilities | 4,476 | 0 | 4,476 |
| EPCM Commissioning | 4,383 | 0 | 4,383 |
| Vendor Support | 6,575 | 1,548 | 8,122 |
| Vendor Pre-commissioning | 2,192 | 516 | 2,707 |
| Vendor Commissioning | 2,192 | 516 | 2,707 |
| Commissioning and Capital Spares | 10,958 | 2,579 | 13,537 |
| Total Indirect Costs | 193,757 | 32,900 | 226,658 |
| 1.19.2 | Operating Cost (Opex) |
The total life-of-mine (LoM) costs, operating costs per short ton ($/st) of processed material, and dollars per pound ($/lb) of cathode produced are summarized in Table 1-10. The project operating costs include mine operating, process plant operating, and general and administrative costs (G&A). Total production costs add royalty expense, reclamation & closure, salvage value, and property & severance taxes. Total costs in each category are divided by the total tonnage of processed material or the total pounds produced to arrive at the values shown in the table below.
| M3-PN210313.007 31 March 2026 Revision 0 | 16 |
GUNNISON PROJECT Form 43-101F1 Technical Report |
Table 1-10: Operating and Production Costs
Area |
LoM ($000) |
$/st mineralized material processed | $/lb Copper Recovered (US$) |
| Mine Operating Cost1 | 4,226,693 | 7.82 | 1.33 |
| SX-EW Operating Cost | 512,427 | 0.95 | 0.16 |
| Heap Leach Operating Cost | 1,077,491 | 1.99 | 0.34 |
| G & A | 142,003 | 0.26 | 0.04 |
| Material Sorting | 212,173 | 0.39 | 0.07 |
| Sulfide Plant | 199,579 | 0.37 | 0.06 |
| Operating Costs | 6,370,366 | 11.78 | 2.00 |
| Royalties | 715,142 | 1.32 | 0.22 |
| Property & Severance Tax | 206,453 | 0.38 | 0.06 |
| Closure & Salvage Value | 1,598 | 0.00 | 0.00 |
| Other Production Costs | 923,192 | 1.71 | 0.29 |
| Total Operating Costs | 7,293,558 | 13.49 | 2.29 |
1. Mine Operating Costs includes total mining costs including lease payments less pre-stripping costs.
| 1.19.2.1 | Mine Operating Costs |
The LOM mine operating cost per lb over the LOM is 0.92/lb Cu plus the equipment leasing cost of $0.27/lb Cu, resulting in a full mine operating cost of $1.19/lb Cu.
Mine operating costs are summarized by material type: mineralized material, overburden waste, and hardrock waste (sedimentary) in Table 1-11. Pre-production mine operating costs of $237.6 million, deferred stripping costs of $185.7 million are included in Table 1-11 below but are applied as Capital costs. Limestone mining costs of $230.6 million are included in Table 1-11 but are allocated elsewhere in the cash flow model. The total mining cost per short ton of mineralized material not including equipment lease payments is $5.61, which equates to $1.12/lb Cu. After adding equipment leasing costs, then subtracting the pre-stripping, deferred stripping and limestone mining costs, the total mined operating cost is $1.19/lb Cu.
| M3-PN210313.007 31 March 2026 Revision 0 | 17 |
GUNNISON PROJECT Form 43-101F1 Technical Report |
Table 1-11: Summary of Mine Operating Costs
Mined Type |
LoM ($M) |
$/st Mined Type |
$/st Mineralized Material Processed | $/lb Copper Recovered (US$) |
| Mined Mineralized Material | 1,223.8 | 0.54 | 1.91 | 0.38 |
| Waste – Sedimentary | 1,151.8 | 0.50 | 1.80 | 0.36 |
| Waste – Alluvium | 1,223.8 | 0.54 | 1.91 | 0.38 |
| Total Mined Costs1 | 3,599.4 | 1.58 | 5.61 | 1.12 |
| Additional Cost of Lease Payments | 864.8 | 0.38 | 1.35 | 0.27 |
| Total Mined Costs including Lease Payments | 4,464.3 | 1.96 | 6.96 | 1.39 |
| Pre-Stripping Cost | (237.6) | (0.10) | (0.37) | (0.07) |
| Deferred Stripping Cost | (185.7) | (0.08) | (0.29) | (0.06) |
| Limestone Mining Cost | (230.6) | (0.10) | (0.36) | (0.07) |
| Total Mined Operating Costs | 3,810.4 | 1.67 | 5.94 | 1.19 |
| 1.19.2.2 | Plant Operating Costs |
The operating costs assume a heap leach with a planned average placement of 28.2 million short tons per year and an SX-EW facility producing copper cathodes. The process plant operating costs are summarized by the categories of labor, electric power, reagents & wear parts, maintenance parts, and supplies and services. Table 1-12 lists the operating costs for the Heap Leach and Table 1-13 lists the operating costs for the SXEW.
Table 1-12: Heap Leach Opex Summary by Cost Element
Operating & Maintenance |
LoM Operating Cost ($000) | $/st mineralized material processed | $/lb Copper Recovered (US$) | % |
| Labor | 78,788 | 0.15 | 0.02 | 7.3% |
| Electrical Power | 217,879 | 0.40 | 0.07 | 20.2% |
| Reagents | 756,415 | 1.40 | 0.24 | 70.2% |
| Maintenance Parts | 23,186 | 0.04 | 0.01 | 2.2% |
| Supplies and Services | 1,222 | 0.00 | 0.00 | 0.1% |
| Total | 1,077,491 | 1.99 | 0.34 | 100.0% |
| M3-PN210313.007 31 March 2026 Revision 0 | 18 |
GUNNISON PROJECT Form 43-101F1 Technical Report |
Table 1-13: SX-EW Opex Summary by Cost Element
Operating & Maintenance |
LoM Operating Cost ($000) | $/st mineralized material processed | $/lb Copper Recovered (US$) | % |
| Labor | 135,145 | 0.25 | 0.042 | 26.4% |
| Electrical Power | 218,660 | 0.40 | 0.069 | 42.7% |
| Reagents | 91,431 | 0.17 | 0.029 | 17.8% |
| Maintenance Parts | 52,409 | 0.10 | 0.016 | 10.2% |
| Supplies and Services | 14,782 | 0.03 | 0.005 | 2.9% |
| Total | 512,427 | 0.95 | 0.16 | 100.0% |
| 1.19.2.3 | General and Administrative Operating Costs |
General and Administrative (G&A) costs include items such as site management, accounting, human resources, environmental and safety compliance, laboratory, community relations, communications, insurance, legal, training, and other costs not associated with either mining or processing. The LOM G&A cost is shown in Table 1-14 below and includes the $/st processed material and $/lb of copper.
Table 1-14: Summary General and Administrative Operating Cost
Item |
LoM Operating Cost ($000) |
$/st mineralized material processed | % |
| Labor | 66,114 | 0.12 | 44.7% |
| Accounting (excluding labor) | 1,408 | 0.00 | 1.0% |
| Safety & Environmental (excluding labor) | 1,221 | 0.00 | 0.8% |
| Human Resources (excluding labor) | 939 | 0.00 | 0.6% |
| Security (excluding labor) | 1,408 | 0.00 | 1.0% |
| Assay Lab (excluding labor) | 5,634 | 0.01 | 3.8% |
| Office Operating Supplies and Postage | 939 | 0.00 | 0.6% |
| Maintenance Supplies | 2,817 | 0.01 | 1.9% |
| Power | 1,408 | 0.00 | 1.0% |
| Communications | 1,878 | 0.00 | 1.3% |
| Small Vehicles | 2,817 | 0.01 | 1.9% |
| Claims Assessment | 469 | 0.00 | 0.3% |
| Legal & Audit | 6,573 | 0.01 | 4.4% |
| Consultants | 4,695 | 0.01 | 3.2% |
| Janitorial Services | 1,408 | 0.00 | 1.0% |
| Insurances | 37,558 | 0.07 | 25.4% |
| Subs, Dues, PR, and Donations | 1,127 | 0.00 | 0.8% |
| Travel, Lodging, and Meals | 3,756 | 0.01 | 2.5% |
| Recruiting/Relocation | 3,756 | 0.01 | 2.5% |
| Community Relations | 1,878 | 0.00 | 1.3% |
| Total | 147,802 | 0.27 | 100.0% |
| M3-PN210313.007 31 March 2026 Revision 0 | 19 |
GUNNISON PROJECT Form 43-101F1 Technical Report |
| 1.20 | Economic Analysis |
The financial evaluation presents the determination of the Net Present Value (NPV), payback period (time in years to recapture the initial capital investment), and the Internal Rate of Return (IRR) for the Project. Annual cash flow projections were estimated over the life of the operation based on the estimates of capital expenditures and production cost and sales revenue. The sales revenue is based on the production of a copper cathode for open pit mining.
New facilities include Crushing-Conveying system, the Heap Leach Pad, SX-EW plant, the facilities at the Mine Services Area, the ancillary buildings located at the SX-EW plant, and the sulfuric acid plant.
Infrastructure changes include realignment of Interstate 10 in the vicinity of the Gunnison open pit, rerouting/relocating the powerlines and substations for the new Gunnison SX-EW and installation of the rail spur into the Gunnison property and the railyard.
The sulfuric acid plant has been upsized from 1,650 stpd to 2,700 stpd to meet the new acid demand for the heap leach option.
| 1.20.1 | Plant Production Statistics |
The design basis for the process plant production is 175 mppa of copper cathode in a single large SX-EW facility. To achieve that production, up to the design capacity of approximately 32,000 gpm of PLS will be pumped from the PLS pond to the Gunnison plant.
Average annual production is projected to be approximately 174 million pounds of copper cathode over the 19-year life of mine. Total production for the life of the operation is projected at approximately 3,187 million pounds of copper.
| 1.20.2 | Copper Sales |
The copper cathodes are assumed to be shipped to buyers in the US market, with sales terms negotiated with each buyer. The financial model assumptions are based on experience with copper sales from similar operations in the US.
| 1.20.3 | Working Capital |
A 15-day delay of receipt of revenue from sales is assumed for accounts receivables. A delay of payment for accounts payable of 55 days is also incorporated into the financial model. An allowance for initial replacement parts inventory for the plant is also included. All the working capital is recaptured at the end of the mine life and the final value of these accounts is zero.
| 1.20.4 | Revenue |
Annual revenue is determined by applying estimated metal prices to the annual payable metal estimated for each operating year. Sales prices have been applied to all life of operation production without escalation or hedging. The revenue is the gross value of payable metals sold before treatment charges and transportation charges. The average copper price used in the evaluation is $4.64/lb for the life of the mine.
| 1.20.5 | Royalty |
There are three entities that are entitled to royalties: the State of Arizona, Greenstone and Altius. The State has a sliding scale royalty estimated at 5.5%, applied only to copper produced from State land.
| M3-PN210313.007 31 March 2026 Revision 0 | 20 |
GUNNISON PROJECT Form 43-101F1 Technical Report |
The Greenstone royalty is paid at the rate of 3.0% of the value of copper produced, while the Altius royalty is paid at a flat rate of 1.50%.
The Bowlin royalty has an estimated LOM cost of $500,000, which equates to an incremental cost of $0.002/lb Cu. This royalty has not been included in the LOM discounted cash flow.
Royalties for the life of the operation are estimated at $715.1 million and average $0.22 per pound of copper recovered. The Stream for the life of the operation are estimated at $310.9 million and average $0.10 per pound of copper recovered.
| 1.20.6 | Property and Severance Taxes |
Property and severance taxes are estimated to be $206.4 million and average $0.06 per pound of copper recovered. Property taxes were estimated to be approximately $3.5 million per year during copper production and $0.7M thereafter, totaling $97.9 million for the life of the operations. Severance taxes are calculated as 2.5% of net proceeds before taxes from mining. Severance taxes are estimated to be approximately $108.6 million for the life of the operation.
| 1.20.7 | Reclamation and Closure |
An allowance for reclamation and closure costs is estimated to be $92.6 million ($0.034/lb copper cathode). Reclamation and closure activities are assumed to occur for 3 years beginning the year after mining has ceased.
| 1.20.8 | Income Taxes |
Taxable income for income tax purposes is defined as metal revenues minus operating expenses, royalty, property and severance taxes, reclamation and closure expense, depreciation, and depletion. The combined federal and state corporate income tax rate in Arizona is 25.9 percent and is applied to ‘taxable income’ derived from the Gunnison Project.
Income taxes are estimated by applying state and federal tax rates to taxable income. The primary adjustments to taxable income are tax depreciation and the depletion deduction. Income taxes estimated in this manner total $1,788.1 million for the life of the Project.
| 1.20.9 | Net Present Value (NPV) and Internal Rate of Return (IRR) |
The economic results after taxes for the Project, as shown in Table 1-15, indicate an Internal Rate of Return (IRR) of 22.5% and a payback period of 3.9 years. The Net Present Value (“NPV”) before taxes is $1.96 billion at an 8% discount rate using the mid-year convention. The analysis assumes 100% equity financing.
Table 1-15: Economic Results
| Item | Units | Base Case |
| Life of Mine | # years | 21 |
| Recovered Copper Cathode | millions lbs | 3,187 |
| Copper Price | $/lb | 4.6425 |
| Initial Capital | $ millions | 1,555 |
| Expansion Capital | $ millions | 682 |
| Sustaining Capital | $ millions | 587 |
| Payback Period | # years | 3.9 |
| M3-PN210313.007 31 March 2026 Revision 0 | 21 |
GUNNISON PROJECT Form 43-101F1 Technical Report |
| Item | Units | Base Case |
| Internal Rate of return (after-tax) | % | 22.5% |
| Copper Cash Cost (C1) | $/lb Copper recovered | 1.70 |
| All-In Copper Sustaining Cost (AISC) | $/lb Copper recovered | 2.05 |
| Net Present Value @ 8% (after-tax) | $ millions | 1,959 |
The PEA is preliminary in nature and includes inferred mineral resources that are considered too speculative geologically to have the economic considerations applied to them that would enable them to be categorized as mineral reserves. There is no certainty that the conclusions reached in the PEA will be realized. Mineral resources that are not mineral reserves do not have demonstrated economic viability. The Project’s after-tax economic results show greatest sensitivity to copper price fluctuations, followed by initial capital expenditures and operating cost changes. Table 1-16, Figure 1-2 and Figure 1-3 below illustrate these sensitivities.
Table 1-16: Sensitivity Analysis – Open Pit
| Copper Price Sensitivities | Units | $4.25/lb | $4.60/lb | $5.00/lb | $5.50/lb | $6.00/lb | $6.50/lb | $7.00/lb |
| NPV8 | M$ | 1,566 | 1,959 | 2,403 | 2,953 | 3,500 | 4,043 | 4,586 |
| IRR | % | 19.5% | 22.5% | 25.8% | 29.8% | 33.7% | 37.5% | 41.1% |
| Project Payback | years | 5.17 | 3.95 | 3.28 | 2.78 | 2.45 | 2.20 | 2.00 |
| LOM Cu Gross Revenue | M$ | 13,364,882 | 14,484,547 | 15,764,165 | 17,363,687 | 18,963,209 | 20,562,731 | 22,162,253 |
| LOM EBITDA | M$ | 13,520,441 | 14,588,504 | 15,808,666 | 17,333,310 | 18,857,478 | 20,381,280 | 21,904,794 |
| FCF - Unlevered (post-tax) | M$ | 9,031,003 | 9,867,503 | 10,818,120 | 12,005,261 | 13,192,045 | 14,378,553 | 15,564,846 |
| Operating Costs | % | NPV8 | IRR | Payback |
| Low | -20% | 2,311 | 25.0% | 3.4 |
| Mid-low | -10% | 2,136 | 23.8% | 3.7 |
| Base Case | 0% | 1,959 | 22.5% | 3.9 |
| Mid-high | 10% | 1,781 | 21.2% | 4.4 |
| High | 20% | 1,601 | 19.9% | 5.0 |
| Initial Capex | % | NPV8 | IRR | Payback |
| Low | -20% | 2,226 | 27.5% | 3.0 |
| Mid-low | -10% | 2,093 | 24.8% | 3.4 |
| Base Case | 0% | 1,959 | 22.5% | 3.9 |
| Mid-high | 10% | 1,826 | 20.6% | 4.7 |
| High | 20% | 1,692 | 18.9% | 5.3 |
| M3-PN210313.007 31 March 2026 Revision 0 | 22 |
GUNNISON PROJECT Form 43-101F1 Technical Report |
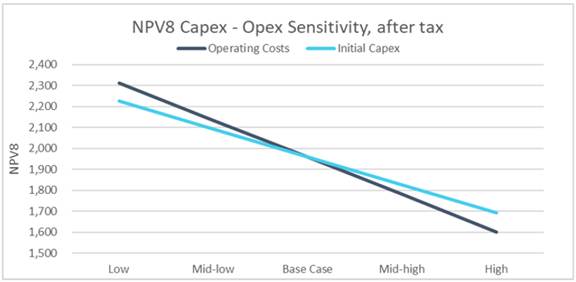
Figure 1-2: Open Pit Capex – Opex NPV Sensitivity – After Tax
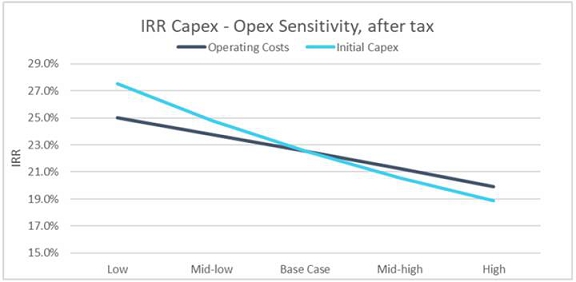
Figure 1-3: Open Pit Capex – Opex IRR Sensitivity – After Tax
| 1.21 | Adjacent Properties |
The Gunnison Project lies within the porphyry copper metallogenic province of the southwestern United States. It is located in the Cochise Mining District, which is dominated by Cu-Zn skarns. With the acquisition of the Johnson Camp Mine, GCC now controls a majority of historical producing properties in the district. Tungsten and minor lead-silver-gold have been produced in adjacent properties in the district (Cooper and Silver, 1964). In particular, tungsten has been historically produced in the area west of the Gunnison Project in the northern half of the Texas Canyon quartz monzonite stock before and during World War I. Lead-silver was also historically produced from Paleozoic limestones in the Gunnison Hills east of the Gunnison Project in the early 1900s (Cooper and Silver, 1964). Mineralization on adjacent properties is not necessarily indicative of the mineralization on the Gunnison Project. The author has relied on reports by others (as referenced) for the information presented in this section and has been unable to verify the information.
| M3-PN210313.007 31 March 2026 Revision 0 | 23 |
GUNNISON PROJECT Form 43-101F1 Technical Report |
| 1.22 | Interpretation and Conclusions |
A production schedule has been developed using input from independent consultants and existing Project data. The production schedule anticipates recovery of 85% of the mineral resources in the mine plan resulting in production of 3,187 million pounds of cathode copper over a mine life of 21 years.
The economic analysis indicates an after-tax NPV of $1,959 million at a 8% discount rate with a projected IRR at 22.5%. Payback is anticipated in 3.9 years of production. The economics are based on a $4.60/lb copper price with a premium of
$0.0425/lb added for producing Grade A cathode copper, a design copper production rate of 174 mppa for 21 years. Direct operating costs are estimated at $1.70/lb of copper, inclusive of Mining Operating costs. Initial CAPEX totals $1,555 million, which includes the mine, Gunnison SX-EW plant, leach pad and ponds, acid plant, rail spur, and owner’s costs. Sustaining capital costs of $587 million are projected for mine fleet replacement and additions to the leach pad.
The PEA is preliminary in nature and includes inferred mineral resources that are considered too speculative geologically to have the economic considerations applied to them that would enable them to be categorized as mineral reserves. There is no certainty that the conclusions reached in the PEA will be realized. Mineral resources that are not mineral reserves do not have demonstrated economic viability.
| 1.22.1 | Risks |
Certain risks and opportunities are associated with the Project, as is typical for mine development projects. These risks may include and are not limited to environmental permitting, title issues, taxation, public/political opposition, or legal impediments to operating this type of mining/processing operation at this location. The following project-specific risks have been identified along with the measures that GCC envisages to mitigate the risk.
| 1. | Slope Stability. Slope recommendations received from Call & Nicholas, Inc. (“CNI”) were based on recent strength testing as well as rock quality designation (RQD) data from core holes and experience at other Arizona mines in similar rock formations. Actual slope angles may have to be decreased, increasing the amount of waste handling required. |
Mitigation. Geotechnical drilling, along with further in-depth slope stability analysis, could result in achievable pit slope angles that are more shallow or steeper than the angles used in the analysis that will be presented in the report.
| 2. | Blasting Costs. Drilling and blasting in the weakly cemented alluvium overburden is assumed to be significantly more productive than in the bedrock. Overestimation of blasting productivity in the overburden would result in increased costs. |
Mitigation. Additional investigation of the weakly cemented alluvium could remove uncertainties for this productivity differential.
| 3. | Mine Design Uncertainty. The tonnage and grade expected to be placed on the leach pad could change as more drilling and engineering are completed. Metal prices, changes in metal recovery, or increases in operating costs could change the potential tonnage of heap leachable material. |
Mitigation. Additional investigation as the Project moves toward implementation should reduce the uncertainty.
| 4. | Copper Recovery. The heap leaching process for recovering copper from oxidized mineralization can be unpredictable. Metallurgical testing has established that coarse crushed mineralization is amenable to copper heap leaching and recovery. There is risk that additional testwork or actual performance could indicate the possibility of lower copper recoveries at the current crush size, acid application rate, or leach cycle estimates. |
| M3-PN210313.007 31 March 2026 Revision 0 | 24 |
GUNNISON PROJECT Form 43-101F1 Technical Report |
Mitigation. Operational strategies will involve adjusting crush sizes, flowrates and acid strengths based on operational experience to maximize infiltration rates and increase PLS grades.
| 5. | Leach Pad Flow Attenuation. Production of excess fines, compaction of lift surfaces on the leach pad, decrepitation of host rock mineralized material, and precipitation of minerals due to acid depletion could cause the formation of zones of low permeability. |
Mitigation. Placement and distribution of the leach material will be monitored to prevent compaction and enhance uniform distribution of leach solutions. Boreholes drilled through zones identified with low permeability can enhance vertical migration of solutions. Segregation or special treatment of materials that are identified as decrepitation (breaking down) and/or releasing fines may be necessary to mitigate this type of flow attenuation.
| 6. | Acid Consumption/Cost. Acid consumption is estimated to range from 24 to 87 pounds of acid per ton of leach material based on the various rock types and carbonate content. The actual acid consumption could potentially be higher. |
Mitigation. Controlling excess sulfuric acid consumption may require careful management and segregation of the materials as they are placed on the leach pad. The height of each lift could be increased to reduce the time that the lower portion is subjected to leach solutions consuming acid. Placing geomembranes or low permeability layers between lifts could isolate depleted, acid-consuming materials at the bottom of the pad. Studies into mineralized material sorting to reject high carbonate-low copper mineralization will be conducted to determine the applicability and economics of this technique. Mineralized material sorting has the potential to reduce acid consumption in practice. Building an acid production facility greatly reduces the cost of acid, which helps mitigate higher acid consumptions.
| 7. | Sulfide bacterial leaching is relatively new technology and may not produce expected results. |
Mitigation. Testwork from the Johnson Camp Mine Sulfide Leaching Demonstration may shed some light on the expected recoveries, acid consumption and costs.
| 8. | Mineralized material Sorting Capacity and Scaling. There is inherent risk in implementing material sorting at the proposed treatment rate which is higher than established industry practice. |
Mitigation. Investigate during material sorting tests the copper losses at higher throughputs to test the efficiency of material sorting at the projected rates that Gunnison is planning.
| 9. | Permitting Difficulties. Permitting mining projects in the western US and Arizona is unpredictable. Regulations and social attitudes can change. Although the Company has previously been able to obtain all operating permits in a reasonable time frame, there is no certainty this track record will continue. |
Mitigation. Permitting difficulties for changing the mining method for the deposit can be mitigated by developing support within the local community, identifying, and fixing potential areas of contention before they arise, getting support from community leaders in advance of applying for permits. Another measure is developing realistic permitting schedules that incorporate time to deal with challenges which also helps minimize deleterious consequences.
| M3-PN210313.007 31 March 2026 Revision 0 | 25 |
GUNNISON PROJECT Form 43-101F1 Technical Report |
| 10. | Equipment Financing. The initial mine CAPEX costs assume that equipment lease payments during pre-production will be interest-only payments. This is an unconventional equipment financing arrangement and may or may not be available at the time of project construction. |
Mitigation. Additional discussions with the financial arms of equipment manufacturers as the project progresses will provide a better understanding of what financing options are available.
| 1.22.2 | Opportunities |
Several opportunities have been identified which could enhance the viability and economic attractiveness of the Gunnison open pit. Many of these opportunities may be realized by removal of risk and uncertainty that are present at the PEA level.
| 1. | Acid Consumption. Preliminary data suggest that sorting of this material has the potential to greatly reduce acid consumption and volume of material leached by removing 40 to 50 percent of the process stream as unmineralized, higher acid consuming, waste. This would result in significant savings on operating costs. |
| 2. | Pit Slope Angles. The pit wall angles for the Gunnison open pit are considered reasonable based on the data available, however it is conceivable that pre-feasibility geotechnical data can steepen the pit walls in the gravel-alluvium, thus reducing pre-strip capital costs and life of mine waste mining costs. |
| 3. | Copper Recoveries. The anticipated copper recovery is an estimate based on the best interpretation of existing test work. This copper recovery could be exceeded in practice. Improvements in the rate of recovery would mean lower flows from the leach pad for the same level of copper production, lowering operational costs., or the increased grade could result in higher copper production (revenue) for the same operating cost. Improvements in total copper recovered have the obvious benefit of increasing total revenue during the life of the mine. |
| 4. | Increased Copper Price. The current financial analysis is based on an average, long-term copper price of $4.60 per pound based on current consensus pricing plus a $0.0425 per pound cathode premium. Current spot markets are currently 5% to 10% higher than long-term pricing estimates. Global demand increases for copper have the potential to drive copper prices higher, thereby increasing the economic (revenue) outlook for the Project. |
| 5. | Material Sorting Impacts to Recovery. Owing to the possibility of a constant leached residue assay irrespective of head assay, ASCu extractions from upgraded sorter material from the Martin formation and the Strong & Harris mineralization could be higher than predicted. |
| 6. | Acid Consumption for Sorted Materials. Consumption of sulfuric acid could be much lower than predicted for unsorted heap feed. However, the predicted acid consumptions may also be lower than would have applied prior to sorting. |
| 7. | Alluvium Mining. 61% of the waste mined in the pit is weakly cemented gravel (alluvium). The current design includes reduced drill and blast costs for this gravel including free digging of the top 50 feet however it is possible even more of this material will not need any drill and blast. This will be investigated in more detail during the planned PFS. |
| 8. | Alternative Mining of Alluvium. The current removal of alluvium envisions the use of blast-haul operations. There are potential cost savings by developing other means of removal such as use of conveyors, dozers, or earth movers instead of blast-load-dump equipment. These will be investigated during the PFS. |
| M3-PN210313.007 31 March 2026 Revision 0 | 26 |
GUNNISON PROJECT Form 43-101F1 Technical Report |
| 9. | In-pit Leaching. In-pit leaching provides an opportunity to reduce operating costs and improve leach recovery over the life of mined mineralized material. The nature of the Gunnison Deposit and aquifer would allow control of leach solutions. |
| 10. | Exploration Potential. Modern exploration activity has not occurred in the district. Exploration for the source of the porphyry copper sulfide mineralization at Gunnison has never been conclusively conducted and copper skarn deposits such as Gunnison are often associated with large nearby porphyry copper deposits. Significant areas of Earp Formation, Colina Limestone and Horquilla Limestone are under cover and have not been explored. These same formations host the mineralization in the Hermosa-Taylor deposits being developed by South 32 in southern Arizona. |
In-Pit Stockpiling. The mine plan has not considered the potential for in-pit waste stockpiles. Some areas of the open pit may be suitable for this, reducing hauling distances and costs.
| 1.23 | Recommendations |
Based on the results of this PEA, it is recommended that GCC consider proceeding with a PFS of the open pit project which is expected to take approximately 18 months. A feasibility study will be proposed on successful completion of the PFS.
Additional drilling for resource verification and geotechnical coverage is recommended to support mine planning. Updating the acid plant design for the selected capacity is also recommended. Additional planning and costing work are required to establish the schedule and costs for the relocation of Interstate 10 and the addition of the rail spur to the Union Pacific Railroad.
Additional drilling will be required for metallurgical studies. Pilot metallurgical heap leach testing is recommended to investigate the recovery kinetics and flow characteristics for the heap leach design.
A mine plan, heap leach design, SX-EW design and highway move design are necessary to complete the PFS.
GCC has proposed the list and budget for additional work that will support a pre-feasibility study shown in Table 1-17.
Table 1-17: Gunnison Project Pre-feasibility Budget
| Detail | Cost $US |
| Resource Upgrade | $9,343,000 |
| Metallurgy | $8,176,000 |
| Geotechnical | $210,000 |
| Pit design | $350,000 |
| Infrastructure design/PFS study | $1,710,000 |
| Total | $19,789,000 |
| M3-PN210313.007 31 March 2026 Revision 0 | 27 |
GUNNISON PROJECT Form 43-101F1 Technical Report |
| 2 | INTRODUCTION |
In 2024, Gunnison Copper Corporation (GCC) commissioned M3 Engineering & Technology Corporation (M3) to prepare a Preliminary Economic Analysis (PEA) covering the process and infrastructure design, capital cost, operating cost, and an independent Technical Report prepared in accordance with NI 43-101 standards for reporting mineral properties, for the Gunnison Open Pit Project (the “Project”) – Gunnison Deposit in Cochise County, Arizona, USA (“October 2024 Technical Report”).
This report is the updated March 2026 Technical Report, which focuses on material changes to the mining, processing, and downstream products from the Gunnison Deposit as an open pit-heap leach project. The largest change to the Project is to include material sorting of the high carbonate mineralized material to pre-concentrate copper grades and drastically reduce acid consumption of these materials on the leach pad. Another material change is to include the mining, stockpiling, and processing of high-quality limestone from the pit to produce cement, and high-value calcium carbonate products. Another material change to the October 2024 Technical Report is to update the copper prices forecast for revenue generation. A further material change is to include the Strong & Harris Deposit as part of the Project. Previously Strong & Harris was evaluated as a standalone operation.
The Gunnison Copper Project originally was started in 2020 as an in situ copper recovery (ISR) leaching, using techniques similar to in situ leaching that is widely used for extracting uranium. A wellfield consisting of injection wells, recovery wells, hydraulic control wells, and groundwater monitor wells was permitted and constructed. The in situ copper leaching produced lower than anticipated results in the first year of operation in 2020-21 due to a reduction in flow between injection and recovery wells. As a result, GCC began assessing conventional open pit mining as an alternative to develop the Gunnison copper deposit. Previous investigators (Cyprus Minerals, Phelps Dodge, Magma Copper) in the 1980s and 1990s had developed pit simulations to extract copper from the Gunnison Deposit. However the copper price at the time and difficulties with the underlying mineral rights holder convinced these companies to drop the leases before taking the project further. The forecasted economics from an open pit operation are well understood and is the preferred development path for the Gunnison copper Project.
This Technical Report includes an updated mineral resource, an open pit mine design, a material handling scheme that includes a primary crusher, a material sorting plant, a mechanically stacked heap leach pad, a staged SX-EW plant, a 2,700 stpd sulfuric acid plant, and infrastructure that supports a mining operation that can produce on average 175 mppa at full production. The mining rate from a conventional truck and shovel operation ranges from 50,000 short tons per day (stpd) to 120,000 stpd, with an average of 95,000 stpd.
Traditional open pit-heap leach operations are common in Arizona. There are several similar SX-EW operations around the state (Safford, Morenci, Ray, Silver Bell, Carlota, Pinto Valley) and several more in the development and permitting stages (Cactus Project, Santa Cruz Project). GCC has recently restarted the Johnson Camp operations with the construction of a new leach pad. The facilities required for an open pit project include the leach pad(s), waste dumps, process ponds, the SX-EW plant, ancillary support facilities, and normal mine infrastructure: power, water, fuel, and access roads. The Gunnison Project also includes two railroad spurs/sidings from the main United Pacific-Southern Pacific Railroad (UPSP) and a sulfur burning sulfuric acid plant and cogeneration facility. The acid is capable of supplying acid to the heap leach and SX-EW operations that costs significantly less than purchased sulfuric acid, partly due to the power credit from cogeneration. The big additions from the 2024 study include a covered stockpile for coarse crushed material that will be sorted, a screening plant, a secondary crusher for oversize material for the material sorting plant, three material sorting buildings for each of the three size fractions identified for sorting, and a collection of large capacity conveyors to handle leach material to the leach pad and material sorting rejects to the waste dump. In addition, GCC is investigating a joint venture to process limestone from the Gunnison pit into cement and other products that can be moved to markets via rail. Other capital items include the mining fleet and support equipment.
| M3-PN210313.007 31 March 2026 Revision 0 | 28 |
GUNNISON PROJECT Form 43-101F1 Technical Report |
The Gunnison (formerly known as I-10) Deposit contains both acid soluble copper oxides, soluble copper sulfides, and primary chalcopyrite sulfide mineralization. The mine plan presented in this Technical Report includes all three mineralization types for heap leaching. The heap leaching of sulfide mineralization will be enhanced by a process that increases leach kinetics.
On October 15, 2010, Gunnison Copper Corp. (formerly known as Excelsior Mining Corp.) (the “Company” or “GCC”), completed a reverse takeover (“RTO”) by acquiring all of the issued and outstanding common shares of AzTech Minerals, Inc. (“AzTech”) through a plan of merger with Excelsior Mining Arizona, Inc. (“GCAZ”). GCAZ was the surviving corporation in the plan of merger and acquired all assets of AzTech, including the Gunnison Project. The Company is listed on the TSX under the symbol “GCU”.
Legally, the Company is the parent of AzTech, (GCAZ) however, as a result of the share exchange described above, control of the combined companies passed to the former shareholders of AzTech. This type of share exchange is referred to as a “reverse takeover”. The executive management of AzTech continued on as the executive management of GCC.
GCC retained several consultants, including M3, to provide a review of prior work on the Project and to prepare technical and cost information to support a PEA and this Technical Report in accordance with the Canadian NI 43-101 reporting standards. Mr. John Woodson, P.E., SME-RM, of M3 is the principal author and Qualified Person responsible for the preparation of this Technical Report, as well as for the process plant infrastructure, development of the capital and operating costs and economic analysis, and for reviewing and verifying information regarding the relocation of Interstate 10 around the north side of the Gunnison open pit. Mr. Woodson has been to the Gunnison site numerous times while traveling but has not formally visited the Gunnison property. As the other Qualified Persons have visited the site, including colleagues from M3, Mr. Woodson has determined that a formal site visit to the Gunnison property was not required.
Other contributing authors and Qualified Persons responsible for preparing sections of this Technical Report include Abyl Sydykov of M3 for recovery methods; Dr. Terence McNulty, metallurgical consultant; Douglas Bartlett of Clear Creek Associates (CCA) for hydrology and environmental/social/permitting topics; Jacob Richey of Independent Mining Consultants, Inc. (IMC) for mining methods and mine costs; Thomas M. Ryan of Call & Nicholas, Inc. (CNI) for pit slope angles; and Jeffrey Bickel of RESPEC Company LLC (RESPEC) for the estimation of Gunnison Deposit resources and material sorting program results. Mr. Bickel visited the Gunnison Project site on February 26, 2026 and Casa Grande core shack most recently on September 22, 2025.
R. Douglas Bartlett, CPG, of Clear Creek Associates (CCA), is responsible for the preparation of Section 16.9 - Mining Methods and Section 20 – Environmental Studies, Permitting, and Social Impact. Mr. Bartlett visited the site March 2018.
Dr. Terence P. McNulty is responsible for reviewing the historical metallurgical testing programs for both the Gunnison development program and the Johnson Camp heap leach evaluation. Dr. McNulty is responsible for the preparation of Section 13 – Mineral Processing and Metallurgical Testing and Section 24 – Other Relevant Data and Information. Dr. McNulty visited the Johnson Camp Site in 1990s. Dr. McNulty has worked extensively on copper hydrometallurgical projects in the US and elsewhere.
Mr. Tyler Peck P.E., of Burgex Mining Consultants, is the Qualified Person responsible for evaluating the limestone markets, product pricing forecasts, and the economic feasibility of the cement and limestone portions of the PEA. Mr. Peck is responsible for the preparation of the cement and limestone portions of Section 18 and contributed to the limestone-related financial evaluations in Section 21. In preparing these sections, Mr. Peck supervised and reviewed the specialized market research, pricing analysis, and economic modeling conducted by Mr. Stuart Burgess, also of Burgex Mining Consultants. To evaluate the local infrastructure, rail access, and logistical factors critical to the downstream limestone market feasibility, Mr. Burgess conducted a site visit to the Gunnison property on January 12, 2026. Because this field assessment was completed and the QP’s scope of work was strictly limited to downstream market and economic evaluations, Mr. Peck determined that a personal site visit was not required.
| M3-PN210313.007 31 March 2026 Revision 0 | 29 |
GUNNISON PROJECT Form 43-101F1 Technical Report |
Mr. Robert Valceschini, P.E., of Geo-Logic Associates is the Qualified Person responsible for evaluating the proposed heap leach pad. Mr. Valceschini visited the Gunnison property on January 12, 2026, where he reviewed maps and drawings of the proposed leach pad area and conducted a site tour. The tour extended from the approximate northwest corner to the southeast corner of the proposed heap leach pad area. During the visit, general site topography and drainage features were observed.
M3 was responsible for developing process design criteria, process flowsheets, an equipment list, general arrangements of the site plan and process facilities, process ponds, infrastructure, capital cost, operating cost, PEA-level financial assessment, and integrating the work by other consultants into a final Technical Report prepared in accordance with Canadian NI 43-101 standards. M3 also scaled previous work by others for the sulfur-burning sulfuric acid plant that is included in the project.
| 2.1 | List of Qualified Persons |
Site visits and areas of responsibility are summarized in Table 2-1 for the Qualified Persons.
Table 2-1: Dates of Site Visits and Areas of Responsibility
| Author | Company | Designation | Site Visit Date | Section Responsibility |
John Woodson |
M3 Engineering & Technology Corporation |
P.E. SME-RM |
N/A |
Sections 1.1, 1.16, 1.17, 1.19 (except 1.19.1.1 and 1.19.2.1), 1.20, 1.22, 1.23, 2, 3, 18 (except 18.3 and 18.7), 19, 21 (except 21.2.1, 21.3.1, 21.2.4 and 21.3.8), 22, 25, 26, and 27. |
Jeffrey Bickel |
RESPEC Company LLC |
CPG |
February 26, 2026 |
Sections 1.2, 1.3, 1.4, 1.5, 1.6, 1.7, 1.8, 1.9, 1.10, 1.12, 1.21, 4, 5, 6, 7, 8, 9, 10, 11, 12, 13.5, 14, and 23 |
| Abyl Sydykov | M3 Engineering & Technology Corporation | PhD, P.E. | December 17, 2024 | Sections 1.15 and 17 (except 17.7) |
| Dr. Terence P. McNulty | T.P. McNulty & Associates | P.E., DSc | Johnson Camp Site in 1990s* | Sections 1.11, 13 (except 13.5) and 24 |
| Rob Valceschini | Geo-Logic Associates | P.E. | January 12, 2026 | Section 17.7 and 18.3 |
| Tyler Peck | Burgex Mining Consultants | P.E. | N/A | Section 18.7, 21.2.4 and 21.3.8 |
| R. Douglas Bartlett | Clear Creek Associates | CPG | May 15, 2019 | Sections 1.14.1, 1.18, 16.9, and 20 |
Jacob Richey |
Independent Mining Consultants, Inc. |
P.E. |
July 31, 2025 |
Sections 1.13, 1.14 (except 1.14.1), 1.19.1.1, 1.19.2.1, 15, 16 (except 16.2 and 16.9), 21.2.1, and 21.3.1 |
| Thomas M. Ryan | Call & Nicholas, Inc. | P.E. | October 18, 2023 | Section 16.2 |
* Visits to JCM which is adjacent to the Gunnison Project but not direct site visit to the Gunnison Project
| M3-PN210313.007 31 March 2026 Revision 0 | 30 |
GUNNISON PROJECT Form 43-101F1 Technical Report |
| 2.2 | Definitions of Terms Used in this Technical Report |
| ● | Lixiviant: Aqueous media, in this case, sulfuric acid, to extract copper from the oxide copper mineralization. |
| ● | Pregnant Leach Solution (PLS): Lixiviant after it is loaded with dissolved copper. PLS is stripped of copper in the solvent extraction process. |
| ● | Raffinate: Lixiviant after it has been stripped of copper in the solvent extraction process. Raffinate is re-acidified and pumped back to the wellfield to dissolve more copper. |
| ● | Diluent: Organic medium in which solvent extract takes place in the SX settlers. |
| ● | Extractant: Organic chemical that is used to extract copper from PLS into the diluent and then transfer the copper from the diluent to the electrolyte. |
| ● | Electrolyte: The aqueous solution carrying concentrated copper in solution which is pumped into the EW Tankhouse to electroplate copper onto steel blank sheets. The depleted electrolyte is recirculated to the SX circuit to load more copper. |
| ● | Sulfuric acid: A dense, colorless liquid chemical (H2SO4) used extensively to leach oxide copper. |
| ● | Sulfurous acid: The chemical species, H2SO3, which is formed by dissolving sulfur dioxide, SO2, in water was used briefly as a lixiviant for copper in the 1920’s. |
| 2.3 | Units and Abbreviations |
This Technical Report is in English units. Tons are short tons and ktons mean 1,000 short tons. Copper grades are in percentage by weight. All tonnages reported in this document are in dry tons. Lengths are in feet (except where noted) and currency is in U.S. dollars (except if noted otherwise).
Table 2-2: Units, Terms and Abbreviations
| Abbreviation | Unit or Term |
| % | percent |
| ° | degree (degrees) |
| °C | degrees Centigrade |
| $M | million dollars |
| µ | micron or microns, micrometer, or micrometers |
| A | Ampere |
| a/m2 | amperes per square meter |
| AA | atomic absorption |
| ADEQ | Arizona Department of Environmental Quality |
| ADWR | Arizona Department of Water Resources |
| APP | Aquifer Protection Permit |
| AQL | Aquifer Quality Limit |
| ASCu | Acid soluble copper |
| AzTech | AzTech Minerals, Inc. |
| M3-PN210313.007 31 March 2026 Revision 0 | 31 |
GUNNISON PROJECT Form 43-101F1 Technical Report |
| Abbreviation | Unit or Term |
| BADCT | Best Available Demonstrated Control Technology |
| BLM | US Department of the Interior, Bureau of Land Management |
| cfm | cubic feet per minute |
| cm | Centimeter |
| cm2 | square centimeter |
| cm3 | cubic centimeter |
| CoG | cut-off grade |
| CNCu | Cyanide soluble copper |
| Cu | Copper |
| CuS | Copper sulfide |
| dia. | Diameter |
| EA | Environmental Assessment |
| EIS | Environmental Impact Statement |
| EMP | Environmental Management Plan |
| FA | fire assay |
| famsl | feet above mean sea level |
| FS | Feasibility Study |
| ft | foot (feet) |
| ft2 | square foot (feet) |
| ft3 | cubic foot (feet) |
| ft3/st | cubic foot (feet) per short ton |
| g | gram |
| g/L | gram per liter |
| g/st | grams per short ton |
| GA | General Arrangement |
| gal | gallon |
| GCAZ | Excelsior Mining Arizona, Inc. |
| GCC | Gunnison Copper Corp. |
| GCH | Excelsior Mining Holdings, Inc. |
| g-mol | gram-mole |
| gpl | gram per liter |
| gpm | gallons per minute |
| Ha | hectares |
| HDPE | High Density Polyethylene |
| hp | horsepower |
| IMC | Independent Mining Consultants |
| in | inch |
| IRR | Internal Rate of Return |
| M3-PN210313.007 31 March 2026 Revision 0 | 32 |
GUNNISON PROJECT Form 43-101F1 Technical Report |
| Abbreviation | Unit or Term |
| ISR | In-Situ Recovery |
| JCM | Johnson Camp Mine |
| kg | kilograms |
| km | kilometer |
| km2 | square kilometer |
| ktons | thousand short tons/ kilotons |
| kst/d | thousand short tons per day |
| kst/y | thousand short tons per year |
| kV | kilovolt |
| kW | kilowatt |
| kWh | kilowatt-hour |
| kWh/st | kilowatt-hour per short ton |
| L | liter |
| L/sec | liters per second |
| lb | pound |
| LHD | Load-Haul-Dump truck |
| LoM | Life-of-Mine |
| M | meter |
| m.y. | million years |
| m2 | square meter |
| m3 | cubic meter |
| M3 | M3 Engineering & Technology Corporation |
| Ma | million years ago |
| mg/L | milligrams/liter |
| mi | mile |
| mi2 | square mile |
| MIW | Mine-influenced water |
| MM lb | million pounds |
| mm | millimeter |
| mm2 | square millimeter |
| mm3 | cubic millimeter |
| mppa | million pounds per annum (year) |
| Mst | million short tons |
| Mst/y | million short tons per year |
| MVA | megavolt ampere |
| MW | million watts |
| NI 43-101 | Canadian National Instrument 43-101 |
| NPV | Net Present Value |
| M3-PN210313.007 31 March 2026 Revision 0 | 33 |
GUNNISON PROJECT Form 43-101F1 Technical Report |
| Abbreviation | Unit or Term |
| PAST | Professional Archeological Services of Tucson |
| PEA | Preliminary Economic Assessment |
| PFS | Pre-Feasibility Study |
| PLS | Pregnant Leach Solution |
| PMF | probable maximum flood |
| POO | Plan of Operations |
| ppb | parts per billion |
| ppm | parts per million |
| psi | pounds per square inch |
| QA/QC | Quality Assurance/Quality Control |
| RC | reverse circulation drilling |
| RQD | Rock Quality Description |
| RT | Reverse takeover |
| SEC | U.S. Securities & Exchange Commission |
| sec | second |
| SG | specific gravity |
| st | short ton (2,000 pounds) |
| stpd | short tons per day |
| st/h | short tons per hour |
| st/y | short tons per year |
| SX-EW | Solvent Extraction (SX) - Electrowinning (EW) |
| t | tonne (metric ton) (2,204.6 pounds) |
| TCu | Total copper |
| TSF | Tailings Storage Facility |
| TSP | total suspended particulates |
| UIC | Underground Injection Control |
| USEPA | United States Environmental Protection Agency |
| V | volts |
| VFD | variable frequency drive |
| W | watt |
| WTP | Water treatment plant |
| XRD | x-ray diffraction |
| yd2 | square yard |
| yd3 | cubic yard |
| yr | year |
| M3-PN210313.007 31 March 2026 Revision 0 | 34 |
GUNNISON PROJECT Form 43-101F1 Technical Report |
| 3 | RELIANCE ON OTHER EXPERTS |
The authors, as Qualified Persons, relied upon historical data for the Gunnison Project provided by Gunnison Copper Corp. In the opinion of the authors, the Gunnison historical data, in conjunction with borehole assays conducted by GCC, are present in sufficient detail to prepare this Technical Report and are generally correlative, credible, and verifiable. The Project data are a reasonable representation of the Gunnison Project. Any statements in this Technical Report related to deficiency of information are directed at information that, in opinion of the authors, is recommended by the authors to be acquired.
The authors relied on a summary of title document review dated February 22, 2021 prepared by Lewis Roca Rothgerber Christie LLP, and review of underlying option agreements, in making legal determinations of the lands and claims at Gunnison for the purposes of Section 4.
GCC provided an internal preliminary feasibility study (PFS) report titled “I-10 Gunnison Final Pre-Feasibility Study. Realign I-10 & Reconstruct Johnson Rd TI” prepared by Kimley-Horn in 2025. M3 relied on the estimated cost for highway relocation contained in the Kimley Horn 2025 report.
RESPEC has relied on the report titled “Evaluation of Aggregate and High-Value Calcium Carbonate Resource Potential - Gunnison Copper,” dated October 2025 and prepared by Mr. Stephen Laird, Staff Geologist with Burgex Mining Consultants. The report evaluates the commercial potential of carbonate waste rocks at Gunnison. Mr. Laird has seven years of experience in subsurface materials evaluation, geotechnical investigation, and aggregate testing. Based on his relevant professional experience and direct involvement in the sampling and analysis programs, RESPEC considers reliance on his findings to be reasonable for the purposes of this technical assessment. In accordance with NI 43-101, RESPEC reviewed Mr. Laird’s report along with the associated chemical and physical laboratory test data completed by Burgex Mining Consultants. This review included an assessment of the analytical results, the testing methodologies, and the interpretations provided. RESPEC did not identify any significant risks or issues that would materially affect the valuation or suitability of carbonate waste rocks for industrial mineral and construction aggregate applications.
Clear Creek Associates (CCA) reviewed and updated the environmental report prepared for the Gunnison property and prepared Section 20 for the Gunnison open pit and heap leach operation. CCA has relied on information provided by GCC operations personnel and reports filed with agencies since 2019. A report by Haley & Aldrich (2014a) documents the environmental condition of the Gunnison property.
| M3-PN210313.007 31 March 2026 Revision 0 | 35 |
GUNNISON PROJECT Form 43-101F1 Technical Report |
| 4 | PROPERTY DESCRIPTION AND LOCATION |
The Project is held by GCC through its wholly owned subsidiaries Excelsior Mining Arizona, Inc. (GCAZ) and Excelsior Mining Holdings, Inc. (GCH). Acquisition of all mineral interests comprising the Gunnison Project from the James L. Sullivan Trust was completed in January of 2015. In December 2015, GCAZ purchased the assets of Nord Resources Corporation, as they relate to the Strong & Harris portion of the Gunnison Property (“Strong & Harris”), through a court-appointed receiver. Additionally, in October 2019 GCH purchased the Strong & Harris claims from the Strong & Harris Trust. These assets represent, among other things, the mineral rights to the Gunnison and Strong & Harris Copper deposits of the Gunnison Project (the Project).
The Project is located in Cochise County, Arizona, approximately 65 miles east of Tucson. Figure 4-1 is a general location map and property location near the I-10 freeway. The Project includes portions of Section 33 and 34 T14S R22E, Section 2, 10, 13, 14, 15, 22, 23, 24, 25, 27, 35 and 36 T15S R22E, Sections 1, 2, 11, 12, 13, 23, 24, 25, and 26 T16S R22E,
Sections 3, 4, 5, 6, 7, 8, 9, 10, 15, 16, 17, 18 and 19 T16S R23E, and Sections 19, 20, 29, 30, 31, 32 and 33 T15S R23E
and is centered at 32º 04’ 55” N latitude and 110º 02’ 40” W longitude. Total area of the Project is approximately 18,796 acres (7,606 Ha).
Figure 4-2 shows the claim status for the Gunnison Project as of February 2026. Table 4-1 contains a summary of the land packages that constitute the Gunnison Project. Following the table is brief descriptions of the claims, permits, deeds and land holdings. Appendix B contains a detailed list of all the mining claims and land packages.
| M3-PN210313.007 31 March 2026 Revision 0 | 36 |
GUNNISON PROJECT Form 43-101F1 Technical Report |
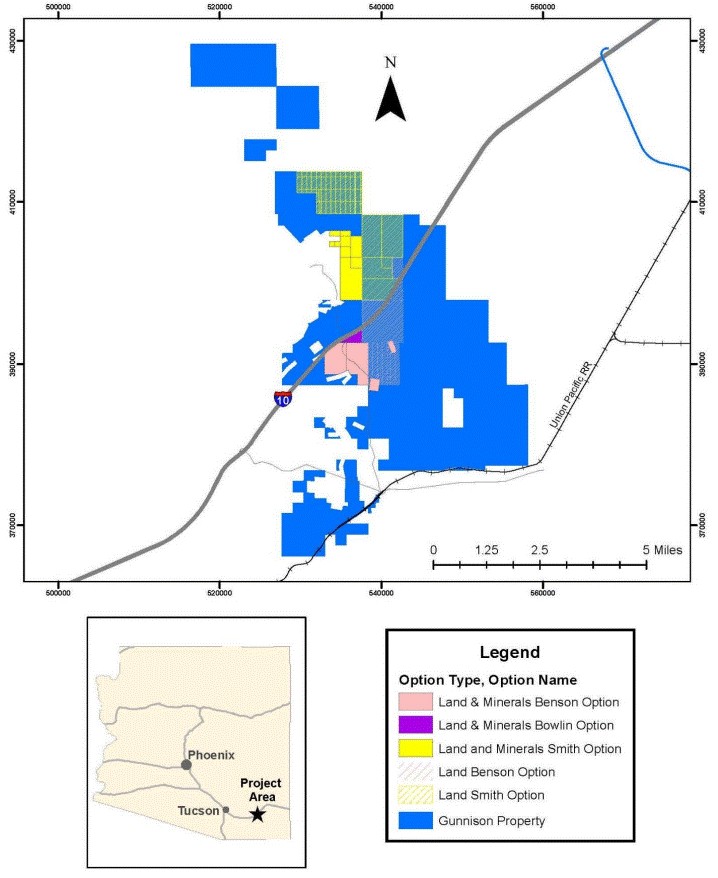
Source: GCC, 2026
Figure 4-1: Location of the Gunnison Project, Gunnison and South Star Deposits – February 2026
| M3-PN210313.007 31 March 2026 Revision 0 | 37 |
GUNNISON PROJECT Form 43-101F1 Technical Report |
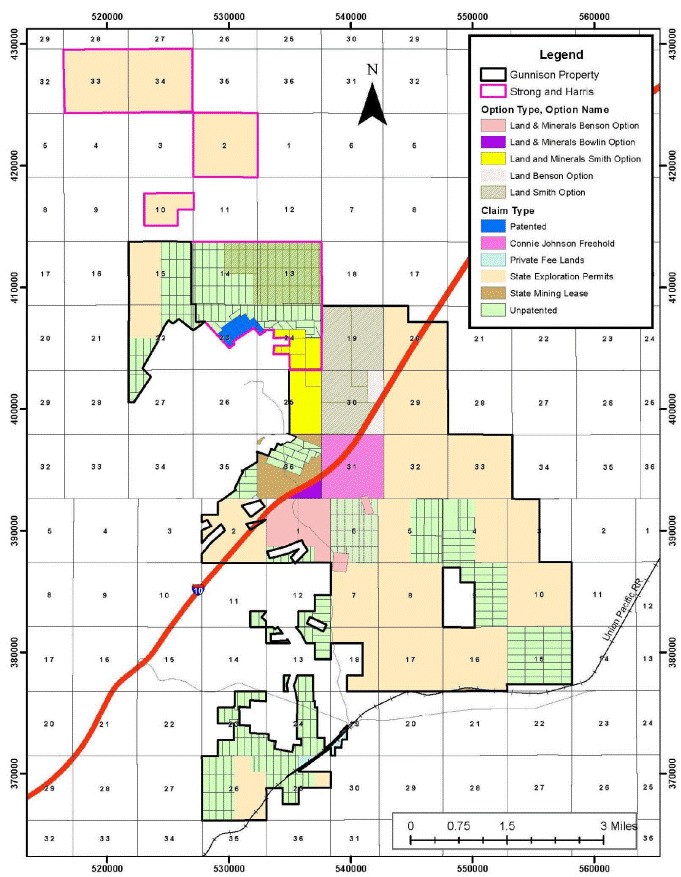
Source: GCC, 2026
Figure 4-2: Project Mineral Rights by Claim Type – February 2026
| M3-PN210313.007 31 March 2026 Revision 0 | 38 |
GUNNISON PROJECT Form 43-101F1 Technical Report |
Table 4-1: Summary of Land Packages that Constitute the Gunnison Project
Claim Type |
# of Claims | Approximate Area | Approximate Holding Costs | Surface Rights |
| Federal Patented Lode Mining Claims | 6 | 183 acres 74 hectares |
Nil | Controlled by GCAZ |
| Federal Unpatented Mining Claims | 409 | 6,344 acres 2568 hectares |
Annual $81,800.00 | Subject to US mining law |
| Arizona State Mineral Lease | 1 | 319 acres 129 hectares |
Annual $18,345.95 | Subject to AZ state laws |
| Arizona State Exploration Permits | 22 | 10,105 acres 4,089 hectares |
Annual up to $131,221.8 |
Subject to AZ state laws |
| Gunnison Freehold Mineral Rights via “Connie Johnson” Deed |
1 |
616 acres 249 hectares |
Nil |
Subject to deed of trust (see below) |
| Bowlin Option | 1 | 65 acres 25 hectares |
Nil | Subject to Bowlin Option (see below) |
| Benson Option | 3 | 562 acres 228 hectares |
Nil | Subject to Benson Option (see below) |
| Smith Option | 9 | 540 acres 219 hectares |
Nil | Subject to Smith Option (see below) |
| Freehold Land and Mineral Rights | 5 | 62 acres 25 hectares |
Annual $649.34 | Controlled by GCAZ |
| Total | 457 | 18,796 acres 7,606 hectares |
Annual $232,017.09 |
Ownership of the unpatented mining claims is in the name of the holder (locator), subject to the paramount title of the United States of America, under the administration of the U.S. Bureau of Land Management (“BLM”). Under the Mining Law of 1872, which governs the location of unpatented mining claims on federal lands, the locator has the right to explore, develop, and mine minerals on unpatented mining claims without payments of production royalties to the U.S. government, subject to the surface management regulation of the BLM. As of the Effective Date, annual claim-maintenance fees are the only federal payments related to unpatented mining claims, and GCC represents these fees have been paid in full to August 31, 2026. The current annual holding cost for Gunnison is estimated at $232,017.09, including the county recording fees.
GCC has rights to use the surface of the Project that is in the form of a State Mineral Lease and fee land parcels. The federal unpatented claims grant surface access but do not provide for surface ownership. Unpatented mining claims give the owner the right to develop and exploit valuable minerals contained within the claim, so long as the claim is properly located and validly maintained.
| 4.1 | Unpatented Mining Claims |
There are 409 unpatented mining claims held by Gunnison in the name of GCAZ and GCH totaling 6,344 acres (2,568 ha). A complete list of the claims is provided in Appendix B. The unpatented claims are for minerals only, with no surface ownership. The BLM requires that all unpatented claims use a rental year from September 1 through August 31; claims for which fees are not paid by August 31st are automatically forfeited. The claims otherwise have no expiration dates and under current mining law can be held indefinitely if properly maintained. The claims are located on the ground and the location descriptions are filed with the BLM.
| M3-PN210313.007 31 March 2026 Revision 0 | 39 |
GUNNISON PROJECT Form 43-101F1 Technical Report |
| 4.2 | State Mineral Lease and Prospecting Permits |
GCAZ and GCH hold the Arizona State Mineral Lease and Prospecting Permits. The tenements are administered by the Arizona State Land Department and are for minerals only. Rents, fees, and expenditure commitments are due each year and all payments and expenditure commitments are current. The 2026 expenditure commitment will be up to $101,251.5 with fees of up to $48,316.25. A detailed list of these fees and the due dates is supplied in Appendix B. A state royalty is payable on state leases for copper that is produced and sold. The amount is set by the Arizona State Land Department using a sliding scale royalty. The sliding scale royalty uses an upper and lower limit based on copper price and has the highest possible royalty rate of 8% and the lowest possible royalty rate of 2%. GCAZ is required to pay a minimum annual royalty regardless of production. The minimum annual royalty is $6,381.20 and is due each year on or before the anniversary of the commencement date of the lease and shall be a credit for GCAZ, fully recoupable against production royalties. Mineral lease and prospecting permit boundaries are described by the Arizona State Land Department. Surface rights include the right to use the surface for exploration, mining, mineral processing, and related activities subject to a state approved Mineral Development Report or Exploration Plan as the case may be. The mineral lease was renewed by the Arizona State Land Department June 16, 2014, and expires on June 15, 2034. The individual expiration dates of the Prospecting Permits are shown in Appendix B and range from 2026 to 2031. There are provisions in the Arizona State mining law to retain the area held by the permits, subject to meeting certain state requirements, by converting the permits to mineral leases or by applying for new exploration permits.
| 4.3 | “Connie Johnson” Deed |
GCC owns the mineral rights in Section 31, T15S., R23E, that were subject to the provisions of a Deed of Trust dated January 22, 1998, between GCAZ and the seller of the mineral rights. The Deed of Trust was released, and the mineral rights transferred to GCAZ through a Beneficiary Deed of Full Release and Full Reconveyance that was recorded on February 6, 2015. The area (approximately 616 acres or 249 ha) covers about 1/3 of the Gunnison Deposit, is for the minerals only and is defined by the boundaries of Section 31, T15S.and R23E. Surface and mineral rights are defined by the Deed of Trust and include “All mines and minerals in and under Section 31, Township 15 South, Range 23 East, Gila and Salt River Base and Meridian, containing 615.62 acres, more or less, together with the power to take all usual, necessary or convenient means for working, getting, laying up, dressing, making merchantable, and taking away the said mines and minerals, and also for the above purposes, or for any other purposes whatsoever, to make and repair tunnels and sewers, and to lay and repair pipes for conveying water to and from any manufactory or other building…”.
| 4.4 | Fee Simple Land |
Mineral and in some cases mineral and surface rights to a small portion of the South Star deposit are held directly by GCAZ. Mineral rights only pertain to Parcel F (approximately 15.3 acres), Section 25 T16S., R22E and Parcel A (approximately 39 acres), Section 19, T16S., R23E., Union Pacific Railroad that covers an easement along the Union Pacific Railroad. Surface and Mineral rights are held via Parcel D (approximately 14.24 acres), Section 19 T16S., R22E., and Parcel E (approximately 4.28 acres), Section 19 T16S., R23E. Holding costs for the fee simple land amount to approximately $649 per year in property taxes. Property boundaries are defined by the property descriptions on public record.
GCAZ has entered into an option agreement with certain landowners that provide GCAZ the right to acquire approximately 2563.05 acres of Fee Simple Lands that are referred to as the “Smith Option” and the “Bowlin Option”. The terms of the Smith Option agreement commenced in September 2022 and require an upfront fee of $40,000 and an annual fee of
$30,000. GCAZ has a period of seven years to exercise the option at a price that starts at $3,500/acre in Year 1 and increases over the seven year term at $500 per year to $6,500/acre in Year 7. The terms of the Bowlin
| M3-PN210313.007 31 March 2026 Revision 0 | 40 |
GUNNISON PROJECT Form 43-101F1 Technical Report |
Option agreement commenced in January 2023 and require an annual fee of $40,000.00. The term of the Bowlin Option agreement is seven years, provided that the option may be extended by an addition five years in return for an increased annual fee of $50,000.00 for years eight to twelve. The purchase price for the property under the terms of the Bowlin Option agreement is $2,000 per acre for a portion of the property and the remainder of the property will be valued by an independent appraiser at the time of option exercise, provided that such amount shall not be less than $15 million (adjusted annually by the US Consumer Price Index (CPI-U). There are also alternatives for GCC to acquire a smaller portion of the property or for the seller to require a relocation of its travel center to a new land parcel procured by GCC.
GCAZ has entered into an option agreement with certain landowners that provide GCAZ the right to acquire approximately 3898.14 acres of Fee Simple Lands that are referred to as the “Benson Option” The terms of the Benson Option agreement commenced in November 12, 2024 and require an upfront fee of $1,000,000 and an annual fee of $250,000 in years two, three, four, five and six. GCAZ has a period of six years to exercise the option at a price that starts at $28,000,000 in Year 1 (with the $1 million credited against the purchase price) and increases over the six year term at a rate of $2,000,000 per year (plus the $250,000 annual fee which is credited against the purchase price), to $37,000,000 in year six.
| 4.5 | Additional Royalties |
| 4.5.1 | Greenstone Royalty |
Greenstone Excelsior Holdings L.P. (“Greenstone”) holds a 3.0% gross revenue royalty over the Gunnison Project (excluding Strong & Harris). The gross revenue royalty is defined as royalty percentage times receipts, which is the sum of physical product receipts and deemed receipts. The Greenstone royalty applies to the entirety of the Gunnison Project (excluding Strong & Harris) and production therefrom.
| 4.5.2 | Triple Flag |
Triple Flag USA Royalties Inc. (“TF Royalties”) holds a 3.0% gross revenue royalty over the Strong & Harris portion of the Gunnison Project. The gross revenue royalty is defined as royalty percentage times receipts, which is the sum of physical product receipts and deemed receipts. The TF Royalties apply to the entirety of the Strong & Harris portion of the Gunnison Project and production therefrom.
The Gunnison Project (and certain portions of Strong & Harris) are also subject to a Metal Stream Agreement with Triple Flag International Ltd. (“Triple Flag”) that is applicable to all oxide minerals production from the parts of the Project located in the “Stream Area”. The Metal Stream Agreement is summarized in Table 4-2.
Table 4-2: Triple Flag Metal Stream Agreement for the Gunnison Project
| Stream Deliveries | GCAZ (“Seller”) is required to deliver Grade A Copper Cathodes in an amount equal to the “Payable Copper”. The amount of Payable Copper is calculated based on a percentage of the amount of copper that is sold and delivered to Offtakers under the terms of Offtake Agreements (for percentages see heading – Payable Copper). |
| Payment | The Buyer pays to the Seller a price for copper equal to 25% of the daily official LME Grade A Settlement quotation for copper quoted in U.S. Dollars, as published in the Metal Bulletin. |
| M3-PN210313.007 31 March 2026 Revision 0 | 41 |
GUNNISON PROJECT Form 43-101F1 Technical Report |
| Payable Copper | “Payable Copper” means a percentage of the Reference Copper equal to: | |||
| Scenario | Stage 1 (25 mppa) | Stage 2 (75 mppa) | Stage 3 (125 mppa) | |
| Upfront Deposit | 16.5% | 5.75% | 3.5% | |
| Upfront Deposit + Expansion Option | 16.5% | 11.0% | 6.0% | |
| At the current stage of the Project, the Buyer has made the initial upfront deposit ($65 million). The Metal Stream Agreement was completed placed on the planned ISR operation. As the annual production rate from the open pit operation is expected to exceed 125 mppa, it is assumed that the “Stage 3” stream percentage will be applicable. | ||||
| The “Expansion Option” provides Buyer the option to invest an additional $65 million in the event Seller approves an expansion to at least 50 mppa. | ||||
| 4.5.3 | Callinan Royalty |
Callinan Royalties Corporation (now a wholly owned subsidiary of Altius Minerals Corporation) holds a gross revenue royalty over the Gunnison Project. The gross revenue royalty is defined as royalty percentage times receipts which is the sum of physical product receipts and deemed receipts. The royalty rate is 1.625% while the plant capacity is less than 75 million pounds per annum and 1.5% once plant capacity is greater than or equal to 75 million pounds per annum.
| 4.5.4 | Bowlin Royalty |
Pursuant to the terms of the Bowlin Option agreement, Bowlin Travel Centers, Inc. has been granted a 1% gross revenue royalty on any copper mined and processed from the area marked “Land & Minerals, Bowlin Option”.
| 4.5.5 | RG Royalties |
RG Royalties, LLC holds a 2.5% net smelter returns (“NSR”) royalty interest in minerals produced and sold from six (6) patented claims that form part of the Strong & Harris Deposit. These six patented claims are also subject to the terms of a “Royalty Deed and Assignment of Royalty,” recorded with the Cochise County Recorder’s Office on June 19, 2009, at No. 2009-14847, and the “Grant of Production Payment” recorded with the Cochise County Recorder’s Office on June 10, 1999, at No. 1999-18419, as modified by a certain “Assignment of Production Payment” between Arimetco, Inc. and Styx Partners, L.P. (collectively, the “Production Payment Agreements”). The Production Payment Agreements provide for a non-participating payment of $0.02 per pound out of production during the calendar month in which copper produced from the 15 patented claims. The production payment is only payable when copper prices are in excess of $1.00 per pound and is capped at an aggregate of $1,000,000, of which $480,836 has been paid and or accrued as of 12/31/25.
| M3-PN210313.007 31 March 2026 Revision 0 | 42 |
GUNNISON PROJECT Form 43-101F1 Technical Report |
| 4.6 | Environment and Permitting |
| 4.6.1 | Gunnison Project |
The Gunnison Project operates under an Aquifer Protection Permit (APP), Air Quality Permit (AQP), a Resource Conservation and Recovery Act (RCRA) site specific ID number. All of these permits are issued and administered by the Arizona Department of Environmental Quality (ADEQ). In addition, Gunnison operates under an Underground Injection Control Permit (UIC) administered by the EPA. Gunnison also has a site wide Reclamation Plan approved by Arizona State Mine Inspector (ASMI).
Existing closure liabilities at Gunnison are covered under the APP, UIC and ASMI. These include closure of the existing ponds, wellfield, and disturbed grounds. There are existing bonds in place to cover all reclamation and closure obligations.
All permits will need major modifications for open pit mining.
| 4.7 | Other Significant Risk Factors |
There are no other known significant factors or risks that may affect access, title, or the right or ability to perform work on the property.
| M3-PN210313.007 31 March 2026 Revision 0 | 43 |
GUNNISON PROJECT Form 43-101F1 Technical Report |
| 5 | ACCESSIBILITY, CLIMATE, LOCAL RESOURCES, INFRASTRUCTURE AND PHYSIOGRAPHY |
The Gunnison Project (the Project) is located in a sparsely populated, flat to slightly undulating ranching and mining area about 65 road miles east of Tucson, Arizona. The Tucson metropolitan area is a major population center (approximately 1,000,000 persons) with a major airport and transportation hub including well developed infrastructure (highways and rail) and services that support the surrounding copper mining industry. The towns of Benson and Wilcox are nearby and combined with Tucson can supply sufficient skilled labor for the Project.
Access to the Gunnison Project is via the Interstate10 (I-10) freeway from Tucson and Benson in the west or Wilcox in the east. The Gunnison Deposit can be accessed via a short, improved dirt road heading approximately 1 mile east from the south side of the “Thing” roadhouse on the Johnson Road exit from I-10. Strong & Harris is reached via the improved unpaved Johnson Road travelling approximately 3.5 miles north from I-10.
The Project area encompasses approximately 15 square miles within Cochise County, Arizona and includes patented and unpatented mining claims, private land, Arizona State Prospecting Permits, a single Arizona State Mineral Lease, and direct ownership of mineral rights. Unpatented mining claims give the Owner exclusive right to possess the ground (surface rights) covered by the claim, as well as the right to develop and exploit valuable minerals contained within the claim, so long as the claim is properly located and validly maintained.
For the Fee Simple lands (private), both the land and mineral rights are owned by GCAZ or GCAZ has the option to acquire such land and mineral rights. The Connie Johnson Deed grants the mineral right to GCAZ as well as access to mining. The Arizona State Prospecting Permits gives lessee the right to explore and convert mineral discoveries to Arizona State Mineral Leases so long as the claim is validly maintained. Surface rights for the various land packages are sufficient for GCAZ to conduct its mining operations, subject to applicable laws and permits.
The main Union Pacific Southern Pacific (UPSP) railway runs 3 to 5 miles south of the Gunnison Deposit. Engineering plans, cost estimates, and preliminary discussions have been made to construct a siding and rail spur to the Gunnison Project to supply lime and tanker cars of sulfuric acid and/or molten sulfur for the production of sulfuric acid onsite after the initial years of copper production. A railroad spur could also be used to ship cathode copper.
The existing 69 kV electrical power line skirts the eastern border of the Gunnison Project and lands at the main Johnson Camp Mine substation. This power line can be tapped at the Gunnison process plant substation which lies slightly to the north of the UPSP rail line. Other higher voltage transmission lines coming from the Apache generating station, located just to the east of the Gunnison Project. The Gunnison Project including sulfuric acid plant at full production will be able to co-generate up to 27.8 MW of power to the electrical grid operated by Sulphur Springs Valley Electrical Cooperative.
Freshwater supply will be provided from dewatering wells located in and around the Gunnison open pit. There will be years when there is excess non-contact water produced that will be re-injected into the water table at a location on the northeast end of the property. Four wells have been budgeted in the capital cost estimate for these purposes.
The elevation on the property ranges from approximately 4,600 to 4,900 feet above mean sea level in terrain of the eastern Basin and Range physiographic province of southeastern Arizona. The climate varies with elevation, but in general the summers are hot and dry, and winters are mild.
The area experiences two rainy seasons in general, one during the winter months of December to March and a second summer season from July through mid-September. The summer rains are typical afternoon thunderstorms that can be locally heavy. Average annual rainfall for Dragoon is 13.2 inches and the average highs range from 58ºF in January to 94º F in June. Occasional light snow falls at higher elevations in the winter months. Exploration programs and mining activities operate year around in the region.
| M3-PN210313.007 31 March 2026 Revision 0 | 44 |
GUNNISON PROJECT Form 43-101F1 Technical Report |
Vegetation on the property is typical of the upper Sonoran Desert and includes bunchgrasses, yucca, mesquite, and cacti. Figure 5-1 shows the typical vegetation and topography of the Project.
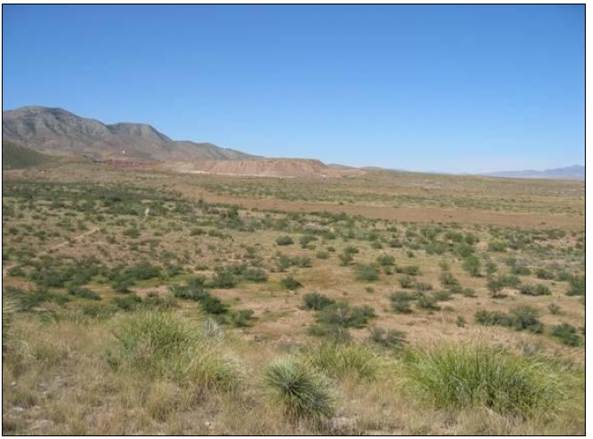
Source: RESPEC, 2024
Figure 5-1: Typical Vegetation and Topography of the Gunnison Project (Johnson Camp Mine and Strong & Harris in the background)
| M3-PN210313.007 31 March 2026 Revision 0 | 45 |
GUNNISON PROJECT Form 43-101F1 Technical Report |
| 6 | HISTORY |
Prior to GCC involvement, there was no direct mining history of the Gunnison Deposit or Strong & Harris, but the adjacent Cochise district has seen considerable copper, zinc, silver, and tungsten mining beginning in the 1880s and extending to the present day. Between 1882 and 1981, the district produced 12 million tons of mineralized material containing 146 million pounds of copper, 94 million pounds of zinc, 1.3 million pounds of lead, 720 thousand ounces of silver, and minor quantities of gold (Keith et. al., 1983). Much of the historical production came from small-scale underground copper-zinc mines located on what is now the Johnson Camp property controlled by GCC. The most significant of these producers were the Republic and Moore mines. From 1904-1940, the mineralized material from these mines reportedly contained 4 to 4.5 percent copper and 0.5-0.75 ounces of silver per ton (Cooper, 1964). The zinc content for this period was not reported. Post 1940, the mineralized material contained 1.5 to 3 percent copper, 5 to 10 percent zinc, and about 0.3 ounces of silver per ton. The Republic mine was the site of the historic concentrating plant in the district. Smaller underground mines in the area, such as the Peabody, reportedly yielded very high-grade mineralized material which averaged 7.5 percent copper, 4 ounces of silver per ton, and contained as much as 44 percent zinc (Cooper, 1964). Copper-oxide mineralization has been mined 1.5 miles northwest of Gunnison Deposit at the Johnson Camp open-pit operation since 1975, most recently by Nord Resources Corporation from 2008 until 2010. This property is now controlled by GCC. Overall, approximately 39 million tons of mineralized material and 187 million pounds of copper have been produced out of the Johnson Camp open pits.
In the 1960s, it was recognized that potentially economic copper-skarn mineralization could be identified remotely by magnetic highs related to the magnetite content of these mineralized bodies. As a result, a magnetic high lying southeast of the now nonexistent town of Johnson was drilled in the 1960s and the Gunnison Deposit was discovered.
Since Gunnison’s deposit discovery, several companies have explored the area. During this time period, extensive drilling and assaying, magnetic and IP surveys, metallurgical testing, hydrological studies, In-situ Recovery (ISR) tests, and preliminary mine design and evaluations have been undertaken.
By the late 1960s, the Gunnison Deposit was partly controlled by Cyprus and partly by private owners. In 1970, a division of the Superior Oil Company (Superior) joint ventured into the northern half of the Gunnison Deposit with Cyprus and the private owners. During the early 1970’s, Superior did most of the drilling and limited metallurgical testing of the Gunnison Deposit, and by early 1974 had defined several million tons of low-grade, acid-soluble copper mineralization. During this time, the southern portion of the Gunnison Deposit was controlled by Quintana Minerals Corporation, who drilled several diamond holes and conducted metallurgical testing.
By the late 1970s, Superior had relinquished its rights to the Gunnison Deposit. Cyprus maintained the ground holdings on the Gunnison Deposit for a time but did very little work. Cyprus handed most of the ground covering the Gunnison Deposit back to the private owners in 1977.
The focus since the 1970s has been to utilize ISR or a combination of ISR and open pits as a potential mining strategy. By the early 1980s, Mr. James Sullivan had gained full control of Section 6 of the Gunnison Deposit and by 1991 had gained control of Section 31 and Section 36 via the State Mineral Lease. Apparently, no work was done from the early 1980s through 1992.
| 6.1 | 1993 to 1998: Magma Copper and Phelps Dodge |
Magma Copper Company (Magma) optioned Gunnison Deposit from Mr. Sullivan in 1983. Magma drilled 8 holes, completed several metallurgical tests (some on six-inch diameter core), undertook limited hydrological studies, and calculated a copper-oxide resource. Magma’s interest in the Project was for ISR of the copper-oxide resource. Metallurgical test work completed by Magma indicated that greater than 70% recovery is possible with ISR. Shortly after being acquired by BHP-Billiton (BHP), Magma (BHP) relinquished the Project in 1997.
| M3-PN210313.007 31 March 2026 Revision 0 | 46 |
GUNNISON PROJECT Form 43-101F1 Technical Report |
After BHP relinquished its option on the Gunnison Deposit in 1997, Phelps Dodge Mining Company (Phelps Dodge) optioned the Gunnison Deposit and, in conjunction with Mr. Sullivan, drilled several holes on the periphery of the deposit. In 1998, before Phelps Dodge finished their investigation of both deposits, the company decided to focus its exploration activities outside the continental U.S. and returned the Project to Mr. Sullivan.
| 6.2 | 1999 – 2006 |
No work was done at the Gunnison Project in 1999 through 2006.
| 6.3 | 2007 – 2010: AZTECH MINERALS |
AzTech Minerals Inc. (AzTech) acquired an option for the Project in May 2007. Prior to this, Mr. Steven Twyerould and AzTech had spent nearly two years compiling, summarizing, and digitizing historical project data from over thirty years of investigations by Superior, Cyprus, Quintana, CF&I, Magma, Phelps Dodge, and James Sullivan. This process involved building a digital database, verifying historical data, re-interpreting the geology in 3D, and calculating a copper mineral resource.
Biological surveys were conducted for AzTech by Darling Environmental & Surveying, Ltd (Darling). It was found that no federally listed, endangered, threatened species, or proposed and candidate species for listing were present in the survey area from their known distributions and ranges. In addition, the survey area does not contain suitable habitat necessary for survival or life-history requirements of such species. Anthropological surveys conducted for AzTech by Darling indicated only random artifacts were present and occasional clusters of artifacts scattered outside of the area of mineralization. No burial sites or significant cultural sites were identified. Nine lines of ground magnetic data were also obtained, and a water-table depth study was completed in June 2010.
In June 2010, AzTech and GCC announced their intent to merge. The merger was completed in October 2010 when AzTech merged with GCAZ, with GCAZ as the surviving corporation.
| 6.4 | Historical Resource Estimates |
Historical resource estimates for the Gunnison Deposit were completed by Superior in 1974, Phelps Dodge in 1998, and AzTech in 2010 (Table 6-1). The Superior and Phelps Dodge estimates were not prepared in accordance with the requirements of NI 43-101 and CIM definitions. Mr. Bickel has not done sufficient work to classify these historical estimates as current mineral resources or mineral reserves and GCC is not treating the historical estimate as current mineral resources or mineral reserves. All of these historical estimates are superseded by the mineral resource estimates presented in Section 14 of this Technical Report and are not to be relied upon; they are presented here only for ease of reference and historical completeness.
Table 6-1: Comparison of Previous Oxide Copper Resource Estimates to AzTech 2010 Estimate
Source |
TCu Cut-off |
Gunnison Deposit | |
| Million Tons | TCu Grade | ||
| AzTech | 0.3% | 242 | 0.45% |
| Phelps Dodge | 0.3% | 300 | 0.47% |
| Superior Oil | 0.3% | 304 | 0.47% |
| TCu = Total Copper | |||
| M3-PN210313.007 31 March 2026 Revision 0 | 47 |
GUNNISON PROJECT Form 43-101F1 Technical Report |
| 6.5 | ISR Development Plan |
The Gunnison Project was previously designed as a copper in-situ recovery (ISR) mine using SX-EW to produce copper cathode. The ISR operation commenced ramp-up to production in 2020; however, it had operational issues related to low flow rates, so the Company began evaluating alternatives and opportunities to fix the ramp-up challenges. Well stimulation (small scale, shallow level, hydraulic fracking), has the potential to fundamentally change the performance of the wellfield and fix many of the low productivity issues. The Company has obtained a permit for well stimulation and the next step would be to conduct field trials. If well stimulation is successful, it could provide an operation with superior economics to the open pit operation and be in copper production much quicker than an open pit. However, due to the substantially improved viability of the open pit operation, GCC intends to focus the open pit operation as the alternative to ISR. The Company intends to maintain the optionality of future ISR operations and well stimulation trials as this remains an asset to the Company. This includes maintaining full compliance with all regulatory and permit requirements, including maintaining hydraulic control, pumping, monitoring and regulatory reporting.
| 6.6 | Strong & Harris Project Exploration History |
Modern-era exploration of the Strong & Harris project commenced in 1964. More than 100,000 feet of rotary and core drilling were done by various operators from the mid-1960s through 1992, including the Superior Oil Company (“Superior”), Cyprus Mining (“Cyprus”), Continental Exploration (“Continental”), Continental Materials, Beard Mining Company (“Beard”), AZCO and Manazanita Hills Inc. (“Manzanita”). Information on the historical drilling is summarized, to the extent known, in Section 10. The information in this section has been extracted and summarized from unpublished reports by the Ralph M. Parsons Company (Parsons, 1974), and Manzanita Hills Inc. (Manzanita, 1991).
According to Parsons (1974), oxide copper mineralization was discovered at what is now the Strong & Harris Deposit in drill cuttings “while a water well was being drilled, perhaps in the early 1960s.” A Mr. Strong and a Mr. Harris subsequently located mining claims on the present property.
| 6.6.1 | 1954-1957 Coronado Copper and Zinc Co. |
Coronado Copper and Zinc Co. was involved in district production and exploration since 1942 and at least until 1957 (Cooper and Silver, 1964). District-wide exploration in the 1950’s was focused around the underground operations in the Cochise district including the Republic Mine, the Moore Mine, and the Peabody and Black Prince Mine. A few of these drill holes were in the vicinity of the Strong & Harris Deposit. They were drilled from surface to test the continuity of mineralization of the Black Prince and Peabody Mines.
| 6.6.2 | 1964 - 1972 Cyprus Mining |
Cyprus optioned the property from Mr. Strong and Mr. Harris and drilled 36 holes during 1964 through 1968. Significant copper mineralization was encountered in 13 of the Cyprus drill holes. Additionally, Cyprus drilled 2 holes in 1972 in the “Peabody Sill” area of the deposit. These were likely on separate claims from the main Strong & Harris project at the time.
An induced polarization and resistivity (“IP/Res”) survey was carried out for “Congdon and Carey” by McPhar Geophysics during the time of the Cyprus drilling. The survey consisted of seven east-west lines using electrodes at 400 and 600 foot spacings (Hallof and Bell, 1967).
| 6.6.3 | 1967 - 1971 Continental Exploration |
Continental optioned the property from Strong & Harris in 1967 and drilled 31 core holes during 1968 through 1971. Some of the holes were used for down-hole induced potential and resistivity (IP/Res) surveys. Copper mineralization was encountered in 25 of these drill holes. Continental assigned their option to Superior via a lease agreement in 1971.
| M3-PN210313.007 31 March 2026 Revision 0 | 48 |
GUNNISON PROJECT Form 43-101F1 Technical Report |
| 6.6.4 | 1971 – 1976 Superior Oil Company |
Superior leased the Continental option in 1971 and drilled 63 core holes. By 1974, 51 of the 63 total holes had been drilled and at least 43 had intersected significant copper-zinc mineralization (Parsons, 1974). Superior commissioned an economic assessment of the Strong & Harris Deposit by Parsons in 1974 that included an estimate of reserves for a small underground operation and documented the exploration and assay procedures used by Superior. At some point in the 1970s, Superior terminated their interest in the property.
| 6.6.5 | 1980 New Beginnings Resources |
In 1980, a company known as New Beginnings Resources leased the property and carried out an IP/Res survey. New Beginnings drilled four holes with negative results (Manzanita, 1991). The authors are not aware of any further information concerning the New Beginnings exploration work and are unaware of when the New Beginnings lease of the property was terminated.
The author has no information on the property history during most of the 1980s but believe the property ownership remained with Mr. Strong and Mr. Harris through the 1980s. In 1983, a magnetic survey was conducted by Robert L. Clayton but maps and cross sections made from the survey have been lost, and no information is available on the methods and procedures used for the survey, or the anomalies identified.
| 6.6.6 | 1985-1988 Robert Durham |
Between 1985-1988 at least two exploration holes were drilled by Robert Durham who maintained ownership in the claims. Details regarding these holes are limited and largely based on public record.
| 6.6.7 | 1988 – 1989 Arizona Copper Company (“AZCO”) |
In 1988 AZCO optioned the Strong & Harris project and, in 1989, entered into a joint venture with Granges Inc. to jointly explore the property. Granges drilled one hole and terminated their joint venture participation (Manzanita, 1991).
| 6.6.8 | 1991-1992 AZCO and Manzanita Hills Inc. |
Manzanita entered into a joint venture with AZCO for the property in 1991. In 1992, drill hole SH-140 was drilled by AZCO. Otherwise, very little is known about any work done by Manzanita.
| 6.6.9 | 2019 – 2026 Gunnison Copper |
The Strong & Harris project was idle and no work was done from 1992 into 2019. Gunnison purchased the property in 2019. Gunnison’s work on the property has been summarized in Section 9.
| M3-PN210313.007 31 March 2026 Revision 0 | 49 |
GUNNISON PROJECT Form 43-101F1 Technical Report |
| 7 | GEOLOGICAL SETTING AND MINERALIZATION |
The Gunnison Project including the Gunnison and Strong & Harris copper deposit is located in southeastern Arizona within the Mexican Highland section of the Basin and Range province (Figure 7-1). The province is characterized by fault-bounded mountains, typically with large intrusive cores, separated by deep basins filled with Tertiary and Quaternary gravels. Generalized stratigraphy of the Project area is shown in Table 7-1 below.
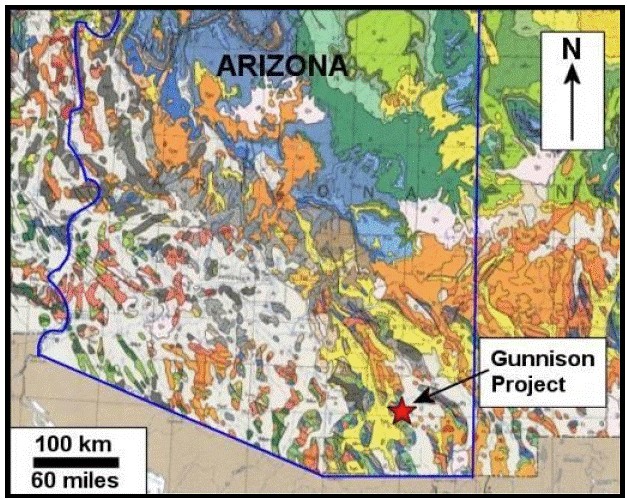
Figure 7-1: Regional Geologic Setting of the Gunnison Project (Modified from King and Beikman, 1974)
| M3-PN210313.007 31 March 2026 Revision 0 | 50 |
GUNNISON PROJECT Form 43-101F1 Technical Report |
Table 7-1: Stratigraphy of the Gunnison Project Region
(Modified from Weitz, 1979; Clayton, 1978)
| Rock Unit or Formation | Age |
Gunnison Project Geology |
Regional Geology |
| Basin Fill/Alluvium | Upper Tertiary and Quaternary | Unconsolidated boulders, sand, and gravel. | Stream laid gravels, sand and silt. |
| Texas Canyon Quartz Monzonite | Lower Tertiary | Quartz monzonite and related intrusions. | Intrusions important in mineralizing event. |
| Concha Limestone | Permian | Strong & Harris only. Local marble | Limestone |
| Scherrer Formation | Permian | Strong & Harris only. Local hornfels | Sandstone, siltstone, and limestone |
| Colina Limestone | Permian | Strong & Harris only. Local skarn, calc-silicate hornfels, and marble | Limestone |
| Earp Formation | Permian-Carboniferous | Strong & Harris only. Local skarn, calc-silicate hornfels, and marble | Limestone, dolostone, conglomerates, and sandstone |
| Horquilla Limestone | Middle Pennsylvanian | Pyroxene-rich calc-silicate hornfels and skarn, marble. | Limestone with abundant thin beds of shale. |
| Black Prince Limestone | Lower Pennsylvanian | Pyroxene-rich calc-silicate hornfels and skarn, marble. | Limestone with thin shale at the base. |
| Escabrosa Limestone | Lower Mississippian | Garnet-rich skarns and calc-silicate hornfels, marble. | Cliff forming limestone and dolomite. Copper skarns. |
| Martin Formation | Upper Devonian | Diopside-garnet skarns with diagnostic magnetite. | Dolomite with some shale and sandstone. Copper skarns. |
| Abrigo Formation | Upper Cambrian | Garnet-epidote-pyroxene-amphibole skarns and calc-silicate hornfels. | Shale, impure limestone and sandy dolomite. Copper skarns. |
| Bolsa Quartzite | Middle Cambrian | Red-brown to white quartzite and green hornfels. | Red-brown to white quartzite. |
| Apache Group (Pioneer Shale) | Upper Precambrian | Quartzite and metadiabase sills. | Basement rocks. |
| Pinal Schist | Lower Precambrian | Sericite schist. | Basement rocks. |
| 7.1 | Regional Geology |
The Gunnison Project including the Gunnison copper deposit is situated on the eastern edge of the Little Dragoon Mountains (Figure 7-2). The Little Dragoon Mountains are an isolated, fault bounded, up thrown block within the Basin and Range province in southeastern Arizona. The ages of the rocks range from the Proterozoic Pinal Schist to Holocene sediments. The southern portion of the Little Dragoon Mountains consists predominantly of the Eocene age Texas Canyon Quartz Monzonite, whereas the Pinal Schist and the Paleozoic sedimentary units that host the regional copper mineralization dominate the northern half.
The oldest rocks in the area, the Pinal Schist, are composed of Proterozoic sandstones, shales and volcanic flows that have been metamorphosed to greenschist and amphibolite facies. The Proterozoic Apache Group unconformably overlies the Pinal Schist and is composed of conglomerates, shales, and quartzite that were subsequently intruded by diabase sills. The Apache Group is then unconformably overlain by the Paleozoic rocks that host the mineralization including the Bolsa, Abrigo, Martin, and Escabrosa Formations. Overlying the mineralized rocks are the Black Prince and Horquilla Limestones. Tertiary/Quaternary basin fill has filled in the valleys.
| M3-PN210313.007 31 March 2026 Revision 0 | 51 |
GUNNISON PROJECT Form 43-101F1 Technical Report |
The Texas Canyon Quartz Monzonite is thought to be the source of the copper mineralization at the Gunnison and South Star deposits, and is coarsely porphyritic, with potassium feldspar phenocrysts from 1 to 10 cm. Livingston et al. (1967) determined the age to be 50.3 ± 2.5 million years (Ma), which is uncorrected for current decay constants, and Reynolds et al. (1986) list eight determinations ranging from 49.5 to 55.0 Ma. The intrusion crops out to the west of the Gunnison Deposit.
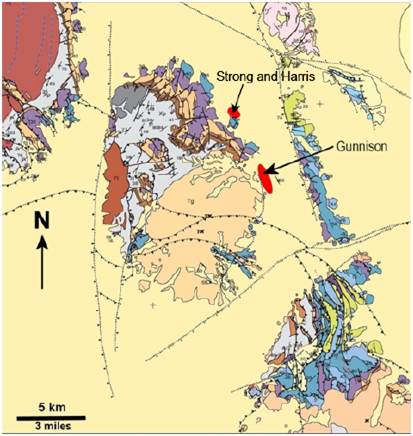
Figure 7-2: Geologic Map of the Little Dragoon Mountains (Modified from Drewes et al, 2001)
Several deformations have occurred in the Project area, with the most relevant being the Laramide Orogeny, to which the mineralization is related, and Basin and Range extension that has modified the topography to its current appearance. Much earlier, Pre-Apache Group deformation of the Pinal Schist included isoclinal folding with steep to overturned fold axes with a general northeastern structural trend. Minor deformation took place in the late Precambrian Era and between the end of the Paleozoic Era, but prior to the Cretaceous Period. The post Paleozoic, but pre-Cretaceous deformation produced steep northeast-to easterly-striking faults with offsets up to hundreds of feet.
The Laramide deformation was at right angles to the Pre-Apache Group deformation, with structures striking in a northwesterly direction. Older faults were reactivated and modified; folding and thrust faulting are common features of the Laramide deformation. The Centurion Fault of Laramide age is located south of the Gunnison Deposit.
| M3-PN210313.007 31 March 2026 Revision 0 | 52 |
GUNNISON PROJECT Form 43-101F1 Technical Report |
Structural trends at the regional scale include lithological units that strike approximately north-northwest and dip 20° to 45° NE; recurrent northeast-striking normal faults, and local north-northwest striking faults of variable slip directions. Regional geology and structure have been described extensively by Cooper and Silver (1964).
Two episodes of block faulting prior to the Quaternary Period have created the Basin and Range topography that dominates the current landscape and postdates the mineralization.
| 7.2 | Gunnison Deposit Geology |
The Gunnison Deposit is covered by un-mineralized basin fill, varying between 300 and 800 feet in thickness. The mineralized Paleozoic host rocks below the basin fill strike approximately north-northwest and dip 20° to 45° east-northeast. Baker (1953) recognized three sets of faults in the Johnson Camp area and similar faults have been interpreted in the Gunnison Deposit area. These faults include the “Northeaster” (N10° to 30°E striking; 70° to 75° dip to the SE), “Easter” (N60° E to S60° E striking; 30° to 50° S and higher angle reverse faults dipping 75° S) and “Northwestern” orientations (N15° W strike; steep E or W dip). Only minor displacements are thought to have occurred in the Gunnison Deposit area; however, numerous sheared and brecciated faults, generally filled with copper-oxide mineralization, cut through the deposit.
The Paleozoic host rocks have been intruded by the Texas Canyon quartz monzonite along the western margin of the deposit. The intrusion has formed wide zones of calc-silicate and hornfels alteration, as well as extensive low-grade copper sulfide mineralization within the Paleozoic rocks. Metamorphic alteration grading outward from the stock includes garnet-wollastonite-idocrase, diopside, tremolite and chlorite-talc (Kantor, 1977) (Figure 7-3). More specifically, the Martin Formation grades from a wollastonite-diopside-rich rock near the porphyry, to a distal diopside-tremolite-actinolite assemblage, and finally to dolomite. The Abrigo has garnet-actinolite-epidote-diopside alteration with some biotite hornfels near the porphyry, and this grades to a distal tremolite alteration leading into un-metamorphosed limey shale. Quartz-orthoclase-carbonate ± magnetite and chalcopyrite veins are characteristic of the lower Abrigo where it is mineralized.
| M3-PN210313.007 31 March 2026 Revision 0 | 53 |
GUNNISON PROJECT Form 43-101F1 Technical Report |
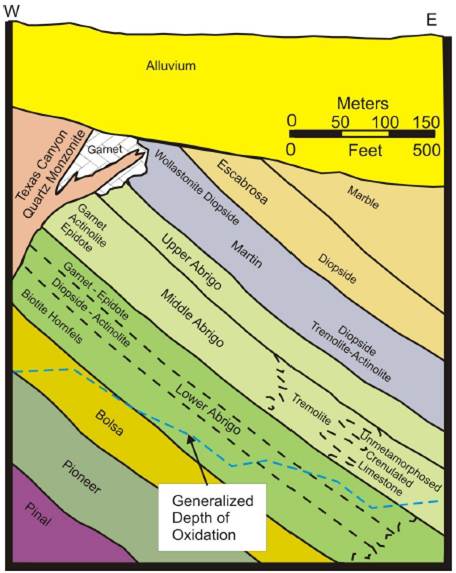
Figure 7-3: Gunnison Deposit Generalized Geological Cross Section (after Kantor, 1977)
| 7.2.1 | Limestone and Marble Overburden at Gunnison |
The Escabrosa limestone and units stratigraphically above it which include the units of the Naco Group, contain significant intercepts of white, blue-grey, and mottled marble in addition to local areas of mineralization. In general, the existence of marble increases moving up the stratigraphic sequence. These zones were sampled and analyzed by Burgex Mining Consultants of Midvale, UT to evaluate the commercial potential of the material. The analysis reviewed specific market suitability for the analyzed samples. Specifically, the Burgex (2025) findings include:
| 7.2.1.1 | Cement and Lime Feed |
Nearly all tested zones continue to meet cement raw meal and quicklime feed requirements, with CaCO₃ values consistently above 95%, LOI 41–43%, and SiO₂ generally below 5%. These chemical profiles mean the material will calcine efficiently, produce high-quality lime, and minimize kiln waste.
| 7.2.1.2 | Agricultural Lime |
The entire sequence is suitable for agricultural lime because of its very high neutralizing value and CaCO₃ consistently over 90%. Even zones that show moderately higher silica or slightly lower LOI maintain strong agronomic performance. This market remains low risk and requires minimal beneficiation.
| M3-PN210313.007 31 March 2026 Revision 0 | 54 |
GUNNISON PROJECT Form 43-101F1 Technical Report |
| 7.2.1.3 | Food and Pharmaceutical Calcium Carbonate |
While the core shows excellent CaCO₃ (often 97–100%) and proper LOI, trace heavy metals and iron levels are the key blockers. Multiple intervals exceed the USP/FCC limits for lead (Pb ≤ 2 ppm) and iron oxide (Fe₂O₃ ≤0.10%), preventing classification as ingestible or pharma grade. Achieving these thresholds would require ultra-selective quarrying and advanced purification, making this market not currently feasible.
| 7.2.1.4 | Paper (GCC/PCC) |
Chemical assay results show there is selective potential for premium paper filler and coating applications. Roughly 11 of 41 tested intervals have the very low SiO₂ (≤1%) and Fe₂O₃ (≤0.2%) needed for bright, clean GCC, and initial whiteness results are promising. Optical testing confirms selective potential for premium paper filler and coating applications. Intervals such as NSD-41 @817′ and NSD-43 @960′ & 996′ meet or exceed premium coated paper standards, while other zones in the 88–90% brightness range remain suitable for standard paper and board filler. Careful mine planning and selective production will be required to maintain paper-grade consistency.
| 7.2.1.5 | Paint and Coatings |
Chemistry and brightness also make a portion of the deposit suitable for architectural and industrial paints, especially as an extender/filler. The same low-silica, low-iron zones that pass paper specs are best for high-brightness white paints, while zones with slightly higher Fe₂O₃ (up to ~0.2%) and SiO₂ (up to ~2%) can still serve well in tinted or industrial coatings where ultra-whiteness is not required. Heavy metals are generally within acceptable limits for coatings markets.
RESPEC reviewed all available data and created domains of the rock characteristics and quantified them as they pertain to the above, and these quantities have been used in the processing of waste described in this report.
| 7.2.1.6 | Construction Aggregate |
Physical testing (LA Abrasion, soundness, absorption, specific gravity, gradation) shows that most of the rock is excellent for concrete and asphalt mixes, with LA Abrasion ≤30% and absorption ≤2% in many zones. Some deeper intervals with absorption >3% or poor soundness (>12% loss) should be segregated or reserved for road base, subbase, and riprap rather than premium DOT concrete. With selective production, the site can reliably supply high-spec concrete and asphalt.
| 7.2.2 | Structural Framework of the Gunnison Deposit |
At the Gunnison Deposit, the mineralized formations strike approximately N10° to N40° W and dip from 30° to 45° NE. The strong regional trend of N10° to N30° E striking normal faults is overprinted by an abundance of N10° to N40°W striking reverse faults, joint sets, and normal faults which range in dip from 35° NE, sub-parallel to bedding, to 75° NE. The reverse faults strike parallel to the long axis of the deposit. Late-stage N70° E to S70° E striking vertical faults at the north end of the deposit contain local zones of high-grade copper-oxide mineralization. Porphyritic quartz monzonite intrusions occur along the western margin of the mineralization. At the southern end, the intrusion forms a sill between the Lower Abrigo Formation and the Bolsa Quartzite. At the northern end of the deposit, the intrusion commonly occurs as thin dikes and sills which cut the strata in numerous locations.
GCC has carried out on-going studies to model and understand the subsurface structural geology of the Gunnison Deposit and its relation to mineralization and hydrology. GCC’s methods and procedures for collecting and analysis of subsurface structural data, and the resulting interpretations and models are summarized in Section 9.
| M3-PN210313.007 31 March 2026 Revision 0 | 55 |
GUNNISON PROJECT Form 43-101F1 Technical Report |
| 7.3 | Gunnison Mineralization |
Within the Project area the important mineralized host rocks include the Abrigo and Martin Formations and, to a lesser extent, the Horquilla Limestone, and the lower parts of the Escabrosa Limestone. Mineralization is also found in the Bolsa Quartzite and Precambrian basement rocks. Copper mineralization is related to calc-silicate skarns that have replaced these carbonate rocks adjacent to the Texas Canyon quartz monzonite (TQM).
Oxidation has occurred to a depth of approximately 1,600 feet and has resulted in the formation of dominantly chrysocolla with minor tenorite, copper oxides, and secondary chalcocite. Copper-oxide mineralization is present in the calc-silicate skarns as fracture coatings and vein fillings mainly in the form of chrysocolla. The remainder of the oxide mineralization occurs as replacement patches and disseminations. Copper-oxide mineralization extends over a strike length of 11,100 feet, has an aerial extent across strike of up to 3,000 feet and is more than 900 feet thick in places. Figure 7-4 shows the plan view geology of the deposit and Figure 7-5 and Figure 7-6 are east-west cross sections. Note the thickness and continuity of mineralization. The north-south long-section view in Figure 7-7 also confirms the thickness and continuity of mineralization.
Copper sulfide mineralization has formed preferentially in the proximal (higher metamorphic grade) skarn facies, particularly within stratigraphic units such as the Abrigo and Martin Formations, and within structurally complex zones. There are three types of sulfide mineralization within the skarns. In decreasing order of abundance, these are fracture coatings and vein fillings, distinct quartz-orthoclase-carbonate ± magnetite and chalcopyrite veins 0.2 to 10 cm wide (Weitz, 1976), and disseminations. The veins have retrogressive haloes of chlorite, actinolite and epidote. Primary mineralization also occurs as stringers and veinlets of chalcopyrite and bornite.
| M3-PN210313.007 31 March 2026 Revision 0 | 56 |
GUNNISON PROJECT Form 43-101F1 Technical Report |
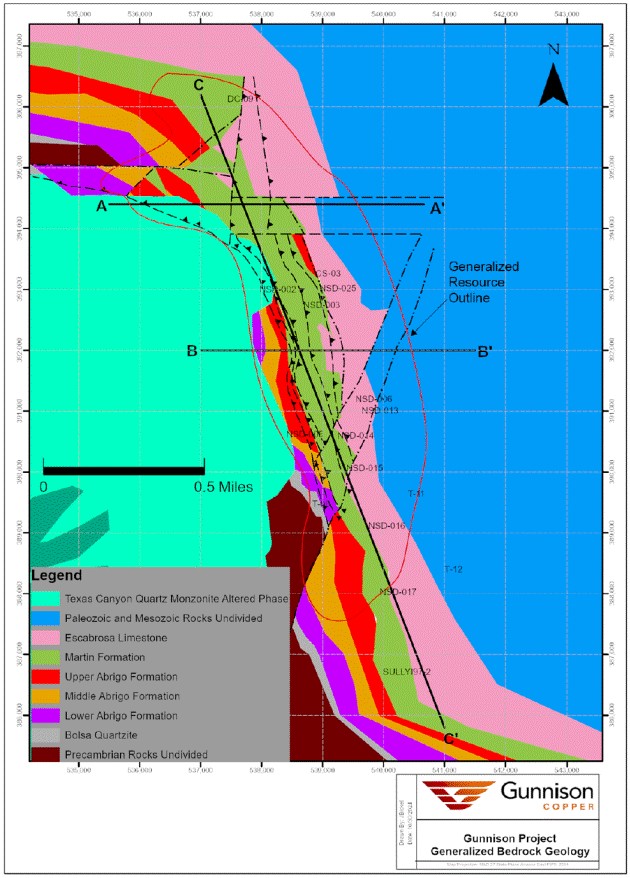
Figure 7-4: Gunnison Generalized Geology in Plan View, Below Basin Fill
| M3-PN210313.007 31 March 2026 Revision 0 | 57 |
GUNNISON PROJECT Form 43-101F1 Technical Report |
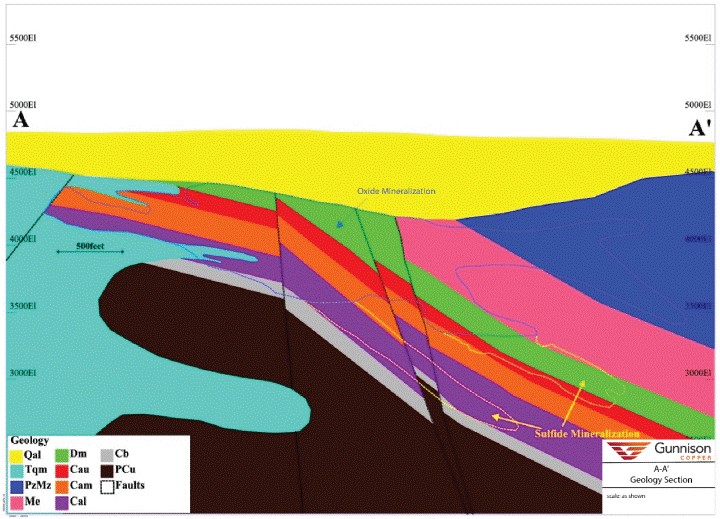
Figure 7-5: Gunnison Deposit East – West Geology Section at 394,400N Looking North
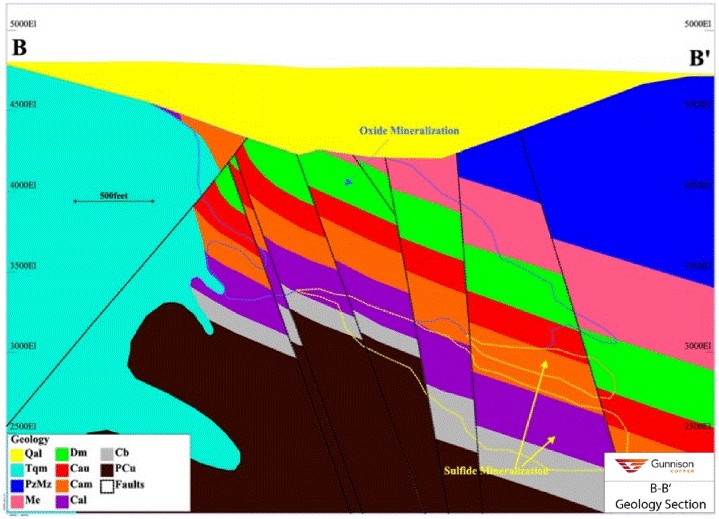
Figure 7-6: Gunnison Deposit East – West Geology Section at 392,000N, Looking North
| M3-PN210313.007 31 March 2026 Revision 0 | 58 |
GUNNISON PROJECT Form 43-101F1 Technical Report |
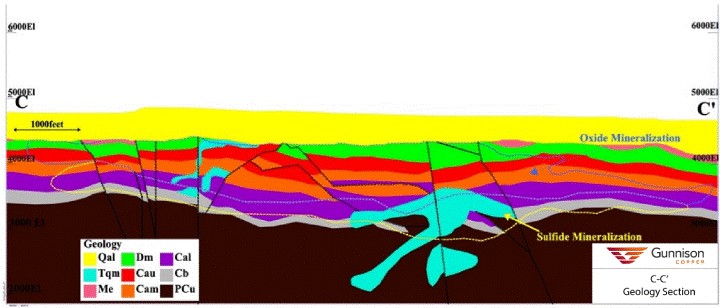
Figure 7-7: Gunnison Deposit North – South Geology Section, Looking East
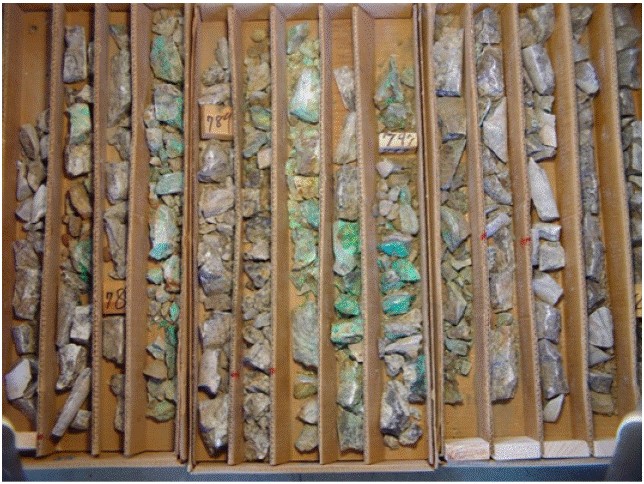
Figure 7-8: Photograph of Typical Oxide Mineralization for the Gunnison Deposit Hole J-9: 780 to 806 feet
Texturally, pyrite and magnetite are later than, and replace, the skarn minerals, and chalcopyrite formed last. The magnetite occurs as disseminated 0.2 to 0.5 mm euhedral to anhedral grains and is closely associated with pyrite. Ninety percent of the magnetite is in the skarns and may compose up to five percent by volume of the rock. The disseminated magnetite and magnetite bearing veins are most likely what is giving the magnetic response for the deposit (Colburn and Perry, 1976).
| M3-PN210313.007 31 March 2026 Revision 0 | 59 |
GUNNISON PROJECT Form 43-101F1 Technical Report |
Primary chalcopyrite-molybdenite disseminations and veins also occur in the mineralized porphyry below and to the west of the skarn mineralization at the Gunnison Deposit. Only nine drillholes intersected the quartz monzonite over significant lengths (lengths > 100 feet). Most were mineralized with a best interval of 289 feet averaging 0.31% Cu and 0.028% Mo, including 30 feet at a grade of 1.35% Cu. This mineralization has never been fully assessed.
Both oxide and sulfide mineralization exhibit strong fracture control. This fracturing and faulting are best developed in terms of width and close spacing in a zone around the intrusive contact, and this decreases away from the intrusive contact in the less altered rocks to the east. The initial formation of the skarn created denser minerals and liberated CO2 resulting in volume reduction, which created significant fracturing, and a consequent increase of porosity and permeability, allowing penetration by the later copper-bearing fluids. Weitz (1976) calculated a 30% volume reduction in the skarn-altered portions of the Abrigo and Martin formations at the Gunnison Deposit.
Oxide copper also exists within the transition zone. It mainly occurs along fractures and in quartz vein selvages as chrysocolla. Secondary supergene copper sulfide minerals such as chalcocite are often associated with the oxide mineralization in the transition zone. The transition zone is typically 100 feet to 200 feet in thickness and is strongly fractured and broken, similar to the oxide zone.
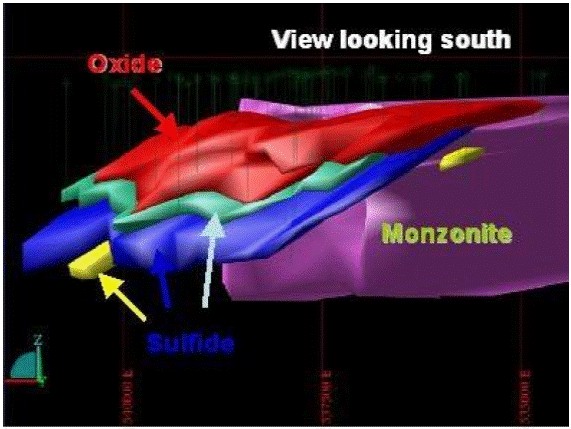
Figure 7-9: Generalized 3D View of Mineralization Looking South
| 7.4 | Ongoing Modeling and Analysis |
In 2021, GCC engaged RESPEC) to review data from the production wells completed in 2018-2019 and assist with the construction of new geological models for the small area in and around the initial production wellfield for internal purposes. The models generated in 2021 have not been integrated into the overall geological model used in the estimation of the current mineral resources. Mr. Bickel has reviewed the models and determined that any discrepancies between these new interpretations and the modeled geology described in this Technical Report are immaterial to the mineral resources tabulated in Section 14. The reasoning behind this determination is discussed in Section 12.6.
| M3-PN210313.007 31 March 2026 Revision 0 | 60 |
GUNNISON PROJECT Form 43-101F1 Technical Report |
| 7.5 | Strong & Harris Deposit Geology |
The Strong & Harris Deposit is hosted in altered Paleozoic sedimentary rocks which are covered by an average of 425 feet of post-mineral and mostly unconsolidated valley fill near the northeast flank of the Little Dragoon Mountains and about three northwest of the Gunnison oxide copper deposit (Figure 7-10).
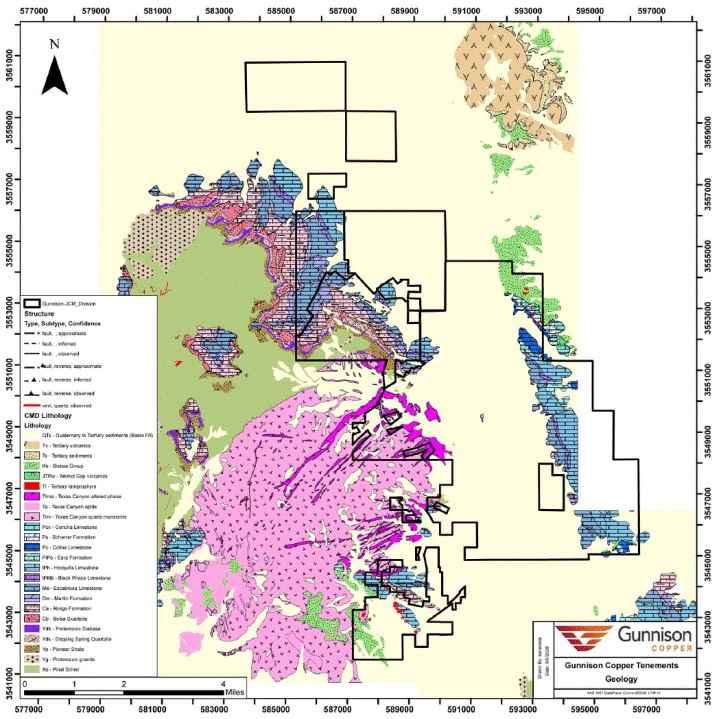
(from Gunnison, September 2026)
Figure 7-10: Property Geologic Setting for the Strong & Harris Project
A diagrammatic stratigraphic column showing the known stratigraphy of the property area is shown in Figure 7-11.
| M3-PN210313.007 31 March 2026 Revision 0 | 61 |
GUNNISON PROJECT Form 43-101F1 Technical Report |
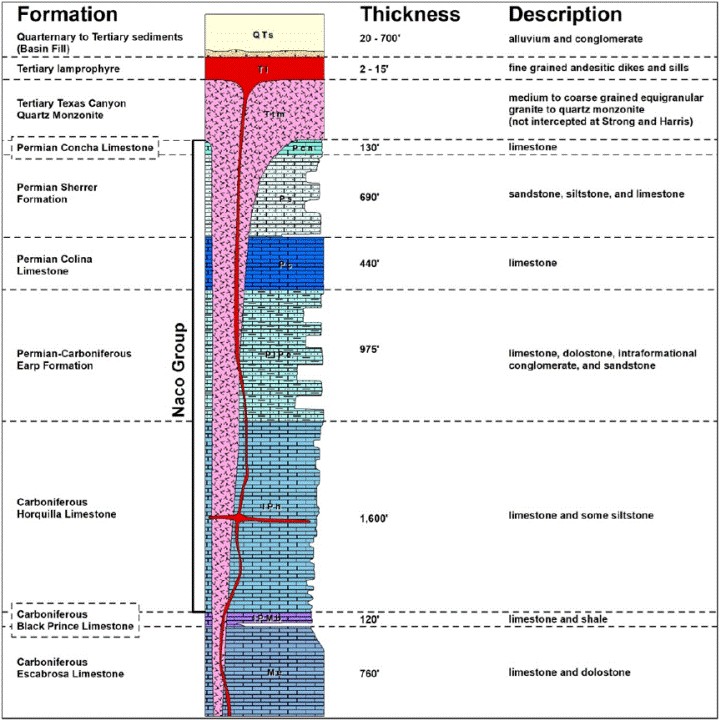
(from Excelsior, September 2021)
Figure 7-11: Stratigraphic Column for the Strong & Harris Project and Vicinity
The valley fill consists of largely unconsolidated sand, gravel, and conglomerate that dips shallowly to the east at about 15° with some local variability. Near its base, the valley fill is consolidated fanglomerate for approximately 10 to 20 feet above the contact with the Paleozoic rocks. This consolidated basal layer may be correlative to the regionally extensive Gila Conglomerate. The mineralized Paleozoic rocks below the valley fill sediments strike approximately 315° azimuth and dip 30° to 45° northeast. These Paleozoic rocks include the Carboniferous Escabrosa Limestone, the Carboniferous Black Prince Limestone, the Carboniferous to Permian Horquilla Limestone, the Permian Earp Formation, and the Permian Colina Limestone. The Horquilla Limestone is intruded by a thin mafic sill in the area of Strong & Harris known locally as the “Peabody Sill” for its presence in the historic Peabody Mine south of Strong & Harris. It is likely correlative to Tertiary lamprophyre sills identified by Cooper and Silver (1964).
| M3-PN210313.007 31 March 2026 Revision 0 | 62 |
GUNNISON PROJECT Form 43-101F1 Technical Report |
The stratigraphy at Strong & Harris is cut by east to northeast-striking faults with apparent right-lateral displacement and near-vertical dips. Displacements along the faults are typically between 50 to 200 feet. There appears to be a proximity relationship between these structures and the most mineralized portions of the deposit. They are likely pre- or syn-mineral in age, but may have post-mineral movement as well since some of the mineralization is apparently offset by them. Folds occur locally in the proximity of faults. However, some shallow, gentle folds are common throughout the property with fold axes approximately parallel to the northeasterly dip of the sedimentary units.
The Escabrosa Limestone is generally thick-bedded to massive, white to light grey limestone with dolomitic interbeds which are more abundant at the base of the formation. Regionally, it is 750 feet thick and forms prominent topographic ridges. In the Cochise mining district, it is often recrystallized. Skarn and calc-silicate alteration are typically limited to narrow seams along fractures or thin beds near the base of the formation. It has not been intercepted in the drill holes at Strong & Harris and does not host any known mineralization at the property. It presumably lies below the deposit.
The Black Prince Limestone is a pinkish-grey limestone with a distinct maroon shale at its base. It generally resembles the underlying Escabrosa Limestone above the basal shale and is approximately 120 feet thick. In the Cochise mining district, it is often marbleized and the shale is altered to a distinct brown hornfels. It has not been intercepted in the drill holes at Strong & Harris and does not host any known mineralization at the property. It presumably lies below the deposit.
The Horquilla Limestone consists of thick- to medium-bedded grey limestone with minor silty or shaley interbeds. The formation is typically 1,500 feet in thickness in the region, although the basal contact has not been intercepted in any of the Strong & Harris drill holes. The Horquilla is strongly marbleized in the deposit area and locally altered to various calc-silicate assemblages. Typical alteration minerals include wollastonite, diopside, tremolite, serpentine, and more rarely garnet. The Horquilla is intruded by the Peabody Sill, a fine-grained mafic igneous rock typically 10 to 15 feet thick, although thinner intersections have been encountered. The sill intrudes the Horquilla consistently roughly 800 feet below the contact between the Horquilla and Earp Formation. Where mineralogy can be observed, the rock contains pyroxene and/or hornblende, biotite, and plagioclase. It is commonly altered to chlorite. Quartz-orthoclase-plagioclase(?) veins occasionally occur within 5 feet of the contact of the sill. The sill is likely correlative to Tertiary lamprophyre sills identified by Cooper and Silver (1964). Copper-zinc-silver mineralization in the Horquilla is commonly associated with or proximal to the Peabody Sill. The mineralization in the Horquilla along the diabase sill has been historically distinct from that in the Earp Formation and was historically referred to as the “Peabody Sill” mineralization.
The Earp Formation is the most significant geologic unit at Strong & Harris because it is the principal host for mineralization. The lithology is heterogeneous compared to adjacent formations, containing many interbeds (usually 2 to 8 feet in thickness) of limestone, sandstone, siltstone, and local conglomerates. The Earp Formation also exhibits relatively low competency, likely owing to the interbedded nature of the sequence. It is roughly 975 feet thick at Strong & Harris. The Earp Formation is commonly altered to various assemblages of calc-silicates, historically described as tactites, typically containing wollastonite, pyroxene, serpentine, and amphiboles. Rarely, green garnet is observed in the tactites. Limestone beds have been intensely marbleized and locally silicified. Silicification is commonly more abundant toward the base of the formation.
The Colina Limestone is a medium- to thick-bedded, dark grey to black limestone which overlies the Earp Formation. It has rare thin-bedded sandstone units near the base. It is at least 440 feet thick in the Cochise mining district (Cooper and Silver, 1964). It is only a minor host to mineralization at Strong & Harris.
| 7.6 | Strong & Harris Mineralization |
Primary copper-zinc-silver mineralization at Strong & Harris is characterized by lenses of sulfide minerals emplaced more-or-less parallel to layering in favorable lithologic units, usually along bedding planes or in disseminated masses and blebs. Some mineralization is disseminated in certain lithologies. Less frequently, the mineralization is hosted in quartz +/- calcite +/- feldspar veins. The mineralization is typically accompanied by calc-silicate alteration of the carbonate host-rock (described as “tactite” in the logs). In some local areas or sub-units, the mineralization completely replaced the host rock with massive lenses or patches of sulfide minerals, some of which are now oxidized. The sulfide minerals include pyrite, pyrrhotite, chalcopyrite, chalcocite, and sphalerite. Minor tetrahedrite group minerals have also been reported in the historical drill logs.
| M3-PN210313.007 31 March 2026 Revision 0 | 63 |
GUNNISON PROJECT Form 43-101F1 Technical Report |
Sub-units of the Earp Formation, particularly those immediately below its upper contact with the Colina Limestone, were the most favorable sites for deposition of the copper, zinc and silver minerals. However, mineralization is also present in the Colina Limestone above the Earp, as well as in the Horquilla Limestone below the Earp. Historical reports often referred to mineralization in the Horquilla as the “Peabody Sill”, as such mineralization and its host rock were termed at the historical Peabody Mine southwest of the Strong & Harris Deposit. The contact between the Horquilla and this sill at the Peabody Mine was reportedly favorable, at the mine although the sill itself is thin and represents only a volumetrically minor portion of that deposit. The same relationship is observed on the western side of the Strong & Harris property where the diabase sill has been logged in several holes and is often mineralized. The thickness of the sill is typically less than 10 feet. Mineralization in tactites of the Horquilla Limestone, either stratigraphically above or below the sill, is equally if not more important than the sill itself at Strong & Harris. However, the sill is a favorable host where present.
The Strong & Harris Deposit has been oxidized to varying degrees that generally decrease with depth. Three oxidation zones are currently recognized in the deposit: the oxide zone, the transition (or mixed) zone, and the sulfide zone. In the oxide zone, copper is dominantly hosted in chrysocolla with minor azurite, malachite, and tenorite. Zinc minerals noted in the oxide zone include rosasite, aurichalcite, and willemite. Sulfide zone mineralogy is dominated by chalcopyrite and sphalerite with associated pyrite and pyrrhotite. In the transition (mixed zone), the mineralogy consists of secondary sulfides (namely chalcocite) mixed with a combination of the above oxide and sulfide zone mineralogy.
| M3-PN210313.007 31 March 2026 Revision 0 | 64 |
GUNNISON PROJECT Form 43-101F1 Technical Report |
| 8 | DEPOSIT TYPES |
| 8.1 | Gunnison Deposit Types |
The Gunnison Deposit is a classic copper skarn (Einaudi et al, 1980 and Meinert et al, 2005). Skarn deposits range in size from a few million to 500 million tonnes and are globally significant, particularly in the American Cordillera. They can be stand-alone copper skarns, which are generally small, or can be associated with porphyry copper deposits and tend to be very large. The Gunnison Deposit is large, at the upper end of the range of size for skarn deposits and is likely associated with a mineralized porphyry copper system that has not been discovered.
Copper skarns generally form in calcareous shales, dolomites, and limestones peripheral or adjacent to the mineralized porphyry. Copper mineralizing hydrothermal fluids are focused along structurally complex and fractured rocks and convert the calcareous shales and limestones to andradite rich garnet assemblages near the intrusive body, and to pyroxene and wollastonite rich assemblages at areas more distal to the stock. Retrograde hydrothermal fluids produce actinolite-tremolite-talc-silica-epidote-chlorite assemblages that overprint earlier garnet and pyroxene. The mineralization is typically pyrite-chalcopyrite-magnetite proximal to the mineralizing porphyry and chalcopyrite-bornite more distally from the body. The copper-gold porphyry and skarn model by Sillitoe (1989) (Figure 8-1) is being used as a conceptual exploration model for the Gunnison Deposit. Application of the model entails testing magnetic highs (potential skarns) around magnetically quiet areas (copper porphyry).
Copper-zinc skarns are important in the region and have been historically mined from the Republic, Copper Chief, Moore, and Mammoth mines from underground operations (Baker, 1953). These copper and zinc rich skarns are probably more distal to the mineralized porphyry, whereas the Gunnison and South Star skarns contain only Cu and are proximal to the mineralizing porphyry system. Tungsten and minor lead-silver-gold have also been produced in the district (Cooper and Silver, 1964).
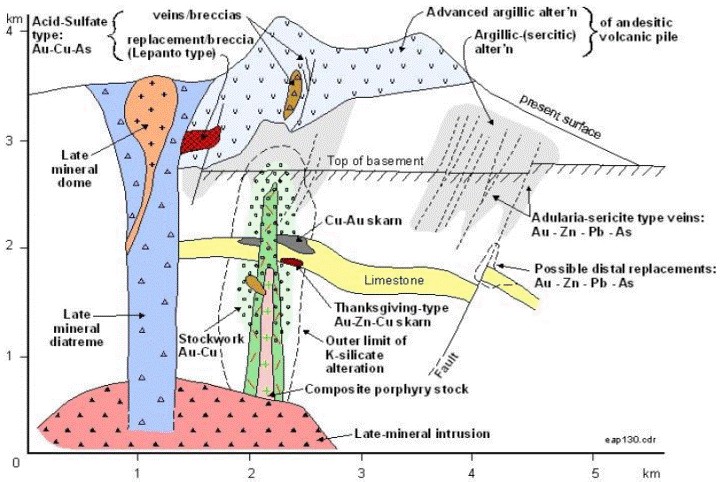
Figure 8-1: Porphyry Copper and Skarn Model (from Sillitoe 1989)
| M3-PN210313.007 31 March 2026 Revision 0 | 65 |
GUNNISON PROJECT Form 43-101F1 Technical Report |
| 8.2 | Strong & Harris Deposit Types |
The Strong & Harris copper-zinc-silver deposit is a sub-type of or related to a classic copper skarn (Einaudi and Burt, 1982; and Meinert et al, 2005). Skarn deposits range in size from a few million to 500 million tonnes and are globally significant, particularly in the southwestern US. They can be stand-alone copper skarns, which are generally small, or can be spatially and temporally closely associated with porphyry copper deposits, in which case they tend to be very large. The skarn at Strong & Harris and collectively in the Cochise mining district is presumably related to the Texas Canyon Quartz Monzonite, despite the intrusive itself hosting very little known economic mineralization. Mineralization in the quartz monzonite would require more specialized conditions involving the metal and volatile content of the magma, depth of emplacement, or other factors (Burt, 1977).
Copper skarns generally form in calcareous shales, dolomites and limestones peripheral or adjacent to the margins of diorite to granite intrusions that range from dikes and sills, to large stocks or phases of batholithic intrusions, and frequently are associated with mineralized intrusions. Copper mineralizing hydrothermal fluids are focused along structurally complex and fractured rocks and convert the calcareous shales and limestones to andradite-rich garnet assemblages near the intrusive body, and to pyroxene and wollastonite rich assemblages at areas more distal to the intrusive. Retrograde evolution of the hydrothermal fluids produces actinolite-tremolite-talc-quartz-epidote-chlorite assemblages that overprint earlier garnet and pyroxene. Strong & Harris occurs approximately two miles north of any known occurrences of the Texas Canyon Quartz Monzonite intrusion in the Cochise mining district, which is thought to be the source of mineralizing hydrothermal fluids. Therefore, Strong & Harris can be sub-categorized as distal skarn related to a porphyry copper system. This assumption is supported by the high abundance of wollastonite alteration in the mineralized zones. The anatomy of a telescoped porphyry copper system model (Figure 8-2) by Sillitoe (2010) can be used as a conceptual model to understand the spatial relationship of the Strong & Harris distal skarn and associated proximal skarns in the district.
| M3-PN210313.007 31 March 2026 Revision 0 | 66 |
GUNNISON PROJECT Form 43-101F1 Technical Report |
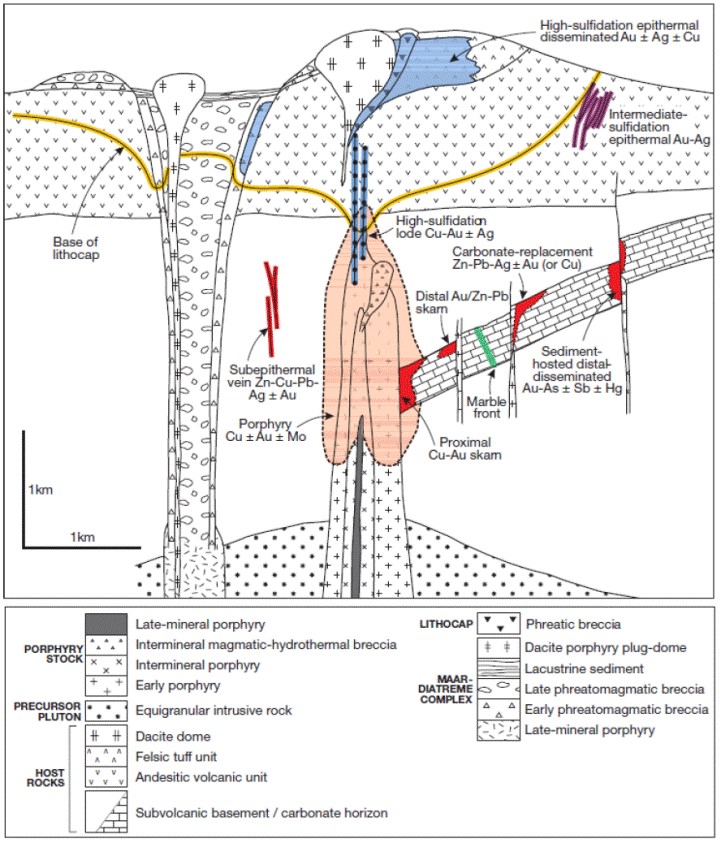
(after Sillitoe, 2010)
Figure 8-2: Schematic Model
| M3-PN210313.007 31 March 2026 Revision 0 | 67 |
GUNNISON PROJECT Form 43-101F1 Technical Report |
| 9 | EXPLORATION |
GCC’s initial exploration at the property began with a re-logging program in December 2010 that was completed in 2011. In addition, a re-assaying program began in March 2011 during which all of the Magma Copper drillholes were re-assayed. Prior to the re-assay, historical Cyprus/Superior (CS) holes that had both total copper (TCu) and acid soluble (ASCu) results were re-split and check assayed at Skyline Labs in Tucson. The results are described in Section 12. In May 2011, a re-assay program was initiated for the Quintana Minerals holes (DC, S and T series) to include sequential Cu analysis. Previous results only included TCu assays.
From late in 2010 through early 2015, GCC has drilled 54 diamond drillholes, totaling 78,615 ft, for metallurgical samples and copper resource definition and expansion. Commencing in 2011, GCC also drilled 33,077 ft in 32 rotary holes for hydrologic testing and observation in the Gunnison Deposit area.
Southwest Exploration Services, LLC and COLOG were contracted by GCC to complete down-hole geophysical surveys during the 2011 to 2015 drill programs. Some holes were not surveyed due to bad ground conditions, and the surveys were shortened in others not reaching the total drilled depths. Altogether, down-hole geophysical data were obtained from a total of 66 drillholes in the deposit. Data collected included temperature, caliper log, sonic log, and acoustic televiewer. The down-hole geophysical data have been analyzed and evaluated as described in Section 9.1.2.
From late 2018 through late 2019, GCC drilled 57 wells totaling 74,342 feet into and around a 400-foot by 400-foot area. Southwest Exploration Services, LLC was contracted by GCC to complete down-hole geophysical surveys during the 2018 to 2019 drill program. All of the wells were surveyed. Some surveys did not reach the total drilled depths due to bad ground conditions. The down-hole geophysical data have been analyzed and evaluated as described in Section 9.1.2.
| 9.1 | GCC Structural Geologic Methods |
GCC’s technical team has made a substantial effort to understand the structural geology of the Gunnison Deposit, particularly as it relates to controls on oxide copper mineralization. This subsection summarizes how GCC has collected, interpreted, and modeled subsurface structural data as part of its exploration program. GCAZ collects structural data by the following four main methods.
| 9.1.1 | Structural Logging |
As a part of the core logging process, GCC’s geologist logged structure type (fault, shear, breccias, etc.), took angle to core axis measurements of the structures, and noted the mineralogy existing on the feature planes, infill, gouge, and selvages.
| 9.1.2 | Down-hole Geophysical Surveys |
For GCC’s drilling programs since 2011, borehole geophysical tools including an acoustic borehole televiewer, were used to collect geophysical data down the holes. Images produced by the televiewer are used by GCC’s geologist to identify and interpret structures by comparing the geophysical logs with the core, characterize structures by type and infill or gouge mineralogy, and obtain their true structural orientation using WellCad software. Other data collected from the surveys included caliper, sonic, and temperature logs.
| M3-PN210313.007 31 March 2026 Revision 0 | 68 |
GUNNISON PROJECT Form 43-101F1 Technical Report |
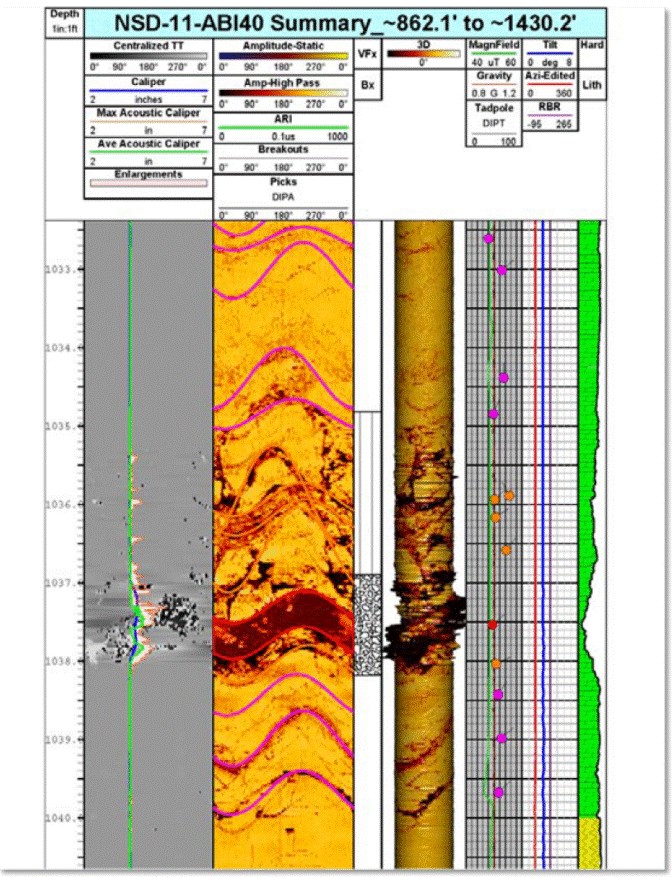
Figure 9-1: Graphical Example of Geophysical Log
| 9.1.3 | Fracture Mapping |
For every assay sample (every 10ft unless truncated by a lithologic boundary), GCC’s geologist logged “Fracture Mapping”. This is the quantity of fractures per assay sample in the drill core, which can be used to calculate fractures per foot. The following categories were logged for Fracture Mapping:
| ● | quantity of mineralized open fractures per assay sample, |
| ● | quantity of mineralized closed fractures per assay sample, |
| ● | quantity of non-mineralized open fractures per assay sample; and |
| ● | quantity of non-mineralized closed fractures per assay sample. |
| M3-PN210313.007 31 March 2026 Revision 0 | 69 |
GUNNISON PROJECT Form 43-101F1 Technical Report |
| 9.1.4 | Structural Analysis |
GCC staff performed a Structural Analysis that examined all collected structural data and was an important input to all geology interpretations.
Figure 9-2 shows the major faults which displace stratigraphy in the deposit projected at the bedrock surface. Their spatial locations and orientations were defined in the Structural Analysis. The numerous parallel reverse faults which strike approximately N-NW cause repetition in stratigraphic section. All reverse faults dip steeply (70-80°) to the NE, except the westernmost reverse fault which dips approximately 60°SW. A subset of NE-striking normal faults, which dip steeply to the SE, is located on the margins of the deposit to the north and south. Also at the north end, E-W sub-vertical faults intersect the deposit along its short axis.
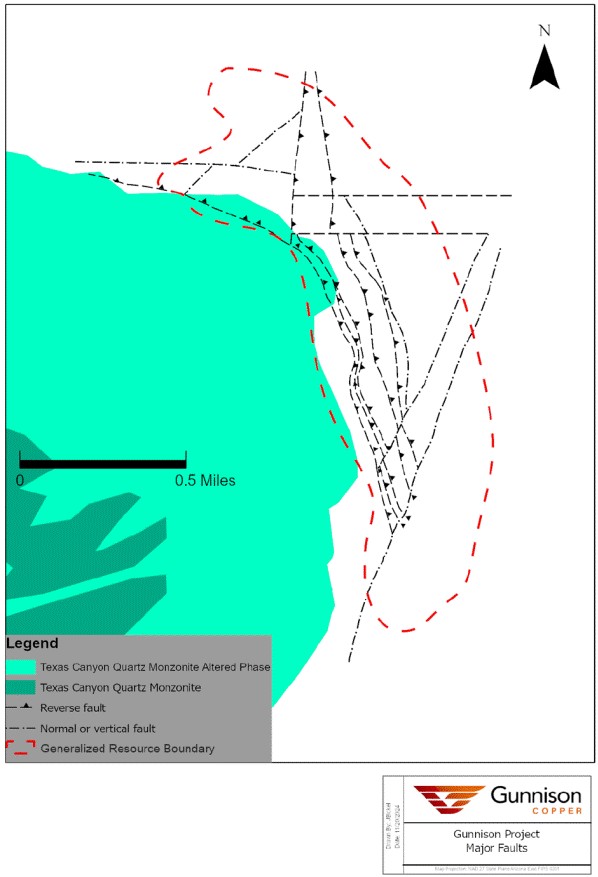
Figure 9-2: Plan View of Major Faults at Bedrock Surface which Displace Stratigraphy
| M3-PN210313.007 31 March 2026 Revision 0 | 70 |
GUNNISON PROJECT Form 43-101F1 Technical Report |
The Structural Analysis also showed that, aside from the major faults which displace stratigraphy, the deposit is dominantly cut by faults, fractures, and joints which strike and dip sub-parallel to bedding. Figure 9-3 is a contour plot of structural data from the geophysical surveys. It contours the poles to dip directions for all structural features measured in the deposit (excluding bedding orientations). Note the strong presence of features which dip moderately to the NE and strike N-NW. These features are approximately sub-parallel to the strike and dip of the stratigraphic units at Gunnison.
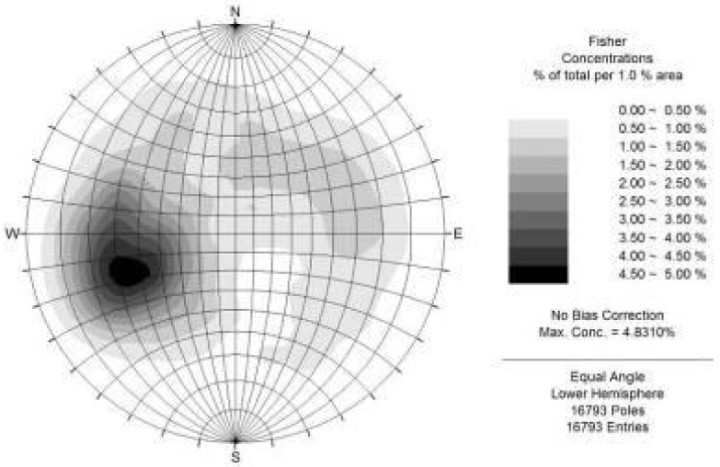
Figure 9-3: Contour Plot of Poles to Dip Directions for Structural Features, Excluding Bedding Orientations
The structural architecture of the subsurface resulting from the interpretations made in the Structural Analysis is a framework of high angle structures with numerous conjugate structures which are sub-parallel to bedding. Figure 9-4 is a schematic east-west cross section showing this framework. The cross section shows the approximate thickness of the structural zones as defined by the Structural Analysis.
| M3-PN210313.007 31 March 2026 Revision 0 | 71 |
GUNNISON PROJECT Form 43-101F1 Technical Report |
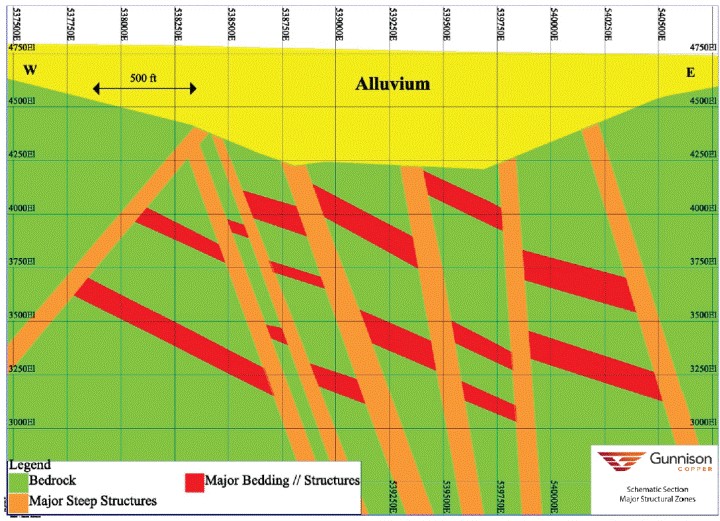
Figure 9-4: Schematic East – West Cross Section Showing the Structural Framework of the Deposit
| 9.2 | Strong & Harris Exploration |
This section summarizes the exploration work carried out by GCC. Mr. Bickel has reviewed the information provided by GCC and believes it is an accurate representation of the work done by GCC.
GCC has not conducted drilling at the Strong & Harris project. Drilling by previous operators is summarized in Section 10.
| 9.2.1 | Historical Data Compilation |
GCC inherited a data package upon purchase of the project. It consisted of well-organized boxes of paper records, drill logs, assay certificates, and technical reports from Robert Durham, who previously controlled the property.
In 2019, GCC began a comprehensive technical review of the reports and project drill data. In 2020-2021, GCC completed a data compilation program to digitize and validate the Strong & Harris data. GCC contracted RESPEC to assist with some of this program.
As of the Effective Date of this report, GCC’s compilation of historical data efforts include:
| ● | Scanning of all historical reports, drill logs, assays, and miscellaneous technical information from the paper files. GCC gathered all paper records for the Strong & Harris project and scanned them. |
| M3-PN210313.007 31 March 2026 Revision 0 | 72 |
GUNNISON PROJECT Form 43-101F1 Technical Report |
| ● | Conversion of drill hole collar coordinates from historical grid to UTM NAD 27, State Plane Arizona East coordinate system. Drill hole collar coordinates were provided in the historical data records, along with maps of the collar locations. The grid used in the historical data was not recognized. GCC contracted RESPEC to use this data, along with data derived from handheld GPS measurements of the existing collars, to create a two-point transformation of the historical collar coordinates to UTM NDAD 27, State Plane Arizona East coordinate system to match GCC’s existing data formats. These collar locations were further verified and adjusted based on field surveys performed in 2021 (as described in Section 12.2.2). |
| ● | Construction of digital drill hole database. GCC contracted RESPEC to construct a digital drill hole database in 2020 based on the historical paper records and scans thereof. This included a comprehensive compilation of all assays, lithologies, collar, survey, and other relevant data into digital format. During this process, RESPEC verified the data compiled into the database described in Section 12.2. |
| ● | Digitization of geologic surfaces. At GCC’s request, RESPEC created preliminary 3D geologic surfaces of the geologic units relevant to the Strong & Harris Deposit. These surfaces were based on cross-sections and maps contained within the historical paper records. In 2021, the geologic surfaces were further refined by collaborative edits between GCC staff geologists and RESPEC. |
| ● | Inventory of historical drill core. GCC contracted technical staff, including RESPEC, to move the historical Strong & Harris drill core from its location in Dragoon, AZ, to GCC’s core processing facility in Casa Grande, AZ. As a part of this process and the ensuing re-sampling of the core, a detailed inventory of the remaining available drill core was generated. The inventory recorded 125 unique historical drill holes, all corresponding to those in the data records and database. In some cases, core for certain sections of the holes were missing boxes and/or intervals. In total, approximately 35,000 feet of core remains intact. |
| 9.2.2 | Geologic Mapping |
In 2020 and 2021, GCC conducted geologic mapping over selected areas within the Cochise mining district west and south of the Strong & Harris project. Traverse mapping at a 1:10,000 scale focused on alteration assemblages, veins orientation, and confirmation of published USGS geologic maps. The mapping was conducted to identify alteration assemblage’s indicative of potential deposits and to characterize known mineralization. Mapping in the Johnson Camp area extended north to the Peabody mine and the exposed lithologies that could be relevant to the areas of the property covered by Cenozoic basin-fill units.
| 9.2.3 | GCC Re-Sampling of Historical Drill Core |
GCC carried out a re-sampling program in February and March of 2021 based on RESPEC’s recommendations. The program was executed by a collaboration between GCC staff and contractors, and RESPEC. The purpose of the program was to 1) verify historical data, and 2) increase the amount of silver assays in the database for the purposes of estimating resources. In total, 1089 samples were selected for re-assay (not including standards, blanks, and duplicates). The criteria for samples to be re-assayed generally included spatial and geologic distribution, as well as core availability. 20% of the samples were intended for verification specifically. Spot-checking of lithology logging and mineralization were included as a part of the program. The processes employed in the re-sampling program are described in Section 11, and the results are discussed in Section 12.
| 9.2.4 | GCC Geophysics |
GCC commissioned Geotech Ltd to complete a helicopter-borne geophysical survey using the versatile time-domain electromagnetic (VTEM™) plus system between October 6th and October 21st, 2020 over the Gunnison Copper Project. Measurements were taken using the VTEM™ Plus system (vertical and in-line components of the EM response) and a horizontal magnetic gradiometer with two caesium sensors. The survey covered several copper deposits in the district, including Strong & Harris.
| M3-PN210313.007 31 March 2026 Revision 0 | 73 |
GUNNISON PROJECT Form 43-101F1 Technical Report |
| 10 | DRILLING |
GCC’s digital database for the Gunnison Deposit mineral resource estimate includes 217 drillholes totaling 245,509 feet. A total of 122 core and RC holes were drilled in the deposit area, and 96 of these, totaling 140,034 feet, directly contributed assay data to the estimation of copper resources. GCC has also drilled 57 wells totaling 74,342 feet in their production wellfield area in 2018-2019. These wells are summarized in Section 10.3. The data from these wells were not used in the mineral resource estimate tabulated in this Technical Report, which is discussed in Section 14.
Historical drilling was primarily conducted by diamond drilling methods, although six Phelps Dodge drillholes were drilled by reverse circulation methods. The majority of drillholes have vertical orientations, which cross the predominant, generally shallow-dipping mineralized zones at the Gunnison Deposit. A few angle holes were also completed by GCC, in attempts to intersect interpreted geologic structures within the deposit.
The predominant sample length for the drill intervals in the GCC database is 10 feet (3.048 meters), with a relatively small percentage of shorter or longer intervals based on lithologic factors. RESPEC believes the drillhole sample intervals are appropriate for the style of mineralization at the Gunnison Deposit. Furthermore, RESPEC is unaware of any sampling or recovery factors that may materially impact the accuracy and reliability of the results and believes that the drill samples are of sufficient quality for use in mineral resource estimations.
Figure 10-1 is a plan map showing the Gunnison Deposit drillholes by company.
| 10.1 | Historical Drilling |
The database includes 88 historical drillholes that were completed by several companies as shown in Table 10-1. These holes extend to a depth of approximately 2,450 ft below the surface at the Gunnison Deposit and cover an area of approximately 310 acres, with additional drilling extending beyond this area. There is a slightly higher density of drilling along the central axis of the Gunnison Deposit.
The historical drillholes are vertical and the mineralization ranges from flat lying to a 30° dip to the east, resulting in a ratio between sample length and true thickness of 1 to 0.87 depending on the true dip of the mineralization.
Table 10-1: Pre-Existing Drilling at the Gunnison Deposit
(Diamond Drilling Includes Percussion Pre-Collar)
| Company | Date | Type | Pre-fix | # of holes | Feet Drilled |
| Cyprus | early 1970s | Diamond core | K | 4 | 3,755 |
| Cyprus/Superior | early 1970s | Diamond core | CS | 36 | 45,786.6 |
| Cyprus/Superior | early 1970s | Diamond core | CYS | 1 | 887 |
| Cyprus/Superior | early 1970s | Diamond core | J | 10 | 12,167 |
| Cyprus/Superior | early 1970s | Diamond core | K-20-X | 1 | 983 |
| James Sullivan | late 1980s | Diamond core | JS | 3 | 1,665.5 |
| Magma Copper | mid 1990s | Diamond core | MCC | 6 | 8,099 |
| Minerals Exploration | early 1970s | Diamond core | JD | 4 | 2,206 |
| Phelps Dodge | late 1990s | RC chip | SullyI97 | 6 | 6,026 |
| Quintana | early 1970s | Diamond core | DC | 1 | 1,080 |
| Quintana | early 1970s | Diamond core | S | 3 | 3,394 |
| Quintana | early 1970s | Diamond core | T | 12 | 20,756 |
| Superior | early 1970s | Diamond core | D | 1 | 1,500 |
| Total | 88 | 108,305.1 | |||
| M3-PN210313.007 31 March 2026 Revision 0 | 74 |
GUNNISON PROJECT Form 43-101F1 Technical Report |
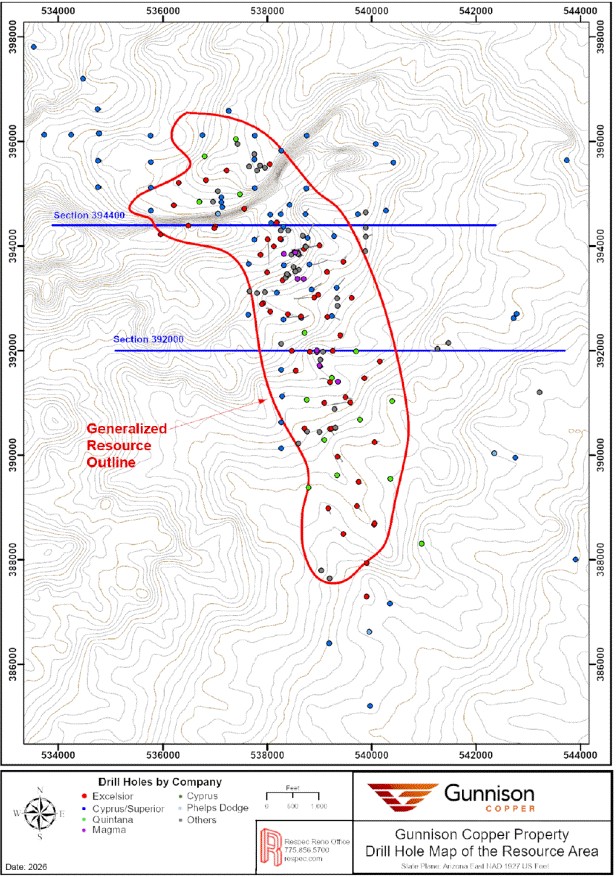
Figure 10-1: Gunnison Deposit Drillhole Collar Locations
| M3-PN210313.007 31 March 2026 Revision 0 | 75 |
GUNNISON PROJECT Form 43-101F1 Technical Report |
Historical core drilled by Cyprus-Superior, Magma, and Quintana is NQ diameter with the exception of two Magma holes (MCC-7 and MCC-8), which were 6-inch metallurgy core holes. James Sullivan diamond drillholes were drilled with HQ-diameter core. The Cyprus-Superior holes used Joy Manufacture Co. as a drilling contractor. Magma drillholes were drilled by Christensen Boyles Corp. RESPEC has no further information on the drilling contractors, rig types, core sizes, and rotary or reverse-circulation drill-bit diameters used to perform the historical drilling.
Sampling of the drill core was on irregular downhole intervals based on geology using half-core splits. For the most part, the entire mineralized intersections have been sampled without any indication of sampling biases towards “high-grading”. Individual down-hole sample intervals ranged from less than 2 feet to about 30 feet. Sample intervals larger than 25 feet generally represent intervals in the overburden (composite chip sampling). All historical drill core was split manually, divided in half, and placed in sample bags for transport to the assay laboratories. Samples have been assayed at commercial laboratories or in-house laboratories as listed in Table 10-2. All laboratories were located in Arizona.
Table 10-2: List of Assay Laboratories Used by Historical Operations
| Company | Assay Laboratory | Comments |
| Superior | American Analytical and Research Laboratories | |
| Quintana | Southwest Assays and Chemists | |
| Phelps Dodge | Actlabs / Skyline Lab1 | Some check assays at Morenci2 |
| Magma | Magma’s San Manuel mine laboratory2 | |
1 Certified by American Association of Laboratory Accreditation 2 Denotes non-independent analytical lab | ||
| 10.1.1 | Historical Collar Position Surveys |
GCC has located 46 historical drillhole collars and had them surveyed by Darling Geomatics using a Trimble Global Positioning System (GPS), which can be accurate to 0.05 ft horizontally and 0.2 ft vertically.
| 10.1.2 | Historical Down – Hole Surveys |
Historical borehole deviation data, where available, has been documented and added to the GCC database. Twenty-nine total historical holes have available survey data. The data came from either gyroscopic or down-hole camera surveys as a part of the initial procedures for the historical drillholes.
Table 10-3: Summary of Historical Borehole Deviation Surveys
| Company | Hole Series | # of Holes Surveyed | Survey Types |
| Cyprus - Superior | CS | 17 | Gyroscopic |
| Cyprus - Superior | J | 5 | Gyroscopic |
| Magma | MCC | 6 | Survey Camera |
| 10.2 | GCC DRILLING 2010 – 2015 |
Fifty-four diamond core holes have been drilled by GCC for a total of 78,615 feet of drilling. Fifteen of these holes were for metallurgical samples and the rest were drilled for resource definition or exploration purposes (Table 10-4; Figure 10-2). Twenty holes were completed from December 2010 to May 2011, eleven holes were drilled from March 2012 to May 2012, and an additional 23 diamond holes were drilled from September 2014 to January 2015. 6 ¼-inch pre-collars were drilled with rotary methods to the base of alluvium (100 to 700 feet) and then cased with 4 ½-inch steel casing. HQ-size diamond core was drilled to a maximum depth of 2,000 feet, except where conditions required
| M3-PN210313.007 31 March 2026 Revision 0 | 76 |
GUNNISON PROJECT Form 43-101F1 Technical Report |
reduction to NQ size. Five metallurgy holes were drilled with PQ diameter core. GCC also completed diamond drilling through the entire section of alluvium for 2 holes in the 2012 program (NSM-001 and NSD-032). Of the 54 holes drilled, 44 have been assayed for inclusion into the mineral resource estimate described in Section 14. GCC has also drilled 32 rotary holes for hydrologic purposes between 2010 and 2015. Assays from these holes do not influence the mineral resource, but the rock chips collected from drilling were logged and used to aide in geologic interpretations of the deposit.
Table 10-4: Listing of GCC Diamond Drilling 2010 – 2015
Hole ID |
Northing (feet) | Easting (feet) | Elevation (feet) | Azimuth |
Dip |
Pre- Collar Depth (feet) | Diamond Depth (feet) | Total Depth (feet) | Purpose |
| NSD-001 | 393496.2 | 537998.1 | 4827.2 | 0 | -90 | 460 | 1045.5 | 1505.5 | Resource |
| NSD-002 | 392910 | 537923.6 | 4809.8 | 0 | -90 | 580 | 1327 | 1907 | Resource |
| NSD-003 | 392651.2 | 538646 | 4805 | 270 | -70 | 565 | 1443 | 2008 | Resource |
| NSD-004 | 391619.2 | 538540.6 | 4781.7 | 0 | -90 | 510 | 799 | 1309 | Resource |
| NSD-005 | 390510.7 | 538711.4 | 4740.2 | 0 | -90 | 420 | 1488 | 1908 | Resource |
| NSD-006 | 391109.8 | 539499.2 | 4753.6 | 0 | -90 | 390 | 1610 | 2000 | Resource |
| NSD-007 | 391470 | 539858.8 | 4737 | 0 | -90 | 430 | 1370 | 1800 | Resource |
| NSD-008 | 392291.2 | 539398.8 | 4783.4 | 0 | -90 | 560 | 1212.5 | 1772.5 | Resource |
| NSD-009 | 393007 | 539614.5 | 4788.2 | 0 | -90 | 620 | 1173 | 1793 | Resource |
| NSD-010 | 391983.3 | 538810.4 | 4768.2 | 0 | -90 | 540 | 969 | 1509 | Resource |
| NSD-011 | 393882.5 | 538523 | 4834.3 | 0 | -90 | 650 | 788 | 1438 | Metallurgy |
| NSD-012 | 390998.4 | 539093 | 4749 | 0 | -90 | 400 | 1331.5 | 1731.5 | Resource |
| NSD-013 | 391010.1 | 539587.2 | 4748.9 | 270 | -70 | 480 | 1527 | 2007 | Resource |
| NSD-014 | 390507 | 539202.9 | 4733.7 | 0 | -90 | 400 | 1512.5 | 1912.5 | Resource |
| NSD-015 | 389971.5 | 539349.6 | 4730.6 | 0 | -90 | 400 | 1556 | 1956 | Resource |
| NSD-016 | 389026 | 539713 | 4731.4 | 0 | -90 | 420 | 1268.5 | 1688.5 | Exploration & Resource |
| NSD-017 | 387936.5 | 539900.7 | 4695.4 | 0 | -90 | 400 | 949 | 1349 | Exploration & Resource |
| NSD-018 | 382749.3 | 538255.3 | 4688.2 | 210 | -70 | 140 | 1264 | 1404 | Exploration |
| NSD-019 | 393832.7 | 537871 | 4848.3 | 0 | -90 | 620 | 834 | 1454 | Resource |
| NSD-022 | 391700.4 | 539007.9 | 4759.5 | 0 | -90 | 500 | 839 | 1339 | Metallurgy |
| NSD-023 | 394132.1 | 538004.1 | 4857.3 | 180 | -70 | 557 | 989 | 1546 | Resource |
| NSD-024 | 394009.6 | 538994.7 | 4823.3 | 270 | -70 | 672 | 1300 | 1972 | Resource |
| NSD-025 | 393019.7 | 538893.5 | 4789.8 | 270 | -70 | 637 | 1006.5 | 1643.5 | Resource |
| NSD-026 | 394710.5 | 537551.9 | 4846.6 | 0 | -90 | 466 | 702 | 1168 | Resource |
| NSD-027 | 394377.4 | 537002.1 | 4883.3 | 0 | -90 | 404 | 600.5 | 1004.5 | Resource |
| NSD-028 | 394391.7 | 536487.3 | 4880.6 | 0 | -90 | 396 | 359 | 755 | Resource |
| NSD-030 | 394780.8 | 536207.8 | 4784.9 | 0 | -90 | 240 | 527 | 767 | Resource |
| NSD-031 | 395445.8 | 537220.3 | 4770.2 | 0 | -90 | 416 | 592 | 1008 | Resource |
| NSD-032 | 395280.2 | 536824 | 4786.4 | 0 | -90 | 338 | 905 | 905 | Resource |
| NSD-033 | 392745.5 | 538051.5 | 4809.1 | 0 | -90 | 499 | 1080 | 1579 | Resource |
| NSD-034 | 388494.6 | 539451.3 | 4708.7 | 0 | -90 | 343 | 654 | 997 | Resource |
| NSD-035A | 388985.8 | 539165.4 | 4713.4 | 0 | -90 | 321 | 838.9 | 1159.9 | Resource |
| M3-PN210313.007 31 March 2026 Revision 0 | 77 |
GUNNISON PROJECT Form 43-101F1 Technical Report |
Hole ID |
Northing (feet) | Easting (feet) | Elevation (feet) | Azimuth |
Dip |
Pre- Collar Depth (feet) | Diamond Depth (feet) | Total Depth (feet) | Purpose |
| NSD-036 | 394225.5 | 535954.6 | 4888.2 | 0 | -90 | 504 | 289.3 | 793.3 | Resource |
| NSD-037 | 395565 | 538041.6 | 4751.3 | 0 | -90 | 524 | 760.4 | 1284.4 | Resource |
| NSD-038 | 388669.9 | 540044.5 | 4719.4 | 0 | -90 | 402 | 1191 | 1593 | Resource |
| NSD-039 | 389494 | 539748.4 | 4729.3 | 0 | -90 | 383 | 1131.8 | 1514.8 | Resource |
| NSD-040 | 390249.4 | 540050.5 | 4722.9 | 0 | -90 | 222 | 1658 | 1880 | Resource |
| NSD-041 | 391796.5 | 540151.9 | 4746.9 | 0 | -90 | 383 | 1383 | 1766 | Resource |
| NSD-042 | 391998.8 | 538464.7 | 4793.1 | 0 | -90 | 460 | 1053 | 1513 | Resource |
| NSD-043 | 393699.3 | 539451.7 | 4802.4 | 0 | -90 | 628 | 1108 | 1736 | Resource |
| NSD-044 | 387296.5 | 539902.7 | 4684.9 | 0 | -90 | 322 | 445 | 767 | Resource |
| NSM-001 | 394139.3 | 538247.4 | 4850.5 | 0 | -90 | 0 | 1150 | 1150 | Metallurgy |
| NSM-002 | 392695.2 | 538391.1 | 4809.4 | 0 | -90 | 507 | 493 | 1000 | Metallurgy |
| NSM-003 | 392892.6 | 537897 | 4810.2 | 0 | -90 | 608 | 420 | 1028 | Metallurgy |
| NSM-004 | 393948.5 | 538702.4 | 4829.1 | 0 | -90 | 596 | 518.3 | 1114.3 | Metallurgy |
| NSM-005A | 393065.2 | 538976.9 | 4786.9 | 0 | -90 | 592 | 579.5 | 1171.5 | Metallurgy |
| NSM-006 | 393997.1 | 538123.5 | 4847.5 | 0 | -90 | 529 | 688 | 1217 | Metallurgy |
| NSM-007 | 394447.2 | 538182.6 | 4844.2 | 0 | -90 | 604 | 563.9 | 1167.9 | Metallurgy |
| NSM-008 | 393344.9 | 538291.6 | 4815.6 | 0 | -90 | 548 | 725 | 1273 | Metallurgy |
| NSM-009 | 392647.8 | 539150.5 | 4794.1 | 0 | -90 | 585 | 764.1 | 1349.1 | Metallurgy |
| NSM-010A | 390508.5 | 539236.6 | 4732.7 | 0 | -90 | 424 | 414.9 | 838.9 | Metallurgy |
| NSM-011 | 391996.1 | 539252.3 | 4774.9 | 0 | -90 | 540 | 799.7 | 1339.7 | Metallurgy |
| NSM-012 | 391397.3 | 539202.4 | 4765.4 | 270 | -70 | 584 | 298 | 882 | Metallurgy |
| NSM-013 | 394341 | 536980.7 | 4881.1 | 0 | -90 | 404 | 549 | 953 | Metallurgy |
| M3-PN210313.007 31 March 2026 Revision 0 | 78 |
GUNNISON PROJECT Form 43-101F1 Technical Report |
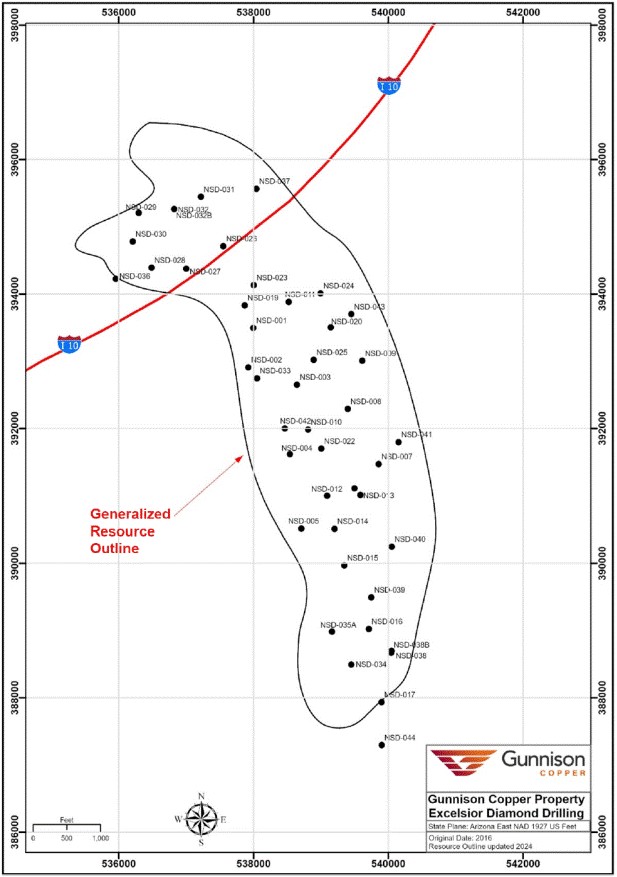
Figure 10-2: GCC 2010-2015 Drillhole Collar Locations
| M3-PN210313.007 31 March 2026 Revision 0 | 79 |
GUNNISON PROJECT Form 43-101F1 Technical Report |
The shaded areas in Figure 10-2 show lands not controlled by GCC. These areas are excluded from the Project mineral resources.
The GCC drillholes are mostly vertical. All GCC drillhole collars have been surveyed by Darling Geomatics using a Trimble GPS, which can be accurate to 0.05 ft horizontally and 0.2 ft vertically. Borehole deviation surveys were conducted for each drillhole using a Reflex down-hole camera survey for each GCC drillhole. Additionally, borehole geophysical logging was carried out on 84% of the GCC drillholes. Where available, the deviation surveys acquired from the geophysical logging supersede the camera surveys due to higher precision of the data.
| 10.2.1 | GCC Drill Logging and Sampling Procedures |
Following delivery of drill core from the drill sites to GCC’s core storage facility in Casa Grande, Arizona, the core was laid out to check labeling, identify any missing intervals, and cleaning. GCC technicians measured and recorded core loss and RQD. The core was then logged digitally using customized AcQuire data-entry forms, which were then forwarded to the GCC database administrator. Additional logging of individual fractures from the borehole geophysical data was done in WellCad software.
The logging geologist marked up the core for sampling and splitting prior to photographing the core. Sample intervals were standardized at 10 feet; however, sample intervals were terminated at lithological boundaries. Other geological factors also led to shorter sample intervals at the discretion of the geologist. The core was then photographed wet and dry, and magnetic susceptibility was measured within each sample interval using a SM-30 handheld susceptibility meter.
Specific-gravity measurements were made using the water-displacement method for every assay sample in zones of mineralization, and every 10 feet outside of mineralized zones. The geologist made the determination on where SG measurements were taken in consideration of mineralized and un-mineralized materials, but measurement intervals most typically respected the assay intervals. The core was not wrapped or waxed for the density measurements. A quartz (SG = 2.65) and marble (SG = 2.71) standards were measured alternatively every 20 samples for quality control of the SG measurements. Readings outside of acceptable limits (three standard deviations) resulted in re-measurement of all samples back to the previous successful standard measurement. Duplicate SG measurements were made every 20 samples.
Samples were split using hydraulic splitters and bagged for shipment to the assay laboratory. Care was taken to ensure that no bias was introduced into the splitting by visually observing the mineralization in the core and splitting appropriately. The fines produced were also manually split and included in the sample.
| 10.2.2 | GCC Core Recovery and RQD |
Core recovery and RQD were measured for each drill run in every GCC diamond drillholes. Recovery was very high (average of 95%) with only rare occurrences of poor recovery due to discrete structures and/or narrow voids. RQD averaged 66%. Table 10-5 below defines RQD and Core Recovery as they relate to the total copper resource domains described in Section 14.2.7. The RQD and recovery values for geotechnical intervals lying within the modeled low-grade and high-grade domains are similar and are also close to the values for intervals lying outside of the modeled domains.
| M3-PN210313.007 31 March 2026 Revision 0 | 80 |
GUNNISON PROJECT Form 43-101F1 Technical Report |
Table 10-5: Core Recovery and RQD for GCC Diamond Drilling 2010 – 2015
All GCC Drilling |
Inside Low-Grade Domain | Inside High-Grade Domain | Inside All Domains | Outside All Domains | |
| % RQD | 66% | 63% | 67% | 65% | 68% |
| % Recovery | 95% | 96% | 96% | 96% | 95% |
| Intervals Measured | 7,752 | 2,139 | 2,309 | 4,448 | 3,304 |
| 10.3 | GCC WELL DRILLING 2018-2019 |
From late 2018 to late 2019, GCC drilled 57 wells totaling 74,342 feet. Of the 57 wells completed, 41 were Injection/Recovery production wells (“IR Wells”) contained within a 400-foot by 400-foot area in the deposit and the remaining 16 were drilled and designed for various monitoring and compliance purposes exterior to the wellfield, in accordance with their operational permits. A map of the 2018-2019 drilling is shown in Figure 10-3. The monitoring and compliance well types include Hydraulic Control Wells (“HC Wells”), Intermediate Monitoring Wells (“IMW Wells”), Observation Wells (“OW Wells”), and Point of Compliance Wells (“POC Wells”). The 2018-2019 drilling campaign is summarized in Table 10-6.
Table 10-6: Summary of 2018-2019 GCC Drilling
Well Type |
Count |
Total Footage | Alluvium Footage | Bedrock Footage |
| IR Wells | 41 | 53,387 | 24,925 | 28,462 |
| HC Wells | 9 | 11,790 | 5,160 | 6,630 |
| IMW Wells | 2 | 2,616 | 1,080 | 1,536 |
| OW Wells | 2 | 2,620 | 1,210 | 1,410 |
| POC Wells | 3 | 3,929 | 1,420 | 2,509 |
| Total | 57 | 74,342 | 33,795 | 40,547 |
The 41 IR Wells and 9 HC Wells were drilled by rotary methods with conventional circulation through the alluvium and into the bedrock to a specified footage, and were cased and sealed in accordance with compliance requirements. The bottoms of the wells were then drilled through the rest of the mineralized zone by reverse-circulation methods and sampled per GCC’s internal sampling procedures. All monitoring and compliance wells were generally drilled by rotary methods with conventional circulation in the alluvium and by mud-rotary methods with conventional circulation in the bedrock. The bedrock in the compliance wells was sampled per GCC’s internal sampling procedures. Some exceptions made to the specific drilling methodologies described above were employed to address specific ground conditions.
| 10.4 | GCC Drilling Summary Statement |
It is the opinion of the author that the drilling and sampling procedures conducted by GCC provided samples of drill intercepts which are representative of significant copper mineralization at the Gunnison and of sufficient quality for use in the interpretations herein, most importantly the estimation of Mineral Resources. Detailed interpretations of the geologic and mineralized intercepts of the drilling results pertinent to the Mineral Resources are provided in Sections 7 and 14.
| M3-PN210313.007 31 March 2026 Revision 0 | 81 |
GUNNISON PROJECT Form 43-101F1 Technical Report |
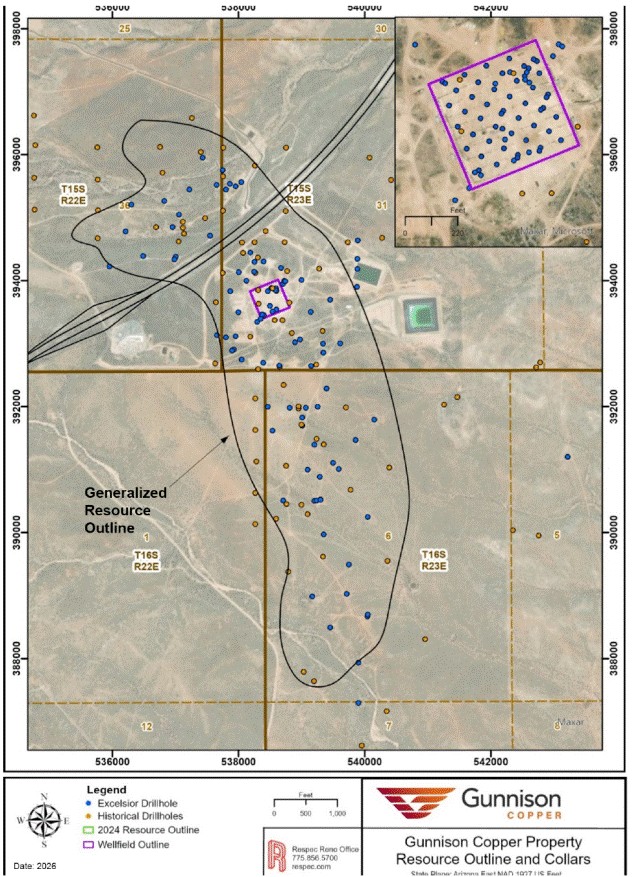
Figure 10-3: Collar Locations with 2018-2019 Drilling in Wellfield Area shown inside the Insert
| M3-PN210313.007 31 March 2026 Revision 0 | 82 |
GUNNISON PROJECT Form 43-101F1 Technical Report |
| 10.5 | Strong & Harris Drilling |
All of the drilling summarized in this section was conducted by historical operators from the 1960s through 1992. GCC has not conducted drilling at the Strong & Harris project. This section summarizes the historical drilling and the information presented in this section of the report is derived from multiple sources, as cited. The author has reviewed this information and believes this summary accurately represents drilling done at the Strong & Harris project.
| 10.5.1 | Summary |
The author is aware of records for a total of 152 holes drilled within the Strong & Harris project, for a total of approximately 130,679 feet drilled. The author believes these holes were drilled in 1965 through 1992 as summarized in Table 10-7. Of these, at least 125 holes were drilled with rotary methods from surface through the valley fill sediments to an average depth of about 425 feet where the top of the Paleozoic sequence was encountered. From that contact the holes were drilled to their final depths with diamond-core (“core”) methods. The drill hole locations are shown in Figure 10-4. Cross sections with representative drill results are provided in Section 14 of this report.
Records of the historical drilling are fragmentary and incomplete. Much of the original information on the methods and procedures used for the historical drilling has been lost. This section is partly based on the summary information provided by Parsons (1974) for the Superior drilling.
Table 10-7: Summary of Strong & Harris Historical Drilling
| Operator | Year | Holes | Feet |
| Coronado Copper and Zinc Co. | 1954 – 1957 | 10 | 7,173 |
| Cyprus Mining | 1965 - 1972 | 38 | 32,952 |
| Continental | 1968 - 1970 | 31 | 22,597 |
| Superior Oil | 1971 - 1976 | 70 | 64,304 |
| Beard Mining | 1980 | Deepened SH-83 | 1,501 |
| Robert C. Durham | 1985-1986 | 2 | 1,094 |
| AZCO/Granges | 1992 | 1 | 1,058 |
| Totals | 152 | 130,679 | |
Three of the ten holes drilled by Coronado Copper and Zinc Co. were angled at -40° and the rest were vertical. All 10 were core holes drilled with BX and smaller diameters but no information is available regarding the drill contractor(s), rig type(s) or methods and procedures for collar and down-hole surveys, if any were conducted.
| M3-PN210313.007 31 March 2026 Revision 0 | 83 |
GUNNISON PROJECT Form 43-101F1 Technical Report |
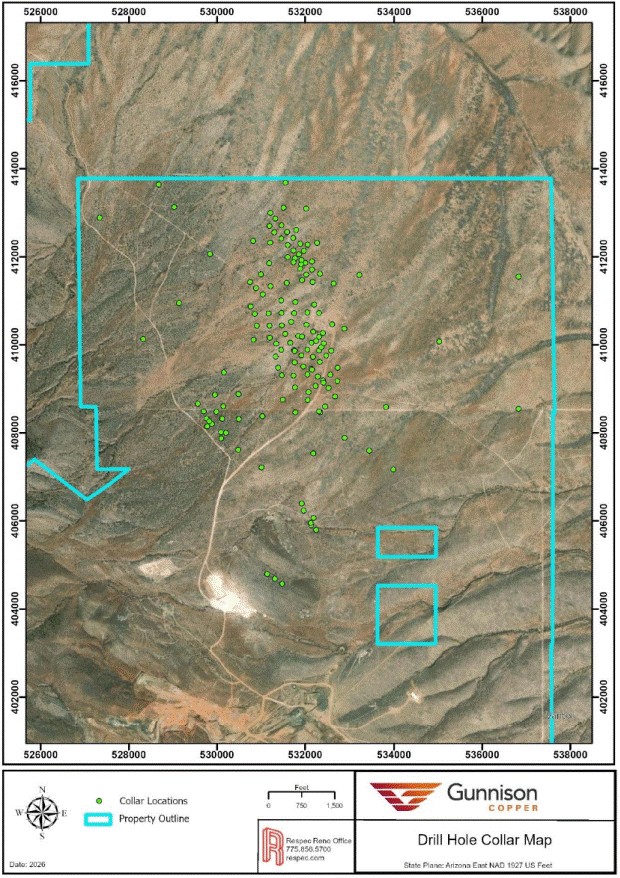
Figure 10-4: Map of Strong & Harris Drill Holes
| M3-PN210313.007 31 March 2026 Revision 0 | 84 |
GUNNISON PROJECT Form 43-101F1 Technical Report |
| 10.5.2 | 1954 – 1957 Historical Drilling by Coronado Copper and Zinc Co. |
Coronado Copper and Zinc Co. drilled a total of 7,173 feet in 1954 and 1957. According to the records, most of the core size was EX with the exception of BX and AX pre-collars. No other information is available regarding the drill contractor(s), rig type(s) or methods and procedures for collar and down-hole surveys, if any were conducted.
| 10.5.3 | 1965 - 1968 Historical Drilling by Cyprus Mining |
Cyprus drilled a total of 32,952 feet in 38 vertical holes in 1965 to 1968. According to Parsons (1974), the core size was NX with the exception of a few feet of BX size. No information is available regarding the drill contractor(s), rig type(s) or methods and procedures for collar and down-hole surveys, if any were conducted.
| 10.5.4 | 1968 – 1970 or 1971 Historical Drilling by Continental Exploration |
Continental drilled a total of 22,597 feet in 31 vertical holes in 1968 through 1970, and possibly into 1971. The core size was NX with the exception of a few feet of BX size (Parsons, 1974). No information is available regarding the drill contractor(s), rig type(s) or methods and procedures for collar and down-hole deviation surveys, if any were conducted.
| 10.5.5 | 1971 – 1976 Historical Drilling by Superior Oil Company |
The author has records indicating that Superior drilled a total of 64,304 feet in 70 holes during 1971 to possibly as late as 1975. All of the holes were vertical. The core size was NX with the exception of a few feet of BX size (Parsons, 1974). No information is available regarding the drill contractor(s), rig type(s) or methods and procedures for collar and down-hole deviation surveys, if any were conducted.
| 10.5.6 | Historical Drilling by New Beginnings Resources |
New Beginnings drilled four holes at the Strong & Harris project according to a 1991 report by Manzanita Mining. Records of this drilling have been lost and the author is unaware of the locations of these drill holes, the methods and procedures used for the drilling, and the results of this drilling.
| 10.5.7 | Historical Drilling by Robert C. Durham |
In 1985 and 1986, Robert C. Durham drilled two holes at Strong & Harris. The drill contractor was Longyear Company. No information is available regarding the rig type(s) or methods and procedures for collar and down-hole deviation surveys, if any were conducted.
| 10.5.8 | Historical Drilling by AZCO/Granges Inc. |
In 1992, AZCO Mining (through a Joint Venture with Granges, Inc), drilled one hole at Strong & Harris. The drill contractor was Longyear Company. No information is available regarding the rig type(s) or methods and procedures for collar and down-hole deviation surveys, if any were conducted.
| 10.6 | Drill-Hole Collar Surveys |
GCC has located 97 historical drill hole collars through a survey from Darling Environmental & Surveying, Ltd. of Tucson, Arizona. The survey was conducted using a Trimble Global Positioning System (“GPS”), which can be accurate to 0.05 ft horizontally and 0.2 ft vertically.
| M3-PN210313.007 31 March 2026 Revision 0 | 85 |
GUNNISON PROJECT Form 43-101F1 Technical Report |
| 10.7 | Down-Hole Surveys |
Only two of the holes at the Strong & Harris project are known to have been surveyed for down-hole deviation. Both holes were drilled by Superior. The surveys were conducted in 1974 by Parsons Survey Co. of Tucson, Arizona (Parsons, 1974). The author is not aware of the methods, procedures or type of instruments used for these surveys.
| 10.8 | Summary Statement |
Mr. Bickel believes that the drilling sampling procedures provided samples that are representative and of sufficient quality for use in the resource estimations discussed in Section 14. The author is unaware of any sampling or recovery factors that materially impact the mineral resources discussed in Section 14.
There is a general lack of down-hole deviation survey data for the historical holes in the Strong & Harris database in all but two drill holes. While the paucity of such data is not unusual for drilling done prior to the 1990s, the lack of deviation data contributes a level of uncertainty as to the exact locations of drill samples at depth. However, in the Strong & Harris area these uncertainties are mitigated to a significant extent by the vertical orientation of nearly all drill holes, the fact that the two surveys that do exist show very little deviation, and the likely open-pit nature of any potential future mining operation that is based in part on data derived from the historical holes.
| M3-PN210313.007 31 March 2026 Revision 0 | 86 |
GUNNISON PROJECT Form 43-101F1 Technical Report |
| 11 | SAMPLE PREPARATION, ANALYSES AND SECURITY |
The following sections summarize the extent of Mr. Bickel’s knowledge regarding the sample preparation, analysis, security, and quality assurance/quality control protocols used in the various drilling programs at the Gunnison Deposit.
| 11.1 | Historical Sample Preparation, Analysis and Security |
The laboratory sample preparation and analytical procedures used by the previous owners of the deposits are unknown. However, the commercial analytical laboratories known to have been used by the historical operators at the Gunnison Deposit are, or were at the time, well recognized and widely used in the minerals industry. In addition, all of the historical operators were reputable, well-known mining/exploration companies, and there is ample evidence that these companies and their chosen commercial laboratories followed accepted industry practices with respect to sample preparation, analytical procedures, and security.
James Sullivan maintained security of the project information and drill samples since the early 1980s to 2006. Information and samples collected by Superior, Cyprus and Quintana in the 1970s to 1980s were handed over to James Sullivan and relocated to his core facility in Casa Grande, Arizona between 1980 and 1998. Magma Copper had security and control of its own information and samples from approximately 1993 to 1997, after which Magma relinquished control to James Sullivan who relocated all the Magma Copper information and samples to his core facility. Phelps Dodge maintained its information and samples until 1998, after which time they were transferred to James Sullivan and were relocated to his core facility.
From November 2006 until October 2010, the original information and samples were under the control of AzTech Minerals at the former James Sullivan core facility. GCC has maintained control of the core facility since October 2010.
| 11.2 | GCC Sample Preparation, Analyses and Security |
GCC’s drill core sampling procedure is as follows:
| ● | Assay tickets are placed at the start of the assay interval. |
| ● | Sample intervals are recorded within the AcQuire form as well as written within paper ticket books. |
| ● | All skarn and porphyry units are sampled. Additional sampling of rock types and/ or mineralization is left up to the discretion of the geologist, under the guidance with senior staff. |
| ● | Sample intervals are based on lithologic boundaries and are not taken across the boundary with the following exceptions: |
| ◌ | short intervals (~<1 foot) can be included within a larger sample where isolating the unit would be problematic; and |
| ◌ | thin lithologic units can be included within a larger sample when sampling such a unit is impractical. |
| ● | Sample length is 10 feet within all rock types. It is understood that irregular sample lengths may be needed at geological boundaries. |
| ● | In areas of poor ground conditions or poor recovery, sample lengths may extend up to 20 feet. |
| ● | Samples must be bracketed on either side by an additional sample (no isolated samples). |
The core samples were manually split by a GCC technician using a hydraulic splitter, with one half placed in a numbered sample bag and the other half retained in the core box. Quality Assurance/Quality Control processes are discussed in Section 11.3.
| M3-PN210313.007 31 March 2026 Revision 0 | 87 |
GUNNISON PROJECT Form 43-101F1 Technical Report |
| 11.2.1 | GCC Analytical Methods |
Skyline Assayers and Laboratories (Skyline) in Tucson, AZ has been GCC’s primary assay lab for drill samples since 2010. Skyline is accredited with international standard ISO/IEC 17025:2005 General Requirements for the Competence of Testing and Calibration Laboratories. Total copper (TCu), acid-soluble copper (ASCu) and cyanide-soluble copper (CNCu) were analyzed. Samples were also assayed for molybdenum in some cases at the discretion of the geologist. Skyline is independent of GCC as GCC has no relationship with Skyline other than Skyline being a service provider.
Upon receipt at Skyline, GCC’s drill samples were lined up and coded into Skyline’s lab information system. Any missing, illegible, or damaged samples were reported. Samples were crushed to 70-80% passing minus 10 mesh. The crushed samples were then split and recombined 3 times, and 250 to 280 grams of material were split and pulverized to 95% passing 150 mesh. Washed river rock was used to clean the crusher between samples.
The analytical methods for copper assays are as follows:
Total Cu (TCu) analysis: Samples are digested in a mixture of hydrochloric, nitric and perchloric acids. This solution is heated and taken to dryness. The contents are treated with concentrated hydrochloric acid and the solution is brought to a final volume of 200 mL with de-ionized water. This solution is read by Atomic Absorption using Standard Reference Materials made up in 5% hydrochloric acid.
Sequential Analysis of Acid-Soluble Cu (ASCu) and Cyanide-Soluble Cu (CNCu): Samples are digested in 5% sulfuric acid and supernatant solution is diluted to 100 mL with de-ionized water. The residue is digested in 10% sodium-cyanide solution and diluted to 100 mL. The ASCu samples are read on Atomic Absorption units using 0.5% H2SO4 calibration standards. The CNCu samples are read on Atomic Absorption units using 1% NaCN calibration standards.
| 11.2.2 | GCC Sample Security |
Drilling was carried out 24 hours a day, 7 days a week, during the drilling periods. Drill core was temporarily stored at the drill rig, supervised by both the driller and the site geologist. The drilling occurred on isolated ranch land behind a locked gate, limiting the access to authorized GCC and drilling personnel. The core was placed in closed core boxes on pallets and banded for pick up by a transport service. A transfer form was signed by both parties upon pickup and delivery of the core to GCC’s core facility in Casa Grande. Once in Casa Grande, the core was stored in a locked facility. Core samples ready for assaying were transported from the core facility to the assay laboratory by Skyline personnel.
In the opinion of the author, there were no significant issues with respect to the sample collection methodology, sample security, sample preparation or sample analyses in the Gunnison Deposit exploration and the sample preparation, analysis, and security protocols of GCC for the Gunnison Project meet current industry standards.
| 11.3 | Gunnison Quality Assurance/Quality Control Programs |
| 11.3.1 | Historical QA/QC |
QA/QC data are not available for any of the historical drilling programs, if any ever existed. GCC has attempted to validate, and has partially replaced, the historical assay data through a resampling and re-assaying program.
| 11.3.2 | GCC QA/QC |
The QA/QC program instituted by GCC for the Gunnison Deposit 2011 to 2015 drilling programs included the systematic analyses of certified analytical standards, coarse blanks, and field duplicates. Skyline performed copper
| M3-PN210313.007 31 March 2026 Revision 0 | 88 |
GUNNISON PROJECT Form 43-101F1 Technical Report |
analyses on all of GCC’s original drill samples and their related QA/QC samples. The QA/QC program was designed to ensure that at least one standard, blank, or field duplicate was inserted into the drill-sample stream for every 10 drill samples. The 2011 and 2012 drill programs also employed check assaying by ALS. ALS located in Tucson, AZ is an independent accredited ISO/IEC 17025:2017 laboratory facility. ALS is independent of GCC as GCC has no relationship with ALS other than ALS being a service provider. All holes drilled by GCC at the Gunnison Deposit have been subject to this QA/QC program.
| 11.3.3 | Certified Standards |
Certified standards were used to evaluate the analytical accuracy and precision of the Skyline analyses during the time the drill samples were analyzed. Two certified standards were purchased from African Mineral Standards (“AMIS”), located in Eastern Johannesburg, South Africa. These standards were chosen by GCC because they are derived from oxidized copper deposits. The certified values and standard deviations for these standards are listed in Table 11-1.
Table 11-1: GCC Certified Standards
Standard ID |
Standard Source |
Certified Value (TCu%) |
Standard Deviation (%) | Standards Analyzed |
| AMIS0118 | AMIS | 0.4615 | 0.0135 | 419 |
| AMIS0249 | AMIS | 0.3692 | 0.0072 | 42 |
Prior to each drilling campaign, GCC attempted to obtain certified standards for ASCu but could not locate any.
Of the standards listed in Table 122, the 301 standards submitted with GCC NSD-series core holes were evaluated by RESPEC, all of which were the AMIS0118 standard. Standards submitted with samples from the NSH-series rotary holes were not reviewed, as these drill data were not used in the mineral resource estimation.
GCC assigned sample numbers for the standards in sequence with their accompanying drill samples, and the standards were inserted into the drill-sample stream submitted for analysis.
Figure 11-1 charts the Skyline analyses of standard AMIS0118.
| M3-PN210313.007 31 March 2026 Revision 0 | 89 |
GUNNISON PROJECT Form 43-101F1 Technical Report |
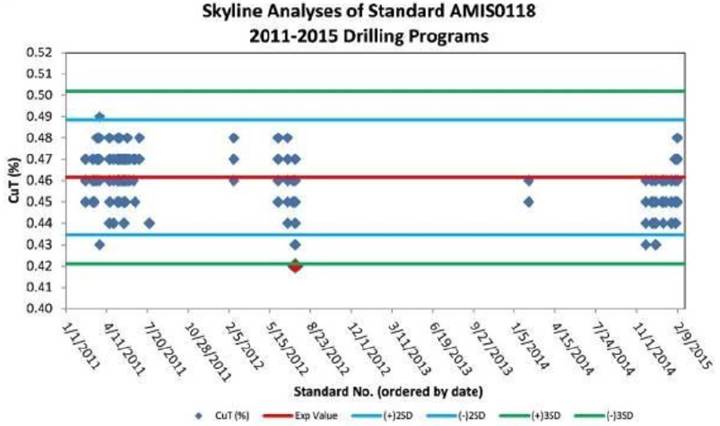
Figure 11-1: Plot of Certified Standard AMIS0118 Analysis
In the case of normally distributed data, 95% of the standard analyses are expected to lie within the two standard-deviation limits (shown as blue lines) of the certified value (shown as the red line), while only 0.3% of the analyses are expected to lie outside of the three standard-deviation limits (green lines). Samples outside of the three standard-deviation limits are therefore considered to be failures. As it is statistically unlikely that two consecutive analyses of standards would lie between the two and three standard-deviation limits, such samples could also be considered failures, unless further investigation proves otherwise.
Only one sample of the 301 assays evaluated lies outside the three standard-deviation limits, and therefore could be considered as a failure (shown as a red diamond in Figure 12-1). However, the failure exceeds the limit by only 0.001% Cu. If the certified standard values and standard deviations were rounded to two decimal places, as the Skyline assays are, instead of three, this standard analysis would not be considered a failure.
There is one case of consecutive analyses that lie between the two and three standard-deviation limits, and these two analyses were performed in the same laboratory batch. However, one of the standards lies above the upper two standard-deviation limits while the other is below the lower two standard-deviation limit. This pair of analyses represent a case worth investigating further but that does not qualify as a ‘failure’.
Table 11-2 compares the mean of Skylines analyses of the standard against its certified value.
Table 11-2: Skyline Analyses of Standard AMIS0118
Drill Program |
Standard Analyses | Count | |
| Mean | %Diff | ||
| 2011 | 0.47 | 1.00% | 178 |
| 2012 | 0.46 | -0.50% | 43 |
| 2014 - 2015 | 0.45 | -1.80% | 80 |
| All | 0.46 | 0.10% | 301 |
| M3-PN210313.007 31 March 2026 Revision 0 | 90 |
GUNNISON PROJECT Form 43-101F1 Technical Report |
The data reviewed indicates no bias in the Skyline analyses of the standards inserted with the 2011 and 2012 drill samples, with a slight low bias of about 2% in Skyline’s analyses of the standards associated with the 2014-2015 drill samples.
| 11.3.4 | Coarse Blanks |
Coarse blanks are samples of barren material that are used to detect possible laboratory contamination, which is most common during sample-preparation stages. Therefore, in order for analyses of blanks to be meaningful, they must be sufficiently coarse to require the same crushing and pulverizing stages as the drill samples. It is also important for blanks to be placed in the sample stream within a series of mineralized samples, which would be the source of most contamination issues.
Blank results that are greater than five times the lower detection limit of the analysis are typically considered failures that require further investigation and possible re-assay of associated drill samples (0.05% and 0.005% Cu for the GCC copper analyses, based on the 0.01% and 0.001% Cu detection limits, respectively).
GCC used landscape river rock purchased from a local home-improvement store as coarse blank material. These blanks were coarse enough to require the same primary and secondary crushing applied to the drill samples.
A total of 236 coarse-blank analyses were analyzed from the 2011 through 2015 drill programs. Of these, 47 were associated with drillholes not used in mineral resource estimation (NSH-series holes), leaving a total of 189 blanks with TCu, ASCu, and/or CNCu analyses that were evaluated by RESPEC. Of these, 126 blanks were preceded by mineralized (above background) drill samples.
There were no failures in the TCu analyses of the blanks and no systematic contamination issues were found in the blank analyses. While two 0.007% ASCu analyses of blanks slightly exceeded the threshold limit of 0.005%, these clearly are not material to the mineral resource modeling discussed in Section 14.
| 11.3.5 | Field Duplicates |
Field duplicates are secondary splits of drill samples. Field duplicates are mainly used to assess inherent geologic variability and subsampling variance. The field duplicate samples were submitted to Skyline with, and immediately following, their associated original drill samples. Only drillholes used in the mineral resource estimate, all of them core holes, are considered in this discussion. Duplicate samples produced by other drilling methods, such as the NSH-series holes which employed conventional-rotary drilling, were not evaluated.
In the case of GCC’s core drilling, field duplicates consisted of quarter-core splits, with the paired originals being half-core splits; a quarter-core split was left in the core library. The field duplicates were collected at regular intervals, which resulted in a large percentage of duplicates being derived from original samples with values at or below the analytical detection limit.
A total of 107 core duplicates were collected by GCC and analyzed by Skyline. The core-duplicate data for TCu are presented in Figure 11-2; 17 pairs in which both the duplicate and original analyses are below the detection limit were removed from the dataset.
| M3-PN210313.007 31 March 2026 Revision 0 | 91 |
GUNNISON PROJECT Form 43-101F1 Technical Report |
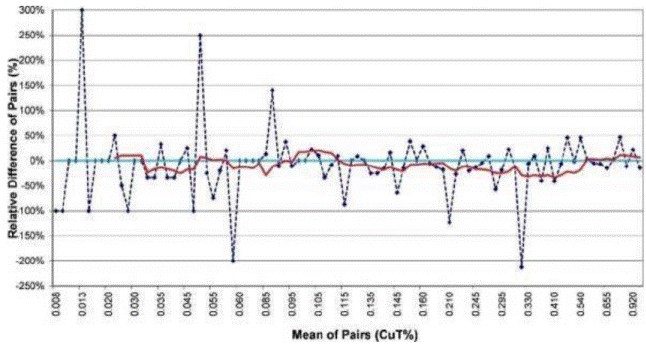
Figure 11-2: Core – Duplicate TCu Analyses Relative to Original Assays
Figure 11-2 is a relative-difference graph, which shows the percentage difference (plotted on the y-axis) of each duplicate assay relative to its paired original analysis. The x-axis of the graph plots the means of the TCu values of the paired data in a sequential, non-linear fashion. The red line is the moving average of the relative differences of the pairs and provides a visual guide to trends in the data. Positive relative-difference values indicate that the duplicate analysis is greater than the original. Relative-difference graphs are very useful in determining biases in the data that may not be evident using only basic descriptive statistics.
The TCu mean of the core-duplicate analyses is 4% lower than the mean of the original samples, but this difference decreases to 2% if the single duplicate pair at a mean of the pair (“MOP”) of 0.330% is removed from the dataset. While there is an indication of a low bias in the core duplicates relative to the originals in the MOP range of ~0.15 to ~0.4% TCu, there are insufficient data to make statistically meaningful conclusions. The average of the absolute values of the relative differences is 25% at a MOP cut-off of 0.1% TCu, indicating a moderate amount of variability between the original and core-duplicate assays.
Figure 11-3 shows the 80 core-sample field-duplicate pairs for ASCu in which both the originals and duplicates were above the lower detection limit; 27 pairs with both below the detection limit were excluded. The mean ASCu grade of the core duplicates is 3% lower than the mean of the original analyses, although the means are identical if five pairs with relative differences exceeding +150% are removed. The average of the absolute values of the relative differences is 34% at a MOP cut-off of 0.1%, lowering to 23% if the five high relative-difference pairs are removed. As with the TCu data, there is a suggestion of a low bias in the ASCu analyses of the core duplicates in the MOP range of ~0.08 to 0.2%, but no statistically valid conclusions can be drawn due to insufficient data in this grade range.
| M3-PN210313.007 31 March 2026 Revision 0 | 92 |
GUNNISON PROJECT Form 43-101F1 Technical Report |
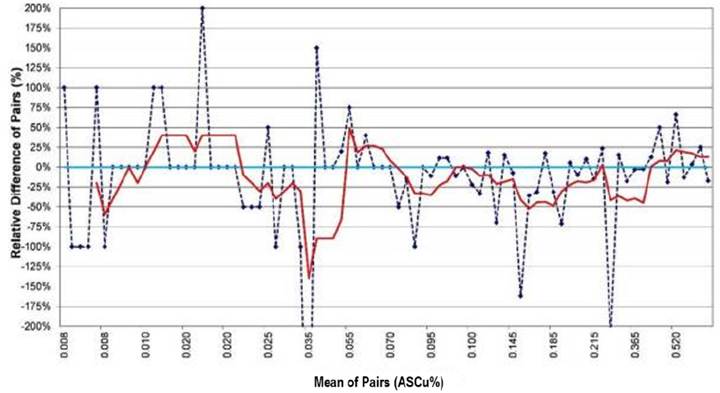
Figure 11-3: Core – Duplicate Analyses Relative to Original ASCu Assays
The mean of the ASCu/TCu ratios derived from the core duplicates is identical to that of the original analyses for all pairs where both TCu analyses exceed 0.03% (low TCu values can lead to meaningless ratios).
While these statistical analyses of the core duplicate TCu and ASCu show no statistically significant issues, more data are needed to properly evaluate GCC’s subsampling of the core.
| 11.3.6 | Replicate Analyses |
Replicate analyses are secondary splits of the original sample pulps that are analyzed by the original laboratory in the same assay batch as the original analysis. These are mainly used to assess variability instilled by the subsampling of the pulp and the analysis itself.
The replicate analyses were analyzed regularly by Skyline as part of its internal QA/QC program. Only the 814 replicates of samples derived from GCC’s NSD core holes are evaluated in this discussion.
The TCu replicate data are presented in Figure 11-4; 138 pairs in which both the duplicate and original analyses are below the detection limit were removed from the dataset.
No bias is evident in the replicate data, and the means of the replicates and the originals are identical at a range of MOP cut-offs. Removal of extreme relative-difference pairs does not affect the means of the datasets because they occur on both sides of the 0% line. Variability of the replicate data is low, as measured by the average of the absolute values of the relative differences, which is 4% for all of the data and 2% at a MOP cut-off of 0.1%.
| M3-PN210313.007 31 March 2026 Revision 0 | 93 |
GUNNISON PROJECT Form 43-101F1 Technical Report |
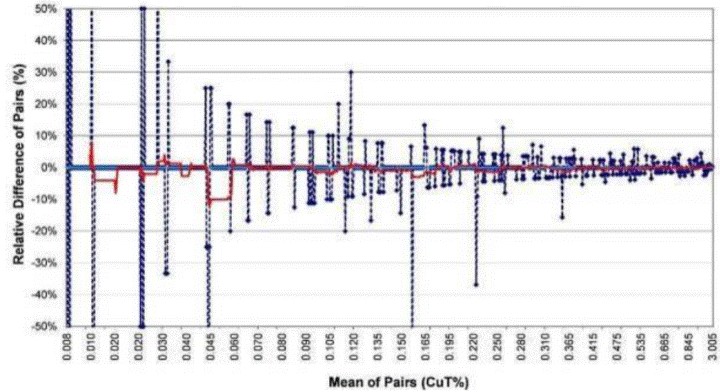
Figure 11-4: Replicate TCu Analyses Relative to Original Assays
Figure 11-5 shows the 975 of 1,289 total replicate-original pairs for ASCu in which both the originals and duplicates were above the lower detection limit; 314 pairs in which both analyses are below the detection limit were excluded. The relative differences displayed at the lowest-grade portion of the ASCu chart are an artifact of variable detection limits that cause extreme, but artificial, variability.
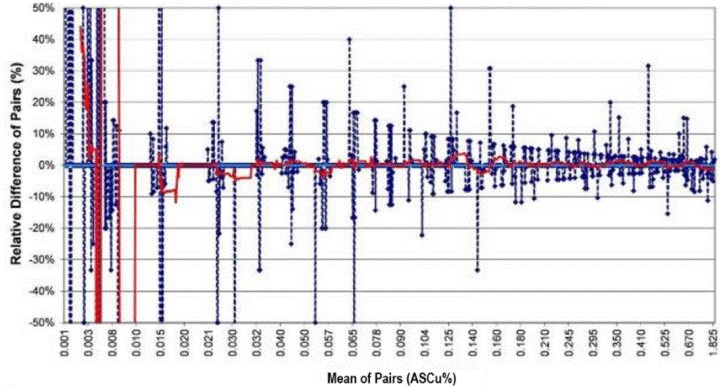
Figure 11-5: Replicate ASCu Analyses Relative to Original Assays
| M3-PN210313.007 31 March 2026 Revision 0 | 94 |
GUNNISON PROJECT Form 43-101F1 Technical Report |
As with TCu, no bias is evident in the ASCu replicate data, and the means of the replicate and original analyses are identical. The average of the absolute values of the relative differences is ~3% at a MOP cut-off of 0.1% ASCu.
The mean of the ASCu/TCu ratios derived from the replicate analyses (0.52) is similar to that of the original analyses (0.53) in pairs where both TCu analyses exceed 0.03%.
| 11.3.7 | Check Assays |
As a further check on analytical accuracy, GCC selected a portion of the original sample pulps from each yearly drill program and sent these to ALS for re-assaying of the original Skyline pulps. Roughly every 20th sample, or approximately 5% of the total sample data, was selected for re-assay. A total of 220 pulps from the 2011, 2012 and 2014/2015 programs were sent to ALS for check assays.
Figure 11-6 compares the ALS check TCu assays to the original Skyline assays from NSD-series core holes from the 2011 and 2012 drilling programs, the ALS check-assay results from which are very consistent. Eight data pairs in which both the check and original analyses are less than the detection limit were removed. The graph shows a very consistent low bias of about 5% in the ALS check assays relative to the Skyline original analyses at MOP greater than about 0.07% TCu. The variability of the duplicate TCu analyses above this MOP is ~7%.
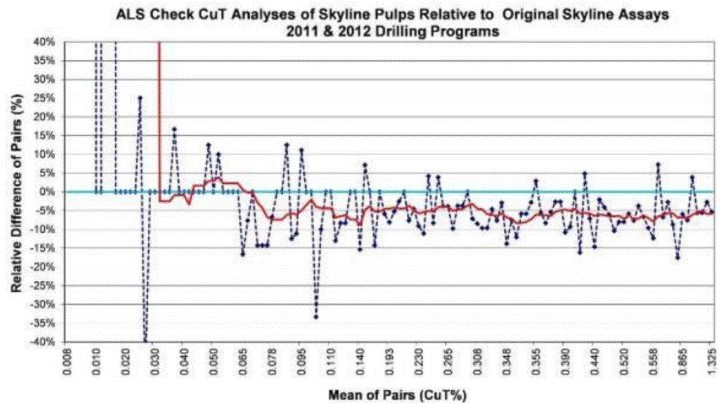
Figure 11-6: ALS Check TCu Assays Relative to Original Skyline Analyses
The check-assay data for ASCu for the 2011 and 2012 drilling programs are very similar to the TCu data, with a consistent low bias in the ALS analyses, in this case of about 8% to 10% relative to the original Skyline assays. The variability of the ASCu duplicate pairs is ~10%.
The check-assay data for the 2014-2015 drilling program yield different results. While there are fewer duplicate pairs, with only 29 pairs above a MOP cut-off of 0.1% TCu, the ALS check TCu assays of the samples from the 2014-2015 program are higher than the original assays up to a MOP grade of ~0.3% TCu, although the extent of the high bias continually decreases over this grade range; in the range MOP range of 0.1 to 0.3% TCu, the ALS analyses are ~5% higher than the original assays. It is worth noting that the Skyline standard analyses for the 2014-2015 drilling program
| M3-PN210313.007 31 March 2026 Revision 0 | 95 |
GUNNISON PROJECT Form 43-101F1 Technical Report |
are also biased low. The limited data above the 0.3% TCu cut-off shows reasonably close agreement between the check and original analyses. The variability in the paired data is ~5% above a MOP cut-off of 0.1% TCu.
The ASCu paired data is again similar to the TCu data for the 2014-2015 drilling program, with a high bias in the check assays of about 10% up to a MOP of ~0.07% ASCu. At higher grades, the check analyses are close to the original analyses. Variability is ~4% above a MOP cut-off of 0.05% ASCu.
GCC included standard pulps with the submissions of Skyline drill-sample pulps to ALS for check assaying at the end of each drill program. ALS analyzed a total of 28 AMIS0118 standard pulps in the check assaying of pulps from the 2011 and 2012 drilling programs and three AMIS0249 standards with the 2014-2015 sample pulps. Figure 11-7 charts the results of the ALS analyses of standard AMIS0118 from the 2011 and 2012 drilling programs, and Table 11-3 summarizes the results for all ALS analyses of the standards.
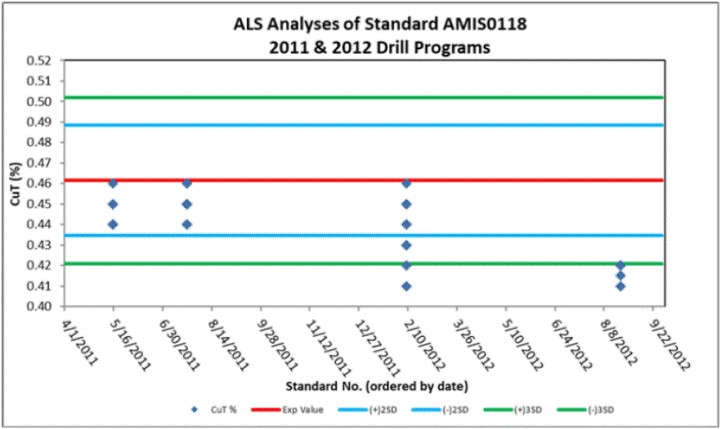
Figure 11-7: Plot of ALS Check Assay Analyses of Standard AMIS0118
Table 11-3: Summary of ALS Analyses of Standards from Check – Assaying Programs
Drill Program |
ALS Mean |
Certified Value | %Diff |
Count |
| 2011 & 2012 | 0.44 | 0.4615 | -4.70% | 28 |
| 2014 & 2015 | 0.36 | 0.3692 | -3.00% | 3 |
The 2011 and 2012 ALS TCu analyses of AMIS0118 are systematically biased low, and the magnitude of this bias is consistent with the magnitude of low bias in the ALS analyses of 2011 and 2012 Skyline drill-sample pulps relative to the original Skyline analyses. While the 2014-2015 ALS analyses of the three AMIS0249 are slightly low, there are insufficient standard analyses to determine a definitive bias. GCC does not have ASCu standards.
It is important to note that the analytical procedures employed by ALS differed significantly from those used by Skyline. Skyline analyzed TCu by atomic absorption following multi-acid digestion. A sequential-leach procedure was performed separately for the ASCu and CNCu analyses. In the case of ALS, ASCu and CNCu were also obtained from sequential-leach analyses. A third analysis was then run on the residua of the sequential-leach analyses. TCu is indirectly determined by adding the three values (ASCu + CNCu + residual Cu). This means that an error in any of the three analyses will similarly affect the calculated TCu value as well. It is unfortunate that ALS did not complete TCu analyses directly on the sample pulps in addition to the sequential-leach analyses.
| M3-PN210313.007 31 March 2026 Revision 0 | 96 |
GUNNISON PROJECT Form 43-101F1 Technical Report |
| 11.3.8 | GCC Inter – Laboratory Check Program |
In light of the discrepancies between the original Skyline and ALS check assays, M3 (2014) recommended additional inter-laboratory check-assaying programs. Following these recommendations, GCC selected 30 coarse rejects from the original Skyline drill samples at the end of each of the 2011, 2012, and 2014-2015 drill programs and sent them to ALS. ALS prepared and analyzed the 30 pulps at the end of each program and then sent the pulps to Skyline for check assays.
RESPEC completed a detailed analysis of this inter-laboratory program using techniques described above for the other duplicate datasets. The data were examined as a whole as well as by drill program. Consistent TCu and ASCu biases were found between the ALS analyses and both the Skyline check assays of the ALS pulps and the original Skyline analyses of the drill core for all three drill programs. In all cases, the Skyline TCu and ASCu analyses are biased high relative to those of ALS. These biases are consistent with those identified in the original check-assaying of the 2011 and 2012 drilling programs discussed above but are not consistent with the check-assay data from the 2014-2015 program.
Table 11-4 compares the means of the original Skyline analyses of core, the ALS analyses of the Skyline coarse rejects, and the Skyline check analyses of the ALS pulps. One of the 90 samples was removed from the dataset due to an extreme outlier in a 2011 ASCu analysis. Based on detailed reviews, as well as the exclusion of this single outlier sample, RESPEC believes the means shown in Table 11-4 provide a reasonable summary of the results of the inter-laboratory check program.
Table 11-4: Summary of the Inter – Laboratory Check Program
| 2011 | 2012 | 2014-2015 | All Data | ||||||||||||
| Skyline | ALS Cse Rej |
Skyline | ALS Cse Rej |
Skyline | ALS Cse Rej |
Skyline | ALS Cse Rej |
Skyline Chk vs Core | ALS vs Skyline | ||||||
| Core | ALS Chk |
Core | ALS Chk |
Core | ALS Chk |
Core | ALS Chk |
vs. Core | vs Chk | ||||||
| TCu | 0.52 | 0.53 | 0.5 | 0.79 | 0.79 | 0.77 | 0.35 | 0.35 | 0.34 | 0.55 | 0.56 | 0.54 | 0.40% | -3.20% | -3.60% |
| ASCu | 0.4 | 0.42 | 0.39 | 0.66 | 0.64 | 0.63 | 0.21 | 0.23 | 0.2 | 0.43 | 0.43 | 0.41 | 0.90% | -4.50% | -5.30% |
| ASCu/TCu | 0.76 | 0.79 | 0.77 | 0.84 | 0.8 | 0.8 | 0.6 | 0.65 | 0.59 | 0.73 | 0.75 | 0.72 | 2.30% | -1.20% | -3.50% |
| CNCu | 0.007 | 0.008 | 0.009 | 0.026 | 0.037 | 0.017 | 0.048 | 0.04 | 0.032 | 0.27 | 0.022 | 0.022 | 7.40% | 18.50% | 24.10% |
Note: One 2011 sample removed due to spurious ASCu analysis
In contrast to the Skyline – ALS biases, comparisons between the original Skyline analyses and the Skyline check analyses of the ALS pulps (which are derived from Skyline coarse rejects) show no biases. The close correspondence between the two sets of Skyline analyses suggests that laboratory sample preparation is not the cause of the Skyline – ALS biases. This leads to the conclusion that the biases are probably rooted in either the subsampling of pulps to obtain aliquots for analysis or in the analyses themselves; RESPEC believes the former explanation is very unlikely.
GCC inserted standards with the coarse rejects analyzed by ALS and the ALS pulps analyzed by Skyline (Table 11-5). All of the ALS and Skyline analyses of these standards yielded values within two standard-deviations of the certified standard grades. While the data are not sufficient to derive definitive conclusions, the Skyline analyses of the standards tend to be higher than the certified values in the 2011 and 2014-2015 data, while the ALS analyses are generally lower. Note that Skyline’s much more numerous analyses of the same standard inserted with the original drill samples show no high bias whatsoever.
| M3-PN210313.007 31 March 2026 Revision 0 | 97 |
GUNNISON PROJECT Form 43-101F1 Technical Report |
Table 11-5: Skyline and ALS TCu Analyses of Standards – Inter – Laboratory Program
Drilling Program |
Standard | ALS | Skyline | |||
| Certified Value | Std Dev | Analysis | %Diff | Analysis | %Diff | |
2011 |
0.4615 |
0.0135 |
0.45 | -2.50% | 0.48 | 4.00% |
| 0.49 | 6.50% | 0.48 | 4.00% | |||
| 0.45 | -2.50% | 0.47 | 1.80% | |||
2012 |
0.4615 |
0.0135 |
0.47 | 1.80% | 0.46 | -0.30% |
| 0.46 | -0.30% | 0.46 | -0.30% | |||
| 0.45 | -2.50% | 0.45 | -2.50% | |||
2014-2015 |
0.3692 |
0.0072 |
0.365 | -1.10% | 0.38 | 2.90% |
| 0.355 | -3.8% | 0.38 | 2.90% | |||
| 0.355 | -3.80% | 0.38 | 2.90% | |||
| 11.3.9 | Summary of GCC QA/QC Results |
No significant issues were identified in the results of Skyline’s analyses of the certified standards, coarse blanks, and replicates. While the analyses of the core duplicates are slightly lower than the original analyses over certain grade ranges, there are insufficient data at these grades to allow for definitive conclusions.
The check-assay data indicate that Skyline analyses are systematically higher than ALS at relevant grades. ALS analyses of standards inserted with the drill-sample pulps for check assaying are systematically ~5% lower than the certified values, while Skyline analyses of the same standards submitted with the original drill samples show no biases or other issues. The inter-laboratory program undertaken to further examine the ALS versus Skyline discrepancies accomplished little more than largely confirming the biases identified in the check-assaying program. Based on these data taken as a whole, as well as the differences between the analytical methods employed by Skyline and ALS, RESPEC concludes that there are no significant issues with the Skyline analyses of the original GCC drill samples, although there may be a slight low bias in the 2014-2015 data.
The accuracy of the ASCu and CNCu analyses in the Project database cannot be directly assessed. These analyses only measure a portion of a sample’s copper content, and this portion will vary laboratory to laboratory based on the specifics of the analytical methodologies. Key variables include the leaching time, the temperature of the leach solution, the strength of the leach solution, and the degree of agitation. In other words, there is no ‘correct’ value in any particular sample. What is important, however, is the consistency in the analyses, which in the case of the Gunnison Deposit can be evaluated by examining the ratios of the core duplicates and the replicate analyses. In both cases, the differences between the duplicate and original ratios are very close (less than one percent). RESPEC finds no issues with the soluble copper analyses in the Project database.
The core-duplicate data are useful in estimating variability in the copper analyses that is attributable to geological heterogeneity, subsampling by GCC and the laboratory, and analytical precision. At a cut-off of about 0.1% for both TCu and ASCu, the variability in the core duplicates is about 20%. Since the core duplicates are comprised of ¼-core samples, and the original drill samples are ½-core samples, this variability probably overstates the variability inherent in the original
½-core samples. The data therefore suggest that the total uncertainty in any single TCu or ASCu value in the existing the Gunnison Deposit data is less than + 20%. Approximately 3% of this total is attributable to analytical precision, as evidenced by the replicate data.
| M3-PN210313.007 31 March 2026 Revision 0 | 98 |
GUNNISON PROJECT Form 43-101F1 Technical Report |
| 11.3.10 | Gunnison QA/QC Recommendations |
RESPEC recommends that GCC consider the following changes to their QA/QC protocols:
| ● | The addition of two certified TCu standards, one at a grade lower than the standard presently in use and the other at a higher grade; |
| ● | The addition of preparation duplicates to the QA/QC protocols. Preparation duplicates are analyses by the primary assay laboratory of second pulps prepared from the original coarse rejects. These duplicates monitor the subsampling undertaken by the primary lab; |
| ● | The TCu, ASCu, and CNCu analytical procedures used by the check-assay laboratory should be identical to those used by GCC’s primary lab; and |
| ● | The use of the present inter-laboratory check program should be terminated. In the event that discrepancies between check assays and the original analyses cannot be resolved by the laboratories’ analyses of certified standards, the check-assay pulps should be sent to a third ‘umpire’ lab along with the same standards analyzed by the primary and check-assay labs. |
| 11.4 | Strong & Harris Sample Preparation, Analysis, and Security |
This section summarizes all information known to Mr. Bickel relating to sample preparation, analysis, and security, as well as quality assurance/quality control procedures and results, that pertain to the Strong & Harris project. The information has either been compiled by Mr. Bickel from historical records as cited, or provided by GCC.
| 11.4.1 | Historical Sample Preparation and Analysis |
Mr. Bickel is unaware of any information on the methods and procedures used by Cyprus and Continental for the preparation of their drilling samples. Samples from the Cyprus and Continental drilling were originally analysed at Southwestern Assayers and Chemists (Parsons, 1974). Incomplete records indicate that some samples were analysed for various combinations of copper ± gold, ± silver ± lead ± zinc ± molybdenum, but the analytical methods are not known.
According to Parsons (1974), for both old core and new core acquired by Superior, the core was split using a guillotine-type splitter. Half was stored and half was placed in cloth sample bags and sent to American Analytical Research Laboratories (“AARL”) in Tucson, Arizona. Each sample was reportedly crushed to minus ¼ inch and split to yield about a two pound fraction. The two pound split was pulverized and dried, then composites of the individual samples were prepared to make 100ft intervals that were analysed at AARL for total copper, total zinc, and oxide copper. In some cases, gold and silver were determined. Copies of assay certificates are preserved in the historical records and the author has reviewed and audited the certificates against the database. The author has no information on the analytical methods and procedures used, or the certifications that AARL may have held. The author infers that AARL was independent of Superior.
Samples from the AZCO/Granges hole of 1992 were analyzed by Skyline Labs for copper, lead and zinc. Copies of assay certificates are preserved in the historical records and the author has reviewed and audited them against the database. No information is available on the methods and procedures used for sample preparation and analysis.
| M3-PN210313.007 31 March 2026 Revision 0 | 99 |
GUNNISON PROJECT Form 43-101F1 Technical Report |
| 11.4.2 | GCC 2021 Sample Preparation and Analysis |
Drill core remaining from historical drilling was inspected and selected intervals were re-sampled in 2021 under the supervision of Mr. Bickel. Before sampling, the core boxes were inventoried, photographed, and inspected by Mr. Bickel and GCC staff. Samples were selected based on criteria agreed upon by GCC and Mr. Bickel, and core availability. A vast majority of the samples existed as half core (originally split by historical operators). These samples were split to ¼ core. In some rare cases, the samples were taken on full core that had not been sampled previously. These samples were split to ½ core. All samples were mechanically split and placed in bags. Internal QA/QC samples (standards, blanks, and ¼ core duplicates) were inserted approximately every tenth sample in the sequence.
The GCC samples were prepared and analyzed at Skyline in Tucson, Arizona. As summarized above, Skyline is an independent commercial laboratory that holds ISO 9001:2015 and ISO/IEC 17025:2017 accreditations.
The samples were crushed to plus 75% passing -10 mesh, then split and pulverized with standard steel to plus 95% passing -150 mesh.
The analytical methods for the assays are as follows:
Total Cu (Cu) and Zinc (Zn) analyses: Samples are digested in a mixture of hydrochloric, nitric and perchloric acids. This solution is heated and taken to dryness. The contents are treated with concentrated hydrochloric acid and the solution is brought to a final volume of 200 mL with de-ionized water. This solution is read by Atomic Absorption using Standard Reference Materials made up in 5% hydrochloric acid.
Sequential Analysis of Acid-Soluble Cu (ASCu) and Cyanide-Soluble Cu (CNCu) analyses: Samples are digested in 5% sulfuric acid and supernatant solution is diluted to 100 mL with de-ionized water. The residue is digested in 10% sodium-cyanide solution and diluted to 100 mL. The ASCu samples are read on Atomic Absorption units using 0.5% H2SO4 calibration standards. The CNCu samples are read on Atomic Absorption units using 1% NaCN calibration standards.
Silver Fire Assay analyses: Silver was determined by fire-assay fusion of a 50g aliquot of the pulp, followed by a gravimetric finish.
31 element analyses: A total of 31 major, minor and trace elements, including silver, were determined by inductively-coupled plasma optical-emission spectrometry (“ICP-OES”) after aqua-regia digestion.
220 of the samples were analyzed by Skyline for bulk density using the water-displacement method.
| 11.4.3 | Sample Security |
The author has no information on the sample security methods and procedures used by historical operators. Drill core remaining from the historical drill campaigns has been stored at the GCC core facility in Casa Grande, AZ. GCC’s samples were selected and stored in plastic bags at the GCC core facility. The plastic bags were placed into large mobile bins and made available for direct pickup by Skyline labs. Upon pickup by Skyline, Chain of Custody sheets were filled out and signed by GCC and Skyline.
| 11.4.4 | Quality Assurance/Quality Control |
| 11.4.4.1 | Historical QA/QC Results |
Little information is provided in the historical records pertaining to the results of historical QA/QC programs. According to Parsons (1974), a spot check of assay values generated by American Analytical vs. those from Southwestern Assayers and Chemists was performed on samples from Continental’s drill holes. Parsons (1974) indicates that the reproducibility results showed a slight low bias in American Analytical’s results compared to the results of Southwestern, but the differences were “well within” 10% of the original value.
| M3-PN210313.007 31 March 2026 Revision 0 | 100 |
GUNNISON PROJECT Form 43-101F1 Technical Report |
| 11.4.4.2 | GCC QA/QC Methods and Results |
CRMs. In 2021, GCC purchased commercial certified reference materials (“CRMs”) for use in the 2021 re-sampling program. The CRMs were inserted into the re-sample stream and analyzed with the core samples. The results were used to evaluate the analytical accuracy and precision of the analyses in GCC’s samples.
In the case of normally distributed data, 95% of the CRM analyses are expected to lie within the two standard-deviation limits of the certified value, while only 0.3% of the analyses are expected to lie outside of the three standard-deviation limits. Note, however, that most assay datasets from metal deposits are positively skewed. Samples outside of the three standard-deviation limits are typically considered to be failures. As it is statistically unlikely that two consecutive analyses of CRMs would lie between the two and three standard-deviation limits, such samples are also considered to be failures unless further investigations suggest otherwise. All potential failures should trigger investigation, possible laboratory notification of potential problems, and possible reanalysis of all samples included with the failed standard result.
Table 11-6 lists the CRMs used by GCC. Note that the CRM “CRM Oxide Au” is not a gold standard, but is certified for silver.
Table 11-6: Certified Reference Materials for 2021 Assays
Reference Material |
Certified Value (%Cu) | 2 Std Dev (%Cu) |
Certified Value (Zn ppm) |
2 Std Dev (Zn ppm) |
Certified Value (Ag ppm) |
2 Std Dev (Ag ppm) |
No of Skyline Analyses |
| AMIS 0200 | 1.06 | 0.09 | 6 | ||||
| A106013X | 0.57 | 2 | |||||
| CRM Oxide Au | 47.6 | 4.8 | 20 | ||||
| MEG-GB4 | 708 | 78 | 7 |
The Skyline copper analyses of the GCC CRMs returned excellent results, with generally good precision and accuracy and no ‘failures’ for both AMIS 0200, shown in Figure 11-8, and A106013X, shown in Figure 11-9.
| M3-PN210313.007 31 March 2026 Revision 0 | 101 |
GUNNISON PROJECT Form 43-101F1 Technical Report |
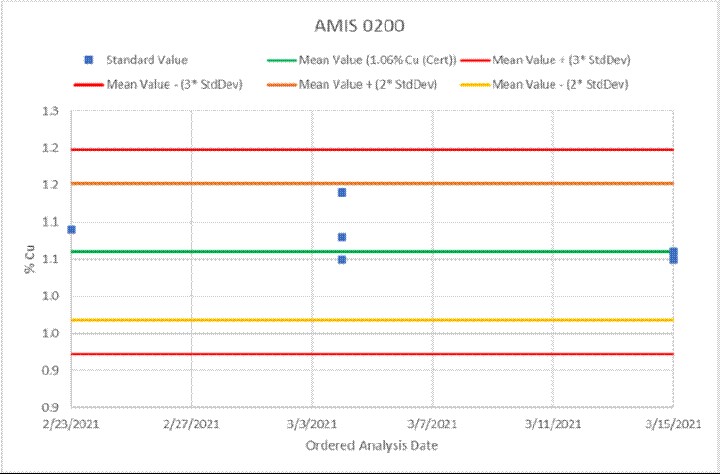
Figure 11-8: AMIS 0200 Copper Analyses
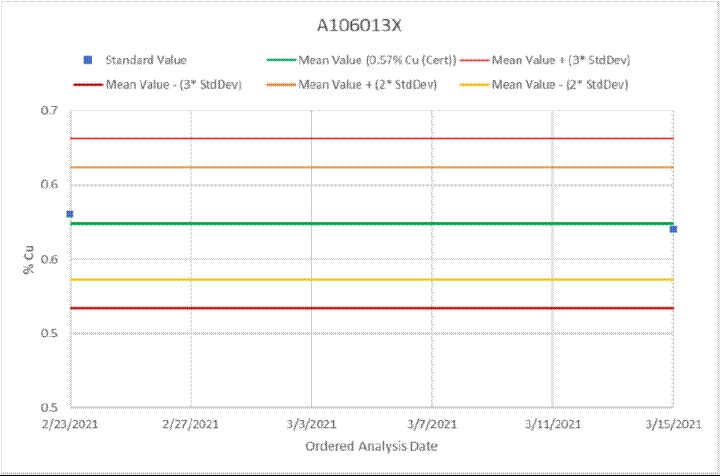
Figure 11-9: A106013X Copper Analyses
| M3-PN210313.007 31 March 2026 Revision 0 | 102 |
GUNNISON PROJECT Form 43-101F1 Technical Report |
Skyline zinc analyses of the GCC CRMs met normal performance thresholds with few ‘failures’. The results are shown in Figure 11-10. The zinc analyses clearly showed a low bias.
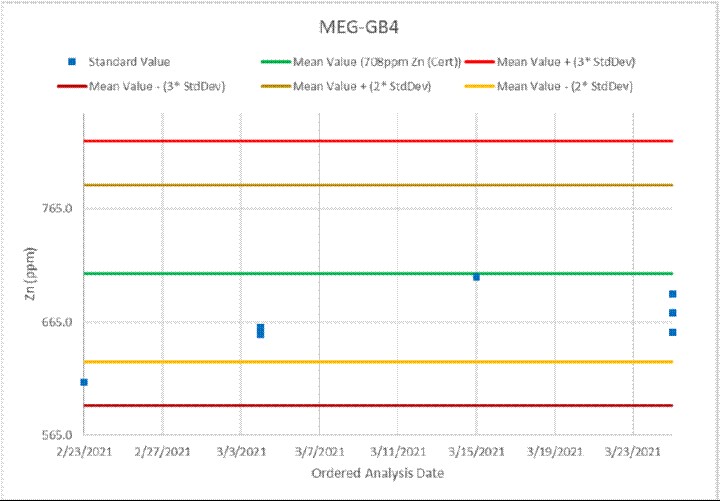
Figure 11-10: MEG-GB4 Zinc Analyses
Skyline silver analyses of the GCC CRMs met normal performance thresholds with a moderate amount ‘failures’. The results are shown in Figure 11-11. The silver analyses clearly showed a low bias.
| M3-PN210313.007 31 March 2026 Revision 0 | 103 |
GUNNISON PROJECT Form 43-101F1 Technical Report |
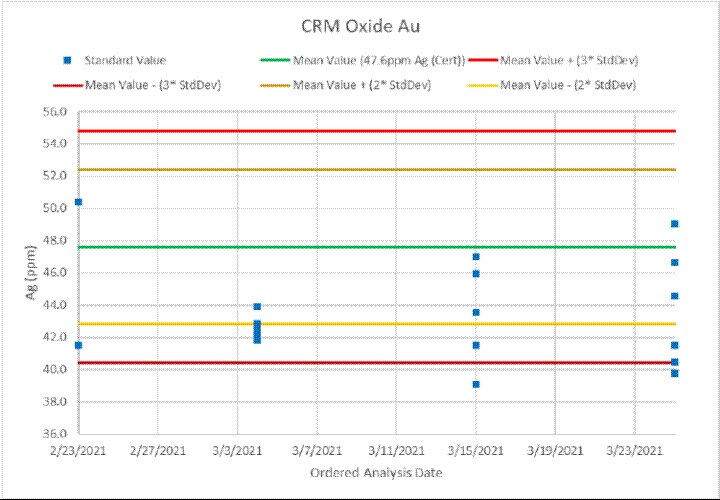
Figure 11-11: CRM Oxide Au Silver Analyses
Coarse Blanks. Coarse blanks are samples of barren material that are used to detect possible contamination in the laboratory, which is most common during sample preparation stages. In order for analyses of blanks to be meaningful, they must be sufficiently coarse to require the same crushing and pulverizing stages as the drill samples. It is also important for a significant number of the blanks to be placed in the sample stream within, or immediately following, a set of mineralized samples, which would be the source of most contamination issues. In practice, this is much easier to accomplish with core samples than RC.
Blank results that are greater than five times the lower detection limit of the relevant analyses are typically considered failures that require further investigation and possible re-assaying of associated drill samples. The detection limit of the Skyline analyses was 0.01 % for copper and zinc, and 0.1 oz/ton for silver, so blank samples assaying in excess of these detection limits are considered to be failures. Plots of the Skyline analyses of the coarse blanks (y-axis) versus the values of the previous samples, which would be the likely source of any in-lab contamination, are shown in Figure 11-12, Figure 11-13, and Figure 11-14. There were no coarse blank failures among the samples analyzed.
| M3-PN210313.007 31 March 2026 Revision 0 | 104 |
GUNNISON PROJECT Form 43-101F1 Technical Report |
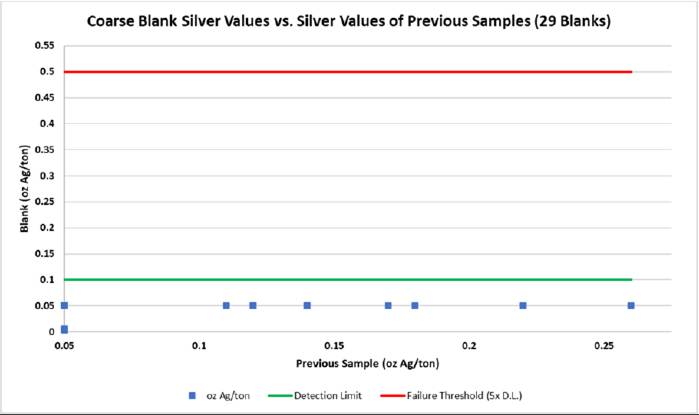
Figure 11-12: Coarse Blank Silver Values vs. Silver Values of Previous Samples
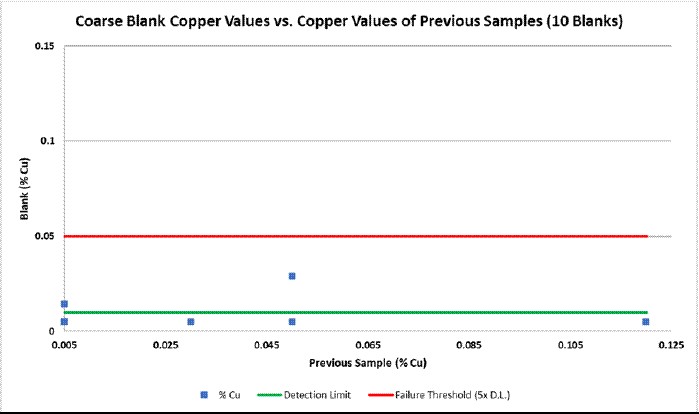
Figure 11-13: Coarse Blank Copper Values vs. Copper Values of Previous Samples
| M3-PN210313.007 31 March 2026 Revision 0 | 105 |
GUNNISON PROJECT Form 43-101F1 Technical Report |
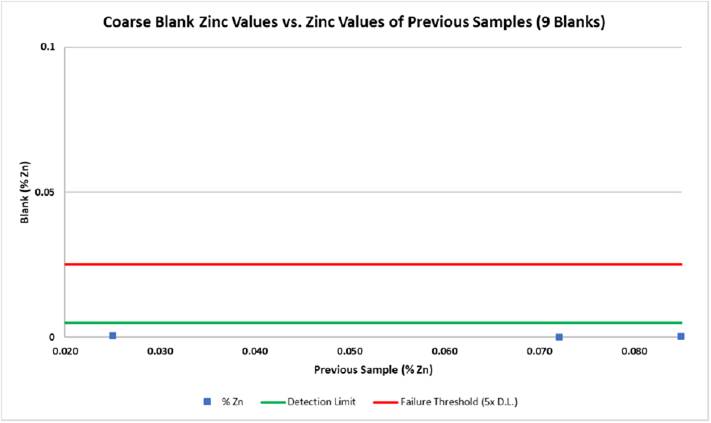
Figure 11-14: Coarse Blank Zinc Values vs. Zinc Values of Previous Samples
Core-Duplicates. Core field duplicates are secondary splits of original core samples collected simultaneously with the primary sample splits. One half split core is quartered to create the duplicate. Core duplicates are used to evaluate the total variability introduced by subsampling, including in the laboratory as well as the variability in the analyses. Core-duplicates should therefore be analyzed by the primary analytical laboratory.
GCC’s resampling program included a total of 14 pairs of copper analyses, 14 pairs of zinc analyses, and 27 pairs of silver analyses. Figure 11-15 is a relative-difference graph that compares the RC duplicate data to the primary samples.
| M3-PN210313.007 31 March 2026 Revision 0 | 106 |
GUNNISON PROJECT Form 43-101F1 Technical Report |
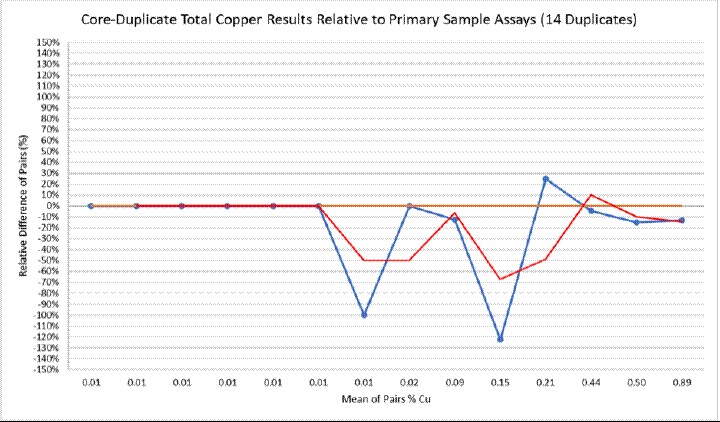
Figure 11-15: Core-Duplicate Copper Results Relative to Primary Sample Assays
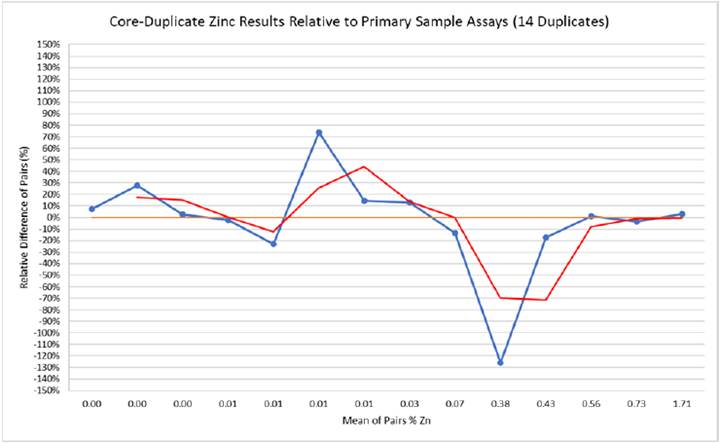
Figure 11-16: Core-Duplicate Zinc Results Relative to Primary Sample Assays
| M3-PN210313.007 31 March 2026 Revision 0 | 107 |
GUNNISON PROJECT Form 43-101F1 Technical Report |
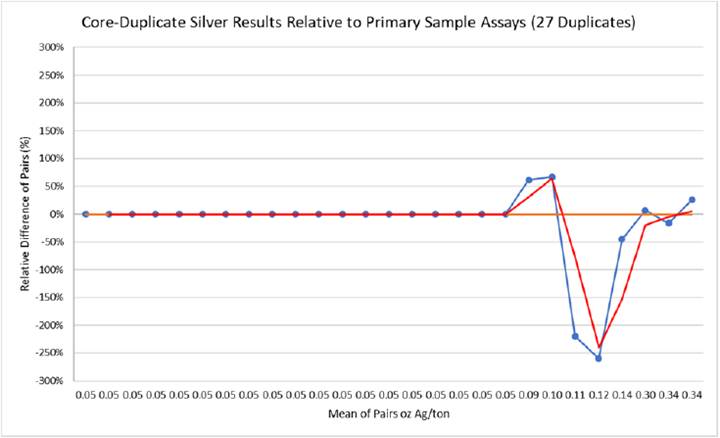
Figure 11-17: Core-Duplicate Silver Results Relative to Primary Sample Assays
There is no obvious bias in the duplicate sample results. The average assay duplicate assay values for copper, zinc, and silver, are all within 10% of the average original values. No outliers were removed.
| 11.4.5 | Summary of Strong & Harris QA/QC Results |
Other than with respect to Skyline, the certification status of the analytical laboratories is not known. Mr. Bickel is not familiar with AARL. Southwestern Assayers and Chemists is the predecessor to Skyline. Mr. Bickel believes these were independent commercial laboratories that were widely recognized and used by the mining industry at that time.
Documentation of the methods and procedures used for historical sample preparation, analyses, and sample security, as well as for quality assurance/quality control procedures and results, is incomplete and in many cases not available. Despite this, a majority of the historical assay certificates have been preserved and GCC was able to reasonably duplicate the original results (described in section 12.2.4). Mr. Bickel is therefore satisfied that the historical analytical data are adequate to support the current resources, interpretations, conclusions, and recommendations summarized in this report.
| 11.5 | Adequacy of Sample Collection, Preparation, Security and Analytical Procedures |
It is the opinion of the author that GCC’s sample preparation and analyses for both Gunnison and Strong & Harris were performed at a well-known certified laboratory, and the sample security and QA/QC procedures are adequate to support the current resources, interpretations, conclusions, and recommendations summarized in this report, including Mineral Resource Estimation.
| M3-PN210313.007 31 March 2026 Revision 0 | 108 |
GUNNISON PROJECT Form 43-101F1 Technical Report |
| 12 | DATA VERIFICATION |
Verification of data relevant to the mineral resources of the Gunnison Deposit was completed under the supervision of Mr. Bickel of RESPEC.
The major contributors to the current Gunnison Deposit database include GCC and Cyprus-Superior, with smaller quantities of data from and Quintana and several other companies. Mr. Bickel experienced no limitations with respect to their activities related to the verification of the Project data related to these companies.
No significant issues have been identified with respect to the data provided by GCC’s quality assurance/quality control (“QA/QC”) programs. QA/QC data are not available for the historical drilling programs at the Gunnison Deposit, but GCC analyses dominate the assays used directly in the estimation of the mineral resources, most of the historical data were generated by well-known mining companies, and the GCC drill data are generally consistent with the results generated by the historical companies. Mr. Bickel believes the Gunnison Deposit data and Strong & Harris Deposit data are acceptable as used in the estimation of the mineral resources presented in this Technical Report.
| 12.1 | Introduction |
In order to place the following discussions of database auditing and QA/QC into context, it is helpful to understand the origin of the most relevant Project data. There are 122 holes in the Project database that were drilled in the Gunnison Deposit area; these holes have a total of 9,996 assayed sample intervals in the database. Of these sample intervals, 7,573 directly contribute data to the estimates of mineral resource grades discussed in Section 14.
Table 12-1 lists the drillholes by company, as well as the percentages of the 7,573 sample intervals that are attributable to each company. Note that the percentages shown for all companies have been adjusted to reflect GCC’s analyses of historical sample pulps and resampled historical core, as these GCC analyses replaced the historical assays in the Project database where available.
Table 12-1: Drillhole Data by Company
Company |
Hole Series |
Number of Holes |
Percent of Coded Assays | ||
| Total Copper | Acid-Soluble Copper | Cyanide-Soluble Copper | |||
| GCC | NSD, NSM | 44 | 69.0% | 70.7% | 100.0% |
| Cyprus - Superior | CS, CYS, J | 43 | 24.0% | 24.9% | 0.0% |
| Quintana | S, T, DC | 15 | 5.5% | 2.6% | 0.0% |
| Magma | MMC | 8 | 0.0% | 0.0% | 0.0% |
| Cyprus | K | 2 | 0.4% | 0.5% | 0.0% |
| Phelps Dodge | SullyI97 | 2 | 0.3% | 0.1% | 0.0% |
| Others | D, JS | 8 | 1.2% | 1.2% | 0.0% |
| Totals | 122 | 100.0% | 100.0% | 100.0% | |
| 12.2 | Database Auditing |
| 12.2.1 | Collar Table |
GCC provided RESPEC with two spreadsheets described as originating from Darling Environmental & Surveying, Ltd. of Tucson, Arizona – one spreadsheet with 2012 survey data and the other with 2015 surveys. RESPEC used this information to audit the locations of 71 GCC, 26 Cyprus-Superior, 13 Quintana, and 7 Magma drillholes. With the
| M3-PN210313.007 31 March 2026 Revision 0 | 109 |
GUNNISON PROJECT Form 43-101F1 Technical Report |
exception of one hole in which the survey location was based on an open hole in the ground, all of the locations of the historical holes were based on drill casing in the ground.
Out of the 117 holes audited, two discrepancies between the database and surveyed locations were identified, one of which was resolved by GCC. The other discrepancy involved a Cyprus-Superior hole, whereby the x, y, and z coordinates in the database differed from the survey coordinates provided to RESPEC by 0.2 to 1.5 feet. The database coordinates were accurately transcribed from a 2015 survey, while the audit records used by RESPEC have older coordinates.
In addition to RESPEC’s auditing of the database, M3 (2014) reported that several drillhole locations were checked during a 2007 site visit using handheld GPS and were found to reasonably match the recorded collar coordinates (M3, 2014).
| 12.2.2 | Survey Table |
RESPEC audited the down-hole deviation survey data for the GCC drillholes using both original digital files generated as part of the down-hole geophysical-survey data and scanned copies of original handwritten paper documentation of Reflex EZ-Shot measurements. The survey data for eight of the 45 GCC NSD-series core holes were audited, which includes 2,804 individual surveys out of the 10,233 surveys of the GCC holes. Six discrepancies between the database and the original records were identified, all in the azimuth readings. Two of the discrepancies exceed 0.1 degrees (0.4 and 0.6 degrees) and none are considered material.
RESPEC audited down-hole deviation data from three Magma holes and four Cyprus-Superior CS-series holes. No errors were found in the Magma deviations in the Project data, which were audited using scans of original paper records from Eastman Whipstock, Inc. The depths of two out of the four CS-holes audited have discrepancies in the depths of the down-hole readings, whereby the down-hole back-up data have readings at depths of 200, 300, and 400 feet, for example, while the database has these same readings at depths of 300, 400, and 500 feet. GCC examined all of the data for these two holes and found that the information used by RESPEC in the audit is actually derived from averaged values of multiple readings over 100-foot intervals. The data used by RESPEC in the audit represent the “from” depth of each averaged interval, while the database has the same data at the “to” depth. GCC is investigating the deviation data for all CS holes in detail and will make corrections if warranted. However, all of the CS-series holes are vertical, and the dip changes for each 100-foot data point are usually small (the average dip change for each 100-foot interval in the four holes audited is less than 0.4 degrees), so any inaccuracies are unlikely to materially affect the modeling of the Project mineral resources.
| 12.2.3 | Assay Table |
A total of 6,427 sample intervals were analyzed by Skyline for GCC, including intervals from GCC drillholes as well as intervals from historical (pre-GCC) core holes and re-analyses of historical sample pulps. RESPEC obtained and compiled GCC’s digital analytical data directly from Skyline and used a computer script to complete an automated audit of the database values. A total of 5,141 TCu values and 6,413 ASCu and CNCu (sequential leach) values were audited using the automated routine. A small number of discrepancies between the Skyline and database values were identified, all but one of which were found to be re-analyses in the database due to QA/QC issues. No errors were found in the ASCu and CNCu data.
RESPEC used historical paper records to audit the database values of five CS-series and two J-series holes drilled by the Cyprus-Superior joint venture. Out of the total of 1,858 CS-series sample intervals in the database that have historical analyses, 656 TCu and 650 ASCu values were audited using scanned copies of original American Analytical assay certificates. Five discrepancies were found in the TCu data (<1% of the audited data), only one of which was significant. Six discrepancies in the ASCu data were also identified (<1% of the audited data), with two of them being significant. One of the significant errors in the ASCu data is from the same sample interval as the single significant TCu error; these are the result of incorrect repeating of the analyses from the previous sample interval in the hole. GCC found that the other discrepancies are due to the derivation of the database values from handwritten geologic logs, as opposed to the copies of the original assay certificates used by RESPEC in the auditing; GCC corrected their database to match the values on the certificates.
| M3-PN210313.007 31 March 2026 Revision 0 | 110 |
GUNNISON PROJECT Form 43-101F1 Technical Report |
In the J-series holes, 173 TCu values and 103 ASCu values in the Project database were checked against typed Cyprus Mines assay sheets; there are 425 J-series sample intervals in the Project database. No discrepancies were identified.
| 12.2.4 | Resampling of Cyprus – Superior Drill Core |
Core Duplicates: GCC resampled selected intervals of Cyprus-Superior core from holes CS-02 and CS-06 and sent the 40 core-duplicates to Skyline for preparation and analysis. M3 (2014) stated that the mean of the Skyline TCu analyses is 12% lower than the mean of the original analyses (0.37 vs. 0.42%, respectively), and the mean of the Skyline ASCu analyses is 8% lower (0.21 versus 0.23%). M3 (2014) concluded that the comparison between the original analyses and the Skyline check assays suggests the original data may be biased high for TCu and ASCu; however, the limited number of sample pairs and large scatter of points prevent confirmation of any systematic bias (M3, 2014). RESPEC independently analyzed the data and agrees with this conclusion. While the potential bias is more evident in the TCu data than ASCu, the mean of the ASCu/TCu ratios of the original and core-duplicate datasets are very close, which suggests any bias in the Skyline TCu data is mirrored in their ASCu analyses. Approximately 25% of the data directly used in the estimation of resource grades are derived from the original Cyprus-Superior analyses.
| 12.2.5 | Pulp–Check Analyses and Resampling of Quintana Drill Core |
Core Duplicates: The core from 101 sample intervals in holes T-01 and T-05 was resampled by GCC and analyzed for TCu by Skyline. A systematic low bias in the Skyline analyses is evident at mean grades of the pairs greater than ~0.08% TCu, and the mean of the Skyline analyses is 10% lower than the mean of the original assays (Figure 12-1).
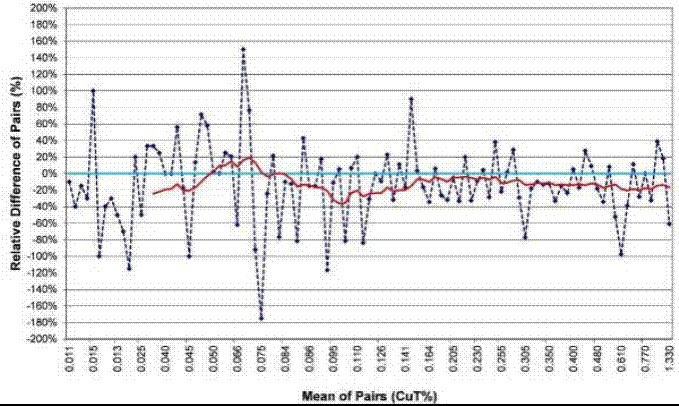
Figure 12-1: Skyline TCu Analyses of Core Duplicates Relative to Original Quintana Assays
| M3-PN210313.007 31 March 2026 Revision 0 | 111 |
GUNNISON PROJECT Form 43-101F1 Technical Report |
Skyline also completed ASCu analyses on 274 core duplicates from seven T-series holes and holes S-3 and DC-09 (Figure 12-2).
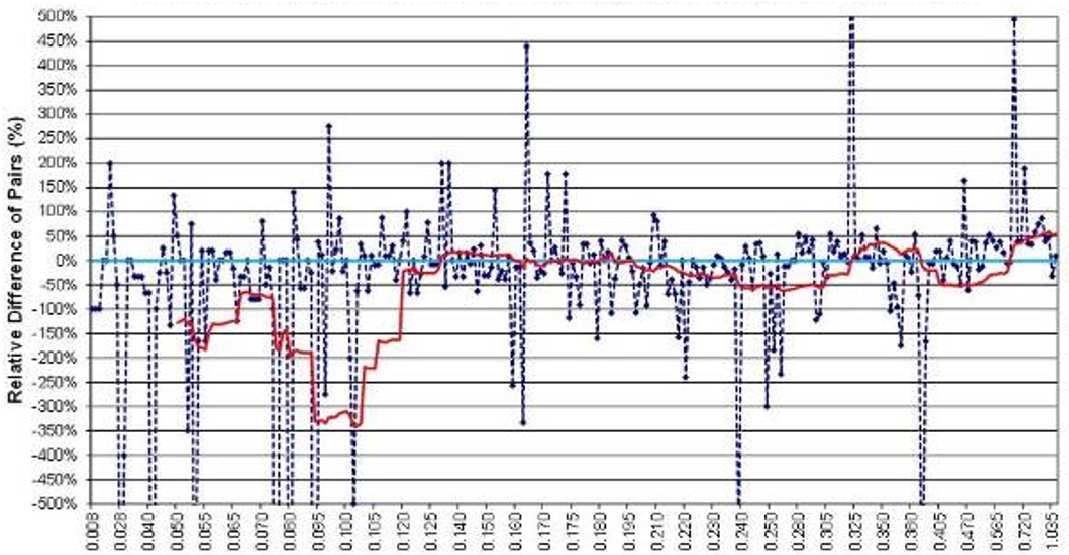
Figure 12-2: Skyline ASCu Analyses of Core Duplicates Relative to Original Quintana Assays
The mean of the Skyline data is close to the mean of the original analyses (1% higher). However, the Skyline mean includes an anomalous number of instances in which the Skyline analyses are significantly lower than the originals (as seen in pairs with relative differences >~-150 to -200%). These pairs, in part, lead to an apparent low bias in the Skyline analyses for pairs with means up to about 0.1% ASCu, as well as in the range of ~0.2 to 0.3% ASCu.
RESPEC also investigated the core-duplicate data for the 58 sample intervals within the dataset in Figure 12-2 for which paired ASCu analyses are available. These pairs also show a low bias in the Skyline analyses within a similar range of the MOP of ~0.15 to ~0.3% ASCu, although there are not enough data to make definitive conclusions. The mean of the Skyline ASCu/TCu ratios is identical to the mean of the ratios of the original analyses.
Re-Assays of Original Pulps: Skyline completed ASCu analyses on original Quintana sample pulps from seven T-series holes (S-01, S-04, and DC-09). A total of 331 of these pairs are compared in Figure 12-3.
| M3-PN210313.007 31 March 2026 Revision 0 | 112 |
GUNNISON PROJECT Form 43-101F1 Technical Report |
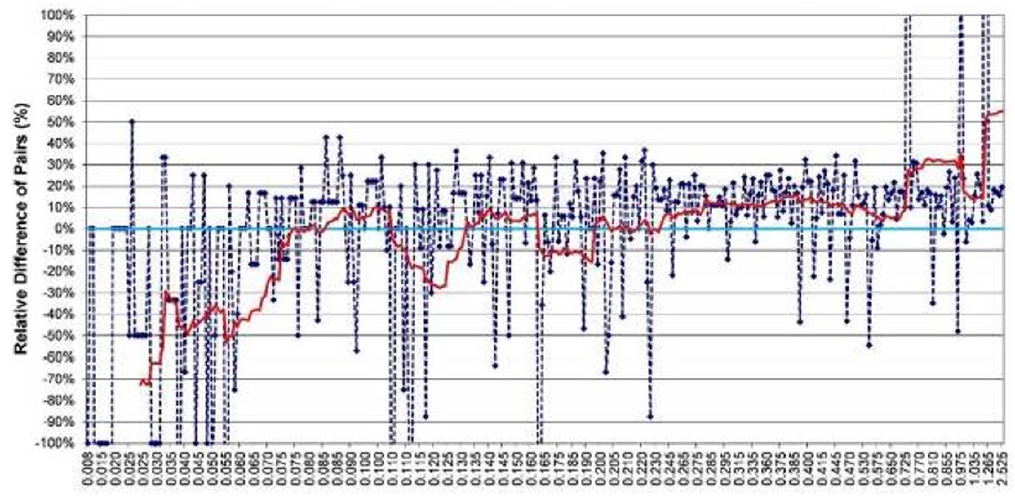
Figure 12-3: Skyline ASCu Analyses of Pulp Relative to Original Quintana Assays
The mean of the Skyline analyses of the original pulps is 12% higher than the original assays (0.30 vs. 0.27% ASCu, respectively); removal of all pairs with relative differences >100% decreases the difference to 9%. A strong and systematic high bias in the Skyline analyses is seen at MOP’s greater than about 0.25% ASCu.
There is a distinct bias in the pairs with relative differences in excess of about 40%, and relative differences of this magnitude are high for check analyses of pulps. Instances in which the Skyline analyses are significantly lower than the originals dominate these pairs. If not for these high relative-difference pairs, the high bias in the Skyline analyses would be exacerbated, and it would extend the bias to MOP’s greater than ~0.12% ASCu. There are no Skyline TCu analyses that accompany this ASCu dataset.
Quintana TCu and ASCu analyses in the Gunnison Deposit database represent 5.5% and 2.6%, respectively, of the data directly used in the estimation of the Gunnison Deposit mineral resources.
| 12.2.6 | Resampling of Magma Copper Drill Core |
Core Duplicates: GCC resampled historical Magma drill core and sent the 519 core-duplicate samples to Skyline for preparation and analysis of both TCu and ASCu. Skyline’s core-duplicate results differ significantly from the original Magma analyses, which led GCC to completely replace the Magma analytical data with analyses of resampled core. The Skyline TCu analyses of the core duplicates are compared to the original analyses in Figure 12-3. While the ASCu comparison is similar to that shown in Figure 12-4, the magnitude to the differences in the two datasets is less. This leads to the Skyline mean of the ASCu/TCu ratios (0.74) in the duplicate analyses being significantly higher than the mean of the ratios of the original analyses (0.62).
Note that the pairs with extreme relative differences are highly biased towards those in which the Skyline analyses are lower than the originals.
| M3-PN210313.007 31 March 2026 Revision 0 | 113 |
GUNNISON PROJECT Form 43-101F1 Technical Report |
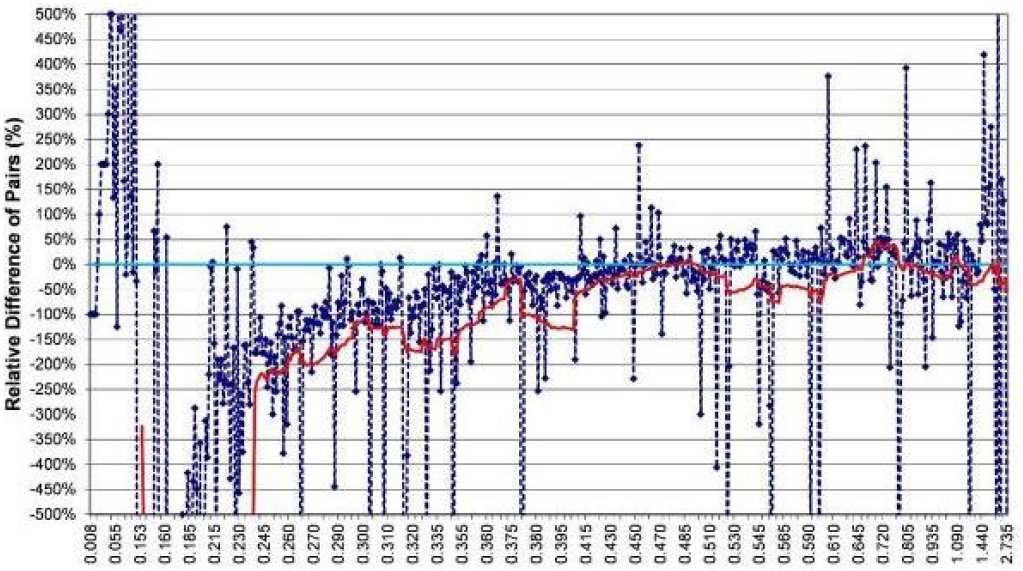
Figure 12-4: Skyline TCu Analyses of Core Duplicates Relative to Original Magma Assays
GCC completely replaced all original Magma assays in the Project database with Skyline’s duplicate-core analyses.
| 12.3 | Site Inspections |
Mr. Bickel visited the Gunnison Project site on February 26, 2026 and Casa Grande core shack most recently on September 22, 2025. Core from several holes drilled at the Gunnison Deposit was examined, and procedures for logging, sampling, sample handling, and SG determination were reviewed. Prior to this, Mr. Bickel has made numerous site visits to Gunnison dating back to 2021. During the visits, Mr. Bickel verified drillhole collar locations, inspected the Gunnison drill core, and reviewed GCC procedures for logging, sampling, sample handling, and SG determinations.
Mr. Bickel did not collect samples of core for the purposes of verifying the presence of copper mineralization at the Gunnison Deposit. Outcrops a short distance to the east of the deposit with visible copper-oxide mineralization were inspected and significant copper mineralization in long intervals of GCC drill core and cuttings were visually confirmed by Mr. Bickel during the site visit. The existence of the Gunnison Deposit has been known widely in the industry for many years prior to GCC’s involvement, based on the results of drilling programs conducted by major copper-mining and exploration companies (e.g., Magma, Cyprus, and Superior).
| 12.4 | Discussion of 2018-2019 Production Wellfield Drilling Data |
Mr. Bickel reviewed the data collected from the 2018-2019 production wellfield drilling, which was completed after the estimation of the Gunnison Deposit mineral resources. While the production wellfield data is immaterial to the mineral resources estimated herein, as the holes were drilled within an area that includes only about 3% of the total copper in the mineral resources, it provides data for a limited comparison with the estimated mineral resource grades.
Based on visual comparisons of the wellfield data and the block-model lithologic codes and estimated grades, the wellfield drill logging and total-copper and acid-soluble grades reasonably match the modeled geology and estimated grades of the resource block model. However, the mean of bench composites of the total-copper assays created from the production well data was found to be about 10% higher than the mean of the estimated grades of model blocks that encompass the wellfield bench composites. A relative-difference quantile plot that compares the wellfield total-copper data to the estimated grades of the blocks that encompass the drill data shows that this 10% difference is evident systematically at grades between about 0.4% to 1% TCu, with the wellfield data having lower grades than the estimated block grades below 0.3% TCu and significantly higher grades at grades above 1% TCu. Similar differences were also seen with the acid-soluble grades. The grade differentials at the low- and high-grade portions of the grade distributions are expected, due to the grade averaging of widely spaced drill data that occurs during estimation versus the very minor averaging that results from the compositing of the raw, closely spaced, wellfield assay data.
| M3-PN210313.007 31 March 2026 Revision 0 | 114 |
GUNNISON PROJECT Form 43-101F1 Technical Report |
Due to the very limited area of wellfield drilling as compared to that of the entire resource block model, the only conclusion that can be drawn is that the estimated total-copper block grades, as well as the associated acid-soluble grades, derived from the exploration core holes are biased low with respect to the closely spaced, reverse-circulation wellfield data within the small wellfield area. Significantly more post-model drilling would be needed prior to making global conclusions with respect to the entire area encompassed within the mineral resource estimation.
| 12.5 | Gunnison Deposit Summary Statement on Data Verification |
Extensive verification of the data pertinent to mineral resource estimation has been undertaken. In addition to the drill-data auditing and the compilation and evaluation of the QA/QC data described above, the explicit, ‘hands-on’ approach applied to the estimation of the Gunnison Deposit mineral resources, as described in Section 14, allowed RESPEC to verify GCC’s geological modeling and further verify the drill data. It is the combination of the GCC geologic model and the drill-hole copper analyses that formed the basis of the resource modeling.
In consideration of the information summarized in this and other sections of this Technical Report, RESPEC has verified that the Gunnison Deposit data are acceptable as used to support the estimation and classification of the Gunnison Deposit mineral resources reported herein.
| 12.6 | Strong & Harris Data Verification |
Mr. Bickel has verified the Strong & Harris database and compiled and analyzed available quality QA/QC data collected by GCC. Data verification, as defined in NI 43-101, is the process of confirming that data has been generated with proper procedures, has been accurately transcribed from the original source and is suitable to be used. There were no limitations on, or failure to conduct, the data verification for this report other than those discussed later in this section. Additional confirmation on the drill data’s suitability for use are the analyses of the Strong & Harris project QA/QC procedures and results as described in Section 11.4.
| 12.6.1 | Site Visit |
Mr. Bickel visited the Strong & Harris site most recently on February 26, 2026, though no material information has been collected since 2021. Initially, Mr. Bickel visited the project site on January 28-29, 2021, and then again on multiple occasions between February 12 and March 26, 2021. The latter dates coincided with RESPEC’s work to assist GCC in a re-sampling campaign. During the site visits Mr. Bickel inspected the surface geology of the Strong & Harris Deposit area; reviewed historical drill core and the methods and procedures used for GCC’s sampling process; and carried out discussions of the current geologic interpretations with GCC personnel. Mr. Bickel also independently verified drill hole collar locations by inspecting drill sites and obtaining collar coordinates with a hand-held GPS receiver (see below).
Drill site and mineralization verification procedures were conducted, and sampling procedures were appraised. Mr. Bickel has also maintained a relatively continual line of communication through telephone calls and emails with GCC personnel in which the project status, procedures, and geologic ideas and concepts have been discussed. The result of the site visits and communications is that the author has no significant concerns with the project procedures.
| M3-PN210313.007 31 March 2026 Revision 0 | 115 |
GUNNISON PROJECT Form 43-101F1 Technical Report |
| 12.6.2 | Database Verification |
The current drill-hole database, which supports the resource estimation of the Strong & Harris area, was created by RESPEC using the drill-hole collar coordinates, hole orientations, and analytical information, including laboratory reports of analyses, in the original historical paper records in the possession of GCC. This drill-hole information was then supplemented with GCC’s surveying and sampling data, and results through July 1, 2021. The historical information was subjected to various verification measures, the primary one consisting of the core re-sampling campaign conducted by GCC and RESPEC personnel under Mr. Bickel’s supervision in 2021.
| 12.6.2.1 | Drill-Collar Verification |
In February of 2021, RESPEC directly received drill-hole collar location data from Darling Environmental & Surveying, Ltd. (“Darling”) of Tucson, Arizona. These data were collected for GCC during a survey of the property using digital GPS equipment. Locations of 97 drill-hole collars were provided and RESPEC added them to the GCC database. During his site visits, Mr. Bickel independently checked a number of these locations with a hand held GPS and found them to reasonably match the collar coordinates received from Darling.
Prior to 2021, collar information was found in the historical documentation for 127 of the Strong & Harris drill holes. Collar coordinates were given in a local grid system, which were then converted to a UTM projection with NAD27 datum using a two-point transformation derived from handheld GPS measurements of the existing collars. The remaining 25 holes without historical coordinates, and which were otherwise not located in the field, were assigned coordinates from historical maps of the collars.
GCC updated the collar coordinates of these holes directly in the database to reflect the new survey data. Additionally, a new two-point transformation was created based on the data from the Darling survey and used to update collar locations which could not be located in the field.
| 12.6.2.2 | Down-Hole Survey Verification |
Down-hole deviation data exists for only two drill holes in the historical records (SH-109 and SH-118). These data were verified to match the original paper records to the drill hole database by Mr. Bickel. Historical logs also indicated the planned deviation of the Strong & Harris drill holes, all of which were planned vertically. Based on the data from SH-109 and SH-118, which indicated that both had minimal deviation from their planned vertical orientation, it is reasonable to assume that most of the drill holes are generally vertical. However, the database lacks the spatial precision associated with a more complete set of deviation data.
| 12.6.2.3 | Assay Database Verification |
Historical Assays: Historical paper records, including copies of original assay certificates, and to a lesser extent, handwritten assay values included on geologic logs, were reviewed, transcribed into the digital database and audited under the supervision of Mr. Bickel. Assay data from the original lab certificates represents 92% of the historical assay information in the Strong & Harris database. The remaining 8% of historical assays were transcribed from geologic logs where no data from the original assay certificates existed. During the audit, Mr. Bickel compared the transcribed assays in the database to the certificate and log copies. Some discrepancies were found between the original assay certificates and the hand-written values in the logs, where both existed. These discrepancies were determined to be either transcription errors or, in some cases, the values on the logs appeared to be from re-assay values but the matching re-assay certificates were not found. It is possible that historical assays in the Strong & Harris database taken from hand-written values in the geologic logs are subject to the same transcription errors noted in audit. However, Mr. Bickel does not consider this risk to be material.
| M3-PN210313.007 31 March 2026 Revision 0 | 116 |
GUNNISON PROJECT Form 43-101F1 Technical Report |
GCC Assays: RESPEC received electronic records from the assay lab with the results from GCC’s 2021 re-sampling program. These data were added to the database by RESPEC for any drill hole intersection that did not already have a historical assay value. The remainder, which were duplicate assays of historical intervals, were compared to the historical analyses for verification, but did not otherwise replace the historical values in the database. The results of this comparison are summarized below.
| 12.6.2.4 | GCC 2021 Re-Samples |
GCC re-sampled selected intervals of historical drill core based on RESPEC’s recommendations and submitted them to Skyline for analysis. The samples were selected from a spatial distribution of drill holes throughout the deposit, as well as a distribution of drill holes from the various historical operators who originally drilled and explored the property.
Results from the re-sampled intervals of ¼ core represent core-duplicate analyses. Mr. Bickel compared the 2021 core-duplicate analyses with the historical analyses in the RESPEC database and conducted a MOP analysis.
The MOP analysis for total Cu samples is provided in Figure 12-5. A total of 185 samples were submitted to Skyline for analysis. Ten of these samples (5%), were considered outliers and have been excluded from the results. The average relative difference between the new data and historical data is 9%.
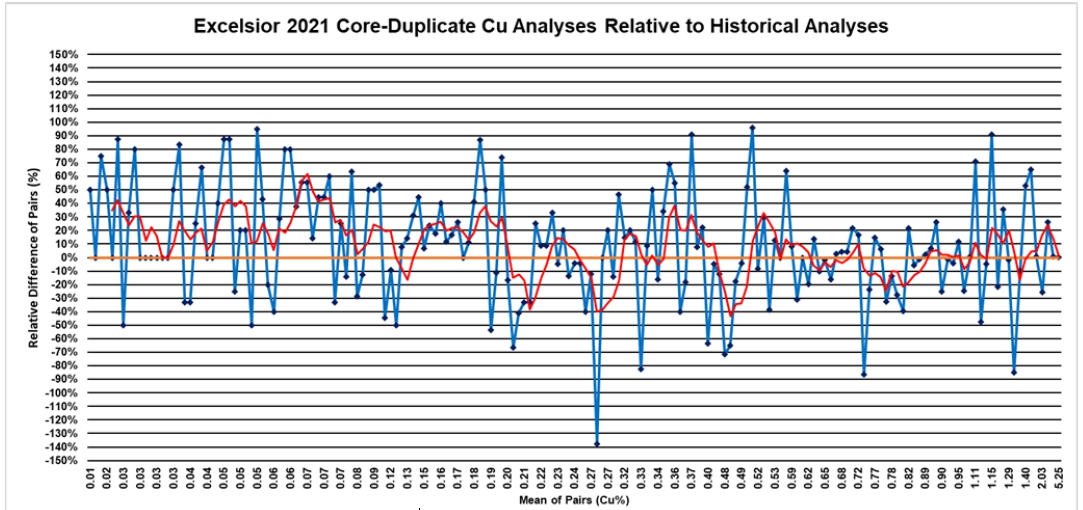
Figure 12-5: Total Copper (“Cu”) Core-Duplicate Analyses Relative to Historical Analyses
The MOP analysis for soluble copper (“CuOx”) samples is provided in Figure 12-6. A total of 211 samples were submitted to Skyline for analysis. Twenty of these samples (9%), were considered outliers and have been excluded from the results. Increased outlier results from the soluble copper assays is expected relative to total copper due to the tendency of soluble copper minerals to be hosted in fine material which is easily shaken, mobilized, or otherwise lost from the core boxes in the historical handling and sampling of core. The average relative difference between the new data and historical data is 8%.
| M3-PN210313.007 31 March 2026 Revision 0 | 117 |
GUNNISON PROJECT Form 43-101F1 Technical Report |
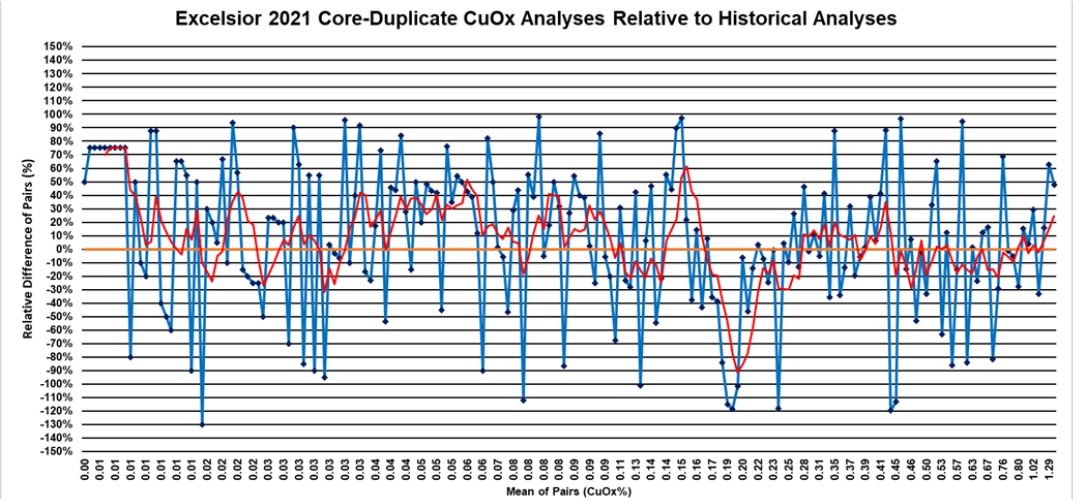
Figure 12-6: Soluble Copper (“CuOx”) Core-Duplicate Analyses Relative to Historical Analyses
The MOP analysis for zinc (“Zn”) samples is provided in Figure 12-7. A total of 207 samples were submitted to Skyline for analysis. Eleven of these samples (5%), were considered outliers and have been excluded from the results. The average relative difference between the new data and historical data is 10%.
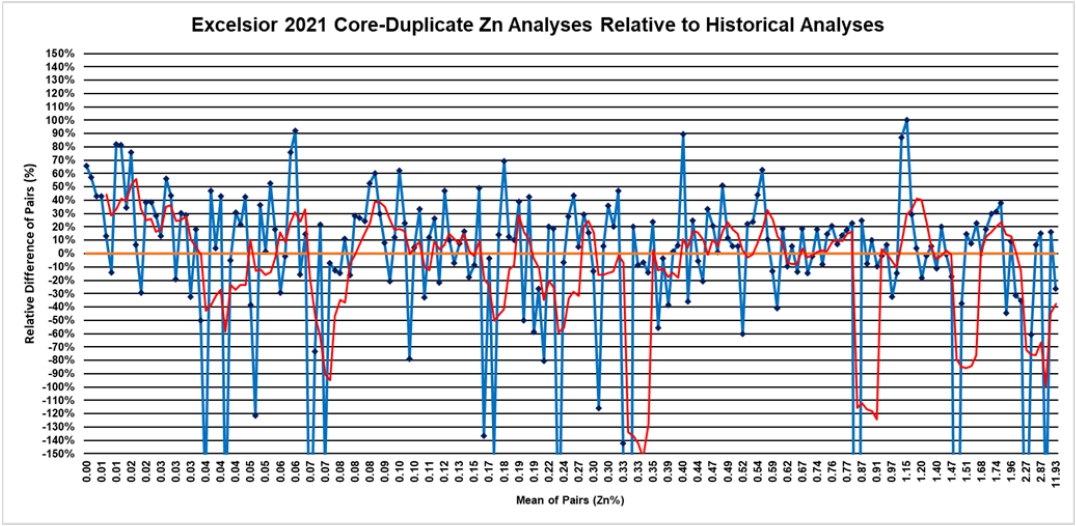
Figure 12-7: Zinc (“Zn”) Core-Duplicate Analyses Relative to Historical Analyses
| M3-PN210313.007 31 March 2026 Revision 0 | 118 |
GUNNISON PROJECT Form 43-101F1 Technical Report |
| 12.6.3 | Independent Verification of Mineralization |
Verification of mineralization was conducted during Mr. Bickel’s participation in GCC’s 2021 sampling campaign. In this period, Mr. Bickel was able to extensively investigate and verify the mineralization in the deposit and its relationship to relevant geology by comparing the 2021 analytical results to notes directly to the mineralized drill core. During several site visits in 2021, outcrops with visible copper and zinc mineralization were observed a short distance west from the
Strong & Harris Deposit. The existence of the Strong & Harris Deposit has been widely known in the industry for many years prior to GCC’s involvement, based on the results of drilling programs conducted by major exploration companies (Cyprus, Superior, and Continental) that were well-known and reputable operators.
| 12.6.4 | Strong & Harris Summary Statement on Data Verification |
Mr. Bickel has undertaken extensive verification of the historical data. This work has identified very few errors in the transcription of assay data into the mine-site drill-hole databases. In addition, the core-duplicate analyses performed in 2021 allowed Mr. Bickel to verify that the historical assay data in the Strong & Harris database is of sufficient quality for use in the estimations of the current resources.
Explicit modeling of the copper, zinc, and silver mineralization was the most critical component to the estimation of the project mineral resources. This ‘hands-on’ approach provided meaningful verification of the historical data, whereby continuity and sensibility of meaningful geological variables, and the assays in the context of those variables, were carefully evaluated and considered.
Mr. Bickel experienced no limitations with respect to data verification activities related to Strong & Harris other than the limited availability of original-source assays discussed previously. In consideration of the information summarized in this and other sections of this report, Mr. Bickel has verified that the project data are adequate as used in this report, most significantly to support the estimation and classification of the mineral resources reported herein.
| 13 | MINERAL PROCESSING AND METALLURGICAL TESTING |
This section discusses historical and recent metallurgical test work and the conclusions that can be drawn from that work for an open pit heap leach mining operation. This PEA differs significantly from previous studies by proposing the use of sorting technology applied to certain rock types to reduce acid consumption while simultaneously increasing the grade of copper mineralization delivered to the heap leaching operation. Substantial new information has been developed with the aid of separation tests on whole core intervals by Steinert, a leading manufacturer of industrial sorting machines.
| M3-PN210313.007 31 March 2026 Revision 0 | 119 |
GUNNISON PROJECT Form 43-101F1 Technical Report |
| 13.1 | Early Laboratory Test Programs Pre-2006 |
Since 1972 and through 2012, samples from the Gunnison Project and neighboring Johnson Camp Mine (of similar mineralogy and geology), have been tested and evaluated by Superior Oil, Quintana Minerals, Phelps Dodge, Magma Copper, and Nord Resources. Unfortunately, the usefulness of those tests has sometimes been impaired by the absence of sample locations, descriptions, and/or mineralogical characterization, or by unrealistic or inappropriate test conditions and parameters. Salient features of the metallurgical reports are summarized below in chronological order with titles and names of firms.
Metcon conducted some agitated sulfuric acid leaching tests on crushed samples of mined Martin and Upper Abrigo formations with heads of 0.61% TCu and 0.57% ASCu, yielding PLS grades of 1.3-1.7 gpl Cu (Metcon, 1972). MSRDI performed a variety of tests on coarse core rejects from drill hole T-2 at different depth intervals (MSRDI, 1973a). Mineralogist Laszlo Dudas observed that 60% of the copper was present as true chrysocolla, but that the remainder was a semi-refractory form of dilute copper silicate impregnating a layer-silicate lattice. Both sulfuric acid and aqueous ammonium carbonate were used in agitated leaches, but acid was more effective. The deepest core interval consumed 9-14 pounds of acid per pound of copper leached (lb/lb), and MSRDI concluded that a sufficiently high acid dosage should readily dissolve 70-80% of the total copper. Actual extractions by MSRDI were in the range of 72.3-81.1%.
MSRDI also conducted tests that included heat treating followed by ammonium carbonate leaching, calcite flotation prior to leaching with sulfuric acid, and simulated vat leaching with sulfuric acid (MSRDI, 1973b). None of these methods produced results that were sufficiently encouraging to justify further evaluation.
Magma carried out a series of bottle roll tests on minus 10-mesh samples of unspecified origin (Magma, 1992). An average of 62.8% of the total copper dissolved at pH 1.5, producing pregnant leach solution (PLS) grades of 0.46-1.2 gpl Cu, essentially proportional to the ASCu assay of the samples. Magma then published an addendum presenting head and “tailing” (leach residue) assays that revealed leaching of calcium and magnesium minerals and precipitation of gypsum (Magma, 1993). Because of gypsum precipitation, residue assays as high as 12% S were produced from samples containing <0.1% S.
Magma conducted subsequent bottle roll tests with sulfuric acid on two minus 10-mesh composites and obtained 50.7 and 84.9% ASCu extractions, but the residue from the former test still contained 0.28% ASCu, casting doubt on the validity of the test (Magma, 1995). The residue from the latter test assayed only 0.05% ASCu, as one would expect from the higher ASCu extraction.
Magma ran “mini-column” acid leaches with epoxy-coated core fragments (to seal fractures created by drilling and core splitting) (Magma, 1996). Total copper extraction was very poor at only 16.9%, but it is worth noting that recirculation (“stacking”) of the leaching solution produced a PLS grade of 0.72 gpl Cu. The tests were run at only 1 gpl free acid, which likely limited copper extraction.
Hazen Research, Inc. (HRI) loaded clear PVC columns 6 inches in diameter by 10 feet high with fragments of 6-inch core and smaller pieces and leached the columns with sulfurous acid (H2SO3) at concentrations of 20 grams per liter (“gpl”) and 40 gpl aqueous SO2 (HRI, 1996). After 5 months of operation, 70% of the copper had dissolved from the column with the stronger lixiviant and 48% had dissolved from the other. Equivalent sulfuric acid consumptions were 9 lb/lb from the more acidic column and 8 lb/lb from the other.
| M3-PN210313.007 31 March 2026 Revision 0 | 120 |
GUNNISON PROJECT Form 43-101F1 Technical Report |
These results were very encouraging, and the use of sulfurous acid may at some point deserve further consideration, as digestion with sulfurous acid is sometimes the preferred analytical procedure for assaying ASCu. Although sulfurous acid will attack calcium carbonate, it probably forms calcium sulfite, not gypsum, and calcium sulfite may be more soluble than gypsum in dilute sulfuric acid. The stronger lixiviant produced an initial PLS grade of 2.88 gpl Cu that eventually equilibrated at about 0.3 gpl Cu.
Phelps Dodge subjected six samples to ammonia leaching, sulfidization and flotation, and dilute sulfuric acid leaching in bottle rolls (Phelps Dodge, 1996). The first two techniques did not yield promising results, but bottle roll copper extractions with dilute sulfuric acid were in the range 74-98% with five of the six above 92%. Heads of 0.43 to 0.88% TCu produced residues that generally contained 0.01-0.06% TCu, with one at 0.14% TCu.
Although a significant number of metallurgical tests were conducted by five laboratories for four property owners between 1972 and 1996, the results were variable and do not allow reliable interpretations or projections of copper extraction.
| 13.2 | Recent Laboratory Metallurgical Testing |
Gunnison completed numerous in-situ related metallurgical testing from 2011 to 2015. This test work included modified saturated column tests and various innovative horizontal box tests. As these tests were specifically designed for in-situ mining recovery techniques, they are not considered directly applicable to open pit heap leaching techniques. Nevertheless, ASCu extractions typically ranged from 60 to over 100% and acid consumptions for the saturated column tests were high, while acid consumptions for the horizontal box tests were low.
Column leaching tests were conducted on similar rocks and mineralization at the adjacent Johnson Camp Mine (“JCM”) in early 2011 at Mountain States R&D and were reported by Dr. Ronald J. Roman (Roman, 2011). The tests were conducted in 8-inch diameter columns 20 feet high on samples from the JCM active mining operation in pits named Copper Chief (CC) and Burro (BP). The samples were crushed and screened to minus 1-inch fragment size, blended, agglomerated and cured with dilute sulfuric acid, and loaded into columns which were all leached concurrently.
The samples varied significantly in breakage characteristics with the minus 6-mesh fraction ranging from 20 to 47% of the total sample weight. Agglomeration of fines and curing of the samples with dilute aqueous sulfuric acid was done by mixing the samples and solution in a portable cement mixer to a target of 8% moisture. The amount of 100% sulfuric acid in the curing solution that was added to the samples varied from 9.8 to 14.3 lb/ton of sample and averaged 12.2 lb/ton. This quantity was added to the eventual net acid consumption estimate.
The columns were then charged with agglomerated and cured samples and irrigated with a lixiviant consisting of mature, acidified JCM SX raffinate. The reported application rate and the flowrate entered on the laboratory worksheets, were incorrectly stated as 0.0024 gallons per minute per square foot of charge surface (gpm/ft2). The recorded flowrate of 13.25 liters per day equated to 0.0024 gallons per minute, but the charge surface area was only 0.394 square feet, resulting in a solution application rate of 0.00609 gpm/ft2. This may not be significant, but it calls into question the correspondence between the column data and the standard heap application rate of 0.005 gpm/ft2. It could also account for flooding of the seventh column and rejection of that column containing Lower Abrigo mineralized material from the Burro Pit from the test series. The influence of an excessive irrigation rate on acid consumption will be discussed in a later section. Head assays were calculated from residue and solution weights or volumes and assays. Acid consumptions were average values at the copper extraction shown in Table 13-1. The assays shown were conducted after hot acid digestion because that procedure gave results that correlated most closely to column copper extractions. However, they overstate the ASCu assay, thereby understating ASCu extractions. Note that the stated ASCu extractions are using the Hot acid digestion technique. This technique involved boiling the sample in a strong acid solution as opposed to the Cold acid digestion technique which uses an acid solution at room temperature. The Hot acid technique is aggressive and dissolves transitional minerals and, possibly, some sulfide copper minerals. As a result, the Hot ASCu copper extractions are close to the total copper (TCu) extractions. Comparing the Hot assayed ASCu extractions in Table 13-1 to the Cold assay ASCu extractions for the same columns in Table 13-3 shows the significant difference in results using the different techniques.
| M3-PN210313.007 31 March 2026 Revision 0 | 121 |
GUNNISON PROJECT Form 43-101F1 Technical Report |
Table 13-1: 2011 Column Leaching Tests
|
Column # |
Formation Name |
Calculated Head Assays |
Leach Days |
Acid
Consumption |
Copper Extraction | |||
| %TCu | %ASCu | lb/ton | lb/lb | %TCu | %ASCu | |||
| 1 | CC Bolsa Quartzite | 0.57 | 0.54 | 79 | 18 | 3.9 | 67 | 70 |
| 2 | CC Pioneer Shale | 1.25 | 1.23 | 111 | 12 | 2.1 | 82 | 84 |
| 3 | CC Lower Abrigo | 0.19 | 0.15 | 70 | 50 | 29.6 | 48 | 58 |
| 4 | CC Diabase | 0.51 | 0.47 | 102 | 33 | 5.9 | 73 | 79 |
| 5 | BP Pioneer Shale | 0.29 | 0.26 | 102 | 23 | 7.0 | 74 | 81 |
| 6 | BP Bolsa Quartzite | 0.31 | 0.29 | 62 | 13 | 4.2 | 76 | 83 |
| 8 | BP Diabase | 0.47 | 0.43 | 95 | 35 | 6.4 | 76 | 82 |
During 2012, further column testing for Nord was done under Dr. Roman’s supervision. There were 35 tests, but some were inconclusive, and the laboratory’s daily reporting sheets are missing for some. Results from the 23 reliable and well-documented tests are summarized in Table 13-2. Once again, the hot acid digestion technique was used which underestimates ASCu extraction compared to a more industry standard ambient acid digestion technique and makes the stated ASCu extraction more equivalent to TCu extraction. Note that many of the samples likely contained significant sulfide mineralization or were mostly sulfide mineralization as Nord at the time was mining below the oxide zone.
Table 13-2: 2012 Johnson Camp Column Leaching Tests using the Hot Acid Digest Assay Technique
|
Column # |
Size |
Formation Name |
Head Assays |
Leach Days |
Acid Consumption | Copper Extraction | |||
|
%TCu |
% ASCu* |
lb/ton |
lb/lb |
%TCu |
%ASCu* | ||||
| 1 | -1” | Bolsa Quartzite | 0.40 | 0.47 | 79 | 19 | 3.9 | 67 | 70 |
| 2 | -1” | Pioneer Shale | 1.23 | 1.21 | 111 | 11 | 2.1 | 82 | 84 |
| 3 | -1” | Lower Abrigo | 0.24 | 0.20 | 70 | 45 | 29.6 | 48 | 58 |
| 4 | -1” | Diabase | 0.47 | 0.44 | 102 | 33 | 5.9 | 73 | 79 |
| 5 | -1” | Pioneer Shale | 0.26 | 0.24 | 102 | 24 | 7.0 | 74 | 81 |
| 6 | -1” | Bolsa Quartzite | 0.22 | 0.20 | 62 | 15 | 4.2 | 76 | 83 |
| 8* | -1” | Diabase | 0.36 | 0.33 | 95 | 37 | 6.4 | 76 | 82 |
| 9 | -6” | Bolsa Quartzite | 0.25 | 0.16 | 111 | 29 | 18.9 | 33 | 52 |
| 10 | -6” | Lower Abrigo | 0.26 | 0.24 | 137 | 9 | 8.9 | 49 | 53 |
| 11 | -6” | Bolsa Quartzite | 0.67 | 0.48 | 155 | 29 | 4.6 | 71 | 98 |
| 12 | -6” | Diabase | 0.51 | 0.17 | 155 | 66 | 15.9 | 45 | 133 |
| 13 | -6” | Mid/Up. Abrigo 1 | 0.34 | 0.32 | 165 | 56 | 18.3 | 49 | 51 |
| M3-PN210313.007 31 March 2026 Revision 0 | 122 |
GUNNISON PROJECT Form 43-101F1 Technical Report |
|
Column # |
Size |
Formation Name |
Head Assays |
Leach Days |
Acid Consumption | Copper Extraction | |||
|
%TCu |
% ASCu* |
lb/ton |
lb/lb |
%TCu |
%ASCu* | ||||
| 14 | -6” | Lower Abrigo | 0.63 | 0.55 | 162 | 44 | 9.6 | 43 | 49 |
| 15 | -6” | Mid/Up Abrigo 3 | 0.31 | 0.27 | 74 | 40 | 28.0 | 24 | 28 |
| 16 | -6” | Mid/Up Abrigo 2 | 0.40 | 0.37 | 126 | 36 | 13.8 | 37 | 40 |
| 17 | -1” | Mid/Up Abrigo 1 | 0.29 | 0.28 | 87 | 43 | 9.9 | 48 | 50 |
| 18 | -1” | Lower Abrigo | 0.91 | 0.85 | 164 | 77 | 6.5 | 58 | 63 |
| 19 | -1” | Mid/Up Abrigo 3 | 0.24 | 0.22 | 87 | 39 | 52.1 | 16 | 17 |
| 20 | -1” | Mid/Up Abrigo 2 | 0.38 | 0.37 | 87 | 39 | 9.9 | 43 | 44 |
| 21 | -1” | Lower Abrigo | 0.24 | 0.20 | 93 | 39 | 30.1 | 26 | 34 |
| 22 | -1” | Lower Abrigo | 0.24 | 0.20 | 93 | 41 | 25.6 | 30 | 37 |
| 23 | -1” | Lower Abrigo | 0.24 | 0.20 | 91 | 43 | 36.8 | 24 | 29 |
| 24 | -1” | Lower Abrigo | 0.24 | 0.20 | 91 | 57 | 47.9 | 24 | 30 |
* Hot acid soluble digestion assay technique. Note: Column 7 was discontinued due to plugging
The data presented in Table 13-1 and Table 13-2 require comments and tentative conclusions. Questionable values are highlighted in red. The % ASCu extraction for Column 12 appears suspicious and a likely error was the low ASCu head assay. Also, the acid consumption appears high for diabase and the minus 6-inch fragments surely would not consume more acid than the fine minus 1-inch crushed product, especially with a shorter leach retention time. Samples of the Abrigo formation show some variability in acid consumption, but the lb acid/ton and lb acid/lb figures reported for Column 24 appear too high and may have been incorrect calculations.
Some column tests, notably Column #s 1, 3, 6, 8*, 15, 17, and 19 through 24, fell short of achieving 90 percent Hot acid digestion ASCu extraction, but the numbers of leach days were less than 100 and some were on large (-6”) fragments. Extraction curves for these mineralized formations typically do not begin leveling off until leaching has progressed for at least 150 days. Furthermore, when diffusion control of kinetics applies, coarser fragments can be expected to leach more slowly than rock that has been crushed to a finer top-size.
As a test to compare the different copper assay techniques, Columns 1 through 8 had a duplicate set of Cold acid digestion assays for the head and tail samples. The ASCu extraction using the Cold acid digestion technique is shown in Table 13-3. In all cases the ASCu extraction is higher compared to the Hot assay technique. Several columns reported ASCu extractions above 100%. These samples probably were transition mineralization, with considerable copper being dissolved in the columns from transitional mineralization like chalcocite that is not accounted for by the ambient assay technique.
| M3-PN210313.007 31 March 2026 Revision 0 | 123 |
GUNNISON PROJECT Form 43-101F1 Technical Report |
Table 13-3: 2012 Johnson Camp Column Leaching Tests using the Cold Acid Digest Assay Technique
|
Column # |
Formation Name |
Calculated Head Assays |
Leach Days |
Acid Consumption |
Copper Extraction | |||
| %TCu | %ASCu* | lb/ton | lb/lb | %TCu | %ASCu* | |||
| 1 | CC Bolsa Quartzite | 0.55 | 0.44 | 79 | 18 | 3.9 | 68 | 87 |
| 2 | CC Pioneer Shale | 1.26 | 1.10 | 111 | 12 | 2.1 | 82 | 93 |
| 3 | CC Lower Abrigo | 0.19 | 0.03 | 70 | 50 | 29.6 | 48 | 267 |
| 4 | CC Diabase | 0.52 | 0.17 | 102 | 33 | 5.9 | 72 | 220 |
| 5 | BP Pioneer Shale | 0.30 | 0.20 | 102 | 23 | 7.0 | 71 | 106 |
| 6 | BP Bolsa Quartzite | 0.32 | 0.23 | 62 | 13 | 4.2 | 75 | 103 |
| 8 | Diabase | 0.48 | 0.30 | 95 | 35 | 6.4 | 74 | 119 |
*Ambient (cold) acid soluble digestion assay technique. Note: Column 7 was discontinued due to plugging
It is important to note that acid consumptions and copper extractions obtained from column tests do not faithfully predict acid consumptions or copper extractions that will be obtained in commercial heaps, as both will depend on leach cycle time, as well as various factors including care taken during heap construction. Also, the original reports expressed copper recovery, which is misleading. It is more correct to use copper extraction. Copper recovery should apply to commercial cathode production and is always somewhat lower than the leaching extraction during column or heap leaching. This is mainly due to copper contained in SX raffinate and recycled to the heap. Neglecting losses such as reprecipitation on the heap, some of this soluble copper will eventually be recovered during rinsing and decommissioning.
The Johnson Camp metallurgical testing was done on similar formations as the Gunnison deposit, namely the Abrigo formations and the Bolsa Quartzite. They are considered relevant to Gunnison metallurgy given the small distance between the 2 deposits (1.7 miles). Extensive testing of the Gunnison formations will occur during the proposed PFS study.
| 13.3 | Gunnison Column Tests 2013 - 2015 |
Column tests on core samples from the Gunnison Deposit were supervised by Dr. Roman during 2013 and 2015. The 2013 column test were conducted by taking one bulk sample for each formation, crushing to -1” and splitting between several columns to test how the samples performed at different irrigation flowrates and free acid concentrations. A review of those results was undertaken to gain a better understanding of the influence of those variables on acid consumption and rate of copper extraction.
Figure 13-1 through Figure 13-2 depict copper recovery (extraction) and acid consumption behavior obtained with different irrigation rates and free acid concentrations for the 2013 columns. Examination of the curves in these figures confirms general conclusions formed by many geochemists and metallurgists since acid leaching of constructed heaps began to achieve widespread adoption in the 1980s. Specifically, the following general rules apply:
| ● | Free acid concentrations greater than about 5 gpl aggressively attack some gangue minerals, exaggerating the acid consumption that will be obtained in a carefully operated heap. | |
| ● | Irrigation rates above about 0.005 gpm/ft2 (12.2 lph/m2) accelerate acid attack, possibly by stripping away surface precipitates that protect the underlying gangue if they are left intact. | |
| ● | In alkaline heap leaching of oxidized gold mineralized material, where there are few solid reaction products that can impair permeability, an irrigation flowrate of 0.005 gpm/ft2 is commonly applied. However, heap leaching of low-grade copper mineralization, where acid attack and oxidation may cause permeability to deteriorate over time, is often done at lower irrigation rates on the order of about 0.002 gpm/ft2 (4.9 lph/m2). |
| M3-PN210313.007 31 March 2026 Revision 0 | 124 |
GUNNISON PROJECT Form 43-101F1 Technical Report |
Figure 13-1 and Figure 13-2 are plots of ASCu recoveries (extractions) and acid consumptions for 2013 column tests on Martin samples at different lixiviant irrigation rates and free acid concentrations. They show that extractions are slower, but acid consumptions are lower at both lower irrigation rates and lower free acid concentrations. This is common behavior with southern Arizona’s oxide copper mineralization and argues in favor of operating heaps at low irrigation rates with weakly acidic solutions. Industry experience supports operation at around 0.002 gallons per minute per square foot (gpm/ft2 and no more than 5 grams of free acid per liter. There are reasons for this:
Calcium and magnesium carbonates (calcite and dolomite) in the mineralized resource consume acid much faster than the copper silicate mineral, However, the rate of gangue acid consumption is approximately proportional to free acid concentration and irrigation rate. Less aggressive leaching conditions will either reduce or delay the attack of acid on the gangue minerals.
Heap leaching under milder conditions probably has several positive consequences:
| 1. | If both free acid and irrigation rates are reduced, competition for acid by the gangue will be reduced, allowing more copper to be dissolved by available acid. |
| 2. | If gypsum (calcium sulfate) is formed at a reduced rate, the morphology of the gypsum may change, probably, leading to formation of coarse-grained and more crystalline gypsum precipitates and less coating of copper minerals by fine particulate or gelatinous coatings that can prevent copper from dissolving. |
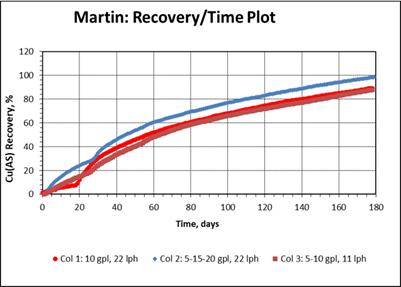
Figure 13-1: Martin ASCu Extraction Versus Free Acid and Irrigation Rate
Note the column leaching parameters at the bottom of Figure 13-1, where the highest free acid concentration and highest irrigation rate (blue curve) gave the fastest initial ASCu extraction and about 10 percent higher extraction at 180 days. However, compare these results with Figure 13-2, showing the effect of these conditions on elevation of gangue acid consumption. As noted in the previous second bullet, free acid concentrations above about 5 gpl and irrigation rates in excess of approximately 5 lph/m2 are especially aggressive toward some gangue minerals, increasing gangue acid consumption.
| M3-PN210313.007 31 March 2026 Revision 0 | 125 |
GUNNISON PROJECT Form 43-101F1 Technical Report |
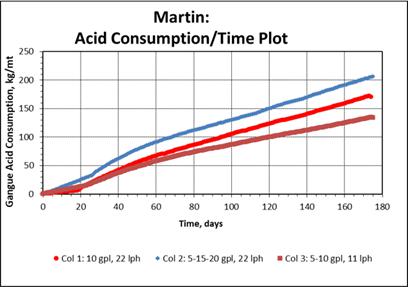
Figure 13-2: 2013 Martin Acid Consumption at Variable Free Acid and Irrigation Rate
The main lesson to be learned from Figure 13-1 through Figure 13-2 is the critical need for careful management of heap leaching parameters to maximize net revenues.
The full 2013 column tests results from Gunnison are presented in Table 13-4. Note that ASCu recoveries greater than 100% are from samples that likely contained transitional copper minerals that leach in the column tests but do not report to the cold ASCu assay technique. This is like what is seen at the Johnson Camp Mine in the transition zone. The acid consumption for the columns depended heavily on the conditions the columns were run at and as noted above the acid consumption was usually lowest for the columns that were run using a low acid concentration and low irrigation rate. Note that the Martin samples contained about 50% un-mineralized carbonate waste, contributing to high acid consumption. Material sorting, discussed in Section 13.5, has been shown to successfully remove most of this carbonate waste from the process stream. The Upper and Middle Abrigo samples also contained some carbonate waste.
| M3-PN210313.007 31 March 2026 Revision 0 | 126 |
GUNNISON PROJECT Form 43-101F1 Technical Report |
Table 13-4: 2013 Gunnison Column Leaching Tests
| Sample Description | Colum # |
Irrigation rate, lph/m2 |
Leach Solution, gpl acid | Acid, gm/hr/m2 |
Days Leached |
Acid Cons’ lbs/ton | Estimated Recovery, % | |
| Cu(total) | ASCu | |||||||
Martin |
1 | 22 | 10 | 220 | 179 | 341 | 60.8 | 89.2 |
2 |
22 |
5 then 15 then to 20 |
110 then 330 then 440 |
179 |
404 |
70.0 |
98.5 | |
| 3 | 11 | 5 then 10 | 55 then 110 |
179 | 267 | 59.9 | 87.8 | |
Upper/Middle Abrigo |
4 | 22 | 15 | 330 | 119 | 164 | 79.8 | 102.1 |
| 5 | 37 | 10 | 370 | 119 | 118 | 76.5 | 97.9 | |
| 6 | 22 | 10 | 220 | 119 | 125 | 74.3 | 95.0 | |
| 7 | 22 | 5 | 110 | 119 | 81 | 62.5 | 79.9 | |
| 8 | 11 | 5 then 10 | 55 then 110 |
179 | 127 | 67.6 | 98.7 | |
Lower Abrigo |
9 | 22 | 15 | 330 | 99 | 77 | 69.7 | 112.3 |
| 10 | 37 | 10 | 370 | 76 | 47 | 67.9 | 109.3 | |
| 11 | 22 | 10 | 220 | 81 | 66 | 65.9 | 106.1 | |
| 12 | 22 | 5 | 110 | 99 | 29 | 57.3 | 92.2 | |
| 13 | 11 | 5 | 55 | 99 | 43 | 60.8 | 97.8 | |
The 2015 column tests were designed to test rock variability by taking Gunnison core samples from various locations and depths across the deposit. The tests were run at 15 gpl free acid and 16 lph/m2, which according to the 2013 column test, are not the optimal conditions for low acid consumption. Figure 13-3 and Figure 13-4 are examples of the 2015 column testing. The 2015 columns showed similar characteristics to the 2013 data, suggesting there may not be a lot of variability in the deposit.
| M3-PN210313.007 31 March 2026 Revision 0 | 127 |
GUNNISON PROJECT Form 43-101F1 Technical Report |
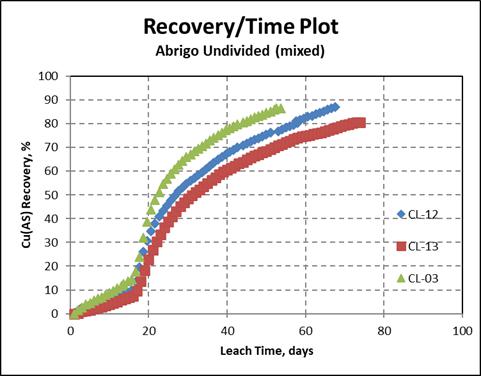
Figure 13-3: 2015 Abrigo Undivided. ASCu Extraction at 15 gpl Free Acid and 16 lph/m2
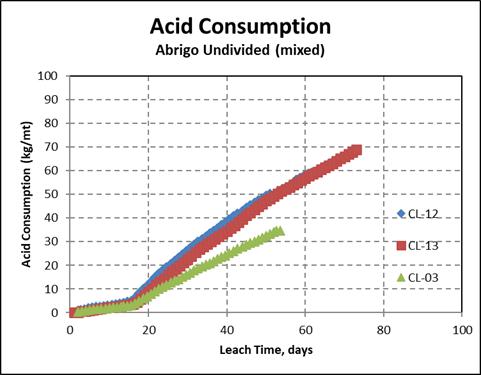
Figure 13-4: Abrigo Undivided Acid Consumption at 15 gpl Free Acid and 16 lph/m2 for Three Different Samples
| M3-PN210313.007 31 March 2026 Revision 0 | 128 |
GUNNISON PROJECT Form 43-101F1 Technical Report |
| 13.4 | Recent Studies to Reduce Acid Consumption and Increase Heap Feed Copper Grade |
During mid-2024, QP Terry McNulty had numerous conversations and in-person meetings at professional society conferences with representatives of companies that manufacture sorting machines and/or sensing equipment and software. These included Metso/Outotech, Tomra, Sentech, Steinert, Rados, and Thermo-Fisher. These conversations helped create an understanding of bulk and particle separation options, capabilities, and limitations, as well as the scale and separation objectives of commercial installations.
Sorting of agricultural products, like removal of pebbles and trash from pinto beans, has been done for at least 75 years. Radiometric sorting of mineralization from waste in uranium mines is generally thought to have begun at Cotter Corporation’s Schwartzwalder Mine in Colorado around 1960. The QP for this subsection, Terry McNulty, was involved in development of truckload scanners for mineralization/waste truck signaling in 1975 at Anaconda’s Jackpile uranium mine in New Mexico.
At some point during the 1980s, increased regulatory pressure and the growth of the waste management industry drove improvements in the effectiveness of segregating recyclable materials including aluminum, steel, glass, nonferrous alloys, magnetic alloys, paper, and trash. Since about 2015, development and refinement of sensing technology and sorting machines have accelerated rapidly, due partially to recognition in the global mining industry that rapidly declining mineralized material grades dictate upgrading to reduce costs and increase product yield from existing processing facilities. Underground sorting with use of rejected waste for stope backfill is becoming common.
Current sensing technologies for non-radioactive non-magnetic mineralized material include optical methods (color, texture, and reflectance), XRT, XRF, and specialized analytical methods. For instance, XRF can simultaneously discriminate among multiple targets, e.g. copper, zinc, and some lighter elements. Gold-mineralized material can be upgraded when the gold is associated with proxies like arsenic in gold-bearing arsenopyrite.
Current applications of bulk sorting at large tonnages have been confined mainly to haul trucks, loader & shovel buckets, and long segments of constant mineralization on conveyor belts. Particle-to-particle sorting is much more precise, but its treatment rate is limited to screening and sorting machine capacities. Most high-tonnage applications use bulk sorting to minimize capital and operating costs of the sorting plant. However, the loss of unacceptable quantities of economic minerals may be a consequence. The current known upper limit of installed particle-to-particle sorting is around 5,000-7,000 tonnes/day of total plant feed rate, but this limit can be increased indefinitely at the expense of capital and operating costs for conveyors, screens, structures, and sorting machines.
At Gunnison, rejection by material sorting of acid-consuming carbonates will be maximized while minimizing losses of copper minerals. As discussed in Section 13.5, the non-sulfide copper minerals, including chrysocolla, copper-impregnated layer silicates, and cuprite/tenorite occur almost exclusively in rock that is blue, green, red, or black. Calcite and dolomite, on the other hand, are predominantly white and tend to occur in discrete bands or zones.
During 2025, extensive tests were conducted by Steinert US on segments of unsplit 3-inch diameter core from the Martin formation. This work was directed by Jeffrey Bickel, CPG, Geology Services Manager, RESPEC. Core fragments from GCC’s core storage facility were tagged with adhesive barcode labels and subjected to optical sorting in a Steinert machine. Results and predictions are summarized below by Mr. Bickel, who will also serve as QP for that subsection.
| 13.5 | GCC Material Sorting Study |
GCC commissioned RESPEC to characterize and test the material sorting possibilities of the host lithologies at the Gunnison Project. Distinct zones of internal waste can be identified in the host Gunnison lithologies, especially in the Martin formation, where alteration and mineralization are discrete. These waste zones tend to contain more residual carbonate minerals than the heavily altered zones carrying copper mineralization. Carbonate minerals consume high amounts of acid in copper heap-leaching operations which negatively impact project economics. Therefore, the scope of material sorting study was to characterize and test the ability of GCC to sort the waste out of the processing feed using a material sorting machine. RESPEC has documented all procedures, results, and related reviews of data. The samples were taken from drillholes internal to the Gunnison Deposit mineral resources which contained representative geology and grade ranges for the deposit.
| M3-PN210313.007 31 March 2026 Revision 0 | 129 |
GUNNISON PROJECT Form 43-101F1 Technical Report |
| 13.5.1 | Characterization Samples |
RESPEC geologists analyzed the core to define the geologic characteristics of mineralization and waste in order to train the material sorting machine to recognize them to separate them in testing of the bulk sample. A combination of an analysis of Laser-induced breakdown spectroscopy data, geologic logging, and assays of the samples were used to characterize mineralized samples versus waste samples.
The numerical average assays results for the combined mineralized sample and the combined waste samples are provided in Table 13-5. Based on these assay results, the characterization samples provide an accurate representation of mineralization grades vs waste grades and can be considered adequate to use as a basis for material sorting tests. The results also prove that there is a significant reduction in acid consumption if waste can be removed from the stream via material sorting. Specifically, waste samples in this characterization set for the Martin formation consumed ~6 times more acid than copper-mineralized samples.
Table 13-5: Characterization Sample Assay Results by Major Lithology
|
Characterization Samples |
Count |
Avg CuT % |
Avg CuAs % |
CuAs Solubility Index | Avg CuCn % |
CuCn Solubility Index | Avg AcidCons (kg/mt) |
| Martin Mineralized Samples | 148 | 0.90 | 0.79 | 88% | 0.01 | 2% | 136 |
| Martin Waste Samples | 151 | 0.02 | 0.01 | 45% | 0.00 | 8% | 803 |
Figure 13-5 charts the distribution of Martin mineralized and waste samples for Total Copper and Acid Consumption assays for the characterization samples. Note that the acid consumption assays are for the dissolution of fully pulverized samples and as such do not correlate to acid consumption from an operational perspective. The chart clearly shows two distinct populations with respect to their relationship between grade and acid consumption. Waste samples with little to no grade have high acid consumption, while mineralization samples have materially lower acid consumption over variable ranges of copper grades. This result is expected since the Martin Formation typically contains an abundance of carbonate minerals in unmineralized rock based on RESPEC’s logging observations.
| M3-PN210313.007 31 March 2026 Revision 0 | 130 |
GUNNISON PROJECT Form 43-101F1 Technical Report |
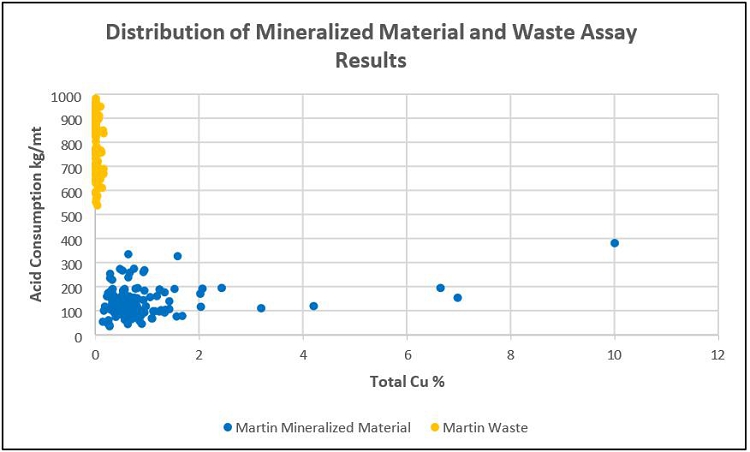
Figure 13-5: Total Copper and Acid Consumption Assay Results for Characterization Samples
This waste material has a distinct color and texture difference when compared to the mineralized material. Figure 13-6 shows a photograph of recent Martin formation drill core and adjacent to the photograph are the corresponding assays for characterization samples for this core. The samples highlighted in yellow correspond to the whiteish-colored internal waste that shows almost an order of magnitude higher acid consumption than the surrounding dark colored mineralized material, yet has no copper. It is this light-colored, un-mineralized, carbonate waste, that test work has shown can be successfully separated from the dark mineralized material using simple optical material sorting technology.
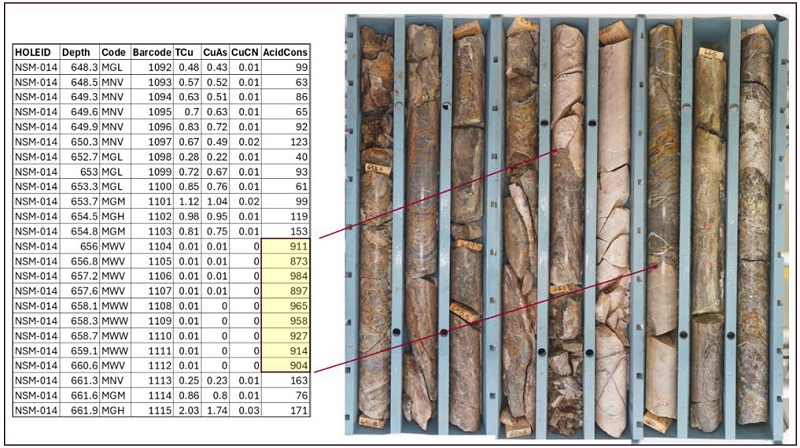
Figure 13-6: Recent Martin formation drill core showing white-colored, unmineralized, high acid consuming internal waste
The characterization samples were shipped to Walton, Kentucky for machine training (July 29th). Samples were run through the KSS sorter one at a time, with each sample’s code manually entered into the sorter’s software. Using the data collected by the sorter, Steinert engineers created calibration curves for the subsequent bulk test.
| 13.5.2 | Bulk Test |
792 bulk samples that met the size criteria of the material sorting test (the same size criteria as the characterization samples) were subsequently identified and labelled by RESPEC, and were shipped to Steinert for a second round of testing in late August.
The bulk samples were then each given an individual QR code, photographed, and weighed. The bulk samples were placed in trays and shipped to Steinert. Table 13-6 summarizes the bulk samples selected for the test. Table 13-7 is a detailed breakdown of the bulk samples by their specific assigned code.
Table 13-6: Summary of Samples Constituting Bulk Test #1
| Sample Type | Count |
| Martin Mineralized Material | 395 |
| Martin Waste | 397 |
| Total | 792 |
For the bulk sample testing, all the individual Martin samples were mixed (mineralization and waste) into one large sample set that was run through the commercial scale machine. The bulk sample consisted of approximately 50% waste samples and 50% mineralization samples, consistent with approximate distribution of mineralized and internal waste material in the overall mineralized Martin Formation.
| M3-PN210313.007 31 March 2026 Revision 0 | 131 |
GUNNISON PROJECT Form 43-101F1 Technical Report |
Bulk Martin samples were fed onto an inclined conveyor several samples at a time and passed through the machine. Twenty-five of the samples for the Martin formation broke during the test procedure and therefore were excluded from the results (twelve of which were mineralized, thirteen of which were waste). For the rest of the samples were run through the machine and the individual pieces were sorted into one of the two piles (mineralization versus waste). After all samples passed through the machine, RESPEC staff weighed the samples for internal checking, scanned the barcodes in each pile, and tabulated the results, which are provided in Table 13-7.
Table 13-7: Results of Bulk Sample Test
| Weights & counts of sorted bins | ||
| Sample | Mass (lbs) | Count |
| Total Sample Set | 1028 | 767 |
| Mineralized samples sorted into mineralized | 544 | 379 |
| Mineralized samples sorted into waste | 6 | 4 |
| Total Mineralized Samples | 383 | |
| % Accuracy Mineralized | 99% | |
| Waste samples sorted into Mineralized | 47 | 43 |
| Waste samples sorted into waste | 431 | 341 |
| Total Waste Samples | 384 | |
| % Accuracy Waste | 89% | |
Four samples of the Martin formation that were categorized as mineralized material were sorted into the waste bin. Forty-three waste samples were sorted into the mineralized bin.
A full summary of the sorting results is presented in Table 13-8, including assay and acid consumption results.
Table 13-8: Results of the Bulk Material Sorting of the Martin Formation
|
Category |
# of samples | Weight (lbs) | Average CuT% | Average ASCu% | Average CuCn% | Average Acid Cons |
% |
Comment |
| All materials | 767 | 1028 | 0.35 | 0.30 | 0.01 | 472 | 100% | of Martin |
| *All sorted to min’ | 422 | 591 | 0.62 | 0.54 | 0.01 | 204 | 57% | of Martin |
| All sorted to waste | 345 | 437 | 0.03 | 0.01 | 0.0020 | 801 | 43% | of Martin |
| Min’ sorted to min’ | 379 | 544 | 0.69 | 0.60 | 0.01 | 135 | 99% | of Min’ |
| Min’ sorted to waste | 4 | 6 | 0.40 | 0.34 | 0.01 | 132 | 1% | of Min’ |
| Waste sorted to Min’ | 43 | 47 | 0.03 | 0.02 | 0.00 | 814 | 10% | of waste |
| Waste sorted to waste | 341 | 431 | 0.02 | 0.01 | 0.00 | 808 | 90% | of waste |
*Min’ = Mineralized sample or Mineralized collection bin
| M3-PN210313.007 31 March 2026 Revision 0 | 132 |
GUNNISON PROJECT Form 43-101F1 Technical Report |
| 13.5.3 | Material Sorting Test Summary |
Based on the results to date, RESPEC concludes that mineralized material and waste can be reasonably segregated through material sorting processes in the Martin formation at Gunnison, and that the net results would reduce acid consumption of the feed going to the leach pads by approximately six times in this geologic unit. Capital and operating costs of using material-sorting machines for the Martin formation should be examined against the cost-savings of reducing acid consumption. If the analysis determines a net value for material sorting, GCC should incorporate material sorting in advanced studies for the project.
The mineralization: internal waste ratio is roughly 1:1 in the Martin formation based on logging and analysis of core. Material sorting test work has shown that approximately 10% of waste will be sorted into the mineralized process stream and 1% of the mineralization will be sorted into waste. Table 13-9 provides calculated percentages of mineralization and waste adjusted by the testing results.
Table 13-9: Mineralized:Waste Percentages Calculated by Sorting Results
| Mineralized: Waste Adjustments Based on Testing | |
| % of internal Waste in Martin resource | 50% |
| % of Waste that can be removed by material sorting | 90% |
| Ratio of acid consumed by Waste / acid consumed by Mineralization | 6.01 |
| % or Mineralization lost to Waste | 1% |
| Calculated Martin Mineralization % | 54.5% |
| Calculated Martin Waste % | 45.5% |
The author notes that the material sorter is using the bulk properties of the rock based on the characterization samples collected by RESPEC to identify mineralization and waste, and that a study using more advanced sorting machines could improve the results of waste sorting. Sorters that can detect oxide copper mineralization (dominantly chrysocolla at Gunnison) through quantifying pixels of specific colors could be used to refine the results of the sorting in the processing sequence; or alternatively used as the primary material sorter (M sorter). These sorters have the potential to successfully sort mineralization from waste in the Abrigo formation, and the author recommends Gunnison Copper explore this opportunity. Also, near-infrared material-sorters (NIR sorters) could detect carbonate minerals directly and could present another option to improve the sorting results of waste in the Martin formation or other units with distinct internal carbonate waste. Sorting machines with multiple optical sensors also have the potential to improve waste removal.
Variability in the mineralization:of internal waste ratio across the deposit could be eventually modeled and quantified through a thorough analysis of the Martin formation in all available core. Despite this, it is the author’s opinion that the spatial distribution of material used for this testing is adequate for preliminary studies. Crushing sizes may also impact mineralization: internal waste ratios, but the author does not have the expertise to speculate whether or not the impact would be material.
For preliminary purposes, the results of the Martin formation herein can reasonably be applied to the formations at Strong & Harris since they are geologically similar to the Martin formation. The author recommends additional testing to confirm this at a later stage in the project.
| M3-PN210313.007 31 March 2026 Revision 0 | 133 |
GUNNISON PROJECT Form 43-101F1 Technical Report |
| 13.6 | Sulfide Leaching |
Because of its high pyrite content, the deep JCM transition/primary copper sulfide zone is a good candidate for generation of ferric iron as an oxidant, a feature that encouraged Phelps Dodge to conduct commercial-scale accelerated ROM heap leaching at Bagdad, AZ, then at Morenci, AZ. These experiments were reported by Freeport several years after completion of a 3-year program at Morenci (Elkenes and Caro, 2013.)2.
Construction and operation of the so-called “engineered heaps” followed extensive column simulation and modeling at the PD/Freeport Process Technology Center in Safford, AZ. Results confirmed three fundamental and long-understood facts:
(1) chalcopyrite leaches more rapidly at elevated temperatures; (2) aeration accelerates pyrite oxidation; and (3) microbes also accelerate pyrite oxidation.
As to the beneficial effect of increased temperature, the kinetic equation derived by Gustav Arrhenius in the late-1800s predicts that most chemical reaction rates double with each 10° C (18°F) temperature rise. (This is generally true for microbial activity as well, up to a limiting temperature that kills the species.) However, increased reaction rate does not necessarily translate to higher ultimate leaching extraction. PD supplemented locally occurring microbes with thermophiles, microbial strains that thrive at elevated temperatures. It helps to crush the heap feed to a fine size, preferably around minus 1-inch, and to provide aeration beneath each heap lift. The PD experiment included both these augmentations.
The PD experiment was on commercial-size heaps and employed nearly all the elements included in the technology now being implemented at Johnson Camp by Rio Tinto’s Nuton venture. However, Nuton has added features developed internally by their central technology center at Bundoora, Victoria. According to the Nuton website, this technology “…achieves (copper) recovery rates of up to 85% from primary sulfides.”
Regardless of whether the sulfide leaching technique that will be used at Johnson Camp is provided by Nuton, or is simply an adaptation of generic improvements in the understanding of the roles of fine crushing, elevated temperatures, microbial enhancement, and supplementary oxygenation, it is reasonable to assume that 60 percent extraction of sulfide copper will be achieved.
| 13.7 | Predicted Gunnison Heap Leaching Performance |
An open question in our industry is prediction of commercial heap leaching performance from information generated by tests in bottle rolls and vertical plastic columns.
As noted in Section 13.2, tests supervised by Dr. Ron Roman to predict in-situ leaching acid consumption yielded values in horizontal box tests that were lower than obtained in columns. Limited published industry experience has shown that progressively lower predictions from bottle roll results are obtained in small columns, then large columns. In turn, commercial heaps require less acid than predicted by large columns. The aggregate effect is that commercial heap acid consumption is probably around 25-40 percent of typical column consumption. This is consistent with the results seen at JCM. The possible reasons include wall effects in columns, but the main differences may result from less aggressive free acid concentrations and irrigation rates in carefully managed commercial heaps. Many heap leaching consultants and operators argue that, for both gold and copper, only a large test heap (5,000-1 million tons) will allow an accurate prediction of acid consumption and metal extraction.
Nord information from 2009-2010 indicated an average of 0.15% ASCu by the standard cold acid assay procedure, equating to 3 pounds of soluble copper per ton. For that entire period of operation, totaling 6,895,449 tons of mixed ROM and crushed mineralized material were mined and stacked onto the leach pad. The period from 2009 through 2015 (the last four years of which were leaching with no mining), produced 26,676,395 pounds of cathode with the application of 117,138 tons of sulfuric acid. This equates to an average of 3.87 pounds of cathode copper produced per ton of mineralized material mined and leached, corresponding roughly to 129% ASCu recovery during approximately 2-years of ramp-up, sporadic operation, and the last four years of residual leaching. The recovery of greater than 100% of the contained ASCu copper indicates considerable copper was being leached from transitional minerals (like chalcocite) and possible sulfide minerals that do not report to the cold ASCu assay technique.
2 J. M. Elkenes and C. A. Caro, Improving leaching recovery of copper from low-grade chalcopyrite ores.” Minerals and Metallurgical Processing, Vol. 30, No. 3, August 2013, p. 180-185.
| M3-PN210313.007 31 March 2026 Revision 0 | 134 |
GUNNISON PROJECT Form 43-101F1 Technical Report |
If the planned Gunnison heap leaching operation performs like the Nord operation, it is expected that copper will be recovered to a similar extent from the acid soluble, transitional copper minerals and, under standard leach conditions, some of the sulfide copper minerals.
As discussed below, materials from the Martin Formation and the Strong & Harris Deposit are expected to behave similarly. Since both will be sorted, and the sorters will be ineffective on material finer that about 1/3 -inch (~10 mm), it can be assumed from a crusher product size distribution study that 13% of the crushed product will be fines.
The sorting tests showed that the split will be essentially 50:50 to heap feed and rejected waste, but sorting inefficiencies will displace 10% of the waste into heap feed with about 0.5% of the copper mineralization displaced into the rejected fraction.
Final pit shell design and economics are based on the recoveries and acid consumptions shown in Table 13-10. These have been derived from the results of the Gunnison column leach testing, factored for the difference between column test results and real-world leaching operations, and assuming that material sorting for the Martin formation and Strong & Harris will remove 90% of high-acid-consuming internal waste, while losing 1% of the mineralization.
Table 13-10: Estimated Acid Consumption and Copper Recoveries
|
Rock Formation |
Acid Consumption (lb/ton) | Estimated Cu Recoveries2 | ||||
|
Unsorted material |
Sorted
material |
ASCu |
CNCu |
Non-Enhance SUCu3 |
Enhanced SUCu | |
| Martin | 135 | 87.61 | 90% | 90% | 10% | 60% |
| Strong & Harris | 135 | 87.61 | 90% | 90% | 10% | 60% |
| Upper Abrigo | 48 | N/A | 90% | 90% | 10% | 60% |
| Middle Abrigo | 48 | N/A | 90% | 90% | 10% | 60% |
| Lower Abrigo | 24 | N/A | 90% | 90% | 10% | 60% |
| 1. Includes 13% fines at the unsorted acid consumption | ||||||
| 2. Recoveries are for the process stream on the leach pad. 1% of the mined product is lost during material sorting for the Martin formation and Strong & Harris. | ||||||
| 3. 10% was used in the financial model. 0% was used during mine planning. | ||||||
| M3-PN210313.007 31 March 2026 Revision 0 | 135 |
GUNNISON PROJECT Form 43-101F1 Technical Report |
| 14 | MINERAL RESOURCE ESTIMATES |
| 14.1 | Introduction |
Jeffrey Bickel, C.P.G., of RESPEC, is the Qualified Person responsible for the mineral resources reported in this Technical Report. Mr. Bickel is independent of GCC by the definitions and criteria set forth in NI 43-101; there is no affiliation between Mr. Bickel and GCC except that of an independent consultant/client relationship.
The Gunnison Deposit Mineral Resources are classified in order of increasing geological and quantitative confidence into Inferred, Indicated, and Measured categories in accordance with the “CIM Definition Standards – For Mineral Resources and Mineral Reserves” and therefore Canadian National Instrument 43-101. Mr. Bickel is not aware of any unusual environmental, permitting, legal, title, taxation, socio-economic, marketing, or political factors that may materially affect the Strong & Harris mineral resources as of the date of this report.
The Strong & Harris mineral resources are classified in order of increasing geological and quantitative confidence into Inferred, Indicated, and Measured categories in accordance with the “CIM Definition Standards - For Mineral Resources and Mineral Reserves” (2014) and therefore NI 43-101. CIM mineral resource definitions are given below, with CIM’s explanatory text shown in italics:
Mineral Resource
Mineral Resources are sub-divided, in order of increasing geological confidence, into Inferred, Indicated and Measured categories. An Inferred Mineral Resource has a lower level of confidence than that applied to an Indicated Mineral Resource. An Indicated Mineral Resource has a higher level of confidence than an Inferred Mineral Resource but has a lower level of confidence than a Measured Mineral Resource.
A Mineral Resource is a concentration or occurrence of solid material of economic interest in or on the Earth’s crust in such form, grade or quality and quantity that there are reasonable prospects for eventual economic extraction.
The location, quantity, grade or quality, continuity and other geological characteristics of a Mineral Resource are known, estimated or interpreted from specific geological evidence and knowledge, including sampling.
Material of economic interest refers to diamonds, natural solid inorganic material, or natural solid fossilized organic material including base and precious metals, coal, and industrial minerals.
The term Mineral Resource covers mineralization and natural material of intrinsic economic interest which has been identified and estimated through exploration and sampling and within which Mineral Reserves may subsequently be defined by the consideration and application of Modifying Factors. The phrase ‘reasonable prospects for eventual economic extraction’ implies a judgment by the Qualified Person in respect of the technical and economic factors likely to influence the prospect of economic extraction. The Qualified Person should consider and clearly state the basis for determining that the material has reasonable prospects for eventual economic extraction. Assumptions should include estimates of cutoff grade and geological continuity at the selected cut-off, metallurgical recovery, smelter payments, commodity price or product value, mining and processing method and mining, processing and general and administrative costs. The Qualified Person should state if the assessment is based on any direct evidence and testing.
| M3-PN210313.007 31 March 2026 Revision 0 | 136 |
GUNNISON PROJECT Form 43-101F1 Technical Report |
Interpretation of the word ‘eventual’ in this context may vary depending on the commodity or mineral involved. For example, for some coal, iron, potash deposits and other bulk minerals or commodities, it may be reasonable to envisage ‘eventual economic extraction’ as covering time periods in excess of 50 years. However, for many gold deposits, application of the concept would normally be restricted to perhaps 10 to 15 years, and frequently to much shorter periods of time.
Inferred Mineral Resource
An Inferred Mineral Resource is that part of a Mineral Resource for which quantity and grade or quality are estimated on the basis of limited geological evidence and sampling. Geological evidence is sufficient to imply but not verify geological and grade or quality continuity.
An Inferred Mineral Resource has a lower level of confidence than that applying to an Indicated Mineral Resource and must not be converted to a Mineral Reserve. It is reasonably expected that the majority of Inferred Mineral Resources could be upgraded to Indicated Mineral Resources with continued exploration.
An Inferred Mineral Resource is based on limited information and sampling gathered through appropriate sampling techniques from locations such as outcrops, trenches, pits, workings and drill holes. Inferred Mineral Resources must not be included in the economic analysis, production schedules, or estimated mine life in publicly disclosed Pre-Feasibility or Feasibility Studies, or in the Life of Mine plans and cash flow models of developed mines. Inferred Mineral Resources can only be used in economic studies as provided under NI 43-101.
There may be circumstances, where appropriate sampling, testing, and other measurements are sufficient to demonstrate data integrity, geological and grade/quality continuity of a Measured or Indicated Mineral Resource, however, quality assurance and quality control, or other information may not meet all industry norms for the disclosure of an Indicated or Measured Mineral Resource. Under these circumstances, it may be reasonable for the Qualified Person to report an Inferred Mineral Resource if the Qualified Person has taken steps to verify the information meets the requirements of an Inferred Mineral Resource.
Indicated Mineral Resource
An Indicated Mineral Resource is that part of a Mineral Resource for which quantity, grade or quality, densities, shape and physical characteristics are estimated with sufficient confidence to allow the application of Modifying Factors in sufficient detail to support mine planning and evaluation of the economic viability of the deposit.
Geological evidence is derived from adequately detailed and reliable exploration, sampling and testing and is sufficient to assume geological and grade or quality continuity between points of observation.
An Indicated Mineral Resource has a lower level of confidence than that applying to a Measured Mineral Resource and may only be converted to a Probable Mineral Reserve.
Mineralization may be classified as an Indicated Mineral Resource by the Qualified Person when the nature, quality, quantity and distribution of data are such as to allow confident interpretation of the geological framework and to reasonably assume the continuity of mineralization. The Qualified
| M3-PN210313.007 31 March 2026 Revision 0 | 137 |
GUNNISON PROJECT Form 43-101F1 Technical Report |
Person must recognize the importance of the Indicated Mineral Resource category to the advancement of the feasibility of the project. An Indicated Mineral Resource estimate is of sufficient quality to support a Pre-Feasibility Study which can serve as the basis for major development decisions.
Measured Mineral Resource
A Measured Mineral Resource is that part of a Mineral Resource for which quantity, grade or quality, densities, shape, and physical characteristics are estimated with confidence sufficient to allow the application of Modifying Factors to support detailed mine planning and final evaluation of the economic viability of the deposit.
Geological evidence is derived from detailed and reliable exploration, sampling and testing and is sufficient to confirm geological and grade or quality continuity between points of observation.
A Measured Mineral Resource has a higher level of confidence than that applying to either an Indicated Mineral Resource or an Inferred Mineral Resource. It may be converted to a Proven Mineral Reserve or to a Probable Mineral Reserve.
Mineralization or other natural material of economic interest may be classified as a Measured Mineral Resource by the Qualified Person when the nature, quality, quantity and distribution of data are such that the tonnage and grade or quality of the mineralization can be estimated to within close limits and that variation from the estimate would not significantly affect potential economic viability of the deposit. This category requires a high level of confidence in, and understanding of, the geology and controls of the mineral deposit.
Modifying Factors
Modifying Factors are considerations used to convert Mineral Resources to Mineral Reserves. These include, but are not restricted to, mining, processing, metallurgical, infrastructure, economic, marketing, legal, environmental, social and governmental factors.
The mineral resources are reported herein at cutoffs that are reasonable for deposits of this nature given anticipated mining methods and plant processing costs, while also considering economic conditions, because of the regulatory requirements that a resource exists “in such form and quantity and of such a grade or quality that it has reasonable prospects for eventual economic extraction.”
| 14.2 | DATA |
The Gunnison Deposit copper resources were modeled and estimated using data generated primarily by GCC, with additional information from historical operators, including data derived from core, reverse circulation, and conventional rotary drillholes. Historical operators included Cyprus Minerals, Superior Minerals, Quintana Minerals, Magma Copper, Phelps Dodge, Minerals Exploration, and James Sullivan. No holes were drilled subsequent to the previously reported mineral resources presented in the Gunnison Copper Project Pre-Feasibility Update prepared by M3 in 2016 (M3, 2016). This data, as well as digital topography of the Project area, were provided to RESPEC by GCC in a digital database in Arizona State Plane, East Zone coordinates in US Survey feet using the NAD27 datum. This database is summarized in more detail in Section 10.
All modeling of the Gunnison Deposit resources was performed using proprietary software developed at RESPEC as well as GEOVIA Surpac™ mining software. The Gunnison resource block-model extents and block dimensions are provided in Table 14-1.
| M3-PN210313.007 31 March 2026 Revision 0 | 138 |
GUNNISON PROJECT Form 43-101F1 Technical Report |
Table 14-1: Block Model Summary
| x
(ft) |
y
(ft) |
z
(ft) | |
| Min Coordinates | 529,000 | 384,750 | 0 |
| Max Coordinates | 549,450 | 398,250 | 5,200 |
| Block Size | 50 | 100 | 25 |
| Rotation | 0 | 0 | 0 |
| 14.3 | Deposit Geology Pertinent to Resource Modeling |
The Gunnison copper mineralization occurs primarily in Paleozoic sedimentary units adjacent to the Texas Canyon Quartz Monzonite, although the quartz monzonite and Precambrian rocks host minor quantities of mineralization as well. The primary controls on the Gunnison mineralization include: (i) proximity to the Texas Canyon Quartz Monzonite; (ii) carbonate-bearing stratigraphic units altered to various calc-silicate/skarn mineral assemblages; and (iii) the degree of fracturing. The development of primary copper-sulfide skarn mineralization is related to the proximity to the intrusion. The skarn mineralization preferentially developed in carbonate-bearing units, with the combination of this and proximity to the intrusion leading to the Martin and Abrigo formations being the primary host units. Fracture intensity is controlled by two factors: fracturing related to volume loss during skarn development and fracturing related to pre- and post-mineral faulting. The effects of oxidation overprint the primary copper mineralization to depths of approximately 1,600 feet.
Geologic factors are critical to the modeling of the Gunnison copper mineralization therefore include lithology, structure, and oxidation.
| 14.3.1 | Modeling of Geology |
GCC completed stratigraphic interpretations on a set of east-west vertical cross sections that were used for all modeling of the Gunnison Deposit. These sections are spaced at 100-foot intervals over a north-south extent of 9,000 feet, which covers the mineral resource area, with four 500-foot spaced sections appended to the north and south of the 100-foot sections. The stratigraphic units modeled on the cross sections include the Naco Group, Escabrosa Limestone, Martin Formation, Abrigo Formation (subdivided into the upper, middle, and lower units), Bolsa Quartzite, undivided Precambrian rocks (including the Pinal Schist and Apache Group), Texas Canyon Quartz Monzonite, and Tertiary/Quaternary basin fill. Following a review of geological modeling, the GCC stratigraphic cross sections were used to assign a single lithologic code to each block in the model (Figure 14-1 and Figure 14-2).
| M3-PN210313.007 31 March 2026 Revision 0 | 139 |
GUNNISON PROJECT Form 43-101F1 Technical Report |
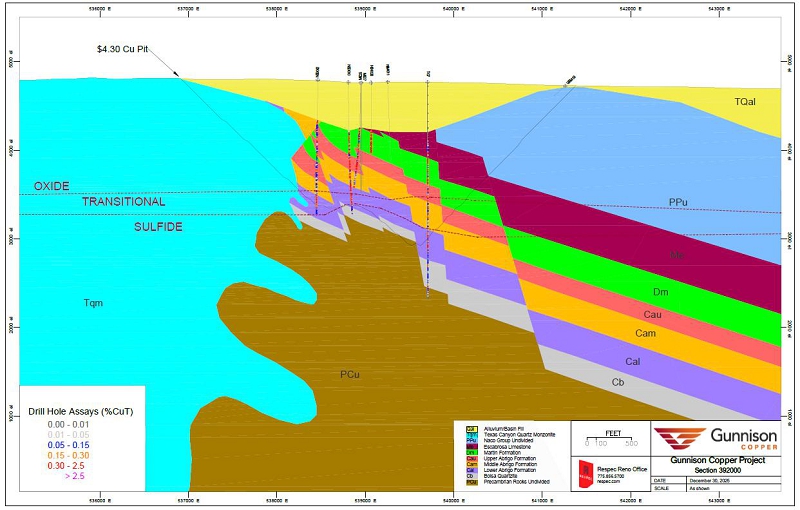
Figure 14-1: Cross Section 392000N Showing Gunnison Geologic Model
| M3-PN210313.007 31 March 2026 Revision 0 | 140 |
GUNNISON PROJECT Form 43-101F1 Technical Report |
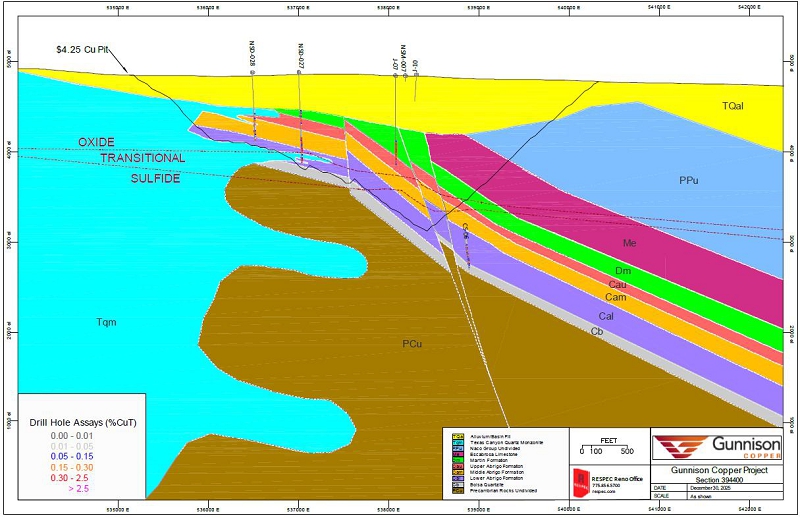
Figure 14-2: Cross Section 394400N Showing Gunnison Geologic Model
| M3-PN210313.007 31 March 2026 Revision 0 | 141 |
GUNNISON PROJECT Form 43-101F1 Technical Report |
As part of the geologic modeling, GCC also completed detailed structural interpretations. A total of 61 individual structural domains were modeled as three-dimensional wire-framed solids (Figure 14-3). These solids were used to code model blocks to each of the 61 modeled structural domains. A block that encompasses any volume of one of the structural domains was assigned the code of that domain, which effectively expands the volumes of the structural domains from those represented by the structural solids.
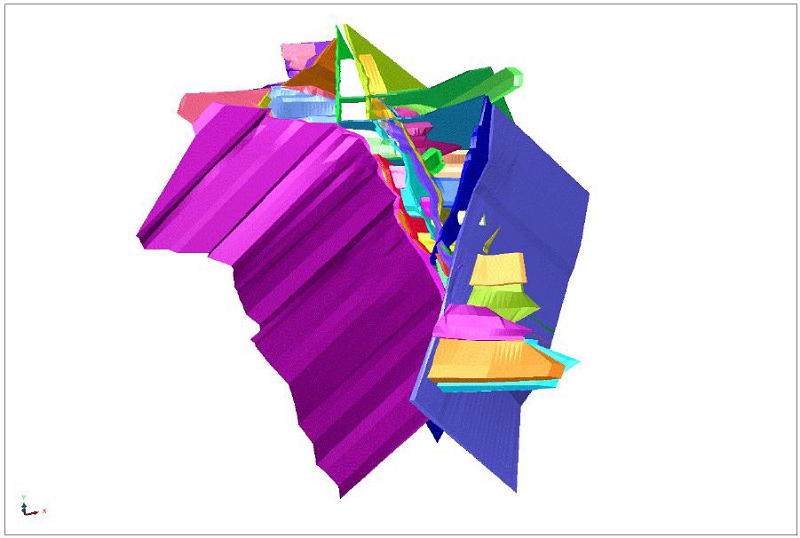
Figure 14-3: Oblique Northerly View of Structural – Domain Wire – Frame Solids
| 14.4 | Geologic and Oxidation Models |
At GCC’s request, RESPEC constructed stratigraphic interpretations on a set of vertical, digital cross sections oriented at 045° azimuth through the Strong & Harris Deposit. These sections were spaced at 200-foot intervals over a strike extent of 10,000 feet, which covers the resource area. The stratigraphic units modeled on the cross sections include the Colina Limestone, Earp Formation, Horquilla Limestone, Black Prince Limestone, and the diabase sill. The sectional interpretations were then triangulated to create 3D surfaces or solids.
Fault surfaces were constructed using information from three sources: (i) GCC interpretations on cross sections; (ii) RESPEC interpretations on cross sections; and (iii) historical interpretations from Superior Minerals.
RESPEC also interpreted oxidation domains on the cross sections using logging data and the ratio of soluble copper assays to total copper assays. The mineralization was assigned to oxide, transition, or sulfide material types (domains). In general, if the ratio CuOx/Cu was greater than or equal to 60%, the mineralization was assigned to the oxide domain. If the ratio ranged between 25% and 60%, the mineralization was assigned to the transition material. Mineralization with a ratio of less than 25% soluble copper was assigned to the sulfide domain. These oxidation ratio rules were modified as needed with geological context. The cross-sectional oxidation domains were then triangulated into 3D surfaces.
| M3-PN210313.007 31 March 2026 Revision 0 | 142 |
GUNNISON PROJECT Form 43-101F1 Technical Report |
| 14.4.1 | Oxidation Modeling |
Using drillhole logging and copper sequential-leach data (TCu), acid-soluble copper (ASCu), and cyanide-soluble copper (CNCu), GCC modeled both the base of more-or-less complete oxidation and the bottom of oxidation/top of unoxidized materials on a set of 100-foot spaced, east-west vertical sections. In general, if the ASCu to TCu ratio was greater than or equal to 50%, the mineralization was assigned to oxide. If the ASCu to TCu ratio ranged between 49% to 20%, the mineralization was assigned as transitional material. These oxidation ratio rules were modified primarily by geological common sense.
The outcome of the modeling was to interpret three dimensional surfaces between oxide, transitional, and sulfide portions of the Gunnison Deposit. The surfaces were then used to code each model block to one of the three oxidation zones after RESPEC verified GCC’s modeling of the surfaces.
| 14.4.2 | Fracture – Intensity Modeling |
Fracture intensity at the Gunnison Deposit is defined based on geological logging and down-hole geophysical data. A relative fracture-intensity value was assigned to each logged interval in the Project database on a scale of one to five, irrespective of the rock unit, with a value of “5” representing the most fractured rock (Table 14-2).
Table 14-2: Fracture – Intensity Scale
|
Intensity Code |
Description (% of Core ≤ 4 inches) |
| 1 | Very Weak (0-5%) |
| 2 | Weak (5-20%) |
| 3 | Moderate (20-50%) |
| 4 | Strong (50-80%) |
| 5 | Very Strong (80-100%) |
The wireframe solids discussed in Section 14.3.1 were used to code the fracture-intensity intervals in the Project database to the structural domains. Fracture-intensity intervals lying outside of the structural domains were also assigned a code, leading to a total of 3,485 coded fracture-intensity intervals in the database, 26% of the intervals inside of the solids and the remainder outside. The intervals inside and outside of the structural domains have length-weighted mean fracture intensity values of 3.4 and 2.3, respectively.
The coded fracture-intensity values were composited to 25-foot lengths for use in inverse-distance-to-the-fifth-power interpolations of the fracture intensity into the resource-model blocks. All composites coded to the 61 structural domains were used for the interpolation of values into each of the structural domains coded into the model, and outside-domain composites were used to estimate the values in the remainder of the model. The inside-domain estimations used one of eight search-ellipse orientations to match the average strike and dip of each modeled structural domain. Fracture intensity values of the Paleozoic sedimentary units and Precambrian rocks outside of the structural domains were estimated using an ellipse that is consistent with the average strike and dip of the sedimentary units, while the Texas Canyon Quartz Monzonite was estimated using an isotropic search ellipse (Table 14-3). These search ellipses for fracture intensity were also used in the estimation of TCu grades and ASCu to TCu ratios (ASCu/TCu); see Table 14-11 for details of the search-ellipse orientations.
| M3-PN210313.007 31 March 2026 Revision 0 | 143 |
GUNNISON PROJECT Form 43-101F1 Technical Report |
Table 14-3: Fracture – Intensity Estimation Parameters
| Structural Domains, Paleozoic Sediments, Precambrian Rocks | ||||||
Estimation Pass |
Search-Ellipse Ranges (ft) | Composite Constraints | ||||
| Major | Semi-Major | Minor | Min | Max | Max/hole | |
| 1 | 700 | 700 | 233 | 4 | 10 | 4 |
| 2 | 1000 | 1000 | 333 | 1 | 10 | 4 |
| Texas Canyon Quartz Monzonite | ||||||
Estimation Pass |
Search-Ellipse Ranges (ft) | Composite Constraints | ||||
| Major | Semi-Major | Minor | Min | Max | Max/hole | |
| 1 | 700 | 700 | 700 | 4 | 10 | 4 |
Figure 14-4 is an east-west cross section showing the fracture-intensity model in the deposit.
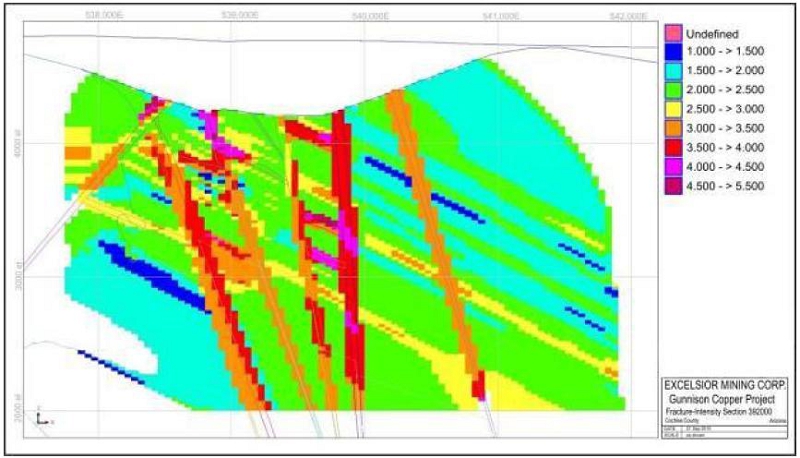
Figure 14-4: Fracture – Intensity Model Cross Section 392000N
| 14.4.3 | Density Modeling |
Specific-gravity (“SG”) determinations were made by GCC for every assay sample in zones of mineralization and an additional 10 feet beyond the limits of each mineralized zone. The logging geologist determined where SG measurements were taken with regards to mineralized and non-mineralized materials; determinations were made on core from the NSD-series holes as well as the NSM-series metallurgical holes. The water-displacement method was used to determine the SG values using whole-core samples, which were not wrapped or waxed for the measurements. RESPEC notes that this methodology does not allow for the determination of actual in-situ bulk, specific gravity in zones of highly broken core, because natural void spaces cannot be properly measured, leading to some overstatement of SG in these cases.
| M3-PN210313.007 31 March 2026 Revision 0 | 144 |
GUNNISON PROJECT Form 43-101F1 Technical Report |
Model tonnage factors were assigned based on the combination of lithologic, oxidation, and total-copper mineral-domain coding of each block in the model. The TCu mineral-domain codes (discussed in Section 14.4.4) include domain 100 (low-grade), domain 200 (high-grade), or domain 0 (un-modeled/un-mineralized). Table 14-4 shows descriptive statistics of the underlying SG data by these categories, as well as the tonnage factors assigned to the model blocks (calculated from the SG means).
Table 14-4: Specific Gravity Statistics and Model Coding of Tonnage Factors
| TCu | Oxidation | Specific Gravity | Tonnage Factor | ||||||||
| Unit | Domain |
Zone |
Mean |
Median |
Min |
Max |
Count |
(ft3/ton) | |||
| Qal | 0 | ox | 2.5 | 2.54 | 2.28 | 2.74 | 17 | 12.81 | |||
| 200 | ox + trans | 2.61 | 2.59 | 2.27 | 3.14 | 35 | 12.27 | ||||
| 100 | ox + trans | 2.57 | 2.58 | 2.33 | 3.06 | 115 | 12.47 | ||||
| Tqm | 0 | ox + trans | 2.56 | 2.58 | 2.14 | 2.88 | 177 | 12.51 | |||
| 100 | unox | 2.59 | 2.6 | 2.16 | 3.18 | 237 | 12.37 | ||||
| 0 | unox | 2.56 | 2.59 | 2.21 | 2.7 | 80 | 12.51 | ||||
| Ppu | 100 0 |
ox + trans ox + trans |
2.72 2.71 |
2.67 2.67 |
2.58 2.36 |
3.47 3.46 |
27 137 |
11.78 11.82 | |||
| 200 | ox + trans | 2.96 | 3.04 | 2.03 | 3.58 | 63 | 10.82 | ||||
| Me | 100 | ox + trans | 2.84 | 2.7 | 2.42 | 3.67 | 101 | 11.28 | |||
| 0 | ox + trans | 2.68 | 2.66 | 2.26 | 3.69 | 125 | 11.95 | ||||
| 200 | ox + trans | 2.79 | 2.76 | 2.18 | 3.81 | 478 | 11.48 | ||||
| 100 | ox + trans | 2.82 | 2.75 | 2.12 | 3.66 | 125 | 11.36 | ||||
| Dm | 0 | ox + trans | 2.72 | 2.71 | 1.97 | 4.23 | 444 | 11.78 | |||
| 200 | unox | 2.9 | 2.85 | 2.6 | 3.25 | 31 | 11.05 | ||||
| 100 | unox | 2.85 | 2.86 | 2.46 | 3.21 | 26 | 11.24 | ||||
| 0 | unox | 2.86 | 2.85 | 2.7 | 3.11 | 10 | 11.2 | ||||
| 200 | ox + trans | 2.82 | 2.83 | 2.14 | 3.75 | 337 | 11.36 | ||||
| 100 | ox + trans | 2.85 | 2.85 | 2.27 | 3.32 | 277 | 11.24 | ||||
| Cau | 0 | ox + trans | 2.75 | 2.77 | 2.07 | 3.54 | 332 | 11.65 | |||
| 200 | unox | 2.98 | 2.99 | 2.46 | 4.11 | 89 | 10.75 | ||||
| 100 | unox | 2.88 | 2.87 | 2.44 | 3.42 | 59 | 11.12 | ||||
| 0 | unox | 2.85 | 2.81 | 2.42 | 3.43 | 42 | 11.24 | ||||
| 200 | ox + trans | 2.85 | 2.81 | 2.1 | 4.55 | 368 | 11.24 | ||||
| 100 | ox + trans | 2.96 | 2.96 | 2.1 | 3.41 | 201 | 10.82 | ||||
| Cam | 0 | ox + trans | 2.91 | 2.88 | 2.24 | 3.84 | 239 | 11.01 | |||
| 200 | unox | 2.9 | 2.89 | 2.38 | 3.65 | 81 | 11.05 | ||||
| 100 | unox | 2.98 | 2.96 | 2.47 | 3.48 | 79 | 10.75 | ||||
| 0 | unox | 3.05 | 3.03 | 2.41 | 3.67 | 177 | 10.5 | ||||
| 200 | ox + trans | 2.71 | 2.7 | 1.79 | 3.72 | 269 | 11.82 | ||||
| 100 | ox + trans | 2.66 | 2.66 | 2.32 | 3.01 | 97 | 12.04 | ||||
| Cal | 0 | ox + trans | 2.66 | 2.66 | 2.34 | 3.01 | 32 | 12.04 | |||
| 200 | unox | 2.75 | 2.73 | 2.15 | 3.59 | 472 | 11.65 | ||||
| 100 | unox | 2.72 | 2.69 | 2.3 | 3.57 | 293 | 11.78 | ||||
| 0 | unox | 2.81 | 2.76 | 2.42 | 3.41 | 90 | 11.4 | ||||
| 100 | ox + trans | 2.75 | 2.64 | 2.61 | 3 | 3 | 11.65 | ||||
| Cb | 200 | unox | 2.62 | 2.61 | 2.47 | 2.9 | 30 | 12.23 | |||
| 100 | unox | 2.64 | 2.64 | 2.31 | 3 | 173 | 12.14 | ||||
| 0 | unox | 2.63 | 2.62 | 2.48 | 2.99 | 48 | 12.18 | ||||
| 0 | ox + trans | 2.7 | 2.7 | 2.26 | 3.01 | 85 | 11.87 | ||||
| Pcu | 200 | unox | 2.69 | 2.69 | 2.56 | 2.87 | 15 | 11.91 | |||
| 100 | unox | 2.74 | 2.73 | 2.43 | 3.11 | 94 | 11.69 | ||||
| 0 | unox | 2.69 | 2.69 | 2.25 | 3.01 | 155 | 11.91 | ||||
| M3-PN210313.007 31 March 2026 Revision 0 | 145 |
GUNNISON PROJECT Form 43-101F1 Technical Report |
| 14.4.4 | Total Copper and Soluble Copper Modeling |
The Gunnison Deposit mineral domains were modeled jointly by RESPEC and GCC to respect the detailed lithologic, structural, and oxidation modeling completed by GCC. Following a statistical evaluation of the drillhole copper data, TCu mineral domains were interpreted on 100-foot spaced, east-west vertical cross sections that span the 2.1-mile north-south and 1.3-mile east-west extents of the deposit. The TCu domains were then used to explicitly constrain the estimation of copper grades into 50 x 100 x 25-foot (x, y, z) model blocks using 20-foot composites and inverse-distance interpolation. The TCu grade estimation was further controlled by the incorporation of a number of unique search ellipses that reflect the various orientations of the modeled structural domains, as well as the strike and dip of the favorable stratigraphic units in areas outside the structural domains. The estimation of the ASCu/TCu ratios was constrained by modified versions of the TCu mineral domains, as well as by oxidation zone (oxide, transitional, and sulfide).
| 14.4.4.1 | Mineral Domains |
A mineral domain encompasses a volume of ground that is ideally characterized by a single, natural, population of a metal grade that occurs within a specific geologic environment. In order to define the mineral domains at the Gunnison Deposit, the natural TCu grade populations were identified on population-distribution graphs for all drillhole samples in the Gunnison Deposit area. This analysis led to the identification of low-grade and high-grade populations, with a gradational change between the two. Ideally, each of these populations can be correlated with specific geologic characteristics that are captured in the Project database, which then can be used in conjunction with the grade populations to interpret the bounds of each of the TCu mineral domains. The approximate grade ranges of the low-(domain 100) and high- (domain 200) grade domains are listed in Table 14-5.
Table 14-5: Approximate Grade Ranges of Total – Copper Mineral Domains
| Domain | Total Copper (%) |
| 100 | ~0.01 to ~0.15 |
| 200 | > ~0.15 |
Using these grade populations in conjunction with GCC’s lithologic and structural interpretations, the Gunnison TCu mineralization was modeled by interpreting mineral-domain polygons on the set of 100-foot spaced cross sections described in Section 14.3.1. The interpretation of the TCu mineral-domain polygons was guided by the lithologic, structural, and fracture-intensity controls described in Section 14.3.
Representative cross sections showing the TCu mineral-domain interpretations are shown in Figure 14-5 and Figure 14-6.
As discussed further below, ASCu and CNCu were not estimated directly into the block model, but were instead derived from the estimations of TCu grade and ASCu ratios. In addition to other constraints discussed below, the ASCu domain was created to envelope an area of anomalously low soluble copper ratios in the Paleozoic sedimentary rocks and Precambrian rocks within the oxide zone. This low-ratio mineral domain, interpreted on the Project cross sections, models a low-ratio rind that more-or-less lies along the contact of the sedimentary units with the Texas Canyon Quartz Monzonite. This low-ratio contact zone appears to be related more to clay mineralogy than to oxidation.
| M3-PN210313.007 31 March 2026 Revision 0 | 146 |
GUNNISON PROJECT Form 43-101F1 Technical Report |
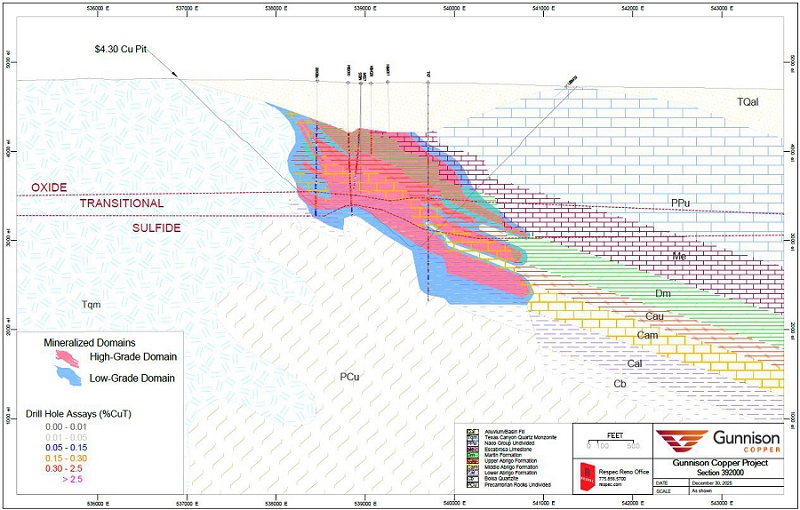
Figure 14-5: Cross Section 392000 N Showing Total – Copper Mineral Domains
| M3-PN210313.007 31 March 2026 Revision 0 | 147 |
GUNNISON PROJECT Form 43-101F1 Technical Report |
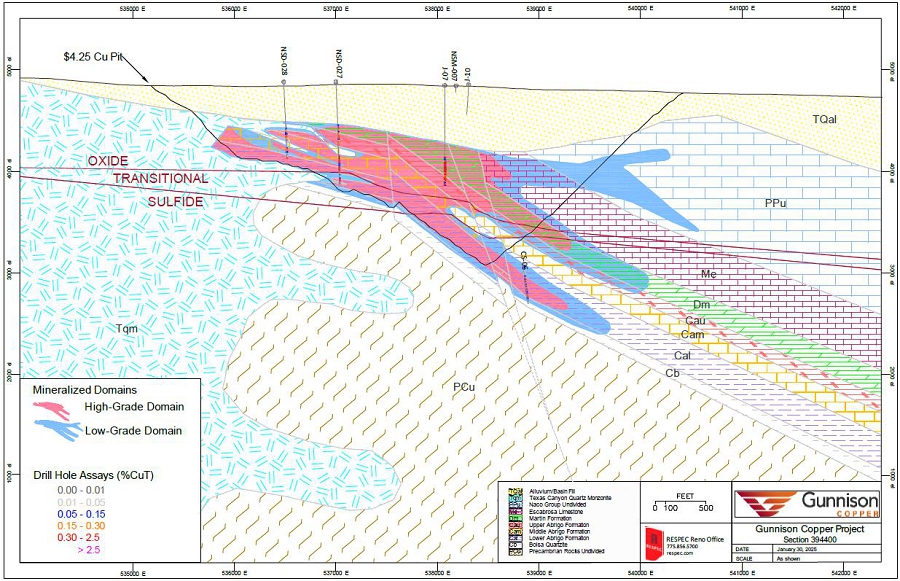
Figure 14-6: Cross Section 394400 Showing Total – Copper Mineral Domains
| M3-PN210313.007 31 March 2026 Revision 0 | 148 |
GUNNISON PROJECT Form 43-101F1 Technical Report |
| 14.4.4.2 | Assay Coding, Capping, and Compositing |
The TCu cross-sectional mineral-domain polygons were used to code drillhole TCu intervals to their respective mineral domains. The ASCu and CNCu database intervals were coded to the oxide, transitional, sulfide, and low-ratio domains using the oxidation surfaces and low-ratio sectional polygons. Only those intervals that were also coded to one of the two TCu mineral domains were coded to one of the ASCu and CNCu domains. As an additional constraint, ASCu and CNCu intervals were not coded if the TCu value was less than 0.03%, in order to alleviate spurious ratios caused by analyses of either species close to, or at, the analytical detection limits.
Descriptive statistics of the coded TCu analyses are provided in Table 14-6.
Table 14-6: Descriptive Statistics of Coded Total – Copper Analyses
|
Domain |
Assays |
Count |
Mean (Cu%) | Median (Cu%) |
Std. Dev |
CV |
Min. (Cu%) | Max. (Cu%) |
| 100 | Cu | 3075 | 0.09 | 0.07 | 0.15 | 1.57 | 0.00 | 9.00 |
| Cu Cap | 3075 | 0.09 | 0.07 | 0.09 | 1.04 | 0.00 | 1.50 | |
| 200 | Cu | 4498 | 0.40 | 0.30 | 0.37 | 0.94 | 0.00 | 10.95 |
| Cu Cap | 4498 | 0.40 | 0.30 | 0.37 | 0.94 | 0.00 | 10.95 | |
| All | Cu | 7573 | 0.27 | 0.17 | 0.34 | 1.23 | 0.00 | 10.95 |
| Cu Cap | 7573 | 0.27 | 0.17 | 0.34 | 1.21 | 0.00 | 10.95 |
The process of determining TCu capping levels (Table 14-7) included the evaluation of population distribution plots of the coded analyses by domain to identify potential high-grade outliers. Descriptive statistics of the coded assays by domain and visual reviews of the spatial relationships of the possible outliers and their potential impacts during grade interpolation were also considered. ASCu/TCu and CNCu/TCu ratios were capped at 1.00.
Table 14-7: Total – Copper Assay Caps by Mineral Domain
| Domain | TCu% | Number Capped (% of Samples) |
| 100 | 1.5 | 7 (<1%) |
| 200 | - | - |
The capped TCu analyses and corresponding ASCu/TCu and CNCu ratios in the database were composited at 20-foot down-hole intervals that respect the mineral domains; composites less than 10 feet in length were eliminated. The 20-foot composite length was chosen because it is a multiple of the dominant 10-foot sample length.
Descriptive statistics of TCu, ASCu/TCu, and CNCu-ratio composites are shown in Table 14-8, Table 14-9, and Table 14-10, respectively.
Table 14-8: Descriptive Statistics of Total – Copper Composites
|
Domain |
Count |
Mean (Cu%) | Median (Cu%) |
Std. Dev. |
CV |
Min. (Cu%) | Max. (Cu%) |
| 100 | 1,352 | 0.09 | 0.08 | 0.06 | 0.71 | 0 | 0.81 |
| 200 | 1,915 | 0.4 | 0.33 | 0.29 | 0.72 | 0.01 | 2.9 |
| All | 3,267 | 0.27 | 0.19 | 0.27 | 1 | 0 | 2.9 |
| M3-PN210313.007 31 March 2026 Revision 0 | 149 |
GUNNISON PROJECT Form 43-101F1 Technical Report |
Table 14-9: Descriptive Statistics of Acid – Soluble to Total – Copper Composites
|
Domain |
Count |
Mean |
Median |
Std. Dev. |
CV |
Min. |
Max. |
| 100 | 139 | 0.44 | 0.43 | 0.17 | 0.37 | 0.1 | 0.81 |
| 210 | 1,758 | 0.75 | 0.77 | 0.13 | 0.17 | 0.03 | 1 |
| 220 | 701 | 0.31 | 0.3 | 0.22 | 0.69 | 0.01 | 1 |
| 230 | 428 | 0.09 | 0.07 | 0.09 | 1 | 0.01 | 0.74 |
| All | 3,026 | 0.54 | 0.65 | 0.3 | 0.56 | 0.01 | 1 |
Table 14-10: Descriptive Statistics of Cyanide – Soluble to Total – Copper Composites
|
Domain |
Count |
Mean |
Median |
Std. Dev. |
CV |
Min. |
Max. |
| 210 | 1,328 | 0.049 | 0.03 | 0.06 | 1.14 | 0.002 | 0.94 |
| 220 | 487 | 0.207 | 0.17 | 0.15 | 0.72 | 0.004 | 0.65 |
| 230 | 271 | 0.113 | 0.1 | 0.05 | 0.46 | 0.03 | 0.40 |
| 240 | 77 | 0.228 | 0.2 | 0.16 | 0.71 | 0.005 | 0.68 |
| all | 2,163 | 0.099 | 0.06 | 0.11 | 1.15 | 0.002 | 0.94 |
| 14.4.4.3 | Block Model Coding |
The percentage of each block that lies below the topographic surface was coded into the block model, as well as the lithologic, structural, fracture intensity, oxidation, and density coding discussed in previous subsections of this Technical Report. The TCu domains were coded using the 100-foot spaced mineral-domain polygons, and the low-ASCu/TCu ratio domain was similarly coded. All of this coding was done on a block-in-block-out basis (i.e., each block received only one lithologic code, one oxidation code, one TCu domain code, etc.).
The model was also coded by land, including the unpatented claims on BLM lands, State of Arizona lands, and Connie Johnson mineral rights, all controlled by GCC, as well as “Other” lands (not controlled by GCC).
| 14.4.4.4 | Variography |
Using all TCu composites, variogram ranges of 1,200 feet along the strike of the sedimentary units (340°) and 700 feet in the dip direction (-35° at 070°) were obtained. Due to the inclusion of composites in this analysis from the structure domains and the Texas Canyon Quartz Monzonite, which have a variety of orientations and whose strikes and especially dips are quite different than the orientation of the sedimentary units, these ranges are considered to be minimums.
| 14.4.4.5 | Acid-Soluble Copper Modeling |
There are two methods for estimating ASCu: directly, using composites of the ASCu analyses in the database; or indirectly, by estimating ASCu/TCu ratios. In the latter case, the ratios are determined for each drill interval that has both ASCu and TCu analyses, and these ratios are then coded, composited, and used to estimate the ratios into the model blocks. The estimated ASCu model values are then derived by multiplying the estimated ASCu/TCu ratio by the estimated TCu value in each block.
| M3-PN210313.007 31 March 2026 Revision 0 | 150 |
GUNNISON PROJECT Form 43-101F1 Technical Report |
There is no evidence of significant leaching and remobilization of the supergene copper at the Gunnison Deposit, which is probably due to remnant carbonate minerals in the host units that would have restricted the movement of acidic solutions during oxidation. In a scenario of limited to no remobilization of oxidized copper species, ASCu/TCu ratios reflect the degree of oxidation of the hypogene copper mineralization. At the Gunnison Deposit, the ASCu/TCu ratios are relatively uniform within each of the oxidation zones, with some indication of decreasing ratios (decreasing oxidation) with depth.
The use of ASCu/TCu ratios in the estimation of ASCu values can negate possible biases created by sample intervals that were selectively analyzed for TCu but not ASCu. There are 259 sample intervals coded to the TCu domains that have no ASCu analyses, which represents approximately 3.5% of the coded intervals.
RESPEC decided to use estimated ASCu/TCu ratios to calculate the Gunnison ASCu block values. The ASCu/TCu ratio estimation was confined to blocks with estimated TCu values. The ratios of blocks coded to the oxide, transitional, and sulfide zones, as well as the low-ratio zone discussed above, were all estimated independently.
| 14.4.5 | Cyanide-Soluble Copper Modeling |
RESPEC also estimated cyanide-soluble copper ratios (CNCu/TCu) and then calculating the CNCu grade by the same methods as ASCu. The CNCu/TCu ratio estimation was confined to blocks with estimated TCu values in the sulfide and transition zones of the model, as well as isolated pods perched in the oxide zone. The ratios of blocks coded to the various oxidation zones were all estimated independently.
| 14.4.5.1 | Estimation |
The search ellipses used for the TCu, ASCu/TCu, and CNCu/TCu ratio interpolations are shown in Table 14-11 and other estimation parameters are summarized in Table 14-12.
Table 14-11: Search Ellipse Orientations
| Total Copper and Fracture Intensity | Major Bearing | Plunge | Tilt |
Inside Structural Domains: All Rock Types |
005° | 0° | -85° |
| 025° | 0° | -80° | |
| 045° | 0° | -65° | |
| 090° | 0° | -90° | |
| 145° | 0° | -50° | |
| 165° | 0° | -35° | |
| 340° | 0° | -25° | |
| 345° | 0° | -70° | |
| Outside Structural Domains: Paleozoic + Precambrian Units | 340° | 0° | -35° |
| Outside Structural Domains: Texas Canyon Quartz Monzonite | 0° | 0° | 0° |
| Acid-Soluble to Total-Copper Ratio | Major Bearing | Plunge | Tilt |
| All Domains | 0° | 0° | 0° |
| M3-PN210313.007 31 March 2026 Revision 0 | 151 |
GUNNISON PROJECT Form 43-101F1 Technical Report |
Table 14-12: Estimation Parameters
| Total Copper – All Units Except Quartz Monzonite | ||||||
|
Estimation Pass |
Search Ranges (ft) | Composite Constraints | ||||
| Major | S-Major | Minor | Min | Max | Max/hole | |
| 1 | 300 | 300 | 100 | 3 | 12 | 3 |
| 2 | 700 | 700 | 233 | 3 | 12 | 3 |
| 3 | 2000 | 2000 | 667 | 1 | 12 | 3 |
| Total Copper – Quartz Monzonite | ||||||
| 1 | 300 | 300 | 100 | 3 | 12 | 3 |
| 2 | 700 | 700 | 233 | 1 | 12 | 3 |
| Acid-Soluble to Total-Copper Ratio | ||||||
| 1 | 700 | 700 | 233 | 3 | 12 | 3 |
| 2 | 2000 | 2000 | 667 | 1 | 12 | 3 |
The estimation passes were performed independently for each of the TCu mineral domains, so only composites coded to a particular domain were used to estimate grade into blocks coded by that domain.
Inverse-distance to the third power (ID3) and ordinary kriging estimations were run for both total copper and the ASCu/TCu ratios; nearest-neighbor estimations were also completed for evaluation purposes. Ultimately, the ID3 results were selected for reporting of the Project mineral resources.
The copper sulfide (CuS) grade was calculated by taking the total copper grade and subtracting the estimated acid-soluble copper grade and estimated cyanide-soluble copper grade. The remaining value is considered the residual sulfide copper grade. However, residual copper in the oxide zone, especially near-surface, can occasionally exist in non-sulfide minerals. Because of this possibility, a factor was applied within the modeled oxide and mixed groups for elevations between 4500 and 5000 feet. To apply the factor, the residual copper grade was multiplied by 0 at 4950 to 5000 feet. For each 50 feet descending from 5000 feet, 10% was added to the multiplication factor. Table 14-13 below shows how the factor was applied. The author considers this a conservative approach to copper that is hosted in insoluble minerals near surface.
Table 14-13: Residual Sulfide Calculation
| Elevation (feet) | Residual Sulfide Formula |
| > 4,475 | Residual Sulfide =–(TCu -–ASCu - CNCu)*0 |
| 4,375 to 4,475 | Residual Sulfide =–(TCu -–ASCu - CNCu)*10% |
| 4,275 to 4,375 | Residual Sulfide =–(TCu -–ASCu - CNCu)*20% |
| 4,175 to 4,275 | Residual Sulfide =–(TCu -–ASCu - CNCu)*30% |
| 4,075 to 4,175 | Residual Sulfide =–(TCu -–ASCu - CNCu)*40% |
| 3,975 to 4,075 | Residual Sulfide =–(TCu -–ASCu - CNCu)*50% |
| 3,875 to 3,975 | Residual Sulfide =–(TCu -–ASCu - CNCu)*60% |
| 3,775 to 3,875 | Residual Sulfide =–(TCu -–ASCu - CNCu)*70% |
| 3,675 to 3,775 | Residual Sulfide =–(TCu -–ASCu - CNCu)*80% |
| 3,575 to 3,675 | Residual Sulfide =–(TCu -–ASCu - CNCu)*90% |
| M3-PN210313.007 31 March 2026 Revision 0 | 152 |
GUNNISON PROJECT Form 43-101F1 Technical Report |
| 14.5 | Density |
A total of 220 samples were taken from drill core by GCC and sent to Skyline for determinations of specific-gravity (“SG”). The samples were taken across a range of geological characteristics and spatial distribution in the deposit. The samples were analyzed using the water-displacement method.
RESPEC evaluated the SG results for use in the resource estimation and then assigned an average SG to each copper mineral domain as described in Section 14.7.5. The SG measurements were converted to tonnage factors as summarized in the Table 14-14.
Table 14-14: Average SG and Tonnage Factors by Copper Domain
| Grade Domain | SG | TF |
| Outside Domains | 2.65 | 12.1 |
| Low-Grade | 2.62 | 12.2 |
| Mid-Grade | 2.68 | 11.9 |
| High-Grade | 2.89 | 11.1 |
| 14.6 | Gunnison Deposit Mineral Resources |
The Gunnison Deposit mineral resources are reported within an optimized pit. The inputs for the pit constraint are provided in Table 14-15.
Table 14-15: Pit Constraint Inputs
| Input Parameters | Units | Value |
| Overburden Mining Cost | $/ton | 1.28 |
| Hard Rock Waste Mining Cost | $/ton | 1.95 |
| Mineralized Material Mining Cost | $/ton | 1.92 |
| Incremental Cost | $/ton/bench | 0.01 |
| Bench Discounting | % | 0 |
| Overall Pit Slope Angle for Overburden | Degrees | 42 |
| Overall Pit Slope Angle for Hardrock | Degrees | 47 |
| Overall Pit Slope Angle for Hardrock West Wall | Degrees | 36 |
| Cu Recovery Conventional Leach | ||
| Acid Soluble Cu | % | 90 |
| Cn Soluble | % | 90 |
| Sulfide Cu | % | 0 |
| Cu Recovery Sulfide Leach | ||
| Acid Soluble Cu | % | 90 |
| Cn Soluble | % | 90 |
| Sulfide Cu | % | 60 |
| M3-PN210313.007 31 March 2026 Revision 0 | 153 |
GUNNISON PROJECT Form 43-101F1 Technical Report |
| Input Parameters | Units | Value |
| Processing Costs (Conventional Leach) | ||
| Escabrosa (and stratigraphically above) | $/t mineralized material | 2.71 |
| Middle and Upper Abrigo | $/t mineralized material | 1.85 |
| Lower Abrigo, Bolsa, TQM | $/t mineralized material | 1.42 |
| Processing Costs (Sulfide Leach) | ||
| Escabrosa (and stratigraphically above) | $/t mineralized material | 3.92 |
| Middle and Upper Abrigo | $/t mineralized material | 3.85 |
| Lower Abrigo, Bolsa, TQM | $/t mineralized material | 3.42 |
| SXEW + G&A Cost | $/lb | 0.21 |
| Acid Cost | $/ton | 52.00 |
| Acid Consumption | ||
| Escabrosa (and stratigraphically above) | lb/ton | 52.9 |
| Martin | lb/ton | 52.9 |
| Upper Abrigo | lb/ton | 48 |
| Middle Abrigo | lb/ton | 48 |
| Lower Abrigo | lb/ton | 24 |
| Bolsa/TQM (and stratigraphically below) | lb/ton | 24 |
Processing costs were calculated using a “net of process” for each type of leaching. The following equations were used for each leaching type to calculate the net of process:
Net of Process Conventional Leach =
CuAS% * 20 lbs/%/ton * CuAS Recovery * ($4.3/lb Cu * (1-.0675 royalty) - $0.21/lb GA+SXEW)
+CuCN% * 20 lbs/%/ton * CuCN Recovery * ($4.3/lb Cu * (1-.045 royalty) - $0.21/lb GA+SXEW)
-$/t processing cost
Net of Process Sulfide Leach =
CuAS% * 20 lbs/%/ton * CuAS Recovery * ($4.3/lb Cu * (1-.0675 royalty) - $0.21/lb GA+SXEW)
+CuCN% * 20 lbs/%/ton * CuCN Recovery * ($4.3/lb Cu * (1-.045 royalty) - $0.21/lb GA+SXEW)
+CuSU% * 20 lbs/%/ton * CuSU Recovery * ($4.3/lb Cu * (1-.045 royalty) - $0.21/lb GA+SXEW)
-$/t processing cost
The in-pit mineralization - mineral resources are tabulated using an internal cut-off grade of 0.05% TCu for oxide and transitional mineralization and 0.1% TCu for sulfide mineralization.
No mineral resources were estimated within overburden (Tertiary/Quaternary alluvium), and the reported mineral resources are restricted to lands controlled by GCC.
| M3-PN210313.007 31 March 2026 Revision 0 | 154 |
GUNNISON PROJECT Form 43-101F1 Technical Report |
The Gunnison Deposit TCu resources are listed in Table 14-16.
Table 14-16: Gunnison Deposit Total – Copper Resources
| In-Pit Mineralization - Oxide Resources | |||
|
Resource Class |
Short Tons (millions) | Total Cu (%) | Cu Pounds (millions) |
| Measured | 155.9 | 0.39 | 1,201 |
| Indicated | 476.0 | 0.29 | 2,726 |
| Measured + Indicated | 631.9 | 0.31 | 3,927 |
| Inferred | 76.0 | 0.20 | 300 |
| In-Pit Mineralization - Transitional Resources | |||
|
Resource Class |
Short Tons (millions) | Total Cu (%) | Cu Pounds (millions) |
| Measured | 32.2 | 0.32 | 203 |
| Indicated | 116.1 | 0.28 | 655 |
| Measured + Indicated | 148.3 | 0.29 | 858 |
| Inferred | 11.6 | 0.22 | 50.8 |
| In-Pit Mineralization - Sulfide Resources | |||
|
Resource Class |
Short Tons (millions) | Total Cu (%) | Cu Pounds (millions) |
| Measured | 3.5 | 0.27 | 19 |
| Indicated | 62.5 | 0.31 | 386 |
| Measured + Indicated | 65.9 | 0.31 | 405 |
| Inferred | 6.3 | 0.36 | 46 |
Notes:
| 1. | Mineral Resources that are not Mineral Reserves do not have demonstrated economic viability. | |
| 2. | Mineral Resources are reported within an optimized pit at a 0.05% total copper cut-off for oxide and transition material, and 0.1% cut-off for sulfide. | |
| 3. | Rounding may result in apparent discrepancies between tons, grade, and metal content. | |
| 4. | The Effective Date of the Mineral Resource estimate is January 23, 2026. |
The Gunnison Deposit resources are classified on the basis of a combination of: (i) a minimum number of composites used to interpolate TCu grades into a block; (ii) the number of holes from which the composites are derived; and (iii) the distance of the composites to the block (Table 14-17).
Table 14-17: Gunnison Deposit Classification Parameters
|
Class |
Min. Number of Composites |
Additional Constraints |
| Measured | 2 | Minimum of 2 holes within an average distance of 200 feet from the block |
| Indicated | 2 | Minimum of 2 holes within an average distance of 400 feet from the block |
| Inferred | all other estimated blocks | |
| M3-PN210313.007 31 March 2026 Revision 0 | 155 |
GUNNISON PROJECT Form 43-101F1 Technical Report |
When evaluating the results produced by the classification criteria, it became apparent that a small, isolated zone of blocks classified as Inferred occurred within a mass of Indicated blocks near the southern limit of the well-drilled portion of the deposit. This Inferred material created a classification discontinuity in the deposit, where confidence in the modeling is high, and the classification was therefore changed to Indicated. This change resulted in an increase of one percent of the mineral resource tonnes classified as Indicated.
Table 14-18: Combined Oxide, Transitional, and Sulfide Resources
| Total Resources (Oxide + Transitional + Sulfide) | |||
|
Resource Class |
Short Tons (millions) | Total
Cu (%) |
Cu Pounds (millions) |
| Measured | 191.5 | 0.37 | 1,423 |
| Indicated | 654.5 | 0.31 | 3,768 |
| Measured + Indicated | 846.1 | 0.33 | 5,190 |
| Inferred | 94.0 | 0.21 | 397 |
Notes:
| 1. | Mineral Resources that are not Mineral Reserves do not have demonstrated economic viability. | |
| 2. | Mineral Resources are reported within an optimized pit at a 0.05% total copper cut-off for oxide and transition material, and 0.1% cut-off for sulfide. | |
| 3. | Rounding may result in apparent discrepancies between tons, grade, and contained metal content. | |
| 4. | The Effective Date of the Mineral Resource estimate is January 23, 2026. |
The average ASCu/TCu ratio of the combined mineral resources is 0.62. The average CNCu/TCu ratio of the combined mineral resources is 0.04.
The estimate of mineral resources may be materially affected by geology, environmental, permitting, legal, title, taxation, sociopolitical, marketing, or other relevant issues. Potential risk factors include changes in metal prices, increases in operating costs, fluctuations in labour costs and availability, availability of investment capital, infrastructure failures, changes in government regulations, community engagement and socio-economic community relations, civil disobedience and protest, permitting and legal challenges, and general environmental concerns. However, the author is not aware of any such factors that may materially affect the Gunnison Deposit mineral resources as of the date of this technical report. The impact of taxation was taken into consideration when establishing cut-off grade.
Figure 14-7 and Figure 14-8 show cross section of the block model that correspond to the mineral-domain cross sections presented above.
| M3-PN210313.007 31 March 2026 Revision 0 | 156 |
GUNNISON PROJECT Form 43-101F1 Technical Report |
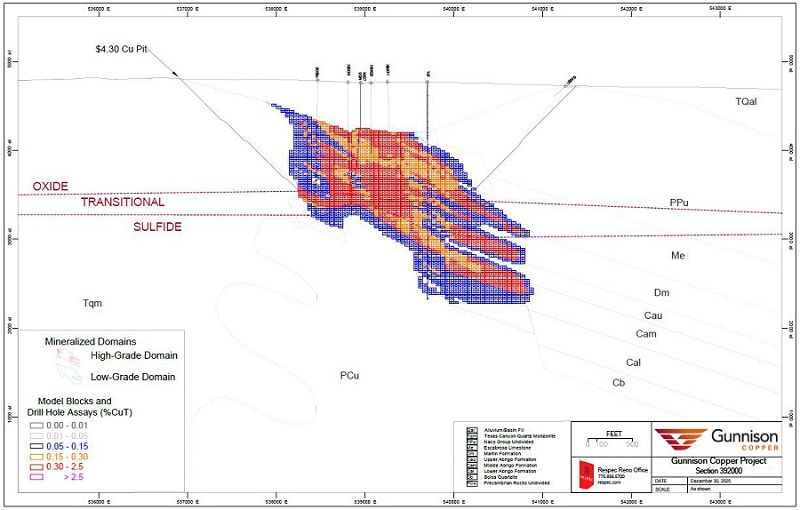
Figure 14-7: Gunnison Cross Section 392000 Showing Block Model Copper Grades
| M3-PN210313.007 31 March 2026 Revision 0 | 157 |
GUNNISON PROJECT Form 43-101F1 Technical Report |
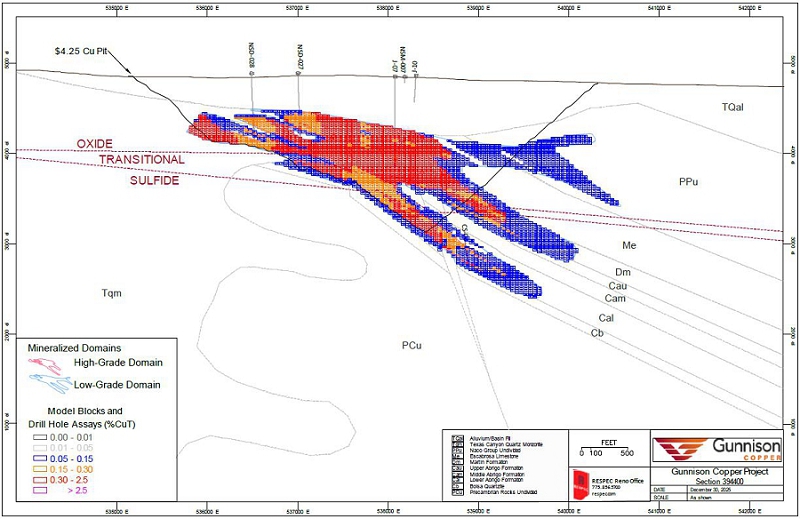
Figure 14-8: Gunnison Cross Section 394400N Showing Block Model Copper Grades
| M3-PN210313.007 31 March 2026 Revision 0 | 158 |
GUNNISON PROJECT Form 43-101F1 Technical Report |
| 14.6.1 | Copper Block Model Checks |
Volumes derived from the sectional mineral-domain modeling were compared to the coded block-model volumes to assure close agreement, and all block-model coding described herein was checked visually. The inverse-distance results, from which the reported Project mineral resources are tabulated, were compared to those from: (i) a polygonal estimate based on the cross-sectional interpretations; and (ii) the nearest-neighbor and ordinary kriging estimates of the modeled mineral resources, all at 0 cut-off grade. The ID3, ordinary kriging, and nearest-neighbor grades are identical, and the polygonal tons and grade are as expected. Various grade-distribution plots of assays, composites, and nearest-neighbor, ordinary kriging, and ID3 block grades were evaluated as a check on both the global and local estimation results, with no anomalous relationships. Finally, the ID3 grades were visually compared to the drillhole assay data to assure that reasonable results were obtained.
| 14.6.2 | Comments on the Resource Block Model Estimates |
Inferred mineral resources totaling 79.6 million tons at a grade of 0.20% TCu within the current constrained pit could be converted into M&I categories with additional drilling. RESPEC notes that mineralization is generally open in most directions from the deposit, except for the western margin where the largely barren Texas Canyon quartz monzonite is located.
A subsequent estimate of the Gunnison Deposit mineral resources could be improved with the incorporation of additional geologic input into the modeling. Specifically, the modeling of the western extremities of the deposit could be improved where the large mass of mineralization that typifies the central-core portion of the deposit breaks up into lenses that follow favorable stratigraphic horizons. The correlations of some of these ‘arms’ of mineralization with specific stratigraphic units might be improved with additional drill data and further review and consideration. Also, drilling to accomplish tighter spatial control on geologic structures would refine the current understanding of structural controls on favorable geologic hosts, mineralization, and oxidation.
Re-blocking of the 50 x 100 x 25 ft model blocks to a larger size could easily be accomplished, if this was deemed appropriate to properly represent a bulk-tonnage mining operation.
GCC reported net in-situ copper production in 2021 of 385,238 pounds of copper. This production represents less than 1% of the total pounds of copper in the measured and indicated mineral resources of the Project, and therefore it was not removed from the current Project’s mineral resources.
The Mineral Resources presented herein are inclusive of the Economic Analysis presented in Section 22 which therefore represents a subset of the Mineral Resources under slightly different economic inputs, most notably lower copper price. However, all Mineral Resources presented in this section have a reasonable prospect of economic extraction based on the Qualified Persons assessment of the long term copper price and economic conditions.
| 14.7 | Strong & Harris Deposit Mineral Resources |
| 14.7.1 | Data |
The Strong & Harris copper, zinc, and silver resources were modeled and estimated using information provided by GCC in the database constructed by RESPEC under Mr. Bickel’s supervision. The information is derived from historical core holes drilled by Cyprus Minerals, Superior Minerals, Continental Materials, Beard Mining, and AZCO. The drill hole database also includes analyses performed by GCC on the historical core. This data, as well as digital topography of the project area, were provided to RESPEC by GCC in a digital database in Arizona State Plane, East Zone coordinates in US Survey feet using the NAD27 datum.
| M3-PN210313.007 31 March 2026 Revision 0 | 159 |
GUNNISON PROJECT Form 43-101F1 Technical Report |
All modeling of the Strong & Harris digital geology, mineral domains and estimation of the mineral resources were performed using GEOVIA Surpac mining software as well as proprietary software developed at RESPEC. The Strong & Harris resource block model extents and dimensions are provided in Table 14-19.
Table 14-19: Block Model Extents and Dimensions
| In Feet | X | Y | Z |
| Min Coordinates | 531,079 | 403,549 | 2,800 |
| Max Coordinates | 540,479 | 415,149 | 5,800 |
| Block Size | 20 | 20 | 20 |
| Rotation | 0 | -45 | 0 |
| 14.7.2 | Deposit Geology Pertinent to Resource Block Model |
The copper-zinc-silver mineralization at Strong & Harris occurs primarily in Paleozoic sedimentary units. The primary controls on mineralization are (i) favorable stratigraphic units altered to various calc-silicate assemblages; (ii) a diabase sill (otherwise known as the “Peabody Sill”) and adjacent stratigraphic units; (iii) the intersection of favorable units with important structures; and (iv) oxidation of primary mineralization. Geologic factors critical to the grade domain modeling of Strong & Harris copper-zinc-silver mineralization therefore include lithology, structure, and oxidation.
| 14.7.3 | Geologic and Oxidation Models |
At GCC’s request, RESPEC constructed stratigraphic interpretations on a set of vertical, digital cross sections oriented at 045° azimuth through the Strong & Harris Deposit. These sections were spaced at 200-foot intervals over a strike extent of 10,000 feet, which covers the resource area. The stratigraphic units modeled on the cross sections include the Colina Limestone, Earp Formation, Horquilla Limestone, Black Prince Limestone, and the diabase sill. The sectional interpretations were then triangulated to create 3D surfaces or solids.
Fault surfaces were constructed using information from three sources: (i) GCC interpretations on cross sections; (ii) RESPEC interpretations on cross sections; and (iii) historical interpretations from Superior Minerals.
RESPEC also interpreted oxidation domains on the cross sections using logging data and the ratio of soluble copper assays to total copper assays. The mineralization was assigned to oxide, transition, or sulfide material types (domains). In general, if the ratio CuOx/Cu was greater than or equal to 60%, the mineralization was assigned to the oxide domain. If the ratio ranged between 25% and 60%, the mineralization was assigned to the transition material. Mineralization with a ratio of less than 25% soluble copper was assigned to the sulfide domain. These oxidation ratio rules were modified as needed with geological context. The cross-sectional oxidation domains were then triangulated into 3D surfaces.
| 14.7.4 | Density |
A total of 220 samples were taken from drill core by GCC and sent to Skyline for determinations of specific-gravity (“SG”). The samples were taken across a range of geological characteristics and spatial distribution in the deposit. The samples were analyzed using the water-displacement method.
RESPEC evaluated the SG results for use in the resource estimation and then assigned an average SG to each copper mineral domain as described in Section 14.7.5. The SG measurements were converted to tonnage factors as summarized in the Table 14-20.
| M3-PN210313.007 31 March 2026 Revision 0 | 160 |
GUNNISON PROJECT Form 43-101F1 Technical Report |
Table 14-20: Average SG and Tonnage Factors by Copper Domain
| Grade Domain | SG | TF |
| Outside Domains | 2.65 | 12.1 |
| Low-Grade | 2.62 | 12.2 |
| Mid-Grade | 2.68 | 11.9 |
| High-Grade | 2.89 | 11.1 |
| 14.7.5 | Mineral Domain Modeling |
A mineral domain encompasses a volume of rock that is ideally characterized by a single, natural population of metal grades that occurs within a specific geologic environment. Mineral domains were modeled by RESPEC to respect the lithologic, structural, and oxidation interpretations of the deposit. Following statistical evaluation of the drillhole data, mineral domains were modeled on cross sections for each metal. Low-, mid-, and high-grade domains were modeled for copper and zinc, and were numbered 100, 200, and 300, respectively, for each of the two metals. Material outside the 100, 200, and 300 domains was assigned to the 0 domain. These grade domains were based on assay data populations. Low-and high-grade domains were modeled for silver (numbered 100 and 200). Soluble-copper domains were not explicitly modeled; instead, the soluble-copper to total-copper ratio was used in the block model to calculate the grade for soluble copper, described in detail below.
| 14.7.5.1 | Copper, Zinc, and Silver Domain Modeling |
In order to define the mineral domains at Strong & Harris, the natural populations of copper, zinc, and silver grades were identified on separate population-distribution graphs for all drillhole samples in the deposit area. The analysis led to identification of distinct populations. Ideally each of these populations can be correlated with geologic characteristics which then can be used in conjunction with the grade populations to interpret the bounds of each of the mineral domains. The approximate grade ranges of the domains are listed in Table 14-21 for each metal.
Table 14-21: Grade Domain Ranges
| Domain | Copper % |
| 100 | ~0.04 to ~0.4 |
| 200 | ~0.4 to 2.0 |
| 300 | > ~2.0 |
| Domain | Zinc % |
| 100 | ~0.04 to ~0.5 |
| 200 | ~0.5 to 2.5 |
| 300 | > ~2.5 |
| Domain | Silver oz/ton |
| 100 | ~0.06 to ~0.2 |
| 200 | > ~0.2 |
Using these grade populations in conjunction with lithologic and structural interpretations, grade domains were independently modeled for each metal within the Strong & Harris Deposit by interpreting mineral domain polygons on a set of 200ft-spaced cross sections oriented along the approximate direction of dip (045° azimuth). While each metal was explicitly interpreted on every cross section, copper, zinc, and silver are generally spatially coincident throughout the deposit. Representative cross sections showing the copper, zinc, and silver mineral domains are shown in Figure 14-9.
| M3-PN210313.007 31 March 2026 Revision 0 | 161 |
GUNNISON PROJECT Form 43-101F1 Technical Report |
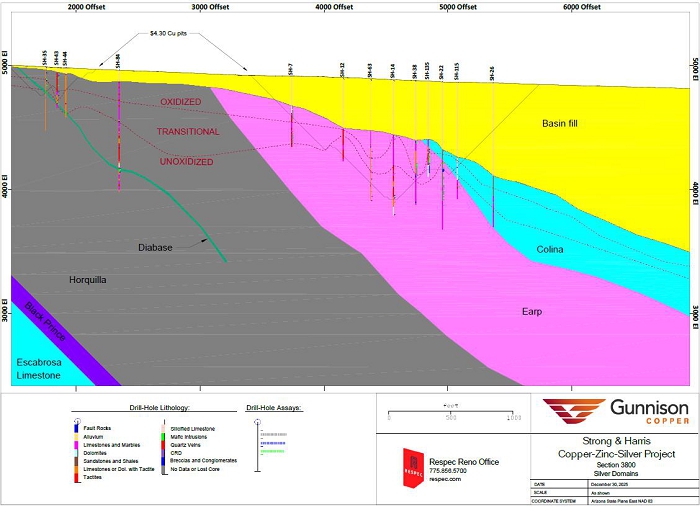
Figure 14-9: Cross Section 3800 Showing Strong & Harris Geologic Model
| M3-PN210313.007 31 March 2026 Revision 0 | 162 |
GUNNISON PROJECT Form 43-101F1 Technical Report |
| 14.7.5.2 | Soluble-Copper Ratio |
There are two methods for estimating soluble copper: directly, using composites of the soluble-copper analyses from the database; or indirectly, by estimating the soluble-copper to total-copper ratios (“Cu Ratio”). In the latter case, the ratios are determined for each drill interval that has both soluble- and total-copper analyses, and these ratios are then coded, composited, and used to estimate the ratios into the model blocks. The estimated soluble-copper model values are then derived by multiplying the estimated ratio by the estimated copper value in each block.
Remobilization of supergene copper is not evident at Strong & Harris. This is likely due to the remnant carbonate minerals in the host units that would have restricted the movement of acidic solutions during oxidation. In the Strong & Harris Deposit, the ratios are generally uniform within each of the modeled oxidation zones despite some internal variability that is likely stratigraphically controlled.
The estimation of ratios for soluble copper can negate possible biases created by intervals that were selectively analyzed for total copper but not soluble copper. In the Strong & Harris database, 3% of the total copper samples do not have soluble copper analyses.
RESPEC used estimated ratios to code the Strong & Harris block model with soluble copper values. The ratio estimation was confined to blocks with estimated total copper values. The ratios of the blocks coded to the oxide, transitional, and sulfide zones were estimated independently.
| 14.7.6 | Assay Coding, Capping, and Compositing |
The cross-sectional mineral-domain polygons described in Section 14.6 were used to code drillhole assay intervals to their respective mineral domains for copper, zinc, and silver. The polygons were coded 100 feet either side of the section plane from which they were created. Soluble copper ratios were coded to the oxide, transitional, and sulfide domains using the oxidation surfaces. Assay caps were determined by domain to identify high-grade outliers that might be appropriate for capping. Visual reviews of the spatial relationships concerning possible outliers and their potential impacts during grade interpolation were also considered in the assay cap definitions. Table 14-22 provides the caps used by each domain for each metal.
| M3-PN210313.007 31 March 2026 Revision 0 | 163 |
GUNNISON PROJECT Form 43-101F1 Technical Report |
Table 14-22: Grade Caps
| Copper | Cap (% Cu) |
| 0 | 0.2 |
| 100 | 1 |
| 200 | 4 |
| 300 | 20 |
| Zinc | Cap (% Zn) |
| 0 | 0.2 |
| 100 | 1.3 |
| 200 | 5 |
| 300 | 17 |
| Silver | Cap (oz/ton Ag) |
| 0 | 0.1 |
| 100 | 0.6 |
| 200 | 2 |
| CuOx Ratio | Cap (Ratio) |
| 0 | 1 |
| 100 | 1 |
| 200 | 1 |
| 300 | 1 |
Descriptive statistics of the coded assays of capped and uncapped copper, zinc, and silver analyses are provided in Table 14-23, Table 14-24, and Table 14-25. Copper ratio statistics are provided in Table 14-26, Table 14-27, and Table 14-28.
Table 14-23: Coded Copper Assay Statistics
| Domain | Assays | Count | Mean (%Cu) |
Median (%Cu) |
Std. Dev. | CV | Min. (%Cu) |
Max. (%Cu) |
| 0 | Cu | 1160 | 0.02 | 0.01 | 0.05 | 2.8 | 0 | 4.45 |
| Cu Cap | 1160 | 0.02 | 0.01 | 0.02 | 1.35 | 0 | 0.2 | |
| 100 | Cu | 1411 | 0.14 | 0.11 | 0.11 | 0.81 | 0.005 | 2.16 |
| Cu Cap | 1411 | 0.14 | 0.11 | 0.11 | 0.79 | 0.005 | 1 | |
| 200 | Cu | 807 | 0.71 | 0.61 | 0.51 | 0.71 | 0.01 | 14.6 |
| Cu Cap | 807 | 0.71 | 0.61 | 0.47 | 0.67 | 0.01 | 4 | |
| 300 | Cu | 116 | 3.78 | 2.75 | 3.37 | 0.89 | 0.02 | 22.5 |
| Cu Cap | 116 | 3.76 | 2.75 | 3.27 | 0.87 | 0.02 | 20 | |
| 100+200+300 | Cu | 2334 | 0.46 | 0.19 | 1.01 | 2.19 | 0.005 | 22.5 |
| Cu Cap | 2334 | 0.46 | 0.19 | 0.99 | 2.15 | 0.005 | 20 |
| M3-PN210313.007 31 March 2026 Revision 0 | 164 |
GUNNISON PROJECT Form 43-101F1 Technical Report |
Table 14-24: Coded Zinc Assay Statistics
| Domain | Assays | Count | Mean (%Zn) |
Median (%Zn) |
Std. Dev. | CV | Min. (%Zn) |
Max. (%Zn) |
| 0 | Zn | 1044 | 0.02 | 0.01 | 0.02 | 1.12 | 0.0009 | 0.41 |
| Zn Cap | 1044 | 0.02 | 0.01 | 0.02 | 0.98 | 0.0009 | 0.2 | |
| 100 | Zn | 1552 | 0.15 | 0.10 | 0.13 | 0.82 | 0 | 0.65 |
| Zn Cap | 1552 | 0.15 | 0.10 | 0.13 | 0.82 | 0 | 0.65 | |
| 200 | Zn | 650 | 0.89 | 0.78 | 0.52 | 0.58 | 0 | 2.49 |
| Zn Cap | 650 | 0.89 | 0.78 | 0.52 | 0.58 | 0 | 2.49 | |
| 300 | Zn | 123 | 5.66 | 4.05 | 4.27 | 0.75 | 0.09 | 18 |
| Zn Cap | 123 | 5.65 | 4.05 | 4.23 | 0.75 | 0.09 | 17 | |
| 100+200+300 | Zn | 2325 | 0.56 | 0.19 | 1.39 | 2.47 | 0 | 18 |
| Zn Cap | 2325 | 0.56 | 0.19 | 1.39 | 2.46 | 0 | 17 |
Table 14-25: Coded Silver Assay Statistics
| Domain | Assays | Count | Mean (oz/ton) |
Median (oz/ton) |
Std. Dev. | CV | Min. (oz/ton) |
Max. (oz/ton) |
| 0 | Ag | 674 | 0.05 | 0.05 | 0.01 | 0.16 | 0 | 0.18 |
| Ag Cap | 674 | 0.05 | 0.05 | 0.01 | 0.14 | 0 | 0.1 | |
100 |
Ag Ag Cap |
439 439 |
0.13 0.13 |
0.14 0.14 |
0.05 0.05 |
0.38 0.38 |
0.001 0.001 |
0.42 0.42 |
200 |
Ag Ag Cap |
271 271 |
0.34 0.33 |
0.26 0.26 |
0.38 0.24 |
1.14 0.73 |
0.001 0.001 |
7.6 2 |
| 100+200+300 | Ag | 710 | 0.21 | 0.17 | 0.26 | 1.25 | 0.001 | 7.6 |
| Ag Cap | 710 | 0.20 | 0.17 | 0.18 | 0.88 | 0.001 | 2 |
Table 14-26: Coded Cu Ratio Statistics in Oxide Material
| Domain | Assays | Count | Mean (Ratio) |
Median (Ratio) |
Std. Dev. | CV | Min. (Ratio) |
Max. (Ratio) |
| 0 | Cu Ratio | 172 | 0.76 | 1.00 | 0.26 | 0.34 | 0.25 | 1 |
| Cu Ratio Cap | 172 | 0.76 | 1.00 | 0.26 | 0.34 | 0.25 | 1 | |
| 100 | Cu Ratio | 410 | 0.79 | 0.82 | 0.18 | 0.23 | 0 | 1.2 |
| Cu Ratio Cap | 410 | 0.79 | 0.82 | 0.18 | 0.23 | 0 | 1 | |
| 200 | Cu Ratio | 246 | 0.86 | 0.91 | 0.18 | 0.21 | 0.02 | 1 |
| Cu Ratio Cap | 246 | 0.86 | 0.91 | 0.18 | 0.21 | 0.02 | 1 | |
| 300 | Cu Ratio | 41 | 0.92 | 0.98 | 0.16 | 0.18 | 0.1 | 1 |
| Cu Ratio Cap | 41 | 0.92 | 0.98 | 0.16 | 0.18 | 0.1 | 1 | |
| 100+200+300 | Cu Ratio | 697 | 0.82 | 0.87 | 0.18 | 0.22 | 0 | 1.2 |
| Cu Ratio Cap | 697 | 0.81 | 0.87 | 0.18 | 0.22 | 0 | 1 |
| M3-PN210313.007 31 March 2026 Revision 0 | 165 |
GUNNISON PROJECT Form 43-101F1 Technical Report |
Table 14-27: Coded Cu Ratio Statistics in Transition Material
| Domain | Assays | Count | Mean (Ratio) |
Median (Ratio) |
Std. Dev. | CV | Min. (Ratio) |
Max. (Ratio) | |
| 0 | Cu Ratio | 438 | 0.67 | 0.50 | 0.27 | 0.41 | 0 | 1 | |
| Cu Ratio Cap | 438 | 0.67 | 0.50 | 0.27 | 0.41 | 0 | 1 | ||
| 100 | Cu Ratio | 591 | 0.58 | 0.57 | 0.25 | 0.43 | 0 | 1 | |
| Cu Ratio Cap | 591 | 0.58 | 0.57 | 0.25 | 0.43 | 0 | 1 | ||
| 200 | Cu Ratio | 363 | 0.52 | 0.50 | 0.32 | 0.62 | 0 | 1 | |
| Cu Ratio Cap | 363 | 0.52 | 0.50 | 0.32 | 0.62 | 0 | 1 | ||
| 300 | Cu Ratio | 47 | 0.45 | 0.37 | 0.38 | 0.85 | 0 | 1 | |
| Cu Ratio Cap | 47 | 0.45 | 0.37 | 0.38 | 0.85 | 0 | 1 | ||
| 100+200+300 | Cu Ratio | 1001 | 0.55 | 0.55 | 0.28 | 0.51 | 0 | 1 | |
| Cu Ratio Cap | 1001 | 0.55 | 0.55 | 0.28 | 0.51 | 0 | 1 | ||
Table 14-28: Coded Cu Ratio Statistics in Sulfide Material
| Domain | Assays | Count | Mean (Ratio) |
Median (Ratio) |
Std. Dev. | CV | Min. (Ratio) |
Max. (Ratio) | |
| 0 | Cu Ratio | 510 | 0.65 | 0.50 | 0.32 | 0.49 | 0 | 1 | |
| Cu Ratio Cap | 510 | 0.65 | 0.50 | 0.32 | 0.49 | 0 | 1 | ||
| 100 | Cu Ratio | 365 | 0.32 | 0.20 | 0.29 | 0.9 | 0 | 1 | |
| Cu Ratio Cap | 365 | 0.32 | 0.20 | 0.29 | 0.9 | 0 | 1 | ||
| 200 | Cu Ratio | 166 | 0.17 | 0.09 | 0.22 | 1.23 | 0 | 0.97 | |
| Cu Ratio Cap | 166 | 0.17 | 0.09 | 0.22 | 1.23 | 0 | 0.97 | ||
| 300 | Cu Ratio | 27 | 0.12 | 0.08 | 0.17 | 1.47 | 0 | 0.96 | |
| Cu Ratio Cap | 27 | 0.12 | 0.08 | 0.17 | 1.47 | 0 | 0.96 | ||
| 100+200+300 | Cu Ratio | 558 | 0.27 | 0.17 | 0.28 | 1.01 | 0 | 1 | |
| Cu Ratio Cap | 558 | 0.27 | 0.17 | 0.28 | 1.01 | 0 | 1 | ||
The capped assays were composited at 10-foot down-hole intervals, respecting the mineral domain boundaries. Descriptive statistics of the composites for each metal are given in Table 14-29.
| M3-PN210313.007 31 March 2026 Revision 0 | 166 |
GUNNISON PROJECT Form 43-101F1 Technical Report |
Table 14-29: Composite Statistics
| Cu Composites by Domain | ||||||||
| Domain | Hole Count | Comp. Count | Mean | Median | Std. Dev. | CV | Min. | Max. |
| 0 | 111 | 1205 | 0.02 | 0.01 | 0.02 | 1.35 | 0.00 | 0.20 |
| 100 | 122 | 1416 | 0.14 | 0.11 | 0.10 | 0.73 | 0.01 | 0.82 |
| 200 | 109 | 741 | 0.71 | 0.61 | 0.43 | 0.60 | 0.01 | 4.00 |
| 300 | 50 | 99 | 3.76 | 2.90 | 2.68 | 0.71 | 0.37 | 16.03 |
| all | 126 | 2256 | 0.46 | 0.20 | 0.91 | 1.98 | 0.01 | 16.03 |
| Zn Composites by Domain | ||||||||
| Domain | Hole Count | Comp. Count | Mean | Median | Std. Dev. | CV | Min. | Max. |
| 0 | 106 | 1073 | 0.02 | 0.01 | 0.02 | 0.97 | 0.00 | 0.20 |
| 100 | 118 | 1578 | 0.15 | 0.11 | 0.12 | 0.79 | 0.00 | 0.65 |
| 200 | 111 | 655 | 0.89 | 0.79 | 0.48 | 0.54 | 0.01 | 2.49 |
| 300 | 58 | 111 | 5.65 | 4.00 | 3.95 | 0.70 | 0.09 | 17.00 |
| all | 123 | 2344 | 0.56 | 0.20 | 1.35 | 2.39 | 0.00 | 17.00 |
| Ag Composites by Domain | ||||||||
| Domain | Hole Count | Comp. Count | Mean | Median | Std. Dev. | CV | Min. | Max. |
| 0 | 60 | 662 | 0.05 | 0.05 | 0.01 | 0.14 | 0.00 | 0.10 |
| 100 | 83 | 654 | 0.13 | 0.14 | 0.05 | 0.36 | 0.00 | 0.42 |
| 200 | 74 | 385 | 0.33 | 0.26 | 0.21 | 0.64 | 0.05 | 2.00 |
| all | 99 | 1039 | 0.20 | 0.17 | 0.16 | 0.81 | 0.00 | 2.00 |
| Cu Ratio Composites by Domain and Oxidation Zone | ||||||||
| Oxide | ||||||||
| Domain | Hole Count | Comp. Count | Mean | Median | Std. Dev. | CV | Min. | Max. |
| 0 | 58 | 200 | 0.76 | 0.97 | 0.26 | 0.34 | 0.25 | 1.00 |
| 100 | 79 | 419 | 0.79 | 0.81 | 0.18 | 0.22 | 0.00 | 1.00 |
| 200 | 64 | 247 | 0.86 | 0.91 | 0.17 | 0.20 | 0.02 | 1.00 |
| 300 | 19 | 33 | 0.92 | 0.96 | 0.15 | 0.17 | 0.10 | 1.00 |
| all | 90 | 699 | 0.81 | 0.87 | 0.18 | 0.22 | 0.00 | 1.00 |
| Transition | ||||||||
| Domain | Hole Count | Comp. Count | Mean | Median | Std. Dev. | CV | Min. | Max. |
| 0 | 77 | 453 | 0.67 | 0.50 | 0.27 | 0.41 | 0.00 | 1.00 |
| 100 | 99 | 589 | 0.58 | 0.57 | 0.24 | 0.41 | 0.00 | 1.00 |
| 200 | 70 | 331 | 0.52 | 0.51 | 0.30 | 0.58 | 0.00 | 1.00 |
| 300 | 22 | 42 | 0.45 | 0.39 | 0.34 | 0.75 | 0.00 | 0.98 |
| all | 104 | 962 | 0.55 | 0.54 | 0.27 | 0.48 | 0.00 | 1.00 |
| Sulfide | ||||||||
| Domain | Hole Count | Comp. Count | Mean | Median | Std. Dev. | CV | Min. | Max. |
| 0 | 65 | 522 | 0.65 | 0.50 | 0.32 | 0.49 | 0.00 | 1.00 |
| 100 | 57 | 373 | 0.32 | 0.20 | 0.28 | 0.88 | 0.00 | 1.00 |
| 200 | 42 | 156 | 0.17 | 0.10 | 0.21 | 1.18 | 0.01 | 0.96 |
| 300 | 16 | 24 | 0.12 | 0.08 | 0.16 | 1.37 | 0.00 | 0.96 |
| all | 62 | 553 | 0.27 | 0.17 | 0.27 | 0.99 | 0.00 | 1.00 |
| M3-PN210313.007 31 March 2026 Revision 0 | 167 |
GUNNISON PROJECT Form 43-101F1 Technical Report |
| 14.7.7 | Block Model Coding |
The 200-foot-spaced cross-sectional mineral-domain polygons were used to code 20 x 20 x 20 (x, y, z)-foot blocks that comprise a digital model rotated to a bearing of 315°. The percentage volume of each mineral domain, as coded directly by the cross-sections, is stored within each block as a “partial percentage”, as is the partial percentage of the block that lies outside of the modeled metal domains (domain 0). In other words, each block stores the partial percentage of each of the four domains for each modeled metal.
The Strong & Harris lithologic surfaces and solids were used to code each block to a single lithology on a ‘majority wins’ basis. The Strong & Harris digital topographic surface was used to code the block model on a partial percentage basis. The specific gravity values shown in Table 14-14 were assigned to the model blocks based on the copper mineral domain codes in each model block.
The mineralization has a variety of orientations. Wireframe solids were therefore created to encompass model areas with similar mineral domain orientations, and the solids were used to code the model blocks to these areas on a block-in/block-out basis. This coding was then used to control search-ellipse orientations during copper, zinc, and silver-grade interpolations. The orientations given in Table 14-30 were applied to all domains for each metal.
Table 14-30: Estimation Area Orientations
| Area | Bearing | Plunge | Tilt |
| 1 | 315 | 0 | -35 |
| 2 | 315 | 0 | 0 |
| 3 | 315 | 0 | -20 |
| 14.7.8 | Grade Interpolation |
Copper, zinc, and silver grades, as well as soluble copper ratios, were interpolated using inverse distance, ordinary kriging, and nearest-neighbor methods. The mineral resources reported herein were estimated by inverse distance interpolation as this method led to results that most appropriately respected the drill data and geology of the deposit. This is particularly true with respect to the estimation of the lowest-grade areas in the model, where potential overestimation of volumes could materially impact the resource estimation at grades close to potential open-pit mining cutoffs. The nearest-neighbor estimation was completed for the purposes of statistical checking of the various estimation iterations. The parameters applied to the grade estimations at Strong & Harris are summarized in Table 14-31.
Table 14-31: Estimation Parameters
| Estimation | Search Ranges (feet) | Composite Constraints | ||||
| Pass | Major | Semi-Major | Minor | Min | Max | Max/Hole |
| Pass 1 | 650 | 650 | 325 | 2 | 15 | 3 |
| Pass 2 | 1000 | 1000 | 500 | 1 | 15 | 3 |
| Pass 3 | 1000 | 1000 | 1000 | 1 | 15 | 3 |
Grade interpolations were completed using 10-foot composites. The estimation passes were performed independently for each of the mineral domains, so that only composites coded to a particular domain were used to estimate grade into blocks coded to that domain. Blocks coded as having partial percentages of more than one domain had multiple grade interpolations, one for each domain coded into the block. The estimated grades for each of the metal domains 0, 100, 200, and 300 coded to a block were coupled with the coded partial percentages of those domains to enable the calculation of a single volume-weighted grade of each of the metal species for each block. These resource block grades are therefore diluted to the full block volumes using this methodology.
| M3-PN210313.007 31 March 2026 Revision 0 | 168 |
GUNNISON PROJECT Form 43-101F1 Technical Report |
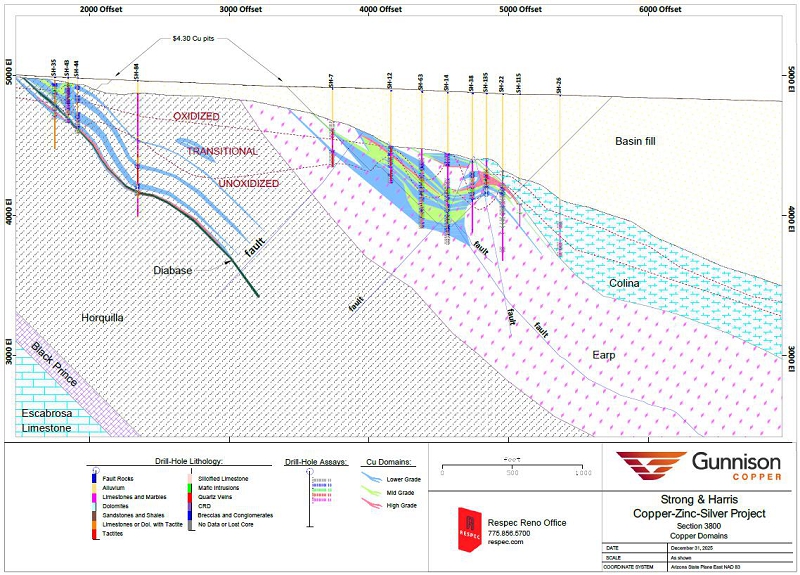
Figure 14-10: Strong & Harris Cross Section 3800 Showing Copper Mineral Domains
| M3-PN210313.007 31 March 2026 Revision 0 | 169 |
GUNNISON PROJECT Form 43-101F1 Technical Report |
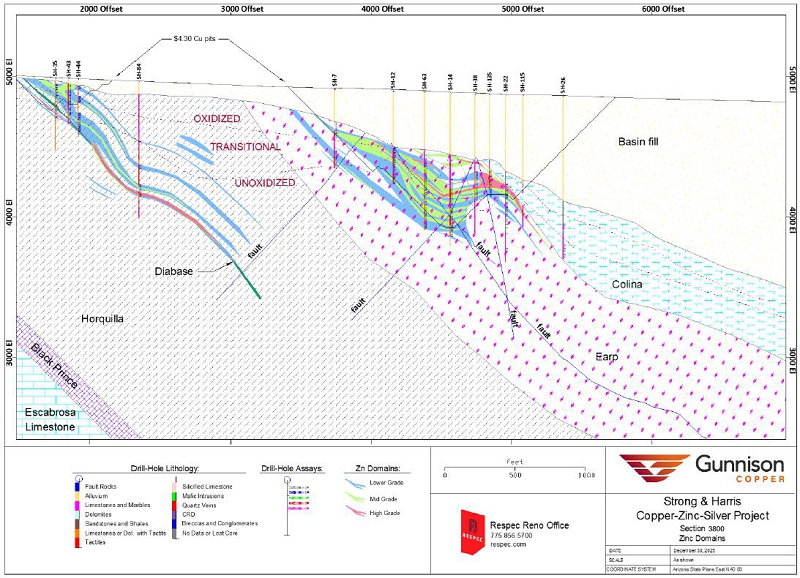
Figure 14-11: Strong & Harris Cross Section 3800 Showing Zinc Mineral Domains
| M3-PN210313.007 31 March 2026 Revision 0 | 170 |
GUNNISON PROJECT Form 43-101F1 Technical Report |
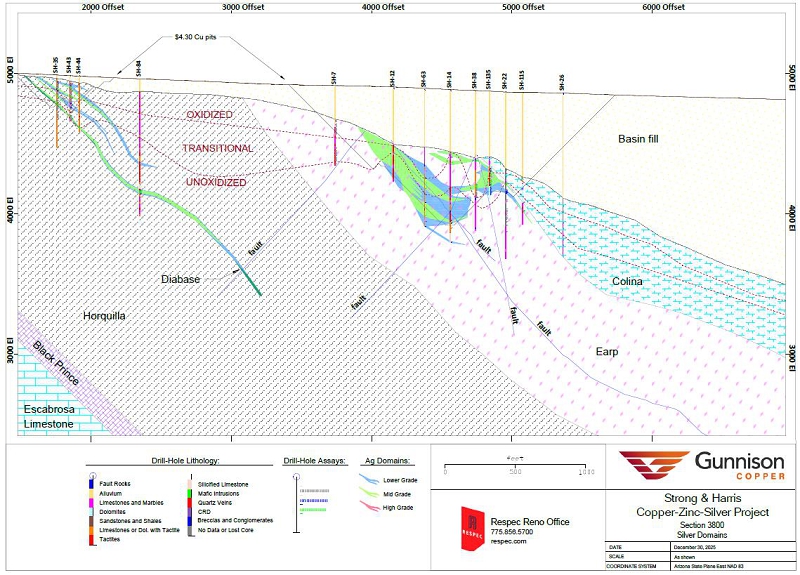
Figure 14-12: Strong & Harris Cross Section 3800 Showing Silver Mineral Domains
| M3-PN210313.007 31 March 2026 Revision 0 | 171 |
GUNNISON PROJECT Form 43-101F1 Technical Report |
| 14.7.9 | Strong & Harris Mineral Resources |
The Strong & Harris project mineral resources have been estimated to reflect potential open-pit extraction and potential processing by heap leaching or concentration (depending on oxidation zone of the mineralization). To meet the requirement of the resources having reasonable prospects for eventual economic extraction, a pit optimization was completed using the parameters summarized in Table 14-32.
Table 14-32: Pit Optimization Parameters
| Parameter | Value | Unit |
| Mining | $ 2.00 | $/ton Mined |
| Processing – Leaching | $ 5.00 | $/ton Processed |
| Processing – Floatation | $ 9.00 | $/ton Processed |
| Processing Rate | 7,2000 | 1,000s tons-per-year |
| G&A Cost per Ton | $ 0.83 | $/ton Processed |
| Cu Price | $ 4.30 | $/pound produced |
| Cu Refining Cost | $ 0.08 | $/pound produced |
| Royalty | 3% | NSR |
| Metallurgical Recoveries | Value | Unit |
| Copper Recovery Heap Leach Oxide and Transition Mineralization | 92.3% | % Rec of CuOx |
| Copper Recovery Heap Leach Oxide and Transition Mineralization | 82.3% | % Rec of Zn |
| Copper Recovery Concentrator Transition Mineralization | 80.1% | % Rev of Cu |
| Zinc Recovery Concentrator Transition Mineralization | 69.7% | % Rec of Zn |
| Copper Recovery Concentrator Sulfide Mineralization | 84.0% | % Rec of Cu |
| Zinc Recovery Concentrator Sulfide Mineralization | 89.0% | % Rec of Zn |
The pit shells created using these optimization parameters were used to constrain the project resources. The in-pit mineralization was further constrained by the application of a cutoff of 0.1% Cu to all model blocks within the optimized pits.
The Strong & Harris project resources are summarized in Table 14-33. Mineral resources that are not mineral reserves do not have demonstrated economic viability.
Table 14-33: Strong & Harris Mineral Resources
(0.07% Cu cutoff)
| Classification | Short Tons (millions) | % Cu |
% CuOx |
% Zn |
oz Ag/ton | Cu lbs (millions) | CuOx lbs (millions) | Zn lbs (millions) | Ag oz (millions) |
| Inferred | 76.070 | 0.49 | 0.32 | 0.56 | 0.12 | 740.0 | 482.691 | 855.707 | 8.971 |
| 1. | The Effective Date of the mineral resources is January 23, 2026. | |
| 2. | The project mineral resources are shown in bold and are comprised of all model blocks at a 0.07% Cu cutoff that lie within optimized resource pits. | |
| 3. | Mineral resources that are not mineral reserves do not have demonstrated economic viability. | |
| 4. | The estimate of mineral resources may be materially affected by geology, environmental, permitting, legal, title, taxation, sociopolitical, marketing, or other relevant issues. | |
| 5. | Rounding as required by reporting guidelines may result in apparent discrepancies between tons, grade, and contained metal content. |
| M3-PN210313.007 31 March 2026 Revision 0 | 172 |
GUNNISON PROJECT Form 43-101F1 Technical Report |
The Strong & Harris mineral resources are entirely classified as Inferred. This classification is based on the confidence in the underlying data which are largely historical. GCC’s 2021 sampling program verified the historical data sufficiently to warrant the Inferred classification, but additional drilling and sampling, as well as more detailed geological modeling, would be required to allow for higher classification of the project resources.
The Strong & Harris in-pit mineralization covers an aerial extent of over one mile along strike. Figure 14-13 shows the surface projections of the pit shells resulting from the resource-constraining pit optimization in the context of the deposit with section line 3800. Figure 14-14, Figure 14-15, Figure 14-16, and Figure 14-17 are representative cross sections through the block model along section line 3800.
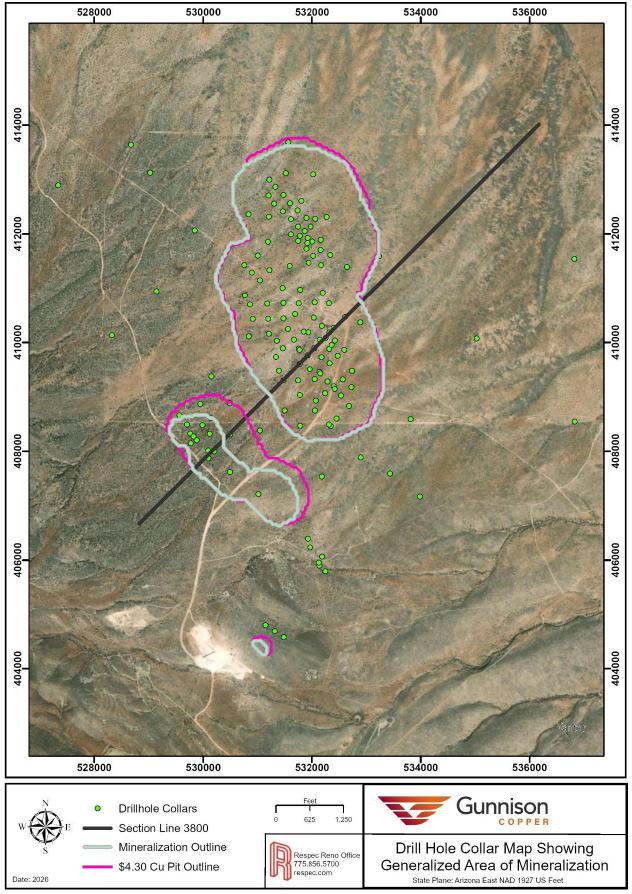
(September, 2021)
Figure 14-13: Plan Map of Strong & Harris Drilling, Mineralization and $4.30/lb Cu Pit Shells
Note: see Figure 10-1 for the location of the resource foot prints relative to the property outline.
| M3-PN210313.007 31 March 2026 Revision 0 | 173 |
GUNNISON PROJECT Form 43-101F1 Technical Report |
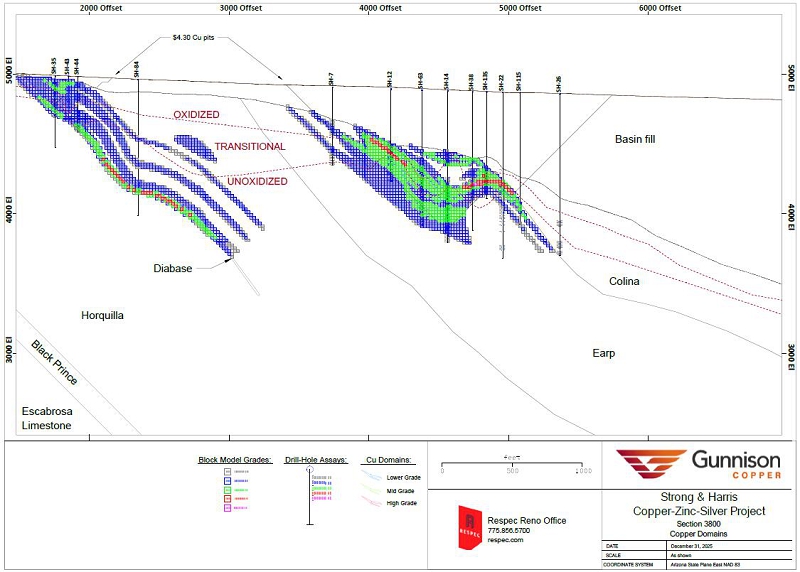
Figure 14-14: Strong & Harris Cross Section 3800 Showing Block Model Copper Grades
| M3-PN210313.007 31 March 2026 Revision 0 | 174 |
GUNNISON PROJECT Form 43-101F1 Technical Report |
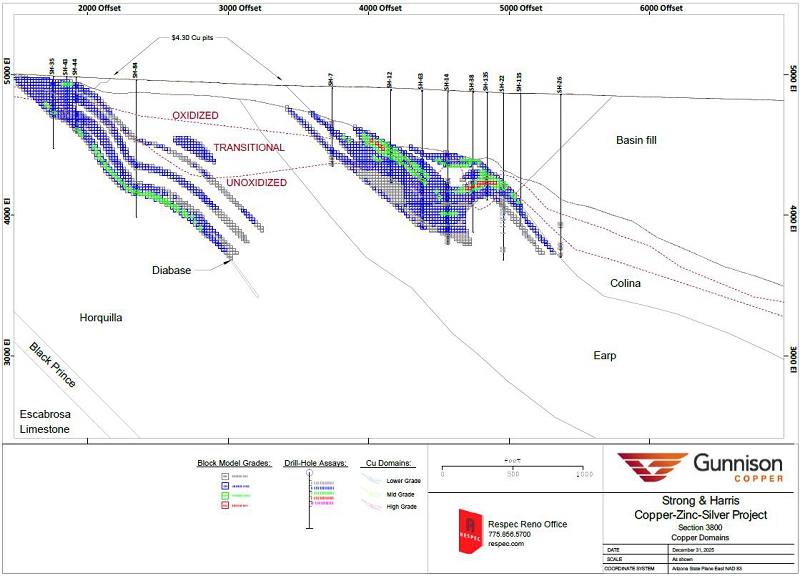
Figure 14-15: Strong & Harris Cross Section 3800 Showing Block Model Soluble Copper Grades
| M3-PN210313.007 31 March 2026 Revision 0 | 175 |
GUNNISON PROJECT Form 43-101F1 Technical Report |
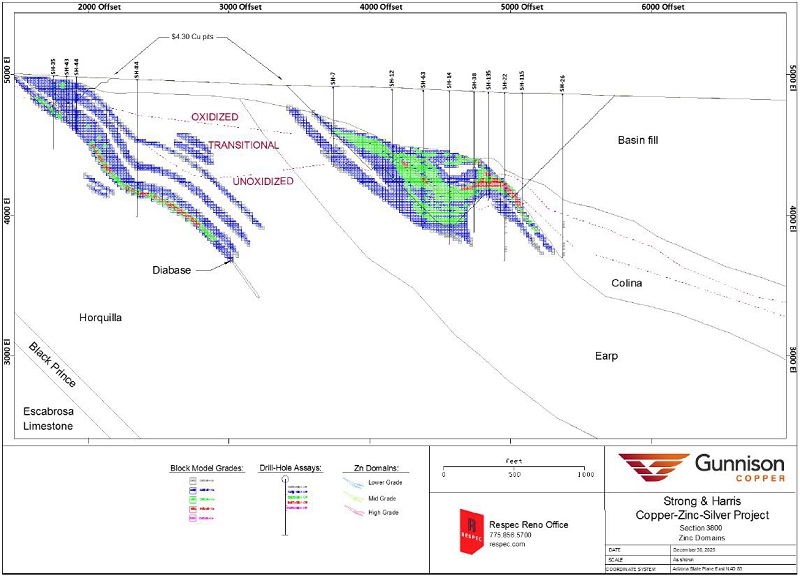
Figure 14-16: Strong & Harris Cross Section 3800 Showing Block Model Zinc Grades
| M3-PN210313.007 31 March 2026 Revision 0 | 176 |
GUNNISON PROJECT Form 43-101F1 Technical Report |
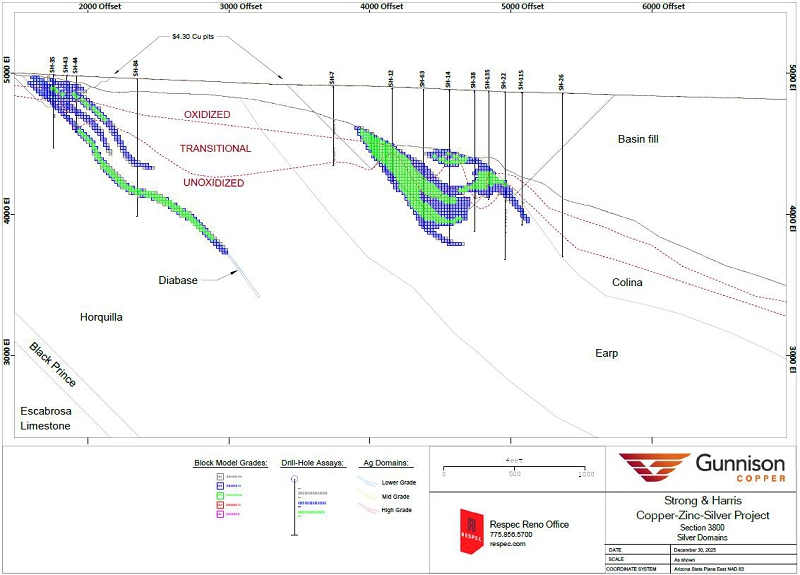
Figure 14-17: Strong & Harris Cross Section 3800 Showing Block Model Silver Grades
| M3-PN210313.007 31 March 2026 Revision 0 | 177 |
GUNNISON PROJECT Form 43-101F1 Technical Report |
The in-pit mineralization at Strong & Harris are categorized geological variables in the model including oxidation zones and lithology. The in-pit mineralization is broken-down by oxidation zone in Table 14-34 and by lithology in Table 14-35.
Table 14-34: Strong & Harris In-Pit Mineralization - Mineral Resources by Oxidation Zone
(0.07% Cu cutoff)
| Oxidation Zone | Tons | % Cu | % CuOx | % Zn | oz Ag/ton | lbs Cu | lbs CuOx | lbs Zn | oz Ag |
| Oxide | 34,764,000 | 0.47 | 0.39 | 0.53 | 0.10 | 323,906,000 | 274,473,000 | 366,245,000 | 3,594,000 |
| Transition | 35,621,000 | 0.49 | 0.27 | 0.58 | 0.12 | 350,250,000 | 194,267,000 | 412,508,000 | 4,424,000 |
| Sulfide | 5,685,000 | 0.58 | 0.12 | 0.68 | 0.17 | 65,844,000 | 13,951,000 | 76,954,000 | 953,000 |
Table 14-35: Strong & Harris In-Pit Mineralization - Mineral Resources by Lithology
(0.07% Cu cutoff)
| Lithology | Tons | % Cu | % CuOx | % Zn | oz Ag/ton | lbs Cu | lbs CuOx | lbs Zn | oz Ag |
| Horquilla | 6,290,000 | 0.30 | 0.19 | 0.22 | 0.07 | 37,830,000 | 23,612,000 | 27,640,000 | 449,000 |
| Earp | 66,825,000 | 0.49 | 0.31 | 0.59 | 0.12 | 655,965,000 | 420,963,000 | 782,669,000 | 8,302,000 |
| Colina | 2,797,000 | 0.79 | 0.66 | 0.79 | 0.07 | 44,168,000 | 36,923,000 | 44,322,000 | 204,000 |
| Diabase | 157,000 | 0.65 | 0.38 | 0.34 | 0.11 | 2,037,000 | 1,192,000 | 1,076,000 | 17,000 |
| 14.7.10 | Discussion of Resources and Recommendations |
The Strong & Harris resource estimate was done through a sectional extrusion of the mineral domain polygons discussed in this report. The resource block model consequently appears jagged when viewed in three dimensions. While this modeling strategy is unlikely to materially affect the overall estimation of project resources, three-dimensional rectification of the cross-sectional mineral domain polygons would improve spatial precision of the grade estimates and would be required for future resource estimations that included classifications above the Inferred level.
Future drilling, exploration, and resource definition at Strong & Harris should focus on increasing the understanding of geologic controls on mineralization, infill drilling in key areas to increase drill density, and drill-testing of the unconstrained limits of the deposit. Despite well-understood lithological controls on mineralization, limited data regarding the deposit structure are available. Drilling angle holes to test structures is recommended for this purpose. The authors also recommend testing the mineralization limits along strike, particularly on the northern edge of known mineralization, as well as testing the mineralization limits down-dip in favorable host-rocks.
Downhole surveys of historical drill holes, where possible, should be collected to improve spatial confidence. Mineralogical characterization of the copper, zinc, and silver, is also recommended using common analytical techniques such as x-ray diffraction, scanning electron microscopy, or otherwise, especially in the context of the deposit’s oxidation zones.
The estimate of mineral resources may be materially affected by geology, environmental, permitting, legal, title, taxation, sociopolitical, marketing, or other relevant issues. Potential risk factors include changes in metal prices, increases in operating costs, fluctuations in labour costs and availability, availability of investment capital, infrastructure failures, changes in government regulations, community engagement and socio-economic community relations, civil disobedience and protest, permitting and legal challenges, and general environmental concerns. However, the author is not aware of any such factors that may materially affect the Gunnison Deposit mineral resources as of the date of this technical report. The impact of taxation was taken into consideration when establishing cut-off grade and further details are provided in Section 22: Economic Analysis.
| M3-PN210313.007 31 March 2026 Revision 0 | 178 |
GUNNISON PROJECT Form 43-101F1 Technical Report |
| 15 | MINERAL RESERVE ESTIMATES |
The Gunnison Project does not currently have any mineral reserves.
| 16 | MINING METHODS |
Mining of the Gunnison and Strong & Harris Deposits is planned to be accomplished using open pit hard rock mining methods. The mine plan was developed to produce 175 million pounds of recoverable copper per year with mining being completed by an owner operated fleet. Mining of the deposit is expected to be accomplished primarily with hydraulic front shovels and 320-ton trucks. Mining is planned on 50-ft bench heights in the Gunnison pit and 40-ft bench heights in the Strong & Harris pit.
An annual schedule was developed for the mine plan. Leach material will be dumped into near pit gyratory crushers to be conveyed either directly to the leach pad or through mineralized material sorting prior to being conveyed to the leach pad. All leach material produced through Year 9 is planned to be treated in a conventional leach operation. Beginning in Year 10, a portion of the leach material is planned to be treated in a sulfide leach operation with the rest of the material treated in a conventional leach operation. The heap tonnage production varies by year as it is based on the requirement of 175 million pounds of recoverable copper being placed on the heap annually.
The annual mine schedule is provided on the following page in Table 16-1. A graphical representation of the schedule is provided in Figure 16-1 below.
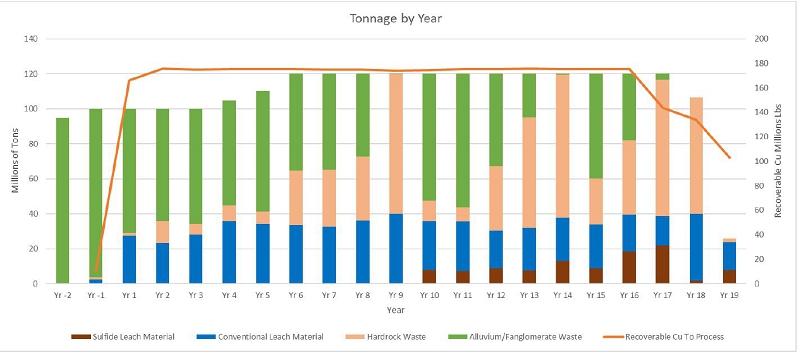
Figure 16-1: Graphical Representation of Gunnison Mine Schedule
| M3-PN210313.007 31 March 2026 Revision 0 | 179 |
GUNNISON PROJECT Form 43-101F1 Technical Report |
Table 16-1: Gunnison PEA Annual Mine Schedule
| Conventional Leach Material to Primary Crusher | Sulfide Leach Material to Primary Crusher | ||||||||||||||||
|
Year |
NetofProc Cut-off $/t | Leach Material kt |
NetofProc. $/t |
ASCu % |
CNCu % |
CuS % |
TCu % |
Leach Material kt |
NetofProc. $/t |
ASCu % |
CNCu % |
CuS % |
TCu % |
Overburden Waste kt | Hardrock Waste kt | Total Waste kt | Total kt |
| -2 | 95,000 | 0 | 95,000 | 95,000 | |||||||||||||
| -1 | 0.01 | 2,612 | 12.70 | 0.226 | 0.000 | 0.000 | 0.300 | 96,341 | 1,047 | 97,388 | 100,000 | ||||||
| 1 | 0.01 | 27,239 | 20.68 | 0.343 | 0.000 | 0.000 | 0.441 | 71,058 | 1,703 | 72,761 | 100,000 | ||||||
| 2 | 0.01 | 23,155 | 26.52 | 0.426 | 0.000 | 0.004 | 0.525 | 64,139 | 12,706 | 76,845 | 100,000 | ||||||
| 3 | 0.01 | 28,165 | 21.54 | 0.347 | 0.000 | 0.006 | 0.453 | 65,877 | 5,958 | 71,835 | 100,000 | ||||||
| 4 | 0.01 | 36,004 | 16.28 | 0.272 | 0.001 | 0.006 | 0.360 | 60,315 | 8,681 | 68,996 | 105,000 | ||||||
| 5 | 0.01 | 34,343 | 17.09 | 0.285 | 0.001 | 0.003 | 0.369 | 68,867 | 6,790 | 75,657 | 110,000 | ||||||
| 6 | 0.01 | 33,287 | 17.89 | 0.290 | 0.006 | 0.010 | 0.377 | 55,345 | 31,368 | 86,713 | 120,000 | ||||||
| 7 | 0.50 | 32,710 | 18.26 | 0.295 | 0.005 | 0.012 | 0.381 | 54,853 | 32,437 | 87,290 | 120,000 | ||||||
| 8 | 2.00 | 36,300 | 16.33 | 0.270 | 0.000 | 0.012 | 0.353 | 47,295 | 36,405 | 83,700 | 120,000 | ||||||
| 9 | 4.00 | 40,000 | 14.67 | 0.240 | 0.002 | 0.004 | 0.335 | 118 | 79,882 | 80,000 | 120,000 | ||||||
| 10 | 3.50 | 28,293 | 15.40 | 0.250 | 0.001 | 0.001 | 0.347 | 7,707 | 19.64 | 0.239 | 0.023 | 0.115 | 0.427 | 72,387 | 11,613 | 84,000 | 120,000 |
| 11 | 0.01 | 28,427 | 14.98 | 0.262 | 0.001 | 0.001 | 0.366 | 7,121 | 17.96 | 0.163 | 0.044 | 0.159 | 0.370 | 75,549 | 8,903 | 84,452 | 120,000 |
| 12 | 0.01 | 21,495 | 18.44 | 0.318 | 0.000 | 0.000 | 0.447 | 9,007 | 17.97 | 0.108 | 0.058 | 0.228 | 0.394 | 52,665 | 36,833 | 89,498 | 120,000 |
| 13 | 0.01 | 24,645 | 17.12 | 0.297 | 0.001 | 0.000 | 0.440 | 7,361 | 17.89 | 0.085 | 0.059 | 0.273 | 0.418 | 24,736 | 63,258 | 87,994 | 120,000 |
| 14 | 1.50 | 24,896 | 11.99 | 0.211 | 0.003 | 0.002 | 0.283 | 12,901 | 20.74 | 0.109 | 0.091 | 0.224 | 0.436 | 576 | 81,627 | 82,203 | 120,000 |
| 15 | 3.50 | 24,971 | 16.42 | 0.279 | 0.000 | 0.001 | 0.364 | 8,984 | 18.34 | 0.142 | 0.046 | 0.193 | 0.394 | 59,917 | 26,128 | 86,045 | 120,000 |
| 16 | 4.50 | 20,888 | 13.26 | 0.224 | 0.001 | 0.001 | 0.304 | 18,644 | 15.19 | 0.077 | 0.066 | 0.193 | 0.336 | 37,964 | 42,504 | 80,468 | 120,000 |
| 17 | 4.00 | 16,733 | 8.89 | 0.155 | 0.001 | 0.001 | 0.217 | 21,894 | 13.65 | 0.046 | 0.050 | 0.226 | 0.322 | 3,226 | 78,147 | 81,373 | 120,000 |
| 18 | 3.50 | 38,408 | 10.45 | 0.179 | 0.001 | 0.000 | 0.261 | 1,592 | 20.15 | 0.271 | 0.001 | 0.111 | 0.419 | 66,625 | 66,625 | 106,625 | |
| 19 | 1.00 | 15,974 | 12.96 | 0.216 | 0.000 | 0.001 | 0.293 | 7,702 | 16.74 | 0.128 | 0.073 | 0.139 | 0.340 | 1,908 | 1,908 | 25,584 | |
| Total | 538,545 | 16.31 | 0.272 | 0.001 | 0.004 | 0.364 | 102,913 | 16.99 | 0.108 | 0.058 | 0.199 | 0.372 | 1,006,228 | 634,523 | 1,640,751 | 2,282,209 | |
*Tonnages Include Measured+Indicated+Inferred Material
*ASCu-Acid Soluble Copper
*CNCu-Cyanide Soluble Copper
*CuS-Sulfide
*TCu-Total Copper Grade
*Net of Process Calculated at $4.30/lb Cu
| M3-PN210313.007 31 March 2026 Revision 0 | 180 |
GUNNISON PROJECT Form 43-101F1 Technical Report |
| 16.1 | Mine Phase Design |
The mine plan presented in this section is achieved by mining 9 phase expansions to achieve the ultimate pit limit in the Gunnison Deposit and mining a single phase at Strong & Harris. The Gunnison phases are practical expansions of the pit incorporating haul road designs, operating room for equipment and all practical mining requirements.
Phases were designed with 50 ft bench heights in the Gunnison pit and 40 ft bench heights in the Strong & Harris Pit. Haul roads were designed at 128 ft width at a maximum 10% gradient. Interramp slope angles that were used are presented in Table 16-4.
Lerchs Grossman (LG) pit shells were run at copper prices between $1.80/lb and $4.30/lb. The change in geometry of the LG pit shells as the copper price increases was used to guide phase expansion at Gunnison generally in the direction of increasing cost per pound of copper starting with the lowest cost of copper first. The comparison of the phase progression to the LG’s at increasing copper price (at the 4200 ft bench) can be seen in Figure 16-2. The northern lobe of the computer generated pit shell was not incorporated into the PEA phase designs in order to respect the location of the highway realignment. Future iterations of the project may allow for incorporation of the northern lobe that is currently not included in the phase designs.
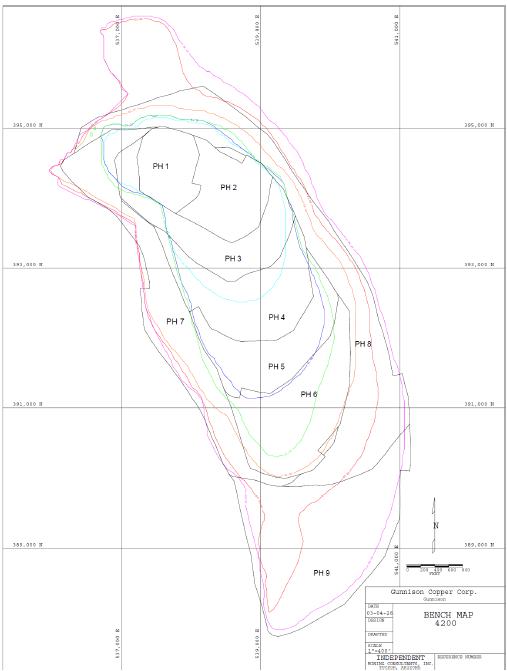
Figure 16-2: Phase Progression of Gunnison Phases (Black) vs LG Pit Shells ($1.80/lb LG-Light Blue, $1.90/lb LG-Dark Blue, $2.00/lb LG-Green, $2.80/lb LG-Orange, $3.60/lb LG-Red, $4,20/lb LG-Pink)
| M3-PN210313.007 31 March 2026 Revision 0 | 181 |
GUNNISON PROJECT Form 43-101F1 Technical Report |
At both Gunnison and Strong & Harris, the pit shells between $1.80/lb and $4.30/lb were all evaluated at $4.30/lb along with the cost inputs shown in Table 16-2. The $4.20/lb pit shell was chosen to guide the design of the ultimate pit limit at Gunnison as only marginal additional value was gained by mining beyond the $4.20/lb pit shell geometry.
Figure 16-3 provides a comparison of the tons of heap material, waste, and the value of the pits between $1.80/lb - $4.30/lb at Gunnison when all of the pit shells are evaluated at $4.30/lb and the inputs shown in Table 16-2. The $3.40/lb pit shell was chosen to guide the design of the ultimate pit limit at Strong & Harris. Figure 16-4 provides a comparison of the tons of heap material, waste and the value of the pits between $1.80/lb - $4.30/lb at Strong & Harris when all of the pit shells are evaluated at $4.30/lb and the inputs shown in Table 16-2.
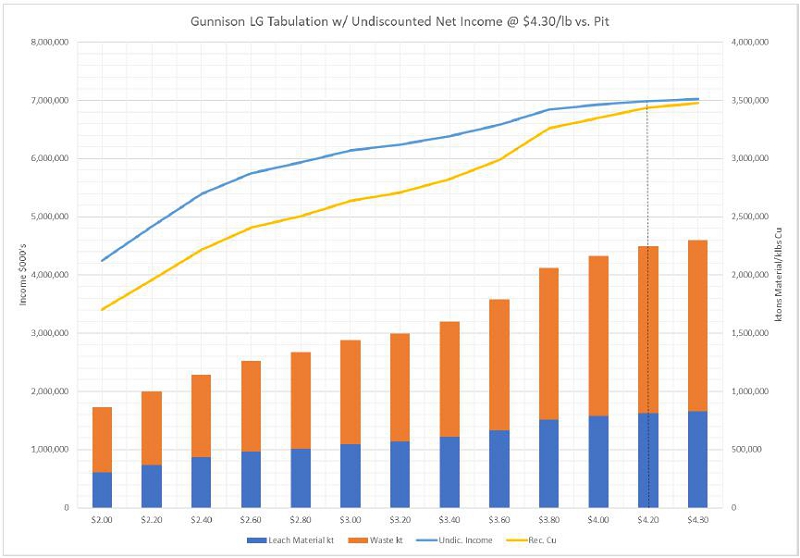
Figure 16-3: Tonnages of Heap Material and Waste along with Undiscounted Pit Value when all LG pit shells are evaluated at $4.30/lb Cu at Gunnison
| M3-PN210313.007 31 March 2026 Revision 0 | 182 |
GUNNISON PROJECT Form 43-101F1 Technical Report |
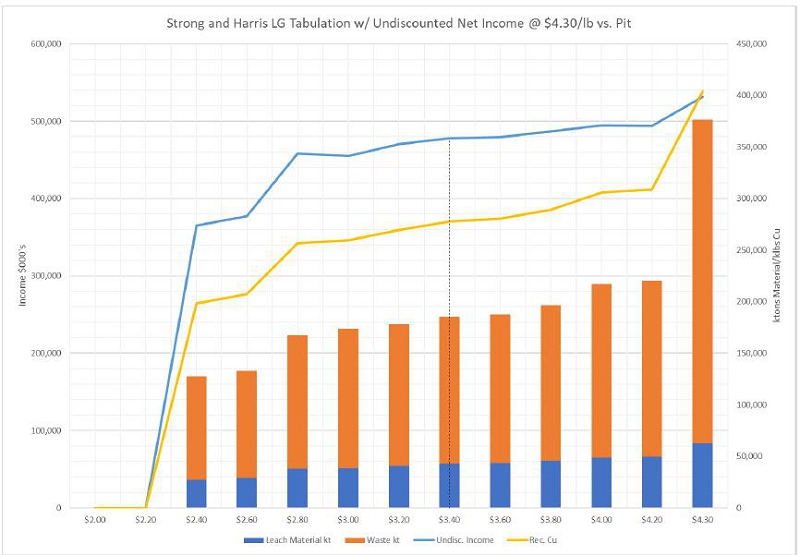
Figure 16-4: Tonnages of Heap Material and Waste along with Undiscounted Pit Value when all LG pit shells are evaluated at $4.30/lb Cu at Strong & Harris
The inputs used to generate the pit shells that guided the phase design are shown in Table 16-2. Pit shells were generated at the beginning of work and differ from the final cost estimates of the PEA work.
Table 16-2: Inputs to Computer Generated Pit Shell Used to Guide Phase Design
| Gunnison | S&H | |||
| Input Parameters | Units | Unsorted Material | Sorted Material | Sorted Material |
| Base Cu Price | $/lb. | $4.30 | $4.30 | $4.30 |
| Sustaining Capital Cost (Owner Case) | $/ton | $0.22 | $0.22 | $0.22 |
| Overburden Mining Cost | $/ton | $1.28 | $1.28 | $1.28 |
| Hard Rock Waste Mining Cost | $/ton | $1.95 | $1.95 | $1.95 |
| Mineralized Material Mining Cost | $/ton | $1.92 | $1.92 | $3.95 |
| Incremental Cost Below 4,300 ft bench | $/ton/bench | $0.01 | $0.01 | |
| Bench Discounting | % | 0.50% | 0.50% | 0.50% |
| Overall Pit Slope Angle for Overburden | Degrees | 42 | 42 | 42 |
| Overall Pit Slope Angle for Hardrock | Degrees | 47 | 47 | 42 |
| Overall Pit Slope Angle for Hardrock West Wall | Degrees | 36 | 36 | 42 |
| M3-PN210313.007 31 March 2026 Revision 0 | 183 |
GUNNISON PROJECT Form 43-101F1 Technical Report |
| Gunnison | S&H | |||
| Input Parameters | Units | Unsorted Material | Sorted Material | Sorted Material |
| Cu Recovery: | ||||
| Acid Soluble Cu | % | 90% | 88.5% | 90.7% |
| Cn Soluble | % | 90% | 59.2% | |
| Sulfide Cu (if processed as sulfide material) | % | 60% | 59.5% | 59.5% |
| Heap Management Cost | $/t mineralized material | $0.21 | $0.13 | $0.13 |
| Crushing / Conveying Cost | $/t mineralized material | $0.40 | $0.40 | $0.40 |
| Sulfide Leach Cost (if processed as sulfide material) | $/t mineralized material | $2.00 | $1.21 | $1.21 |
| Cost to Construct Leach pad | $/t mineralized material | $0.37 | $0.22 | $0.22 |
| Material Sorting Cost | $/t mineralized material | $0.00 | $1.00 | $1.00 |
| SX/EW Cost | $/lb Cu | $0.16 | $0.16 | $0.16 |
| G&A Cost | $/lb Cu | $0.05 | $0.05 | $0.05 |
| Acid Cost | $/ton acid | $36.50 | $36.50 | $36.50 |
| Acid Consumption: | ||||
| Escabrosa (and stratigraphically above) | lb./ton | 0 | 53 | 0 |
| Martin | lb./ton | 0 | 53 | 0 |
| Strong & Harris | 0 | 0 | 53 | |
| Upper Abrigo | lb./ton | 48 | 0 | 0 |
| Middle Abrigo | lb./ton | 48 | 0 | 0 |
| Lower Abrigo | lb./ton | 24 | 0 | 0 |
| Bolsa/TQM (and stratigraphically below) | lb./ton | 24 | 0 | 0 |
| Royalty ASCu | % | 6.75 | 6.75 | 6.75 |
| Royalty CNCu/CuS | % | 4.5 | 4.5 | 4.5 |
The tonnages tabulated at a $0.01/t net of process cut-off (calculated with net of process equations in Table 16-5) within each pushback are provided in Table 16-3.
Table 16-3: Tabulation of Tonnages by Phase
| Mat to Heap | ASCu | CNCu | CuS | TCu | Fanglmt | Hardrock | Total | Rec. Cu | S.R. | Production | ||
| kt | % | % | % | % | waste kt | waste kt | kt | mlbs | W:O | Cost $/lb Cu | ||
| Ph1 | 21,987 | 0.305 | 0 | 0 | 0.396 | 122,588 | 1,544 | 146,119 | 119 | 5.6 | 2.92 | |
| Ph2 | 21,700 | 0.498 | 0 | 0.004 | 0.607 | 97,178 | 1,648 | 120,526 | 193 | 4.6 | 1.81 | |
| Ph3 | 47,334 | 0.341 | 0.001 | 0.008 | 0.448 | 47,334 | 59,475 | 154,143 | 293 | 2.3 | 1.9 | |
| Ph4 | 61,395 | 0.278 | 0.005 | 0.008 | 0.366 | 101,235 | 11,724 | 174,354 | 316 | 1.8 | 1.96 | |
| Ph5 | 41,646 | 0.273 | 0.003 | 0.008 | 0.358 | 72,396 | 9,657 | 123,699 | 207 | 2 | 2.08 | |
| Ph6 | 55,388 | 0.268 | 0 | 0.008 | 0.338 | 80,866 | 47,150 | 183,404 | 268 | 2.3 | 2.32 | |
| Ph7 | 173,386 | 0.182 | 0.018 | 0.049 | 0.31 | 75,890 | 104,657 | 353,933 | 725 | 1 | 2.01 | |
| Ph8 | 157,680 | 0.145 | 0.018 | 0.064 | 0.267 | 111,516 | 180,456 | 449,652 | 574 | 1.9 | 2.81 |
| M3-PN210313.007 31 March 2026 Revision 0 | 184 |
GUNNISON PROJECT Form 43-101F1 Technical Report |
| Mat to Heap | ASCu | CNCu | CuS | TCu | Fanglmt | Hardrock | Total | Rec. Cu | S.R. | Production Cost $/lb | ||
| kt | % | % | % | % | waste kt | waste kt | kt | mlbs | W:O | Cu | ||
| Ph9 | 129,724 | 0.141 | 0.005 | 0.01 | 0.211 | 112,469 | 136,668 | 378,861 | 355 | 1.9 | 3.32 | |
| S&H | 41,041 | 0.326 | 0.521 | 141,883 | 14,595 | 197,519 | 263 | 3.8 | 2.53 | |||
| Total | 751,281 | 0.217 | 0.009 | 0.029 | 0.324 | 963,355 | 567,574 | 2,282,210 | 3313 | 2 | 2.37 |
| 16.2 | Design Parameters |
| 16.2.1 | Geotechnical |
In 2025, Call & Nicholas, Inc. (CNI) updated previous geotechnical studies and provided preliminary slope angles for mine planning and open pit design for the Gunnison Copper Project located in Cochise County, Arizona. The emphasis of the 2025 study update was on the strength and geotechnical character of the conglomerate. The PEA slope angle recommendations consider available regional and local geology data, a geologic block model, rock strength testing, and a drillhole database consisting of geomechanical and exploration data. Historic reports of previous studies relevant to the region were also reviewed to further address site specific concerns.
The Gunnison Deposit has been well explored since the 1950s. Geology and Ore Deposition at the I-10 Prospect Cochise County Arizona (1976) by T. J. Weitz remains a definitive summary of the geology of the deposit. The general engineering geology description for the deposit is that the mineralized material is present in Paleozoic rocks that are in contact with the Tertiary Texas Canyon Quartz Monzonite. These rocks are overlain by up to 650 feet of Tertiary conglomerate and alluvium. The Texas Canyon Quartz Monzonite lies west of the mineralized material. The sedimentary rocks generally strike north-south, and dip 20 to 40 degrees to the east. Precambrian rocks underlie the Paleozoic rocks but may not be exposed in the future pit.
For the PEA slope design at Gunnison, CNI has determined that there are four major engineering rock groups (domains). The engineering rock groups currently defined are:
| 1. | Tertiary fanglomerate |
| 2. | Texas Canyon Quartz Monzonite |
| 3. | Paleozoic rocks |
| 4. | Precambrian rocks |
Given that the character and age of each of these four groups are substantially different, slope angles should be assigned to each rock group for mine planning and design. CNI’s preliminary analysis recommends the following overall slope angles for each of these rock groups:
Alluvium and Conglomerate Slopes – 38 degrees in alluvium, 49 degrees in conglomerate, with a provision for a flatter angle of 45 degrees in the uppermost 200 feet of conglomerate.
Texas Canyon Quartz Monzonite – 45 degrees. This should be a conventional benched rock slope, and given the RQD data and the local exposures nearby the project site, the 45-degree angle may have several degrees of eventual upside.
Paleozoic Rocks – 35 degrees for the west wall, and 45 degrees for the east wall. The flatter slope angle recommended for the Paleozoic rock group in the west wall is due to the dip of the beds being 30 to 40 degrees to the east. This creates a potential “footwall” bedding geometry for the west wall, and to minimize slope instability along bedding planes, a slope angle at the average dip is recommended. The bedding geometry is favorable for the east wall and therefore 45 degrees is recommended there.
| M3-PN210313.007 31 March 2026 Revision 0 | 185 |
GUNNISON PROJECT Form 43-101F1 Technical Report |
Precambrian Rocks – 45 degrees. Although there is limited drilling in the Precambrian rocks, the RQD data is good where there is data, and the pit may not expose any of these rocks in the final wall.
A summary of these recommendations is provided in Table 16-4. It is expected that each of the four engineering rock groups will be mined using conventional bench blasting with 50-foot final bench heights. For detailed mine designs that include haul roads, interramp slope angles 2 to 3 degrees steeper than the overall slope angles above can be implemented at this stage of the design, provided the overall slope angles are maintained.
Table 16-4: Pit Slope Angles Used in Gunnison Pit Design
| Rock Formation | Overall Slope (deg) | Interramp Slope (deg) |
| Fanglomerate | 45-47 | 45-49 |
| Texas Canyon Quartz Monzanite | 47 | 50 |
| Paleozoic Rocks West Wall | 36 | 39 |
| Paleozoic Rocks North-West Wall | 48 | 50 |
cohm = Crf [ r cohi + (1 − r) cohrubble ]
øm = atan [ r2/3 tanøi + (1 − r2/3) tan(ørubble) ]
r = 0.05e0.026 · RQD
τm = cohm + σn tanøm
where:
Crf = 0.25 to 0.50 for open pit mining
Crf = 0.35 to 0.70 for under ground mining
In this case, the intact rock strength is 45.1 degrees with 152 psi cohesion. The broken rubble strength is 36.2 degrees with 2.9 psi cohesion. Using an RQD% of 50%, and a Crf of 0.5, the estimated rock mass strength of the conglomerate at the Gunnison site used for the stability analysis was 38.0 degrees and 24.2 psi cohesion.
Although the conglomerate is a weaker rock (Uniaxial Compressive Strength less than 1000 psi, cohesion less than 50 psi), it is generally unjointed. Therefore, any shear failure must break through the rock mass. In weak rocks like the Gila Conglomerate, there exists a relationship between slope height and slope stability. The higher the slope, the flatter the slope angle needs to be to maintain an adequate Factor of Safety. To determine this relationship a 2d limiting equilibrium slope stability analysis was conducted varying the slope height from 200 to 600 feet. The slope was assumed to be drained of pore pressure. Spencer’s method of slices was used to calculate the Factor of Safety for the critical shear surface for each slope height. Circular and non-circular surfaces were searched to obtain the minimum Factor of Safety for each slope geometry. The result is shown in Figure 16-5. The maximum slope angle has been capped at 55 degrees for catch bench requirements.
| M3-PN210313.007 31 March 2026 Revision 0 | 186 |
GUNNISON PROJECT Form 43-101F1 Technical Report |
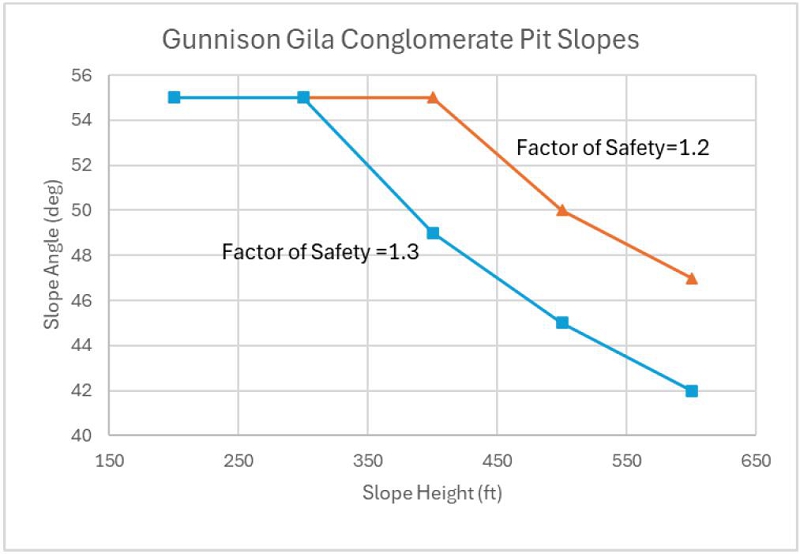
Figure 16-5: Gila Conglomerate Slope Height verses Slope Angle for Factors of Safety of 1.2 and 1.3
| 16.2.2 | Tertiary Texas Canyon Quartz Monzonite |
The quartz monzonite will form much of the west wall of the pit and is believed to be the source of the mineralization and alteration for the deposit. The contact between quartz monzonite and the sedimentary rocks is near vertical but irregular in a general north-south direction and will not have a control on the slope design. The median RQD of the TQM is 56% and the mean compressive strength is estimated to be 15,000-20,000 psi. The TQM does not outcrop in the Johnson Camp area, but surface exposures all along the I-10 corridor show the rock to be a strong and moderately jointed, with a GSI of 45 to 55.
Provided the jointing is favorable, the TQM should be able to stand a 45 to 48-degree interramp slope and a 45-degree overall slope. The only concern that CNI has for the TQM is the potential for joint sets that are consistently long and that would control bench faces and possibly affect multi-bench stability. The surface outcrops nearby to the west do have long, sheet type joints on the order of 100 to 200 feet long, which is why many of the local exposures are favored by rock climbers. These types of exposures can be seen at the rest area on I-10, west of the project site. Provided the jointing is favorable at the project site, the TQM slope angle may have several degrees of eventual upside if bench face angles greater than 65 degrees can be achieved.
| 16.2.3 | Paleozoic rocks |
The Paleozoic rocks host the mineralized material. The beds strike north-south and the main dip of the beds is 30 to 40 degrees to the east. There is substantial alteration in the rocks such that many of the exploration programs have focused on alteration type (e.g., hornfels, tactite, garnetite) rather than rock unit (Escabrosa, Martin, Abrigo). There is a generalized section, however, in the deposit, starting at the top with the Horquilla Limestone and ending at the bottom with the Abrigo Formation and Bolsa Quartzite. Median RQD in the mineralized material rocks ranges from 68 to 86% with the exception of quartzite, which has a RQD of 59 percent. This RQD is relatively high, and the rocks are expected to be minimally jointed with little original bedding remaining intact. However, due to the general dip of the beds, there is a “footwall” geometry for the west wall, and bedding contacts and bedding joints could control slope stability.
| M3-PN210313.007 31 March 2026 Revision 0 | 187 |
GUNNISON PROJECT Form 43-101F1 Technical Report |
To minimize slope instability along bedding planes, a flatter angle is recommended for the west wall. The bedding geometry is favorable for the east wall and therefore 45 degrees is recommended there. Major fault structures do offset the beds in several places, which is an area that should be studied further in in the next phase of slope design. Baker (1953) identified three distinct fault sets in the region, with fault offsets of up to 250 feet. Most are steeply dipping faults with normal type displacement (footwall displaced downward). The most significant example at this time is in the northwest region of the deposit where there are several faults that create a small graben in the Paleozoic rocks. In this fault bounded region, the dip of beds is considerably flatter, which could impact future pit designs.
| 16.2.4 | Precambrian rocks |
Underlying the Paleozoic rocks is an assemblage of different Precambrian rocks, including the Apache Group and the Pinal Schist. The schist has the lowest average RQD for the entire deposit, with a median RQD of 47%. This is lower than many of the engineering rock types in the mine but logging still indicates a jointed rock with a GSI of 40 to 50. The pit is not expected to expose very many benches in these rocks in the final wall. At this time, a 45-degree overall slope angle is recommended for the Precambrian rocks.
| 16.3 | Mine Production Schedule |
The mine production schedule that is presented in Table 16-1 was developed using the phase designs, and the required leach pad feed rate to produce ~175 million pounds of recoverable copper per year. Sufficient waste is moved during the mine life to assure continued release of the required heap material. The cut-off grade of the mineralized material is generally $0.01 net of process. There are several years where cutoff grade was raised to maintain an annual feed of 175 million pounds of recoverable copper(years 7-10 and 14-19).
The calculation of net of process is provided in Table 16-5 below.
Table 16-5: Calculation of Net of Process Value used as Cut-off Grade
Net of Process Conventional Leach =
ASCu% * 20 lbs/%/ton * CuAS Recovery * ($4.30/lb Cu * (1-.0675 royal) - $0.21/lb GA+SXEW) +CNCu% * 20 lbs/%/ton * CuCNRecovery * ($4.30/lb Cu * (1-.045 royal) - $0.21/lb GA+SXEW)-Acid Consumption @ $36.5/ton acid (Varies between $0.44 -$1.49/ton mineralized material) - $/t Material Sorting Cost – $2.00/ton Additional Haulage (for Strong & Harris Only) -$/ton heap management cost- $/t Crushing and Conveying Cost - $/t Cost to Construct Pad
|
Net of Process Sulfide Leach =
ASCu% * 20 lbs/%/ton * CuAS Recovery * ($4.30/lb Cu * (1-.0675 royal) - $0.21/lb GA+SXEW) +CNCu% * 20 lbs/%/ton * CuCN Recovery * ($4.30/lb Cu * (1-.045 royal) - $0.21/lb GA+SXEW) +CuS% * 20 lbs/%/ton * CuSU Recovery * ($4.30/lb Cu * (1-.045 royal) - $0.21/lb GA+SXEW) -Acid Consumption @ $36.5/ton acid (Varies between $0.44 -$1.49/ton mineralized material) -$/ton heap management cost- $/t Crushing and Conveying Cost - $/t Cost to Construct Pad - $/t Material Sorting Cost – $2.00/ton Additional Haulage (for Strong & Harris Only) -$2.00/t Sulfide Leaching Cost |
*Costs used as inputs are provided in Table 16-2 above. *Leach type was assigned based on which process produced the greater net of process value. |
| M3-PN210313.007 31 March 2026 Revision 0 | 188 |
GUNNISON PROJECT Form 43-101F1 Technical Report |
| 16.3.1 | Material Scheduled to the Primary Crusher |
Mineralized material is scheduled to the primary crusher at a rate that will result in 175 million recoverable pounds of copper being placed on the leach pad every year. The primary crusher is fed at a maximum throughput rate of 40 million tons per year. The subset of mineralized material that needs to be diverted to sorting following primary crushing is fed to the primary crusher at a maximum throughput rate of 21 million tons per year. A Table 16-6 and Figure 16-6 showing mineralized material fed to the Primary Crusher by year is provided below (Conv. = conventional leach material, Sulf = sulfide leach material).
Table 16-6: Tonnage of Mineralized Material Fed to the Primary Crusher by Type
| Conventional Leach | Sulfide Leach | ||||||||
|
Year |
Gunnison non-sort Mtons |
Gunnison to sorting Mtons |
S & H to sorting Mtons |
Total Mtons |
Gunnison non-sort Mtons |
Gunnison to sorting Mtons |
S & H to sorting Mtons |
Total Mtons |
Total Total Mtons |
| -2 | |||||||||
| -1 | 0.5 | 2.2 | 0.0 | 2.6 | 2.6 | ||||
| 1 | 7.0 | 20.2 | 0.0 | 27.2 | 27.2 | ||||
| 2 | 9.5 | 13.6 | 0.0 | 23.2 | 23.2 | ||||
| 3 | 18.0 | 10.1 | 0.0 | 28.2 | 28.2 | ||||
| 4 | 14.9 | 21.2 | 0.0 | 36.0 | 36.0 | ||||
| 5 | 14.7 | 19.6 | 0.0 | 34.3 | 34.3 | ||||
| 6 | 12.5 | 20.7 | 0.0 | 33.3 | 33.3 | ||||
| 7 | 11.7 | 21.0 | 0.0 | 32.7 | 32.7 | ||||
| 8 | 19.9 | 16.4 | 0.0 | 36.3 | 36.3 | ||||
| 9 | 33.6 | 6.4 | 0.0 | 40.0 | 40.0 | ||||
| 10 | 28.0 | 0.3 | 0.0 | 28.3 | 7.6 | 0.1 | 0.0 | 7.7 | 36.0 |
| 11 | 15.1 | 0.1 | 13.3 | 28.4 | 7.0 | 0.0 | 0.1 | 7.1 | 35.5 |
| 12 | 8.7 | 0.1 | 12.7 | 21.5 | 7.6 | 0.0 | 1.4 | 9.0 | 30.5 |
| 13 | 6.4 | 7.5 | 10.8 | 24.6 | 4.6 | 0.0 | 2.8 | 7.4 | 32.0 |
| 14 | 5.8 | 19.1 | 0.0 | 24.9 | 12.3 | 0.6 | 0.0 | 12.9 | 37.8 |
| 15 | 6.5 | 18.5 | 0.0 | 25.0 | 7.2 | 1.8 | 0.0 | 9.0 | 34.0 |
| 16 | 14.6 | 6.3 | 0.0 | 20.9 | 17.7 | 0.9 | 0.0 | 18.6 | 39.5 |
| 17 | 15.1 | 1.6 | 0.0 | 16.7 | 21.9 | 0.0 | 0.0 | 21.9 | 38.6 |
| 18 | 34.9 | 3.5 | 0.0 | 38.4 | 1.6 | 0.0 | 0.0 | 1.6 | 40.0 |
| 19 | 14.4 | 1.5 | 0.0 | 16.0 | 7.6 | 0.1 | 0.0 | 7.7 | 23.7 |
| Total | 291.8 | 210.0 | 36.7 | 538.5 | 95.0 | 3.6 | 4.3 | 102.9 | 641.5 |
| M3-PN210313.007 31 March 2026 Revision 0 | 189 |
GUNNISON PROJECT Form 43-101F1 Technical Report |
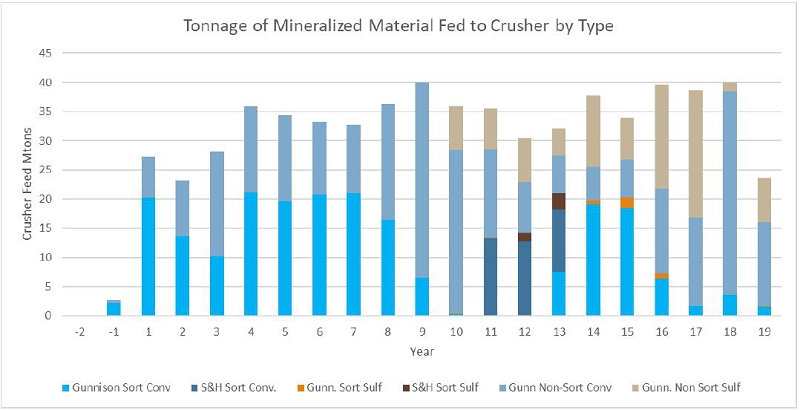
Figure 16-6: Tonnage of Mineralized Material Fed to the Primary Crusher by Type
| 16.3.2 | Sorted Material |
The following material types are planned to be sorted following primary crushing and prior to being placed on the leach pad:
| ● | Escabrosa and formations stratigraphically above. | |
| ● | Martin Formation | |
| ● | Strong & Harris Material |
The assumption that was applied to material processed through sorting is a reduction of mass by 40%. A summary of the material scheduled to be sent to sorting is provided in Table 16-7 below. The maximum tonnage scheduled to sorting on an annual basis is 21 million tons per year. Reject Material is conveyed to the southeast corner of the East WRD; this is shown in the period progression maps.
| M3-PN210313.007 31 March 2026 Revision 0 | 190 |
GUNNISON PROJECT Form 43-101F1 Technical Report |
Table 16-7: Summary of Tonnage of Material sent to sorting by Year
| Martin+ Escabrosa Mtons | Strong& Harris Mtons | Total to Sorting Mtons | Sorted | Reject to | |||
| Year | to Heap Mtons | Waste Mtons | |||||
| 0 | 0 | ||||||
| -1 | 2.2 | 2.2 | 1.3 | 0.9 | |||
| 1 | 20.2 | 20.2 | 12.2 | 8 | |||
| 2 | 13.6 | 13.6 | 8.2 | 5.4 | |||
| 3 | 10.1 | 10.1 | 6.1 | 4 | |||
| 4 | 21.2 | 21.2 | 12.8 | 8.4 | |||
| 5 | 19.6 | 19.6 | 11.8 | 7.8 | |||
| 6 | 20.7 | 20.7 | 12.5 | 8.2 | |||
| 7 | 21 | 21 | 12.7 | 8.3 | |||
| 8 | 16.4 | 16.4 | 9.9 | 6.5 | |||
| 9 | 6.4 | 6.4 | 3.9 | 2.5 | |||
| 10 | 0.4 | 0.4 | 0.2 | 0.2 | |||
| 11 | 0.1 | 13.3 | 13.4 | 8.1 | 5.3 | ||
| 12 | 0.1 | 14.1 | 14.2 | 8.6 | 5.6 | ||
| 13 | 7.5 | 13.6 | 21 | 12.7 | 8.3 | ||
| 14 | 19.7 | 19.7 | 11.9 | 7.8 | |||
| 15 | 20.3 | 20.3 | 12.3 | 8 | |||
| 16 | 7.3 | 7.3 | 4.4 | 2.9 | |||
| 17 | 1.6 | 1.6 | 1 | 0.6 | |||
| 18 | 3.6 | 3.6 | 2.2 | 1.4 | |||
| 19 | 1.6 | 1.6 | 1 | 0.6 | |||
| Total | 213.6 | 41 | 254.7 | 153.8 | 100.8 |
| 16.3.3 | Waste Material |
Waste Material is placed in Waste Rock Dumps (WRD) directly adjacent to the mine pit. There is a WRD east of the Gunnison Pit and a WRD west of the Gunnison pit. There is a WRD planned southeast of the Strong & Harris pit where all of the Strong & Harris waste is allocated. A tabulation and figure of the waste produced from the PEA mine schedule is provided in Table 16-8 and Figure 16-7 below.
| M3-PN210313.007 31 March 2026 Revision 0 | 191 |
GUNNISON PROJECT Form 43-101F1 Technical Report |
Table 16-8: Waste Material Produced from PEA Mine Schedule
| Gunnison Waste | Strong & Harris Waste | ||||||||||
Sedem-mentary Mtons |
OVB 1 Mtons |
OVB 2 Mtons |
OVB 3 Mtons |
Lime-stone Mtons |
Total Mtons |
Waste Sed Mtons |
OVB 2 Mtons |
Lime-stone Mtons |
Total Mtons |
Total Total Mtons | |
| -2 | 67.0 | 28.0 | 95.0 | 95.0 | |||||||
| -1 | 1.0 | 68.6 | 27.8 | 97.4 | 97.4 | ||||||
| 1 | 1.4 | 19.8 | 22.8 | 28.4 | 0.3 | 72.8 | 72.8 | ||||
| 2 | 12.6 | 15.8 | 25.6 | 22.7 | 0.1 | 76.8 | 76.8 | ||||
| 3 | 5.5 | 0.2 | 53.7 | 12.1 | 0.5 | 71.8 | 71.8 | ||||
| 4 | 7.4 | 9.2 | 32.4 | 18.8 | 1.3 | 69.0 | 69.0 | ||||
| 5 | 4.5 | 8.4 | 42.5 | 18.0 | 2.2 | 75.7 | 75.7 | ||||
| 6 | 19.9 | 12.5 | 34.0 | 8.9 | 11.5 | 86.7 | 86.7 | ||||
| 7 | 25.1 | 21.6 | 33.3 | 0.0 | 7.3 | 87.3 | 87.3 | ||||
| 8 | 33.9 | 22.6 | 24.1 | 0.6 | 2.5 | 83.7 | 83.7 | ||||
| 9 | 79.8 | 0.1 | 0.1 | 80.0 | 80.0 | ||||||
| 10 | 11.4 | 0.0 | 11.4 | 0.1 | 72.4 | 0.1 | 72.6 | 84.0 | |||
| 11 | 1.9 | 1.3 | 8.8 | 0.8 | 12.8 | 3.7 | 65.4 | 2.5 | 71.6 | 84.5 | |
| 12 | 20.1 | 30.7 | 17.9 | 13.0 | 81.7 | 2.3 | 4.0 | 1.5 | 7.8 | 89.5 | |
| 13 | 36.0 | 6.9 | 4.5 | 13.3 | 23.0 | 83.6 | 2.6 | 0.1 | 1.7 | 4.4 | 88.0 |
| 14 | 52.8 | 0.0 | 0.6 | 28.9 | 82.2 | 82.2 | |||||
| 15 | 21.5 | 59.9 | 0.0 | 4.7 | 86.0 | 86.0 | |||||
| 16 | 36.5 | 33.3 | 4.7 | 6.0 | 80.5 | 80.5 | |||||
| 17 | 62.0 | 3.2 | 16.1 | 81.4 | 81.4 | ||||||
| 18 | 58.1 | 8.6 | 66.6 | 66.6 | |||||||
| 19 | 1.8 | 0.0 | 1.9 | 1.9 | |||||||
| Total | 493.0 | 185.2 | 502.0 | 177.1 | 126.9 | 1,484.2 | 8.8 | 141.9 | 5.8 | 156.5 | 1,640.7 |
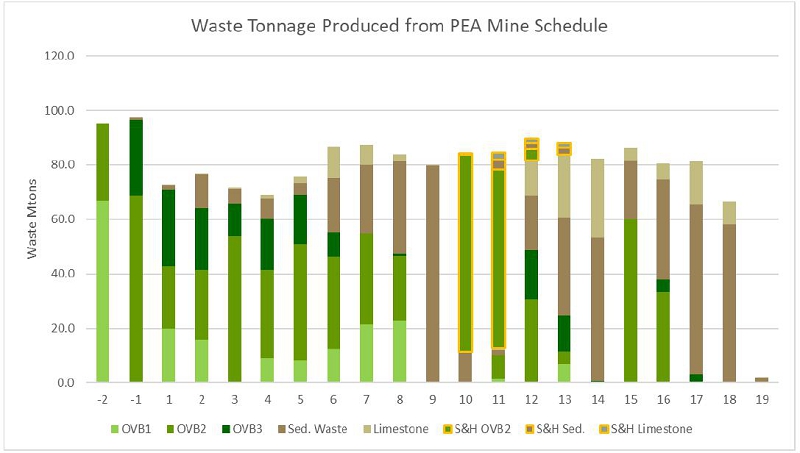
Figure 16-7: Waste Material Produced from PEA Mine Schedule
| M3-PN210313.007 31 March 2026 Revision 0 | 192 |
GUNNISON PROJECT Form 43-101F1 Technical Report |
| 16.3.4 | Limestone Material |
A portion (40%) of the Escabrosa and Horquilla waste from the Gunnison pit along with Earp and Colima waste from the Strong and Harris pit is assumed to be salable limestone material and is stockpiled in the southwest corner of the East WRD for rehandling to the cement plant or direct sale as high grade limestone material (Royalty Material). 60% of stockpiled limestone is assumed to be cement feed quality and 40% is assumed to be Royalty Material quality.
| 16.3.5 | Overburden |
The overburden has been interpreted into three layers. The upper layer is alluvium(OVB1), the middle layer is lightly cemented fanglomerate(OVB2), and the bottom layer is heavily cemented fanglomerate(OVB3). All of the overburden at Strong & Harris is assumed to be lightly cemented fanglomerate.
| 16.4 | Crusher |
The primary crusher is southeast of the Gunnison mine pit. It will crush the leach material to minus 6-inch to be conveyed to either sorting or directly to the leach pad which is planned to be located south of the crusher. The location of the primary crusher can be seen on the mine progression drawings in Figure 16-8 through Figure 16-15.
| 16.5 | Waste Storage |
The waste storage areas(WRD) are east and west of the Gunnison pit and southeast of the Strong & Harris pit. The waste dumps are planned to be constructed in 50 ft lifts at an angle of 2.5:1. The Gunnison east WRD is segregated to hold mine pit waste, limestone from the pit stockpiled and sorting reject that is conveyed from the sorting plant. The geometry of the waste dumps at the end of the mine plan can be seen in Figure 16-15.
| 16.6 | Mine Fleet |
The requirements for the owner operated mine fleet to execute the schedule presented in Table 16-1 are presented in this section. Mining is planned to be executed using automated haulage with the remainder of the equipment being a conventional open pit mining fleet. The reference to specific equipment manufacturers is to illustrate equipment size and is not to be considered a recommendation by Independent Mining Consultants. Inputs to the estimate for requirements for an automated haulage fleet are based on a report provided by Worley Engineering.
Production drilling is expected to be accomplished with 141,000 lb pull-down force class drills with mast lengths capable of single pass drilling 50 ft benches. Holes will be loaded with ANFO when dry and an emulsion slurry when wet.
Based on discussions with the GCC staff on the characteristics of the rock types, drilling and blasting productivities were varied in the overburden waste . In the alluvium (OVB1), no drilling or blasting is assumed to be required. In the lightly cemented fanglomerate (OVB2), drill penetration rates are estimated to be twice, and the powder factor is estimated to be half that of the sedimentary rocks. In the heavily cemented fanglomerate(OVB3), drill penetration rates and powder factors are assumed to be the same as that of the sedimentary rocks. For estimation purposes, all overburden was assumed to be above the water table; holes in hard rock sedimentary units were assumed to be 80% dry and 20% wet.
Hydraulic front shovels with 38 to 44-yard buckets are planned to load a majority of the material with a 30-yard front-end loader available to provide loading flexibility. The front-end loader is also assumed to re-handle 15% of material at the crusher as necessary. Haul trucks are planned to be 320-ton class trucks with 3,500 hp engines. Haul truck productivities are based on haulage time simulations for annual waste and leach material haul profiles. Based on the report provided by Worley engineering, haulage performed by automated trucks has been assumed to have an 11% increase in productive hours per shift as compared with conventional driver operated haul trucks. This additional productivity was applied for when estimating the number of haul trucks required.
| M3-PN210313.007 31 March 2026 Revision 0 | 193 |
GUNNISON PROJECT Form 43-101F1 Technical Report |
A fleet of auxiliary equipment to support the main operating equipment will be required. This will be comprised of 500 hp rubber-tired dozers, 600 hp track dozers, motor graders with 24-ft mold boards, 100-ton haul trucks fitted with 20,000-gallon water tanks and other support equipment. An estimate of the total number of mine major pieces of equipment that will be required to execute the mine plan is provided in Table 16-9. The equipment estimate is based on two 12-hour shifts per day, 360 days per year.
Table 16-9: Expected Major Mining Equipment
| Time Period | |||||||||||||||||||||
Equipment Type |
-2 |
-1 |
1 |
2 |
3 |
4 |
5 |
6 |
7 |
8 |
9 |
10 |
11 |
12 |
13 |
14 |
15 |
16 |
17 |
18 |
19 |
| Cat MD6640 | 1 3 1 10
3 3 2
2
2 1 1 1 |
3 3 1 14
3 3 2
2
2 1 1 1 |
3 3 1 16
3 3 2
2
2 1 1 1 |
3 3 1 17
3 3 2
2
2 1 1 1 |
3 3 1 19
3 3 2
2
2 1 1 1 |
4 4 1 20
3 4 2
2
2 1 1 1 |
4 4 1 22
4 4 2
2
2 1 1 1 |
4 4 1 25
5 4 2
2
2 1 1 1 |
4 4 1 23
5 4 2
2
2 1 1 1 |
4 4 1 26
5 4 2
2
2 1 1 1 |
6 4 1 26
4 4 2
2
2 1 1 1 |
4 4 1 26
4 4 2
2
2 1 1 1 |
4 4 1 25
3 4 2
2
1 1 1 1 |
5 4 1 27
5 4 2
2
1 1 1 1 |
6 4 1 32
5 4 2
2
1 1 1 1 |
6 4 1 32
4 4 2
2
2 1 1 1 |
5 4 1 32
5 4 2
2
1 1 1 1 |
5 4 1 34
5 4 2
2
1 1 1 1 |
6 4 1 35
3 4 2
2
1 1 1 1 |
6 4 1 32
3 4 2
2
1 1 1 1 |
2 1 1 8
2 2 2
1
1 1 1 1 |
| Blasthole Drill | |||||||||||||||||||||
| Cat 6060 Shovel | |||||||||||||||||||||
| Cat 995 High Lift | |||||||||||||||||||||
| 320 ton 3,500hp Haul | |||||||||||||||||||||
| Trucks | |||||||||||||||||||||
| Cat D10 (600 hp) | |||||||||||||||||||||
| Track Dozer | |||||||||||||||||||||
| Cat 834 RT Dozer | |||||||||||||||||||||
| Cat 24M Motor | |||||||||||||||||||||
| Grader | |||||||||||||||||||||
| 100 ton Water Truck | |||||||||||||||||||||
| 20kgal | |||||||||||||||||||||
| Cat 777 (100 ton | |||||||||||||||||||||
| truck) | |||||||||||||||||||||
| Epiroc D45 | |||||||||||||||||||||
| Cat 352 Excavator | |||||||||||||||||||||
| Cat 992 Aux. Loader | |||||||||||||||||||||
| TOTAL | 30 | 36 | 38 | 39 | 41 | 45 | 48 | 52 | 50 | 53 | 54 | 52 | 49 | 54 | 60 | 60 | 59 | 61 | 61 | 58 | 23 |
| 16.7 | Staff Requirements |
The requirements for mine supervision, operations, and maintenance personnel were calculated using the equipment list and mine schedule. Hourly staff requirements are provided in Table 16-10 and salary staff requirements are provided in Table 16-11.
Mine operations and maintenance labor increases to 266 persons at the end of Year 6 and stays between 250 and 300 persons until labor requirements decline in the last year of mining. The “service crew” personnel are the operators responsible for operating the auxiliary mining equipment e.g. water truck, auxiliary loader, auxiliary haul trucks, track drill and excavator. Maintenance personnel requirements are set to be around 60% of required operations personnel (60% if truck drivers were required in the automated haul trucks. Since no haul drivers are assumed, the maintenance to operator ratio appears greater than 60%).
There are planned to be 4 automated haulage technicians on the maintenance side of labor requirements. Although no truck drivers are expected to be required for automated haulage, between 16 and 20 support personnel are planned to be required to operate the automated haulage system(AHS). There are expected to be 48 salaried staff for supervision, engineering, and geology.
| M3-PN210313.007 31 March 2026 Revision 0 | 194 |
GUNNISON PROJECT Form 43-101F1 Technical Report |
Table 16-10: Gunnison PEA Hourly Staff Requirements
|
JOB TITLE |
Time Period | ||||||||||||||||||||
| -2 | -1 | 1 | 2 | 3 | 4 | 5 | 6 | 7 | 8 | 9 | 10 | 11 | 12 | 13 | 14 | 15 | 16 | 17 | 18 | 19 | |
| MINE OPERATIONS: | |||||||||||||||||||||
| Drill Operator | 2 | 8 | 10 | 11 | 11 | 12 | 12 | 15 | 14 | 15 | 22 | 14 | 14 | 16 | 19 | 22 | 15 | 18 | 21 | 19 | 5 |
| Shovel Operator | 11 | 12 | 12 | 12 | 12 | 13 | 13 | 15 | 15 | 15 | 14 | 15 | 15 | 15 | 15 | 14 | 15 | 15 | 15 | 13 | 3 |
| Loader Operator | 2 | 3 | 4 | 4 | 4 | 3 | 3 | 3 | 3 | 4 | 4 | 4 | 4 | 3 | 3 | 4 | 3 | 4 | 4 | 4 | 2 |
| AHS Support Persons | 16 | 16 | 16 | 16 | 16 | 16 | 16 | 16 | 16 | 16 | 16 | 16 | 16 | 16 | 20 | 20 | 20 | 20 | 20 | 20 | 16 |
| Track Dozer Operator | 8 | 8 | 8 | 8 | 8 | 8 | 11 | 15 | 15 | 15 | 11 | 11 | 10 | 14 | 17 | 11 | 14 | 14 | 10 | 10 | 5 |
| Wheel Dozer Operator | 8 | 8 | 8 | 8 | 8 | 11 | 11 | 11 | 11 | 11 | 11 | 11 | 11 | 11 | 11 | 11 | 11 | 11 | 11 | 11 | 4 |
| Grader Operator | 5 | 5 | 5 | 5 | 5 | 6 | 6 | 7 | 7 | 7 | 6 | 6 | 6 | 6 | 7 | 6 | 6 | 6 | 6 | 6 | 5 |
| Service Crew | 18 | 18 | 18 | 18 | 18 | 19 | 19 | 20 | 20 | 20 | 19 | 19 | 14 | 15 | 15 | 19 | 15 | 15 | 14 | 14 | 8 |
| Blasting Helper | 6 | 6 | 6 | 6 | 6 | 6 | 6 | 6 | 6 | 6 | 6 | 6 | 6 | 6 | 6 | 6 | 6 | 6 | 6 | 6 | 6 |
| Dispatch Operator | 4 | 4 | 4 | 4 | 4 | 4 | 4 | 4 | 4 | 4 | 4 | 4 | 4 | 4 | 4 | 4 | 4 | 4 | 4 | 4 | 4 |
| Laborer | 8 | 8 | 8 | 8 | 8 | 8 | 8 | 8 | 8 | 8 | 8 | 8 | 8 | 8 | 8 | 8 | 8 | 8 | 8 | 8 | 8 |
| Operations Total | 88 | 96 | 99 | 100 | 100 | 106 | 109 | 120 | 119 | 121 | 121 | 114 | 108 | 114 | 125 | 125 | 117 | 121 | 119 | 115 | 66 |
| MINE MAINTENANCE: | |||||||||||||||||||||
| Senior Maintenance Mechanics | 25 | 31 | 34 | 38 | 39 | 43 | 46 | 52 | 50 | 53 | 54 | 52 | 49 | 54 | 63 | 63 | 62 | 64 | 64 | 61 | 16 |
| Maintenance Technician | 13 | 16 | 18 | 19 | 20 | 22 | 24 | 27 | 26 | 27 | 28 | 27 | 25 | 28 | 32 | 32 | 32 | 33 | 33 | 31 | 9 |
| Welder / Mechanic | 9 | 11 | 13 | 14 | 15 | 16 | 17 | 19 | 18 | 20 | 20 | 19 | 18 | 20 | 23 | 23 | 23 | 23 | 23 | 22 | 6 |
| AHS Technician | 4 | 4 | 4 | 4 | 4 | 4 | 4 | 4 | 4 | 4 | 4 | 4 | 4 | 4 | 8 | 8 | 8 | 8 | 8 | 8 | 4 |
| Fuel & Lube Man | 8 | 8 | 8 | 8 | 8 | 8 | 8 | 8 | 8 | 8 | 8 | 8 | 8 | 8 | 8 | 8 | 8 | 8 | 8 | 8 | 8 |
| Tire Man | 8 | 8 | 8 | 8 | 8 | 8 | 8 | 8 | 8 | 8 | 8 | 8 | 8 | 8 | 8 | 8 | 8 | 8 | 8 | 8 | 8 |
| Laborer | 4 | 4 | 4 | 4 | 4 | 4 | 4 | 4 | 4 | 4 | 4 | 4 | 4 | 4 | 4 | 4 | 4 | 4 | 4 | 4 | 4 |
| Maintenance Total | 71 | 82 | 89 | 95 | 98 | 105 | 111 | 122 | 118 | 124 | 126 | 122 | 116 | 126 | 146 | 146 | 145 | 148 | 148 | 142 | 55 |
| VS&A at 10.0% | 16 | 18 | 19 | 20 | 20 | 21 | 22 | 24 | 24 | 25 | 25 | 24 | 22 | 24 | 27 | 27 | 26 | 27 | 27 | 26 | 12 |
| TOTAL LABOR REQUIREMENT | 175 | 196 | 207 | 215 | 218 | 232 | 242 | 266 | 261 | 270 | 272 | 260 | 246 | 264 | 298 | 298 | 288 | 296 | 294 | 283 | 133 |
| M3-PN210313.007 31 March 2026 Revision 0 | 195 |
GUNNISON PROJECT Form 43-101F1 Technical Report |
Table 16-11: Gunnison PEA Salary Staff Requirements
|
JOB TITLE |
Time Period | ||||||||||||||||||||
| -2 | -1 | 1 | 2 | 3 | 4 | 5 | 6 | 7 | 8 | 9 | 10 | 11 | 12 | 13 | 14 | 15 | 16 | 17 | 18 | 19 | |
| Mine Manager | 1 | 1 | 1 | 1 | 1 | 1 | 1 | 1 | 1 | 1 | 1 | 1 | 1 | 1 | 1 | 1 | 1 | 1 | 1 | 1 | 1 |
| Secretary | 1 | 1 | 1 | 1 | 1 | 1 | 1 | 1 | 1 | 1 | 1 | 1 | 1 | 1 | 1 | 1 | 1 | 1 | 1 | 1 | 1 |
| Total | 2 | 2 | 2 | 2 | 2 | 2 | 2 | 2 | 2 | 2 | 2 | 2 | 2 | 2 | 2 | 2 | 2 | 2 | 2 | 2 | 2 |
| MINE OPERATIONS: | |||||||||||||||||||||
| Superintendent, Mine | |||||||||||||||||||||
| Operations | 1 | 1 | 1 | 1 | 1 | 1 | 1 | 1 | 1 | 1 | 1 | 1 | 1 | 1 | 1 | 1 | 1 | 1 | 1 | 1 | 1 |
| General Foreman, Mine | |||||||||||||||||||||
| Operations | 1 | 1 | 1 | 1 | 1 | 1 | 1 | 1 | 1 | 1 | 1 | 1 | 1 | 1 | 1 | 1 | 1 | 1 | 1 | 1 | 1 |
| Supervisor, Mine Ops | 4 | 4 | 4 | 4 | 4 | 4 | 4 | 4 | 4 | 4 | 4 | 4 | 4 | 4 | 4 | 4 | 4 | 4 | 4 | 4 | 4 |
| Supervisor, Drill & Blast | 2 | 2 | 2 | 2 | 2 | 2 | 2 | 2 | 2 | 2 | 2 | 2 | 2 | 2 | 2 | 2 | 2 | 2 | 2 | 2 | 2 |
| Supervisor, Mine Support | |||||||||||||||||||||
| Services | 1 | 2 | 2 | 2 | 2 | 2 | 2 | 2 | 2 | 2 | 2 | 2 | 2 | 2 | 2 | 2 | 2 | 2 | 2 | 2 | 2 |
| Mine Training Supervisor | 1 | 1 | 1 | 1 | 1 | 1 | 1 | 1 | 1 | 1 | 1 | 1 | 1 | 1 | 1 | 1 | 1 | 1 | 1 | 1 | 1 |
| Mine Operations Total | 10 | 11 | 11 | 11 | 11 | 11 | 11 | 11 | 11 | 11 | 11 | 11 | 11 | 11 | 11 | 11 | 11 | 11 | 11 | 11 | 11 |
| MINE MAINTENANCE: | |||||||||||||||||||||
| Superintendent, Mine | |||||||||||||||||||||
| Maintenance | 1 | 1 | 1 | 1 | 1 | 1 | 1 | 1 | 1 | 1 | 1 | 1 | 1 | 1 | 1 | 1 | 1 | 1 | 1 | 1 | 1 |
| General Foreman, Mine | |||||||||||||||||||||
| Maintenance | 4 | 4 | 4 | 4 | 4 | 4 | 4 | 4 | 4 | 4 | 4 | 4 | 4 | 4 | 4 | 4 | 4 | 4 | 4 | 4 | 4 |
| Sr Planner, Mine | |||||||||||||||||||||
| Maintenance | 2 | 2 | 2 | 2 | 2 | 2 | 2 | 2 | 2 | 2 | 2 | 2 | 2 | 2 | 2 | 2 | 2 | 2 | 2 | 2 | 2 |
| Supervisor, Mine | |||||||||||||||||||||
| Maintenance - Mechanical | 4 | 4 | 4 | 4 | 4 | 4 | 4 | 4 | 4 | 4 | 4 | 4 | 4 | 4 | 4 | 4 | 4 | 4 | 4 | 4 | 4 |
| Planner, Mine | |||||||||||||||||||||
| Maintenance | 2 | 2 | 2 | 2 | 2 | 2 | 2 | 2 | 2 | 2 | 2 | 2 | 2 | 2 | 2 | 2 | 2 | 2 | 2 | 2 | 2 |
| Maintenance Clerk | 2 | 2 | 2 | 2 | 2 | 2 | 2 | 2 | 2 | 2 | 2 | 2 | 2 | 2 | 2 | 2 | 2 | 2 | 2 | 2 | 2 |
| Mine Maintenance Total | 15 | 15 | 15 | 15 | 15 | 15 | 15 | 15 | 15 | 15 | 15 | 15 | 15 | 15 | 15 | 15 | 15 | 15 | 15 | 15 | 15 |
| MINE ENGINEERING: | |||||||||||||||||||||
| Chief Mine Engineer | 1 | 1 | 1 | 1 | 1 | 1 | 1 | 1 | 1 | 1 | 1 | 1 | 1 | 1 | 1 | 1 | 1 | 1 | 1 | 1 | 1 |
| Chief Surveyor | 1 | 1 | 1 | 1 | 1 | 1 | 1 | 1 | 1 | 1 | 1 | 1 | 1 | 1 | 1 | 1 | 1 | 1 | 1 | 1 | 1 |
| Sr. Engineer, Mine | 1 | 1 | 1 | 1 | 1 | 1 | 1 | 1 | 1 | 1 | 1 | 1 | 1 | 1 | 1 | 1 | 1 | 1 | 1 | 1 | 1 |
| Dispatch Engineer | 1 | 1 | 1 | 1 | 1 | 1 | 1 | 1 | 1 | 1 | 1 | 1 | 1 | 1 | 1 | 1 | 1 | 1 | 1 | 1 | 1 |
| Mine Engineer | 1 | 1 | 1 | 1 | 1 | 1 | 1 | 1 | 1 | 1 | 1 | 1 | 1 | 1 | 1 | 1 | 1 | 1 | 1 | 1 | 1 |
| Engineer III, Mine | 2 | 2 | 2 | 2 | 2 | 2 | 2 | 2 | 2 | 2 | 2 | 2 | 2 | 2 | 2 | 2 | 2 | 2 | 2 | 2 | 2 |
| Technician 3, Survey | 2 | 2 | 3 | 3 | 3 | 3 | 3 | 3 | 3 | 3 | 3 | 3 | 3 | 3 | 3 | 3 | 3 | 3 | 3 | 3 | 3 |
| Technician 1, Survey | 2 | 2 | 2 | 2 | 2 | 2 | 2 | 2 | 2 | 2 | 2 | 2 | 2 | 2 | 2 | 2 | 2 | 2 | 2 | 2 | 2 |
| Mine Engineering Total | 11 | 11 | 12 | 12 | 12 | 12 | 12 | 12 | 12 | 12 | 12 | 12 | 12 | 12 | 12 | 12 | 12 | 12 | 12 | 12 | 12 |
| MINE GEOLOGY: | |||||||||||||||||||||
| Chief Mine Geologist | 1 | 1 | 1 | 1 | 1 | 1 | 1 | 1 | 1 | 1 | 1 | 1 | 1 | 1 | 1 | 1 | 1 | 1 | 1 | 1 | 1 |
| Sr Geologist | 1 | 1 | 1 | 1 | 1 | 1 | 1 | 1 | 1 | 1 | 1 | 1 | 1 | 1 | 1 | 1 | 1 | 1 | 1 | 1 | 1 |
| Geologist III | 1 | 1 | 1 | 1 | 1 | 1 | 1 | 1 | 1 | 1 | 1 | 1 | 1 | 1 | 1 | 1 | 1 | 1 | 1 | 1 | |
| Geologist II | 1 | 1 | 1 | 1 | 1 | 1 | 1 | 1 | 1 | 1 | 1 | 1 | 1 | 1 | 1 | 1 | 1 | 1 | 1 | 1 | |
| Technician, Ore Control | 4 | 4 | 4 | 4 | 4 | 4 | 4 | 4 | 4 | 4 | 4 | 4 | 4 | 4 | 4 | 4 | 4 | 4 | 4 | ||
| Mine Geology Total | 2 | 4 | 8 | 8 | 8 | 8 | 8 | 8 | 8 | 8 | 8 | 8 | 8 | 8 | 8 | 8 | 8 | 8 | 8 | 8 | 8 |
| TOTAL PERSONNEL | 40 | 43 | 48 | 48 | 48 | 48 | 48 | 48 | 48 | 48 | 48 | 48 | 48 | 48 | 48 | 48 | 48 | 48 | 48 | 48 | 48 |
| M3-PN210313.007 31 March 2026 Revision 0 | 196 |
GUNNISON PROJECT Form 43-101F1 Technical Report |
| 16.8 | Mine Plan Drawings |
Figure 16-8 through Figure 16-15 illustrate the pit and waste dump configurations at time periods of mine progression.
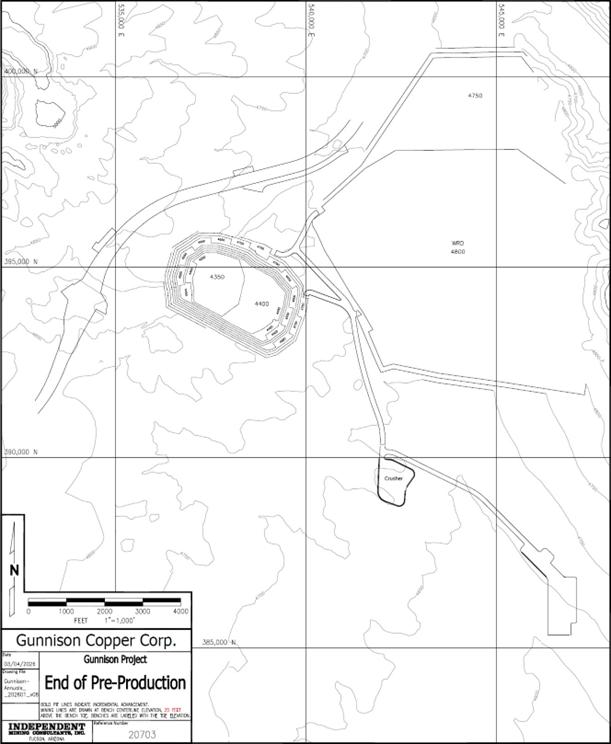
Figure 16-8: Pit and Dump Configuration at the end of Pre-Production Mining
| M3-PN210313.007 31 March 2026 Revision 0 | 197 |
GUNNISON PROJECT Form 43-101F1 Technical Report |
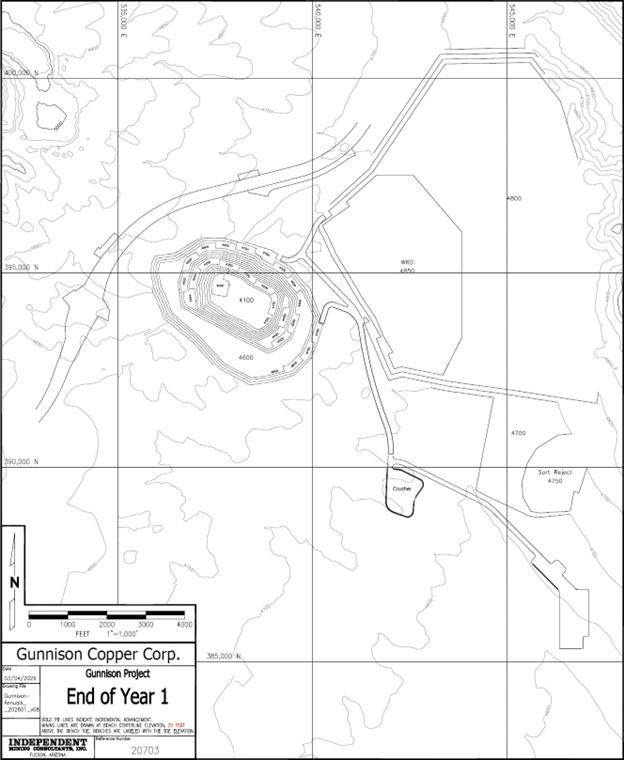
Figure 16-9: Pit and Dump Configuration at the end of Year 1 of Mining
| M3-PN210313.007 31 March 2026 Revision 0 | 198 |
GUNNISON PROJECT Form 43-101F1 Technical Report |
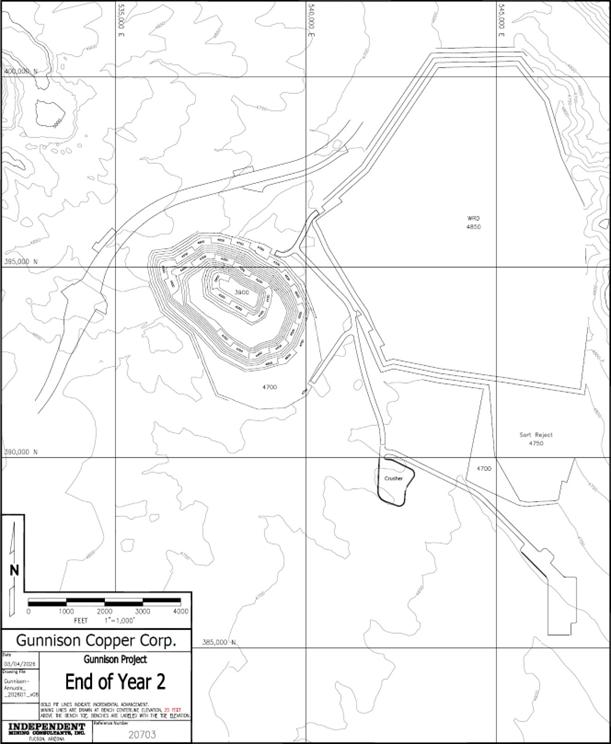
Figure 16-10: Pit and Dump Configuration at the end of Year 2 of Mining
| M3-PN210313.007 31 March 2026 Revision 0 | 199 |
GUNNISON PROJECT Form 43-101F1 Technical Report |
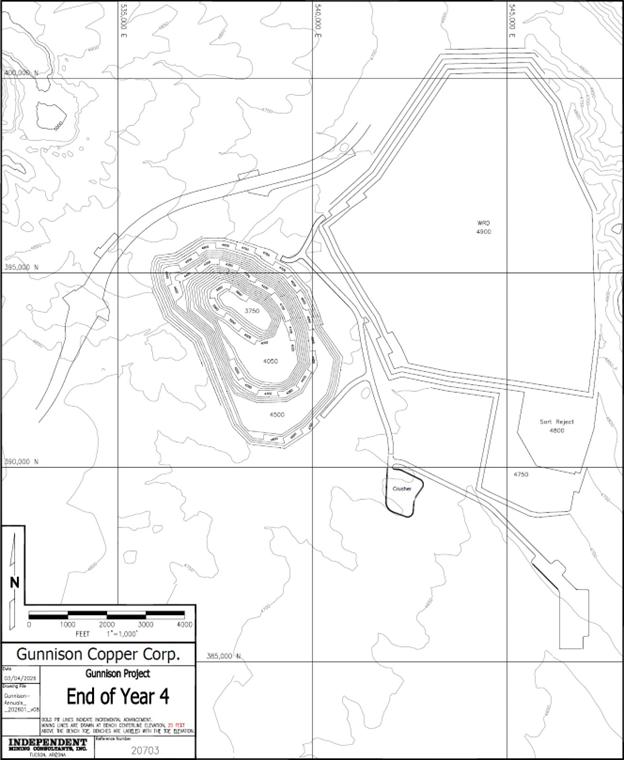
Figure 16-11: Pit and Dump Configuration at the end of Year 4 of Mining
| M3-PN210313.007 31 March 2026 Revision 0 | 200 |
GUNNISON PROJECT Form 43-101F1 Technical Report |
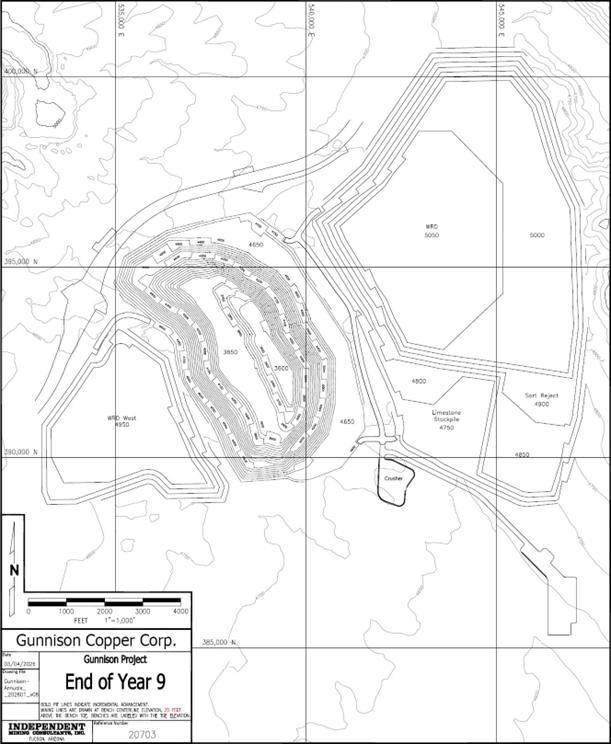
Figure 16-12: Pit and Dump Configuration at the end of Year 9 of Mining
| M3-PN210313.007 31 March 2026 Revision 0 | 201 |
GUNNISON PROJECT Form 43-101F1 Technical Report |
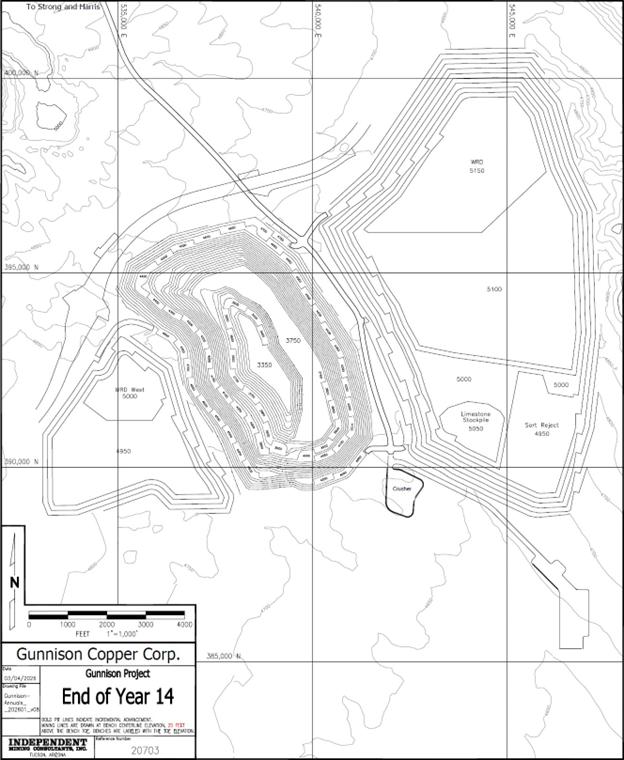
Figure 16-13: Pit and Dump Configuration for Gunnison Pit at the end of Year 14 of Mining
| M3-PN210313.007 31 March 2026 Revision 0 | 202 |
GUNNISON PROJECT Form 43-101F1 Technical Report |
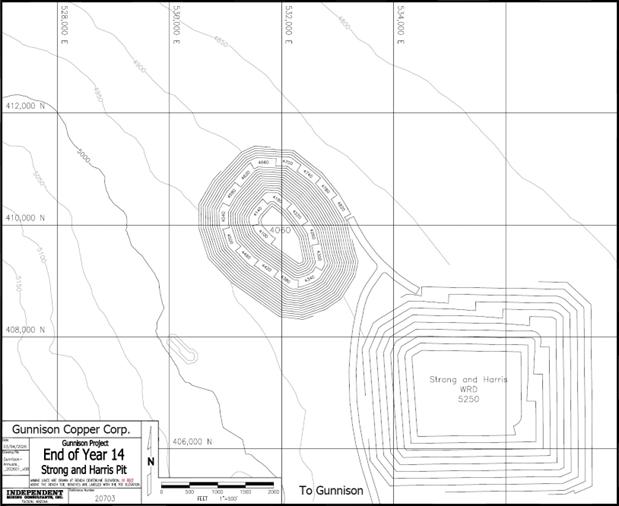
Figure 16-14: Pit and Dump Configuration for Strong & Harris Pit at the end of Year 14 of Mining
| M3-PN210313.007 31 March 2026 Revision 0 | 203 |
GUNNISON PROJECT Form 43-101F1 Technical Report |
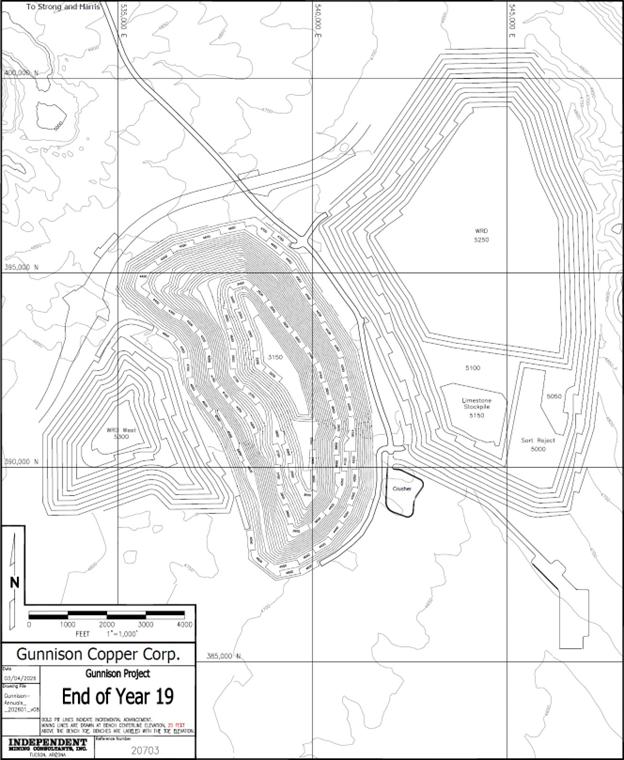
Figure 16-15: Pit and Dump Configuration at the end of Year 19(End of Mine Life) of Mining
| M3-PN210313.007 31 March 2026 Revision 0 | 204 |
GUNNISON PROJECT Form 43-101F1 Technical Report |
| 16.9 | Pit Dewatering |
| 16.9.1 | Groundwater Flow Model |
The groundwater flow model for the Gunnison ISR project, completed for the 2016 Aquifer Protection The groundwater flow model developed for the Gunnison ISR project Aquifer Protection Permit application submitted in 2016 has been updated for the Gunnison Open Pit Mine PEA. The groundwater model domain (Figure 16-16) was expanded to the north to accommodate the future Strong & Harris open pit. The Strong & Harris open pit area lies just north of a surface water divide separating the Upper Tres Alamos Watershed to the north from the Walnut Wash Watershed to the south. ADWR also divides these basins between the Allen Flat Groundwater Sub-Basin (Upper Tres Alamos) and the Wilcox Groundwater Basin to the south (Walnut Wash, Big Wash and IT Draw). The Upper Tres Alamos Wash Sub-Basin drains toward the San Pedro River and the Wilcox Sub-Basin drains into the Wilcox Playa.
The model grid was simplified to include uniform cells that are each 200 feet by 200 feet. The model has seven (7) layers with a total of 309,225 active calculation cells. The groundwater flow model domain boundaries are shown in Figure 16-16.
The stress period setup used in the modeling is presented in Table 16-12. Annual stress periods are used throughout the simulation of mining. Pre-mining conditions for the Gunnison project were simulated using a steady-state model calibrated to water levels in the basin measured up to 2019. Thereafter, the model simulates pumping operations for mine water supply from the Section 19 wells, hydraulic containment required for the former ISR operations from wells HC-17, HC-18, and HC-15B, and the Moore Shaft using pumping rates provided by Gunnison. Hydraulic containment pumping is simulated to continue until open pit operations cause the abandonment of these wells in Stress Period 14 (2032). For the purposes of this PEA, open pit mining was assumed to start in 2029. The pit reaches the water table by the end of 2028 (Stress Period 10) and thereafter, the pit bottom is deepened below the water table.
Table 16-12: Stress Period Setup
| Mine Year | Stress Periods | End Date | Year | Comments |
| - | 1 | 12/31/2019 | NA | 1 day Pre-Mining (SS) Period |
| -9 to -3 | 2-8 | 12/31/2026 | 2020 | Pre-Mining Operations |
| -2 to -1 | 9-10 | 12/31/2028 | 2022 | Overburden Stripping |
| 1 to 20 | 11-30 | 12/31/2048 | 2024 | Mining Operations |
| M3-PN210313.007 31 March 2026 Revision 0 | 205 |
GUNNISON PROJECT Form 43-101F1 Technical Report |
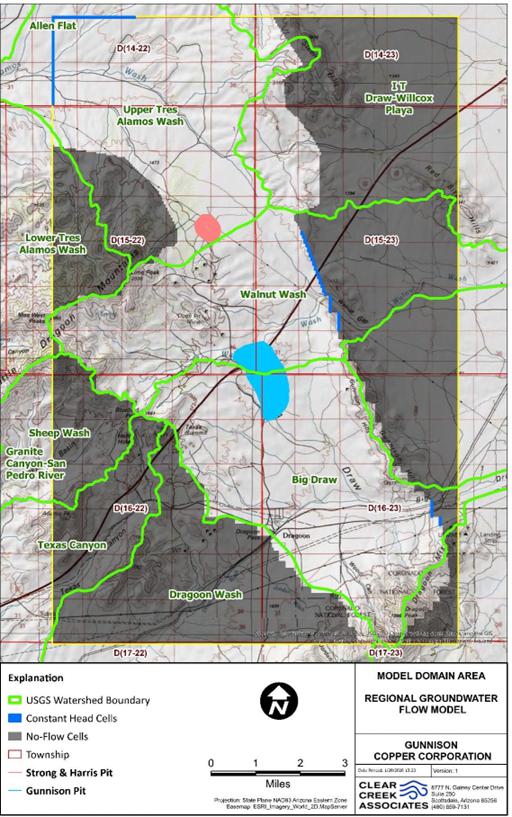
Figure 16-16: Groundwater Flow Model
| M3-PN210313.007 31 March 2026 Revision 0 | 206 |
GUNNISON PROJECT Form 43-101F1 Technical Report |
| 16.9.1.1 | Pit Simulation |
Drain cells that are used to simulate the deepening of the open pit begin to receive groundwater flow during Year 1 of mining operations (Stress Period 11). Figure 16-17 shows the ultimate pit elevation values and the steady-state starting water levels. Flow to drain cells can only occur in model cells with a pit bottom elevation lower than the steady-state water level. Based on the ultimate pit elevations, Figure 16-17 shows the model cells with drain cells, which include elevations less than 4,400 feet AMSL. These model cells comprise the drains simulated in the model with elevations lowered over time. Pit elevation contours were used for each year to set the drain cell elevations, based on the mine plan provided by IMC.
The Strong & Harris open pit is simulated in the same way as the Gunnison open pit. IMC provided pit shells representing pit depths over time as mining progresses (Figure 16-18). Drain cells were input to the model with drain depths consistent with the IMC mine plan. The Strong & Harris pit is assumed to start during Stress Period 21 (2039) with completion by Stress Period 26 (2044). Thereafter, drain elevations were kept constant to the end of the simulation.
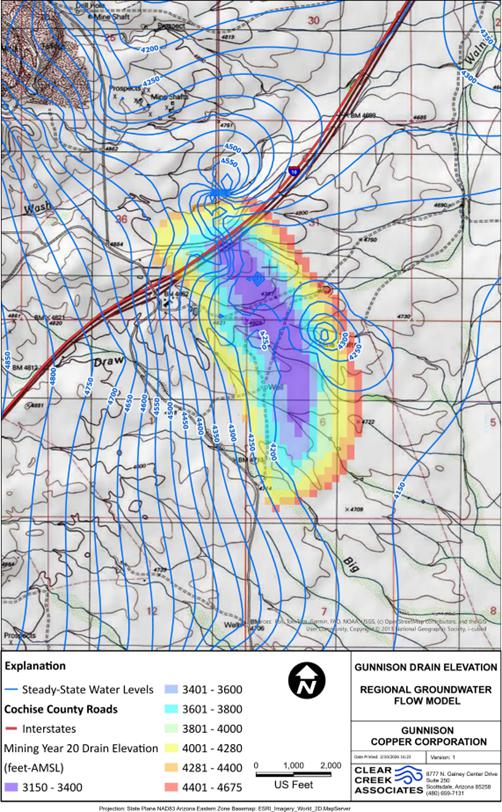
Figure 16-17: Final Drain Elevation Gunnison Pit
| M3-PN210313.007 31 March 2026 Revision 0 | 207 |
GUNNISON PROJECT Form 43-101F1 Technical Report |
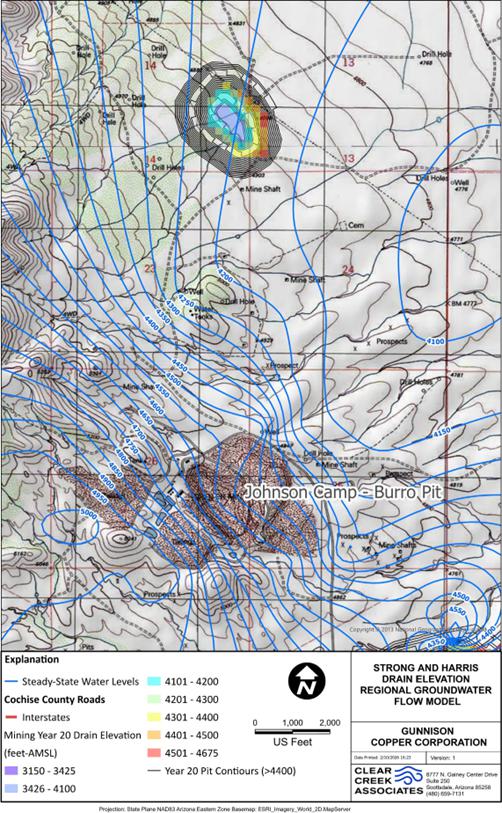
Figure 16-18: Final Drain Elevation Strong & Harris Pit
| M3-PN210313.007 31 March 2026 Revision 0 | 208 |
GUNNISON PROJECT Form 43-101F1 Technical Report |
Drain conductance values were set based on the hydraulic properties and dimensions of the model cells represented by the drain cells.
| 16.9.1.2 | Boundary Conditions |
The revised Gunnison and Strong & Harris open pits model included a constant flux boundary condition representing flow out of the basin to the east along the Gunnison Hills near Walnut Wash gap and a constant head boundary where Big Draw exists the model domain at the southeast corner (Figure 16-16). Constant head cells were also placed at the far northwest corner of the model in the Upper Tres Alamos Wash Sub-Basin to represent flow existing the model toward the San Pedro River. The constant head value was fixed at an elevation of 4,180 feet based on interpretation of groundwater level data in the basin. The boundary was placed a considerable distance from the Strong & Harris pit to prevent the boundary from influencing predicted groundwater inflow to the pit.
| 16.9.1.3 | Model Results |
The model simulates 20 years of open pit mining. Figure 16-19 illustrates the predicted groundwater elevation contours at the end of open pit mining. A large cone-of-depression forms around the Gunnison open pit causing an inward gradient. Water levels simulated near the smaller Strong & Harris pit do not show a pronounced cone of depression.
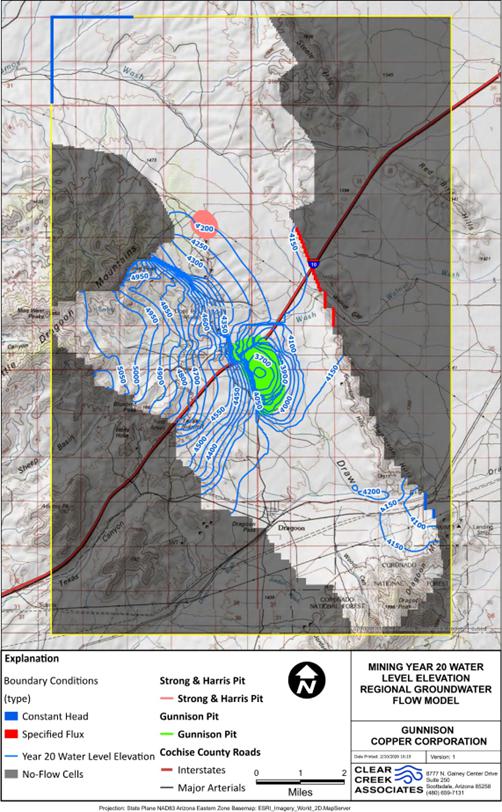
Figure 16-19: Water Level Elevation for Mining Year 20 Flow Model
| M3-PN210313.007 31 March 2026 Revision 0 | 209 |
GUNNISON PROJECT Form 43-101F1 Technical Report |
Figure 16-20 shows the predicted inflow rates to the model drains representing the advancement of the Gunnison Pit (red line). The red line is the best fit polynomial line to the raw predictions (blue line). The smoothed red line was necessary to eliminate the variability caused by 1) the dimensions of the model grid coupled with 2) the length of stress periods. The brown line in Figure 16-20 represents the pit bottom elevation over time. Figure 16-21 shows the predicted inflow rates to the Strong & Harris pit (green line) in relation to the pit bottom over time. The model-simulated pit advancement is based upon the yearly mine plan contours. Because the groundwater table is reached quickly, drainage starts by the end of the first mining year.
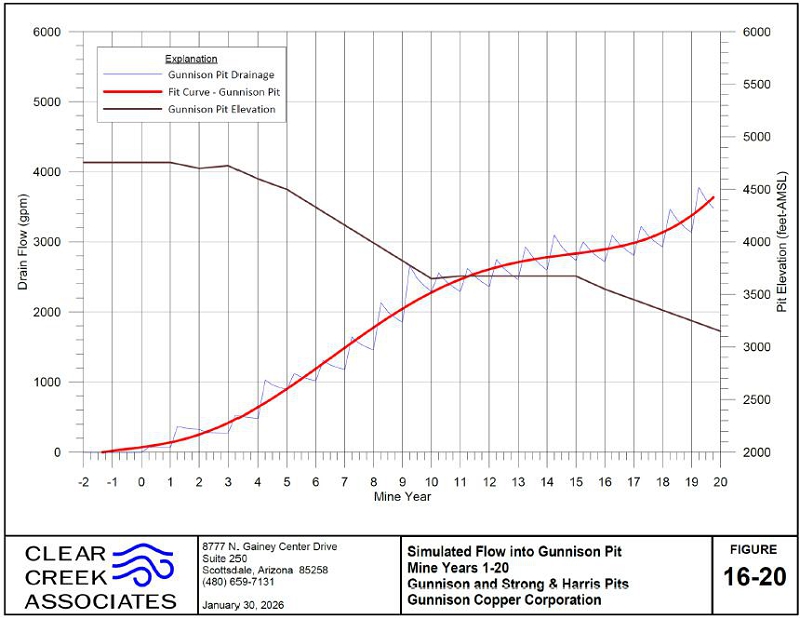
Figure 16-20: Simulated Drainage Flows into Gunnison Pit
The inflow to the Gunnison pit increases over time reaching a maximum of about 4,500 gpm after 20 years of mining. The Strong & Harris pit inflow, shown on Figure 16-21, rapidly spikes in the first year of mining (2042) at about 150 gpm. However, as explained above, this “spike” is an aberration of the model solution. The inflow will likely slowly increase to about 75-100 gpm and thereafter remain relatively constant. For this simulation, pit dewatering is assumed to continue in the Strong & Harris pit after cessation of mining. Pit lake simulations were not completed for this analysis.
| M3-PN210313.007 31 March 2026 Revision 0 | 210 |
GUNNISON PROJECT Form 43-101F1 Technical Report |
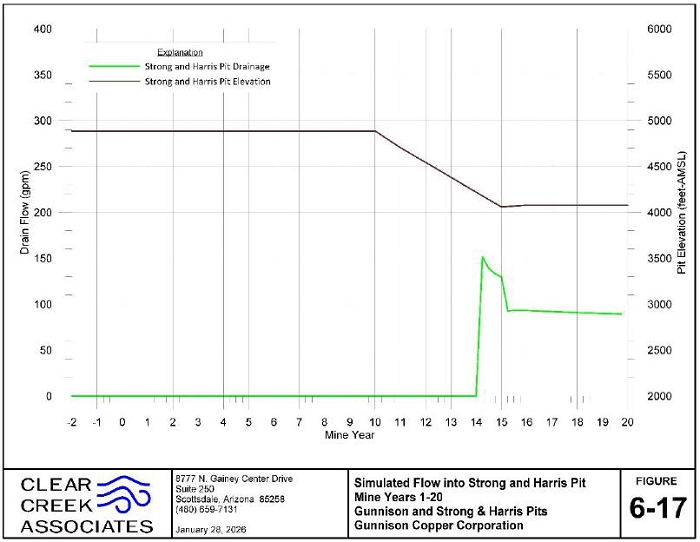
Figure 16-21: Simulated Flow into Strong & Harris Pit
| 16.9.1.4 | Limitations of the Simulation |
The model simulation assumes that drainage flows into the pit and is pumped out. Once mining is terminated, the pits will fill and pit lakes will likely form. This simulation does not evaluate the formation of pit lakes; the ultimate fate of the pit is not considered. Additionally, the original ISR model was constructed to simulate flows in the mineralized material, which is dominated by a fracture flow environment. This may result in an over-estimate of hydraulic conductivity, as the lower hydraulic conductivity of the unfractured rock may impact the overall flows during large-scale dewatering during the pit construction. The same issue would also apply for the hydraulic storage values, which were calibrated to reflect the flow in the mineralized material, dominated by fractures. These storage values may also be high for a large-scale dewatering of the open pit. These factors may result in an over-estimate of dewatering rates.
The conductance value assigned to the drain cells is uncertain as it represents the resistance to flow into the pit from saturated rock. This value is not directly measurable but is important to the predictions of flow into the pit. Refinement of the pit dewatering rate for a future feasibility study should include a sensitivity analysis of the conductance term.
Pit deepening is presumed to decline based on the pit contours presented in the IMC mine plan to maximum depth over the 20-year course of mining. It is likely that the decline rate would vary and focus on the mineralized material distributions encountered. This analysis also assumes that the water table is reached at the beginning of the first mining year.
| 16.9.1.5 | Conclusion |
In summary, the drainage of groundwater into the Gunnison open pit is likely to result in flows as high as about 4,500 gpm by the end of mining. This dewatering rate may be high due to simplifications incorporated in the model simulation. This rate of dewatering is recognized to be high relative to other open pit mines in Arizona, however, the mineralized material at Gunnison is quite fractured and broken relative to other mineralized material; therefore, a high rate of dewatering is expected. The smaller Strong & Harris pit is predicted to have groundwater inflow of between 75 and 100 gpm.
| M3-PN210313.007 31 March 2026 Revision 0 | 211 |
GUNNISON PROJECT Form 43-101F1 Technical Report |
| 17 | RECOVERY METHODS |
| 17.1 | Introduction |
The Gunnison open pit-heap leach operation will place mineralized oxide, supergene, and sulfide material from the open pit on to the leach pad as primary crushed material, described in Section 16.
The oxide and supergene copper-bearing material will be irrigated with acidified raffinate pumped from the Gunnison Raffinate Pond. Starting in Year 10 of the mine schedule, sulfide-dominant material is scheduled to be mined and treated with an engineered sulfide enhancement treatment process ahead of heap leaching to improve the kinetics and copper recovery from primary sulfide materials.
Pregnant leach solution (PLS) generated from the heap-leach facility will be processed in a solvent extraction–electrowinning (SX-EW) plant designed to produce 175 million pounds per annum (Mlb/a) of copper cathode. PLS solutions will be collected by an overliner collection system and discharged to the PLS Pond. PLS is pumped from the PLS Pond to the Gunnison SX Feed Tank. From this tank, the PLS solution will be treated in conventional solvent extraction and electrowinning facilities to produce copper cathode. Figure 17-1 provides a conceptual overview of the process.
| 17.2 | Material Sorting |
One of the drawbacks to mining the full mineral resources at the Gunnison Deposit is the relatively high carbonate content in the skarn and limestone/dolomite host rocks that comprise some of the mineralization. GCC conceived of a plan to reduce carbonate content that leads to high acid consumption by testing optical material sorting to pre-concentrate the mineralized material and reject high carbonate-low copper content rocks that are intermixed with the mineralization.
High carbonate content/high acid consuming formations, namely the Devonian Martin Formation, and the Escabrosa, Horquilla, and Earp Formations from the Strong & Harris Deposit will be processed through a material sorting facility to reject high carbonate materials and pre-concentrate the material headed to the leach pad, the Lower Abrigo, Middle Abrigo, and Upper Abrigo Formations as well as Bolsa Quartzite will not be sorted.
Based on the material sorting test results, a preliminary processing route was recommended. Run-of-mine (ROM) material will be crushed and conveyed either directly to the leach pad, if classified as low-carbonate (low acid-consuming), or routed to the material sorting plant for removal of high-carbonate (high acid-consuming) fractions. Within the material sorting plant, the feed will undergo classification and secondary crushing. Material passing 3/8” will be screened ahead of sorting and directed to the leach pad or directly to the waste dump, depending on its acid-consumption characteristics. Material coarser than 3/8” will be fed to classification to produce three size fractions for material sorting: coarse (+3” to 6”), intermediate (+1” to 3”), and fine (+3/8” to 1”). Water sprays will be applied to the screening equipment to wash particle surfaces and enhance optical sorting performance. Each size fraction will then be processed through dedicated sorting machines. The sorted product will be conveyed to the leach pad for copper acid heap leaching, together with unsorted low-carbonate material.
| M3-PN210313.007 31 March 2026 Revision 0 | 212 |
GUNNISON PROJECT Form 43-101F1 Technical Report |
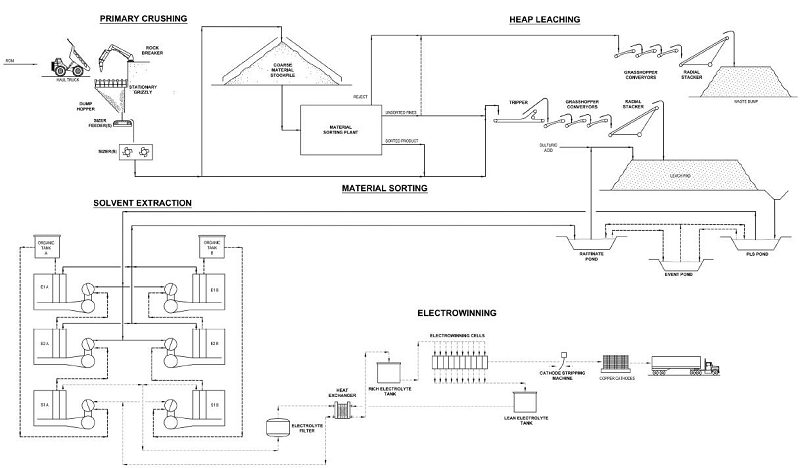
Source: M3, 2026
Figure 17-1: Overall Process Flow Diagram
| M3-PN210313.007 31 March 2026 Revision 0 | 213 |
GUNNISON PROJECT Form 43-101F1 Technical Report |
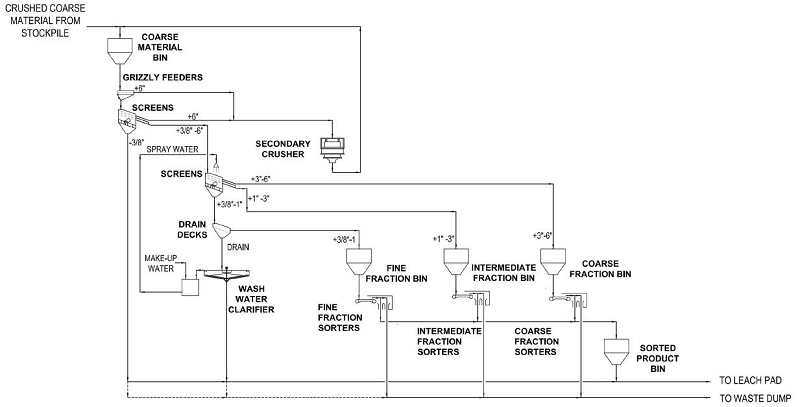
Source: M3, 2026
Figure 17-2: Simplified Material Sorting Flowsheet
| M3-PN210313.007 31 March 2026 Revision 0 | 214 |
GUNNISON PROJECT Form 43-101F1 Technical Report |
| 17.3 | Primary Crushing |
ROM material will be delivered by haul trucks to the primary crushing area, where it will be discharged onto a stationary grizzly equipped with 2.5 ft × 2.5 ft square openings.
Oversize material remaining on the grizzly will be reduced using a dedicated hydraulic rock breaker to ensure safe and continuous flow of material. Once adequately fragmented, the rock will fall through the grizzly openings and join the undersize stream.
The grizzly undersize will be collected in a receiving hopper and withdrawn by two apron feeders. Each apron feeder will provide controlled, steady feed to a corresponding mineral sizer unit. The mineral sizers will perform the primary crushing duty, reducing the material to a product size with a P80 of approximately 6 inches.
The crushed product from both sizers will be transferred onto a conveyor system for downstream handling. The conveying system will route the material either to the coarse material stockpile or, alternatively, directly to the leach pad, depending on operational requirements and material blending strategies.
This primary crushing and material-handling circuit is designed to ensure reliable throughput, controlled feed characteristics, and flexibility in directing crushed material to subsequent processing stages.
| 17.4 | Stockpile and Reclaim |
The coarse material stockpile will be designed to provide a live operating volume equivalent to 24 hours of continuous feed to the Material Sorting plant. This live capacity ensures stable plant operation, mitigates upstream feed variability, and allows for maintenance flexibility within the primary crushing circuit. This stockpile will be covered to mitigate fines from blowing and also prevent high precipitation events from wetting the stockpile material.
Crushed mineralized material will be reclaimed from the coarse material stockpile via six apron feeders positioned beneath the stockpile. The feeders will withdraw mineralized material at a controlled and consistent rate, discharging onto the conveyor system supplying the Material Sorting plant.
| 17.5 | Screening Plant |
The Stockpile Reclaim Conveyor will discharge crushed material into a Coarse Material Bin, which provides surge capacity and controlled feed to the secondary crushing and screening circuit. Three vibrating grizzly feeders with 6-inch openings, withdraw material from the bin.
Oversize material retained on the grizzly decks (>6 inches) will be directed to the Secondary Cone Crusher, where it will be reduced to a minus 6-inch product. The crushed product from the Secondary Cone Crusher will be returned to the Coarse Material Bin via the Stockpile Reclaim Conveyor.
The grizzly undersize (<6 inches) will be fed to three triple-deck Secondary Crusher Feed Screens. The screens are configured with top, middle, and bottom deck openings of 6 inches, 1 inch, and 3/8 inch, respectively.
Depending on its properties, the 3/8-inch undersize fraction (fine material) will be conveyed either to the waste dump or to the leach pad mixed with sorted or unsorted material that is diverted around the primary crushers prior to placement on the leach pad.
The 6-inch oversize fraction from the top deck will be combined with the grizzly oversize material and will be routed to the Secondary Cone Crusher for further size reduction.
| M3-PN210313.007 31 March 2026 Revision 0 | 215 |
GUNNISON PROJECT Form 43-101F1 Technical Report |
The intermediate 1-inch and 3/8-inch oversize fractions generated from the middle and lower decks, respectively, will be combined and conveyed to three triple-deck wet material sorting feed screens. These wet screens will be configured with top, middle, and bottom deck openings of 3-inch, 2-inch, and 1-inch, respectively, and are equipped with water spray systems to wash and clean particle surfaces, ensuring optimal sensor performance in the downstream material sorting circuit.
The 1-inch undersize material from the wet screens will be discharged onto three drain decks, where excess water will be removed and recycled prior to further handling.
Following screening and dewatering, three size fractions—+3” to -6”, +1” to -3”, and +3/8” to -1”—will be directed to their respective material sorter feed bins for processing in Material Sorters.
Drainage water collected from the drain decks will be routed to a clarifier. The clarified water will be recovered for reuse in the wet screening and material sorting circuits. The clarifier underflow will be directed to the material sorting reject conveyor to the waste dump.
| 17.6 | Mineralized Material Sorting |
Each of the three classified size fractions will be directed to dedicated material sorting circuits equipped with parallel sorting machines. The coarse fraction (+3” to 6”) will be processed through five (5) material sorters operating in parallel. The intermediate fraction (+1” to 3”) will be processed through thirteen (13) parallel material sorters, and the fine fraction (+3/8” to 1”) will likewise be treated using fourteen (14) parallel units.
The material sorters will employ primarily optical detection technology to discriminate mineralized rock particles from waste rock. Based on metallurgical testwork and projected feed characteristics, approximately 45% of the total sorter feed is expected to be rejected as waste and transported via conveyor to the Waste Rock dump. The remaining mineralized material, designated as material sorter product, will be conveyed to the leach pad for further processing.
| 17.7 | Gunnison Leach Pad |
The location of the leach pad is southeast of the Gunnison pit in an area where the natural drainage is toward the southeast, as shown on Figure 17-4. The full leach pad will be approximately 909.6 acres in area and oriented to match existing topography so that the overliner collection system drains by gravity to the southeastern toe of the leach pad for collection. Solutions will be conveyed via gravity pipeline to the Gunnison PLS pond and pumped to the SX Feed Tank with a set of 316SS vertical turbine pumps. The leach pad will be constructed on prepared subgrade that has been cut and filled with borrow materials within the pad area or sourced from other suitable materials on the mine site. The conceptual overall site plan is shown in Figure 18-1.
The total cut to fill volume will be approximately 4.0 million cubic yards (yd3) with an additional 314,025 yd3 of miscellaneous cut materials. Approximately 1.4 million yd3 of low hydraulic conductivity soil liner (1x10⁻⁶ cm/s maximum saturated hydraulic conductivity) will be sourced from within the pad perimeter or from other suitable materials on the mine site. The low hydraulic conductivity soil liner will be screened (3/8” minus) and compacted in two 6-inch lifts to construct a 12-inch-thick layer beneath the HDPE liner. After installation of the HDPE liner over each phased pad area, a system of perforated leachate solution collection pipes will be installed atop the HDPE liner (and in some cases upon a pipe bedding material).
The solution collection pipe network will be covered in an overliner aggregate consisting of minus ¾” material (also referred to as liner protection material). This material will be placed to form a 4 ft thick layer above the HDPE liner. It is anticipated that this material, totaling approximately 5.4 million yd3, will be obtained from screened alluvial overburden removed from the leach pad area supplemented with suitable materials from pre-stripping operations from the mine.
| M3-PN210313.007 31 March 2026 Revision 0 | 216 |
GUNNISON PROJECT Form 43-101F1 Technical Report |
The Gunnison leach pad will be constructed in four phases for a total lined footprint of 840.8 acres. Phase 1 consists of approximately 244 acres (29% of the total lined 840.8 acre leach pad) and will be prepared and constructed during the initial construction period for the mine and processing plant (Years -2 and -1). Phase 2 adds an additional 212 acres (25% of the total lined area of the leach pad) to be constructed at the beginning of Year -1 to Year 1. Phase 3 adds an additional
210.8 acres (25% of the total lined area of the leach pad) at the beginning of Year 1 to Year 2. Phase 4 completes the build-out of the pad with 21% in of the total leach pad beginning in Year 2 and completed in Year 3 to provide the capacity for the life of mine.
Phase 4 of the Gunnison leach pad will have new technology to enhance heap leaching recovery and kinetics of copper sulfide bearing material that underlies the oxide and transition resources in the Gunnison open pit. The sulfide material will not be mined in significant amounts until Year 8. The technology for enhanced or engineered sulfide heap leaching has not been defined yet. The process parameters for enhanced heap leaching could include a finer crush size, chemical additives and aeration to promote oxidation of sulfides. Future testwork will confirm the viability of these options.
Leaching is conducted on minus 6” material that is stacked by a mechanical system of overland conveyors, grasshopper conveyors and a mobile radial stacker. The heap leach material will be leveled and ripped with a dozer. Drilling and blasting parameters will be adjusted as necessary to minimize the production of excessive amounts of fines that could impair percolation of the leach solution that could leach slowly and clog the overliner material.
Lifts of primary crushed mineralized material are planned to be placed in lifts 30 ft high. There currently is no plan to install impermeable inter-lift liners between lifts. The inter-lift liners could prevent high-grade PLS percolating from the fresh lift down into leached-out (spent) material. Spent material continues to consume acid, weakening the strength of the solution and its copper-carrying capacity. This could cause re-deposition of copper and a reduction in PLS grade. Leach pad height is limited to 336 ft to mitigate this possibility. Evaluation of lift height and the potential use of inter-lift liners will be conducted using empirical operational data.
Sulfuric acid consumption for leach material ranges from 24 lbs/ton for the Lower Abrigo, Bolsa, and Quartz Monzonite to 70 lbs/ton for the Martin, Escabrosa, and Horquilla formations, based on column testwork reports described in Section 13. The average acid consumption for the mineral resources in the conceptual mine plan is approximately 53 lb/ton of material. The application rate of acidified leach solution is planned to start at 0.002 gpm/ft2.
| M3-PN210313.007 31 March 2026 Revision 0 | 217 |
GUNNISON PROJECT Form 43-101F1 Technical Report |
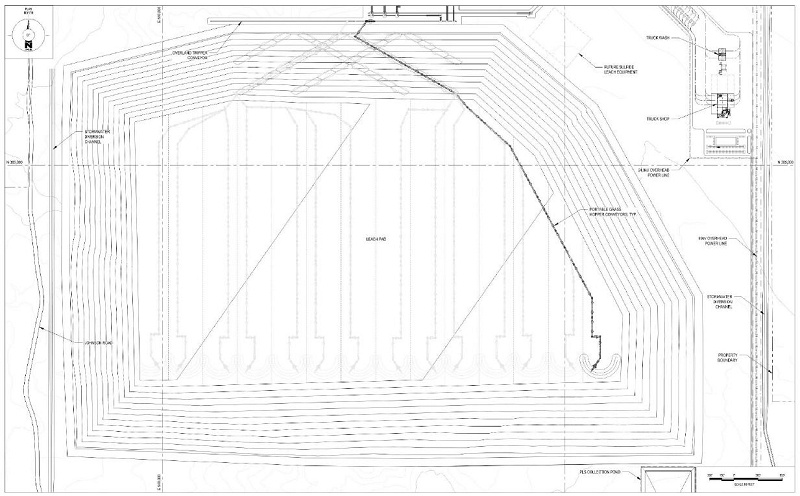
Source: Geo-logic, 2026
Figure 17-3: Gunnison Project Leach Pad
| M3-PN210313.007 31 March 2026 Revision 0 | 218 |
GUNNISON PROJECT Form 43-101F1 Technical Report |
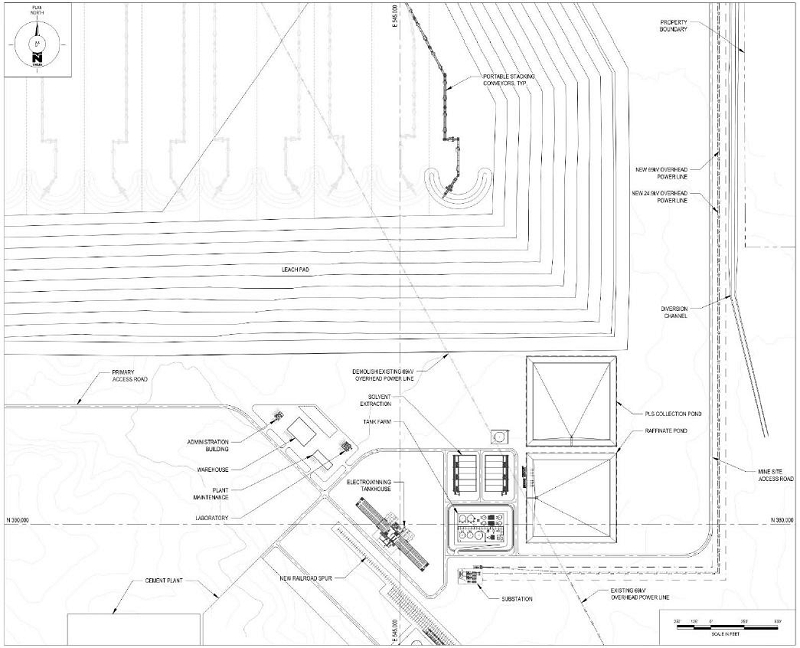
Source: M3, 2026
Figure 17-4: Gunnison Leach Pad and Plant Configuration
| M3-PN210313.007 31 March 2026 Revision 0 | 219 |
GUNNISON PROJECT Form 43-101F1 Technical Report |
| 17.8 | SX-EW Process Description |
The Gunnison SX-EW plant has a design capacity of 175 mppa of copper cathode production. The PLS from the Leach Pad provides the PLS feed solution for the SX-EW process. Copper is extracted from PLS and transferred to a high-acid electrolyte in the solvent extraction (SX) process. The copper-bearing electrolyte is pumped to the Electrowinning Tankhouse (EW) where the copper is electrowon (plated) on stainless steel cathodes. Sheets of plated copper are stripped from the cathodes with a mechanical robotic stripping machine, bundled, tested, and weighed prior to being shipped to market. The following sections provide details of the copper recovery process.
| 17.8.1 | Solvent Extraction |
PLS drains from the Leach Pad to the PLS pond. A set of PLS pumps is used to pump PLS to the Gunnison SX Feed tank for delivery to the Gunnison mixer-settlers for copper extraction. The SX circuits for the Gunnison Project consist of two trains of mixer-settlers that extract copper from the PLS and transfer it to the organic phase. Each train has two extraction settlers and one strip settler. The extraction settlers use an extractant contained in a petroleum-based liquid (“organic”) to extract copper from the aqueous phase. The strip settlers (one in each train) use a high-acid aqueous phase (electrolyte) to strip copper from the organic phase. The electrolyte is then pumped to EW for recovery.
The SX trains for the Gunnison Project are designed to operate in parallel, which means that half the PLS flows to each extraction settler in the train. In this case, one quarter of the total PLS flow is sent to each extraction settler in the SX circuit. The organic phase passes through both extraction settlers, extracting copper from the PLS and becoming “loaded organic”. The copper-bearing loaded organic is mixed with lean electrolyte in the stripper pumper mixers to transfer copper from the organic phase to aqueous electrolyte solution. The stripper settler allows the immiscible liquids to separate in laminar flow. The rich electrolyte then flows to the Electrolyte Filter Feed Tank.
Stripped organic is sent to the extraction pumper mixers where agitated contact between the organic phase and PLS solutions promotes adsorption of copper by the extractant in the organic phase. The extraction settlers allow the immiscible liquids to separate in laminar flow so that the aqueous solution (raffinate) and organic solution can be collected in separate launders at the end of the settler. Raffinate is re-acidified in the aqueous launder of the second extraction settler and flows by gravity to the Raffinate Pond. The partially loaded organic from the second extraction settler flows to the pumper mixers of the first extraction settler and adsorbs copper from the other half of the PLS stream. Fully loaded organic from the first extraction settler flows to the Loaded Organic Tank. The SX process is designed to extract 92% of the copper contained within the PLS at an incoming copper grade of 1.38 grams per liter (g/L). The remainder of the copper in solution is recycled to the Leach Pad with the acidified raffinate.
| 17.8.2 | Electrowinning |
Copper recovery from the Rich Electrolyte solution is accomplished by electrowinning. This action takes place in the Electrowinning Building or “Tankhouse” in electrowinning cells that are powered by DC current. Rich electrolyte solution from the Solvent Extraction area flows by gravity to the Electrolyte Filter Feed Tank. Electrolyte is pumped from this tank through two multimedia electrolyte filters to remove entrained organic emulsion and particulates from electrolyte prior to advancing the filtered electrolyte to the electrowinning cells. The filters are backwashed periodically with water (or lean electrolyte solution) and air from an air scour blower. The filters are backwashed with lean electrolyte and the backwash solution is pumped to the PLS Pond.
Filtered electrolyte solution is pumped to an electrolyte recirculation tank through the electrolyte heat exchangers. The filtered rich electrolyte flows through one heat exchanger and is warmed by lean electrolyte returning to solvent extraction from electrowinning. Rich electrolyte is heated to the final temperature (approximately 40 to 45°C) for electrowinning in the trim heater, when required, with supplemental heat from a hot water heating system. When supplemental heat is not required, lean electrolyte flows through the trim heater, countercurrent to the flow of rich electrolyte being heated.
| M3-PN210313.007 31 March 2026 Revision 0 | 220 |
GUNNISON PROJECT Form 43-101F1 Technical Report |
Heated electrolyte solution enters an electrolyte recirculation tank and is mixed with electrolyte solution flowing in from the Lean Electrolyte Tank. The heated electrolyte in the Gunnison plant comes from the lean electrolyte portion of the Electrolyte Recirculation Tank. The electrolyte solution exits the EW cells and flows by gravity to the lean side of the Electrolyte Recirculation Tank (Gunnison), which is equipped with pumps for sending electrolyte to the SX stripping circuits. Excess lean electrolyte is mixed with rich electrolyte for feeding the electrowinning cells.
Copper is electrowon onto stainless steel 1-m x 1-m cathode blanks in the EW cells. The copper cathodes are harvested from each EW cell on a weekly basis, operating continuously across the tankhouse. The EW tankhouse has an overhead Class E bridge crane for transporting cathodes (and anodes) to and from the cells using a cathode (anode) lifting strongback. Harvested cathodes are washed in the Cathode Wash Tanks using circulation pumps. Washed cathodes are removed from the stainless-steel blanks, sampled, weighed, and banded using a semi-automatic stripping machine. Copper produced by this process is LME Grade A for sale on the world market in 2- to 3-ton packages.
| 17.8.3 | Tank Farm |
The primary process function of the Tank Farm is storage and transfer of solutions. The Tank Farm for the plant contains storage tanks, solution and organic pumps, and multimedia electrolyte filters for handling solutions needed for the SX-EW process. There are two process unit operations that take place in the Tank Farm: Electrolyte Filtration and Crud Treatment.
Electrolyte filters in the tank farm remove impurities from the rich electrolyte returning from SX to prevent contamination of the tankhouse and electrolyte system. Rich electrolyte flows by gravity to the Electrolyte Filter Feed Tank and is pumped through one or more anthracite-garnet filters to remove entrained organic and particulates that could interfere with the electrowinning process. Filtered rich electrolyte flows to the Electrolyte Recirculation Tank. The filters are periodically backwashed to remove impurities and maintain design flow rates through the filter media.
Crud is a mixture of solids, and an emulsion organic liquid and aqueous solution that accumulates at the organic/aqueous interface in the settlers or any mixture of aqueous and organic liquids that requires separation. Crud is removed by suction from the settlers and needs to be treated to separate the three phases for reuse in the process or, in the case of the solids, for disposal. Crud also comes from the mixture of aqueous, organic, and solids that accumulates in the electrolyte filters. The crud treatment system consists of the following major equipment:
| ● | Crud Holding Tank | |
| ● | Crud Treatment Tank | |
| ● | Crud Centrifuge (Tricanter) | |
| ● | Recovered Organic Tank |
Crud from the Crud Holding Tank will be pumped to the Crud Treatment Tank, an agitated, cone-bottom tank. Amendments including clay and diatomaceous earth can be added to the Crud Treatment Tank to assist in separation of the phases. The Crud centrifuge is a horizontal-axis centrifuge that separates the crud into its three component phases, allowing aqueous and organic liquids to be returned to the process. Solids are collected in a container for offsite disposal.
| 17.8.4 | Reagents |
There are several reagents required for the SX-EW process.
| ● | Sulfuric Acid | |
| ● | Diluent | |
| ● | Extractant |
| M3-PN210313.007 31 March 2026 Revision 0 | 221 |
GUNNISON PROJECT Form 43-101F1 Technical Report |
| ● | Cobalt sulfate | |
| ● | Guar | |
| ● | Mist suppressor |
Sulfuric acid storage tanks are provided to store approximately 7 days of the acid supply required for leaching and making the electrolyte for the EW process. A molten sulfur burning sulfuric acid plant is planned for construction to provide the acid necessary for leaching and SX-EW process make-up.
Diluent provides a petroleum liquid base for the extractant used as the organic phase of SX. The Diluent Tank stores make-up liquid to compensate for evaporative and process loss of organic. Other reagents include extractant, the active ingredient in the organic phase that transfers copper from PLS to electrolyte; cobalt sulfate, an additive to the electrolyte to improve plating; guar, a cathode smoothing agent; and mist suppressor, a chemical added to the electrolyte to inhibit the formation of acid mist in the tank house.
| 17.9 | Supporting Systems |
There are several systems that are necessary to support the SX-EW operation. These include systems to contain solutions, convey solutions, provide water, control the process, suppress fires, and ensure that mine-influenced solutions in the subsurface do not migrate offsite.
| 17.9.1 | Process Control and Monitoring |
The operational data from instrumentation is transmitted via fiber-optic cables to the control room in the EW building where it is monitored by a computerized plant control system (PCS). Communication between the PCS and the main control enclosures is by fiber-optic cable. The operator in the control room uses the PCS to monitor conditions and communicates any abnormal conditions to the operators. The control room operator can turn off pumps, adjust flow conditions, and monitoring line pressures from the control room, but restarting pumps is reserved for the operators.
The PCS is also equipped with data loggers to record information from plant instrumentation to enable the operator to examine trends, calculate local and cumulative flows, set alarm conditions, and maintain production records. The PCS provides trending, historical and alarm data for level sensors, flow meters, and any other instrumentation required in this system. Alarms are triggered when monitored parameters are out of limits set by the operator. Alarms will also be generated when there is a communications fault, equipment or instrument failure, or a process that is out of control limits.
| 17.9.2 | Process Ponds |
Process ponds are used to store and handle the various liquids and liquid-solid mixtures that are involved in the SX-EW process. PLS ponds collect copper-bearing solutions from the leach pad, allow particulates to settle, and provide a source for feeding the SX plant. Raffinate ponds collect the solution from which copper has been removed (raffinate) and provide a source of acidified solution for leaching to the leach pad. These ponds are managed so that they have a reserve of solutions to maintain SX-EW operations if they are interrupted and surge capacity to contain the solutions. Both sets of ponds are equipped with pumps and piping to remove the stored solutions and deliver them to the necessary destination at the variable flows and adequate pressures. These ponds are double-lined with HDPE geomembrane, and have leak detection instrumentation and pumps installed between the primary and secondary liners.
Operational depths of the PLS and Raffinate ponds are assumed to operate at half the height of each process ponds freeboard depth with the operational depth set to 8.75 ft. It is assumed that the SX-EW plant will accommodate flow/process flow rate and HLF draindown rate of 32,000 gpm. In order to reduce pond areas, the PLS and Raffinate ponds have been designed with 2.5:1 side slopes and 20 feet deep with crest dimensions of 670 feet by 670 feet. The event pond has been sized with 2.5:1 side slopes and 20 feet deep with crest dimensions of 580 feet by 580 feet.
| M3-PN210313.007 31 March 2026 Revision 0 | 222 |
GUNNISON PROJECT Form 43-101F1 Technical Report |
PLS and Raffinate ponds have been sized to accommodate and maintain an operational depth assuming a 2 hour (4 hours total) operational volume plus 6 hours (12 hours total) of HLP draindown. Additional emergency storage has been added to both the PLS and Raffinate ponds to accommodate 12 hours (24 hours total) of HLF draindown in the event of a power outage. It is assumed that solution quality from draindown may require direct diversion from the PLS pond into the Raffinate pond and therefore it is assumed that the Raffinate pond will require the same draindown capacity as the PLS pond. Ponds have been sized to calculate a net zero storage shortfall and no unrolled discharge from the ponds from the deterministic scenario and storm event occurred.
Ponds were sized based on the following criteria:
| ● | Sized to contain the immediate runoff (full precipitation depth minus initial abstraction and infiltration) from a 100-yr 24-hr precipitation event (3.91 inches) on the HLF. Storm surge from infiltration arriving in the subsequent weeks is assumed to be mitigated through a temporary increase in pumping rate and makeup water demand. |
| ● | SCS Curve Numbers (CN) on the mineralized material surface were assumed to be 70 for areas not under leach, 73 for areas under leach, and 99 on lined surfaces. |
| ● | In addition to the captured storm runoff, ponds are sized to capture emergency draindown from a 24-hour power outage at freeboard with 12 hours of draindown reporting to the PLS pond and 12 hours reporting the Raffinate pond. |
| ● | Ponds will involve no evaporation reduction devices such as covers or bird balls and process ponds would be operated at 8.75 feet (approximately half pond freeboard depth) to maintain minimum pumping depth requirements. |
The Event Pond is designed to contain excess draindown and runoff from the leach pad caused by a storm event. Excess draindown caused by precipitation on the leach pad may overwhelm the capacity of the PLS pond and the PLS pumps to recycle it to the top of the Leach Pad. Overflow from the PLS Pond will be controlled and directed to the Event Pond. Precipitation that falls directly on portions of the liner prior to receiving mineralized material may be diverted directly to the Event Pond. This pond is single-lined with HDPE geomembrane materials. The Event Pond will double as a contact water runoff pond to capture contacted stormwater from the SX-EW plant areas. It will capture contacted water that overflows the secondary containment of storage tanks within the Tank Farm area of the plant. Water that collects in the Event Pond will be recycled back to the Raffinate Pond with pumps to send back to the Leach Pad.
| M3-PN210313.007 31 March 2026 Revision 0 | 223 |
GUNNISON PROJECT Form 43-101F1 Technical Report |
| 18 | PROJECT INFRASTRUCTURE |
The Gunnison Project is dominated by the presence of the mine pit, waste dumps, and leach pad that are required for the mine-for-leach operation. The Gunnison SX-EW Facilities are located to the southeast end of the property, east of the village of Dragoon. Besides the mine, waste dumps and leach pad, there are four primary areas where facilities are located: the Plant Area, the Sulfuric Acid Plant and Railyard, the Mine Services Area, and the Crusher installation. Power lines connect to the project along the edges of the Gunnison mine property and access to the mine comes in from the west. Figure 18-1 shows the current site plan for the Gunnison Project with the distribution of areas.
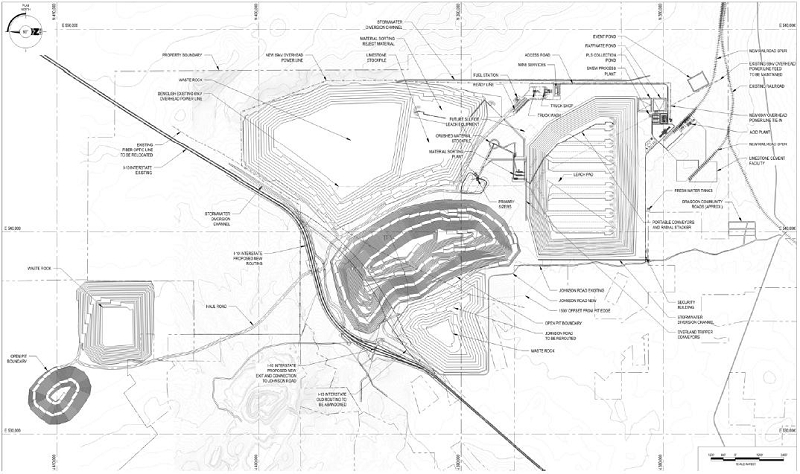
Source: M3, 2025
Figure 18-1: Gunnison Open Pit Site Plan
| 18.1 | Access Roads |
The primary access to the Gunnison site is via Interstate 10 (I-10) from either Benson or Willcox, Arizona and North Johnson Road exit between Benson and Willcox, Arizona (Figure 18-1). North Johnson Road is re-routed to pass between the mine pit and the West Waste Storage Stockpile. The access to the Gunnison SX-EW Plant is from Johnson Road along the southern boundary of the proposed Gunnison Leach Pad (Figure 18-1). Access to the property can also be gained via the railyard.
| 18.2 | Interstate 10 Relocation |
Because the Gunnison open pit underlies I-10, approximately 3.0 miles, as shown on Figure 18-2. The relocated freeway will require a new freeway interchange to access North Johnson Road. The preferred location of that interchange will be determined during roadway design in consultation with the Arizona Department of Transportation (ADOT), which has control of the I-10 and is the coordinating agency for the relocation design and construction.
| M3-PN210313.007 31 March 2026 Revision 0 | 224 |
GUNNISON PROJECT Form 43-101F1 Technical Report |
GCC contracted Kimley Horn, an infrastructure specialist firm, to prepare a prefeasibility study for the Gunnison Open Pit PEA. The comprehensive study included a description of the existing and recommended highway configuration and conditions, Rights-of-Way, utilities, drainages and drainage control, bridges culverts, and crossings, traffic signage, markings, and Freeway Management Systems, geotechnical considerations, and existing pavement conditions. The Kimley Horn study makes recommendations for new highway design criteria, horizontal and vertical alignments, earthwork requirements, relocation of The Thing (a well-known highway landmark, roadside attraction and fueling station), drainage controls and mitigation, relocation of Johnson Road which crosses I-10, traffic design, utilities (power, lighting, fiberoptic) aesthetics, and multimodal considerations.
Figure 18-2 is a photo from the Kimley Horn report of the current I-10 highway as it exists now. The photo shows Johnson Road crossing the highway. The cleared spot is for The Thing.
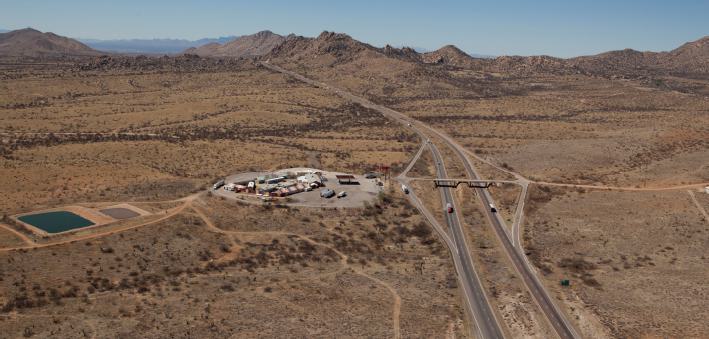
Source: Kimley Horn, 2025
Figure 18-2: Interstate 10 looking west towards Texas Canyon
The study includes a high level environmental review and consideration of cultural resources. The study includes a capital cost build-up, a PFS-level Project Development Plan and a staged plan forward to work with Arizona Department of Transportation (ADOT) to permit and construct the highway relocation project. Figure 18-3 shows the proposed new alignment of I-10 to make room for the Gunnison open pit.
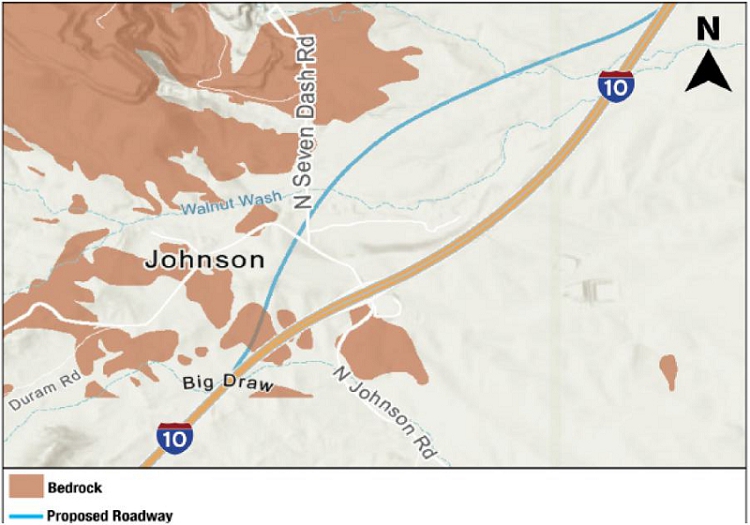
Source: Kimley Horn, 2025
Figure 18-3: Proposed Re-Alignment of Interstate 10 to the North
| M3-PN210313.007 31 March 2026 Revision 0 | 225 |
GUNNISON PROJECT Form 43-101F1 Technical Report |
Kimley Horn has included typical roadway section designs in their PFS showing the dimensions of the roadway widths, the Rights-of-Way and embankment slopes (Figure 18-4).
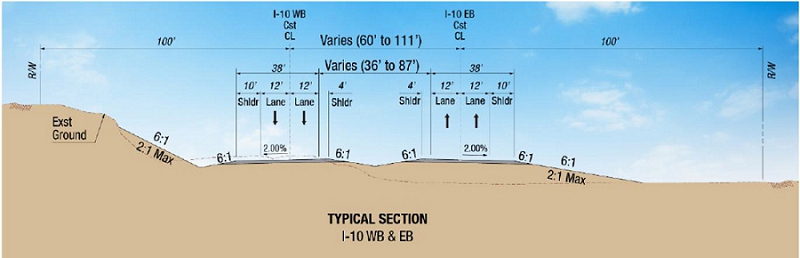
Source: Kimley Horn, 2025
Figure 18-4: Typical Roadway Sections showing East Bound and West Bound Lanes of I-10
The estimated cost for the highway relocation includes $26.2 million in direct construction costs, $8.1 million in construction indirect costs, and $7.6 million in other costs and contingency. The total cost estimated by Kimley Horn is $41.9 million to realign I-10.
| 18.3 | Leach Pad & Waste Dumps |
The location of the leach pad is southeast of the Gunnison pit in an area where the natural surface water drainage is towards the southeast, as shown on Figure 18-1. The full leach pad will be approximately 909.6 acres in area and oriented to the existing topography so that the overliner collection system gravity drains solutions down to the southeastern toe of the pad for collection. The leach pad is planned to have eleven lifts for an ultimate height of 336 feet. The leach pad containment section will consist of the following layers (from top to bottom); 4-foot thick overliner material, 80-mil HDPE geomembrane, 1-foot thick low permeability soil layer (1x10⁻⁶ cm/s), and prepared subgrade.
The PLS pond will capture copper-bearing solutions that collect beneath the leach pad. A stormwater event pond will capture runoff from the leach pad in the event that the PLS pond capacity is not sufficient to capture the runoff from storm events. The 100-year storm event for 24 hours for the Johnson Camp area is 3.91 inches. There is a contact water runoff pond that has been sized for runoff for the SX-EW plant.
The primary waste dump is the East Waste Dump. It is approximately 1,031 acres in area and extends to the eastern edge of the Gunnison property. The West Waste Dump covers 313 acres and extends from the ultimate pit on its eastern side to Johnson Road on the west side. The waste dumps will mostly contain gravels and overburden from the material that overlies the Gunnison mineralization. Once the mineralization is exposed, the waste dumps will include the primary lithologies present in the pit: Mississippian Horquilla and Escabrosa Limestone on the east side and Paleocene Texas Canyon Granite on the west side of the pit. There is no plan to line the two waste dumps with geomembrane liners.
| 18.4 | Process Buildings |
The Gunnison SX-EW processing facility will be constructed in a single stage and relocated south of the leach pad (Figure 18-5). The solvent extraction settlers consist of two sets of three covered mixer-settler tanks. The Electrowinning Tankhouse consists of a steel building with metal roofing and siding. The production capacity to meet 175 mppa will require 224 EW cells in double rows of 112 cells on each side of a central corridor. Two bridge cranes, one per building side, will serve to harvest the cathodes. The automatic cathode stripping machines and the cathode handling equipment will be located in the center of the building between the two double rows of EW cells.
| M3-PN210313.007 31 March 2026 Revision 0 | 226 |
GUNNISON PROJECT Form 43-101F1 Technical Report |
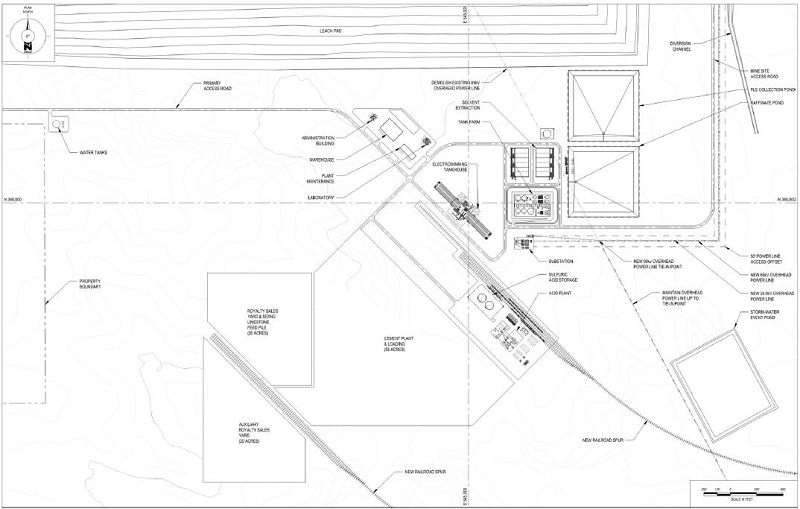
Source: M3, 2025
Figure 18-5: Gunnison Process Plant Site
An electrical equipment room and a Control Room are located above near the cathode stripping area so that personnel in the Control Room can observe the entire operation. Cathode handling, weighing, and banding is performed at the cathode handling section. The paved storage yard outside the cathode handling area will allow cathode storage and loading of cathodes onto flatbed trailers or rail cars for shipment to market.
The building will be designed with ventilation fans along one side to circulate air in the cell area and expel acid mist from the EW area. Two sets of transformer-rectifiers will provide DC electrical current for electrowinning. The electrical equipment are located outside and upwind of the building to minimize impacts from acid mist and vapors evolved during electrowinning.
The Gunnison Tank Farm is uncovered and located downhill from the SX circuit and the Electrowinning Tankhouse to facilitate gravity drainage of solutions to the Tank Farm. The Tank Farm contains tanks, pumps, filters, and heat exchangers involved in the handling of aqueous and organic solutions used in the process. The Tank Farm includes a containment area that drains to a sump with an oil-water separator to return spilled liquid to the proper location for recycling. A drain line is also provided to drain the tank farm sump to the Raffinate Pond in case of a process upset during power outage.
| M3-PN210313.007 31 March 2026 Revision 0 | 227 |
GUNNISON PROJECT Form 43-101F1 Technical Report |
| 18.5 | Ancillary Facilities |
Ancillary buildings will be constructed at the Gunnison site which include a guard house and truck scale, the Administration Building, Plant Change House, and Plant Maintenance Building. In addition, there is a Mine Services Area that includes the Truck Shop, Truck Wash, Mine Office Building, and Mine Change House.
| 18.5.1 | Security Building and Truck Scale |
The guard house is located at the main gate along the access road that connects to Johnson Road along the west side of the property. The guard house will be a modular metal building that includes a security office, a restroom, check-in area, and storage. The truck scale will be located beside the guard house to weigh trucks entering and leaving the property.
| 18.5.2 | Administration Building and Plant Non-Process Buildings |
The Administration Building is located on the west side of the access road, west of the SX area. The change house and plant maintenance building are located east of the EW Tankhouse (Figure 18-5). The Administration Building is a single-story pre-engineered steel or modular building that will include offices for the general administrative staff and supervisory personnel for the Gunnison operation.
The Plant Change House is a single-story, pre-engineered steel building for workers coming and going at shift change. It is located next to the PLS Collection Pond. The Change House includes showers and locker rooms for men and women; meeting room; offices for safety and training personnel; exam, first aid, and nurse’s room; supply rooms; and records room.
Adjacent to the Change House is the Mine Site Assay Laboratory. It will be equipped to process production samples from the mine as well as performing chemical analyses on process solutions, and analyses on the purity of copper cathodes. The lab building will include an area for sample drying and preparation, ICP and AA analysis, mass spectroscopy for cathodes, and a wet chemical lab for other analyses.
The Plant Maintenance Building is a two-story, pre-engineered steel building for maintenance of equipment used in the SX-EW process. The first floor of the maintenance building includes working areas, tool cribs, instrument room, overhead crane, offices, and restrooms. The second story along one end of this building includes offices and meeting rooms for planning and supervisory personnel. The Plant Warehouse, another metal pre-engineered building will be located next to the Plant Maintenance Building.
| 18.5.3 | Mine Services Area |
The Mine Services Area will be located south of the East Waste Dump and near the northeast corner of the Leach Pad (Figure 18-1). It will be accessed by a road along the east side of the Process Plant Area.
The Mine Services Area will include the Ready Line, Truck Shop, the Truck Wash, Tire Change the Mine Warehouse, a shed to store oil, grease, and waste products from truck maintenance, the fuel station, the Mine Change House, and the Light Vehicle Maintenance Shop (Figure 18-6).
| M3-PN210313.007 31 March 2026 Revision 0 | 228 |
GUNNISON PROJECT Form 43-101F1 Technical Report |
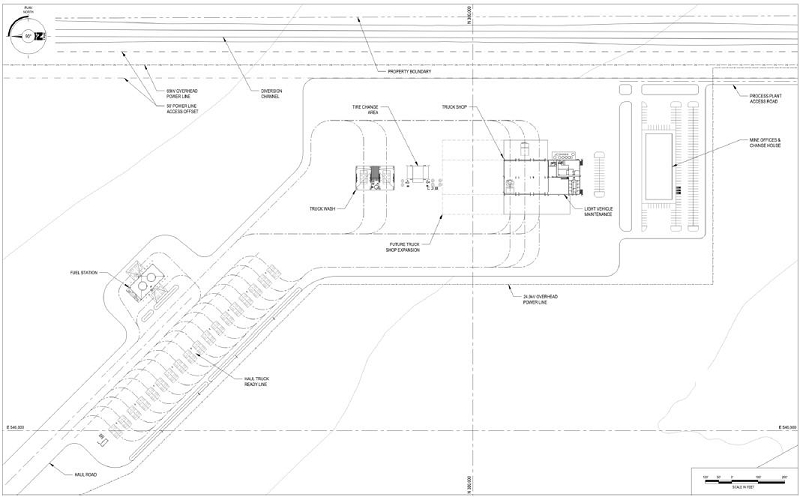
Source: M3, 2025
Figure 18-6: Gunnison Mine Services Area
| 18.5.4 | Primary Crusher Pad |
The primary crusher is located at the southeast corner of the Gunnison open pit and the southwest corner of the East Waste Dump (Figure 18-1). The crusher pad will accommodate two large mineral sizers as primary crushers with traffic patterns that accommodate the Cat 785 haul trucks (Figure 18-7). A small substation will supply power to the crushing equipment and overland conveyor that supplies crushed material to the Leach Pad. Access to the crusher pad for light vehicles will be from the Mine Services Area.
The primary crusher civil pad will require 40 feet of elevation above the surface including a MSE wall and 20 feet excavation beneath the surface to be able to accommodate the mineral sizers and reclaim tunnel the crusher pad will be constructed from fill screened from the overburden mined from the Gunnison pre-stripping operation.
| M3-PN210313.007 31 March 2026 Revision 0 | 229 |
GUNNISON PROJECT Form 43-101F1 Technical Report |
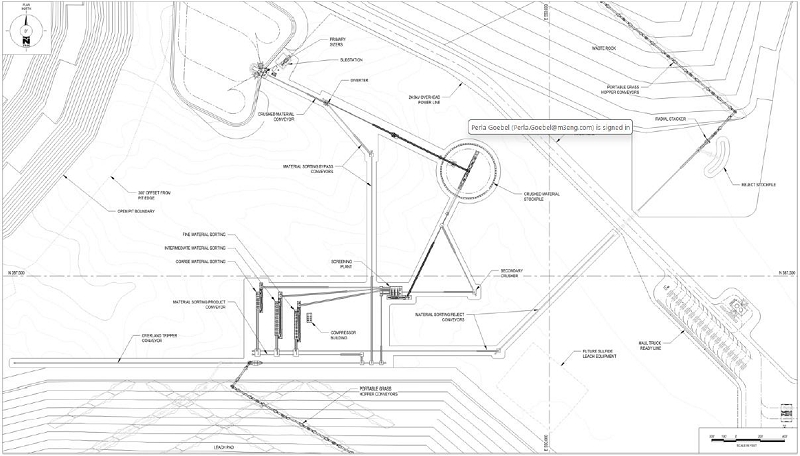
Source: M3, 2025
Figure 18-7: Primary Crusher Pad
| 18.6 | Sulfuric Acid Plant |
The sulfuric acid plant is constructed as part of the Gunnison SX-EW Plant. The sulfuric acid plant is located southwest of the Electrowinning Building along the railroad spur that runs south of the Project area for this option (Figure 18-1). The design for the sulfuric acid plant is based on a study for the Gunnison Project by NORAM Engineering in 2022 (Figure 18-8).
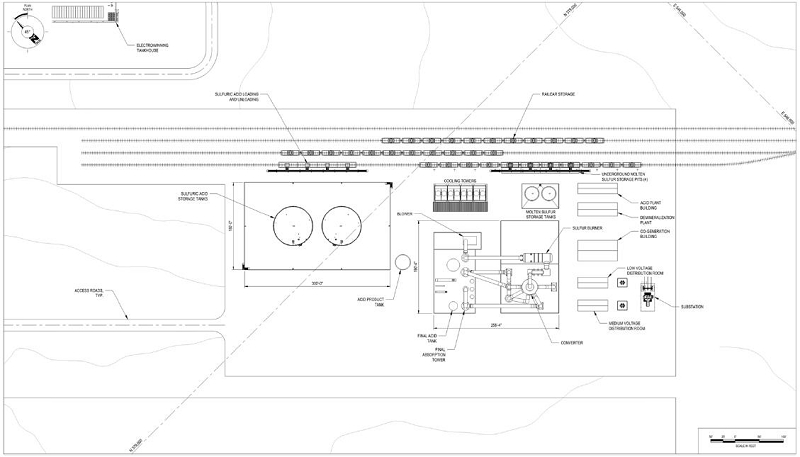
Source: M3, 2025
Figure 18-8: Sulfuric Acid Plant and Railyard
| M3-PN210313.007 31 March 2026 Revision 0 | 230 |
GUNNISON PROJECT Form 43-101F1 Technical Report |
The design capacity in the NORAM study was for 1,650 stpd. The current Acid Plant required for the Gunnison Project is 2,700 stpd, an increase of 64%.
The power generated by the steam turbine generator has a maximum power generating capacity of 43 MW of which 40.9 MW is left when discounted for normal operations. The amount of power generated is proportional to the amount of acid produced by the plant. The power requirement for the SX-EW is 14.3 MW which leaves 26.6 MW available to sell back to the grid or to consume in the SX-EW plant.
Ancillary facilities for the sulfuric acid plant include an operations building for sulfuric acid operations, a section of cooling towers, and boiler water treatment equipment to produce demineralized water.
The sulfuric acid plant is fed from two molten sulfur storage tanks. The cogeneration equipment feeds a substation that then distributes power back into the local grid operated by Sulphur Springs Valley Electric Cooperative.
Two 10,000 gallon sulfuric acid storage tanks in concrete containment are located next to the sulfuric acid plant. These storage tanks can hold approximately one week’s worth of sulfuric acid.
| 18.7 | Limestone By-Product and Cement Plant Facilities |
As part of the Gunnison Project’s waste valorization strategy, dedicated infrastructure has been incorporated to handle, process, and load high-purity limestone extracted as a waste by-product from the open pit. This infrastructure supports a planned 1-million-short-ton-per-year integrated cement plant and a limestone royalty sales operation to third-parties.
| 18.7.1 | Limestone Stockpiling and Conveyance |
Limestone waste rock, primarily from the Escabrosa and Horquilla Limestone formations, will be stored in the primary East Waste Dump as it is mined. Because limestone extraction rates are tied to the copper stripping schedule, high-grade limestone will be selectively segregated into designated stockpiles to act as a buffer and ensure a dependable feed for the downstream operations. This dedicated limestone stockpile portion of the East Waste Dump will cover a footprint of approximately 190 acres.
When required for processing, the high-grade limestone destined for the cement plant and royalty sales will be processed through a dedicated crushing circuit. The crushing circuit and overland conveyor system will also be established near the East Waste Dump to process and transport high-grade limestone down to the Cement Plant and limestone yard located near the cement and limestone rail spur.
Following crushing, the material will be transported via a new overland conveyor system downslope from the East Waste Dump directly to the processing facilities and sales yard located near the dedicated cement and limestone rail spur at the south end of the property. This material transport system will consist of three separate conveyors totaling approximately 15,000 feet in length, utilizing a 48-inch belt width.
| 18.7.2 | Cement Plant and Limestone Yard |
Space has been allocated adjacent to the new cement and limestone rail spur for the cement plant and limestone yard to optimize processing and bulk loading operations:
| ● | Integrated Cement Plant: The cement plant footprint covers approximately 55 acres and accommodates a limestone fed stockpile, raw material blending bed, a raw mill, a cyclone pre-heater tower, a dry-process rotary kiln, a clinker cooler, finish cement mills, and storage silos. At full capacity, the plant is designed to consume approximately 1.24 million short tons of stockpiled limestone feedstock annually to produce up to 1 million short tons of cement. |
| M3-PN210313.007 31 March 2026 Revision 0 | 231 |
GUNNISON PROJECT Form 43-101F1 Technical Report |
| ● | Limestone Royalty Sales Yard: Adjacent to the cement plant, a dedicated 20-acre yard has been allocated for secondary processing, staging, and loadout of up to 1.5 million short tons per year of high-quality limestone. This material is intended for third-party royalty sales to regional industrial, agricultural, and specialty markets. An additional 20 acres of auxiliary space has been allocated in this yard for a third-party to co-locate facilities for further beneficiation and processing. |
| 18.7.3 | Product Loadout and Logistics |
Secondary products leaving the site will include finished Portland cement and high-grade limestone rock, which will be loaded at the cement and limestone rail spur and transported in bulk via railcars as well as via tractor-trailers for local plant-gate sales.
The rail loading facility will include dedicated infrastructure for the high-volume bulk distribution of finished cement powder and crushed limestone, primarily utilizing unit trains destined for distribution terminals in Tucson, Phoenix, and other western U.S. markets. To support these operations, the dedicated cement and limestone rail spur will measure approximately 3,500 feet in length from the mainline connection to the spur terminus.
| 18.7.4 | Natural Gas Supply |
Thermal energy for the cement plant’s pyroprocessing (rotary kiln) will be supplied entirely by natural gas, which simplifies air permitting and reduces the facility’s carbon footprint compared to traditional coal-fired plants. The plant benefits from an existing high-pressure natural gas pipeline located immediately south of the cement yard, running parallel to the rail line. Because this pipeline is situated within the property boundary, a direct tap, metering station, and short distribution line can be constructed with minimal capital expenditure, avoiding the need for off-site pipeline extensions or third-party right-of-way acquisitions.
| 18.8 | Railroad Facilities |
The Union Pacific main line railroad passes through the town of Dragoon, Arizona. A new rail siding will connect to the main line about 1 mile northeast of the town of Dragoon. A new rail spur will generally follow an existing power line alignment northwest to the Gunnison plant site. The rail spur is about 2.2 miles long and terminates alongside the sulfuric acid plant (Figure 18-8).
Molten sulfur shipments will be received in unit trains of 80-ton railcars and unloaded with steam equipment into the sulfur storage tanks. The rail loading facility near the plant consists of three sidings in addition to the spur line to accommodate up to 25 cars each: one for unloading, one for empties, and one for switching. The new siding (drop-pull track) will consist of three tracks and will be of sufficient length to accommodate an 80-car unit train. It is assumed that the Union Pacific will service the property from Dragoon.
With the addition of the cement plant and limestone operation, GCC has included a second rail spur and siding to the east of the first rail spur and siding. The requirement for a second siding is partly driven by the UPSP’s weight limit per siding. Figure 18-5 shows the location and relative position of the proposed rail sidings and railyards.
| 18.9 | Power Supply & Distribution |
The Gunnison Substation will receive power from Sulfur Springs Valley Electric Cooperative Inc. (SSVEC) located in Willcox, Arizona. SSVEC has a 69 kV transmission line that passes close to where the Gunnison Substation is located. This 69 kV transmission line will feed the Gunnison Substation. A section of the 69 kV transmission line will need to be re-routed as it currently passes on top of the future leach pad. The Gunnison Substation will have two (2) 50 MVA power transformers that will step-down the voltage from 69 kV to 24.9 kV. The distribution line throughout the plant will be at 24.9 kV. At major process areas there will be distribution transformers to step-down the voltage from 24.9 kV to either medium voltage (4,160 V) or low voltage (480 V) depending on the requirements. These distribution transformers will feed power distribution centers which will be used to distribute utilization voltage to the process loads.
| M3-PN210313.007 31 March 2026 Revision 0 | 232 |
GUNNISON PROJECT Form 43-101F1 Technical Report |
The existing transmission line is used as the power source for the Gunnison open pit SX-EW facilities, as shown in Figure 18-1 above.
| 18.10 | Water Supply & Distribution |
The primary water supply source for the Gunnison open pit is from pit dewatering, as described in Section 16.9. The water supply is pumped to a process/fire water storage tank. The lower portion of the storage tank is reserved for fire water. Potable water will be used for offices, labs, restrooms, and eye wash stations.
Excess water from pit dewatering will be pumped to injection wells that will be located north of the East Waste Dump (Figure 18-1).
| 18.11 | Sanitary Waste Disposal |
Sanitary wastes from sinks, lavatories, toilets, and showers will be handled by septic systems. The septic systems will be typically dedicated to an individual building, but it is possible that adjacent buildings might share a septic tank or leach field. The septic systems will be designed and permitted in accordance with Cochise County regulations.
Sinks and drains where chemical handling operations are taking place will either drain to the tank farm sump and ultimately report to the Raffinate Pond or be contained in dedicated piping to a chemical containment tank. Any containment tanks will be serviced by licensed hazardous materials handling contractors in accordance with federal, state, and local regulations.
| 18.12 | Waste Management |
Solid wastes will be collected in approved containers, removed from site by a solid waste contractor, and disposed in accordance with federal, state, and local regulations. Excess construction materials and construction debris will be removed from site by the generating contractor.
Recyclable materials that are non-hazardous, such as scrap metal, paper, used oil, batteries, wood products, etc., will be collected in suitable containers and recycled with appropriate vendors.
Hazardous materials, such as contaminated greases, chemicals, paint, and reagents, will be collected and recycled, whenever possible, or shipped off-site for destruction, treatment, or disposal.
| 18.13 | Surface Water Control |
The natural gradient of the land generally slopes from the northwest to the southeast. From the southwest, there are four major watersheds that will impact the proposed rerouted Interstate 10 (I-10), contributing an estimated stormwater runoff between 14,058 cfs and 17,189 cfs for a 50-year, 24-hour, and 100-year, 24-hour storm events. This runoff will be channeled under the proposed rerouted I-10 by culverts, which were estimated using the 50-year, 24-hour storm event per the “Federal Highway Administration Project Development and Design Manual”. Most of that runoff will be captured in a large channel that will run parallel to the proposed rerouted I-10, discharging into the natural drainage way. The remaining runoff not captured by the large channel will be diverted around the pit, stockpiles, leach pad, and plant facilities as much as possible. These diversions will be evaluated and designed during detailed engineering. Stormwater, process water, or fresh water falling on or running onto potentially impacted areas of the site is considered potentially contaminated “contact” water and will be directed to containment ponds and sumps to prevent contamination of the natural drainage ways. Collected contact water will be pumped into the Raffinate Pond as makeup water for the leaching process. 15-foot and 50 foot wide, with the 3 H : 1 V sides slopes that are armored with 6 inches of shotcrete.
| M3-PN210313.007 31 March 2026 Revision 0 | 233 |
GUNNISON PROJECT Form 43-101F1 Technical Report |
The North diversion channel diverts water around the north end of the Gunnison pit and delivers non-contact water to Walnut Wash headed towards Willcox, AZ. This diversion will be require to be constructed in Year 10 of the project.
The East diversion channel diverts water away from the East Waste Dump until it connects with natural drainages that exit to the south of the Gunnison Hills. The diversion will need to keep water away from the Mine Services Area.
The West diversion channel diverts non-contact water around the west side of the Leach Pad and around the SX-EW plant facilities to where it can connect to natural drainages to the south of the Gunnison property.
| 18.14 | Transportation & Shipping |
Materials, equipment, and supplies for the Gunnison plant are either brought in by truck or by rail using the rail spur described in Section 18.8. Sulfuric acid and molten sulfur are brought in by rail and unloaded into their respective storage tanks at the Railyard.
The primary product leaving the plant is cathode copper, which is shipped by tractor trailers or by rail depending on the contracts with buyers. Excess sulfuric acid from the Acid Plant that is not needed for the copper operation may be sold and transported to the buyer by truck or rail. Recycled materials leaving the plant will also be by truck. Scales to weigh full and empty trucks coming into and leaving the site are provided at the main gate for highway trucks and at the rail spur for the rail cars of sulfuric acid and sulfur.
Cement and limestone products will exit the property via the second railyard and siding to the UPSP main railroad.
| 18.15 | Communications |
The connection to telephone and internet service has not been confirmed at this time. The telecommunication system will be integrated with the onsite data network system utilizing a voice over internet protocol (VoIP) phone system. A dedicated server will be provided for setup and maintenance of the VoIP system. Handsets will plug into any network connection in the system for telecommunications. The office network will support accounting, payroll, maintenance, and other servers as well as individual user computers. High bandwidth routers and switches will be used to logically segment the system and provide the ability to monitor and control traffic over the network.
A process control system network will support the screen, historian and alarm servers connected to the control room computers as well as Programmable Logic Controllers (PLC). This system will incorporate redundancy and a gateway between the office system and control system to allow business accounting systems to retrieve production data from the control system. No phone or user computer will be connected to this system.
The internal communications within the plant will utilize the same VoIP phone system, which will provide direct dial to other phones throughout the plant site. Mobile radios will also be used by operating and maintenance personnel for daily communications while outside the office and will be enhanced for use by the mine fleet and dispatch.
| M3-PN210313.007 31 March 2026 Revision 0 | 234 |
GUNNISON PROJECT Form 43-101F1 Technical Report |
| 19 | MARKET STUDIES AND CONTRACTS |
| 19.1 | Market Studies |
| 19.1.1 | Copper Price |
Long-term copper price expectations are fundamentally driven by structural supply and demand trends in the global copper market. Demand for copper is expected to grow steadily over the coming decades due to its essential role in electrification, renewable energy systems, defense, electric vehicles, power transmission infrastructure, and digital technologies such as data centers. These sectors are significantly more copper-intensive than traditional technologies, and the ongoing global energy transition is expected to materially increase copper consumption. Industry forecasts indicate that global copper demand could increase from roughly 27 Mt in 2024 to approximately 33 Mt by 2035 and continue rising thereafter as electrification expands worldwide. In addition to energy transition drivers, continued urbanization and industrialization in emerging economies are expected to provide a stable base of traditional demand for copper across construction, manufacturing, and electrical infrastructure.
On the supply side, the copper market faces structural constraints that may limit the pace of new production growth. Declining material grades, increasing capital intensity, permitting challenges, and long development timelines for new mines—often exceeding a decade from discovery to production—have reduced the responsiveness of supply to rising demand. At the same time, the pipeline of large new copper discoveries has slowed in recent years, and many existing operations face depletion or declining productivity. These factors have led analysts to project tightening market balances and potential long-term supply deficits without significant investment in new projects. As a result, many market participants expect copper prices to remain supported over the long term as new supply is required to meet growing demand.
For the purposes of this technical report, the long-term copper price is based on analyst consensus forecasts rather than a proprietary price forecast. Consensus pricing reflects the aggregated expectations of multiple independent market analysts and financial institutions, incorporating a wide range of macroeconomic assumptions, supply-demand modeling, and commodity market expertise. Using consensus forecasts is a common approach in technical and financial reporting as it provides an objective and transparent benchmark that reduces reliance on any single price outlook. It also aligns project economics with broadly accepted market expectations and improves comparability with other studies, financial analyses, and industry evaluations that frequently rely on similar consensus price assumptions. Table 19-1 shows the individual analyst copper price forecasts as at February 3, 2026 and the average of $4.60/lb is determined to be the consensus long term price applicable to the Gunnison Copper Project.
| M3-PN210313.007 31 March 2026 Revision 0 | 235 |
GUNNISON PROJECT Form 43-101F1 Technical Report |
Table 19-1: Copper Price Analyst Consensus
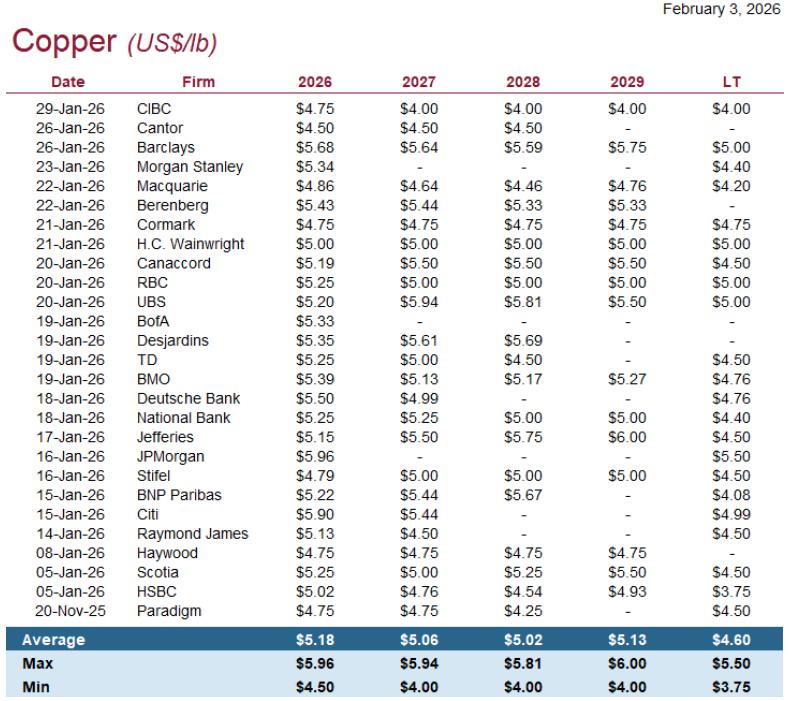
| 19.1.2 | Copper Net Premium |
Copper premiums are amounts charged above and beyond the market price for delivery of finished physical metals to customers. These premiums are typically netted with the costs of freight from the mine to the customer and quoted as a net premium per pound of copper delivered.
Historically, management has used 2.5% of the copper price assumption as the gross premium and then deducted an estimated freight to arrive at a net premium. To estimate the freight costs, management consulted with Rio Tinto Marketing USA (“Rio”), the offtaker of Johnson Camp copper, to determine the appropriate freight rate. As per Rio, an appropriate weighted average freight assuming deliveries to the US Midwest and Texas is $0.0725/lb.
Therefore, the LT net copper premium is calculated as $0.0425/lb as shown in Table 19-2.
Table 19-2: LT Net Copper Premium Calculation
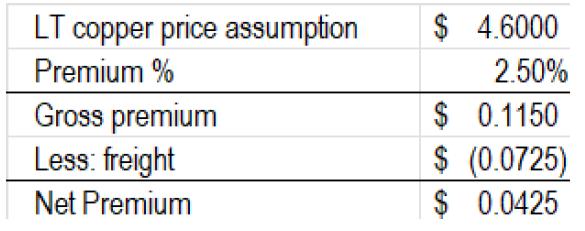
| M3-PN210313.007 31 March 2026 Revision 0 | 236 |
GUNNISON PROJECT Form 43-101F1 Technical Report |
| 19.1.3 | Sulfuric Acid Price |
Sulfuric acid is the largest single consumable in the Gunnison Project and it is expected to be completely supplied by the 2,700 stpd acid plant. If the acid plant supply is less than the processing needs in any period, then acid will be purchased in the spot market. If there is an excess of acid plant production versus the processing needs in any perio, then acid will be sold to local and regional purchasers such as other copper mines.
| 19.1.3.1 | Long Term Sulfuric Acid Price - Purchases |
Johnson Camp mine, located immediately beside the Gunnison Copper Project, has been purchasing sulfuric acid for the past six years, from 2019 to 2025. As a result, actual historical delivered pricing is available for sulfuric acid delivered to the site. In addition, a sulfuric acid benchmark called the US spot CFR Benchmark is available and typically used as a base price to value purchases and sales in the United States for sulfuric acid. Data comparing the delivered price and the benchmark price are presented in Table 19-3 below.
Table 19-3: Sulfuric Acid Price and Benchmark Price
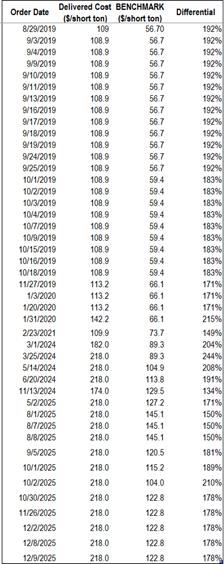
| M3-PN210313.007 31 March 2026 Revision 0 | 237 |
GUNNISON PROJECT Form 43-101F1 Technical Report |
A linear regression analysis was performed on the data set and resulted in the regression equation of y = 1.5235x + 23.837. The R2 is 0.8813 indicating a strong correlation of the data points. Refer below to Figure 19-1 for details.
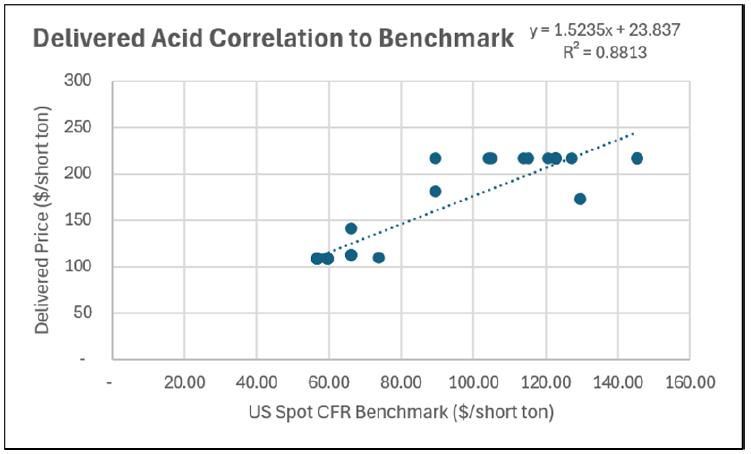
Figure 19-1: Delivered Acid Correlation to Benchmark
Next, a projection of the US spot CFR Benchmark was obtained from a leading industry analyst and the regression equation was applied to calculate the long term acid purchase price delivered to the Gunnison Copper Project site. The LT purchase price assumption is $210.00/ short ton.
Table 19-4: LT Sulfuric Acid Purchase Price Assumption
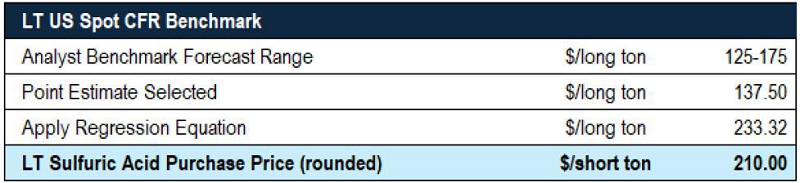
| 19.1.3.2 | Long Term Sulfuric Acid Price from Sales to Other Operations |
During certain years, the Gunnison sulfuric acid plant will produce surplus acid that must be sold. Three mines/projects current and future consumers of acid located in Southern Arizona were identified, whose purchase requirements would be sufficient to account for any acid sales projected by the Gunnison Project: Florence Copper, Pinto Valley Mine, and the Santa Cruz Project. Additionally, there is the potential for acid sales to the Cactus project. Based on an analysis of the average distance to the customers and the prevailing cost per mile and tons per truck, the average cost of shipping was determined to be $20.00/short ton. Trucking was chosen as the mode of transport for conservatism (most expensive method) as it is unclear if a direct rail link will be available at these sites.
| M3-PN210313.007 31 March 2026 Revision 0 | 238 |
GUNNISON PROJECT Form 43-101F1 Technical Report |
Using this shipping cost, the rounded long-term price assumption for the sale of excess sulfuric acid was determined to be $190.00/short ton (Table 19-5).
Table 19-5: Sulfuric Acid Delivered Sales Price
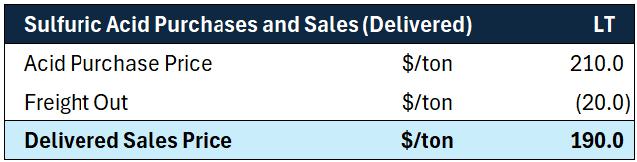
| 19.1.3.3 | Long Term Molten Sulfur Price |
The Gunnison sulfuric acid plant has been sized to produce 2,700 stpd of sulfuric acid. This plant will require 900 tons per day of sulfur. For sulfur, there is one main benchmark price in the molten North American market – the Tampa benchmark price. It is priced in long tons (2240 lbs) on a delivered basis (DEL). The price is agreed by the end of the first month of the new quarter. It is negotiated by The Mosaic Company for the buy side and a few US refiners on the sell side. Any other domestic pricing is either based on private negotiations or using a formula that includes references to the Tampa benchmark.
An analysis of the suppliers of sulfur indicates it could be sourced from US domestic oil refineries such as the four refineries (Valero, Exxon, Aramco, and TotalEnergies) located near Beaumont Texas. These refineries currently produce over 1.6 million short tons of molten sulfur per year; more than enough supply to meet the approximately 328,000 annual short tons needed by the Gunnison Copper Project acid plant. In addition, these refineries view molten sulfur as a by-product / waste product of their primary production processes (gasoline, etc.) and typically offer a $20/long ton discount to the Tampa benchmark given their location.
While historical data is available, price forecasts for molten sulfur are very challenging because molten sulfur is traded and produced as a by-product of crude oil refining and natural gas processing, which means molten sulfur production is inelastic in that neither weaker nor firmer demand for it will dictate production levels. Due to the challenges in supply and demand style price forecasting for US molten sulfur, it was determined that a historical average of the benchmark price, incorporating enough data points to include several price cycles (molten sulfur is a highly cyclic commodity), to be the most appropriate forecasting method.
A 30-year price history was obtained from an industry analyst firm for molten sulfur benchmark pricing Tampa DEL. The longer time length of the data set was selected to ensure several price cycles were included and management noted the data set includes seven price cycles (refer to Figure 19-2 below).
| M3-PN210313.007 31 March 2026 Revision 0 | 239 |
GUNNISON PROJECT Form 43-101F1 Technical Report |
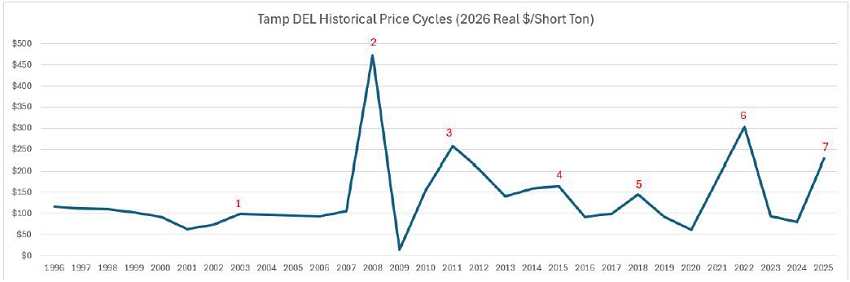
Figure 19-2: Tampa DEL Historical Price Cycles
The historical nominal prices were inflated to 2026 real dollars by applying appropriate CPI factors, see Table 19-6. The average benchmark price in 2026 real dollars is $136.8 per short ton.
Table 19-6: Sulfur Benchmark Prices from 1996 to 2025 Inflated to 2026 Real Dollars
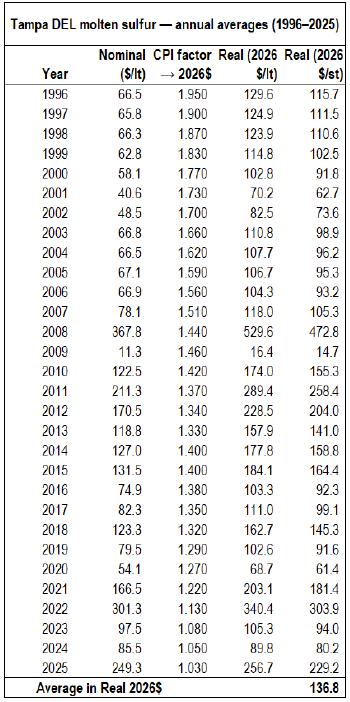
| M3-PN210313.007 31 March 2026 Revision 0 | 240 |
GUNNISON PROJECT Form 43-101F1 Technical Report |
With regards to freight costs, discussions with an industry logistics company in the Beaumont Texas area indicate each of the four refineries have direct rail connection, eliminating the need to truck and transload. However, at present, they lack the loadout racks at their facilities for loading the sulfur on the railcars. According to the industry logistics company, the loadout racks could be constructed for approximately $1.0M to $1.5M. Given the low capex requirement, management determined these costs could be negotiated into the long-term offtake contracts as refinery costs, given the large volumes of sulfur to be purchased over the mine life. As a result, management did not include a truck and transload component in the freight cost.
The rail freight from Beaumont to Gunnison site will be entirely on the Union Pacific line, reducing potential freight costs versus having to involve multiple railroads. According to an industry analyst., the freight costs assuming manifest train deliveries (multiple commodities, multiple customers and destinations) is expected to be approximately $60.00/long ton or
$53.57/short ton. These costs can be further reduced with dedicated unit train configuration (single commodity, single customer, single destination). According to RSI Logistics, a rail logistics solution provider, the savings on unit train rates can be approximately 25% versus manifest due to elimination of switching, faster turnaround times, economies of scale, and fuel efficiency. Management analyzed the available land package at the Gunnison Project site and determined sufficient space exists to support unit train deliveries at site. As a result, the rail freight cost was calculated to be $40.18/short ton as shown in Table 19-7.
Table 19-7: Union Pacific Freight Rate
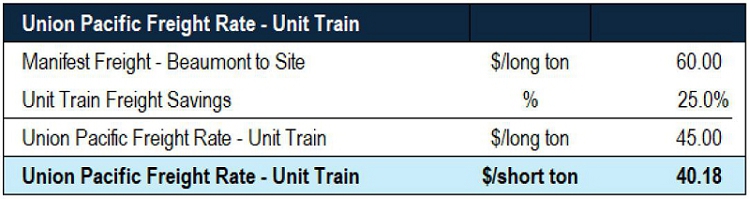
In addition to the Union Pacific rail rates, management notes that rail cars appropriate for the transport of molten sulfur must either be purchased or leased as these are not typically provided by the railroad at their cost. According to discussions with an industry logistics company located in Beaumont Texas, molten sulfur rail car leases are available for $1200 per month per rail car. Based on a capacity per car assumption of 100 short tons (the logistics company indicated a range of 88 to 94 long tons per car or 99 to 105 short tons per car), and a turnaround time of 6 days (3 days travel and load/unload each direction Gunnison site to Beaumont), the railcar lease per ton was calculated to be $2.37/ short ton.
Table 19-8: Railcar Lease per Short Ton
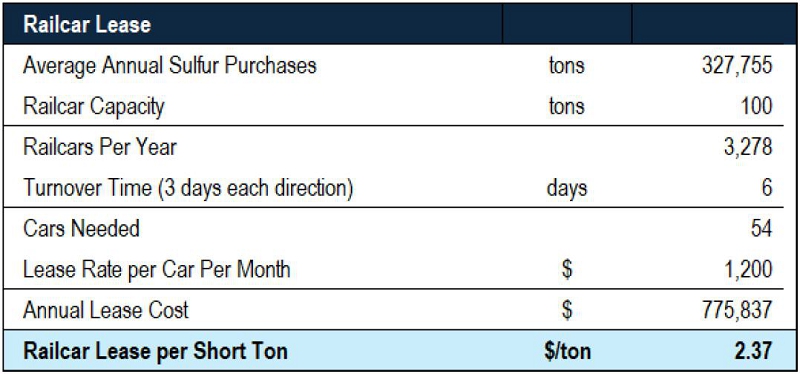
| M3-PN210313.007 31 March 2026 Revision 0 | 241 |
GUNNISON PROJECT Form 43-101F1 Technical Report |
Based on the data points above, it was concluded, the appropriate Long-Term Molten Sulfur price assumption for the 2026 Gunnison PEA is to be $160.00 / short ton delivered to Gunnison site.
Table 19-9: Long-Term Molten Sulfur Price
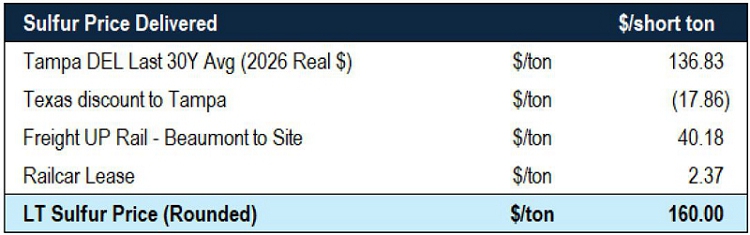
| 19.1.4 | Diesel |
The Gunnison open pit operation will use a mining contractor, and red dyed off-road diesel (“diesel”) will be the primary fuel used by the Gunnison mining heavy fleet and ancillary equipment. Given the localized nature of pricing for diesel, with pricing variations depending on region of the country and delivery costs, there is no widely accepted consensus price forecast that can be used directly.
| 19.1.4.1 | Methodology |
The price of diesel in all localities is highly correlated to the West Texas Intermediate crude (WTI) benchmark as WTI is the primary type of crude oil refined in the United States. WTI is forecast by a range of reputable banks and oil analysts resulting in a widely accepted consensus price forecast that is available on the Bloomberg terminal.
Table 19-10: Diesel Price

To determine the relationship between actual realized local diesel prices at the Johnson Camp mine site, which is immediately adjacent to the Gunnison Copper Project site, and the WTI index a linear regression analysis of these variables will be performed. The resulting regression equation has been applied to the LT WTI forecast to determine the appropriate LT diesel price assumption for the Gunnison open pit model.
| M3-PN210313.007 31 March 2026 Revision 0 | 242 |
GUNNISON PROJECT Form 43-101F1 Technical Report |
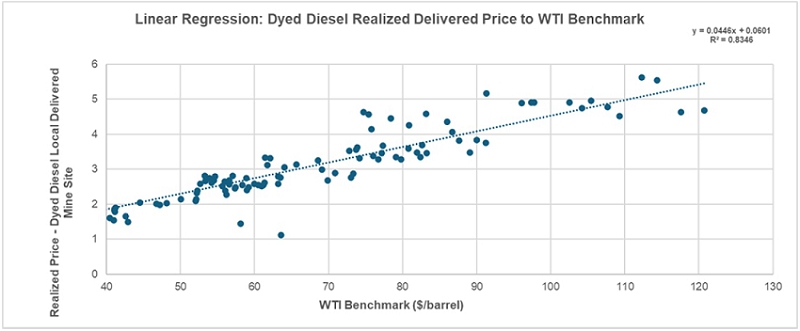
Figure 19-3: Regression Analysis of Red Diesel Prices vs WTI Benchmark Prices
| 19.1.4.2 | Results |
To calculate the regression equation, 317 samples of actual realized prices delivered to site over six years were regressed to the actual WTI price resulting in the equation y = 0.0446x + 0.0601 that yields an R2 of 0.8346 which indicates a strong correlation. Applying this equation to the price forecast results in a LT diesel price assumption of $2.96/gallon.
| 19.2 | Contracts |
Principal activities for GCC are project financing, community relations and permitting, and related engineering activities that support the development of the Gunnison Project. During this period, contracting activities will continue to be driven by the need to acquire specialists and professional services firms to assist GCC with these various activities.
A number of contracts will need to be put into place in order to complete the proposed studies. Some are already in place and others are still proposed. These include:
| ● | Project financing, | |
| ● | Community relations, | |
| ● | Land use, | |
| ● | Environmental studies and permitting, | |
| ● | Hydrology and hydrogeology, | |
| ● | Metallurgical and process engineering support, | |
| ● | Detailed engineering and procurement, | |
| ● | Site safety and health services, | |
| ● | Professional Services, | |
| ● | Drilling services contractors, and | |
| ● | Sulfuric acid contract. |
Contractors will be pre-qualified by GCC on the basis of their:
| ● | Safety record, | |
| ● | Previous experience on similar projects, | |
| ● | Quality of workmanship on previous projects, | |
| ● | Quality/experience of on-site management, | |
| ● | Local availability in region, | |
| ● | Previous schedule performance, | |
| ● | Financial stability, and | |
| ● | Cost competitiveness. |
Areas with clearly defined scopes of work will be required as unit price or lump sum contracts.
| 19.3 | Confirmation |
The author confirms that he has reviewed the studies and analyses set out in this Section 19 and that the results support the assumptions in this technical report.
| M3-PN210313.007 31 March 2026 Revision 0 | 243 |
GUNNISON PROJECT Form 43-101F1 Technical Report |
| 20 | ENVIRONMENTAL STUDIES, PERMITTING AND SOCIAL OR COMMUNITY IMPACT |
| 20.1 | Environmental Studies and Permitting |
This section identifies applicable key environmental permits associated with an open pit mine at Gunnison. Federal, state, and local government existing environmental permits are listed in Table 20-1.
Table 20-1: Open Pit Environmental Permits
|
Agency |
Permit/ Notification |
Description |
Citation |
When Required/ Permit No. |
| Federal | ||||
|
Bureau of Land Management |
Mining |
All operations on public lands that disturb more than 5 acres on the surface require a Plan of Operations, which will require a National Environmental Policy Act (NEPA) environmental assessment (EA) or environmental impact statement (EIS) and posting of a reclamation bond. | 43 CFR §3809, 43 CFR Part 46 |
Applicable only when BLM land is disturbed and potentially applies to end of mine life plans at Strong & Harris. |
|
US Fish & Wildlife Service (USFW) |
Incidental Take Permit |
Operations that may affect species listed as endangered or threatened must conduct studies to identify any targeted species and apply for a permit to conduct the activities. Any threatened or endangered species identified in pre-mining surveys must be mitigated before mining proceeds. |
50 CFR Sections 7 and 10 |
No endangered/ threatened species previously identified at Gunnison. Additional studies may be required prior to disturbing new ground |
|
National Historic Preservation Act |
Cultural Resources Permit - Consultation and Mitigation | Requires Federal agencies to take into account the effects of their undertakings, such as construction projects, on properties covered by the NHPA. Compliance with Section 106 of the NHPA is necessary before the BLM/USFS approves a mining plan on public lands. | 16 USC §470 et seq 42 CFR §137.288 |
None previously identified. New studies will be required prior to disturbing new ground. |
Alcohol Tobacco and Firearms (ATF), Mine Safety and Health Administration (MSHA), ASMI, Occupational Health and Safety Administration (OSHA) |
Federal Explosives Permit |
All persons who wish to transport, ship, cause to be transported, or receive explosive materials must first obtain a Federal explosives license or permit. Includes vehicular requirements for transportation of explosives and requirements for construction of explosives magazine. Refer to ATF publication 5400.7 |
[18 U.S.C. 842(b); 18 U.S.C. 845; 27 CFR 555.26(a), 27 CFR 555.141] |
Required to transport, ship, cause to be transported, or receive explosive materials. |
| State of Arizona | ||||
| Arizona Department of Environmental Quality (ADEQ) Air Quality Division | Air Quality Control Permit |
Ensures air pollutants from any source does not exceed the National Ambient Air Quality Standards. Acid Plant, boilers, generators, fuel storage tanks, SX-EW plant, use of ANFO etc. will require permits or permit amendments. |
ARS §49-421 |
AQP-71633 covers the Gunnison Project and JCM. Will require amendment for new facilities. |
|
ADEQ Groundwater Section |
Aquifer Protection Permit |
APPs are required for regulated facilities where discharges may reach an aquifer. Categorical facilities include solution impoundments, non-stormwater impoundments, tailing facilities, leach pads, waste rock stockpiles, or any | AAC R18-9 Articles 1 – 4 |
Existing Gunnison APP P-511633 will require amendment to cover new discharging facilities. Amendment must include |
| M3-PN210313.007 31 March 2026 Revision 0 | 244 |
GUNNISON PROJECT Form 43-101F1 Technical Report |
|
Agency |
Permit/ Notification |
Description |
Citation |
When Required/ Permit No. |
| discharges that may infiltrate to the aquifer. Closure cost estimates and bonding for APP-regulated facilities required. | updated closure cost estimates and updated bonding. | |||
|
ADEQ Underground Injection Control Program |
UIC Area Permit |
Specifies protocol for operating, monitoring, and decommissioning the ISR Operation. |
A.A.C. R18- 9 Article 6 |
Existing UIC Permit No. P-515168 (formerly EPA permit R9UIC-AZ3-FY16_1) will require amendment to reflect changes in mining plan, including revising the closure plan for ISR operations. |
|
Arizona Department of Water Resources |
Willcox Active Management Area (AMA) |
AMAs are subject to certain statutory and administrative regulations regarding withdrawal and use of groundwater. |
ARS §45-402-599 |
Water withdrawal, use/reuse, and/or reinjection may be subject to additional requirements including application for Type 2 grandfathered rights, water conservation, withdrawal permits, and annual reporting. |
|
ADEQ Waste Management Division |
EPA ID Number |
Generators of hazardous waste must have an EPA ID prior to offering the waste for shipment. | ARS §49-922 | Covers JCM and Gunnison |
| Pollution Prevention Plan |
Plan identifying opportunities to reduce waste. |
ARS §49- 961 thru 973 |
Report to be submitted annually | |
| Toxic Release Inventory | Submit Form R for quantity of copper in waste rock. | 40 CFR 372 | Report to be submitted annually | |
| Arizona Department of Agriculture | Notice of Intent to Clear Land | Ensures enforcement of Arizona Native Plant Laws | ARS §3-904 | Notify 60 days prior to new disturbance on private land |
|
Arizona Game and Fish Department |
Consultation |
Consultation re: whether the mining operation will endanger fish and game habitat, etc. |
AAC Title 12 |
No threatened/endangered species previously identified. Additional survey may be required depending on extent of open pit operations. |
Arizona State Museum |
Cultural resources—private land | No prior notification required, but if certain objects are discovered on private land, Arizona State Museum director must be notified immediately. This can shut down work. |
ARS 41- 865 |
Notify AZ State Museum Director if cultural objects are found on private land. |
| Arizona State Museum, State Historic Preservation Officer, Arizona State Land Dept |
Arizona Antiquities Act Permit |
When applicant files State exploration permit, State Land Dept consults with State Historic Preservation officer to ensure that significant resources are avoided or adequately studied | ARS §41- 861 et seq and ARS §41-841 et seq |
Applies to State Trust land. Additional survey may be required for new project area. |
| M3-PN210313.007 31 March 2026 Revision 0 | 245 |
GUNNISON PROJECT Form 43-101F1 Technical Report |
|
Agency |
Permit/ Notification |
Description |
Citation |
When Required/ Permit No. |
| before they are impacted. ASLD will determine if a cultural survey is needed. | ||||
|
Arizona State Mine Inspector (ASMI) |
Mined Land Reclamation Plan and Bond |
Bonding for reclamation of mined land. Reclamation bond does not include facilities covered by the Aquifer Protection Permit closure bond. |
AAC R11-2- 101 thru 822 |
Exploration and mining activities on private land with greater than 5 acres disturbance. Current Gunnison bond for ISR will require update to accommodate open pit. |
|
ASMI |
Above-Ground Storage Tanks |
There is no specific permit for ASTs. Inspections at mines are by ASMI. Construction is expected to be designed according to Uniform Fire Code, NFPA and Federal regulations. ASMI Requirements vary depending on tank capacity. | ARS Title 27 NFPA, 29 CFR 1910, 30 CFR 56.44 |
Above ground fuel storage tanks storing more than 60 gallons for more than 7 consecutive days. |
|
ASMI |
Notice of Start-up |
When mining operations are scheduled to begin at any mine, the operator, owner, agent or other authorized representative shall give written notice to the inspector prior to commencement of mining. The mine inspector’s office must have information on file pertaining to each mining or milling operation in order to comply with its mandated inspection requirements. | A.R.S. § 27-303(A) A.R.S. § 27-124 |
Give written notice to the inspector prior to commencement of mining. |
|
Arizona Department of Transportation (ADOT) |
ADOT Encroachment permit |
Permitting through ADOT will be required to move interstate around project area. Encroachment permits allow for activity in the ADOT right of way. Some work that may be required by the permit includes cultural, biological, native plant surveys, traffic analyses, traffic control plans, and construction drawings. |
AAC R17-3- 501 et seq |
Required before any activity is allowed in ADOT right-of-way. |
The permits that are anticipated to require longer permitting timeframes and permit application preparation times are discussed below:
| ● | Arizona Department of Transportation (ADOT): The project includes re-routing a portion of Interstate 10. A permit from ADOT will be required before any work can be conducted. The permit may require additional environmental studies, including cultural, biological, and native plant surveys, depending on where I-10 is routed. Detailed design drawings must be submitted and approved prior to permit issuance. |
| ● | Aquifer Protection Permit (APP): Aquifer Protection permits are required for discharging facilities that have the possibility of impacting an aquifer. Mining facilities that generally require APPs are surface impoundments, mine tailings piles and ponds, waste rock piles, concentrate storage facilities and other stockpiles, wastewater treatment facilities, injection wells, and point source discharges to navigable waters. Open pits are not regulated facilities if passive containment (due to evaporation) can be demonstrated. |
| M3-PN210313.007 31 March 2026 Revision 0 | 246 |
GUNNISON PROJECT Form 43-101F1 Technical Report |
Facilities that may be constructed at Gunnison that may require an APP include:
| ● | Leach pad | |
| ● | Waste rock stockpile(s) |
| ● | Non-stormwater ponds |
| ● | Process solution ponds (for PLS or Raffinate) |
| ● | Acid Plant |
| ● | Injection wells for mine pit dewatering, if necessary (GCC will prioritize other uses for excess water. See Section 20.2) |
An APP already exists for ISR facilities. Much of the data in the initial APP application can be used toward the permit for new facilities. Additional tasks will likely include an update to the groundwater model and materials characterization of the waste rock to evaluate whether waste rock stockpiles can be classified as inert material (i.e., exempt from APP requirements). The licensing timeframe for significant amendment is 221-329 business days, depending on the complexity and whether a public notice is required. GCC should assume that a public hearing will be required in estimating the APP licensing timeframe for the project.
Arizona Mined Land Reclamation Plan: This is required for surface disturbances greater than 5 acres on private land. Financial assurance must be provided for reclamation of surface disturbances/facilities that are not covered by the APP. The processing time is approximately 6 months.
Air Quality: Air quality permits will be required for the boilers, generators, fuel storage tanks, use of ANFO, trucks, a new SX-EW plant, crusher, cement plant, etc. The acid plant will likely require a Class 1 Permit, which has a 365-calendar day processing timeframe. Permits are good for 5 years.
Underground Injection Control Modification: Modifications may be required to reflect changes in the mining plan, including the excavation of the existing ISR wellfield and revising the closure plan for ISR operations to align with the transition to open pit mining. Hydraulic control must be maintained and demonstrated according to the UIC. All requirements of the current UIC are in effect until EMI files a modification request and it is granted.
| 20.2 | Water and Waste Management |
Water management associated with the open pit mine will include dewatering of the pit and run-on and run-off controls. As discussed in Section 16.9, dewatering is expected to generate up to 4,500 gpm during pit development. This water can be used for a variety of uses including dust control, makeup water for leaching of mineralized material, third-party use agreements, or reinjected into other areas of the aquifer.
Because the Willcox Basin is a closed basin, drainages are not classified as “Waters of the U.S.” and there are no Clean Water Act requirements. However, for optimal operation and stability of the mine facilities, erosion controls and management of stormwater run-on and runoff will be included in the designs of the facilities. For APP-regulated facilities, run-on and runoff controls such as containment berms and diversion structures are key elements of Best Available Demonstrated Control Technologies (BADCT) and integrated in the designs of the facilities. Limiting run-on reduces the amount of water that may contact mining materials. APP-regulated facilities will include the heap leach pad, any process solution and non-stormwater ponds, and possibly the waste rock stockpile (unless it can be determined as exempt). Ponds will be sufficiently sized to contain the solutions they are designed to hold, plus storm events with a minimum of 2 feet of freeboard. The minimum design storm requirement for APP facilities is the 100-year 24-hour storm event.
Surface water will be diverted around the pit, leach pad, process plant, and other non-APP facilities. Water will be managed using engineered features such as diversions or retention structures.
| M3-PN210313.007 31 March 2026 Revision 0 | 247 |
GUNNISON PROJECT Form 43-101F1 Technical Report |
Approximately 1641 million tons of waste material is planned to be removed in the mining process. Waste material includes overlying basin fill material and uneconomic bedrock that must be removed in the process of mining mineralized material for the heap leaching operation. Note that GCC is processing limestone from the Gunnison pit into cement and other products. Remaining, waste rock will be placed in two or more waste rock stockpiles. The basin fill materials are alluvial and typically alkaline in nature. Subeconomic bedrock material is typically calcareous in nature and not expected to contain significant sulfides or be acid generating. The stockpiles are likely exempt from APP regulations and are not planned to be lined; however a waste rock characterization demonstration may be required as part of the APP significant amendment to demonstrate the waste rock is inert material.
The stockpiles are designed for stability and efficiency of construction. Surface water diversions are designed to direct stormwater runoff from impacting the stockpiles, allowing it to be discharged into the natural drainage system at the site. Stockpile construction is also designed to facilitate reclamation efforts at the end of mine life.
| 20.3 | Closure and Reclamation |
All APP-regulated facilities must be closed in accordance with the stipulations of the APP permit at the end of operations. Non-APP facilities, such as buildings and infrastructure, will be reclaimed in accordance with the approved Mined Land Reclamation Program overseen by the Arizona State Mine Inspector’s Office. This reclamation plan ensures safe and stable post-mining land use. Re-grading and resurfacing needs, if any, will be completed with good engineering practices minimizing unwanted surface disturbances. The closure and reclamation plans include cost estimates and financial assurance for implementing the plans. GCC maintains a surety bond, posted with Arizona State Mine Inspector (ASMI). Both the reclamation plan and surety bond must be updated to reflect changes in the surface processing facilities.
Reclamation of the pit (which is not expected to be an APP-regulated facility) will consist of erosion control. At closure stable pit walls will be left in place, and unstable pit walls will be stabilized. Reclamation cover material will be placed on the benches above the projected water level and seeded. Pit roads and safety benches will be ripped and water bars will be employed to control surface water erosion. Where practical, disturbed areas around and adjacent to the pit will be covered with topdressing material and revegetated. The pit area and highwalls will be appropriately barricaded or fenced and posted according to MSHA and Arizona State Mine Inspector’s regulations. Access to the pit will be limited by some combination of gates, road blocks, and physical barricades.
At closure, the heap leach pad (an APP-regulated facility) and the waste rock stockpiles (which may be regulated under APP) will be managed to prevent, contain, or control discharges. In the case of the heap leach pad, it is anticipated that closure will include neutralizing or rinsing of all spent mineralized material, elimination of free liquids, stabilization of heap materials, and recontouring of the heap to eliminate ponding. The waste rock stockpile will be recontoured in a similar manner to eliminate ponding and minimize infiltration.
Process solution and non-stormwater ponds will be closed in accordance with the approved APP closure plan. The solution ponds containing liquids (PLS, raffinate, etc.) will be emptied and cleaned. Liners will be inspected for signs of leakage. The soils beneath prospective defects will be investigated and remediated as necessary. After clearance, the liner materials will be folded into the bottom of the pond for burial in place. Perimeter berms above the natural land surface will be pushed into the pond to cover the liner, contoured, and revegetated to shed surface runoff and minimize infiltration.
Other facilities such as the plant and buildings will be removed and the land surface will be contoured and graded.
Total costs for reclamation and closure are estimated to be $92.6 million.
| M3-PN210313.007 31 March 2026 Revision 0 | 248 |
GUNNISON PROJECT Form 43-101F1 Technical Report |
| 20.4 | Community Relations |
GCC consistently seeks to build sustainable partnerships and bring value to the communities where it operates. GCC’s approach to community relations reinforces its core values and provides guidelines for making decisions on a variety of issues, ranging from charitable giving to resource development. To that end, GCC maintains a broad-based community relations and stakeholder outreach program in support of the Gunnison Project. Various levels of activity and outreach occur as a function of the development of the Project from pre-feasibility and feasibility studies, through Project construction and operations, to closure and rehabilitation. Elements of this program include:
| ● | Targeted stakeholder outreach to government, community, business, non-profit and special interest groups, and leaders at the local, county and state level. |
| ● | Development of community relation and communication tools and resources (e.g., Project website, Project e-newsletter, and presentation materials). |
| ● | Public open houses and technical briefings when appropriate. |
Crucial elements of GCC’s community relations efforts will involve ensuring consistent and ongoing communication with all stakeholders and providing opportunities for meaningful two-way dialogue and active public involvement. GCC will focus on ensuring the public benefits related to the Gunnison Project, such as employment opportunities, supplier services, infrastructure development and community investment are optimized for the local community. GCC’s social and environmental license to operate is further confirmed by a settlement agreement that was reached with a number of environmental activist groups that resulted in the withdrawal of a permit appeal related to the in-situ operation.
| 20.5 | Economic Benefits |
GCC commissioned an Economic Impact Study through the University of Arizona Eller Partnerships Office, which forecasted an increase in economic activity within Arizona during the construction phase and life of the mine; the preliminary results of that study are presented below. To assess the full economic contribution of the Project, the study applied three complementary, nationally accepted economic modeling tools: regression-based forecasting, the Regional
Input-Output Modeling System (RIMS II), and the Impact Analysis for Planning (IMPLAN) model.3 The results of these methods, taken together, were used to make projections about the direct benefit and multiplier effect of the Project. The local, state, and national economic impacts of mine development are outlined below:
| ● | During the lifetime of the project, an annual average of 524 jobs will be created by the Project, with 733 jobs anticipated during peak production. Employment benefits are distributed through many sectors, including skilled and semi-skilled categories, and are expected to generate multiplier effects across the county’s service, trade, and utility sectors. |
| ● | The Project is projected to generate approximately $625 million per year in direct economic output in Arizona. |
| ● | When indirect and induced effects are included, the total economic output attributable to the project in District 6, including Cochise County, is 765 jobs and $880 million in output. Statewide, the indirect and induced effects are estimated at 1,739 jobs and $978 million in output, representing secondary economic activity associated with supply chain expenditures and employee household spending. |
At the national level, the Economic Impact Study predicts annual combined direct, indirect and induced effects of $1.43 billion in economic output and 2,676 jobs. Cumulative Life-of-Mine impacts include $9.02 billion in economic output for District 6 (including Cochise County), $10.01 billion for Arizona, and $14.6 billion for the United States.
3 This study was based on a projected 1-year pre-production and 18-year production phase.
| M3-PN210313.007 31 March 2026 Revision 0 | 249 |
GUNNISON PROJECT Form 43-101F1 Technical Report |
| 21 | CAPITAL AND OPERATING COSTS |
Capital and operating costs for the Gunnison Project were developed at a AACE Level 5 level of accuracy suitable for a Preliminary Economic Analysis (PEA) technical report. The level of accuracy is +35% / -25% and the contingency used is 20% across the board.
Estimation of Capital and Operating costs is essential to the evaluation of the economic viability of a prospective project. These factors, combined with revenue and other expense projections, form the basis of the financial analysis presented in Section 22 Economic Analysis. Capital (CAPEX) and Operating (OPEX) costs for the Gunnison Open Pit (OP) Project were estimated on the basis of the PEA mine plan and plant design. The CAPEX presented here is primarily a “factored” cost estimate based on capital equipment costs compiled for the operation. Some WBS Areas including the heap leach pad, and the SX-EW plant were estimated using capital equipment costs and material take-offs of the basic construction commodities. Civil earthworks, concrete, and steelwork quantities were estimated for all WBS areas.
| 21.1 | Project Summary |
The Gunnison Open Pit Copper Project will be a large open pit, heap operation. The mine will include two open pits: the Gunnison Deposit and the Strong & Harris Deposit. The common SX-EW plant, with a capacity of 175 million lbs of copper cathode per annum, will be located to the south of the heap leach pad. The operation will consist of primary crushing located between the Gunnison open pit and the leach pad. Approximately 40% of the throughput will be diverted to a Material Sorting plant to remove high carbonate mineralized materials ahead of leaching. The leach pad will be mechanically stacked by mobile conveyors.
The Mine Services Area includes a Truck Maintenance Shop, Truck Wash, Tire Shop, Mine Operations Building, Mine Change House and Fuel Station. Other ancillary buildings that are located near the SX-EW facility include the administration building, security control and truck scale, laboratory, and plant maintenance building. The project’s main substation is also located next to the SX-EW.
Infrastructure changes include realignment of Interstate 10 in the vicinity of the Gunnison open pit, rerouting the pipeline corridor between the Gunnison PLS Pond and the Johnson Camp ponds, relocating a fiberoptic telephone cable that crosses over the deposit, relocating the powerlines and substations for the new Gunnison SX-EW and sulfuric plant, and shortening the rail spur into the property.
The 2,700 stpd sulfuric acid plant area is located adjacent to the SX-EW facility. It includes the acid plant proper, molten sulfur storage tanks, two large sulfuric acid storage tanks, a cogeneration facility, cooling towers, and a boiler water treatment facility. The Railyard lies adjacent to the Sulfuric Acid Plant and connects directly to the UPSP main line via a rail spur.
High quality unmineralized limestone from the pits will be mined, stockpiled, and fed to a cement plant to produce cement for the growing markets. Other high purity limestone products will be produced and sold on a royalty basis to augment revenues.
| 21.2 | Capital Cost Summary |
Estimated CAPEX, or capital expenditures, include two components: (1) the initial CAPEX to undertake the detailed design, pre-strip, construct, and commission the mine, plant facilities, ancillary facilities, utilities, and complete on and offsite environmental mitigation and remediation; (2) the sustaining CAPEX for facilities expansions, mining equipment replacements, expected replacements of process equipment and ongoing environmental mitigation activities. Table 21-1 summarizes the initial and sustaining CAPEX for the Project.
| M3-PN210313.007 31 March 2026 Revision 0 | 250 |
GUNNISON PROJECT Form 43-101F1 Technical Report |
Table 21-1: Capital Cost Summary
|
Area |
Detail |
Initial CAPEX ($000s) | Sustaining CAPEX ($000s) |
Total CAPEX ($000s) |
Direct Costs |
Mine Costs | 280,302 | 51,802 | 332,104 |
| Processing Plant | 738,540 | 211,583 | 950,123 | |
| Infrastructure | 92,020 | 378,019 | 470,039 | |
| Freight | 55,707 | 15,999 | 71,706 | |
| Indirect Costs | 193,757 | 32,900 | 226,658 | |
| Owner’s Costs, First Fills, & Light Vehicles | 23,657 | 0 | 23,657 | |
| Offsite Environmental Mitigation Costs | 0 | 0 | 0 | |
| Onsite Mitigation, Monitoring, and Closure Costs | 0 | 0 | 0 | |
| Total CAPEX without Contingency | 1,383,983 | 690,303 | 2,074,287 | |
| Contingency | 171,635 | 39,072 | 210,707 | |
| Total CAPEX with Contingency | 1,555,618 | 729,376 | 2,284,994 | |
The CAPEX estimate includes direct mining equipment and pre-stripping costs, process plant costs, and infrastructure such as the water systems, main substation, transmission lines, ancillary facilities, cement plant, sulfide plant, and highway relocation. The initial CAPEX also includes indirect costs for detailed design and engineering. Initial CAPEX also includes an estimate of contingency based on the accuracy and level of detail of the cost estimate. The purpose of the contingency provision is to make allowance for uncertain cost elements that may occur but are not included in the cost estimate. These cost elements include uncertainties concerning completeness, accuracy and characteristics or nature of material takeoffs, accuracy of labor and material rates, accuracy of labor productivity expectations, and accuracy of equipment pricing. The CAPEX estimates are considered to have an accuracy range of -25% to +30%.
The primary assumptions used to develop the CAPEX are provided below:
| ● | The estimate is based on 1st quarter 2026 costs. |
| ● | All cost estimates were developed and are reported in United States of America (US) dollars. |
| ● | Units of measure for this project are primarily in Imperial customary units. |
| ● | At the time of this estimate, engineering was approximately 3% complete. |
| ● | Contingency during the pre-production period is specific to each major component of the Project as determined by the various consultants. |
| ● | Qualified and experienced construction contractors will be available at the time of Project execution. |
| ● | No provision has been made for currency fluctuations. |
| 21.2.1 | Mine Capital Cost |
The mine capital generally includes three components: capital to lease with the option to purchase the mining/support fleet and the cost of pre-stripping. Mine capital costs for mobile equipment were developed from the mine equipment list presented in Section 16.
| M3-PN210313.007 31 March 2026 Revision 0 | 251 |
GUNNISON PROJECT Form 43-101F1 Technical Report |
Mine capital costs including equipment and pre-production development are presented in Table 21-2.
Table 21-2: Summary of Mine Capital Costs ($000s)
|
Category |
Initial Capital | Sustaining Capital | Total Capital | ||
| Year -2 | Year -1 | Total | |||
| Preproduction Development | 106,742 | 130,829 | 237,571 | 237,571 | |
| Mining Equipment - Leased | 25,687 | 17,053 | 42,731 | 51,802 | 94,533 |
| Total | 132,420 | 147,882 | 280,302 | 51,802 | 332,104 |
*Assumes equipment lease to purchase at 10% down *Assumes interest only payments during pre-production
Mine capital costs include the following:
| 1. | Cost of mine mobile equipment required to drill, blast, load, and haul material. Major equipment purchase costs were from 2025 budgetary quotes received by IMC. Equipment is assumed to be leased. |
| 2. | Auxiliary equipment to maintain the mine and material storage areas in good working order. Major equipment purchase costs were from 2025 budgetary quotes received by IMC. Equipment is assumed to be leased. |
| 3. | Equipment to maintain the mine fleet such as mechanic trucks, lube trucks, tire handlers and forklifts. Support equipment purchase costs are sourced from the IMC project library. Equipment is assumed to be leased. |
| 4. | Light vehicles for mine operations and staff personnel. Equipment is assumed to be leased. |
| 5. | An allowance (3% of pre-production mine major equipment capital) is included for initial shop tools. |
| 6. | An allowance (5% of pre-production mine major equipment capital) is included for initial spare parts inventory. |
| 7. | Equipment replacements are included as required based on the useful life of the equipment. |
Table 21-3 summarizes the mine capital costs by year. Pre-production stripping is part of the mine capital cost but is shown separately to differentiate it from the cost of purchasing mine equipment. An additional $185.6 million of waste stripping costs is also applied to sustaining capital beyond what is shown in Table 21-3. These costs are included in Table 21-9 below.
Table 21-3: Summary of Annual Mine Capital Costs ($000s)
|
Year |
Mine Equipment | Mine Preproduction Development | Total Mine Capital Cost | |
| Initial 10% Down Payment | Capitalized Lease Interest | |||
| -2 | 25,678 | 106,742 | 132,420 | |
| -1 | 3,260 | 13,793 | 130,829 | 147,882 |
| 1 | 304 | 304 | ||
| 2 | $292 | 292 | ||
| 3 | 1,069 | 1,069 | ||
| 4 | 4,760 | 4,760 | ||
| 5 | 1,269 | 1,269 | ||
| 6 | 4,225 | 4,225 | ||
| 7 | 745 | 745 | ||
| M3-PN210313.007 31 March 2026 Revision 0 | 252 |
GUNNISON PROJECT Form 43-101F1 Technical Report |
|
Year |
Mine Equipment | Mine Preproduction Development | Total Mine Capital Cost | |
| Initial 10% Down Payment | Capitalized Lease Interest | |||
| 8 | 1,419 | 1,419 | ||
| 9 | 2,541 | 2,541 | ||
| 10 | 1,162 | 1,162 | ||
| 11 | 8,453 | 8,453 | ||
| 12 | 11,858 | 11,858 | ||
| 13 | 6,370 | 6,370 | ||
| 14 | 917 | 917 | ||
| 15 | 605 | 605 | ||
| 16 | 4,663 | 4,663 | ||
| 17 | 1,151 | 1,151 | ||
| Total | 80,740 | 13,793 | 237,571 | 332,104 |
| *Assumes equipment lease to purchase at 10% down | ||||
| *Assumes interest only payments during pre-production | ||||
IMC provided the equipment purchase cost estimate to Gunnison Copper, and Gunnison Copper calculated the equipment lease costs shown in these tables for equipment acquired during mining assuming the following lease terms:
| ● | Lease to own 10% down payment with a 7 year duration at a 7.23% interest rate. |
| ● | Lease payments during pre-production are assumed to be interest only at an 8.48% interest rate |
IMC considers the above lease term assumptions to be unconventional. As a check, the author prepared an estimate of the mining costs assuming recently observed lease to own terms for the mining equipment of: 15% down payment with a 7 year duration at a 7.23% interest rate. This calculation was used as an independent “check” of the impact of the interest only payments during preproduction on the resulting mining costs.
The Initial capital cost of $280.3 million presented in Table 21-2 is ~14% less than the “check” initial capital estimated by the author. A 14% difference is within the stated +35% / -25% accuracy of the PEA estimate.
As an additional comparison, the author compared the sum of mining capital and operating costs (total mining costs) presented in this section 21 against the “check” total mining costs. The total mining costs were compared on an annual basis following pre-production. The total costs presented in this chapter varied from 22% higher to 14% lower when compared to the total mining cost “check” estimate on an annual basis. Over the entire mine life, the presented total mining costs and the “check” total mining costs differ by only 1.3% both on an undiscounted basis and on an 8% discounted basis. For the purposes of a PEA study, the author finds that the mining cost estimates presented in this chapter fall within the accepted accuracy of the independent “check”.
No contingency has been applied to mine capital costs.
| 21.2.2 | Process Plant Capital Cost |
Capital costs for the processing plant were estimated using budgetary equipment quotes, material take-offs (MTOs) for concrete, steel, and earthwork, estimates from vendors and consultants, and estimates based on experience with
| M3-PN210313.007 31 March 2026 Revision 0 | 253 |
GUNNISON PROJECT Form 43-101F1 Technical Report |
similar projects of this type. The direct capital cost estimate for the plant is shown in Table 21-4. Some of the costs and quantity estimates used by M3 were supplied by other consultants.
Table 21-4: Process Plant Direct Capital Cost Summary
| Area Description | Initial ($000s) | Sustaining ($000s) | Total ($000s) |
| Plant General | 25,588 | 10,844 | 25,588 |
| Crushing, Stockpile, Material Sorting | 250,087 | 0 | 250,087 |
| Material Handling/Stacking | 215 | 0 | 215 |
| Leaching, Solution Ponds | 96,266 | 200,739 | 297,005 |
| Solvent Extraction (SX) | 60,024 | 0 | 60,024 |
| Tank Farm | 26,375 | 0 | 26,375 |
| Electrowinning (EW) | 83,160 | 0 | 83,160 |
| Reagents | 400 | 0 | 400 |
| Sulfuric Acid Plant | 196,423 | 0 | 196,423 |
| Plant Direct Capital Total | 738,540 | 211,583 | 950,123 |
Mechanical Equipment Costs
Major mechanical equipment was priced for the capital cost estimate by soliciting budgetary quotations or by escalating quotations from the 2024 Gunnison Open Pit PEA. Some budgetary quotations were used from recent M3 hydrometallurgical projects with similar scope and capacity. Vendors were approached were the well-qualified suppliers of process and auxiliary equipment typically found in the mining industry. Operating data were provided with duty specifications for some pieces of process and auxiliary equipment in the Equipment Register. These data included process flows and data from Bruno comminution simulations, from METSIM mass balance process simulations and other specifications compiled in the Process Design Criteria (PDC), and from physical information derived from General Arrangement drawings.
Suppliers were provided with the basic information required to prepare a credible quotation. Budgetary proposals were evaluated to determine if they met the duty specifications for the project. Where prices were escalated from previous quotes, M3 used the Engineering Record Index, a month-by-month estimation of inflation to current dollars. The price that was used in the capital cost estimate was based on the most suitable quote.
Civil Earthworks
The earthwork quantities for the Gunnison Open Pit project (OP) were based on the existing survey extracted from the AutoDesk application Infraworks. Using AutoDesk Civil 3D, these existing grade elevations were used to design the rough graded surfaces for the project infrastructure for civil pads, access roads, non-contact water diversions, and railroad grades. The leach pad earthworks quantities were estimated by Geo-Logic from their leach pad designs.
The earthworks quantities for the crusher pad and MSE wall were estimated from GA’s and by the dimensions of crushing facilities at other M3 projects.
Structural Steel and Concrete Quantity Estimates
Structural steel and concrete quantities were based on MTOs prepared from General Arrangement (GA) drawings of process facilities and buildings. Dimensions were taken from design drawings and compared with MTO’s for more advanced projects of similar size and scale. MTO provided the total quantities of each category of concrete and steel by WBS (Area) number.
| M3-PN210313.007 31 March 2026 Revision 0 | 254 |
GUNNISON PROJECT Form 43-101F1 Technical Report |
Concrete & Structural Commodity Pricing
Structural steel pricing was developed from recent M3 benchmarking data for similar materials local to the project.
Concrete supply pricing was developed from recent M3 benchmarking on the assumption that a batch plant would be set up on site and that aggregate would be available from site-furnished materials.
Piping Costs
Piping costs were factored by Area and benchmarked from recent projects of similar size and type. In the case of the SX-EW plant, material take-offs (MTO’s) had been previously compiled for the same layout in previous years. These take-offs were priced with updated material and installation costs. For the leach pad collection, distribution, and irrigation piping, new MTO’s were compiled by Geo-Logic and M3.
Electrical Costs
Electrical equipment and bulk materials were factored by area and benchmarked from recent projects. Instrumentation
Instrumentation materials costs were factored by area and benchmarked from recent projects.
| 21.2.3 | Infrastructure Costs |
| 21.2.3.1 | Infrastructure Summary |
Infrastructure includes site utilities, ancillary facilities, the cement plant, the sulfide plant, and highway relocation. Table 21-5 summarizes the direct costs for onsite infrastructure. Infrastructure costs that were not estimated by M3 have the source listed in parenthesis.
Table 21-5: Infrastructure CAPEX Summary
| Onsite Infrastructure | Initial ($000s) | Sustaining ($000s) | Total ($000s) |
| Fresh/Fire Water Systems | 6,288 | 0 | 6,288 |
| Main Substation, Transmission Power Line | 16,115 | 0 | 16,115 |
| Ancillary Facilities | 27,674 | 0 | 27,674 |
| Cement/Limestone Plant (Burgex) | 0 | 321,419 | 321,419 |
| Sulfide Plant (GCC) | 0 | 56,600 | 56,600 |
| Highway Relocation (Kimley Horn) | 41,943 | 0 | 41,943 |
| Total Infrastructure | 92,020 | 378,019 | 470,039 |
| 21.2.3.2 | Sulfuric Acid Plant |
In 2021, NORAM Engineering of Vancouver provided a conceptual design for sulfuric acid plant with a capacity of 1,650 short tons per day (stpd). For the 2025 Gunnison OP PEA, M3 factored the NORAM design to a capacity of 3,000 stpd and compared the escalated cost with other 3,000 stpd acid plants for verification of costs and scope. For the current 2026 Gunnison Open Pit PEA, the 2025 sulfuric plant estimate was reduced using the Power of 0.725 rule to a plant capacity of 2,700 tons per day and then escalated to Q1 2026 dollars. The cost for sulfuric acid plant related areas totals $196.4 million and is included as part of the Processing Plant.
| M3-PN210313.007 31 March 2026 Revision 0 | 255 |
GUNNISON PROJECT Form 43-101F1 Technical Report |
The scaling factor to compensate for the higher acid demand uses the formula: (R2/R1)^0.725 * CapexR1, where R1 is the original estimated capacity of the acid plant and R2 is the new capacity. The power factor of 0.725 was used instead of the standard power factor of six-tenths because at this larger capacity, many of the large vessels in the acid plant will have to be constructed on site instead of shop fabricated and transported to site, resulting in higher costs.
The main equipment within the current scope of work includes:
| ● | Main blower and steam generator | |
| ● | Drying Tower | |
| ● | Sulfur Furnace | |
| ● | Waste Heat Boiler | |
| ● | Converter | |
| ● | Superheater | |
| ● | Hot and Cold Pass Heat Exchangers | |
| ● | Economizers | |
| ● | Intermediate and Final Absorption Towers | |
| ● | Circulation Acid Tank w/ Acid Cooler and pump | |
| ● | Product and Final Acid Coolers and pumps | |
| ● | Deaerator | |
| ● | Cooling tower | |
| ● | Turbo generator | |
| ● | Continuous Blowdown Tank | |
| ● | Dump and Surface Condensers | |
| ● | Caustic Feed Tank, Pump, and Cooler | |
| ● | Civil, concrete and steel MTO quantities were developed by MTO. |
Equipment outside NORAM’s scope of supply includes:
| ● | Sulfur unloading pumps | |
| ● | Railcar steaming equipment | |
| ● | Sulfur storage pit | |
| ● | Sulfur day tanks and steam jacketing system | |
| ● | Demineralized water plant | |
| ● | Emergency boiler | |
| ● | Two (2) 10,000 ton sulfuric acid storage |
Interconnect piping, electrical equipment and distribution, and plant instrumentation were built up by using standard M3 factors based on capital equipment costs. M3 also included a dedicated substation to provide power to the sulfuric acid plant. These prices were estimated by M3.
| M3-PN210313.007 31 March 2026 Revision 0 | 256 |
GUNNISON PROJECT Form 43-101F1 Technical Report |
| 21.2.3.3 | Railroad Spur and Siding |
The two railroad spurs, rail siding and railyards are located adjacent to the Sulfuric Acid plant and the Cement Plant. For the current study, they have been relocated to meet the positioning on the Gunnison site plan, and they are still integral to operation and economics for the project. The Union Pacific Southern Pacific (UPSP) railroad has communicated that rail spurs must be able to accommodate unit trains (80 cars) to be considered for connection to the UPSP rail line.
MHF Consulting (MHF), an independent railroad engineering consultant previously prepared a design and costing for the railroad siding and rail unloading yard, reporting an estimate of accuracy +30%/-15%. For this PEA, the material take-off of the rail siding was adjusted for a shorter length because the railyard is now closer to the UPSP main line by 1.4 miles. The material take-offs for rail in the railyard were revised for the current configuration and re-costed with Q1 2026 steel costs. The railcar mover cost was escalated to Q1 2026 prices.
| 21.2.3.4 | Interstate Highway Relocation |
The development of the Gunnison open pit requires the relocation/realignment of a segment of Interstate 10 (I-10), which is located over the top of the northern portion of the Gunnison Copper deposit. The relocation of the highway also involves relocating the interchange and exit to Johnson Road that provides access to a privately owned gift shop (The Thing) and gasoline station and to the Johnson Camp Mine on the north side of the highway.
Kimley Horn, an engineering company that specializes in transportation infrastructure, prepared an internal PFS for GCC in October 2025 to update the investigation that they had previously provided to GCC in 2021. Their PFS report is a complete study that includes a thorough review of the highway design criteria, previous works on the highway, new design alignment, geotechnical conditions, hydrology and environmental considerations, permitting, and safety considerations. Their estimate is based on a three-mile length of four-lane concrete paved interstate. The estimate includes excavation and grading, aggregate base course (ABC), asphaltic concrete, binders, admixtures, and concrete catch basins. The estimate also includes a new interchange for the Johnson Road relocation and an underpass for mine vehicles. Other costs include contractor mobilization, quality control, and construction surveying. With 20% contingency, the direct cost of the Interstate 10 relocation is $34.4 million. Another $7.6 million has been added for drainage, traffic signage, traffic control during construction, dust suppression, erosion control, and incentives for smoothness and quality. Kimley Horn included a contingency estimate of 5%. Kimley Horn’s total cost of the highway realignment with direct and indirect costs, and contingency is $41.9 million (Kimley, 2025).
| 21.2.3.5 | Electrical Switchyard |
The current design for the Gunnison Open Pit Project includes connecting to the existing 69 kV transmission line operated by SSVEC that is in use for the Johnson Camp Mine on the north side of I-10. The Gunnison Open Pit will more than likely need to connect to a transmission line with a higher voltage. This capital cost estimate includes a cost of $5.3 million for an electrical switchyard to tap a 115 kV power transmission line operated by SSVEC. This change will allow the operation to increase the Gunnison incoming primary substation from 69 kV to the 115 kV to handle the higher current required for the 175 mppa Gunnison SX-EW plant. Another $10.9 million has been estimated for new overhead distribution power lines and cabling to the various plant and ancillary facilities.
| 21.2.4 | Cement Plant and Limestone Facilities |
The capital cost estimate for the integrated cement plant and limestone distribution infrastructure was developed to AACE Class 5 standards (+35% / -25% accuracy). These costs are summarized in Table 21-6.
| M3-PN210313.007 31 March 2026 Revision 0 | 257 |
GUNNISON PROJECT Form 43-101F1 Technical Report |
Unlike the initial copper operation infrastructure, the cement plant is structured as expansion capital. Construction is scheduled for Years 4 and 5 of the mine life, allowing the facility to be funded entirely from cumulative project free cash flow following the payback of the initial copper project capital.
The total direct expansion capital cost to construct the 1.2-million-ton-per-year capacity cement plant and associated limestone handling facilities is estimated at $321.42 million as shown in Table 21-6. This capital estimate includes:
| ● | Raw Material Preparation: Primary, secondary, and tertiary crushing circuits, screens, and the overland conveyor system to transport material from the East Waste Dump to the cement yard. |
| ● | Main Process Equipment: Raw mill, pre-heater tower, dry-process rotary kiln, clinker cooler, clinker storage, and finish cement mills. |
| ● | Distribution Network: Construction of two rail-served distribution terminals located in Tucson and Phoenix to facilitate bulk market access. |
| ● | Infrastructure & Utilities: Site preparation, dedicated power substations, a direct tap into the on-site natural gas pipeline, and the dedicated cement/limestone rail spur. |
Sustaining capital for the cement plant and limestone operations over the life of the mine is estimated at $349.5 million. This encompasses major mechanical degradation replacements, refractory lining cycles for the kiln, and ongoing equipment replacements, effectively modeling the physical aging of the asset over its operating life.
Table 21-6: Cement Plant and Limestone Facilities Capital Costs
|
Description of Capital Cost Item |
Estimated Cost ($000) |
| Raw Materials Prep | 20,600 |
| Conveyor from Stockpile to Plant | 15,200 |
| Main Process Equipment | 140,500 |
| EPC & Installation | 45,000 |
| Site Prep and Utilities | 10,000 |
| Rail Spur and Loading Facilities | 17,760 |
| Contingency | 37,359 |
| Distribution Terminal Network | 35,000 |
| Total | 321,419 |
**Limestone Pre-Stripping Capitalized costs of $4.1million not shown in Table 21-6.
| 21.2.5 | Indirect Costs |
Indirect costs are those costs that cannot generally be assigned to a specific work area, as summarized in Table 21-7. This category includes “other indirect costs” that provide oversight and support the construction activities for the project.
| M3-PN210313.007 31 March 2026 Revision 0 | 258 |
GUNNISON PROJECT Form 43-101F1 Technical Report |
Table 21-7: Indirect Capital Cost Summary
| Indirect Cost Items | Initial ($000s) | Sustaining ($000s) | Total ($000s) |
| Contractor Labor/Non-Labor Indirect costs | 55,559 | 13,289 | 68,848 |
| EPCM | 107,423 | 14,452 | 121,875 |
| EPCM Temporary Facilities | 4,476 | 0 | 4,476 |
| EPCM Commissioning | 4,383 | 0 | 4,383 |
| Vendor Support | 6,575 | 1,548 | 8,122 |
| Vendor Precommissioning | 2,192 | 516 | 2,707 |
| Vendor Commissioning | 2,192 | 516 | 2,707 |
| Commissioning and Capital Spares | 10,958 | 2,579 | 13,537 |
| Total Indirect Costs | 193,757 | 32,900 | 226,658 |
| 21.2.5.1 | EPCM Costs |
The EPCM cost is comprised of various categories that total 12% of direct constructed field cost excluding mining pre-strip and mine equipment costs. The EPCM categories are management, engineering, project services, project controls, and construction management. EPCM Temporary Facilities are included at 0.5% of direct constructed field costs to cover EPCM and Owner temporary housing, warehousing and materials, temporary entrances, and any safety related facilities associated with construction. EPCM Commissioning is included at 1% of plant equipment cost excluding mobile equipment.
| 21.2.5.2 | Other Indirect Costs |
Contractor Non-direct Labor/Non-Labor Indirect costs are included at $20 per direct work hour to cover non-direct labor, support of direct construction activities, safety items & personal protection, equipment mobilization, temporary construction power, and temporary construction facilities required during construction.
Vendor Support at 1.5% of plant equipment costs, Pre-commissioning at 0.5% of plant equipment costs, and Commissioning at 0.5% of plant equipment costs are included to cover the cost of vendor personnel services for the installation, pre-commissioning, and commissioning of all process equipment.
Capital and Commissioning spares cost is included using 2.5% of plant equipment costs. No other Indirect Costs were included in the capital estimates.
| 21.2.6 | Owner’s Costs |
Owner costs are included at $23.7M.
Equipment operators will be hired as early as three months prior to start-up for training and preparation work. Senior staff and engineering personnel will also be hired several months prior to start-up as they become available. Environmental monitoring will continue through the construction period. Other Owner Cost items include:
| ● | Owner’s construction and administrative costs, including the Owners office; | |
| ● | Plant mobile equipment and light vehicles; | |
| ● | Insurance, accounting and legal; | |
| ● | Furniture and office equipment; |
| M3-PN210313.007 31 March 2026 Revision 0 | 259 |
GUNNISON PROJECT Form 43-101F1 Technical Report |
| ● | Tools; | |
| ● | Staffing and operator training cost; and | |
| ● | Initial fills and wear steel spares. |
| 21.2.7 | Environmental Mitigation, Reclamation, and Closure Costs |
Reclamation and Closure costs are included in the financial model for the project and total $92.6 million.
| 21.2.8 | Contingency |
The purpose of the contingency provision is to make allowance for uncertain cost elements that may occur but are not included in the cost estimate. The total estimated contingency for the SX-EW plant, heap leach facility and infrastructure for this Project is 20% of the total initial CAPEX before sales tax.
| 21.3 | Operating Costs (OPEX) |
The total life-of-mine (LoM) costs, operating costs per short ton ($/st) of processed material, and dollars per pound ($/lb) of cathode produced are summarized in Table 21-8. The project operating costs include mine operating, process plant operating, and general and administrative costs (G&A). Total production costs add royalty expense, reclamation & closure, salvage value, and property & severance taxes. Total costs in each category are divided by the total tonnage of processed material or the total pounds produced to arrive at the values shown in Table 21-8.
Table 21-8: Operating and Production Costs
|
Area |
LoM ($000) |
$/st Mineralized Material Processed | $/lb Copper Recovered (US$) |
| Mine Operating Cost | 4,226,693 | 7.82 | 1.33 |
| SXEW Operating Cost | 512,427 | 0.95 | 0.16 |
| Heap Leach Operating Cost | 1,077,491 | 1.99 | 0.34 |
| G & A | 142,003 | 0.26 | 0.04 |
| Mineralized material Sorting | 212,173 | 0.39 | 0.07 |
| Sulfide Plant | 199,579 | 0.37 | 0.06 |
| Operating Costs | 6,370,366 | 11.78 | 2.00 |
| Royalties | 715,142 | 1.32 | 0.22 |
| Property & Severance Tax | 206,453 | 0.38 | 0.06 |
| Closure & Salvage Value | 1,598 | 0.00 | 0.00 |
| Other Production Costs | 923,192 | 1.71 | 0.29 |
| Total Operating Costs | 7,293,558 | 13.49 | 2.29 |
| 21.3.1 | Mine Operating Cost |
Mine operating costs were developed based on first principles for the mine plan and the equipment list presented in Section 16. Sufficient release of leachable material is not achieved until after two years of pre-production waste stripping. The mine operating costs for the first two years of preproduction mining ($237.6 million Years -2 and -1) and also the deferred stripping costs ($185.7 million in Years 1 – 15) are discussed in this section and included in Table 219 but are accounted for in the mining capital costs section. Equipment lease costs average $0.38/t mined. The mine operating costs presented below include $230.5 million that has been allocated to “limestone mining costs”.
| M3-PN210313.007 31 March 2026 Revision 0 | 260 |
GUNNISON PROJECT Form 43-101F1 Technical Report |
Annualized operating costs by cost center are provided in Table 21-9.
Table 21-9: Mine Operating Costs by Cost Center
|
Mining Year |
Total Material (kt) |
Drilling $/t |
Blasting $/t |
Loading $/t |
Hauling $/t |
Auxiliary $/t |
General Mine $/t |
General Maint. $/t |
G&A $/t |
TOTAL $/t |
Sub-Total Operating Cost ($000) |
Equipment Lease Costs ($000) | Total Operating Cost ($000) |
| -2 | 95,000 | 0.07 | 0.02 | 0.20 | 0.53 | 0.12 | 0.05 | 0.06 | 0.08 | 1.12 | 106,742 | 106,742 | |
| -1 | 100,000 | 0.08 | 0.15 | 0.19 | 0.58 | 0.12 | 0.05 | 0.06 | 0.09 | 1.31 | 130,829 | 130,829 | |
| 1 | 100,000 | 0.08 | 0.14 | 0.19 | 0.58 | 0.13 | 0.05 | 0.06 | 0.09 | 1.33 | 132,664 | 42,069 | 174,733 |
| 2 | 100,000 | 0.11 | 0.15 | 0.21 | 0.58 | 0.13 | 0.04 | 0.06 | 0.09 | 1.37 | 136,572 | 47,806 | 184,378 |
| 3 | 100,000 | 0.12 | 0.15 | 0.21 | 0.63 | 0.13 | 0.04 | 0.06 | 0.09 | 1.43 | 142,934 | 49,485 | 192,419 |
| 4 | 105,000 | 0.12 | 0.16 | 0.21 | 0.65 | 0.14 | 0.04 | 0.06 | 0.09 | 1.48 | 154,994 | 56,958 | 211,952 |
| 5 | 110,000 | 0.12 | 0.15 | 0.21 | 0.65 | 0.15 | 0.04 | 0.06 | 0.09 | 1.46 | 161,048 | 58,949 | 219,997 |
| 6 | 120,000 | 0.13 | 0.16 | 0.21 | 0.68 | 0.15 | 0.04 | 0.06 | 0.09 | 1.50 | 180,524 | 65,582 | 246,106 |
| 7 | 120,000 | 0.12 | 0.14 | 0.21 | 0.63 | 0.15 | 0.04 | 0.06 | 0.08 | 1.44 | 172,255 | 66,751 | 239,006 |
| 8 | 120,000 | 0.13 | 0.15 | 0.21 | 0.68 | 0.15 | 0.04 | 0.06 | 0.09 | 1.51 | 180,870 | 26,909 | 207,780 |
| 9 | 120,000 | 0.19 | 0.21 | 0.21 | 0.82 | 0.14 | 0.04 | 0.06 | 0.09 | 1.76 | 210,612 | 25,160 | 235,772 |
| 10 | 120,000 | 0.12 | 0.14 | 0.21 | 0.62 | 0.14 | 0.04 | 0.06 | 0.09 | 1.41 | 169,279 | 25,306 | 194,585 |
| 11 | 120,000 | 0.12 | 0.14 | 0.21 | 0.69 | 0.12 | 0.04 | 0.06 | 0.08 | 1.46 | 175,500 | 31,105 | 206,605 |
| 12 | 120,000 | 0.14 | 0.18 | 0.20 | 0.75 | 0.14 | 0.04 | 0.06 | 0.09 | 1.60 | 191,513 | 47,729 | 239,242 |
| 13 | 120,000 | 0.16 | 0.19 | 0.20 | 0.82 | 0.15 | 0.04 | 0.06 | 0.09 | 1.72 | 206,901 | 51,097 | 257,997 |
| 14 | 120,000 | 0.19 | 0.21 | 0.21 | 1.01 | 0.14 | 0.04 | 0.06 | 0.09 | 1.94 | 233,381 | 51,367 | 284,748 |
| 15 | 120,000 | 0.13 | 0.16 | 0.21 | 0.81 | 0.14 | 0.04 | 0.06 | 0.09 | 1.63 | 195,580 | 50,089 | 245,669 |
| 16 | 120,000 | 0.16 | 0.18 | 0.21 | 0.93 | 0.14 | 0.04 | 0.06 | 0.09 | 1.80 | 216,508 | 53,420 | 269,928 |
| 17 | 120,000 | 0.19 | 0.21 | 0.21 | 0.95 | 0.12 | 0.04 | 0.06 | 0.09 | 1.88 | 225,117 | 53,403 | 278,520 |
| 18 | 106,625 | 0.19 | 0.21 | 0.21 | 0.99 | 0.14 | 0.05 | 0.06 | 0.10 | 1.95 | 207,733 | 40,132 | 247,864 |
| 19 | 25,584 | 0.19 | 0.23 | 0.24 | 1.14 | 0.30 | 0.11 | 0.13 | 0.31 | 2.65 | 67,874 | 21,516 | 89,390 |
| Total | 2,282,196 | 0.14 | 0.16 | 0.21 | 0.74 | 0.14 | 0.04 | 0.06 | 0.09 | 1.58 | 3,599,429 | 864,835 | 4,464,264 |
| Percent: | 8.64% | 10.25% | 13.04% | 46.92% | 8.83% | 2.80% | 3.72% | 5.79% | 100.00% | or $1.96/t | |||
| * Costs in Years -2 and -1 of Pre-production have been included in the mine capital costs | |||||||||||||
| * Includes deferred stripping costs | |||||||||||||
| * Includes costs that have been allocated to limestone mining costs | |||||||||||||
Mine operating costs include blast hole drilling, loading of blast holes, hauling, and auxiliary operations to support production mining. Those cost centers include, operating labor, maintenance labor, consumables costs, and equipment maintenance costs.
“General Mining” costs include the costs for: general mine laborers, software licenses, assaying costs and miscellaneous operations consumables. “General Maintenance” costs include the costs for: general maintenance laborers and miscellaneous maintenance consumables. “G&A” costs include mine supervision staff, maintenance supervision staff, technical services staff and also a 10% allowance for vacation and sick leave of the hourly labor.
A diesel fuel price of $2.96/gallon was used as input for developing the operating costs. This equates to diesel accounting for $0.41/t of mine operating cost.
| M3-PN210313.007 31 March 2026 Revision 0 | 261 |
GUNNISON PROJECT Form 43-101F1 Technical Report |
| 21.3.2 | Plant Operating Costs |
The operating costs assume a heap leach with a planned average placement of 28.2 million short tons per year and an SX/EW facility producing copper cathodes. The process plant operating costs are summarized by the categories of labor, electric power, reagents & wear parts, maintenance parts, and supplies and services. Table 21-10 lists the operating costs for the Heap Leach and Table 21-11 lists the operating costs for the SX-EW.
Table 21-10: Heap Leach OPEX Summary by Cost Element
|
Operating & Maintenance |
LoM Operating Cost ($000) | $/st Mineralized Material processed | $/lb Copper Recovered (US$) |
% |
| Labor | 78,788 | 0.15 | 0.02 | 7.3% |
| Electrical Power | 217,879 | 0.40 | 0.07 | 20.2% |
| Reagents | 756,415 | 1.40 | 0.24 | 70.2% |
| Maintenance Parts | 23,186 | 0.04 | 0.01 | 2.2% |
| Supplies and Services | 1,222 | 0.00 | 0.00 | 0.1% |
| Total | 1,077,491 | 1.99 | 0.34 | 100.0% |
Table 21-11: SXEW OPEX Summary by Cost Element
|
Operating & Maintenance |
LoM Operating Cost ($000) | $/st Mineralized Material processed | $/lb Copper Recovered (US$) |
% |
| Labor | 135,145 | 0.25 | 0.042 | 26.4% |
| Electrical Power | 218,660 | 0.40 | 0.069 | 42.7% |
| Reagents | 91,431 | 0.17 | 0.029 | 17.8% |
| Maintenance Parts | 52,409 | 0.10 | 0.016 | 10.2% |
| Supplies and Services | 14,782 | 0.03 | 0.005 | 2.9% |
| Total | 512,427 | 0.95 | 0.16 | 100.0% |
| 21.3.3 | General and Administrative Costs |
General and Administrative (G&A) costs include items such as site management, accounting, human resources, environmental and safety compliance, laboratory, community relations, communications, insurance, legal, training, and other costs not associated with either mining or processing. The LOM G&A cost is shown in Table 21-12 below and includes the $/st processed material and $/lb of copper.
| M3-PN210313.007 31 March 2026 Revision 0 | 262 |
GUNNISON PROJECT Form 43-101F1 Technical Report |
Table 21-12: G&A OPEX Cost
|
Item |
LoM Operating Cost ($000) | $/st Mineralized Material processed | % |
| Labor | 66,114 | 0.12 | 44.7% |
| Accounting (excluding labor) | 1,408 | 0.00 | 1.0% |
| Safety & Environmental (excluding labor) | 1,221 | 0.00 | 0.8% |
| Human Resources (excluding labor) | 939 | 0.00 | 0.6% |
| Security (excluding labor) | 1,408 | 0.00 | 1.0% |
| Assay Lab (excluding labor) | 5,634 | 0.01 | 3.8% |
| Office Operating Supplies and Postage | 939 | 0.00 | 0.6% |
| Maintenance Supplies | 2,817 | 0.01 | 1.9% |
| Power | 1,408 | 0.00 | 1.0% |
| Communications | 1,878 | 0.00 | 1.3% |
| Small Vehicles | 2,817 | 0.01 | 1.9% |
| Claims Assessment | 469 | 0.00 | 0.3% |
| Legal & Audit | 6,573 | 0.01 | 4.4% |
| Consultants | 4,695 | 0.01 | 3.2% |
| Janitorial Services | 1,408 | 0.00 | 1.0% |
| Insurances | 37,558 | 0.07 | 25.4% |
| Subs, Dues, PR, and Donations | 1,127 | 0.00 | 0.8% |
| Travel, Lodging, and Meals | 3,756 | 0.01 | 2.5% |
| Recruiting/Relocation | 3,756 | 0.01 | 2.5% |
| Community Relations | 1,878 | 0.00 | 1.3% |
| Total | 147,802 | 0.27 | 100.0% |
| 21.3.4 | Processing Labor |
Labor for the Project was estimated based on a staffing plan for the process plant operations and maintenance areas. Labor rates were estimated using benchmark market data for the region and comparable wage rates from other mining operations in the area and included discussions with Gunnison Copper. The annual salaries include an allowance for benefits for both salaried and hourly employees. The benefits allowance was estimated using a burden rate of 28% for both hourly and salaried staff. Personnel were assumed to be working 12-hour shifts except for salaried employees. A breakdown of the labor staffing, stratified by function (operations, maintenance and process administration, is presented in Table 21-13 with the estimated payroll for an average year.
| M3-PN210313.007 31 March 2026 Revision 0 | 263 |
GUNNISON PROJECT Form 43-101F1 Technical Report |
Table 21-13: Estimated Labor Requirements
|
Staff |
Average Annual Salary ($) |
LoM Cost ($000) | |
| SXEW Operations | 34 | 67,746 | 48,370 |
| Heap Leach Operations | 36 | 77,739 | 58,771 |
| SXEW Maintenance | 24 | 129,672 | 65,355 |
| Heap Leach Maintenance | 6 | 170,464 | 21,479 |
| Administration - Operations | 15 | 121,329 | 38,219 |
| Total | 115 | 232,193 |
| 21.3.5 | Reagents, Wear Parts, and Electricity Costs |
The reagent and wear part costs were estimated using metallurgical test data and established industry practice assumptions and unit prices from similar size and type project benchmarks. Table 21-14 below lists the LoM cost and average $/lb copper costs for the Heap Leach, SXEW, and material sorting reagents and wear parts.
Table 21-14: Summary of Reagents and Wear Parts – Heap Leach, SXEW Plant & Material Sorting
|
Reagent / Wear Part |
LoM Cost (US$000) |
$/lb Copper Recovered (US$) |
| Extractant | 13,010 | 0.004 |
| Diluent | 45,382 | 0.01 |
| Cobalt Sulfate | 1,536 | 0.0000 |
| Guar | 11,951 | 0.004 |
| Mist Suppressor | 1,605 | 0.001 |
| Sulfuric Acid (Acid Plant Supplied) | 17,947 | 0.01 |
| Sulfuric Acid (Vendor Supplied) | 0 | 0.0000 |
| Subtotal SX-EW | 91,431 | 0.0290 |
| Primary Crushing Liners | 8,586 | 0.003 |
| Abrasion Resistant Chute Liners | 6,082 | 0.002 |
| Sulfuric Acid (Acid Plant Supplied) | 741,747 | 0.23 |
| Sulfuric Acid (Vendor Supplied) | 0 | 0.000 |
| Subtotal Heap Leach | 756,415 | 0.237 |
| Secondary Crusher Liners | 8,110 | 0.003 |
| Abrasion Resistant Chute Liners | 6,082 | 0.002 |
| Subtotal Material Sorting | 14,192 | 0.004 |
| Total Reagents | 862,039 | 0.270 |
| M3-PN210313.007 31 March 2026 Revision 0 | 264 |
GUNNISON PROJECT Form 43-101F1 Technical Report |
Electrical Power costs were estimated based on a detailed capital equipment list and connected horsepower as determined by the electrical engineering team. Power will be sourced from the local power grid at a rate of $0.079/kWh. Table 21-15 summarizes the average annual power consumption by area.
Table 21-15: Summary of Power Consumption and Cost
|
Area |
Average Annual kWh |
Average Annual Cost ($000) |
LoM Cost ($000) |
$/st Mineralized Material processed | $/lb Copper Recovered (US$) |
| Stockpile | 1,411,032 | 111 | 1,672 | 0.00 | 0.001 |
| Primary / Material Sorting Screens | 10,354,411 | 818 | 17,178 | 0.03 | 0.005 |
| Secondary Crushing | 4,695,542 | 371 | 7,790 | 0.01 | 0.002 |
| Material Sorting | 11,870,298 | 938 | 19,693 | 0.04 | 0.006 |
| Air Compressors | 6,117,584 | 483 | 10,149 | 0.02 | 0.003 |
| Material Sorting Reject | 15,255,951 | 1,205 | 25,310 | 0.05 | 0.008 |
| Agglomeration | 1,316,718 | 104 | 2,184 | 0.00 | 0.001 |
| Solution Ponds | 10,956,839 | 866 | 18,177 | 0.03 | 0.006 |
| Solution Ponds Expansion | 5,462,233 | 432 | 8,199 | 0.02 | 0.003 |
| Solvent Extraction | 1,699,876 | 134 | 2,820 | 0.01 | 0.001 |
| Solvent Extraction Expansion | 1,543,390 | 122 | 2,560 | 0.00 | 0.001 |
| Tank Farm | 1,218,051 | 96 | 2,021 | 0.00 | 0.001 |
| Tank Farm Expansion | 1,035,456 | 82 | 1,718 | 0.00 | 0.001 |
| Electrowinning | 50,206,337 | 3,966 | 83,292 | 0.15 | 0.026 |
| Electrowinning Expansion | 51,311,801 | 4,054 | 85,126 | 0.16 | 0.027 |
| Fresh Water System | 706,166 | 56 | 1,172 | 0.00 | 0.000 |
| Fire Water System | 955,001 | 75 | 1,584 | 0.00 | 0.000 |
| Total | 176,116,687 | 13,913 | 290,646 | 0.538 | 0.091 |
| 21.3.6 | Maintenance Costs |
An allowance is used to estimate the cost of maintenance for the process equipment and facilities. The annual allowance is estimated using a benchmark percentage of 3.0% applied to the direct cost of the capital equipment for all areas, with the exception of the material sorting area which uses a percentage of 5.0%. The LOM maintenance cost for the Heap Leach plant is $23.1 million, while the LOM maintenance cost for the SXEW plant is $52.4 million.
| 21.3.7 | Operating Supply Costs |
An allowance is used to estimate the cost of operating and maintenance supplies that are in addition to the other costs elements discussed above. The LOM supplies cost for the Heap Leach plant is $1.2 million, while the LOM supplies cost for the SXEW plant is $14.8 million.
| 21.3.8 | Cement Plant and Limestone Facilities Operating Cost |
Operating costs for the cement plant and limestone royalty sales were built from first principles and industry benchmarking for similar modern, dry-process rotary kiln operations. The facility benefits from a significant structural cost advantage: because the high-purity limestone is extracted as a waste by-product of the Gunnison copper operation, the primary mining costs (drilling, blasting, and primary hauling) are absorbed by the copper mine. This reduces the substantial quarrying costs typical of standalone cement operations while the byproduct credit from limestone sales further reduces the net cash cost.
| M3-PN210313.007 31 March 2026 Revision 0 | 265 |
GUNNISON PROJECT Form 43-101F1 Technical Report |
When operating at the steady-state production rate, the cash operating cost (C1) is estimated at $97.59 per ton of cement produced, with an All-In Sustaining Cost (AISC) of $103.97 per ton. A summary of the unit operating costs is provided in Table 21-16.
Table 21-16: Cement Plant Operating Costs
|
Operating Category |
$/Ton Limestone Processed | $/ton Cement Produced | LOM Operating Cost ($000) |
| Processing – Raw Materials Processing | 7.69 | 9.38 | 612,457 |
| Processing – Energy | 19.28 | 23.52 | 1,535,714 |
| Processing – Additives | 9.64 | 11.76 | 767,857 |
| Processing – Labor & Staff | 9.01 | 10.99 | 717,581 |
| Processing – Maintenance | 10.18 | 12.42 | 810,951 |
| Processing – Other Costs | 8.70 | 10.61 | 692,769 |
| Processing – Subtotal | 64.49 | 78.68 | 5,137,329 |
| Freight & Distribution | 10.61 | 12.95 | 845,492 |
| G&A (Onsite & Mining Portion) | 5.20 | 6.34 | 413,886 |
| Mining Cost – (Subsidized from Copper) | 2.89 | 3.53 | 230,551 |
| Byproduct Credit (Limestone Sales) | (3.20) | (3.90) | (254,908) |
| Cash Cost (C1) | 80.00 | 97.59 | 6,372,351 |
| Sustaining Capital | 4.39 | 5.35 | 349,505 |
| Property Taxes & Closure (Net Salvage) | 0.82 | 1.00 | 65,3456,790 |
| All-In Sustaining Cost (AISC) | 85.20 | 103.95 | 6,787,201 |
Key operating cost drivers include:
| ● | Energy: Energy is the most significant operational expense, estimated at $23.52 per ton of cement, accounting for 24.1% of the C1 cost. The model assumes thermal energy consumption of 3.5 GJ per ton of clinker utilizing the adjacent natural gas pipeline, and electrical consumption of 110 kWh per ton of cement. |
| ● | Additives: Estimated at $11.76 per ton, this covers the procurement and delivery of gypsum to control setting time, as well as supplementary cementitious materials (SCMs) and correctives such as silica or alumina. |
| ● | Labor and Staff: Plant-level labor is estimated at $10.99 per ton, which covers management, operations personnel, quality control, and administrative staff. |
| ● | Distribution & Freight: Rail freight to the Phoenix and Tucson distribution terminals, including transloading fees, averages $12.95 per ton of cement. |
| M3-PN210313.007 31 March 2026 Revision 0 | 266 |
GUNNISON PROJECT Form 43-101F1 Technical Report |
| 22 | ECONOMIC ANALYSIS |
All statements, other than statements of historical fact, contained in this report, including the results of the economic analyses discussed in this section, constitute “forward-looking statements” and “forward-looking information” (collectively, “forward-looking statements”) within the meaning of applicable securities legislation. Forward-looking statements, including the results of the conceptual study, are based on assumptions, estimates, expectations and opinions, which are considered reasonable and represent best judgment based on available facts, as of the date such statements are made and, if proven to be incorrect, actual and future results may be materially different than expressed or implied in the forward-looking statements. Forward-looking statements are also inherently subject to known and unknown risks, uncertainties, contingencies and other factors that may cause actual results to differ materially from those presented in this report.
The project has been evaluated using a discounted cash flow (DCF) analysis based on an 8.0% discount rate. Cash inflows consist of annual revenue projections. Cash outflows consist of capital expenditures, including pre-production costs, operating costs, taxes, and royalties. These are subtracted from the inflows to arrive at the annual cash flow projections.
Cash flows are taken to occur at the mid-point of each period for discounting purposes. It must be noted that tax calculations involve complex variables that can only be accurately determined during operations and, as such, the actual post-tax results may differ from those estimated. A sensitivity analysis was performed to assess the impact of variations in copper price, operating cost, and initial capital costs.
The capital and operating cost estimates developed specifically for this project are presented in Section 21. The economic analysis has been conducted assuming a constant dollar basis with no inflation.
The economic analysis also used the following assumptions:
| ● | Construction period of two years |
| ● | Cost estimates in constant Q1 2026 US dollars with no inflation or escalation factors considered |
| ● | Reclamation & Closure cost of $92.6 million is assumed |
| ● | Capital cost funded with 100% equity |
The Project’s capital cost estimate includes the open pit mine (automated mobile mining fleet), waste dumps, heap leach pad, sulfide plant, material sorters, SX-EW process plant, sulfuric acid plant, cement plant, mine services, utilities and services, and ancillary facilities.
Infrastructure changes will require the realignment of Interstate 10 around the north side of the proposed Gunnison open pit. The present Gunnison PLS Pond will be relocated to the south end of the proposed leach pad. The power transmission lines and substations for the new Gunnison SX-EW and sulfuric acid plant will be rerouted, and the rail spur from the Union Pacific Southern Pacific Railroad will be shortened coming into the property.
The annual production figures were obtained from the mining plan as presented earlier in this Technical Report.
| 22.1 | Plant Production Statistics |
The design basis for the process plant production is 175 mppa of copper cathode in a single large SX-EW facility. To achieve that production, up to the design capacity of approximately 32,000 gpm of PLS will be pumped from the PLS pond to the Gunnison plant.
Average annual production is projected to be approximately 174 million pounds of copper cathode over the 19-year life of mine. Total production for the life of the operation is projected at approximately 3,187 million pounds of copper.
| M3-PN210313.007 31 March 2026 Revision 0 | 267 |
GUNNISON PROJECT Form 43-101F1 Technical Report |
| 22.1.1 | Copper Sales |
The copper cathodes are assumed to be shipped to buyers in the US market, with sales terms negotiated with each buyer. The financial model assumptions are based on experience with copper sales from similar operations in the US. The forecast copper price used for this PEA is $4.60 per lb of copper sold. A $0.0425 per lb premium has been added to each pound of copper, which is the net of 2.5% premium less $ 0.075 per lb of freight, so the effective price for cathode sales is $4.6425 per lb.
| 22.1.2 | Initial Capital |
The initial capital cost estimate for the Gunnison Project, exclusive of open pit development is shown in Table 22-1 below. The estimated initial capital cost for the project is $1,555.6 million. This total includes: the mine mobile fleet by leasing, pre-stripping costs, the crushing and conveying area, construction of the first phase of the heap leach pad, the SX-EW plant, the sulfuric acid plant, the utility upgrades, the infrastructure improvements, ancillary facilities, and the I-10 highway relocation. The financial indicators have been calculated assuming 100% equity financing of the initial capital. Any acquisition cost or expenditures, such as property acquisition, permitting, and study costs, prior to project authorization have been treated as “sunk” cost and have not been included in the analysis.
Table 22-1: Initial Capital Requirement
|
Area |
Detail |
Initial CAPEX ($000s) |
Direct Costs |
Mine Costs | 280,302 |
| Processing Plant | 738,540 | |
| Infrastructure | 92,020 | |
| Freight | 55,707 | |
| Indirect Costs | 193,757 | |
| Owner’s Costs, First Fills, & Light Vehicles | 23,657 | |
| Offsite Environmental Mitigation Costs | 0 | |
| Onsite Mitigation, Monitoring, and Closure Costs | 0 | |
| Total CAPEX without Contingency | 1,383,983 | |
| Contingency | 171,635 | |
| Total CAPEX with Contingency | 1,555,618 | |
| 22.1.3 | Expansion Capital |
As the amount of material increases, the project includes the expansion of the Heap Leach pads for approximately $200.7M from year 1 to year 10 direct costs. Another $10.8M are expended in Y10 to secure the north diversion berm. Freight on these items adds another $16M in direct costs. Construction of the Sulfide Plant will be done in year 10 for $56.6M and the Cement Plant will be added in years 4 and 5 with an estimated operation start by year 6 for a total of $321.4M including limestone pre stripping.
| M3-PN210313.007 31 March 2026 Revision 0 | 268 |
GUNNISON PROJECT Form 43-101F1 Technical Report |
Table 22-2: Expansion Capital Requirement
| Expansion Capital Expenditures | ($M) |
| Direct Costs - Leach Pad | 200.7 |
| Direct Costs – Freight | 16.0 |
| Direct Costs - Subtotal | 216.7 |
| Indirect Costs | 32.9 |
| Contingency | 39.1 |
| Subtotal | 288.7 |
| Acid Plant | - |
| Infrastructure | 10.8 |
| Sulfide Plant | 56.6 |
| Cement Plant | 321.4 |
| Total CAPEX | 677.6 |
| 22.1.4 | Sustaining Capital |
Sustaining capital is primarily required for the cement plant, which requires periodic replacement parts. The other main component of sustaining capital is the mine, which will require new and replacement fleet units for a net of leased costs of $51.8M million in Years 1 through 17.
Table 22-3: Sustaining Capital Requirement
| Sustaining Capital Expenditures | ($M) |
| Direct Costs - Mine Costs | 51.8 |
| Subtotal | 51.8 |
| Total CAPEX | 51.8 |
| 22.1.5 | Working Capital |
A 15-day delay of receipt of revenue from sales is assumed for accounts receivables. A delay of payment for accounts payable of 55 days is also incorporated into the financial model. An allowance for initial replacement parts inventory for the plant is also included at 25 days. All the working capital is recaptured at the end of the mine life, and the final value of these accounts is zero.
| 22.2 | Revenue |
Annual revenue is determined by applying estimated metal prices to the annual payable metal estimated for each operating year. Sales prices have been applied to all life of operation production without escalation or hedging. The revenue is the gross value of payable metals sold before treatment charges and transportation charges. The average copper price used in the evaluation is $4.6425/lb for the life of the mine.
| 22.3 | Total Copper Operating Cost |
Operating Costs have been split into the two main businesses, copper and cement/limestone. The average Cash Operating Cost over the life of the copper operation is estimated to be $8.43 per short ton of mined material exclusive of royalties and taxes. On a per pound basis, the cash operating cost is $1.70 per pound of copper produced, excluding the cost of the capitalized pre-production leaching. Cash Operating Cost includes mining, crushing, sorting, heap leaching, SX-EW plant operations, sulfuric acid plant, General Administrative (G&A) costs, limestone mining cost credits allocated to the limestone business, and byproduct credits from acid sales. Table 22-4 below shows the estimated operating cost and other production costs by area per pound of copper produced.
| M3-PN210313.007 31 March 2026 Revision 0 | 269 |
GUNNISON PROJECT Form 43-101F1 Technical Report |
Table 22-4: Life of Copper Operation Operating + Production Costs
| Operating Expenditures – Copper Inputs | $/lb Cu Produced |
| Mining | 1.20 |
| Heap Leach | 0.36 |
| Material Sorting | 0.07 |
| SX/EW | 0.20 |
| G&A | 0.04 |
| Byproduct Credits – Acid Sales | (0.17) |
| Cash Cost (C1) | 1.70 |
| Sustaining Capex | 0.07 |
| Royalties | 0.22 |
| Sustaining Cash Cost | 2.00 |
| Taxes, Closure, Salvage | 0.06 |
| All-In Sustaining Cost (AISC) | 2.05 |
Total Cash Cost is the Total Operating Cost plus royalties, property tax, severance tax, salvage value, and reclamation and closure costs. The average Total Cash Cost over the life of the operation is estimated to be $2.05 per pound of copper produced.
| 22.4 | Total Cement/Limestone Cash Cost |
The average Cash Operating Cost over the life of the cement operation is estimated to be $97.59 per short ton of cement produced exclusive of taxes. Cash Operating Cost includes mining, processing, freight, General Administrative (G&A) costs and byproduct credits from high grade limestone sold as a royalty. Table 22-5 below shows the estimated operating cost and other production costs by area per short ton of cement produced.
| M3-PN210313.007 31 March 2026 Revision 0 | 270 |
GUNNISON PROJECT Form 43-101F1 Technical Report |
Table 22-5: Life of Cement Operation Operating + Production Costs
| Operating Expenditures –Cement Inputs | $/ton Cement Produced |
| Mining | 3.53 |
| Processing - Raw Materials Processing | 9.38 |
| Processing - Additives | 11.76 |
| Processing - Energy | 23.52 |
| Processing - Labor & Staff | 10.99 |
| Processing - Maintenance | 12.42 |
| Processing - Other Costs | 10.61 |
| Processing - Subtotal | 78.68 |
| Freight | 12.95 |
| G&A | 6.34 |
| Byproduct Credits - Limestone - Royalty Sales | (3.90) |
| Cash Cost (C1) | 97.59 |
| Sustaining Capex | 5.35 |
| Sustaining Cash Cost | 102.95 |
| Taxes and Closure | 1.03 |
| All-In Sustaining Cost (AISC) | 103.98 |
| 22.5 | Royalties |
There are three entities that are entitled to royalties: the State of Arizona, Greenstone and Altius. The State has a flat royalty of 5.5%.
The Greenstone royalty is paid at the rate of 3.0% of the value of copper produced, while the Altius royalty is paid at a flat rate of 1.50%.
The Bowlin royalty has an estimated LOM cost of $500,000, which equates to an incremental cost of $0.002/lb Cu. This royalty has not been included in the LOM discounted cash flow.
Royalties for the life of the operation are estimated at $715.1 million and average $0.22 per pound of copper recovered. The Stream for the life of the operation are estimated at $310.9 million and average $0.10 per pound of copper recovered.
| 22.6 | Property and Severance Taxes |
Property and severance taxes are estimated to be $206.4 million and average $0.06 per pound of copper recovered. Property taxes were estimated to be approximately $3.5 million per year during copper production and $0.7M thereafter, totaling $97.9 million for the life of the operations. Severance taxes are calculated as 2.5% of net proceeds before taxes from mining. Severance taxes are estimated to be approximately $108.6 million for the life of the operation.
| M3-PN210313.007 31 March 2026 Revision 0 | 271 |
GUNNISON PROJECT Form 43-101F1 Technical Report |
| 22.7 | Reclamation and Closure |
An allowance for reclamation and closure costs is estimated to be $92.6 million ($0.03/lb copper cathode). Reclamation and closure activities are assumed to be split after two milestones. The first one is the closure of all copper mining related activities, estimated to occur for 3 years beginning the year after mining has ceased, and accounts for 64% of the cost ($59.3M). The second portion is assumed to happen with the closure of the cement and acid plant, accounting for the remaining 36% ($33.3M)
A credit of $65.0 million has been included for the salvage value of the plant equipment, while a credit of $26M was included for the cement plant and for the acid plant salvage value.
| 22.8 | Income Taxes |
Taxable income for income tax purposes is defined as metal revenues minus operating expenses, royalty, property and severance taxes, reclamation and closure expense, depreciation, and depletion. The combined federal and state corporate income tax rate in Arizona is 25.9 percent and is applied to ‘taxable income’ derived from the Gunnison Project.
Income taxes are estimated by applying state and federal tax rates to taxable income. The primary adjustments to taxable income are tax depreciation and the depletion deduction. Income taxes estimated in this manner total $1,789.4 million for the life of the Project.
| 22.9 | Net Present Value (NPV) and Internal Rate of Return (IRR) |
The economic results after taxes for the Project, as shown in Table 22-6, indicate an Internal Rate of Return (IRR) of 22.5% and a payback period of 3.9 years. The Net Present Value (“NPV”) after taxes is $1.96 billion at an 8% discount rate using the mid-year convention. The analysis assumes 100% equity financing.
Table 22-6: Economic Results
| Item | Units | Base Case |
| Life of Mine | # years | 21 |
| Recovered Copper Cathode | millions lbs | 3,187 |
| Copper Price | $/lb | 4.6425 |
| Initial Capital | $ millions | 1,555 |
| Expansion Capital | $ millions | 682 |
| Sustaining Capital | $ millions | 587 |
| Payback Period | # years | 3.9 |
| Internal Rate of return (after-tax) | % | 22.5% |
| Copper Cash Cost (C1) | $/lb Copper recovered | 1.70 |
| All-In Copper Sustaining Cost (AISC) | $/lb Copper recovered | 2.05 |
| Net Present Value @ 8% (after-tax) | $ millions | 1,959 |
The preliminary economic assessment is preliminary in nature and it includes inferred mineral resources that are considered too speculative geologically to have the economic considerations applied to them that would enable them to be categorized as mineral reserves. There is no certainty that the preliminary economic assessment will be realized.
The project ‘s after-tax economic results shows greatest sensitivity to copper price fluctuations, followed by initial capital expenditures and operating cost changes. Table 22-7, Figure 22-1 and Figure 22-2 below illustrate these sensitivities.
| M3-PN210313.007 31 March 2026 Revision 0 | 272 |
GUNNISON PROJECT Form 43-101F1 Technical Report |
Table 22-7: Sensitivity Analysis
| Copper Price Sensitivities | Units | $4.25/lb | $4.60/lb | $5.00/lb | $5.50/lb | $6.00/lb | $6.50/lb | $7.00/lb |
| NPV8 | M$ | 1,566 | 1,959 | 2,403 | 2,953 | 3,500 | 4,043 | 4,586 |
| IRR | % | 19.5% | 22.5% | 25.8% | 29.8% | 33.7% | 37.5% | 41.1% |
| Project Payback | years | 5.17 | 3.95 | 3.28 | 2.78 | 2.45 | 2.20 | 2.00 |
| LOM Cu Gross Revenue | M$ | 13,364,882 | 14,484,547 | 15,764,165 | 17,363,687 | 18,963,209 | 20,562,731 | 22,162,253 |
| LOM EBITDA | M$ | 13,520,441 | 14,588,504 | 15,808,666 | 17,333,310 | 18,857,478 | 20,381,280 | 21,904,794 |
| FCF - Unlevered (post-tax) | M$ | 9,031,003 | 9,867,503 | 10,818,120 | 12,005,261 | 13,192,045 | 14,378,553 | 15,564,846 |
| Operating Costs | % | NPV8 | IRR | Payback |
| Low | -20% | 2,311 | 25.0% | 3.4 |
| Mid-low | -10% | 2,136 | 23.8% | 3.7 |
| Base Case | 0% | 1,959 | 22.5% | 3.9 |
| Mid-high | 10% | 1,781 | 21.2% | 4.4 |
| High | 20% | 1,601 | 19.9% | 5.0 |
| Initial Capex | % | NPV8 | IRR | Payback |
| Low | -20% | 2,226 | 27.5% | 3.0 |
| Mid-low | -10% | 2,093 | 24.8% | 3.4 |
| Base Case | 0% | 1,959 | 22.5% | 3.9 |
| Mid-high | 10% | 1,826 | 20.6% | 4.7 |
| High | 20% | 1,692 | 18.9% | 5.3 |
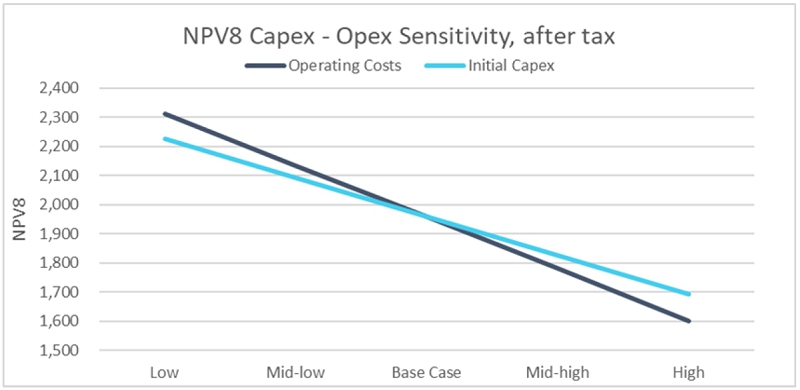
Figure 22-1: Open Pit Capex – Opex NPV Sensitivity – After Tax
| M3-PN210313.007 31 March 2026 Revision 0 | 273 |
GUNNISON PROJECT Form 43-101F1 Technical Report |
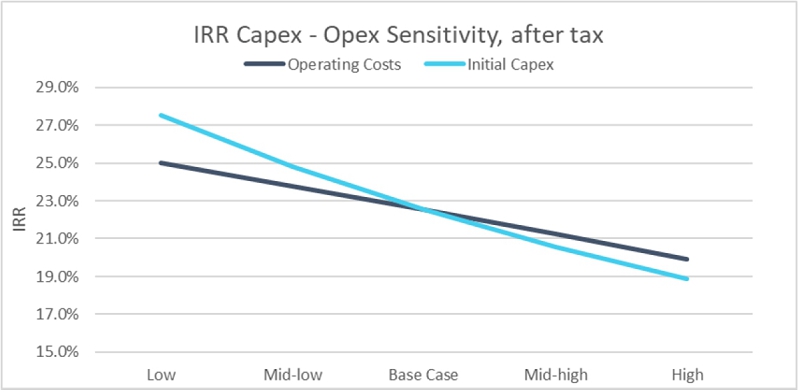
Figure 22-2: Open Pit Capex – Opex IRR Sensitivity – After Tax
| 23 | ADJACENT PROPERTIES |
The Gunnison Project lies within the porphyry copper metallogenic province of the southwestern United States. It is located in the Cochise Mining District, which is dominated by Cu-Zn skarns. GCC controls a majority of historical producing properties in the district. Tungsten and minor lead-silver-gold have been produced in small adjacent properties in the district (Cooper and Silver, 1964). In particular, tungsten has been historically produced in the area west of the Gunnison Project in the northern half of the Texas Canyon quartz monzonite stock before and during World War I. Lead-silver was also historically produced from Paleozoic limestones in the Gunnison Hills east of the Gunnison Project in the early 1900s (Cooper and Silver, 1964). Mineralization on adjacent properties is not necessarily indicative of the mineralization on the Gunnison Project. The author has relied on reports by others (as referenced) for the information presented in this section and has been unable to verify the information.
| M3-PN210313.007 31 March 2026 Revision 0 | 274 |
GUNNISON PROJECT Form 43-101F1 Technical Report |
| 24 | OTHER RELEVANT DATA AND INFORMATION |
No other relevant data to report.
| 25 | INTERPRETATION AND CONCLUSIONS |
The Gunnison Deposit is amenable to open pit and heap leaching technology for the extraction of copper from oxidized mineralization and conventional solvent SX-EW technology for making a saleable copper product.
| 25.1 | Conclusions |
The PEA suggests that the Gunnison Deposit can be economically exploited using open pit mining methods with heap leaching to extract oxidized copper in the mineralized material. A mine plan was developed to produce 175 mppa (averages 174 million pounds of recoverable copper per year over LOM) with mining conducted by an owner-operated fleet. Mining of the deposit is expected to be accomplished with hydraulic front shovels and 320-ton trucks. Mining is planned on 50-ft bench heights.
An annual schedule was developed for the mine plan. Primary crushed heap leach material will be processed by placement on a conveyor transported, leach pad following approximately two years of pre-production waste stripping. The heap tonnage production varies by year as it is based on the requirement of 175 million pounds of recoverable copper being placed on the leach pad annually.
M3 completed an economic analysis for this PEA using industry standard criteria for studies at this level. The results of this PEA indicate that open pit heap leach development of the Gunnison Project offers the potential for positive economics based upon the information available at this time. Project economics are based on constructing a 175 mppa SX-EW plant that includes construction of a 2,700 stpd sulfur-burning acid plant, cogeneration facilities, and rail spur for the delivery of molten sulfur to supply acid for the leaching operation.
| 25.2 | Project Risks |
Certain risks and opportunities are associated with the Project, as is typical for mine development projects. These risks may include and are not limited to environmental permitting, title issues, taxation, public/political opposition, or legal impediments to operating this type of mining/processing operation at this location. The following project-specific risks have been identified along with the measures that GCC envisages to mitigate the risk.
| 1. | Slope Stability. Slope recommendations received from Call & Nicholas, Inc. (“CNI”) were based on recent strength testing as well as rock quality designation (RQD) data from core holes and experience at other Arizona mines in similar rock formations. Actual slope angles may have to be decreased, increasing the amount of waste handling required. |
Mitigation. Geotechnical drilling, along with further in-depth slope stability analysis, could result in achievable pit slope angles that are more shallow or steeper than the angles used in the analysis that will be presented in the report.
11. Blasting Costs. Drilling and blasting in the weakly cemented alluvium overburden is assumed to be significantly more productive than in the bedrock. Overestimation of blasting productivity in the overburden would result in increased costs.
Mitigation. Additional investigation of the weakly cemented alluvium could remove uncertainties for this productivity differential.
| 2. | Mine Design Uncertainty. The tonnage and grade expected to be placed on the leach pad could change as more drilling and engineering are completed. Metal prices, changes in metal recovery, or increases in operating costs could change the potential tonnage of heap leachable material. |
| M3-PN210313.007 31 March 2026 Revision 0 | 275 |
GUNNISON PROJECT Form 43-101F1 Technical Report |
The tonnage of leach material expected to be diverted to material sorting in the mine schedule in Section 16 varies between 0.4 million tons per year to 21 million tons per year. Future iterations of phase designs and mine schedules will need to smooth the quantity of leach material planned for sorting. This may require a higher total tonnage of material to be mined on an annual basis.
Mitigation. Additional investigation as the Project moves toward implementation should reduce the uncertainty.
| 3. | Copper Recovery. The heap leaching process for recovering copper from oxidized mineralization can be unpredictable. Metallurgical testing has established that coarse crushed mineralization is amenable to copper heap leaching and recovery. Metallurgical testwork results have been used to approximate results of leaching, although they may not reflect the LOM actual leach recovery performance. There is risk that additional testwork or actual performance could indicate the possibility of lower copper recoveries at the current crush size, acid application rate, or leach cycle estimates. |
Mitigation. Operational strategies will involve adjusting crush sizes, flowrates and acid strengths based on operational experience to maximize infiltration rates and increase PLS grades.
| 4. | Leach Pad Flow Attenuation. Production of excess fines, compaction of lift surfaces on the leach pad, decrepitation of host rock mineralized material, and precipitation of minerals due to acid depletion could cause the formation of zones of low permeability. As with all leach pads, there is risk of poor vertical solution flow and leach pad hydrodynamics. |
Mitigation. Placement and distribution of the leach material will be monitored to prevent compaction and enhance uniform distribution of leach solutions. Boreholes drilled through zones identified with low permeability can enhance vertical migration of solutions. Segregation or special treatment of materials that are identified as decrepitation (breaking down) and/or releasing fines may be necessary to mitigate this type of flow attenuation.
| 5. | Acid Consumption/Cost. This Project relies on large volumes of sulfuric acid to liberate and dissolve copper from the leach pad materials to produce a saleable product. Acid consumption is estimated to range from 24 to 87 pounds of acid per ton of leach material based on the various rock types and carbonate content. The actual acid consumption could potentially be higher. |
Mitigation. Controlling excess sulfuric acid consumption may require careful management and segregation of the materials as they are placed on the leach pad. The height of each lift could be increased to reduce the time that the lower portion is subjected to leach solutions consuming acid. Placing geomembranes or low permeability layers between lifts could isolate depleted, acid-consuming materials at the bottom of the pad. Studies into mineralized material sorting to reject high carbonate-low copper mineralization will be conducted to determine the applicability and economics of this technique. Mineralized material sorting has the potential to reduce acid consumption in practice. Building an acid production facility greatly reduces the cost of acid, which helps mitigate higher acid consumptions.
| 6. | Sulfide bacterial leaching is relatively new technology and may not produce expected results. |
Mitigation. Testwork from the Johnson Camp Mine Sulfide Leaching Demonstration may shed some light on the expected recoveries, acid consumptions, and costs.
| 7. | Mineralized material Sorting Capacity and Scaling. Despite likely improvements in sorting technology in the years before this project is implemented, sorting is like any processing method in that there is inherent risk, especially if the technology is being used at a treatment rate much higher than established industry practice. Difficulties in operating a large screening, conveying, and sorting plant could retard the rate of achievement of design capacity, thereby impairing net revenue generation within the first one or two operating years. |
| M3-PN210313.007 31 March 2026 Revision 0 | 276 |
GUNNISON PROJECT Form 43-101F1 Technical Report |
Mitigation. Investigate during material sorting tests the copper losses at higher throughputs to test the efficiency of material sorting at the projected rates that Gunnison is planning.
| 8. | Permitting Difficulties. Permitting mining projects in the western US and Arizona has often been an arduous and unpredictable task in the recent past. Regulations and social attitudes can change. Although the Company has previously been able to obtain all operating permits in a reasonable time frame, there is no certainty this track record will continue. |
Mitigation. Permitting difficulties for changing the mining method for the deposit can be mitigated by developing support within the local community, identifying, and fixing potential areas of contention before they arise, getting support from community leaders in advance of applying for permits. Another measure is developing realistic permitting schedules that incorporate time to deal with challenges which also helps minimize deleterious consequences.
| 9. | Equipment Financing. The initial mine CAPEX costs assume that equipment lease payments during pre-production will be interest only payments. This is an unconventional equipment financing arrangement and may or may not be available at the time of project construction. |
Mitigation. Additional discussions with the financial arms of equipment manufacturers as the project progresses will provide a better understanding of what financing options are available.
| 25.3 | Opportunities |
Several opportunities have been identified which could enhance the viability and economic attractiveness of the Gunnison open pit. Many of these opportunities may be realized by removal of risk and uncertainty that are present at the PEA level.
| 1. | Acid Consumption. Mineralized material sorting is a significant value-add opportunity for the Gunnison open pit. Greater than 80% of the mined copper is oxide mineralization, forming visually distinct blue-green and red-brown zones that are ideally suited to pre-concentration by optical mineralized material sorting. Preliminary data suggest that sorting of this material has the potential to greatly reduce acid consumption and volume of material leached by removing 40 to 50 percent of the process stream as unmineralized, higher acid consuming, waste. This would result in significant savings on operating costs. |
| 2. | Pit Slope Angles. The pit wall angles for the Gunnison open pit are considered reasonable based on the data available, however it is conceivable that pre-feasibility geotechnical data can steepen the pit walls in the gravel-alluvium, thus reducing pre-strip capital costs and life of mine waste mining costs. |
| 3. | Copper Recoveries. Copper recoveries and acid consumptions are based on limited data, and more information on the leaching responses of representative samples should be collected during the pre-feasibility study. The anticipated copper recovery is an estimate based on the best interpretation of existing test work. This copper recovery could be exceeded in practice. Recovery increases could improve the rate of recovery, as well as increase total copper recovered. Improvements in the rate of recovery would mean lower flows from the leach pad for the same level of copper production, lowering operational costs., or the increased grade could result in higher copper production (revenue) for the same operating cost. Improvements in total copper recovered have the obvious benefit of increasing total revenue during the life of the mine. |
| M3-PN210313.007 31 March 2026 Revision 0 | 277 |
GUNNISON PROJECT Form 43-101F1 Technical Report |
| 4. | Increased Copper Price. The current financial analysis is based on an average, long-term copper price of $4.60 per pound based on current consensus pricing plus a $0.0425 per pound cathode premium. Current spot markets are currently 5% to 10% higher than long-term pricing estimates. Global demand increases for copper have the potential to drive copper prices higher, thereby increasing the economic (revenue) outlook for the Project. |
| 5. | Material Sorting Impacts to Recovery. Owing to the possibility of a constant leached residue assay irrespective of head assay, ASCu extractions from upgraded sorter material from the Martin formation and the Strong & Harris mineralization could be higher than predicted. |
| 6. | Acid Consumption for Sorted Materials. Consumption of sulfuric acid could be much lower than predicted for unsorted heap feed. However, the predicted acid consumptions may also be lower than would have applied prior to sorting. |
| 7. | Alluvium Mining. 61% of the waste mined in the pit is weakly cemented gravel (alluvium). The current design includes reduced drill and blast costs for this gravel including free digging of the top 50 feet however it is possible even more of this material will not need any drill and blast. This will be investigated in more detail during the planned PFS. |
| 8. | Alternative Mining of Alluvium. The current removal of alluvium envisions the use of blast-haul operations. There are potential cost savings by developing other means of removal such as use of conveyors, dozers, or earth movers instead of blast-load-dump equipment. These will be investigated during the PFS”. |
| 9. | In-pit Leaching. In-pit leaching provides an opportunity to reduce operating costs and improve leach recovery over the life of mined mineralized material. The nature of the Gunnison Deposit and aquifer would allow control of leach solutions. Permitting of in-pit leaching would be required through Arizona Department of Environmental Quality, though it is currently being employed at other properties in Arizona. Production sequencing will utilize in-pit leaching as a trade-off to the construction and maintenance of a heap leach pad during PFS work on the Gunnison open pit. |
| 10. | Exploration Potential. The mining district that GCC has consolidated in recent years exhibits significant exploration potential. Modern exploration activity has not occurred in the district. District-wide data consolidation and integration should be conducted to evaluate its overall mineral potential and identify exploration targets. Exploration for the source of the porphyry copper sulfide mineralization at Gunnison has never been conclusively conducted and copper skarn deposits such as Gunnison are often associated with large nearby porphyry copper deposits. Several historic carbonate replacement deposits including the Republic and Moore deposits merit additional exploration attention. Significant areas of Earp Formation, Colina Limestone and Horquilla Limestone are under cover and have not been explored. These same formations host the mineralization in the Hermosa-Taylor deposits being developed by South 32 in southern Arizona. |
| 11. | In-Pit Stockpiling. The mine plan has not considered the potential for in-pit waste stockpiles. Some areas of the open pit may be suitable for this, reducing hauling distances and costs. |
| M3-PN210313.007 31 March 2026 Revision 0 | 278 |
GUNNISON PROJECT Form 43-101F1 Technical Report |
| 26 | RECOMMENDATIONS |
Based on the results of this PEA, it is recommended that GCC consider proceeding with a PFS of the open pit project which is expected to take approximately 18 months. A feasibility study will be proposed on successful completion of the PFS.
Additional drilling for resource verification and geotechnical coverage is recommended to support mine planning. Updating the acid plant design for the selected capacity is also recommended. Additional planning and costing work are required to establish the schedule and costs for the relocation of Interstate 10 and the addition of the rail spur to the Union Pacific Railroad.
The current Gunnison resource model was developed to support an in situ leaching operation. The block dimensions are 50 ft (x) x 100 ft (y) x 25 ft (y) which results in the same SMU as a block with the dimensions 50 ft (x) x 50 ft (y) x 50 ft (z). Future block models should have a block height that corresponds with the expected mining bench height of 50 ft. Changing the block dimensions could have a negative or positive impact on the expected tons and grade Additional drilling will be required for metallurgical studies. Pilot metallurgical heap leach testing is recommended to investigate the recovery kinetics and flow characteristics for the heap leach design.
Most importantly, metallurgical confirmation of mineralized material sorting through bulk sorting studies are recommended to determine the effectiveness and economics of preconcentration and reduction of acid consumption. For this work, samples will need to be drilled from carbonate-hosted mineralization in both the Gunnison Deposit (Martin Formation) and the Strong & Harris deposit (Escabrosa, Horquilla, and Earp Formations).
A mine plan, heap leach design, SX-EW design and highway move design are necessary to complete the PFS. GCC has proposed a list and budget for additional work that will support a Prefeasibility Study (PFS).
Table 26-1: Pre-feasibility Budget for the Gunnison Project
| Detail | Cost $US |
| Resource Upgrade | $9,343,000 |
| Metallurgy | $8,176,000 |
| Geotechnical | $210,000 |
| Pit design | $350,000 |
| Infrastructure design/PFS study | $1,710,000 |
| Total | $19,789,000 |
| M3-PN210313.007 31 March 2026 Revision 0 | 279 |
GUNNISON PROJECT Form 43-101F1 Technical Report |
| 27 | REFERENCES |
Arizona Department of Environmental Quality (ADEQ). 1996, revised 2008. A Screening Method to Determine Soil Concentrations Protective of Groundwater Quality, prepared by the Leachability Working Group of the Cleanup Standards/Policy Task Force, September.
Arizona Department of Environmental Quality (ADEQ). 2004a. Arizona Mining BADCT Guidance Manual. Publication #TB 04-01.
Arizona Department of Environmental Quality (ADEQ). 2004b, Interoffice Memorandum on Alert Level Calculations for Mining APPs, from Bill Kopp to Mining Unit Staff, April 1, 2002, revised October 19, 2004.
Arizona Department of Environmental Quality (ADEQ). 2007. Arizona Administrative Code (A.A.C.). Title 18 - Environmental Quality, Chapter 7 -Department of Environmental Quality Remedial Action, Article 2. Soil Remediation. http://www.azsos.gov/ public services/title_18/18-07.htm
Arizona Department of Water Resources (ADWR). 2008. Well Abandonment Handbook. September 2008.
Arizona Geological Survey. 2015. Natural Hazards in Arizona. On-Line Arizona Natural Hazards Viewer. http://data.usgin.org/hazard-viewer.
Baker, A., III. 1953. Localization of Pyrometasomatic Ore Deposits at Johnson Camp, Arizona, AIME Technical Paper 36841; Mining Engineering, V.5, no. 12, pp. 1272-1277.
Bikerman Engineering & Technology Associates Inc. 2007. Johnson Camp Mine Project Feasibility Study, Cochise County, Arizona – NI 43-101 Technical Report, prepared for Nord Resources, 234 p.
Burgex, Inc. 2025. Evaluation of Aggregate and High-Value Calcium Carbonate Resource Potential- Gunnison Copper. October 2025.
Burt, D.M. 1977. Mineralogy and petrology of skarn deposits: Rendiconti della Soc. Ital. di Mineral. e Petrol., v. 33, p. 859-873.
Clear Creek Associates. 2021. Letter Report: Groundwater Model Update dated February 18, 2021.
Cochise County, Arizona. 2014. Master Final Zoning Regulations, revised February 25, 2014. https://www.cochise.az.gov/sites/default/files/planning_and_zoning/MASTER FINAL ZONING REGULATIONS 2-25-14.pdf
Colburn, N.I., Perry, A.J., March 17, 1976: Perry, Knox, Kaufman, Inc., Perry, Knox, Kaufman, Inc. internal company report, 34 pages plus figures.
Cooper, J. R., and L. T. Silver, 1964. Geology and Ore Deposits of the Dragoon Quadrangle, Cochise County, Arizona.
Geological Survey Professional Paper 416. United States Government Printing office, Washington, 196 pp.
Curtis & Associates, 2011: Johnson Camp Mine Pad 5 Expansion Project, Feasibility Study with Revisions prepared for Nord Resources, 49.
Darling Environmental and Surveying, Ltd., 2010. Gunnison Project Threatened and Endangered Species Analysis: Internal AzTech Minerals, Inc. report, 25 p.
| M3-PN210313.007 31 March 2026 Revision 0 | 280 |
GUNNISON PROJECT Form 43-101F1 Technical Report |
Darling Environmental and Surveying, Ltd., 2014. Gunnison Project 2014 State Land Threatened and Endangered Species Analysis: Internal Excelsior Mining Corp. report, 41 p.
Darling Environmental and Surveying, Ltd., 2015. Gunnison Project 2014 State Land Threatened and Endangered Species Analysis: Internal Excelsior Mining Corp. report, 9 p.
Darling Geomatics. 2016. Gunnison Copper Project biological evaluation 2016 Threatened & Endangered species analysis, T. 15S., R. 22E, Sec. 36 and T. 15S., R. 23 E., Sec. 31, Cochise County, Arizona.
Davis, S.N., and R.J.M. DeWiest, 1966. Hydrogeology. New York, NY. John Wiley and Sons, 463 pp.
Dickens, Chuck M., 2003. Characterization of Hydrogeologic Conditions, Johnson Camp Mine. Prepared in Support of an Application for an Aquifer Protection Permit. July 31, 2003.
Drewes, Harald, Kelley, W.N. and Munts, S.R., 2001, Tectonic map of southeast Arizona: a digital database for the west part: U.S. Geological Survey Miscellaneous Investigations Series Map I-1109, digital database, version 1.0, 29 p., 1 digital sheet, scale 1:125,000.
Early D., 2016, Metallurgical Test Model (MTM) Calibration Results for the Gunnison Feasibility Project April 25, 2016, 17 p.
Einaudi, M.T., Meinert, L.D., Newberry, R.J., 1980. Skarn Deposits in Skinner, B.J., ed., Economic Geology 75th Anniversary Volume 1905-1980: El Paso, Texas, The Economic Geology Publishing Company, p. 317-391.
Engineering Enterprises, Inc., 1985. Guidance Document for the Area of Review Method. ftp://ftp.consrv.ca.gov/pub/oil/EPA/Guidance_Document_for_Area_of_Review_Requirement.pdf
Federal Emergency Management Agency (FEMA), 2008. Flood Insurance Rate Map. Cochise County, Arizona and Incorporated Areas. Map Number 04003C0985F. Number 040012 Panel 0985 Suffix F. Effective Date August 28, 2008.
Fellows, L. D., 2000. 3. Arizona Geology, Vol. 30, No. 1, Spring 2000. Published by the Arizona Geological Survey. Freeze, R. A., and J. A. Cherry, 1979. Groundwater. Prentice-Hall Inc., Englewood Cliffs, NJ. 604 pp.
Glasgow Engineering Group Inc, 2010, Technical Design Report for Johnson Camp Mine Leach Pad No. 5; APP Facility No. 28 (Nord Resources), 355 p.
Griffith, G.E., Omernik, J.M., Johnson, C.B., and Turner, D.S., 2014. Ecoregions of Arizona (poster): U.S. Geological Survey Open-File Report 2014-1141, with map, scale 1:1,325,000.
Haley and Aldrich, 2015. Hydrogeologic Well Completion Report, Gunnison Copper Project, Cochise County, Arizona. July.
Halpenny, L. C., 1973. Letter from Leonard C. Halpenny, Water Development Corporation, to William E. Seaegart, Quintana Minerals Corporation, dated February 14, 1973. 16pp.
Harshbarger & Associates, 1973. Hydrogeological Conditions and Potential Groundwater Supply, Johnson Camp Mine Area. December 6, 1973.
HATCH, 2022. Excelsior Mining Corp. Gunnison Project Mine Water Treatment Concept Design. Prepared for Excelsior Mining Corp. February 14, 2022.
| M3-PN210313.007 31 March 2026 Revision 0 | 281 |
GUNNISON PROJECT Form 43-101F1 Technical Report |
Hazen Research, Inc. (“HRI”) for BHP Copper, 1996. Project No. 8619, “Oxide Copper Column Leaching Experiments with Sulfurous Acid.” September 9, 1996.
Hazen Research, Inc. (“HRI”) for Excelsior Mining Arizona, Inc., 2011. Project No 11245, “Copper Ore Column Leach Experiments” Draft. September 2011.
Kantor, J. A., 1977. Structure, Alteration and Mineralization on the Flanks of the Texas Canyon Stock, Cochise County, Arizona. Society of Mining Engineers Preprint Number 77-I-321. For presentation at the 1977 SME Fall Meeting and Exhibit, St. Louis, Missouri – October 19-21, 1977.
Keith, S.B., Gest, D.E. DeWitt, E., Toll, N.W., Everson, B.A., 1983, Metallic Mineral Districts and Production in Arizona: Bulletin 194, Arizona Bureau of Geology and Mineral Technology, p. 22-23.
Kim, Eui-Jun; Shin, Dongbok; Shin, Seungwook; Nam, Hyeong-Tae; Park, Samgyu; 2015. Skarn zonation and rock physical properties of the Wondong Fe-Pb-Zn polymetallic deposit, Korea, Geosciences Journal: The Association of Korean Geoscience Societies, V 19, no 4, p 587-598.
Kimley Horn, 2025. I-10 Gunnison Final Pre-Feasibility Study. Realign I-10 & Reconstruct Johnson Rd TI. October 2025.
King, A.M., 2014. A cultural resources inventory of 256 acres near Dragoon, Cochise County, Arizona. WestLand Resources, Inc.
King, P.B. and Beikman, H.M., 1974, Geological Map of the United States. US Geological Survey. Kuhnel V., 2016, Distribution of hydraulic conductivities in the Gunnison Ore body.
Lewis Roca Rothgerber Christie LLP, 2021. RE: Summary of Document Review. Attn: Elian Terner, Managing Director of Scotia Capital Inc. and Dan Barnholden, Managing Director of PI Financial Corp. February 22, 2021.
Livingston, D.E., Damon, P.E., Mauger, R.L., Bennett, R., and Laughlin, A.W., 1967. Argon 40 in Cogenetic Feldspar-Mica Mineral Assemblages: Journal of Geophysical Research, v. 72, no. 4, pp. 1361-1375.
M3 Engineering and Technology Corporation, 2014. Gunnison Copper Project NI 43-101 Technical Report Prefeasibility Study, Cochise County, Arizona, USA. Revision 0, 14 February 2014. Prepared for Excelsior Mining Corp. 287pp.
M3 Engineering and Technology Corporation, 2016. Gunnison Copper Project Prefeasibility Update, Cochise County, Arizona, USA. Prepared for Excelsior Mining Corp.
M3 Engineering and Technology Corporation, 2017. Gunnison Copper Project Feasibility Study, Cochise County, Arizona, USA. Prepared for Excelsior Mining Corp. January 16, 2017.
M3 Engineering and Technology Corporation, 2022. Gunnison Copper Project NI 43-101 Technical Report Gunnison Copper Project Prefeasibility Study Update and JCM Heap Leach Preliminary Economic Assessment, Cochise County, Arizona, USA. Revision 0, Effective Date: March 11, 2022. Prepared for Excelsior Mining Corp.
Magma Copper Co. Metallurgical Laboratory (“Magma”), 1992. Report, No. ML-2093, “Bottle Roll Leach Test: Johnson Camp Samples,” December 8, 1992.
Magma Copper Co. Metallurgical Laboratory (“Magma”), 1993. “Addendum to ML 2093,” January 14, 1993.
| M3-PN210313.007 31 March 2026 Revision 0 | 282 |
GUNNISON PROJECT Form 43-101F1 Technical Report |
Magma Copper Co. Metallurgical Laboratory (“Magma”), 1995. Report No. ML-2343, “Bottle Roll Leach Tests: Johnson Camp Samples – Composite #1 and #2, Crushed to Minus 10-mesh,” February 27, 1995.
Magma Copper Co. Metallurgical Laboratory (“Magma”), 1996. Report No. ML-2494, “Mini-Column Leaching of I-10 Epoxy Coated Samples.” January 4, 1996.
McDonald, M.G., and Harbaugh, A.W., 1988. A modular three-dimensional finite-difference ground-water flow model: Techniques of Water-Resources Investigations of the United States Geological Survey, Book 6, Chapter A1, 586 p.
Meinert, L.D., Dipple, G.M., and Nicolescu, S., 2005. World Skarn Deposits, in Hedenquist, J.W., Thompson, J.F.H., Goldfarb, R.J., and Richards, J.P., eds., Economic Geology 100th Anniversary Volume 1905-2005: Littleton, Colorado, Society of Economic Geologists, Inc., p. 299-336.
Metcon Research for The Superior Oil Co., 1972. Project No. 50-92.10,” Leach Testing on JO-1, JO-2, and JO-3”, June 29, 1972.
Mountain States Research & Development, Inc. (“MSRDI”) for Quintana Minerals Corp., 1973a. Project No. 2019, “Preliminary Metallurgical Tests – Johnson Camp Venture # 2, January 18, 1973.
Mountain States Research & Development, Inc. (“MSRDI”) for Quintana Minerals Corp, 1973b. Project 2019, Progress Report No. 2, March 30, 1973.
NORAM Engineering and Construction Ltd, 2022. 1,650 stpd Sulfur Burning Sulfuric Acid Plant Study Report. Prepared for Excelsior Mining Corp and M3 Engineering. January 31, 2022.
PAST, 2010. Archaeological survey of The North Dragoon Basin Project near Dragoon, Cochise County, Arizona (A). PAST, 2010. Archaeological survey of The Thing View Project near Dragoon, Cochise County, Arizona (B).
Pearthree, P. A., and A. Youberg, 2006. Recent Debris Flows and Floods in Southern Arizona. Arizona Geology, Vol. 36, No. 3. Fall 2006. Published by the Arizona Geological Survey.
Petersen, M.D., Moschetti, M.P., Powers, P.M., Mueller, C.S., Haller, K.M., Frankel, A.D., Zeng, Yuehua, Rezaeian, Sanaz, Harmsen, S.C., Boyd, O.S., Field, E.H., Chen, Rui, Luco, Nicolas, Wheeler, R.L., Williams, R.A., Olsen, A.H., and Rukstales, K.S., 2015, Seismic-hazard maps for the conterminous United States, 2014. USGS Scientific Investigations Map 3325, 6 sheets, scale 1: 7,000,000, http://dx.doi.org/10.3133/sim3325.
Phelps Dodge Mining Company’s Process Technology Center, by E. A. Rood (Phelps Dodge), 1996. “I-10 Project, Metallurgical Testing Update.” December 17, 1996.
Professional Archeological Services of Tucson (P.A.S.T.), 2010a. Archeological Survey of the Thing View Project near Dragoon, Cochise County, AZ. Cultural Resources Report No. 101981.
Professional Archeological Services of Tucson (P.A.S.T.), 2010b. Archeological Survey of the North Dragoon Basin Project near Dragoon, Cochise County, AZ. Cultural Resources Report No. 101974.
R. J. Roman, 2011. “Johnson Camp Column Leach Program (8-inch Columns),” Final Report, Revision 1, for Nord Resources Corporation, May 12, 2011.
Ramsahoye, L. E., and S. M. Lang, 1961. A Simple Method for Determining Specific Yield from Pumping Tests. Ground-Water Hydraulics. Geological Survey Water-Supply Paper 1536-C. Prepared in cooperation with the New Jersey Department of Conservation and Economic Development. USGS, U. S. Government Printing Office, Washington, D.C. 46 pp.
| M3-PN210313.007 31 March 2026 Revision 0 | 283 |
GUNNISON PROJECT Form 43-101F1 Technical Report |
Regnault O., Lagneau V., Fiet N., Langlais V., 2013, Reactive transport simulation of Uranium ISL at the block scale a tool for testing designs and operation scenarios.
Reynolds, S.J., Florence, F.P., Welty, J.W., Roddy, M.S., Currier, D.A., Anderson, A.V., Keith, S.B., 1986. Arizona Bureau of Geology and Mines Technical Bulletin 197, Compilation of Radiometric Age Determinations in Arizona, 258 pp.
Richard, Stephen M., Todd C. Shipman, Lizbeth C. Greene, and Raymond C. Harris, 2007, Estimated Depth to Bedrock in Arizona, Arizona Geological Survey Digital Geologic Map Series DGM-52, Version 1.0.
S. Twyerould, President, Excelsior Mining Corp, private communication, February 8, 2022.
Shipman, T.C., 2007. Cochise County Earth Fissure Planning Map, Arizona: Arizona Geological Survey Open File Report 07-01, v1, Sheet 3, scale 1:250,000.
Sillitoe, R., 1989. Gold Deposits in the Western Pacific Island Arcs: The Magmatic Connection. Economic Geology Monograph 6, pp 266-283.
Sillitoe, R.H, 2010. Porphyry Copper Systems. Economic Geology, 105, 3-41.
Stone, B.W.S. 2017. A cultural resources inventory of approximately 66.85 acres of Arizona state trust land and 265.88 acres of private land northeast of Dragoon, Cochise County, Arizona. WestLand Resources, Inc.
United States Historical Climatology Network (USHCN), 2015. Monthly Climate Records for Station 026353, PEARCE SUNSITES, Arizona.
Veolia Water Technologies, 2016. Excelsior Mining Gunnison Project Water Treatment Concept Design, October 31, 2016.
Weitz, T.J., 1976. Geology and Ore Deposits at the I-10 Prospect, Cochise County, Arizona, Unpublished M.S. Thesis, University of Arizona, 85 pp.
Westland Resources Inc., 2014. Cultural Resources Report 2014-52A, A Cultural Resource Inventory of 256 Acres near Dragoon, Cochise County, Arizona,: Internal Excelsior Mining Corp. report, 53p.
Worley Consulting, 2026. Gunnison Copper PEA – Automated Haulage System Evaluation. Memorandum dated 6 February 2026.
Young, J., and P. Pearthree, 2014. Duncan M5.3 Earthquake of June 2014 and Temporary Seismic Network Deployment. Seismic News, Arizona Geological Survey, October 17, 2014.
http://azgeology.azgs.az.gov/article/seismic/2014/10/duncan-m53-earthquake-june-2014-and-temporary-seismic-network-deployment.
Yunge, H. 1965. Chemical compounds and radio-activity in atmosphere; Clarendon –press: Oxford, 1965.
| M3-PN210313.007 31 March 2026 Revision 0 | 284 |
GUNNISON PROJECT Form 43-101F1 Technical Report |
APPENDIX A: PRELIMINARY ECONOMIC ASSESSMENT CONTRIBUTORS AND PROFESSIONAL QUALIFICATIONS
| M3-PN210313.007 31 March 2026 Revision 0 | 285 |
GUNNISON PROJECT Form 43-101F1 Technical Report |
CERTIFICATE OF QUALIFIED PERSON
John Woodson
I, John Woodson, P.E., SME-RM do hereby certify that:
| 1. | I am employed as Chief Financial Officer, Senior Vice President, Project Manager and Project Sponsor of: |
M3 Engineering & Technology Corporation
2051 W. Sunset Road, Ste. 101
Tucson, Arizona. 85704
| 2. | I graduated with a Bachelor of Science in Civil Engineering from the University of Arizona in 2003 and a Master of Science in Civil Engineering from the University of Arizona in 2008. |
| 3. | I am a registered professional engineer in good standing in the State of Arizona in the area of Structural Engineering (No. 47714). I am also registered as a professional engineer in the states of California (No. 73405), Nevada (No. 029163) and Michigan (No. 6201057625). |
| 4. | I have worked as an engineer for a total of 22 years. My experience includes 20 years at M3 Engineering and Technology Corporation working on all aspects of mine plant development for base and precious metals projects with a specific focus on plant layout, infrastructure, estimating and scheduling. As Project Manager and Sponsor, I have been involved with studies as well as full engineering, procurement, and construction management (EPCM) projects. |
| 5. | I have read the definition of “Qualified Person” set out in National Instrument 43-101 (“NI 43-101”) and certify that by reason of my education, affiliation with a professional association (as defined in NI 43-101) and past relevant work experience, I fulfill the requirements to be a “Qualified Person” for the purposes of NI 43-101. |
| 6. | I am a contributing author for the preparation of the technical report titled “Gunnison Project NI 43-101 Technical Report Preliminary Economic Assessment” (“Technical Report”) dated effective March 18, 2026, prepared for Gunnison Copper Corp.; and am responsible for Sections 1.1, 1.16, 1.17, 1.19 (except 1.19.1.1 and 1.19.2.1), 1.20, 1.22, 1.23, 2, 3, 18 (except 18.3 and 18.7), 19, 21 (except 21.2.1, 21.3.1, 21.2.4 and 21.3.8), 22, 25, 26, and 27. I have not visited the project site. |
| 7. | I have prior involvement with the property that is the subject of the Technical Report. I was contributing author for the preparation of the technical report titled “Gunnison Project NI 43-101 Technical Report Preliminary Economic Assessment” dated effective March 12, 2025, prepared for Gunnison Copper Corp.; and am responsible for Sections 1.1, 1.16, 1.17, 1.19 (except 1.19.1.1 and 1.19.2.1), 1.20, 1.22, 1.23, 18, 19, 21 (except 21.1.2 and 21.2.1), 22, 25, 26, and 27. |
| 8. | As of the effective date of the technical report, to the best of my knowledge, information and belief, the Technical Report contains all scientific and technical information that is required to be disclosed to make the Technical Report not misleading. |
| 9. | I am independent of the issuer applying all of the tests in Section 1.5 of National Instrument 43-101. |
| 10. | I have read National Instrument 43-101 and Form 43-101F1, and the Technical Report has been prepared in compliance with that instrument and form. |
| 11. | I consent to the filing of the Technical Report with any stock exchange and other regulatory authority and any publication by them, including electronic publication in the public company files on their websites accessible by the public, of the Technical Report. |
Signed and dated this 31st day of March 2026.
| (Signed and sealed) “John Woodson” | |
| John Woodson, P.E., SME-RM |
 |
CERTIFICATE OF QUALIFIED PERSON
I, Jeffrey Bickel, C.P.G. (AIPG) and Registered Geologist (Arizona), do hereby certify that: | |
| 1. | I am currently employed as a Senior Geologist at RESPEC Company LLC (formerly Mine Development Associates, Inc.) (“RESPEC”), at 210 South Rock Blvd, Reno, Nevada, 89502. | |
| 2. | This certificate applies to the technical report titled “Gunnison Project NI 43-101 Technical Report Preliminary Economic Assessment”, with the effective date of March 18, 2026 (the “Technical Report”). | |
| 3. | I graduated with a Bachelor of Science degree in Geological Sciences from Arizona State University in 2010. I am a Certified Professional Geologist (#12050) with the American Institute of Professional Geologists. I am also a Registered Geologist in the state of Arizona (#60863). | |
| 4. | I have worked as a geologist continuously for over 14 years since graduation from university. During that time, I have previously explored, drilled, evaluated, and modelled oxide copper deposits similar to Gunnison in Arizona and elsewhere and have estimated the mineral resources for such deposits. | |
| 5. | I have read the definition of “qualified person” set out in National Instrument 43-101 – Standards of Disclosure for Mineral Projects (“NI 43-101”) and certify that by reason of my education, affiliation with a professional association (as defined in NI 43-101) and past relevant work experience, I fulfill the requirements to be a “qualified person” for the purposes of NI 43-101. | |
| 6. | I have visited the Gunnison Project site on multiple occasions, most recently on February 26, 2026. | |
| 7. | I worked as a geologist for the issuer from 2010-2020. I also co-authored four prior technical reports for the issuer, most recently the technical report dated effective March 12, 2025 and titled “Johnson Camp Mine NI 43-101 Technical Report, Cochise County, Arizona, USA.” | |
| 8. | I am independent of the issuer applying all of the tests in Section 1.5 of National Instrument 43-101. | |
| 9. | I am responsible for sections 1.2, 1.3, 1.4, 1.5, 1.6, 1.7, 1.8, 1.9, 1.10, 1.12, 1.21, 4, 5, 6, 7, 8, 9, 10, 11, 12, 13.5, 14, and 23 of the Technical Report. | |
| 10. | I have read National Instrument 43-101 and Form 43-101F1 and the Technical Report has been prepared in compliance with that instrument and form. | |
| 11. | As of the Effective Date of the Technical Report, to the best of my knowledge, information and belief, the Technical Report contains all scientific and technical information that is required to be disclosed to make the Technical Report not misleading. | |
210 South Rock Boulevard
Reno, NV 89502
775.856.5700
| Dated this 31st day of March 2026. | ||
| (Signed and Sealed) “Jeffrey Bickel” | ||
| Jeffrey Bickel, C.P.G. (#12050) |
respec.com
CERTIFICATE OF QUALIFIED PERSON
Abyl Sydykov, PhD, PE
I, Abyl Sydykov, PhD, PE, do hereby certify that:
| 1. | I am employed as Process Engineer and Project Manager of: |
M3 Engineering & Technology Corporation
2051 W. Sunset Road, Ste. 101
Tucson, Arizona 85704
| 2. | I graduated with a degree in Non-Ferrous Metallurgy from the National University of Science and Technology “MISIS” (Moscow, Russia) in 1992, and a PhD in Metallurgy from the RWTH Aachen University (Germany) in 2004. |
| 3. | I am a registered professional engineer in good standing in the State of Arizona in the area of Mining and Mineral Processing (No. 80378). |
| 4. | I have worked in metallurgical and mineral processing operations, research, consulting, and engineering for a total of 30 years. My experience includes 4 years at M3 Engineering and Technology Corp. working on process engineering and project management. As Process Engineer, I have been involved in studies and engineering processing plants for copper, lead, zinc, gold and silver mining projects. |
| 5. | I have read the definition of “Qualified Person” set out in National Instrument 43-101 (“NI 43-101”) and certify that by reason of my education, affiliation with a professional association (as defined in NI 43-101) and past relevant work experience, I fulfill the requirements to be a “Qualified Person” for the purposes of NI 43-101. |
| 6. | I am a contributing author for the preparation of the technical report titled “Gunnison Project NI 43-101 Technical Report Preliminary Economic Assessment” (“Technical Report”) dated effective March 18, 2026, prepared for Gunnison Copper Corp.; and am responsible for Sections 1.15 and 17 (except 17.7). I visited the project site on December 17, 2024. |
| 7. | I have prior involvement with the property that is the subject of the Technical Report. I was contributing author for the preparation of sections 1.15 and 17 of the technical report titled “Gunnison Project NI 43-101 Technical Report Preliminary Economic Assessment” dated effective November 1, 2024. |
| 8. | As of the effective date of the Technical Report, to the best of my knowledge, information and belief, the Technical Report contains all scientific and technical information that is required to be disclosed to make the Technical Report not misleading. |
| 9. | I am independent of the issuer applying all of the tests in Section 1.5 of National Instrument 43-101. |
| 10. | I have read National Instrument 43-101 and Form 43-101F1, and the Technical Report has been prepared in compliance with that instrument and form. |
| 11. | I consent to the filing of the Technical Report with any stock exchange and other regulatory authority and any publication by them, including electronic publication in the public company files on their websites accessible by the public, of the Technical Report. |
Signed and dated this 31st day of March 2026.
| (Signed and Sealed) “Abyl Sydykov” | |
| Abyl Sydykov, PhD, PE |
CERTIFICATE OF QUALIFIED PERSON
Dr. Terence P. McNulty, PE, DSc
I, Dr. Terence P. McNulty, PE, DSc, do hereby certify that:
| 1. | I am President of: |
T, P, McNulty and Associates, Inc,
4321 North Camino de Carrillo, Tucson, AZ 85750
| 2. | I graduated with a BS in Chemical Engineering from Stanford University in 1960 and earned an MS in Metallurgical Engineering from Montana School of Mines in 1963 and a doctorate (DSc) from Colorado School of Mines in 1966. |
| 3. | I am a Registered Professional Engineer in Colorado with reciprocity in most states. My registration is current (No. 24789) and I am in good standing. |
| 4. | I have worked as a metallurgical engineer for a total of over 59 years since completion of post-graduate studies. My experience includes serving as a Research Engineer, Mill Superintendent, Supervisor of Process Engineering, and Director of Corporate R&D for The Anaconda Company, VP-Technical Operations for Kerr-McGee Chemical Corp., President of Hazen Research, Inc., and President of T. P. McNulty and Associates, Inc. for the last 33 years. |
| 5. | I have read the definition of “Qualified Person” set out in National Instrument 43-101 (“NI 43-101”) and certify that by reason of my education, affiliation with a professional association (as defined in NI 43-101) and past relevant work experience, I fulfill the requirements to be a “Qualified Person” for the purposes of NI 43-101. |
| 6. | I am responsible for Sections 1.11, 13 (except 13.5) and 24 of the Technical Report “Gunnison Project NI 43-101 Technical Report Preliminary Economic Assessment” (“Technical Report”) dated effective March 18, 2026, prepared for Gunnison Copper Corp. |
| 7. | I have not visited the Gunnison Property directly but have visited the adjacent Johnson Camp Site in the 1970s and 1990s when it was owned by Cyprus Minerals. |
| 8. | I had prior involvement with the property that is the subject of the Technical Report. I was responsible for the Sections 13 (except 13.2.3.1), 24.13 of the technical report titled “Gunnison Copper Project, NI 43-101 Technical Report, Gunnison Copper Project Prefeasibility Study Update and JCM Heap Leach Preliminary Economic Assessment” dated effective February 1, 2023. I was also responsible for Sections 1.11, 13 and 24 of the report “Gunnison Project NI 43-101 Technical Report Preliminary Economic Assessment” dated effective November 1, 2024. |
| 9. | Except as disclosed in paragraph 8 of this certificate, I have not provided consulting services to, or otherwise been involved with, the project owner prior to the current assignment. |
| 10. | As of the date of this certificate, to the best of my knowledge, information and belief, the Technical Report contains all scientific and technical information that is required to be disclosed to make the Technical Report not misleading. |
| 11. | I am independent of the issuer by applying all of the tests in Section 1.5 of National Instrument 43-101. |
| 12. | I have read National Instrument 43-101 and Form 43-101F, and the Technical Report has been prepared in compliance with that instrument and form. |
| 13. | I consent to the filing of the Technical Report with any stock exchange and other regulatory authority and any publication by them, including electronic publication in the public company files on their websites accessible by the public, of the Technical Report. |
Signed and dated this 31st day of March 2026.
| (Signed and sealed) “Terence P. McNulty” | |
| Dr. Terence P. McNulty, PE, DSc |
CERTIFICATE OF QUALIFIED PERSON
Rob Valceschini, P.E.
I, Rob Valceschini, P.E., do hereby certify that:
| 1. | I am a principal engineer of: |
Geo-Logic Associates
4960 Vista Boulevard, Unit 100
Sparks, NV 89436
| 2. | I graduated with a bachelor’s of science in Geological Engineering from the MacKay School if Mines, Reno, Nevada in 1984 and graduated with a master’s degree in Civil Engineering from the University of Nevada, Reno in 1991. |
| 3. | I am a licensed civil engineer in good standing in in the state of Arizona license number 66877. I am also registered as a civil engineer in the states of Nevada, Montana, Oregon and California. |
| 4. | I have worked as geotechnical engineer for a total of 42 years. My experience includes the design, review and construction quality assurance of heap leach pads for hard rock mines. |
| 5. | I have read the definition of “Qualified Person” set out in National Instrument 43-101 (“NI 43-101”) and certify that by reason of my education, affiliation with a professional association (as defined in NI 43-101) and past relevant work experience, I fulfill the requirements to be a “Qualified Person” for the purposes of NI 43-101. |
| 6. | I am a contributing author for the preparation of the technical report titled “Gunnison Project NI 43-101 Technical Report Preliminary Economic Assessment” (“Technical Report”) dated effective March 18, 2026, prepared for Gunnison Copper Corp.; and am responsible for Sections 17.7 and 18.3. I visited the project site on January 12, 2026. |
| 7. | I have prior involvement with the property that is the subject of the Technical Report. I assisted in the preparation of a previous PEA at this site. This included managing the PEA level design of the heap leach pad and surface water diversion and PEA level deterministic water balance for the heap leach pad. |
| 8. | I have no other involvement with the project or the Client. |
| 9. | As of the effective date of the Technical Report, to the best of my knowledge, information and belief, the Technical Report contains all scientific and technical information that is required to be disclosed to make the Technical Report not misleading. |
| 10. | I am independent of the issuer applying all of the tests in Section 1.5 of National Instrument 43-101. |
| 11. | I have read National Instrument 43-101 and Form 43-101F1, and the Technical Report has been prepared in compliance with that instrument and form. |
| 12. | I consent to the filing of the Technical Report with any stock exchange and other regulatory authority and any publication by them, including electronic publication in the public company files on their websites accessible by the public, of the Technical Report. |
Signed and dated this 31st day of March 2026.
| (Signed and sealed) “Rob Valceschini” | |
| Rob Valceschini, P.E. |
CERTIFICATE OF QUALIFIED PERSON
Tyler Peck, P.E.
I, Tyler Peck, P.E., do hereby certify that:
| 1. | I am employed as a Mining Engineer of: |
Burgex Inc.
10717 South State Street Sandy, Utah 84070
| 2. | I graduated with a Bachelor of Science in Mining Engineering from the University of Utah in 2016. |
| 3. | I am a registered professional engineer in good standing in the State of Utah in the areas of Mining and Mineral Processing (No. 13350581-2201). I am also registered as a professional engineer in the state of Georgia (No. PE05829). |
| 4. | I have worked as an engineer for a total of 10 years. My experience includes 2 years at Dolese Bros. Co. where I worked on special projects and mine design/planning for multiple crushed stone and sand and gravel operations through the central south region of the United States, 2 years at Komatsu Equipment Company where I focused on equipment selection, GPS and automated machine control for dirt work operations, and 6 years at Burgex working on all aspects of mine planning, including site selection, drilling, testing, design, infrastructure, transportation and markets analytics. |
| 5. | I have read the definition of “Qualified Person” set out in National Instrument 43-101 (“NI 43-101”) and certify that by reason of my education, affiliation with a professional association (as defined in NI 43-101) and past relevant work experience, I fulfill the requirements to be a “Qualified Person” for the purposes of NI 43-101. |
| 6. | I am a contributing author for the preparation of the technical report titled “Gunnison Project NI 43-101 Technical Report Preliminary Economic Assessment” (“Technical Report”) dated effective March 18, 2026, prepared for Gunnison Copper Corp.; and am responsible for Sections 18.7, 21.2.4 and 21.3.8. I have not visited the project site. |
| 7. | I have not had prior involvement with the property that is the subject of the Technical Report. |
| 8. | As of the effective date of the Technical Report, to the best of my knowledge, information and belief, the Technical Report contains all scientific and technical information that is required to be disclosed to make the Technical Report not misleading. |
| 9. | I am independent of the issuer applying all of the tests in Section 1.5 of National Instrument 43-101. |
| 10. | I have read National Instrument 43-101 and Form 43-101F1, and the Technical Report has been prepared in compliance with that instrument and form. |
| 11. | I consent to the filing of the Technical Report with any stock exchange and other regulatory authority and any publication by them, including electronic publication in the public company files on their websites accessible by the public, of the Technical Report. |
Signed and dated this 31st day of March 2026.
| (Signed and sealed) “Tyler Peck” | |
| Tyler Peck, P.E. |
CERTIFICATE OF QUALIFIED PERSON
R. Douglas Bartlett, C.P.G.
I, R. Douglas Bartlett, C.P.G. do hereby certify that:
| 1. | I am currently employed as a Hydrogeologist by: |
Clear Creek Associates, a subsidiary of Geo-Logic Associates
8777 N. Gainey Center Dr., Suite 250
Scottsdale, Arizona, 85258
| 2. | I am a graduate of Colorado State University |
| 3. | I am a: |
| ● | Registered Geologist in the States of Arizona, California, Oregon, Washington, and Alaska |
| 4. | I have practiced geology and hydrogeology since 1977 at: Dames & Moore in Denver and Phoenix; Anaconda Minerals in Denver, Colorado; and Clear Creek Associates in Scottsdale, Arizona. My expertise includes mining-related hydrogeologic investigations and groundwater modeling. |
| 5. | I have read the definition of “qualified person” set out in National instrument 43-101 (“NI 43-101”) and certify that by reason of my education, affiliation with a professional association (as defined in NI 43-101) and past relevant work experience, I fulfill the requirements to be a “qualified person” for the purposes of NI 43-101. |
| 6. | I am responsible for Sections 1.14.1, 1.18, 16.9, and 20 of the technical report titled “Gunnison Project NI 43-101 Technical Report Preliminary Economic Assessment” (“Technical Report”) dated effective March 18, 2026 prepared for Gunnison Copper Corp. |
| 7. | I had prior involvement with the property that is the subject of the Technical Report. I was responsible for the Sections 16, and 20 of the technical reports titled “Gunnison Copper Project, NI 43-101 Technical Report, Prefeasibility Study Update” dated effective January 28, 2016, and “Gunnison Copper Project, NI 43-101 Technical Report Feasibility Study” dated effective December 17, 2016 prepared for Gunnison Copper Corp. I was also responsible for Sections 16, 20, and 24.20 of the technical report titled “Gunnison Copper Project Prefeasibility Study Update and JCM Heap Leach Preliminary Economic Assessment” dated effective March 11, 2022. I was also responsible for Sections 16, 20, 24.16.5, and 24.20 of the technical report titled “Gunnison Copper Project Prefeasibility Study Update and JCM Heap Leach Preliminary Economic Assessment” dated effective February 1, 2023 and sections 1.18, 16.9, and 20 of the technical report titled “Gunnison Project NI 43-101 Technical Report Preliminary Economic Assessment” dated effective November 1, 2024. |
| 8. | I visited the Gunnison Site on May 15, 2019. |
| 9. | As of the effective date of the Technical Report, to the best of my knowledge, information and belief, the Technical Report contains all scientific and technical information required to be disclosed to make the report not misleading. |
| 10. | I am independent of the issuer applying all of the tests in Section 1.5 of National Instrument 43-101. |
| 11. | I have read National Instrument 43-101 and Form 43-101F1, and the Technical Report has been prepared in compliance with that instrument and form. |
Signed and dated this 31st day of March 2026
| (Signed and sealed) “R. Douglas Bartlett” | |
| R. Douglas Bartlett, C.P.G. |
CERTIFICATE OF QUALIFIED PERSON
I, Jacob W. Richey, P.E. do hereby certify that:
| 1. | I am currently employed as a Senior Mining Engineer by: |
Independent Mining Consultants, Inc.
3560 E. Gas Road
Tucson, Arizona, USA 85714
| 2. | I graduated with the following degrees from the Colorado School of Mines. Bachelors of Science, Mining Engineering – 2009 |
| 3. | I am a Registered Professional Mining Engineer in the State of Arizona USA. Registration # 64139 |
| 4. | I have worked as a mining engineer for more than 14 years. I have been involved with the preparation of mineral resources, mineral reserves, and mine plans for multiple hard rock metal projects over that time. |
| 5. | I have read the definition of “qualified person” set out in National Instrument 43-101 (“NI 43-101”) and certify that by reason of my education, affiliation with a professional association (as defined in NI 43-101) and past relevant work experience, I fulfill the requirements to be a “qualified person” for the purposes of NI43-101. |
| 6. | I am responsible for sections 1.13, 1.14 (except 1.14.1), 1.19.1.1, 1.19.2.1, 15, 16 (except 16.2 and 16.9), 21.2.1, and 21.3.1 of the Technical Report titled “Gunnison Project NI 43-101 Technical Report Preliminary Economic Assessment”, with the effective date of March 18, 2026 prepared for Gunnison Copper Corp. |
| 7. | I last visited the Gunnison Copper property on 31 July 2025. |
| 8. | I have previously been involved with engineering work on the Gunnison Project since 2022. I was responsible for sections 1.13, 1.14, 1.19.1.1, 1.19.2.1, 15, 16 (except 16.2 and 16.9), 21.1.2, and 21.2.1 of the Technical Report titled “Gunnison Project NI 43-101 Technical Report Preliminary Economic Assessment”, with the effective date of November 1, 2024. |
| 9. | As of the date hereof, to the best of my knowledge, information, and belief, the Technical Report contains all the scientific and technical information that is required to be disclosed to make the Technical Report not misleading. |
| 10. | I am independent of the issuer applying the definition in Section 1.5 of NI 43-101. |
| 11. | I have read National Instrument 43-101 and Form 43-101F1, and the Technical Report has been prepared in compliance with that instrument and form. |
| 12. | I consent to the filing of the Technical Report with any stock exchange and other regulatory authority and any publication by them, including electronic publication in the public company files on their websites accessible by the public, of the Technical Report. |
Dated: March 31, 2026
| (Signed and Sealed) “Jacob W. Richey” | |
| Jacob W. Richey |
Professional Mining Engineer AZ #64139
CERTIFICATE OF QUALIFIED PERSON
Thomas M. Ryan, P.E.
I, Thomas M. Ryan, P.E., do hereby certify that:
| 1. | I am a Principal Engineer, Vice President, and Director of: |
Call & Nicholas, Inc.
2475 N. Coyote Drive Tucson AZ 85718
| 2. | I am a graduate of the University of Arizona having received a Bachelor of Science in Geological Engineering in 1986 and Master of Science in 1987. |
| 3. | I am a registered Professional Engineer in good standing in Arizona (27693), New Mexico (14166) and Utah (11106129). |
| 4. | I have worked as an Engineer for a total of 39 years. My experience includes 31 years in Geotechnical Engineering as it applies to rock slope and underground stability for mine design. |
| 5. | I have read the definition of “Qualified Person” set out in National Instrument 43-101 (“NI 43-101”) and certify that by reason of my education, affiliation with a professional association (as defined in NI 43-101) and past relevant work experience, I fulfill the requirements to be a “Qualified Person” for the purposes of NI 43-101. |
| 6. | I am a contributing author for the preparation of the technical report titled “Gunnison Project NI 43-101 Technical Report Preliminary Economic Assessment” (“Technical Report”) dated effective March 18, 2026, prepared for Gunnison Copper Corp.; and am responsible for Section 16.2. I visited the project site on October 18, 2023. |
| 7. | I have prior involvement with the property that is the subject of the Technical Report as a technical advisor for the PEA pit slope design in 2022, 2023 and 2024. |
| 8. | As of the effective date of the Technical Report, to the best of my knowledge, information and belief, the Technical Report contains all scientific and technical information that is required to be disclosed to make the Technical Report not misleading. |
| 9. | I am independent of the issuer applying all of the tests in Section 1.5 of National Instrument 43-101. |
| 10. | I have read National Instrument 43-101 and Form 43-101F1, and the Technical Report has been prepared in compliance with that instrument and form. |
| 11. | I consent to the filing of the Technical Report with any stock exchange and other regulatory authority and any publication by them, including electronic publication in the public company files on their websites accessible by the public, of the Technical Report. |
Signed and dated this 31st day of March 2026.
| (Signed and sealed) “Thomas M. Ryan” | |
| Thomas M. Ryan, P.E. |
GUNNISON PROJECT Form 43-101F1 Technical Report |
APPENDIX B: MINERAL CLAIM DETAIL
BLM Claims
| Claim Name and Number | BLM Serial # (AMC #) | Township, Range, Section* | Maintenance Costs | Area |
| Mr Twn Rng Sec | ||||
| ALPHA #1 | 21945 | 14 0160S 0220E 025 | $200.00 | Gunnison |
| ALPHA #2 | 21946 | 14 0160S 0220E 025 | $200.00 | Gunnison |
| ALPHA #3 | 21947 | 14 0160S 0220E 025 | $200.00 | Gunnison |
| ALPHA #4 | 21948 | 14 0160S 0220E 025 | $200.00 | Gunnison |
| ALPHA #5A | 351064 | 14 0160S 0220E 025 | $200.00 | Gunnison |
| ALPHA #6 | 21950 | 14 0160S 0220E 024 | $200.00 | Gunnison |
| ALPHA #7 | 21951 | 14 0160S 0220E 024 | $200.00 | Gunnison |
| ALPHA #8 | 21952 | 14 0160S 0220E 024 | $200.00 | Gunnison |
| ALPHA #9 | 21953 | 14 0160S 0220E 024 | $200.00 | Gunnison |
| ALPHA #10 | 21954 | 14 0160S 0220E 024 | $200.00 | Gunnison |
| ALPHA #11 | 21955 | 14 0160S 0220E 024 | $200.00 | Gunnison |
| ALPHA #12 | 21956 | 14 0160S 0220E 024 | $200.00 | Gunnison |
| ALPHA #13 | 21957 | 14 0160S 0220E 024 | $200.00 | Gunnison |
| ALPHA #15 | 21959 | 14 0160S 0220E 024 | $200.00 | Gunnison |
| ALPHA #16 | 21960 | 14 0160S 0220E 024 | $200.00 | Gunnison |
| ALPHA #17 | 21961 | 14 0160S 0220E 024 | $200.00 | Gunnison |
| ALPHA #18 | 21962 | 14 0160S 0220E 024 | $200.00 | Gunnison |
| ALPHA #19 | 21963 | 14 0160S 0220E 024 | $200.00 | Gunnison |
| ALPHA #20 | 21964 | 14 0160S 0220E 024 | $200.00 | Gunnison |
| ALPHA #22 | 21966 | 14 0160S 0220E 026 | $200.00 | Gunnison |
| ALPHA #23 | 21967 | 14 0160S 0220E 026 | $200.00 | Gunnison |
| ALPHA #24 | 21968 | 14 0160S 0220E 023 | $200.00 | Gunnison |
| ALPHA #25 | 21969 | 14 0160S 0220E 023 | $200.00 | Gunnison |
| ALPHA #26 | 21970 | 14 0160S 0220E 023 | $200.00 | Gunnison |
| ALPHA #31 | 21975 | 14 0160S 0220E 023 | $200.00 | Gunnison |
| ALPHA #32 | 21976 | 14 0160S 0220E 023 | $200.00 | Gunnison |
| ALPHA #33 | 21977 | 14 0160S 0220E 023 | $200.00 | Gunnison |
| ALPHA 34 A | 324360 | 14 0160S 0220E 023 | $200.00 | Gunnison |
| ALPHA #36 | 21980 | 14 0160S 0220E 025 | $200.00 | Gunnison |
| ALPHA #37 | 21981 | 14 0160S 0220E 025 | $200.00 | Gunnison |
| ALPHA #38 | 21982 | 14 0160S 0220E 025 | $200.00 | Gunnison |
| ALPHA #39 | 21983 | 14 0160S 0220E 025 | $200.00 | Gunnison |
| ALPHA #40 | 21984 | 14 0160S 0220E 025 | $200.00 | Gunnison |
| ALPHA #45 | 21989 | 14 0160S 0220E 025 | $200.00 | Gunnison |
| ALPHA #46 | 21990 | 14 0160S 0220E 025 | $200.00 | Gunnison |
| ALPHA #49 | 21991 | 14 0160S 0220E 025 | $200.00 | Gunnison |
| ALPHA #50 | 21992 | 14 0160S 0220E 025 | $200.00 | Gunnison |
| ALPHA #51 | 21993 | 14 0160S 0220E 025 | $200.00 | Gunnison |
| ALPHA 52 A | 324361 | 14 0160S 0220E 026 | $200.00 | Gunnison |
| ALPHA 118 | 326439 | 14 0160S 0220E 001 | $200.00 | Gunnison |
| ALPHA 119 | 326440 | 14 0160S 0220E 001 | $200.00 | Gunnison |
| ALPHA 120 | 326441 | 14 0160S 0220E 001 | $200.00 | Gunnison |
| ALPHA 121 | 326442 | 14 0160S 0220E 001 | $200.00 | Gunnison |
| ALPHA 122 | 326443 | 14 0160S 0220E 001 | $200.00 | Gunnison |
| ALPHA 123 | 326444 | 14 0160S 0220E 001 | $200.00 | Gunnison |
| M3-PN210313.007 31 March 2026 Revision 0 |
GUNNISON PROJECT Form 43-101F1 Technical Report |
| Claim Name and Number | BLM Serial # (AMC #) | Township, Range, Section* | Maintenance Costs | Area |
| ALPHA 124 | 326445 | 14 0160S 0220E 001 | $200.00 | Gunnison |
| ALPHA 125 | 326446 | 14 0160S 0220E 011 | $200.00 | Gunnison |
| ALPHA 126 | 326447 | 14 0160S 0220E 011 | $200.00 | Gunnison |
| ALPHA 127 | 326448 | 14 0160S 0220E 011 | $200.00 | Gunnison |
| ALPHA 128 | 326449 | 14 0160S 0220E 013 | $200.00 | Gunnison |
| ALPHA 129 | 326450 | 14 0160S 0220E 013 | $200.00 | Gunnison |
| ALPHA 130 | 326451 | 14 0160S 0220E 013 | $200.00 | Gunnison |
| ALPHA 131 | 326452 | 14 0160S 0220E 013 | $200.00 | Gunnison |
| ALPHA 27 | 340653 | 14 0160S 0220E 023 | $200.00 | Gunnison |
| ALPHA 28 | 340654 | 14 0160S 0220E 023 | $200.00 | Gunnison |
| ALPHA 29 | 340655 | 14 0160S 0220E 023 | $200.00 | Gunnison |
| ALPHA 30 | 340656 | 14 0160S 0220E 023 | $200.00 | Gunnison |
| ALPHA 35 | 340657 | 14 0160S 0220E 023 | $200.00 | Gunnison |
| ALPHA 41 | 340658 | 14 0160S 0220E 023 | $200.00 | Gunnison |
| ALPHA 42 | 340659 | 14 0160S 0220E 023 | $200.00 | Gunnison |
| ALPHA 43 | 340660 | 14 0160S 0220E 023 | $200.00 | Gunnison |
| ALPHA 44 | 340661 | 14 0160S 0220E 023 | $200.00 | Gunnison |
| ALPHA 56 | 340662 | 14 0160S 0220E 023 | $200.00 | Gunnison |
| ALPHA 57 | 340663 | 14 0160S 0220E 023 | $200.00 | Gunnison |
| ALPHA 58 | 340664 | 14 0160S 0220E 023 | $200.00 | Gunnison |
| ALPHA 59 | 340665 | 14 0160S 0220E 023 | $200.00 | Gunnison |
| ALPHA 60 | 340666 | 14 0160S 0220E 023 | $200.00 | Gunnison |
| TALLSHIP 5-A | 341334 | 14 0160S 0220E 013 | $200.00 | Gunnison |
| TALLSHIP 7-A | 341335 | 14 0160S 0220E 013 | $200.00 | Gunnison |
| TALLSHIP 8-A | 341336 | 14 0160S 0220E 013 | $200.00 | Gunnison |
| TALLSHIP 9-A | 341337 | 14 0160S 0220E 012 | $200.00 | Gunnison |
| TALLSHIP 10-A | 341338 | 14 0160S 0220E 012 | $200.00 | Gunnison |
| TALLSHIP B-1 | 341339 | 14 0160S 0220E 012 | $200.00 | Gunnison |
| TALLSHIP B-2 | 341340 | 14 0160S 0220E 012 | $200.00 | Gunnison |
| TALLSHIP B-3 | 341341 | 14 0160S 0220E 012 | $200.00 | Gunnison |
| TALLSHIP B-4 | 341342 | 14 0160S 0220E 012 | $200.00 | Gunnison |
| TALLSHIP B-5 | 341343 | 14 0160S 0220E 012 | $200.00 | Gunnison |
| TALLSHIP B-6 | 341344 | 14 0160S 0220E 013 | $200.00 | Gunnison |
| TALLSHIP B-7 | 341345 | 14 0160S 0220E 013 | $200.00 | Gunnison |
| TALLSHIP B-8 | 351062 | 14 0160S 0220E 013 | $200.00 | Gunnison |
| TALLSHIP B-9 | 351063 | 14 0160S 0220E 013 | $200.00 | Gunnison |
| TALLSHIP B10 | 341968 | 14 0160S 0220E 013 | $200.00 | Gunnison |
| TALLSHIP #C-1 | 73414 | 14 0160S 0220E 013 | $200.00 | Gunnison |
| TALLSHIP #C-2 | 73415 | 14 0160S 0220E 024 | $200.00 | Gunnison |
| TALLSHIP #C-3 | 73416 | 14 0160S 0220E 013 | $200.00 | Gunnison |
| TALLSHIP #C-4 | 73417 | 14 0160S 0220E 024 | $200.00 | Gunnison |
| TALLSHIP #C-5 | 73418 | 14 0160S 0220E 013 | $200.00 | Gunnison |
| TALLSHIP #C-6 | 73419 | 14 0160S 0220E 024 | $200.00 | Gunnison |
| TALLSHIP #C-7 | 73420 | 14 0160S 0220E 013 | $200.00 | Gunnison |
| PROSPECT 1 | 341969 | 14 0150S 0220E 035 | $200.00 | Gunnison |
| PROSPECT 2 | 341970 | 14 0150S 0220E 035 | $200.00 | Gunnison |
| PROSPECT 3 | 341971 | 14 0150S 0220E 035 | $200.00 | Gunnison |
| PROSPECT 4 | 341972 | 14 0150S 0220E 035 | $200.00 | Gunnison |
| PROSPECT 5 | 341973 | 14 0150S 0220E 035 | $200.00 | Gunnison |
| PROSPECT 6 | 341974 | 14 0150S 0220E 035 | $200.00 | Gunnison |
| M3-PN210313.007 31 March 2026 Revision 0 |
GUNNISON PROJECT Form 43-101F1 Technical Report |
| Claim Name and Number | BLM Serial # (AMC #) | Township, Range, Section* | Maintenance Costs | Area |
| PROSPECT 7A | 341975 | 14 0150S 0220E 035 | $200.00 | Gunnison |
| PROSPECT 8A | 341976 | 14 0150S 0220E 035 | $200.00 | Gunnison |
| PROSPECT 9 | 341977 | 14 0150S 0220E 035 | $200.00 | Gunnison |
| TEX 1 | 341978 | 14 0150S 0230E 031 | $200.00 | Gunnison |
| TEX 2 | 341979 | 14 0160S 0220E 001 | $200.00 | Gunnison |
| TEX 3 | 341980 | 14 0150S 0230E 031 | $200.00 | Gunnison |
| TEX 4 | 341981 | 14 0160S 0230E 006 | $200.00 | Gunnison |
| TEX 5 | 341982 | 14 0150S 0230E 031 | $200.00 | Gunnison |
| TEX 6 | 341983 | 14 0160S 0230E 006 | $200.00 | Gunnison |
| TEX 7 | 341984 | 14 0150S 0230E 031 | $200.00 | Gunnison |
| TEX 8 | 341985 | 14 0160S 0230E 006 | $200.00 | Gunnison |
| TEX 9 | 341986 | 14 0150S 0230E 031 | $200.00 | Gunnison |
| TEX 10 | 341987 | 14 0160S 0230E 006 | $200.00 | Gunnison |
| TEX 11 | 341346 | 14 0150S 0230E 031 | $200.00 | Gunnison |
| TEX 12 | 341988 | 14 0160S 0230E 006 | $200.00 | Gunnison |
| TEX 13 | 341347 | 14 0160S 0230E 006 | $200.00 | Gunnison |
| TEX 14 | 341989 | 14 0160S 0230E 005 | $200.00 | Gunnison |
| TEX 15 | 341990 | 14 0160S 0220E 001 | $200.00 | Gunnison |
| TEX 16 | 341348 | 14 0160S 0220E 001 | $200.00 | Gunnison |
| TEX 17 | 341991 | 14 0160S 0230E 006 | $200.00 | Gunnison |
| TEX 18 | 341349 | 14 0160S 0230E 006 | $200.00 | Gunnison |
| TEX 19 | 341992 | 14 0160S 0230E 006 | $200.00 | Gunnison |
| TEX 20 | 341993 | 14 0160S 0230E 006 | $200.00 | Gunnison |
| TEX 21 | 341994 | 14 0160S 0230E 006 | $200.00 | Gunnison |
| TEX 22 | 341995 | 14 0160S 0230E 006 | $200.00 | Gunnison |
| TEX 23 | 341996 | 14 0160S 0230E 006 | $200.00 | Gunnison |
| TEX 24 | 341997 | 14 0160S 0230E 006 | $200.00 | Gunnison |
| TEX 25 | 341998 | 14 0160S 0230E 006 | $200.00 | Gunnison |
| TEX 26 | 341999 | 14 0160S 0230E 006 | $200.00 | Gunnison |
| TEX 27 | 342000 | 14 0160S 0230E 005 | $200.00 | Gunnison |
| TEX 28 | 342001 | 14 0160S 0230E 005 | $200.00 | Gunnison |
| TEX 29 | 341350 | 14 0160S 0230E 006 | $200.00 | Gunnison |
| TEX 30 | 341351 | 14 0150S 0230E 031 | $200.00 | Gunnison |
| NANA-1 | AZ105264914 | 14 0160S 0220E 026 | $200.00 | Gunnison |
| NANA-2 | AZ105264915 | 14 0160S 0220E 026 | $200.00 | Gunnison |
| NANA-3 | AZ105264916 | 14 0160S 0220E 026 | $200.00 | Gunnison |
| NANA-4 | AZ105264917 | 14 0160S 0220E 026 | $200.00 | Gunnison |
| NANA-5 | AZ105264918 | 14 0160S 0220E 026 | $200.00 | Gunnison |
| NANA-6 | AZ105264919 | 14 0160S 0220E 026 | $200.00 | Gunnison |
| NANA-7 | AZ105264920 | 14 0160S 0220E 026 | $200.00 | Gunnison |
| NANA-8 | AZ105264921 | 14 0160S 0220E 026 | $200.00 | Gunnison |
| NANA-9 | AZ105264922 | 14 0160S 0220E 026 | $200.00 | Gunnison |
| NANA-10 | AZ105264923 | 14 0160S 0220E 026 | $200.00 | Gunnison |
| NANA-11 | AZ105264924 | 14 0160S 0220E 026 | $200.00 | Gunnison |
| NANA-12 | AZ105264925 | 14 0160S 0220E 026 | $200.00 | Gunnison |
| NANA-13 | AZ105264926 | 14 0160S 0220E 026 | $200.00 | Gunnison |
| NANA-14 | AZ105264927 | 14 0160S 0220E 026 | $200.00 | Gunnison |
| NANA-15 | AZ105264928 | 14 0160S 0220E 026 | $200.00 | Gunnison |
| NANA-16 | AZ105264929 | 14 0160S 0220E 026 | $200.00 | Gunnison |
| NANA-17 | AZ105264930 | 14 0160S 0220E 026 | $200.00 | Gunnison |
| M3-PN210313.007 31 March 2026 Revision 0 |
GUNNISON PROJECT Form 43-101F1 Technical Report |
| Claim Name and Number | BLM Serial # (AMC #) | Township, Range, Section* | Maintenance Costs | Area |
| NANA-18 | AZ105264931 | 14 0160S 0220E 026 | $200.00 | Gunnison |
| NANA-19 | AZ105264932 | 14 0160S 0220E 026 | $200.00 | Gunnison |
| NANA-20 | AZ105264933 | 14 0160S 0220E 026 | $200.00 | Gunnison |
| Alpha Omega #64 | AMC 429559 | 14 0160S 0230E 004 | $200.00 | Gunnison |
| Alpha Omega #65 | AMC 429560 | 14 0160S 0230E 004 | $200.00 | Gunnison |
| Alpha Omega #76 | AMC 429561 | 14 0160S 0230E 004 | $200.00 | Gunnison |
| Alpha Omega # 77 | AMC 429562 | 14 0160S 0230E 004 | $200.00 | Gunnison |
| GUNNY 1 | AZ105789226 | 14 0160S 0230E 005 | $200.00 | Gunnison |
| GUNNY 2 | AZ105789227 | 14 0160S 0230E 005 | $200.00 | Gunnison |
| GUNNY 3 | AZ105789228 | 14 0160S 0230E 005 | $200.00 | Gunnison |
| GUNNY 4 | AZ105789229 | 14 0160S 0230E 005 | $200.00 | Gunnison |
| GUNNY 5 | AZ105789230 | 14 0160S 0230E 005 | $200.00 | Gunnison |
| GUNNY 6 | AZ105789231 | 14 0160S 0230E 005 | $200.00 | Gunnison |
| GUNNY 7 | AZ105789232 | 14 0160S 0230E 005 | $200.00 | Gunnison |
| GUNNY 8 | AZ105789233 | 14 0160S 0230E 005 | $200.00 | Gunnison |
| GUNNY 9 | AZ105789234 | 14 0160S 0230E 005 | $200.00 | Gunnison |
| GUNNY 10 | AZ105789235 | 14 0160S 0230E 005 | $200.00 | Gunnison |
| GUNNY 11 | AZ105789236 | 14 0160S 0230E 005 | $200.00 | Gunnison |
| GUNNY 12 | AZ105789237 | 14 0160S 0230E 005 | $200.00 | Gunnison |
| GUNNY 13 | AZ105789238 | 14 0160S 0230E 005 | $200.00 | Gunnison |
| GUNNY 14 | AZ105789239 | 14 0160S 0230E 005 | $200.00 | Gunnison |
| GUNNY 15 | AZ105789240 | 14 0160S 0230E 005 | $200.00 | Gunnison |
| GUNNY 16 | AZ105789241 | 14 0160S 0230E 005 | $200.00 | Gunnison |
| GUNNY 17 | AZ105789242 | 14 0160S 0230E 005 | $200.00 | Gunnison |
| GUNNY 18 | AZ105789243 | 14 0160S 0230E 005 | $200.00 | Gunnison |
| GUNNY 19 | AZ105789244 | 14 0160S 0230E 005 | $200.00 | Gunnison |
| GUNNY 20 | AZ105789244 | 14 0160S 0230E 005 | $200.00 | Gunnison |
| GUNNY 37 | AZ106782444 | 14 0150S 0220E 015 | $200.00 | Gunnison |
| GUNNY 38 | AZ106782445 | 14 0150S 0220E 015 | $200.00 | Gunnison |
| GUNNY 39 | AZ106782446 | 14 0150S 0220E 015 | $200.00 | Gunnison |
| GUNNY 40 | AZ106782447 | 14 0150S 0220E 015 | $200.00 | Gunnison |
| GUNNY 41 | AZ106782448 | 14 0150S 0220E 015 | $200.00 | Gunnison |
| GUNNY 42 | AZ106782449 | 14 0150S 0220E 015 | $200.00 | Gunnison |
| GUNNY 43 | AZ106782450 | 14 0150S 0220E 015 | $200.00 | Gunnison |
| GUNNY 44 | AZ106782451 | 14 0150S 0220E 015 | $200.00 | Gunnison |
| GUNNY 45 | AZ106782452 | 14 0150S 0220E 015 | $200.00 | Gunnison |
| GUNNY 46 | AZ106782453 | 14 0150S 0220E 015 | $200.00 | Gunnison |
| GUNNY 47 | AZ106782454 | 14 0150S 0220E 015 | $200.00 | Gunnison |
| GUNNY 48 | AZ106782455 | 14 0150S 0220E 015 | $200.00 | Gunnison |
| GUNNY 49 | AZ106782456 | 14 0150S 0220E 015 | $200.00 | Gunnison |
| GUNNY 50 | AZ106782457 | 14 0150S 0220E 015 | $200.00 | Gunnison |
| GUNNY 51 | AZ106782458 | 14 0150S 0220E 015 | $200.00 | Gunnison |
| GUNNY 52 | AZ106782459 | 14 0150S 0220E 015 | $200.00 | Gunnison |
| GUNNY 53 | AZ106782460 | 14 0150S 0220E 015 | $200.00 | Gunnison |
| GUNNY 54 | AZ106782461 | 14 0150S 0220E 015 | $200.00 | Gunnison |
| GUNNY 55 | AZ106782462 | 14 0150S 0220E 015 | $200.00 | Gunnison |
| GUNNY 56 | AZ106782463 | 14 0150S 0220E 015 | $200.00 | Gunnison |
| GUNNY 57 | AZ106782464 | 14 0150S 0220E 015 | $200.00 | Gunnison |
| GUNNY 58 | AZ106782465 | 14 0150S 0220E 022 | $200.00 | Gunnison |
| GUNNY 59 | AZ106782466 | 14 0150S 0220E 022 | $200.00 | Gunnison |
| M3-PN210313.007 31 March 2026 Revision 0 |
GUNNISON PROJECT Form 43-101F1 Technical Report |
| Claim Name and Number | BLM Serial # (AMC #) | Township, Range, Section* | Maintenance Costs | Area |
| GUNNY 60 | AZ106782467 | 14 0150S 0220E 022 | $200.00 | Gunnison |
| GUNNY 61 | AZ106782468 | 14 0150S 0220E 022 | $200.00 | Gunnison |
| GUNNY 62 | AZ106782469 | 14 0150S 0220E 022 | $200.00 | Gunnison |
| GUNNY 63 | AZ106782470 | 14 0150S 0220E 022 | $200.00 | Gunnison |
| GUNNY 64 | AZ106782471 | 14 0150S 0220E 022 | $200.00 | Gunnison |
| GUNNY 65 | AZ106782472 | 14 0150S 0220E 022 | $200.00 | Gunnison |
| GUNNY 66 | AZ106782473 | 14 0150S 0220E 022 | $200.00 | Gunnison |
| GUNNY 67 | AZ106782474 | 14 0150S 0220E 022 | $200.00 | Gunnison |
| GUNNY 68 | AZ106782475 | 14 0150S 0220E 022 | $200.00 | Gunnison |
| GUNNY 69 | AZ106782476 | 14 0150S 0220E 022 | $200.00 | Gunnison |
| GUNNY 70 | AZ106782477 | 14 0150S 0220E 022 | $200.00 | Gunnison |
| GUNNY 71 | AZ106782478 | 14 0150S 0220E 022 | $200.00 | Gunnison |
| GUNNY 72 | AZ106782479 | 14 0150S 0220E 027 | $200.00 | Gunnison |
| GUNNY 73 | AZ106782480 | 14 0150S 0220E 022 | $200.00 | Gunnison |
| GUNNY 74 | AZ106782481 | 14 0150S 0220E 027 | $200.00 | Gunnison |
| GUNNY 75 | AZ106782482 | 14 0150S 0220E 022 | $200.00 | Gunnison |
| GUNNY 76 | AZ106782483 | 14 0150S 0220E 027 | $200.00 | Gunnison |
| GUNNY 78 | AZ106782484 | 14 0150S 0220E 027 | $200.00 | Gunnison |
| GUNNY 79 | TBD | 14 0160S 0230E | $200.00 | Gunnison |
| GUNNY 80 | TBD | 14 0160S 0230E | $200.00 | Gunnison |
| GUNNY 81 | TBD | 14 0160S 0230E | $200.00 | Gunnison |
| GUNNY 82 | TBD | 14 0160S 0230E | $200.00 | Gunnison |
| GUNNY 83 | TBD | 14 0160S 0230E | $200.00 | Gunnison |
| GUNNY 84 | TBD | 14 0160S 0230E | $200.00 | Gunnison |
| GUNNY 85 | TBD | 14 0160S 0230E | $200.00 | Gunnison |
| GUNNY 86 | TBD | 14 0160S 0230E | $200.00 | Gunnison |
| GUNNY 87 | TBD | 14 0160S 0230E | $200.00 | Gunnison |
| GUNNY 88 | TBD | 14 0160S 0230E | $200.00 | Gunnison |
| GUNNY 89 | TBD | 14 0160S 0230E | $200.00 | Gunnison |
| GUNNY 90 | TBD | 14 0160S 0230E | $200.00 | Gunnison |
| GUNNY 91 | TBD | 14 0160S 0230E | $200.00 | Gunnison |
| GUNNY 92 | TBD | 14 0160S 0230E | $200.00 | Gunnison |
| GUNNY 93 | TBD | 14 0160S 0230E | $200.00 | Gunnison |
| GUNNY 94 | TBD | 14 0160S 0230E | $200.00 | Gunnison |
| GUNNY 95 | TBD | 14 0160S 0230E | $200.00 | Gunnison |
| GUNNY 96 | TBD | 14 0160S 0230E | $200.00 | Gunnison |
| GUNNY 97 | TBD | 14 0160S 0230E | $200.00 | Gunnison |
| GUNNY 98 | TBD | 14 0160S 0230E | $200.00 | Gunnison |
| GUNNY 99 | TBD | 14 0160S 0230E | $200.00 | Gunnison |
| GUNNY 100 | TBD | 14 0160S 0230E | $200.00 | Gunnison |
| GUNNY 101 | TBD | 14 0160S 0230E | $200.00 | Gunnison |
| GUNNY 102 | TBD | 14 0160S 0230E | $200.00 | Gunnison |
| GUNNY 103 | TBD | 14 0160S 0230E | $200.00 | Gunnison |
| GUNNY 104 | TBD | 14 0160S 0230E | $200.00 | Gunnison |
| GUNNY 105 | TBD | 14 0160S 0230E | $200.00 | Gunnison |
| GUNNY 106 | TBD | 14 0160S 0230E | $200.00 | Gunnison |
| GUNNY 107 | TBD | 14 0160S 0230E | $200.00 | Gunnison |
| GUNNY 108 | TBD | 14 0160S 0230E | $200.00 | Gunnison |
| GUNNY 109 | TBD | 14 0160S 0230E | $200.00 | Gunnison |
| GUNNY 110 | TBD | 14 0160S 0230E | $200.00 | Gunnison |
| M3-PN210313.007 31 March 2026 Revision 0 |
GUNNISON PROJECT Form 43-101F1 Technical Report |
| Claim Name and Number | BLM Serial # (AMC #) | Township, Range, Section* | Maintenance Costs | Area |
| GUNNY 111 | TBD | 14 0160S 0230E | $200.00 | Gunnison |
| GUNNY 112 | TBD | 14 0160S 0230E | $200.00 | Gunnison |
| GUNNY 113 | TBD | 14 0160S 0230E | $200.00 | Gunnison |
| GUNNY 114 | TBD | 14 0160S 0230E | $200.00 | Gunnison |
| GUNNY 115 | TBD | 14 0160S 0230E | $200.00 | Gunnison |
| GUNNY 116 | TBD | 14 0160S 0230E | $200.00 | Gunnison |
| GUNNY 117 | TBD | 14 0160S 0230E | $200.00 | Gunnison |
| GUNNY 118 | TBD | 14 0160S 0230E | $200.00 | Gunnison |
| GUNNY 119 | TBD | 14 0160S 0230E | $200.00 | Gunnison |
| GUNNY 120 | TBD | 14 0160S 0230E | $200.00 | Gunnison |
| GUNNY 121 | TBD | 14 0160S 0230E | $200.00 | Gunnison |
| GUNNY 122 | TBD | 14 0160S 0230E | $200.00 | Gunnison |
| GUNNY 123 | TBD | 14 0160S 0230E | $200.00 | Gunnison |
| GUNNY 124 | TBD | 14 0160S 0230E | $200.00 | Gunnison |
| GUNNY 125 | TBD | 14 0160S 0230E | $200.00 | Gunnison |
| GUNNY 126 | TBD | 14 0160S 0230E | $200.00 | Gunnison |
| GUNNY 127 | TBD | 14 0160S 0230E | $200.00 | Gunnison |
| GUNNY 128 | TBD | 14 0160S 0230E | $200.00 | Gunnison |
| GUNNY 129 | TBD | 14 0160S 0230E | $200.00 | Gunnison |
| GUNNY 130 | TBD | 14 0160S 0230E | $200.00 | Gunnison |
| GUNNY 131 | TBD | 14 0160S 0230E | $200.00 | Gunnison |
| GUNNY 132 | TBD | 14 0160S 0230E | $200.00 | Gunnison |
| GUNNY 133 | TBD | 14 0160S 0230E | $200.00 | Gunnison |
| GUNNY 134 | TBD | 14 0160S 0230E | $200.00 | Gunnison |
| GUNNY 135 | TBD | 14 0160S 0230E | $200.00 | Gunnison |
| GUNNY 136 | TBD | 14 0160S 0230E | $200.00 | Gunnison |
| GUNNY 137 | TBD | 14 0160S 0230E | $200.00 | Gunnison |
| GUNNY 138 | TBD | 14 0160S 0230E | $200.00 | Gunnison |
| GUNNY 139 | TBD | 14 0160S 0230E | $200.00 | Gunnison |
| GUNNY 140 | TBD | 14 0160S 0230E | $200.00 | Gunnison |
| GUNNY 141 | TBD | 14 0160S 0230E | $200.00 | Gunnison |
| GUNNY 142 | TBD | 14 0160S 0230E | $200.00 | Gunnison |
| GUNNY 143 | TBD | 14 0160S 0230E | $200.00 | Gunnison |
| GUNNY 144 | TBD | 14 0160S 0230E | $200.00 | Gunnison |
| GUNNY 145 | TBD | 14 0160S 0230E | $200.00 | Gunnison |
| GUNNY 146 | TBD | 14 0160S 0230E | $200.00 | Gunnison |
| GUNNY 147 | TBD | 14 0160S 0230E | $200.00 | Gunnison |
| CHARLES | 403687 | 14 0150S 0220E 036 | $200.00 | Gunnison |
| DORA | 403691 | 14 0150S 0220E 036 | $200.00 | Gunnison |
| ELLA | 403697 | 14 0150S 0220E 036 | $200.00 | Gunnison |
| ERNEST | 403700 | 14 0150S 0220E 036 | $200.00 | Gunnison |
| GUSTAVE | 403703 | 14 0150S 0220E 036 | $200.00 | Gunnison |
| INA | 403706 | 14 0150S 0220E 036 | $200.00 | Gunnison |
| LOUIE | 403717 | 14 0150S 0220E 036 | $200.00 | Gunnison |
| MARY | 403718 | 14 0150S 0220E 036 | $200.00 | Gunnison |
| ULTIMO | 403744 | 14 0150S 0220E 036 | $200.00 | Gunnison |
| WOLFRIME | 403745 | 14 0150S 0220E 036 | $200.00 | Gunnison |
| J SULLY #6 | 408909 | 14 0150S 0220E 036 | $200.00 | Gunnison |
| J SULLY #8 | 408911 | 14 0150S 0220E 036 | $200.00 | Gunnison |
| J SULLY #11 | 408914 | 14 0150S 0220E 036 | $200.00 | Gunnison |
| M3-PN210313.007 31 March 2026 Revision 0 |
GUNNISON PROJECT Form 43-101F1 Technical Report |
| Claim Name and Number | BLM Serial # (AMC #) | Township, Range, Section* | Maintenance Costs | Area |
| J SULLY #12 | 408915 | 14 0150S 0220E 036 | $200.00 | Gunnison |
| J SULLY #13 | 408916 | 14 0150S 0220E 036 | $200.00 | Gunnison |
| J SULLY #16 | 408919 | 14 0150S 0220E 036 | $200.00 | Gunnison |
| BEE R2 | 403669 | 14 0150S 0220E 024 | $200.00 | Strong and Harris |
| BEE R1 | 403670 | 14 0150S 0220E 024 | $200.00 | Strong and Harris |
| BEE R3 | 403671 | 14 0150S 0220E 024 | $200.00 | Strong and Harris |
| BEE R4 | 403672 | 14 0150S 0220E 024 | $200.00 | Strong and Harris |
| BEE R5 | 403673 | 14 0150S 0220E 024 | $200.00 | Strong and Harris |
| BEE R11 | 403674 | 14 0150S 0220E 024 | $200.00 | Strong and Harris |
| BEE R12 | 403675 | 14 0150S 0220E 024 | $200.00 | Strong and Harris |
| BUMBLE BEE | 403677 | 14 0150S 0220E 023 | $200.00 | Strong and Harris |
| E-5 FRACTION | 403692 | 14 0150S 0220E 013 | $200.00 | Strong and Harris |
| ECHO NO 1 | 403693 | 14 0150S 0220E 024 | $200.00 | Strong and Harris |
| ECHO R2 | 403694 | 14 0150S 0220E 024 | $200.00 | Strong and Harris |
| ECHO R3 | 403695 | 14 0150S 0220E 024 | $200.00 | Strong and Harris |
| ELEPHANT | 403696 | 14 0150S 0220E 023 | $200.00 | Strong and Harris |
| LAURA J | 403711 | 14 0150S 0220E 024 | $200.00 | Strong and Harris |
| PORTLAND | 403728 | 14 0150S 0220E 023 | $200.00 | Strong and Harris |
| PRIMROSE | 403729 | 14 0150S 0220E 023 | $200.00 | Strong and Harris |
| PRIMROSE BEE | 403730 | 14 0150S 0220E 023 | $200.00 | Strong and Harris |
| S-10 | 403732 | 14 0150S 0220E 023 | $200.00 | Strong and Harris |
| S-12 | 403733 | 14 0150S 0220E 023 | $200.00 | Strong and Harris |
| S-14 | 403734 | 14 0150S 0220E 023 | $200.00 | Strong and Harris |
| S-16 | 403735 | 14 0150S 0220E 023 | $200.00 | Strong and Harris |
| S-18 | 403736 | 14 0150S 0220E 023 | $200.00 | Strong and Harris |
| S-26 | 403737 | 14 0150S 0220E 024 | $200.00 | Strong and Harris |
| S-28 | 403738 | 14 0150S 0220E 024 | $200.00 | Strong and Harris |
| S-30 | 403739 | 14 0150S 0220E 024 | $200.00 | Strong and Harris |
| S-32 | 403740 | 14 0150S 0220E 024 | $200.00 | Strong and Harris |
| S-34 | 403741 | 14 0150S 0220E 024 | $200.00 | Strong and Harris |
| ASHLEY | 416211 | 14 0150S 0220E 024 | $200.00 | Strong and Harris |
| J-TRAVASSOS | 416212 | 14 0150S 0220E 024 | $200.00 | Strong and Harris |
| N-TRAVASSOS | 416213 | 14 0150S 0220E 024 | $200.00 | Strong and Harris |
| SUMMERTIME | 416214 | 14 0150S 0220E 023 | $200.00 | Strong and Harris |
| SUNSET | 416215 | 14 0150S 0220E 023 | $200.00 | Strong and Harris |
| T-ACKEN | 416216 | 14 0150S 0220E 024 | $200.00 | Strong and Harris |
| WILDFIRE | 416217 | 14 0150S 0220E 023 | $200.00 | Strong and Harris |
| BIRD DOG 1 | AMC451034 | 14 0150S 0220E 014 | $200.00 | Strong and Harris |
| BIRD DOG 2 | AMC451035 | 14 0150S 0220E 014 | $200.00 | Strong and Harris |
| BIRD DOG 3 | AMC451036 | 14 0150S 0220E 014 | $200.00 | Strong and Harris |
| BIRD DOG 4 | AMC451037 | 14 0150S 0220E 014 | $200.00 | Strong and Harris |
| BIRD DOG 5 | AMC451038 | 14 0150S 0220E 014 | $200.00 | Strong and Harris |
| BIRD DOG 6 | AMC451039 | 14 0150S 0220E 014 | $200.00 | Strong and Harris |
| BIRD DOG 7 | AMC451040 | 14 0150S 0220E 014 | $200.00 | Strong and Harris |
| BIRD DOG 8 | AMC451041 | 14 0150S 0220E 014 | $200.00 | Strong and Harris |
| BIRD DOG 9 | AMC451042 | 14 0150S 0220E 014 | $200.00 | Strong and Harris |
| BIRD DOG 10 | AMC451043 | 14 0150S 0220E 014 | $200.00 | Strong and Harris |
| M3-PN210313.007 31 March 2026 Revision 0 |
GUNNISON PROJECT Form 43-101F1 Technical Report |
| Claim Name and Number | BLM Serial # (AMC #) | Township, Range, Section* | Maintenance Costs | Area |
| BIRD DOG 11 | AMC451044 | 14 0150S 0220E 013 | $200.00 | Strong and Harris |
| BIRD DOG 12 | AMC451045 | 14 0150S 0220E 013 | $200.00 | Strong and Harris |
| BIRD DOG 13 | AMC451046 | 14 0150S 0220E 013 | $200.00 | Strong and Harris |
| BIRD DOG 14 | AMC451047 | 14 0150S 0220E 013 | $200.00 | Strong and Harris |
| BIRD DOG 15 | AMC451048 | 14 0150S 0220E 013 | $200.00 | Strong and Harris |
| BIRD DOG 16 | AMC451049 | 14 0150S 0220E 013 | $200.00 | Strong and Harris |
| BIRD DOG 17 | AMC451050 | 14 0150S 0220E 013 | $200.00 | Strong and Harris |
| BIRD DOG 18 | AMC451051 | 14 0150S 0220E 013 | $200.00 | Strong and Harris |
| BIRD DOG 19 | AMC451052 | 14 0150S 0220E 013 | $200.00 | Strong and Harris |
| BIRD DOG 20 | AMC451053 | 14 0150S 0220E 014 | $200.00 | Strong and Harris |
| BIRD DOG 21 | AMC451054 | 14 0150S 0220E 014 | $200.00 | Strong and Harris |
| BIRD DOG 22 | AMC451055 | 14 0150S 0220E 014 | $200.00 | Strong and Harris |
| BIRD DOG 23 | AMC451056 | 14 0150S 0220E 014 | $200.00 | Strong and Harris |
| BIRD DOG 24 | AMC451057 | 14 0150S 0220E 014 | $200.00 | Strong and Harris |
| BIRD DOG 25 | AMC451058 | 14 0150S 0220E 014 | $200.00 | Strong and Harris |
| BIRD DOG 26 | AMC451059 | 14 0150S 0220E 013 | $200.00 | Strong and Harris |
| BIRD DOG 27 | AMC451060 | 14 0150S 0220E 013 | $200.00 | Strong and Harris |
| BIRD DOG 28 | AMC451061 | 14 0150S 0220E 013 | $200.00 | Strong and Harris |
| BIRD DOG 29 | AMC451062 | 14 0150S 0220E 013 | $200.00 | Strong and Harris |
| BIRD DOG 30 | AMC451063 | 14 0150S 0220E 013 | $200.00 | Strong and Harris |
| BIRD DOG 31 | AMC451064 | 14 0150S 0220E 013 | $200.00 | Strong and Harris |
| BIRD DOG 32 | AMC451065 | 14 0150S 0220E 014 | $200.00 | Strong and Harris |
| BIRD DOG 33 | AMC451066 | 14 0150S 0220E 014 | $200.00 | Strong and Harris |
| BIRD DOG 34 | AMC451067 | 14 0150S 0220E 014 | $200.00 | Strong and Harris |
| BIRD DOG 35 | AMC451068 | 14 0150S 0220E 014 | $200.00 | Strong and Harris |
| BIRD DOG 36 | AMC451069 | 14 0150S 0220E 014 | $200.00 | Strong and Harris |
| BIRD DOG 37 | AMC451070 | 14 0150S 0220E 014 | $200.00 | Strong and Harris |
| BIRD DOG 38 | AMC451071 | 14 0150S 0220E 013 | $200.00 | Strong and Harris |
| BIRD DOG 39 | AMC451072 | 14 0150S 0220E 013 | $200.00 | Strong and Harris |
| BIRD DOG 40 | AMC451073 | 14 0150S 0220E 013 | $200.00 | Strong and Harris |
| BIRD DOG 41 | AMC451074 | 14 0150S 0220E 013 | $200.00 | Strong and Harris |
| BIRD DOG 42 | AMC451075 | 14 0150S 0220E 013 | $200.00 | Strong and Harris |
| BIRD DOG 43 | AMC451076 | 14 0150S 0220E 013 | $200.00 | Strong and Harris |
| BIRD DOG 44 | AMC451077 | 14 0150S 0220E 014 | $200.00 | Strong and Harris |
| BIRD DOG 45 | AMC451078 | 14 0150S 0220E 014 | $200.00 | Strong and Harris |
| BIRD DOG 46 | AMC451079 | 14 0150S 0220E 014 | $200.00 | Strong and Harris |
| BIRD DOG 47 | AMC451080 | 14 0150S 0220E 014 | $200.00 | Strong and Harris |
| BIRD DOG 48 | AMC451081 | 14 0150S 0220E 014 | $200.00 | Strong and Harris |
| BIRD DOG 49 | AMC451082 | 14 0150S 0220E 013 | $200.00 | Strong and Harris |
| BIRD DOG 50 | AMC451083 | 14 0150S 0220E 013 | $200.00 | Strong and Harris |
| BIRD DOG 51 | AMC451084 | 14 0150S 0220E 013 | $200.00 | Strong and Harris |
| BIRD DOG 52 | AMC451085 | 14 0150S 0220E 013 | $200.00 | Strong and Harris |
| BIRD DOG 53 | AMC451086 | 14 0150S 0220E 013 | $200.00 | Strong and Harris |
| BIRD DOG 54 | AMC451087 | 14 0150S 0220E 013 | $200.00 | Strong and Harris |
| SURPRISE NO 1 | AMC452780 | 14 0150S 0220E 014 | $200.00 | Strong and Harris |
| SURPRISE NO 3 | AMC452781 | 14 0150S 0220E 014 | $200.00 | Strong and Harris |
| SURPRISE NO 5 | AMC452782 | 14 0150S 0220E 014 | $200.00 | Strong and Harris |
| M3-PN210313.007 31 March 2026 Revision 0 |
GUNNISON PROJECT Form 43-101F1 Technical Report |
| Claim Name and Number | BLM Serial # (AMC #) | Township, Range, Section* | Maintenance Costs | Area |
| SURPRISE NO 7 | AMC452783 | 14 0150S 0220E 014 | $200.00 | Strong and Harris |
| SURPRISE NO 9 | AMC452784 | 14 0150S 0220E 014 | $200.00 | Strong and Harris |
| SURPRISE NO 19 | AMC452785 | 14 0150S 0220E 013 | $200.00 | Strong and Harris |
| SURPRISE NO 21 | AMC452786 | 14 0150S 0220E 013 | $200.00 | Strong and Harris |
| SURPRISE NO 22 | AMC452787 | 14 0150S 0220E 013 | $200.00 | Strong and Harris |
| SURPRISE NO 23 | AMC452788 | 14 0150S 0220E 013 | $200.00 | Strong and Harris |
| SURPRISE NO 37 | AMC452789 | 14 0150S 0220E 014 | $200.00 | Strong and Harris |
| SURPRISE NO 38 | AMC452790 | 14 0150S 0220E 014 | $200.00 | Strong and Harris |
| SURPRISE NO 39 | AMC452791 | 14 0150S 0220E 014 | $200.00 | Strong and Harris |
| SURPRISE NO 40 | AMC452792 | 14 0150S 0220E 014 | $200.00 | Strong and Harris |
| SURPRISE NO 46 | AMC452793 | 14 0150S 0220E 013 | $200.00 | Strong and Harris |
| SURPRISE NO 47 | AMC452794 | 14 0150S 0220E 013 | $200.00 | Strong and Harris |
| SURPRISE NO 48 | AMC452795 | 14 0150S 0220E 013 | $200.00 | Strong and Harris |
| SURPRISE NO 55 | AMC452796 | 14 0150S 0220E 014 | $200.00 | Strong and Harris |
| SURPRISE NO 56 | AMC452797 | 14 0150S 0220E 014 | $200.00 | Strong and Harris |
| SURPRISE NO 57 | AMC452798 | 14 0150S 0220E 014 | $200.00 | Strong and Harris |
| SURPRISE NO 58 | AMC452799 | 14 0150S 0220E 014 | $200.00 | Strong and Harris |
| SURPRISE NO 64 | AMC452800 | 14 0150S 0220E 013 | $200.00 | Strong and Harris |
| SURPRISE NO 65 | AMC452801 | 14 0150S 0220E 013 | $200.00 | Strong and Harris |
| SURPRISE NO 66 | AMC452802 | 14 0150S 0220E 013 | $200.00 | Strong and Harris |
| *Some claims may extend into adjacent Townships, Ranges or Sections | ||||
| ANNUAL COST | TOTAL # OF CLAIMS | |||
| TOAL GUNNISON CLAIMS | $81,800.00 | 409 | ||
| M3-PN210313.007 31 March 2026 Revision 0 |
GUNNISON PROJECT Form 43-101F1 Technical Report |
State Permits
| Permit No. | 1st Year | 2nd Year | 3rd Year | 4th Year | 5th Year |
08-121961 Sec. 18 |
Rent: None App. Fee: $500 Exp: $2,790.10 Due: 4/4/2022 |
Rent: $279.01 App. Fee: $500 Exp: $2,790.10 Due: 4/4/2023 |
Rent: $279.01 App. Fee: $500 Exp: $5,580.20 Due: 4/4/2024 |
Rent: $279.01 App. Fee: $500 Exp: $5,580.20 Due: 4/4/2025 |
Rent: $279.01 App. Fee: $500 Exp: $5,580.20 Due: 4/4/2026 |
08-121966 Sec. 5 |
Rent: None App. Fee: $500 Exp: $3,193.90 Due: 4/4/2022 |
Rent: $319.39 App. Fee: $500 Exp: $3,193.90 Due: 4/4/2023 |
Rent: $319.39 App. Fee: $500 Exp: $6,387.80 Due: 4/4/2024 |
Rent: $319.39 App. Fee: $500 Exp: $6,387.80 Due: 4/4/2025 |
Rent: $319.39 App. Fee: $500 Exp: $6,387.80 Due: 4/4/2026 |
08-121965 Sec. 25 |
Rent: None App. Fee: $500 Exp: $400.00 Due: 4/4/2022 |
Rent: $40.00 App. Fee: $500 Exp: $400.00 Due: 4/4/2023 |
Rent: $40.00 App. Fee: $500 Exp: $800.00 Due: 4/4/2024 |
Rent: $40.00 App. Fee: $500 Exp: $800.00 Due: 4/4/2025 |
Rent: $40.00 App. Fee: $500 Exp: $800.00 Due: 4/4/2026 |
08-122663 Sec. 29 |
Rent: None App. Fee: $500 Exp: $6,400.00 Due: 11/3/22 |
Rent: $640.00 App. Fee: $500 Exp: $6,400.00 Due: 11/3/23 |
Rent: $640.00 App. Fee: $500 Exp: $12,800.00 Due: 11/3/24 |
Rent: $640.00 App. Fee: $500 Exp: $12,800.00 Due: 11/3/25 |
Rent: $640.00 App. Fee: $500 Exp: $12,800.00 Due: 11/3/26 |
08-122662 Sec. 8 |
Rent: None App. Fee: $500 Exp: $6,400.00 Due: 11/3/22 |
Rent: $640.00 App. Fee: $500 Exp: $6,400.00 Due: 11/3/23 |
Rent: $640.00 App. Fee: $500 Exp: $12,800.00 Due: 11/3/24 |
Rent: $640.00 App. Fee: $500 Exp: $12,800.00 Due: 11/3/25 |
Rent: $640.00 App. Fee: $500 Exp: $12,800.00 Due: 11/3/26 |
08-122661 Sec. 17 |
Rent: None App. Fee: $500 Exp: $6,400.00 Due: 11/3/22 |
Rent: $640.00 App. Fee: $500 Exp: $6,400.00 Due: 11/3/23 |
Rent: $640.00 App. Fee: $500 Exp: $12,800.00 Due: 11/3/24 |
Rent: $640.00 App. Fee: $500 Exp: $12,800.00 Due: 11/3/25 |
Rent: $640.00 App. Fee: $500 Exp: $12,800.00 Due: 11/3/26 |
08-122660 Sec. 32 |
Rent: None App. Fee: $500 Exp: $6,400.00 Due: 11/3/22 |
Rent: $640.00 App. Fee: $500 Exp: $6,400.00 Due: 11/3/23 |
Rent: $640.00 App. Fee: $500 Exp: $12,800.00 Due: 11/3/24 |
Rent: $640.00 App. Fee: $500 Exp: $12,800.00 Due: 11/3/25 |
Rent: $640.00 App. Fee: $500 Exp: $12,800.00 Due: 11/3/26 |
008-126240 Sec. 10 |
Rent: None App Fee: $500 Exp: $2,000.00 Due: 12/17/2026 |
Rent: $200.00 App Fee: $500 Exp: $2,000.00 Due: 12/17/2027 |
Rent: $200.00 App Fee: $500 Exp:$4,000.00 Due: 12/17/2028 |
Rent: $200.00 App Fee: $500 Exp: $4,000.00 Due: 12/17/2029 | Rent: $200.00 App Fee: $500 Exp: $4,000.00 Due: 12/17/2030 |
008-126241 Sec. 20 |
Rent: None App Fee: $500 Exp: $5,400.00 Due: 12/17/2026 |
Rent: $540 App Fee: $500 Exp: $5,400.00 Due: 12/17/2027 |
Rent: $540 App Fee: $500 Exp: $10,800.00 Due: 12/17/2028 |
Rent: $540 App Fee: $500 Exp: $10,800.00 Due: 12/17/2029 |
Rent: $540 App Fee: $500 Exp: $10,800.00 Due: 12/17/2030 |
08-122071 Sec. 33 |
Rent: None App Fee: $500 Exp: $6,400.00 Due: 5/23/2022 |
Rent: $640.00 App Fee: $500 Exp: $6,400.00 Due: 5/23/2023 |
Rent: $640.00 App Fee: $500 Exp: $12,800.00 Due: 5/23/2024 |
Rent: $640.00 App Fee: $500 Exp: $12,800.00 Due: 5/23/2025 |
Rent: $640.00 App Fee: $500 Exp: $12,800.00 Due: 5/23/2026 |
08-122072 Sec. 34 |
Rent: None App Fee: $500 Exp: $6,400.00 Due: 5/23/2022 |
Rent: $640.00 App Fee: $500 Exp: $6,400.00 Due: 5/23/2023 |
Rent: $640.00 App Fee: $500 Exp: $12,800.00 Due: 5/23/2024 |
Rent: $640.00 App Fee: $500 Exp: $12,800.00 Due: 5/23/2025 |
Rent: $640.00 App Fee: $500 Exp: $12,800.00 Due: 5/23/2026 |
08-122253 Sec. 2 |
Rent: None App Fee: $500 Exp: $4,980.20 Due: 6/27/2022 |
Rent: $498.02 App Fee: $500 Exp: $4,980.20 Due: 6/27/2023 |
Rent: $498.02 App Fee: $500 Exp: $9,960.40 Due: 6/27/2024 |
Rent: $498.02 App Fee: $500 Exp: $9,960.40 Due: 6/27/2025 |
Rent: $498.02 App Fee: $500 Exp: $9,960.40 Due: 6/27/2026 |
08-122443 Sec. 26 |
Rent: None App Fee: $500 | Rent: $280.00 App Fee: $500 | Rent: $280.00 App Fee: $500 | Rent: $280.00 App Fee: $500 | Rent: $280.00 App Fee: $500 |
| M3-PN210313.007 31 March 2026 Revision 0 |
GUNNISON PROJECT Form 43-101F1 Technical Report |
| Permit No. | 1st Year | 2nd Year | 3rd Year | 4th Year | 5th Year |
Exp: $2,800 Due: 8/29/2022 |
Exp: $2,800 Due: 8/29/2023 |
Exp: $5,600 Due: 8/29/2024 |
Exp: $5,600 Due: 8/29/25 |
Exp: $5,600 Due: 8/29/26 | |
|
08-125406 Sec. 16 |
Rent: None App Fee: $500 Exp: $6,400.00 Due: 4/7/2026 |
Rent: $640.00 App Fee: $500 Exp: $6,400.00 Due: 4/7/2027 |
Rent: $640.00 App Fee: $500 Exp: $12,800.00 Due: 4/7/2028 |
Rent: $640.00 App Fee: $500 Exp: $12,800.00 Due: 4/7/2029 |
Rent: $640.00 App Fee: $500 Exp: $12,800.00 Due:4/7/2030 |
008-126572 Sec. 7 |
Rent: None App Fee: $500 Exp: $4,557.30 Due: 2027 |
Rent: $455.73 App Fee: $500 Exp: $4,557.30 Due: 2028 |
Rent: $455.73 App Fee: $500 Exp: $9,114.60 Due: 2029 |
Rent: $455.73 App Fee: $500 Exp: $9,114.60 Due: 2030 |
Rent: $455.73 App Fee: $500 Exp: $9,114.60 Due:2031 |
008-126239 Sec. 2 |
Rent: None App Fee: $500 Exp: $6,401.60 Due: 2027 |
Rent: $640.16 App Fee: $500 Exp: $6,401.60 Due: 2028 |
Rent: $640.16 App Fee: $500 Exp: $12,803.20 Due: 2029 |
Rent: $640.16 App Fee: $500 Exp: $12,803.20 Due: 2030 |
Rent: $640.16 App Fee: $500 Exp: $12,803.20 Due: 2031 |
008-126548 Sec. 33 |
Rent: None App Fee: $500 Exp: $6,400.00 Due: 2027 |
Rent: $640.00 App Fee: $500 Exp: $6,400.00 Due: 2028 |
Rent: $640.00 App Fee: $500 Exp: $12,800.00 Due: 2029 |
Rent: $640.00 App Fee: $500 Exp: $12,800.00 Due: 2030 |
Rent: $640.00 App Fee: $500 Exp: $12,800.00 Due: 2031 |
008-126550 Sec. 3 |
Rent: None App Fee: $500 Exp: $3,161.70 Due: 2027 |
Rent: $316.17 App Fee: $500 Exp: $3,161.70 Due: 2028 |
Rent: $316.17 App Fee: $500 Exp: $6,323.40 Due: 2029 |
Rent: $316.17 App Fee: $500 Exp: $6,323.40 Due: 2030 |
Rent: $316.17 App Fee: $500 Exp: $6,323.40 Due: 2031 |
008-126549 Sec. 4 |
Rent: None App Fee: $500 Exp: $3,173.60 Due: 2027 |
Rent: $317.36 App Fee: $500 Exp: $3,173.60 Due:2028 |
Rent: $317.36 App Fee: $500 Exp: $6,347.20 Due: 2029 |
Rent: $317.36 App Fee: $500 Exp: $6,347.20 Due: 2030 |
Rent: $317.36 App Fee: $500 Exp: $6,347.20 Due:2031 |
008-126551 Sec. 10 |
Rent: None App Fee: $500 Exp: $6,400.00 Due: 2027 |
Rent: $640.00 App Fee: $500 Exp: $6,400.00 Due: 2028 |
Rent: $640.00 App Fee: $500 Exp: $12,800.00 Due: 2029 |
Rent: $640.00 App Fee: $500 Exp: $12,800.00 Due: 2030 |
Rent: $640.00 App Fee: $500 Exp: $12,800.00 Due: 2031 |
State Mineral Lease
Permit Number 11-53946 Sec. 36 Rent: $11,964.75 Minimum Royalty: $6,381.20 Due: June 16 each year
Lease expires 6-15-2034
Connie Johnson Deed
All mines and minerals in and under Section 31, Township 15 South, Range 23 East, Gila and Salt River Base and Meridian, containing 615.52 acres, more or less; together with the power to take all usual, necessary or convenient means for working, getting, laying up, dressing, making merchantable, and taking away the said mines and minerals, and also for the above purposes, or for any other purposes whatsoever, to make and repair tunnels and sewers, and to lay and repair pipes for conveying water to and from any manufactory or other building as reserved in that certain Warranty Deed from Hetty Wilson Johnson (formerly Hetty G. Wilson) and Conner Johnson, her husband, to Tom Adams and Lizzie E, Adams, husband and wife, dated May 19, 1943, and recorded at Book 136 Deeds of Real Estate, pages 123, 124 in the Office of the Cochise County, Arizona Recorder.
| M3-PN210313.007 31 March 2026 Revision 0 |
GUNNISON PROJECT Form 43-101F1 Technical Report |
Fee Simple Land
The mineral rights and other interests in the following parcels located in Cochise County, Arizona, as more specifically described in Exhibit A to the Option:
Parcel A: The mineral estate only in approximately 39.06 acres of land in Section 19, T. 16 S., R. 23 E. and Sections 24 and 25, T. 16 S., R 22 E.
Parcel D: The property in approximately 14.24 acres of land in Section 19, T. 16 S., R. 23 E. and Section 25, T. 16 S., R 22 E.
Parcel E: The property in approximately 4.28 acres of land in Section 19, T. 16 S., R. 23 E.
Parcel F: The property in approximately 15.29 acres of land in Section 25, T. 16 S., R. 22E. (save and excluding a 15-foot easement along the northern boundary of Parcels D and E)
Parcel 4: The property in approximately 1.47 acres of land in Section 23, Lot 11 T.15.S. R. 22.E.
Patented Mining Claims
Parcel 6
Last Chance and Delta patented lode mining claims, Mineral Survey No. 1525
Parcel 19
Clondike, Blue Jacket and Blue Bell patented lode mining claims, Mineral Survey No. 1717
Parcel 20
Teaser patented lode mining claims, Mineral Survey No. 3306
| M3-PN210313.007 31 March 2026 Revision 0 |