On October 16, 2026, the Fund will acquire the assets and assume the liabilities of the Sequoia Fund, Inc. (the “Predecessor Fund”), in a reorganization (the “Reorganization”). As a result of the Reorganization, the Fund will adopt the performance and financial history of the Predecessor Fund. The performance information provided below is that of the Predecessor Fund for periods prior to October 16, 2026. The Fund has the same investment objective, investment strategies, fundamental investment policies and management team as the Predecessor Fund. Updated performance information is available at no cost by calling the Fund toll-free at 1- 844-737-3230.
The bar chart illustrates how the Predecessor Fund’s average annual returns have varied from year to year for the past ten calendar years. The table below illustrates how the Predecessor Fund’s average annual total returns compare with those of a broad measure of market performance, the Standard & Poor’s 500 Index (“S&P 500 Index”). The Fund’s past performance, of course, does not necessarily indicate how it will perform in the future.
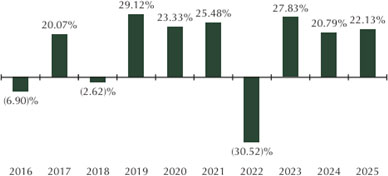
During the period shown in the bar chart, the highest return for a quarter was 27.21% (2nd quarter 2020) and the lowest return for a quarter was -22.17% (1st quarter 2020).
| 1 Year | 5 Years | 10 Years | |
| Return Before Taxes | 22.13% | 10.46% | 11.04% |
| Return After Taxes on Distributions | 19.30% | 8.84% | 8.36% |
| Return After Taxes on Distributions and Sale of Fund Shares | 14.83% | 8.04% | 8.10% |
| S&P 500 Index (reflects no deduction for fees, expenses or taxes) | 17.88% | 14.42% | 14.82% |
After-tax returns are estimates, which are calculated using the highest historical individual Federal marginal income tax rates, and do not reflect the impact of state and local taxes. In some instances, the “Return After Taxes on Distributions and Sale of Fund Shares” may be greater than “Return Before Taxes” because the investor is assumed to be able to use the capital loss of the sale of Fund Shares to offset other taxable gains. Actual after-tax returns depend on an individual investor’s tax situation and may differ from those shown. After-tax returns shown are not relevant to investors who hold their Fund Shares through tax-deferred arrangements, such as 401(k) plans or individual retirement accounts.