Shareholder Report
Jul. 31, 2026
USD ($)
Holding
WHAT WERE THE FUND COSTS FOR THE LAST YEAR?
(Based on a hypothetical $10,000 investment)
| Fund | Costs of a $10,000 investment | Costs paid as a percentage of a $10,000 investment |
| First Trust Large Cap Core AlphaDEX® Fund | $64 | 0.57% |
HOW DID THE FUND PERFORM LAST YEAR? WHAT AFFECTED THE FUND’S PERFORMANCE?
The Fund returned 23.01% during the 12 months ended July 31, 2026. The Fund outperformed its benchmark, the S&P 500® Index, which returned 19.56% for the same Period.
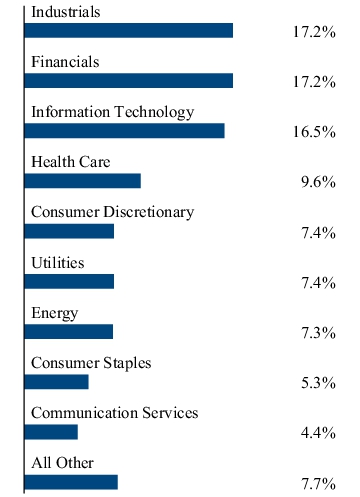
During the Period, investments in the Industrials sector received the greatest allocation of any sector with an average weight of 17.1%, and contributed 4.5% to the Fund’s overall return. With an average weight of 15.1%, investments in the Information Technology sector contributed 7.9% to the Fund’s overall return, which was the greatest contribution of any sector. With an average weight of 4.4%, investments in the Communication Services sector contributed -0.5% to the Fund’s overall return, which was the most negative contribution of any sector.
FUND PERFORMANCE (July 31, 2016 to July 31, 2026)
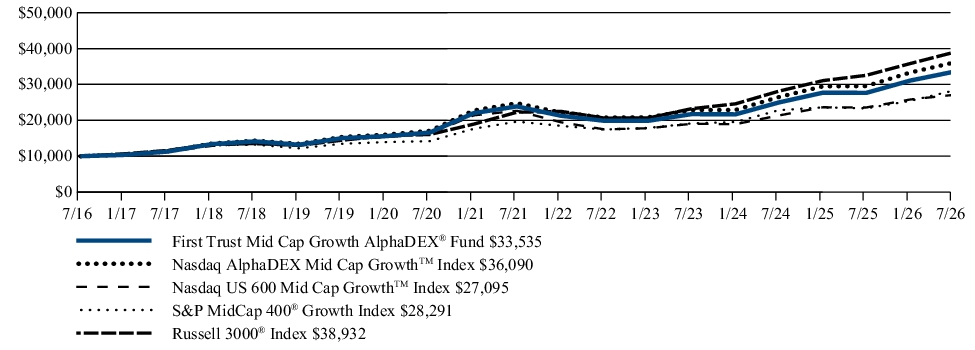
The performance line graph below shows the performance of a hypothetical $10,000 initial investment in the Fund over a ten-year period (or for the life of the Fund, if shorter). The subsequent account value as of the end of the Period is listed next to the name of the Fund or index, as applicable. The performance table below shows the average annual total returns of the Fund for the past one-, five-, and ten-year periods, as applicable (or for the life of the Fund, if shorter), as of the end of the Period. Both the line graph and performance table compare the Fund’s performance to an appropriate broad-based index and may compare to additional indices reflecting the market segment(s) in which the Fund invests over the same periods.
Investment Performance of $10,000
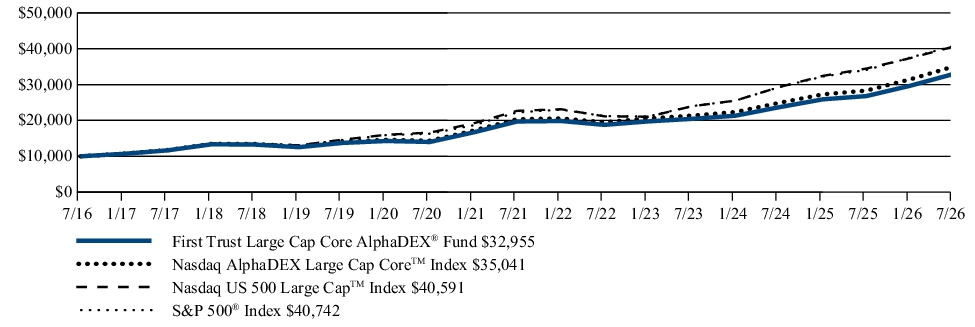
| Average Annual Total Returns (as of July 31, 2026) | 1 Year | 5 Year | 10 Year |
| First Trust Large Cap Core AlphaDEX® Fund | 23.01% | 10.83% | 12.67% |
| Nasdaq AlphaDEX Large Cap CoreTM Index | 23.75% | 11.49% | 13.36% |
| Nasdaq US 500 Large CapTM Index | 17.80% | 12.35% | 15.04% |
| S&P 500® Index | 19.56% | 12.86% | 15.08% |
Visit www.ftportfolios.com/etf/FEX for more recent performance information.
KEY FUND STATISTICS (As of July 31, 2026)
| Fund net assets | $1,565,948,975 |
| Total number of portfolio holdings | 377 |
| Total advisory fee paid | $7,167,515 |
| Portfolio turnover rate | 92% |
WHAT DID THE FUND INVEST IN? (As of July 31, 2026)
The tables below show the investment makeup of the Fund, representing the percentage of total investments (excluding repurchase agreements held as collateral for securities lending arrangements) of the Fund.
Top Ten Holdings
| Cognizant Technology Solutions Corp., Class A | 0.6% |
| Accenture PLC, Class A | 0.6% |
| PayPal Holdings, Inc. | 0.6% |
| Regeneron Pharmaceuticals, Inc. | 0.6% |
| ConocoPhillips | 0.5% |
| Global Payments, Inc. | 0.5% |
| Fidelity National Information Services, Inc. | 0.5% |
| EOG Resources, Inc. | 0.5% |
| Travelers (The) Cos., Inc. | 0.5% |
| AT&T, Inc. | 0.5% |
Sector Allocation
Top Ten Holdings
| Cognizant Technology Solutions Corp., Class A | 0.6% |
| Accenture PLC, Class A | 0.6% |
| PayPal Holdings, Inc. | 0.6% |
| Regeneron Pharmaceuticals, Inc. | 0.6% |
| ConocoPhillips | 0.5% |
| Global Payments, Inc. | 0.5% |
| Fidelity National Information Services, Inc. | 0.5% |
| EOG Resources, Inc. | 0.5% |
| Travelers (The) Cos., Inc. | 0.5% |
| AT&T, Inc. | 0.5% |
WHAT WERE THE FUND COSTS FOR THE LAST YEAR?
(Based on a hypothetical $10,000 investment)
| Fund | Costs of a $10,000 investment | Costs paid as a percentage of a $10,000 investment |
| First Trust Mid Cap Core AlphaDEX® Fund | $64(1) | 0.57%(1) |
|
(1) |
Excludes any Acquired Fund Fees and Expenses of the underlying investment companies in which the Fund invests. |
HOW DID THE FUND PERFORM LAST YEAR? WHAT AFFECTED THE FUND’S PERFORMANCE?
The Fund returned 23.25% during the 12 months ended July 31, 2026. The Fund outperformed its benchmark, the S&P MidCap 400® Index, which returned 20.92% for the same Period.
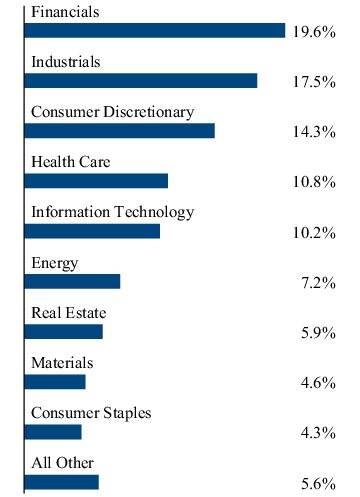
During the Period, investments in the Industrials sector received the greatest allocation of any sector, with an average weight of 20.6%, which contributed 4.8% to Fund’s overall return, which was the greatest of any sector. With an average weight of 4.1%, investments in the Consumer Staples sector contributed -0.3% to the Fund’s overall return, which was the most negative return contribution of any sector.
FUND PERFORMANCE (July 31, 2016 to July 31, 2026)
The performance line graph below shows the performance of a hypothetical $10,000 initial investment in the Fund over a ten-year period (or for the life of the Fund, if shorter). The subsequent account value as of the end of the Period is listed next to the name of the Fund or index, as applicable. The performance table below shows the average annual total returns of the Fund for the past one-, five-, and ten-year periods, as applicable (or for the life of the Fund, if shorter), as of the end of the Period. Both the line graph and performance table compare the Fund’s performance to an appropriate broad-based index and may compare to additional indices reflecting the market segment(s) in which the Fund invests over the same periods.
Investment Performance of $10,000
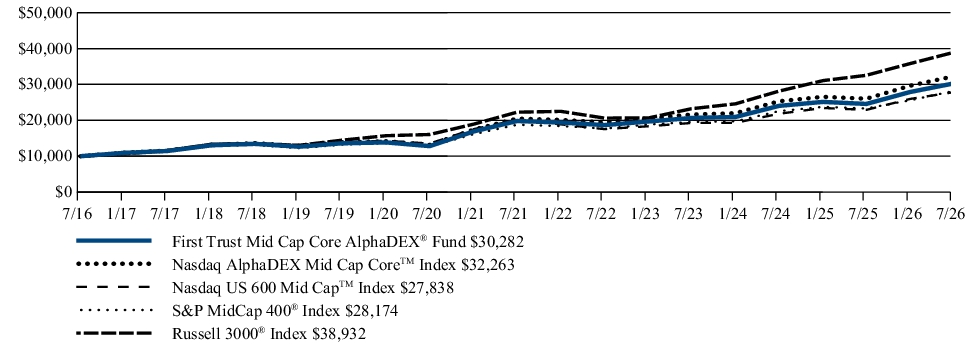
| Average Annual Total Returns (as of July 31, 2026) | 1 Year | 5 Year | 10 Year |
| First Trust Mid Cap Core AlphaDEX® Fund | 23.25% | 8.86% | 11.72% |
| Nasdaq AlphaDEX Mid Cap CoreTM Index | 24.01% | 9.54% | 12.43% |
| Nasdaq US 600 Mid CapTM Index | 21.51% | 6.75% | 10.78% |
| S&P MidCap 400® Index | 20.92% | 8.47% | 10.91% |
| Russell 3000® Index | 19.60% | 11.82% | 14.56% |
Visit www.ftportfolios.com/etf/FNX for more recent performance information.
KEY FUND STATISTICS (As of July 31, 2026)
| Fund net assets | $1,374,486,934 |
| Total number of portfolio holdings | 452 |
| Total advisory fee paid | $6,226,984 |
| Portfolio turnover rate | 100% |
WHAT DID THE FUND INVEST IN? (As of July 31, 2026)
The tables below show the investment makeup of the Fund, representing the percentage of total investments (excluding repurchase agreements held as collateral for securities lending arrangements) of the Fund.
Top Ten Holdings
| EPAM Systems, Inc. | 0.5% |
| Lithia Motors, Inc. | 0.5% |
| HF Sinclair Corp. | 0.5% |
| Genpact Ltd. | 0.5% |
| SM Energy Co. | 0.5% |
| Ovintiv, Inc. | 0.4% |
| ADT, Inc. | 0.4% |
| Permian Resources Corp., Class A | 0.4% |
| CF Industries Holdings, Inc. | 0.4% |
| Asbury Automotive Group, Inc. | 0.4% |
Sector Allocation
Top Ten Holdings
| EPAM Systems, Inc. | 0.5% |
| Lithia Motors, Inc. | 0.5% |
| HF Sinclair Corp. | 0.5% |
| Genpact Ltd. | 0.5% |
| SM Energy Co. | 0.5% |
| Ovintiv, Inc. | 0.4% |
| ADT, Inc. | 0.4% |
| Permian Resources Corp., Class A | 0.4% |
| CF Industries Holdings, Inc. | 0.4% |
| Asbury Automotive Group, Inc. | 0.4% |
WHAT WERE THE FUND COSTS FOR THE LAST YEAR?
(Based on a hypothetical $10,000 investment)
| Fund | Costs of a $10,000 investment | Costs paid as a percentage of a $10,000 investment |
| First Trust Small Cap Core AlphaDEX® Fund | $70 | 0.57% |
HOW DID THE FUND PERFORM LAST YEAR? WHAT AFFECTED THE FUND’S PERFORMANCE?
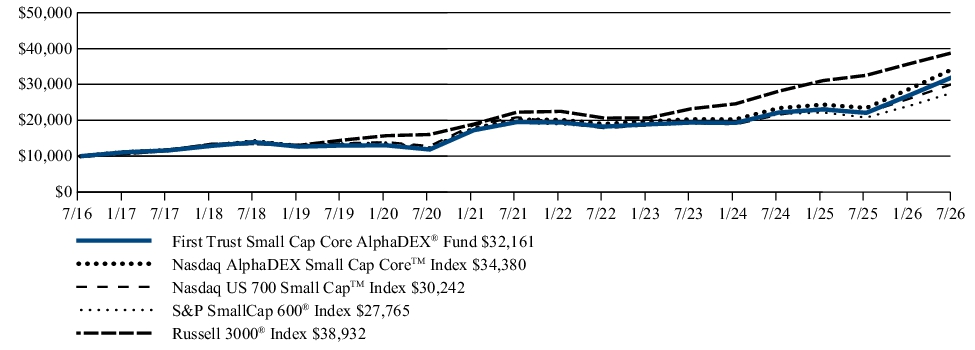
The Fund returned 45.58% during the 12 months ended July 31, 2026. The Fund outperformed its benchmark, the S&P SmallCap 600® Index, which returned 33.64% for the same Period.
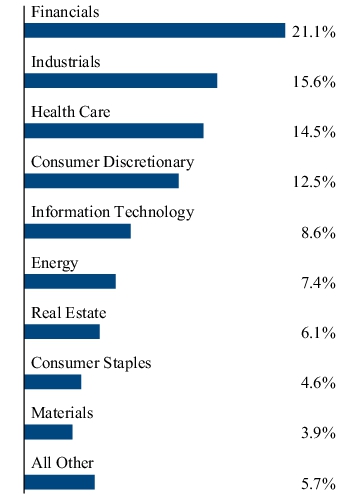
During the Period, investments in the Financials sector received the greatest allocation of any sector, with an average weight of 19.5%, which contributed 6.2% to the Fund’s overall return. With an average weight of 13.7%, investments in the Health Care sector contributed 8.1% to the Fund’s overall return, which was the greatest of any sector. No sector represented a negative contribution to the Fund’s overall return.
FUND PERFORMANCE (July 31, 2016 to July 31, 2026)
The performance line graph below shows the performance of a hypothetical $10,000 initial investment in the Fund over a ten-year period (or for the life of the Fund, if shorter). The subsequent account value as of the end of the Period is listed next to the name of the Fund or index, as applicable. The performance table below shows the average annual total returns of the Fund for the past one-, five-, and ten-year periods, as applicable (or for the life of the Fund, if shorter), as of the end of the Period. Both the line graph and performance table compare the Fund’s performance to an appropriate broad-based index and may compare to additional indices reflecting the market segment(s) in which the Fund invests over the same periods.
Investment Performance of $10,000
| Average Annual Total Returns (as of July 31, 2026) | 1 Year | 5 Year | 10 Year |
| First Trust Small Cap Core AlphaDEX® Fund | 45.58% | 10.49% | 12.39% |
| Nasdaq AlphaDEX Small Cap CoreTM Index | 46.60% | 11.23% | 13.14% |
| Nasdaq US 700 Small CapTM Index | 36.82% | 7.73% | 11.70% |
| S&P SmallCap 600® Index | 33.64% | 7.48% | 10.75% |
| Russell 3000® Index | 19.60% | 11.82% | 14.56% |
Visit www.ftportfolios.com/etf/FYX for more recent performance information.
KEY FUND STATISTICS (As of July 31, 2026)
| Fund net assets | $1,376,674,389 |
| Total number of portfolio holdings | 527 |
| Total advisory fee paid | $5,256,295 |
| Portfolio turnover rate | 102% |
WHAT DID THE FUND INVEST IN? (As of July 31, 2026)
The tables below show the investment makeup of the Fund, representing the percentage of total investments (excluding repurchase agreements held as collateral for securities lending arrangements) of the Fund.
Top Ten Holdings
| CBIZ, Inc. | 0.5% |
| Everforth, Inc. | 0.5% |
| PBF Energy, Inc., Class A | 0.5% |
| Par Pacific Holdings, Inc. | 0.5% |
| CONMED Corp. | 0.5% |
| Dorian LPG Ltd. | 0.4% |
| DXC Technology Co. | 0.4% |
| International Seaways, Inc. | 0.4% |
| Korn Ferry | 0.4% |
| Acadian Asset Management, Inc. | 0.4% |
Sector Allocation
Top Ten Holdings
| CBIZ, Inc. | 0.5% |
| Everforth, Inc. | 0.5% |
| PBF Energy, Inc., Class A | 0.5% |
| Par Pacific Holdings, Inc. | 0.5% |
| CONMED Corp. | 0.5% |
| Dorian LPG Ltd. | 0.4% |
| DXC Technology Co. | 0.4% |
| International Seaways, Inc. | 0.4% |
| Korn Ferry | 0.4% |
| Acadian Asset Management, Inc. | 0.4% |
WHAT WERE THE FUND COSTS FOR THE LAST YEAR?
(Based on a hypothetical $10,000 investment)
| Fund | Costs of a $10,000 investment | Costs paid as a percentage of a $10,000 investment |
| First Trust Large Cap Value AlphaDEX® Fund | $66 | 0.57% |
HOW DID THE FUND PERFORM LAST YEAR? WHAT AFFECTED THE FUND’S PERFORMANCE?
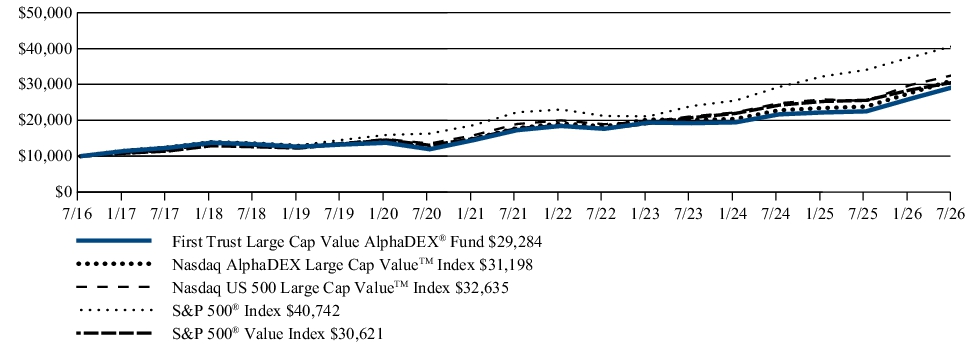
The Fund returned 30.11% during the 12 months ended July 31, 2026. The Fund outperformed its benchmark, the S&P 500® Value Index, which returned 19.71% for the same Period.
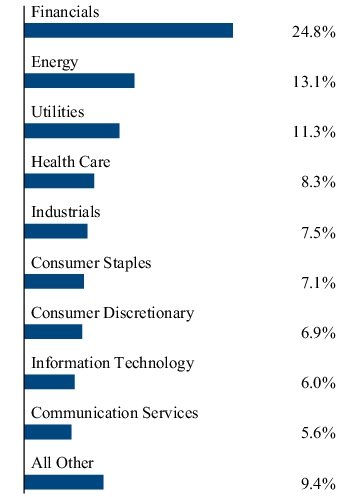
During the Period, investments in the Financials sector received the greatest allocation of any sector, with an average weight of 21.4% and contributed 4.9% to the Fund’s overall return. With an average weight of 11.4%, investments in the Health Care sector contributed 5.7% to the Fund’s overall return, which was the greatest of any sector. No sector contributed a negative return to the Fund’s overall return.
FUND PERFORMANCE (July 31, 2016 to July 31, 2026)
The performance line graph below shows the performance of a hypothetical $10,000 initial investment in the Fund over a ten-year period (or for the life of the Fund, if shorter). The subsequent account value as of the end of the Period is listed next to the name of the Fund or index, as applicable. The performance table below shows the average annual total returns of the Fund for the past one-, five-, and ten-year periods, as applicable (or for the life of the Fund, if shorter), as of the end of the Period. Both the line graph and performance table compare the Fund’s performance to an appropriate broad-based index and may compare to additional indices reflecting the market segment(s) in which the Fund invests over the same periods.
Investment Performance of $10,000
| Average Annual Total Returns (as of July 31, 2026) | 1 Year | 5 Year | 10 Year |
| First Trust Large Cap Value AlphaDEX® Fund | 30.11% | 11.16% | 11.34% |
| Nasdaq AlphaDEX Large Cap ValueTM Index | 30.95% | 11.84% | 12.05% |
| Nasdaq US 500 Large Cap ValueTM Index | 28.48% | 11.46% | 12.56% |
| S&P 500® Index | 19.56% | 12.86% | 15.08% |
| S&P 500® Value Index | 19.71% | 11.57% | 11.84% |
Visit www.ftportfolios.com/etf/FTA for more recent performance information.
KEY FUND STATISTICS (As of July 31, 2026)
| Fund net assets | $1,398,022,182 |
| Total number of portfolio holdings | 189 |
| Total advisory fee paid | $6,147,891 |
| Portfolio turnover rate | 83% |
WHAT DID THE FUND INVEST IN? (As of July 31, 2026)
The tables below show the investment makeup of the Fund, representing the percentage of total investments (excluding repurchase agreements held as collateral for securities lending arrangements) of the Fund.
Top Ten Holdings
| Cognizant Technology Solutions Corp., Class A | 1.2% |
| Accenture PLC, Class A | 1.1% |
| PayPal Holdings, Inc. | 1.1% |
| ConocoPhillips | 1.0% |
| Global Payments, Inc. | 1.0% |
| General Motors Co. | 1.0% |
| Fidelity National Information Services, Inc. | 1.0% |
| EOG Resources, Inc. | 1.0% |
| Travelers (The) Cos., Inc. | 1.0% |
| AT&T, Inc. | 1.0% |
Sector Allocation
Top Ten Holdings
| Cognizant Technology Solutions Corp., Class A | 1.2% |
| Accenture PLC, Class A | 1.1% |
| PayPal Holdings, Inc. | 1.1% |
| ConocoPhillips | 1.0% |
| Global Payments, Inc. | 1.0% |
| General Motors Co. | 1.0% |
| Fidelity National Information Services, Inc. | 1.0% |
| EOG Resources, Inc. | 1.0% |
| Travelers (The) Cos., Inc. | 1.0% |
| AT&T, Inc. | 1.0% |
WHAT WERE THE FUND COSTS FOR THE LAST YEAR?
(Based on a hypothetical $10,000 investment)
| Fund | Costs of a $10,000 investment | Costs paid as a percentage of a $10,000 investment |
| First Trust Large Cap Growth AlphaDEX® Fund | $61 | 0.57% |
HOW DID THE FUND PERFORM LAST YEAR? WHAT AFFECTED THE FUND’S PERFORMANCE?
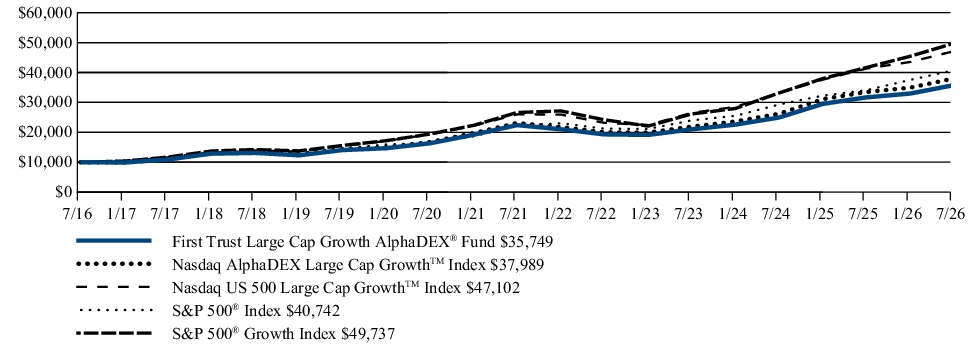
The Fund returned 12.88% during the 12 months ended July 31, 2026. The Fund underperformed its benchmark, the S&P 500® Growth Index, which returned 19.42% for the same Period.
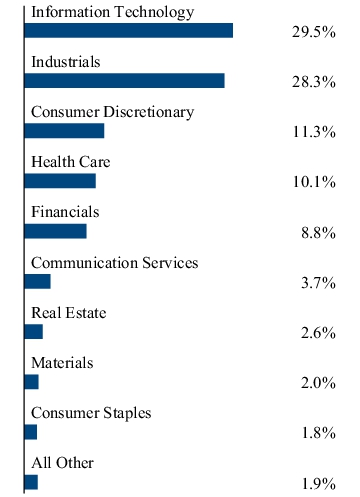
During the Period, investments in the Information Technology sector received the greatest allocation of any sector, with an average weight of 25.9%, and contributed 9.9% to the Fund’s overall return. Investments in the Communication Services, with an average weight of 4.8%, contributed -1.2% to the Fund’s overall return, which was the most negative contribution of any sector.
FUND PERFORMANCE (July 31, 2016 to July 31, 2026)
The performance line graph below shows the performance of a hypothetical $10,000 initial investment in the Fund over a ten-year period (or for the life of the Fund, if shorter). The subsequent account value as of the end of the Period is listed next to the name of the Fund or index, as applicable. The performance table below shows the average annual total returns of the Fund for the past one-, five-, and ten-year periods, as applicable (or for the life of the Fund, if shorter), as of the end of the Period. Both the line graph and performance table compare the Fund’s performance to an appropriate broad-based index and may compare to additional indices reflecting the market segment(s) in which the Fund invests over the same periods.
Investment Performance of $10,000
| Average Annual Total Returns (as of July 31, 2026) | 1 Year | 5 Year | 10 Year |
| First Trust Large Cap Growth AlphaDEX® Fund | 12.88% | 9.80% | 13.59% |
| Nasdaq AlphaDEX Large Cap GrowthTM Index | 13.55% | 10.45% | 14.28% |
| Nasdaq US 500 Large Cap GrowthTM Index | 13.98% | 12.62% | 16.76% |
| S&P 500® Index | 19.56% | 12.86% | 15.08% |
| S&P 500® Growth Index | 19.42% | 13.32% | 17.40% |
Visit www.ftportfolios.com/etf/FTC for more recent performance information.
KEY FUND STATISTICS (As of July 31, 2026)
| Fund net assets | $1,318,673,505 |
| Total number of portfolio holdings | 189 |
| Total advisory fee paid | $6,343,316 |
| Portfolio turnover rate | 113% |
WHAT DID THE FUND INVEST IN? (As of July 31, 2026)
The tables below show the investment makeup of the Fund, representing the percentage of total investments (excluding repurchase agreements held as collateral for securities lending arrangements) of the Fund.
Top Ten Holdings
| Incyte Corp. | 1.0% |
| Fortinet, Inc. | 1.0% |
| Datadog, Inc., Class A | 1.0% |
| eBay, Inc. | 1.0% |
| Interactive Brokers Group, Inc., Class A | 1.0% |
| Morgan Stanley | 1.0% |
| EMCOR Group, Inc. | 0.9% |
| Cincinnati Financial Corp. | 0.9% |
| United Rentals, Inc. | 0.9% |
| Ross Stores, Inc. | 0.9% |
Sector Allocation
Top Ten Holdings
| Incyte Corp. | 1.0% |
| Fortinet, Inc. | 1.0% |
| Datadog, Inc., Class A | 1.0% |
| eBay, Inc. | 1.0% |
| Interactive Brokers Group, Inc., Class A | 1.0% |
| Morgan Stanley | 1.0% |
| EMCOR Group, Inc. | 0.9% |
| Cincinnati Financial Corp. | 0.9% |
| United Rentals, Inc. | 0.9% |
| Ross Stores, Inc. | 0.9% |
WHAT WERE THE FUND COSTS FOR THE LAST YEAR?
(Based on a hypothetical $10,000 investment)
| Fund | Costs of a $10,000 investment | Costs paid as a percentage of a $10,000 investment |
| First Trust Multi Cap Value AlphaDEX® Fund | $75(1) | 0.65%(1) |
|
(1) |
Excludes any Acquired Fund Fees and Expenses of the underlying investment companies in which the Fund invests. |
HOW DID THE FUND PERFORM LAST YEAR? WHAT AFFECTED THE FUND’S PERFORMANCE?
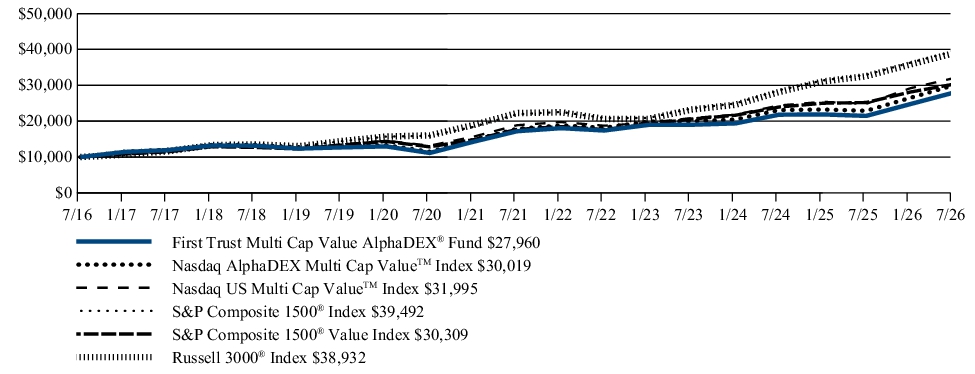
The Fund returned 30.17% during the 12 months ended July 31, 2026. The Fund outperformed its benchmark, the S&P Composite 1500® Value Index, which returned 20.19% for the same Period.
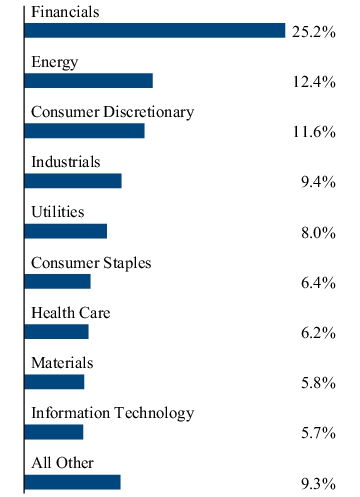
During the Period, the average allocation to the Financials sector was 22.7%, the greatest of any sector, and contributed 5.8% to the Fund’s overall return. With an average weight of 11.5%, investments in the Energy sector contributed 6.0% to the Fund’s overall return, the greatest contribution to the Fund’s overall return. No sector represented a negative contribution to the Fund’s overall return.
FUND PERFORMANCE (July 31, 2016 to July 31, 2026)
The performance line graph below shows the performance of a hypothetical $10,000 initial investment in the Fund over a ten-year period (or for the life of the Fund, if shorter). The subsequent account value as of the end of the Period is listed next to the name of the Fund or index, as applicable. The performance table below shows the average annual total returns of the Fund for the past one-, five-, and ten-year periods, as applicable (or for the life of the Fund, if shorter), as of the end of the Period. Both the line graph and performance table compare the Fund’s performance to an appropriate broad-based index and may compare to additional indices reflecting the market segment(s) in which the Fund invests over the same periods.
Investment Performance of $10,000
| Average Annual Total Returns (as of July 31, 2026) | 1 Year | 5 Year | 10 Year |
| First Trust Multi Cap Value AlphaDEX® Fund | 30.17% | 10.20% | 10.83% |
| Nasdaq AlphaDEX Multi Cap ValueTM Index | 31.11% | 10.95% | 11.62% |
| Nasdaq US Multi Cap ValueTM Index | 28.66% | 11.13% | 12.33% |
| S&P Composite 1500® Index | 19.97% | 12.48% | 14.72% |
| S&P Composite 1500® Value Index | 20.19% | 11.36% | 11.73% |
| Russell 3000® Index | 19.60% | 11.82% | 14.56% |
Visit www.ftportfolios.com/etf/FAB for more recent performance information.
KEY FUND STATISTICS (As of July 31, 2026)
| Fund net assets | $168,465,133 |
| Total number of portfolio holdings | 676 |
| Total advisory fee paid | $649,600 |
| Portfolio turnover rate | 85% |
WHAT DID THE FUND INVEST IN? (As of July 31, 2026)
The tables below show the investment makeup of the Fund, representing the percentage of total investments (excluding repurchase agreements held as collateral for securities lending arrangements) of the Fund.
Top Ten Holdings
| Cognizant Technology Solutions Corp., Class A | 0.6% |
| Accenture PLC, Class A | 0.6% |
| PayPal Holdings, Inc. | 0.6% |
| Global Payments, Inc. | 0.5% |
| ConocoPhillips | 0.5% |
| General Motors Co. | 0.5% |
| Fidelity National Information Services, Inc. | 0.5% |
| EOG Resources, Inc. | 0.5% |
| Travelers (The) Cos., Inc. | 0.5% |
| AT&T, Inc. | 0.5% |
Sector Allocation
Top Ten Holdings
| Cognizant Technology Solutions Corp., Class A | 0.6% |
| Accenture PLC, Class A | 0.6% |
| PayPal Holdings, Inc. | 0.6% |
| Global Payments, Inc. | 0.5% |
| ConocoPhillips | 0.5% |
| General Motors Co. | 0.5% |
| Fidelity National Information Services, Inc. | 0.5% |
| EOG Resources, Inc. | 0.5% |
| Travelers (The) Cos., Inc. | 0.5% |
| AT&T, Inc. | 0.5% |
WHAT WERE THE FUND COSTS FOR THE LAST YEAR?
(Based on a hypothetical $10,000 investment)
| Fund | Costs of a $10,000 investment | Costs paid as a percentage of a $10,000 investment |
| First Trust Multi Cap Growth AlphaDEX® Fund | $66(1) | 0.59%(1) |
|
(1) |
Excludes any Acquired Fund Fees and Expenses of the underlying investment companies in which the Fund invests. |
HOW DID THE FUND PERFORM LAST YEAR? WHAT AFFECTED THE FUND’S PERFORMANCE?
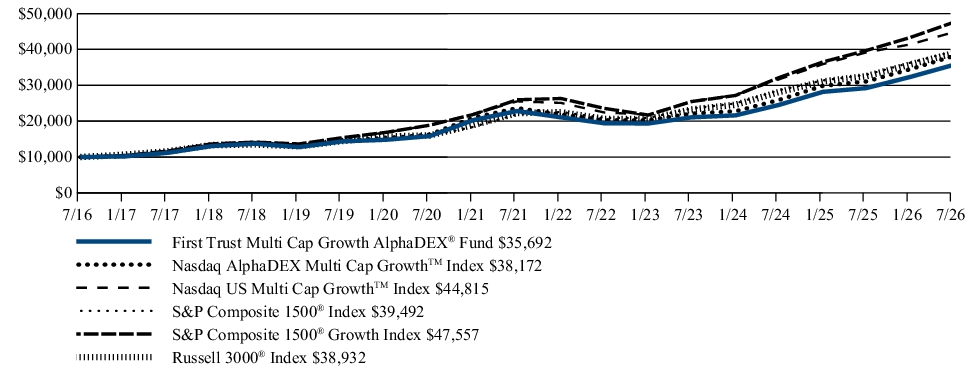
The Fund returned 22.09% during the 12 months ended July 31, 2026. The Fund outperformed its benchmark, the S&P Composite 1500® Growth Index, which returned 19.78% for the same Period.
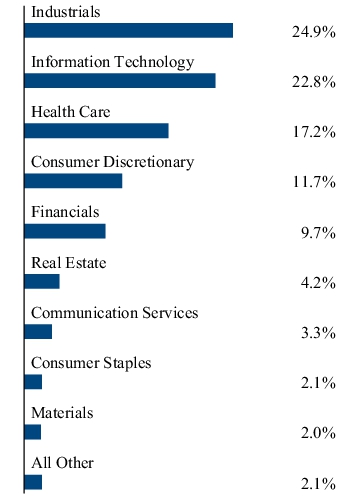
During the Period, the Fund’s greatest allocation was to the Industrials sector. The Industrials sector received an average allocation of 25.2% and contributed 6.4% to the Fund’s overall return. With an average weight of 21.1%, investments in the Information Technology sector contributed 9.0% to the Fund’s overall return, the greatest contribution of the Fund’s overall return. With an average weight of 1.7%, investments in the Utilities sector contributed -0.3% to the Fund’s overall return, the most negative contribution of any sector.
FUND PERFORMANCE (July 31, 2016 to July 31, 2026)
The performance line graph below shows the performance of a hypothetical $10,000 initial investment in the Fund over a ten-year period (or for the life of the Fund, if shorter). The subsequent account value as of the end of the Period is listed next to the name of the Fund or index, as applicable. The performance table below shows the average annual total returns of the Fund for the past one-, five-, and ten-year periods, as applicable (or for the life of the Fund, if shorter), as of the end of the Period. Both the line graph and performance table compare the Fund’s performance to an appropriate broad-based index and may compare to additional indices reflecting the market segment(s) in which the Fund invests over the same periods.
Investment Performance of $10,000
| Average Annual Total Returns (as of July 31, 2026) | 1 Year | 5 Year | 10 Year |
| First Trust Multi Cap Growth AlphaDEX® Fund | 22.09% | 9.34% | 13.57% |
| Nasdaq AlphaDEX Multi Cap GrowthTM Index | 22.86% | 10.05% | 14.33% |
| Nasdaq US Multi Cap GrowthTM Index | 14.38% | 11.92% | 16.18% |
| S&P Composite 1500® Index | 19.97% | 12.48% | 14.72% |
| S&P Composite 1500® Growth Index | 19.78% | 12.86% | 16.87% |
| Russell 3000® Index | 19.60% | 11.82% | 14.56% |
Visit www.ftportfolios.com/etf/FAD for more recent performance information.
KEY FUND STATISTICS (As of July 31, 2026)
| Fund net assets | $577,445,793 |
| Total number of portfolio holdings | 678 |
| Total advisory fee paid | $2,079,056 |
| Portfolio turnover rate | 106% |
WHAT DID THE FUND INVEST IN? (As of July 31, 2026)
The tables below show the investment makeup of the Fund, representing the percentage of total investments (excluding repurchase agreements held as collateral for securities lending arrangements) of the Fund.
Top Ten Holdings
| Incyte Corp. | 0.5% |
| Fortinet, Inc. | 0.5% |
| Datadog, Inc., Class A | 0.5% |
| eBay, Inc. | 0.5% |
| Interactive Brokers Group, Inc., Class A | 0.5% |
| Morgan Stanley | 0.5% |
| EMCOR Group, Inc. | 0.5% |
| Cincinnati Financial Corp. | 0.5% |
| United Rentals, Inc. | 0.5% |
| Ross Stores, Inc. | 0.5% |
Sector Allocation
Top Ten Holdings
| Incyte Corp. | 0.5% |
| Fortinet, Inc. | 0.5% |
| Datadog, Inc., Class A | 0.5% |
| eBay, Inc. | 0.5% |
| Interactive Brokers Group, Inc., Class A | 0.5% |
| Morgan Stanley | 0.5% |
| EMCOR Group, Inc. | 0.5% |
| Cincinnati Financial Corp. | 0.5% |
| United Rentals, Inc. | 0.5% |
| Ross Stores, Inc. | 0.5% |
WHAT WERE THE FUND COSTS FOR THE LAST YEAR?
(Based on a hypothetical $10,000 investment)
| Fund | Costs of a $10,000 investment | Costs paid as a percentage of a $10,000 investment |
| First Trust Consumer Discretionary AlphaDEX® Fund | $67 | 0.64% |
HOW DID THE FUND PERFORM LAST YEAR? WHAT AFFECTED THE FUND’S PERFORMANCE?
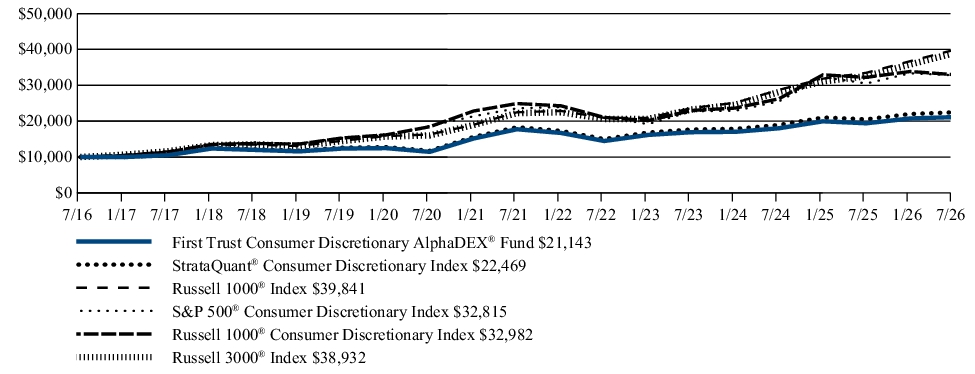
The Fund returned 8.85% during the 12 months ended July 31, 2026. The Fund outperformed its benchmark, the S&P 500® Consumer Discretionary Index, which returned 7.52% for the same Period.
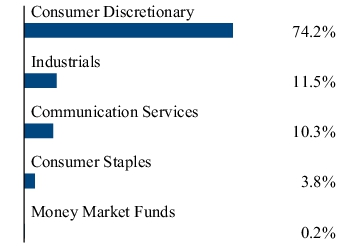
During the Period, investments in the Specialty Retail industry received the greatest allocation of any industry with an average weight of 18.4% and contributed 2.7% to the Fund’s overall return, which was the greatest return contribution of any industry. With an average weight of 1.9%, investments in the Distributors industry contributed –0.6% to the Fund’s overall return, which was the most negative return contribution of any industry.
FUND PERFORMANCE (July 31, 2016 to July 31, 2026)
The performance line graph below shows the performance of a hypothetical $10,000 initial investment in the Fund over a ten-year period (or for the life of the Fund, if shorter). The subsequent account value as of the end of the Period is listed next to the name of the Fund or index, as applicable. The performance table below shows the average annual total returns of the Fund for the past one-, five-, and ten-year periods, as applicable (or for the life of the Fund, if shorter), as of the end of the Period. Both the line graph and performance table compare the Fund’s performance to an appropriate broad-based index and may compare to additional indices reflecting the market segment(s) in which the Fund invests over the same periods.
Investment Performance of $10,000
| Average Annual Total Returns (as of July 31, 2026) | 1 Year | 5 Year | 10 Year |
| First Trust Consumer Discretionary AlphaDEX® Fund | 8.85% | 3.55% | 7.77% |
| StrataQuant® Consumer Discretionary Index | 9.50% | 4.16% | 8.43% |
| Russell 1000® Index | 18.94% | 12.12% | 14.82% |
| S&P 500® Consumer Discretionary Index | 7.52% | 6.81% | 12.62% |
| Russell 1000® Consumer Discretionary Index | 2.33% | 5.76% | 12.68% |
| Russell 3000® Index | 19.60% | 11.82% | 14.56% |
Visit www.ftportfolios.com/etf/FXD for more recent performance information.
KEY FUND STATISTICS (As of July 31, 2026)
| Fund net assets | $269,173,641 |
| Total number of portfolio holdings | 114 |
| Total advisory fee paid | $1,464,185 |
| Portfolio turnover rate | 85% |
WHAT DID THE FUND INVEST IN? (As of July 31, 2026)
The tables below show the investment makeup of the Fund, representing the percentage of total investments (excluding repurchase agreements held as collateral for securities lending arrangements) of the Fund.
Top Ten Holdings
| Fox Corp., Class A | 1.7% |
| Dillard’s, Inc., Class A | 1.7% |
| Mattel, Inc. | 1.6% |
| Lyft, Inc., Class A | 1.6% |
| Gap (The), Inc. | 1.6% |
| SharkNinja, Inc. | 1.6% |
| Lithia Motors, Inc. | 1.6% |
| Macy’s, Inc. | 1.6% |
| Lululemon Athletica, Inc. | 1.6% |
| Sirius XM Holdings, Inc. | 1.5% |
Sector Allocation
Top Ten Holdings
| Fox Corp., Class A | 1.7% |
| Dillard’s, Inc., Class A | 1.7% |
| Mattel, Inc. | 1.6% |
| Lyft, Inc., Class A | 1.6% |
| Gap (The), Inc. | 1.6% |
| SharkNinja, Inc. | 1.6% |
| Lithia Motors, Inc. | 1.6% |
| Macy’s, Inc. | 1.6% |
| Lululemon Athletica, Inc. | 1.6% |
| Sirius XM Holdings, Inc. | 1.5% |
WHAT WERE THE FUND COSTS FOR THE LAST YEAR?
(Based on a hypothetical $10,000 investment)
| Fund | Costs of a $10,000 investment | Costs paid as a percentage of a $10,000 investment |
| First Trust Consumer Staples AlphaDEX® Fund | $66 | 0.64% |
HOW DID THE FUND PERFORM LAST YEAR? WHAT AFFECTED THE FUND’S PERFORMANCE?
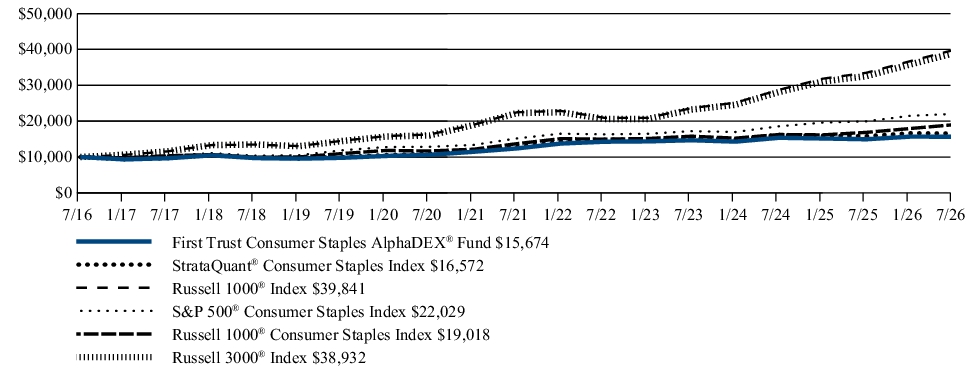
The Fund returned 4.71% during the 12 months ended July 31, 2026. The Fund underperformed its benchmark, the S&P 500® Consumer Staples Index, which returned 10.32% for the same Period.
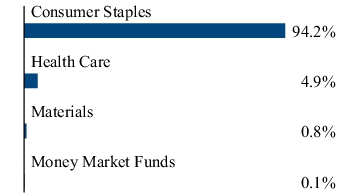
During the Period, investments in the Food Products industry received the greatest allocation of any industry with an average weight of 48.6% and contributed –1.3% to the Fund’s overall return, which was the most negative return contribution of any industry. With an average weight of 18.1%, investments in the Beverages industry contributed 2.4% to the Fund’s overall return, which was the greatest return contribution of any industry.
FUND PERFORMANCE (July 31, 2016 to July 31, 2026)
The performance line graph below shows the performance of a hypothetical $10,000 initial investment in the Fund over a ten-year period (or for the life of the Fund, if shorter). The subsequent account value as of the end of the Period is listed next to the name of the Fund or index, as applicable. The performance table below shows the average annual total returns of the Fund for the past one-, five-, and ten-year periods, as applicable (or for the life of the Fund, if shorter), as of the end of the Period. Both the line graph and performance table compare the Fund’s performance to an appropriate broad-based index and may compare to additional indices reflecting the market segment(s) in which the Fund invests over the same periods.
Investment Performance of $10,000
| Average Annual Total Returns (as of July 31, 2026) | 1 Year | 5 Year | 10 Year |
| First Trust Consumer Staples AlphaDEX® Fund | 4.71% | 4.75% | 4.60% |
| StrataQuant® Consumer Staples Index | 4.69% | 5.23% | 5.18% |
| Russell 1000® Index | 18.94% | 12.12% | 14.82% |
| S&P 500® Consumer Staples Index | 10.32% | 7.69% | 8.22% |
| Russell 1000® Consumer Staples Index | 12.63% | 6.73% | 6.64% |
| Russell 3000® Index | 19.60% | 11.82% | 14.56% |
Visit www.ftportfolios.com/etf/FXG for more recent performance information.
KEY FUND STATISTICS (As of July 31, 2026)
| Fund net assets | $229,274,437 |
| Total number of portfolio holdings | 42 |
| Total advisory fee paid | $1,267,678 |
| Portfolio turnover rate | 95% |
WHAT DID THE FUND INVEST IN? (As of July 31, 2026)
The tables below show the investment makeup of the Fund, representing the percentage of total investments (excluding repurchase agreements held as collateral for securities lending arrangements) of the Fund.
Top Ten Holdings
| JBS N.V., Class A | 4.8% |
| Smithfield Foods, Inc. | 4.4% |
| Ingredion, Inc. | 4.3% |
| General Mills, Inc. | 4.2% |
| McCormick & Co., Inc. | 4.1% |
| Freshpet, Inc. | 4.1% |
| Seaboard Corp. | 4.0% |
| Pilgrim’s Pride Corp. | 4.0% |
| Casey’s General Stores, Inc. | 3.6% |
| Post Holdings, Inc. | 3.4% |
Sector Allocation
Top Ten Holdings
| JBS N.V., Class A | 4.8% |
| Smithfield Foods, Inc. | 4.4% |
| Ingredion, Inc. | 4.3% |
| General Mills, Inc. | 4.2% |
| McCormick & Co., Inc. | 4.1% |
| Freshpet, Inc. | 4.1% |
| Seaboard Corp. | 4.0% |
| Pilgrim’s Pride Corp. | 4.0% |
| Casey’s General Stores, Inc. | 3.6% |
| Post Holdings, Inc. | 3.4% |
WHAT WERE THE FUND COSTS FOR THE LAST YEAR?
(Based on a hypothetical $10,000 investment)
| Fund | Costs of a $10,000 investment | Costs paid as a percentage of a $10,000 investment |
| First Trust Energy AlphaDEX® Fund | $75 | 0.62% |
HOW DID THE FUND PERFORM LAST YEAR? WHAT AFFECTED THE FUND’S PERFORMANCE?
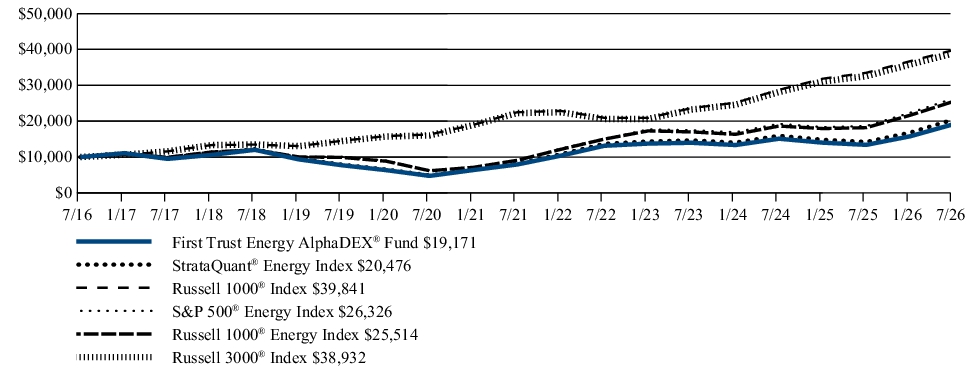
The Fund returned 43.00% during the 12 months ended July 31, 2026. The Fund outperformed its benchmark, the S&P 500® Energy Index, which returned 41.17% for the same Period.
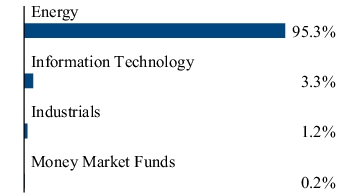
During the Period, investments in the Oil, Gas & Consumable Fuels industry received the greatest allocation of any industry with an average weight of 80.4% and contributed 32.7% to the Fund’s overall return, which was the greatest return contribution of any industry. With an average weight of 0.1%, investments in the Electrical Equipment industry contributed –0.2% to the Fund’s overall return, which was the most negative contribution of any industry.
FUND PERFORMANCE (July 31, 2016 to July 31, 2026)
The performance line graph below shows the performance of a hypothetical $10,000 initial investment in the Fund over a ten-year period (or for the life of the Fund, if shorter). The subsequent account value as of the end of the Period is listed next to the name of the Fund or index, as applicable. The performance table below shows the average annual total returns of the Fund for the past one-, five-, and ten-year periods, as applicable (or for the life of the Fund, if shorter), as of the end of the Period. Both the line graph and performance table compare the Fund’s performance to an appropriate broad-based index and may compare to additional indices reflecting the market segment(s) in which the Fund invests over the same periods.
Investment Performance of $10,000
| Average Annual Total Returns (as of July 31, 2026) | 1 Year | 5 Year | 10 Year |
| First Trust Energy AlphaDEX® Fund | 43.00% | 19.30% | 6.72% |
| StrataQuant® Energy Index | 44.02% | 20.13% | 7.43% |
| Russell 1000® Index | 18.94% | 12.12% | 14.82% |
| S&P 500® Energy Index | 41.17% | 23.99% | 10.16% |
| Russell 1000® Energy Index | 40.15% | 22.92% | 9.82% |
| Russell 3000® Index | 19.60% | 11.82% | 14.56% |
Visit www.ftportfolios.com/etf/FXN for more recent performance information.
KEY FUND STATISTICS (As of July 31, 2026)
| Fund net assets | $379,138,406 |
| Total number of portfolio holdings | 40 |
| Total advisory fee paid | $2,620,187 |
| Portfolio turnover rate | 77% |
WHAT DID THE FUND INVEST IN? (As of July 31, 2026)
The tables below show the investment makeup of the Fund, representing the percentage of total investments of the Fund.
Top Ten Holdings
| HF Sinclair Corp. | 5.7% |
| APA Corp. | 5.0% |
| Devon Energy Corp. | 4.8% |
| Range Resources Corp. | 4.7% |
| Expand Energy Corp. | 4.5% |
| Antero Resources Corp. | 4.5% |
| EQT Corp. | 4.4% |
| Chord Energy Corp. | 3.7% |
| Ovintiv, Inc. | 3.6% |
| ConocoPhillips | 3.5% |
Sector Allocation
Top Ten Holdings
| HF Sinclair Corp. | 5.7% |
| APA Corp. | 5.0% |
| Devon Energy Corp. | 4.8% |
| Range Resources Corp. | 4.7% |
| Expand Energy Corp. | 4.5% |
| Antero Resources Corp. | 4.5% |
| EQT Corp. | 4.4% |
| Chord Energy Corp. | 3.7% |
| Ovintiv, Inc. | 3.6% |
| ConocoPhillips | 3.5% |
WHAT WERE THE FUND COSTS FOR THE LAST YEAR?
(Based on a hypothetical $10,000 investment)
| Fund | Costs of a $10,000 investment | Costs paid as a percentage of a $10,000 investment |
| First Trust Financials AlphaDEX® Fund | $66 | 0.61% |
HOW DID THE FUND PERFORM LAST YEAR? WHAT AFFECTED THE FUND’S PERFORMANCE?
The Fund returned 17.93% during the 12 months ended July 31, 2026. The Fund outperformed its benchmark, the S&P 500® Financials Index, which returned 10.52% for the same Period.
During the Period, investments in the Insurance industry received the greatest allocation of any industry with an average weight of 34.2% and contributed 6.2% to the Fund’s overall return. With an average weight of 27.6%, investments in the Banks industry contributed 8.0% to the Fund’s overall return, which was the greatest return contribution of any industry. No industry had a negative contribution to overall Fund return.
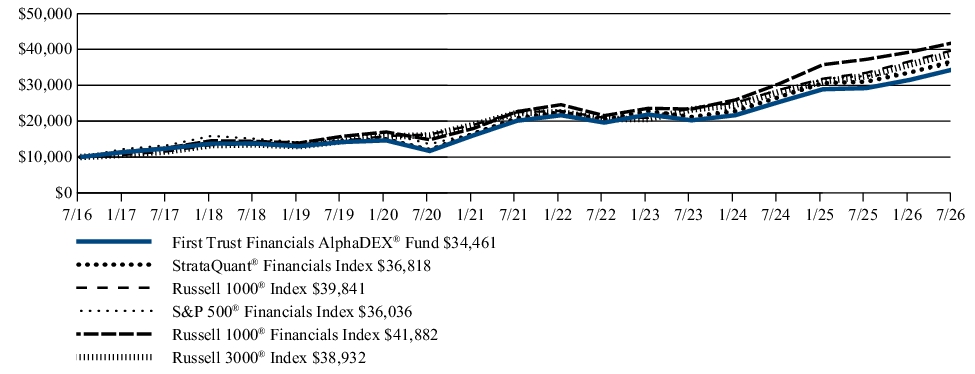
FUND PERFORMANCE (July 31, 2016 to July 31, 2026)
The performance line graph below shows the performance of a hypothetical $10,000 initial investment in the Fund over a ten-year period (or for the life of the Fund, if shorter). The subsequent account value as of the end of the Period is listed next to the name of the Fund or index, as applicable. The performance table below shows the average annual total returns of the Fund for the past one-, five-, and ten-year periods, as applicable (or for the life of the Fund, if shorter), as of the end of the Period. Both the line graph and performance table compare the Fund’s performance to an appropriate broad-based index and may compare to additional indices reflecting the market segment(s) in which the Fund invests over the same periods.
Investment Performance of $10,000
| Average Annual Total Returns (as of July 31, 2026) | 1 Year | 5 Year | 10 Year |
| First Trust Financials AlphaDEX® Fund | 17.93% | 11.37% | 13.17% |
| StrataQuant® Financials Index | 18.73% | 12.07% | 13.92% |
| Russell 1000® Index | 18.94% | 12.12% | 14.82% |
| S&P 500® Financials Index | 10.52% | 11.27% | 13.68% |
| Russell 1000® Financials Index | 12.45% | 13.05% | 15.40% |
| Russell 3000® Index | 19.60% | 11.82% | 14.56% |
Visit www.ftportfolios.com/etf/FXO for more recent performance information.
KEY FUND STATISTICS (As of July 31, 2026)
| Fund net assets | $1,128,685,877 |
| Total number of portfolio holdings | 106 |
| Total advisory fee paid | $8,561,297 |
| Portfolio turnover rate | 70% |
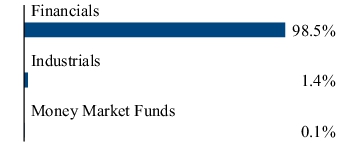
WHAT DID THE FUND INVEST IN? (As of July 31, 2026)
The tables below show the investment makeup of the Fund, representing the percentage of total investments (excluding repurchase agreements held as collateral for securities lending arrangements) of the Fund.
Top Ten Holdings
| MarketAxess Holdings, Inc. | 2.3% |
| Lincoln National Corp. | 2.0% |
| FactSet Research Systems, Inc. | 1.8% |
| Travelers (The) Cos., Inc. | 1.8% |
| Allstate (The) Corp. | 1.7% |
| First American Financial Corp. | 1.7% |
| Central BanCo, Inc. | 1.7% |
| Hartford Insurance Group (The), Inc. | 1.7% |
| MGIC Investment Corp. | 1.7% |
| American International Group, Inc. | 1.7% |
Sector Allocation
Top Ten Holdings
| MarketAxess Holdings, Inc. | 2.3% |
| Lincoln National Corp. | 2.0% |
| FactSet Research Systems, Inc. | 1.8% |
| Travelers (The) Cos., Inc. | 1.8% |
| Allstate (The) Corp. | 1.7% |
| First American Financial Corp. | 1.7% |
| Central BanCo, Inc. | 1.7% |
| Hartford Insurance Group (The), Inc. | 1.7% |
| MGIC Investment Corp. | 1.7% |
| American International Group, Inc. | 1.7% |
WHAT WERE THE FUND COSTS FOR THE LAST YEAR?
(Based on a hypothetical $10,000 investment)
| Fund | Costs of a $10,000 investment | Costs paid as a percentage of a $10,000 investment |
| First Trust Health Care AlphaDEX® Fund | $71 | 0.62% |
HOW DID THE FUND PERFORM LAST YEAR? WHAT AFFECTED THE FUND’S PERFORMANCE?
The Fund returned 29.63% during the 12 months ended July 31, 2026. The Fund outperformed its benchmark, the S&P 500® Health Care Index, which returned 26.92% for the same Period.
During the Period, investments in the Biotechnology industry received the greatest allocation of any industry with an average weight of 26.4% and contributed 10.1% to the Fund’s overall return. With an average weight of 25.0%, investments in the Health Care Providers & Services industry contributed 12.4% to the Fund’s overall return, which was the greatest return contribution of any industry. With an average weight of 2.0%, investments in the Health Care Technology industry contributed –0.9% to the Fund’s overall return, which was the most negative return contribution of any industry.
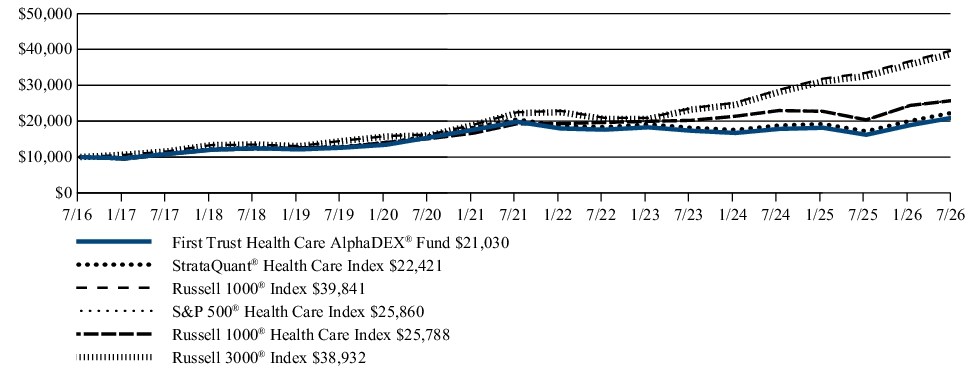
FUND PERFORMANCE (July 31, 2016 to July 31, 2026)
The performance line graph below shows the performance of a hypothetical $10,000 initial investment in the Fund over a ten-year period (or for the life of the Fund, if shorter). The subsequent account value as of the end of the Period is listed next to the name of the Fund or index, as applicable. The performance table below shows the average annual total returns of the Fund for the past one-, five-, and ten-year periods, as applicable (or for the life of the Fund, if shorter), as of the end of the Period. Both the line graph and performance table compare the Fund’s performance to an appropriate broad-based index and may compare to additional indices reflecting the market segment(s) in which the Fund invests over the same periods.
Investment Performance of $10,000
| Average Annual Total Returns (as of July 31, 2026) | 1 Year | 5 Year | 10 Year |
| First Trust Health Care AlphaDEX® Fund | 29.63% | 1.19% | 7.72% |
| StrataQuant® Health Care Index | 30.52% | 1.81% | 8.41% |
| Russell 1000® Index | 18.94% | 12.12% | 14.82% |
| S&P 500® Health Care Index | 26.92% | 6.02% | 9.97% |
| Russell 1000® Health Care Index | 26.59% | 5.25% | 9.94% |
| Russell 3000® Index | 19.60% | 11.82% | 14.56% |
Visit www.ftportfolios.com/etf/FXH for more recent performance information.
KEY FUND STATISTICS (As of July 31, 2026)
| Fund net assets | $1,054,221,358 |
| Total number of portfolio holdings | 75 |
| Total advisory fee paid | $4,569,417 |
| Portfolio turnover rate | 124% |
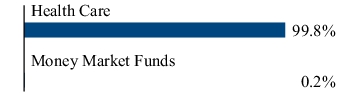
WHAT DID THE FUND INVEST IN? (As of July 31, 2026)
The tables below show the investment makeup of the Fund, representing the percentage of total investments (excluding repurchase agreements held as collateral for securities lending arrangements) of the Fund.
Top Ten Holdings
| Regeneron Pharmaceuticals, Inc. | 2.8% |
| Universal Health Services, Inc., Class B | 2.6% |
| Solventum Corp. | 2.5% |
| Boston Scientific Corp. | 2.5% |
| Zimmer Biomet Holdings, Inc. | 2.5% |
| Guardant Health, Inc. | 2.4% |
| DaVita, Inc. | 2.4% |
| Pfizer, Inc. | 2.4% |
| Tenet Healthcare Corp. | 2.3% |
| Cigna Group (The) | 2.3% |
Sector Allocation
Top Ten Holdings
| Regeneron Pharmaceuticals, Inc. | 2.8% |
| Universal Health Services, Inc., Class B | 2.6% |
| Solventum Corp. | 2.5% |
| Boston Scientific Corp. | 2.5% |
| Zimmer Biomet Holdings, Inc. | 2.5% |
| Guardant Health, Inc. | 2.4% |
| DaVita, Inc. | 2.4% |
| Pfizer, Inc. | 2.4% |
| Tenet Healthcare Corp. | 2.3% |
| Cigna Group (The) | 2.3% |
WHAT WERE THE FUND COSTS FOR THE LAST YEAR?
(Based on a hypothetical $10,000 investment)
| Fund | Costs of a $10,000 investment | Costs paid as a percentage of a $10,000 investment |
| First Trust Industrials/Producer Durables AlphaDEX® Fund | $67 | 0.62% |
HOW DID THE FUND PERFORM LAST YEAR? WHAT AFFECTED THE FUND’S PERFORMANCE?
The Fund returned 15.16% during the 12 months ended July 31, 2026. The Fund underperformed its benchmark, the S&P 500® Industrials Index, which returned 19.86% for the same Period.
During the Period, investments in the Machinery industry received the greatest allocation of any industry with an average weight of 14.6% and contributed 3.6% to the Fund’s overall return, which was the greatest return contribution of any industry. With an average weight of 8.3%, investments in the Financial Services industry contributed –1.6% to the Fund’s overall return, which was the most negative return contribution of any industry.
FUND PERFORMANCE (July 31, 2016 to July 31, 2026)
The performance line graph below shows the performance of a hypothetical $10,000 initial investment in the Fund over a ten-year period (or for the life of the Fund, if shorter). The subsequent account value as of the end of the Period is listed next to the name of the Fund or index, as applicable. The performance table below shows the average annual total returns of the Fund for the past one-, five-, and ten-year periods, as applicable (or for the life of the Fund, if shorter), as of the end of the Period. Both the line graph and performance table compare the Fund’s performance to an appropriate broad-based index and may compare to additional indices reflecting the market segment(s) in which the Fund invests over the same periods.
Investment Performance of $10,000
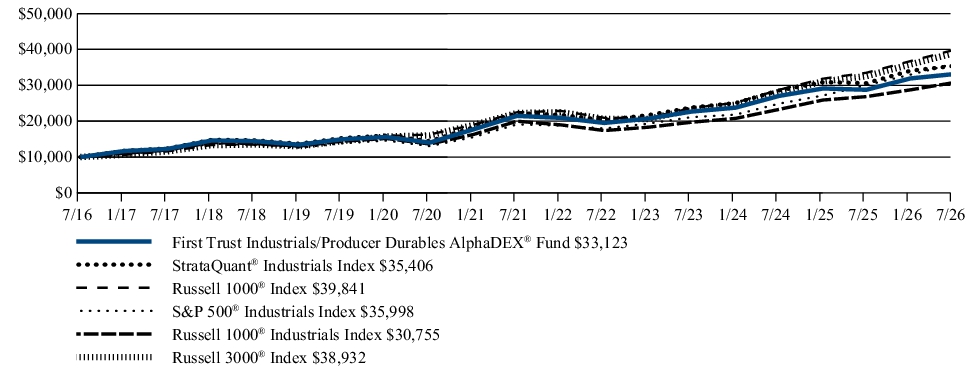
| Average Annual Total Returns (as of July 31, 2026) | 1 Year | 5 Year | 10 Year |
| First Trust Industrials/Producer Durables AlphaDEX® Fund | 15.16% | 9.04% | 12.72% |
| StrataQuant® Industrials Index | 15.77% | 9.74% | 13.48% |
| Russell 1000® Index | 18.94% | 12.12% | 14.82% |
| S&P 500® Industrials Index | 19.86% | 13.49% | 13.67% |
| Russell 1000® Industrials Index | 14.52% | 8.98% | 11.89% |
| Russell 3000® Index | 19.60% | 11.82% | 14.56% |
Visit www.ftportfolios.com/etf/FXR for more recent performance information.
KEY FUND STATISTICS (As of July 31, 2026)
| Fund net assets | $741,607,839 |
| Total number of portfolio holdings | 157 |
| Total advisory fee paid | $5,684,364 |
| Portfolio turnover rate | 74% |
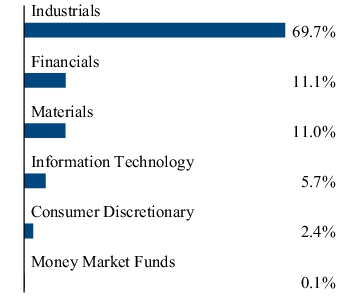
WHAT DID THE FUND INVEST IN? (As of July 31, 2026)
The tables below show the investment makeup of the Fund, representing the percentage of total investments (excluding repurchase agreements held as collateral for securities lending arrangements) of the Fund.
Top Ten Holdings
| Accenture PLC, Class A | 1.5% |
| PayPal Holdings, Inc. | 1.5% |
| Genpact Ltd. | 1.4% |
| ADT, Inc. | 1.3% |
| Fidelity National Information Services, Inc. | 1.3% |
| Vontier Corp. | 1.2% |
| Fiserv, Inc. | 1.2% |
| ExlService Holdings, Inc. | 1.2% |
| Graphic Packaging Holding Co. | 1.1% |
| Mohawk Industries, Inc. | 1.1% |
Sector Allocation
Top Ten Holdings
| Accenture PLC, Class A | 1.5% |
| PayPal Holdings, Inc. | 1.5% |
| Genpact Ltd. | 1.4% |
| ADT, Inc. | 1.3% |
| Fidelity National Information Services, Inc. | 1.3% |
| Vontier Corp. | 1.2% |
| Fiserv, Inc. | 1.2% |
| ExlService Holdings, Inc. | 1.2% |
| Graphic Packaging Holding Co. | 1.1% |
| Mohawk Industries, Inc. | 1.1% |
WHAT WERE THE FUND COSTS FOR THE LAST YEAR?
(Based on a hypothetical $10,000 investment)
| Fund | Costs of a $10,000 investment | Costs paid as a percentage of a $10,000 investment |
| First Trust Materials AlphaDEX® Fund | $75 | 0.64% |
HOW DID THE FUND PERFORM LAST YEAR? WHAT AFFECTED THE FUND’S PERFORMANCE?
The Fund returned 35.49% during the 12 months ended July 31, 2026. The Fund outperformed its benchmark, the S&P 500® Materials Index, which returned 15.32% for the same Period.
During the Period, investments in the Chemicals industry received the greatest allocation of any industry, with an average weight of 40.9%, and contributed 4.7% to the Fund’s overall return. With an average weight of 37.1%, investments in the Metals & Mining industry contributed 20.8% to the Fund’s overall return, which was the greatest return contribution of any industry. No industry had a negative contribution to overall Fund return.
FUND PERFORMANCE (July 31, 2016 to July 31, 2026)
The performance line graph below shows the performance of a hypothetical $10,000 initial investment in the Fund over a ten-year period (or for the life of the Fund, if shorter). The subsequent account value as of the end of the Period is listed next to the name of the Fund or index, as applicable. The performance table below shows the average annual total returns of the Fund for the past one-, five-, and ten-year periods, as applicable (or for the life of the Fund, if shorter), as of the end of the Period. Both the line graph and performance table compare the Fund’s performance to an appropriate broad-based index and may compare to additional indices reflecting the market segment(s) in which the Fund invests over the same periods.
Investment Performance of $10,000
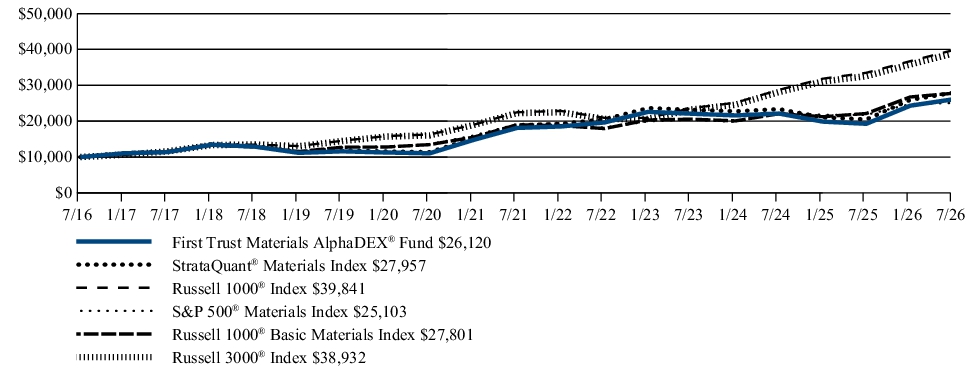
| Average Annual Total Returns (as of July 31, 2026) | 1 Year | 5 Year | 10 Year |
| First Trust Materials AlphaDEX® Fund | 35.49% | 7.58% | 10.08% |
| StrataQuant® Materials Index | 36.33% | 8.28% | 10.83% |
| Russell 1000® Index | 18.94% | 12.12% | 14.82% |
| S&P 500® Materials Index | 15.32% | 5.53% | 9.64% |
| Russell 1000® Basic Materials Index | 25.52% | 7.91% | 10.77% |
| Russell 3000® Index | 19.60% | 11.82% | 14.56% |
Visit www.ftportfolios.com/etf/FXZ for more recent performance information.
KEY FUND STATISTICS (As of July 31, 2026)
| Fund net assets | $368,177,305 |
| Total number of portfolio holdings | 41 |
| Total advisory fee paid | $1,483,638 |
| Portfolio turnover rate | 73% |
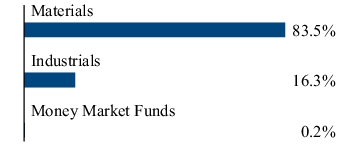
WHAT DID THE FUND INVEST IN? (As of July 31, 2026)
The tables below show the investment makeup of the Fund, representing the percentage of total investments (excluding repurchase agreements held as collateral for securities lending arrangements) of the Fund.
Top Ten Holdings
| CF Industries Holdings, Inc. | 5.6% |
| Steel Dynamics, Inc. | 5.3% |
| Newmont Corp. | 4.9% |
| Anglogold Ashanti PLC | 4.8% |
| Coeur Mining, Inc. | 4.4% |
| Alcoa Corp. | 4.2% |
| Nucor Corp. | 3.9% |
| Mueller Industries, Inc. | 3.7% |
| Eastman Chemical Co. | 3.6% |
| Mosaic (The) Co. | 3.6% |
Sector Allocation
Top Ten Holdings
| CF Industries Holdings, Inc. | 5.6% |
| Steel Dynamics, Inc. | 5.3% |
| Newmont Corp. | 4.9% |
| Anglogold Ashanti PLC | 4.8% |
| Coeur Mining, Inc. | 4.4% |
| Alcoa Corp. | 4.2% |
| Nucor Corp. | 3.9% |
| Mueller Industries, Inc. | 3.7% |
| Eastman Chemical Co. | 3.6% |
| Mosaic (The) Co. | 3.6% |
WHAT WERE THE FUND COSTS FOR THE LAST YEAR?
(Based on a hypothetical $10,000 investment)
| Fund | Costs of a $10,000 investment | Costs paid as a percentage of a $10,000 investment |
| First Trust Technology AlphaDEX® Fund | $69 | 0.61% |
HOW DID THE FUND PERFORM LAST YEAR? WHAT AFFECTED THE FUND’S PERFORMANCE?
The Fund returned 24.65% during the 12 months ended July 31, 2026. The Fund underperformed its benchmark, the S&P 500® Information Technology Index, which returned 26.22% for the same Period.
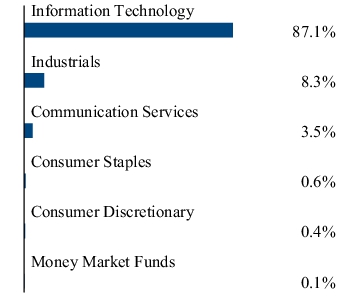
During the Period, investments in the Semiconductors & Semiconductor Equipment industry received the greatest allocation of any industry with an average weight of 29.0% and contributed 23.8% to the Fund’s overall return, which was the greatest return contribution of any industry. With an average weight of 8.3%, investments in the Professional Services industry contributed -2.4% to the Fund’s overall return, which was the most negative return contribution of any industry.
FUND PERFORMANCE (July 31, 2016 to July 31, 2026)
The performance line graph below shows the performance of a hypothetical $10,000 initial investment in the Fund over a ten-year period (or for the life of the Fund, if shorter). The subsequent account value as of the end of the Period is listed next to the name of the Fund or index, as applicable. The performance table below shows the average annual total returns of the Fund for the past one-, five-, and ten-year periods, as applicable (or for the life of the Fund, if shorter), as of the end of the Period. Both the line graph and performance table compare the Fund’s performance to an appropriate broad-based index and may compare to additional indices reflecting the market segment(s) in which the Fund invests over the same periods.
Investment Performance of $10,000
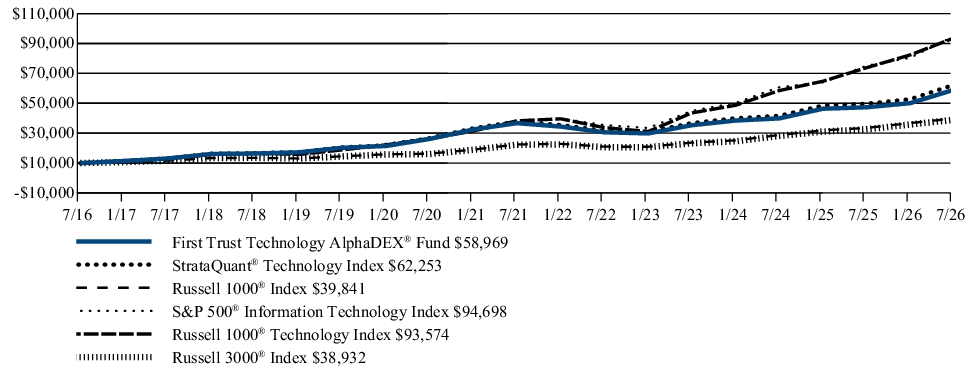
| Average Annual Total Returns (as of July 31, 2026) | 1 Year | 5 Year | 10 Year |
| First Trust Technology AlphaDEX® Fund | 24.65% | 9.95% | 19.42% |
| StrataQuant Technology® Index | 25.38% | 10.55% | 20.06% |
| Russell 1000® Index | 18.94% | 12.12% | 14.82% |
| S&P 500® Information Technology Index | 26.22% | 20.39% | 25.21% |
| Russell 1000® Technology Index | 26.91% | 19.59% | 25.06% |
| Russell 3000® Index | 19.60% | 11.82% | 14.56% |
Visit www.ftportfolios.com/etf/FXL for more recent performance information.
KEY FUND STATISTICS (As of July 31, 2026)
| Fund net assets | $2,569,937,525 |
| Total number of portfolio holdings | 112 |
| Total advisory fee paid | $7,736,247 |
| Portfolio turnover rate | 112% |
WHAT DID THE FUND INVEST IN? (As of July 31, 2026)
The tables below show the investment makeup of the Fund, representing the percentage of total investments (excluding repurchase agreements held as collateral for securities lending arrangements) of the Fund.
Top Ten Holdings
| Cognizant Technology Solutions Corp., Class A | 2.4% |
| EPAM Systems, Inc. | 2.2% |
| PTC, Inc. | 2.0% |
| Leidos Holdings, Inc. | 1.9% |
| Zoom Communications, Inc. | 1.8% |
| Amdocs Ltd. | 1.8% |
| Adobe, Inc. | 1.6% |
| Dell Technologies, Inc., Class C | 1.6% |
| RingCentral, Inc., Class A | 1.4% |
| Western Digital Corp. | 1.4% |
Sector Allocation
Top Ten Holdings
| Cognizant Technology Solutions Corp., Class A | 2.4% |
| EPAM Systems, Inc. | 2.2% |
| PTC, Inc. | 2.0% |
| Leidos Holdings, Inc. | 1.9% |
| Zoom Communications, Inc. | 1.8% |
| Amdocs Ltd. | 1.8% |
| Adobe, Inc. | 1.6% |
| Dell Technologies, Inc., Class C | 1.6% |
| RingCentral, Inc., Class A | 1.4% |
| Western Digital Corp. | 1.4% |
WHAT WERE THE FUND COSTS FOR THE LAST YEAR?
(Based on a hypothetical $10,000 investment)
| Fund | Costs of a $10,000 investment | Costs paid as a percentage of a $10,000 investment |
| First Trust Utilities AlphaDEX® Fund | $65 | 0.61% |
HOW DID THE FUND PERFORM LAST YEAR? WHAT AFFECTED THE FUND’S PERFORMANCE?
The Fund returned 11.49% during the 12 months ended July 31, 2026. The Fund outperformed its benchmark, the S&P 500® Utilities Index, which returned 6.41% for the same Period.
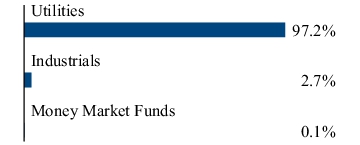
During the Period, investments in the Electric Utilities industry received the greatest allocation of any industry with an average weight of 50.3% and contributed 7.8% to the Fund's overall return, which was the greatest return contribution of any industry. No industry had a negative contribution to overall Fund return.
FUND PERFORMANCE (July 31, 2016 to July 31, 2026)
The performance line graph below shows the performance of a hypothetical $10,000 initial investment in the Fund over a ten-year period (or for the life of the Fund, if shorter). The subsequent account value as of the end of the Period is listed next to the name of the Fund or index, as applicable. The performance table below shows the average annual total returns of the Fund for the past one-, five-, and ten-year periods, as applicable (or for the life of the Fund, if shorter), as of the end of the Period. Both the line graph and performance table compare the Fund’s performance to an appropriate broad-based index and may compare to additional indices reflecting the market segment(s) in which the Fund invests over the same periods.
Investment Performance of $10,000
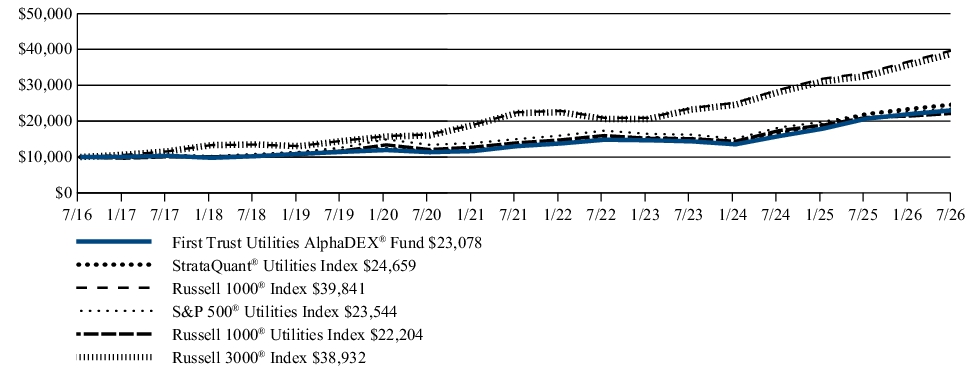
| Average Annual Total Returns (as of July 31, 2026) | 1 Year | 5 Year | 10 Year |
| First Trust Utilities AlphaDEX® Fund | 11.49% | 12.09% | 8.72% |
| StrataQuant® Utilities Index | 12.23% | 12.88% | 9.45% |
| Russell 1000® Index | 18.94% | 12.12% | 14.82% |
| S&P 500® Utilities Index | 6.41% | 9.41% | 8.94% |
| Russell 1000® Utilities Index | 5.60% | 9.72% | 8.30% |
| Russell 3000® Index | 19.60% | 11.82% | 14.56% |
Visit www.ftportfolios.com/etf/FXU for more recent performance information.
KEY FUND STATISTICS (As of July 31, 2026)
| Fund net assets | $831,047,490 |
| Total number of portfolio holdings | 42 |
| Total advisory fee paid | $6,459,969 |
| Portfolio turnover rate | 42% |
WHAT DID THE FUND INVEST IN? (As of July 31, 2026)
The tables below show the investment makeup of the Fund, representing the percentage of total investments (excluding repurchase agreements held as collateral for securities lending arrangements) of the Fund.
Top Ten Holdings
| National Fuel Gas Co. | 4.5% |
| UGI Corp. | 4.4% |
| PG&E Corp. | 4.4% |
| AES (The) Corp. | 4.2% |
| Eversource Energy | 4.2% |
| Edison International | 4.2% |
| Consolidated Edison, Inc. | 4.2% |
| Exelon Corp. | 4.2% |
| Essential Utilities, Inc. | 3.5% |
| Duke Energy Corp. | 3.4% |
Sector Allocation
Top Ten Holdings
| National Fuel Gas Co. | 4.5% |
| UGI Corp. | 4.4% |
| PG&E Corp. | 4.4% |
| AES (The) Corp. | 4.2% |
| Eversource Energy | 4.2% |
| Edison International | 4.2% |
| Consolidated Edison, Inc. | 4.2% |
| Exelon Corp. | 4.2% |
| Essential Utilities, Inc. | 3.5% |
| Duke Energy Corp. | 3.4% |
WHAT WERE THE FUND COSTS FOR THE LAST YEAR?
(Based on a hypothetical $10,000 investment)
| Fund | Costs of a $10,000 investment | Costs paid as a percentage of a $10,000 investment |
| First Trust Mid Cap Growth AlphaDEX® Fund | $79(1) | 0.71%(1) (2) |
|
(1) |
Excludes any Acquired Fund Fees and Expenses of the underlying investment companies in which the Fund invests. |
|
(2) |
Includes extraordinary expenses. If these extraordinary expenses were not included, the expense ratio would have been 0.70%. |
HOW DID THE FUND PERFORM LAST YEAR? WHAT AFFECTED THE FUND’S PERFORMANCE?
The Fund returned 21.30% during the 12 months ended July 31, 2026. The Fund outperformed its benchmark, the S&P MidCap 400® Growth Index, which returned 21.18% for the same Period.
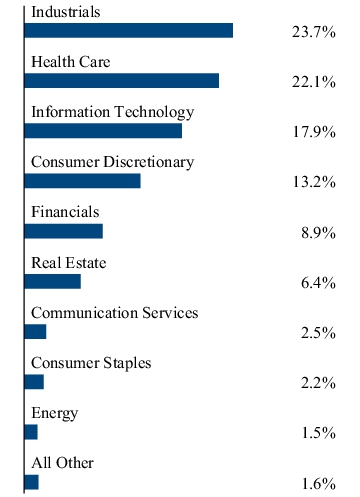
During the Period, investments in the Industrials sector received the greatest allocation of any sector, with an average weight of 26.7%, and contributed 6.3% to the Fund’s overall return, which was the greatest of any sector. Investments in the Consumer Staples sector, with an average weight of 1.7%, contributed -0.8% to Fund’s overall return, which was the most negative contribution of any sector.
FUND PERFORMANCE (July 31, 2016 to July 31, 2026)
The performance line graph below shows the performance of a hypothetical $10,000 initial investment in the Fund over a ten-year period (or for the life of the Fund, if shorter). The subsequent account value as of the end of the Period is listed next to the name of the Fund or index, as applicable. The performance table below shows the average annual total returns of the Fund for the past one-, five-, and ten-year periods, as applicable (or for the life of the Fund, if shorter), as of the end of the Period. Both the line graph and performance table compare the Fund’s performance to an appropriate broad-based index and may compare to additional indices reflecting the market segment(s) in which the Fund invests over the same periods.
Investment Performance of $10,000
| Average Annual Total Returns (as of July 31, 2026) | 1 Year | 5 Year | 10 Year |
| First Trust Mid Cap Growth AlphaDEX® Fund | 21.30% | 7.03% | 12.86% |
| Nasdaq AlphaDEX Mid Cap GrowthTM Index | 22.16% | 7.82% | 13.69% |
| Nasdaq US 600 Mid Cap GrowthTM Index | 14.88% | 3.64% | 10.48% |
| S&P MidCap 400® Growth Index | 21.18% | 7.57% | 10.96% |
| Russell 3000® Index | 19.60% | 11.82% | 14.56% |
Visit www.ftportfolios.com/etf/FNY for more recent performance information.
KEY FUND STATISTICS (As of July 31, 2026)
| Fund net assets | $577,587,332 |
| Total number of portfolio holdings | 227 |
| Total advisory fee paid | $3,450,038 |
| Portfolio turnover rate | 135% |
WHAT DID THE FUND INVEST IN? (As of July 31, 2026)
The tables below show the investment makeup of the Fund, representing the percentage of total investments (excluding repurchase agreements held as collateral for securities lending arrangements) of the Fund.
Top Ten Holdings
| Etsy, Inc. | 0.9% |
| Guardant Health, Inc. | 0.9% |
| PACS Group, Inc. | 0.9% |
| Victoria’s Secret & Co. | 0.8% |
| Amneal Pharmaceuticals, Inc. | 0.8% |
| Enova International, Inc. | 0.8% |
| Corcept Therapeutics, Inc. | 0.8% |
| IES Holdings, Inc. | 0.8% |
| Tutor Perini Corp. | 0.8% |
| Coca-Cola Consolidated, Inc. | 0.8% |
Sector Allocation
Top Ten Holdings
| Etsy, Inc. | 0.9% |
| Guardant Health, Inc. | 0.9% |
| PACS Group, Inc. | 0.9% |
| Victoria’s Secret & Co. | 0.8% |
| Amneal Pharmaceuticals, Inc. | 0.8% |
| Enova International, Inc. | 0.8% |
| Corcept Therapeutics, Inc. | 0.8% |
| IES Holdings, Inc. | 0.8% |
| Tutor Perini Corp. | 0.8% |
| Coca-Cola Consolidated, Inc. | 0.8% |
WHAT WERE THE FUND COSTS FOR THE LAST YEAR?
(Based on a hypothetical $10,000 investment)
| Fund | Costs of a $10,000 investment | Costs paid as a percentage of a $10,000 investment |
| First Trust Mid Cap Value AlphaDEX® Fund | $79(1) | 0.71%(1) (2) |
|
(1) |
Excludes any Acquired Fund Fees and Expenses of the underlying investment companies in which the Fund invests. |
|
(2) |
Includes extraordinary expenses. If these extraordinary expenses were not included, the expense ratio would have been 0.70%. |
HOW DID THE FUND PERFORM LAST YEAR? WHAT AFFECTED THE FUND’S PERFORMANCE?
The Fund returned 22.53% during the 12 months ended July 31, 2026. The Fund outperformed its benchmark, the S&P MidCap 400® Value Index, which returned 20.77% for the same Period.
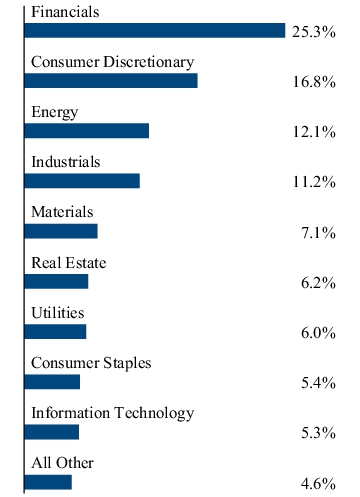
During the Period, investments in the Financials sector received the greatest allocation of any sector, with an average weight of 24.4%, and contributed 6.2% to the Fund’s overall return, which was the greatest of any sector. Investments in the Consumer Staples sector, with an average weight of 6.0%, contributed -0.1% to the Fund’s overall return, which was the most negative return contribution of any sector.
FUND PERFORMANCE (July 31, 2016 to July 31, 2026)
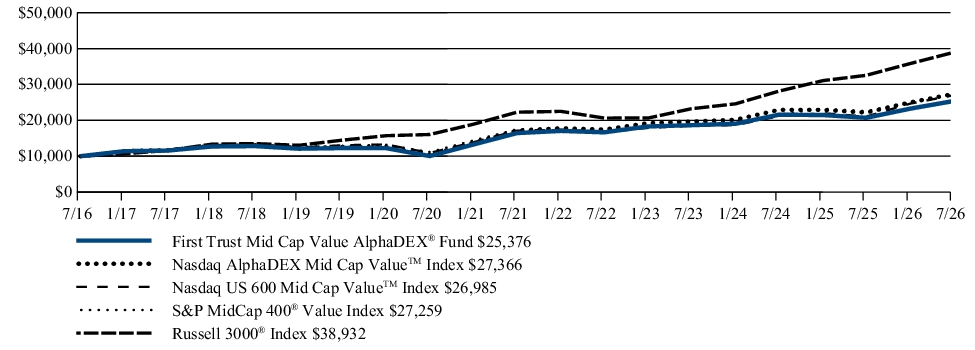
The performance line graph below shows the performance of a hypothetical $10,000 initial investment in the Fund over a ten-year period (or for the life of the Fund, if shorter). The subsequent account value as of the end of the Period is listed next to the name of the Fund or index, as applicable. The performance table below shows the average annual total returns of the Fund for the past one-, five-, and ten-year periods, as applicable (or for the life of the Fund, if shorter), as of the end of the Period. Both the line graph and performance table compare the Fund’s performance to an appropriate broad-based index and may compare to additional indices reflecting the market segment(s) in which the Fund invests over the same periods.
Investment Performance of $10,000
| Average Annual Total Returns (as of July 31, 2026) | 1 Year | 5 Year | 10 Year |
| First Trust Mid Cap Value AlphaDEX® Fund | 22.53% | 9.06% | 9.76% |
| Nasdaq AlphaDEX Mid Cap ValueTM Index | 23.46% | 9.88% | 10.59% |
| Nasdaq US 600 Mid Cap ValueTM Index | 28.24% | 9.55% | 10.44% |
| S&P MidCap 400® Value Index | 20.77% | 9.25% | 10.55% |
| Russell 3000® Index | 19.60% | 11.82% | 14.56% |
Visit www.ftportfolios.com/etf/FNK for more recent performance information.
KEY FUND STATISTICS (As of July 31, 2026)
| Fund net assets | $228,068,181 |
| Total number of portfolio holdings | 227 |
| Total advisory fee paid | $1,450,052 |
| Portfolio turnover rate | 104% |
WHAT DID THE FUND INVEST IN? (As of July 31, 2026)
The tables below show the investment makeup of the Fund, representing the percentage of total investments (excluding repurchase agreements held as collateral for securities lending arrangements) of the Fund.
Top Ten Holdings
| EPAM Systems, Inc. | 0.9% |
| Lithia Motors, Inc. | 0.9% |
| HF Sinclair Corp. | 0.9% |
| Genpact Ltd. | 0.9% |
| SM Energy Co. | 0.9% |
| Ovintiv, Inc. | 0.8% |
| ADT, Inc. | 0.8% |
| Permian Resources Corp., Class A | 0.8% |
| CF Industries Holdings, Inc. | 0.8% |
| Asbury Automotive Group, Inc. | 0.8% |
Sector Allocation
Top Ten Holdings
| EPAM Systems, Inc. | 0.9% |
| Lithia Motors, Inc. | 0.9% |
| HF Sinclair Corp. | 0.9% |
| Genpact Ltd. | 0.9% |
| SM Energy Co. | 0.9% |
| Ovintiv, Inc. | 0.8% |
| ADT, Inc. | 0.8% |
| Permian Resources Corp., Class A | 0.8% |
| CF Industries Holdings, Inc. | 0.8% |
| Asbury Automotive Group, Inc. | 0.8% |
WHAT WERE THE FUND COSTS FOR THE LAST YEAR?
(Based on a hypothetical $10,000 investment)
| Fund | Costs of a $10,000 investment | Costs paid as a percentage of a $10,000 investment |
| First Trust Small Cap Growth AlphaDEX® Fund | $87 | 0.70% |
HOW DID THE FUND PERFORM LAST YEAR? WHAT AFFECTED THE FUND’S PERFORMANCE?
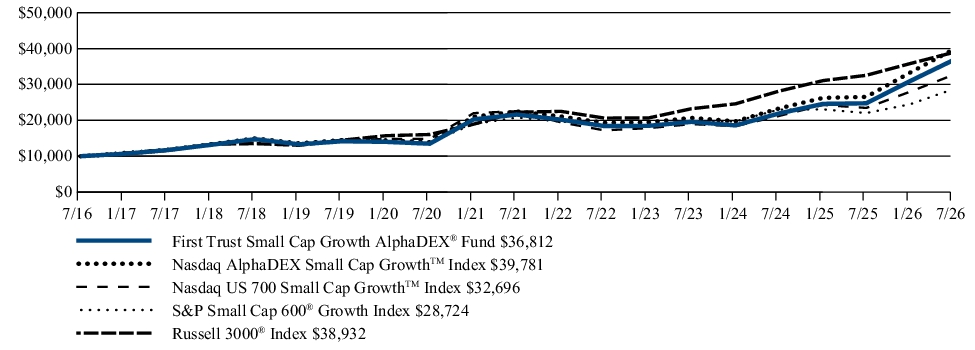
The Fund returned 48.72% during the 12 months ended July 31, 2026. The Fund outperformed its benchmark, the S&P SmallCap 600® Growth Index, which returned 30.43% for the same Period.
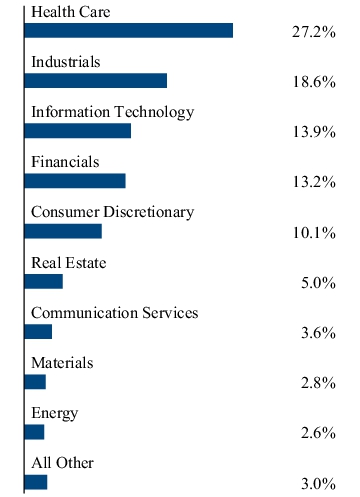
During the Period, the Health Care sector received the greatest allocation of any sector, with an average weight of 24.0%, and contributed 15.1% to the Fund’s return, the largest positive contribution of any sector. No sector represented a negative contribution to the Fund’s overall return.
FUND PERFORMANCE (July 31, 2016 to July 31, 2026)
The performance line graph below shows the performance of a hypothetical $10,000 initial investment in the Fund over a ten-year period (or for the life of the Fund, if shorter). The subsequent account value as of the end of the Period is listed next to the name of the Fund or index, as applicable. The performance table below shows the average annual total returns of the Fund for the past one-, five-, and ten-year periods, as applicable (or for the life of the Fund, if shorter), as of the end of the Period. Both the line graph and performance table compare the Fund’s performance to an appropriate broad-based index and may compare to additional indices reflecting the market segment(s) in which the Fund invests over the same periods.
Investment Performance of $10,000
| Average Annual Total Returns (as of July 31, 2026) | 1 Year | 5 Year | 10 Year |
| First Trust Small Cap Growth AlphaDEX® Fund | 48.72% | 11.24% | 13.92% |
| Nasdaq AlphaDEX Small Cap GrowthTM Index | 49.94% | 12.10% | 14.81% |
| Nasdaq US 700 Small Cap GrowthTM Index | 39.41% | 7.71% | 12.58% |
| S&P SmallCap 600® Growth Index | 30.43% | 6.69% | 11.13% |
| Russell 3000® Index | 19.60% | 11.82% | 14.56% |
Visit www.ftportfolios.com/etf/FYC for more recent performance information.
KEY FUND STATISTICS (As of July 31, 2026)
| Fund net assets | $1,321,993,861 |
| Total number of portfolio holdings | 266 |
| Total advisory fee paid | $5,962,456 |
| Portfolio turnover rate | 127% |
WHAT DID THE FUND INVEST IN? (As of July 31, 2026)
The tables below show the investment makeup of the Fund, representing the percentage of total investments (excluding repurchase agreements held as collateral for securities lending arrangements) of the Fund.
Top Ten Holdings
| Acadian Asset Management, Inc. | 0.8% |
| Chefs’ Warehouse (The), Inc. | 0.8% |
| RingCentral, Inc., Class A | 0.8% |
| Precigen, Inc. | 0.7% |
| First Advantage Corp. | 0.7% |
| Oscar Health, Inc., Class A | 0.7% |
| AtaiBeckley, Inc. | 0.7% |
| National HealthCare Corp. | 0.7% |
| Liquidia Corp. | 0.7% |
| NeoGenomics, Inc. | 0.7% |
Sector Allocation
Top Ten Holdings
| Acadian Asset Management, Inc. | 0.8% |
| Chefs’ Warehouse (The), Inc. | 0.8% |
| RingCentral, Inc., Class A | 0.8% |
| Precigen, Inc. | 0.7% |
| First Advantage Corp. | 0.7% |
| Oscar Health, Inc., Class A | 0.7% |
| AtaiBeckley, Inc. | 0.7% |
| National HealthCare Corp. | 0.7% |
| Liquidia Corp. | 0.7% |
| NeoGenomics, Inc. | 0.7% |
WHAT WERE THE FUND COSTS FOR THE LAST YEAR?
(Based on a hypothetical $10,000 investment)
| Fund | Costs of a $10,000 investment | Costs paid as a percentage of a $10,000 investment |
| First Trust Small Cap Value AlphaDEX® Fund | $86 | 0.71%(1) |
|
(1) |
Includes extraordinary expenses. If these extraordinary expenses were not included, the expense ratio would have been 0.70%. |
HOW DID THE FUND PERFORM LAST YEAR? WHAT AFFECTED THE FUND’S PERFORMANCE?
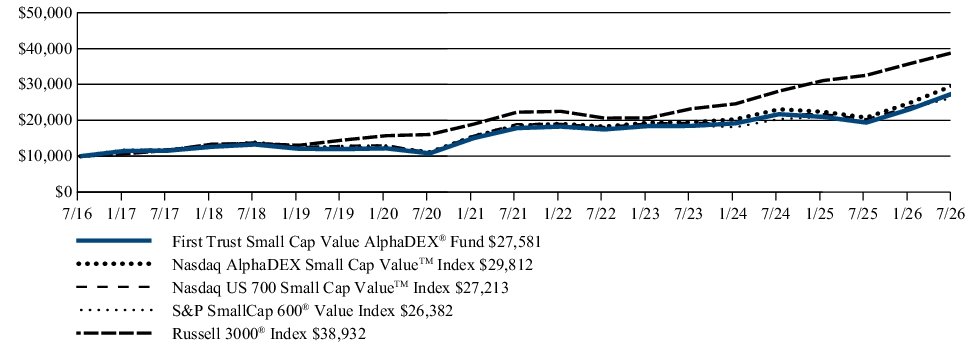
The Fund returned 42.37% during the 12 months ended July 31, 2026. The Fund outperformed its benchmark, the S&P SmallCap 600® Value Index, which returned 37.16% for the same Period.
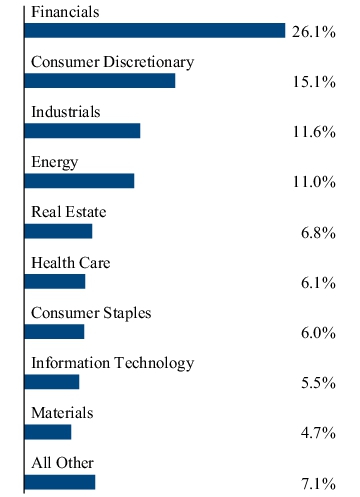
During the Period, investments in the Financials sector received the greatest allocation of any sector with an average weight of 23.6% and contributed 7.3% to the Fund’s overall return. With an average weight of 11.5%, investments in the Energy sector contributed 9.7% to the Fund’s overall return, which was the greatest return contribution of any sector. No sector represented a negative contribution to the Fund’s overall return.
FUND PERFORMANCE (July 31, 2016 to July 31, 2026)
The performance line graph below shows the performance of a hypothetical $10,000 initial investment in the Fund over a ten-year period (or for the life of the Fund, if shorter). The subsequent account value as of the end of the Period is listed next to the name of the Fund or index, as applicable. The performance table below shows the average annual total returns of the Fund for the past one-, five-, and ten-year periods, as applicable (or for the life of the Fund, if shorter), as of the end of the Period. Both the line graph and performance table compare the Fund’s performance to an appropriate broad-based index and may compare to additional indices reflecting the market segment(s) in which the Fund invests over the same periods.
Investment Performance of $10,000
| Average Annual Total Returns (as of July 31, 2026) | 1 Year | 5 Year | 10 Year |
| First Trust Small Cap Value AlphaDEX® Fund | 42.37% | 9.11% | 10.68% |
| Nasdaq AlphaDEX Small Cap ValueTM Index | 43.59% | 10.01% | 11.54% |
| Nasdaq US 700 Small Cap ValueTM Index | 34.02% | 7.51% | 10.53% |
| S&P SmallCap 600® Value Index | 37.16% | 8.14% | 10.19% |
| Russell 3000® Index | 19.60% | 11.82% | 14.56% |
Visit www.ftportfolios.com/etf/FYT for more recent performance information.
KEY FUND STATISTICS (As of July 31, 2026)
| Fund net assets | $194,555,801 |
| Total number of portfolio holdings | 264 |
| Total advisory fee paid | $1,089,872 |
| Portfolio turnover rate | 110% |
WHAT DID THE FUND INVEST IN? (As of July 31, 2026)
The tables below show the investment makeup of the Fund, representing the percentage of total investments (excluding repurchase agreements held as collateral for securities lending arrangements) of the Fund.
Top Ten Holdings
| CBIZ, Inc. | 1.1% |
| Everforth, Inc. | 1.0% |
| PBF Energy, Inc., Class A | 1.0% |
| Par Pacific Holdings, Inc. | 0.9% |
| CONMED Corp. | 0.9% |
| Dorian LPG Ltd. | 0.8% |
| DXC Technology Co. | 0.8% |
| International Seaways, Inc. | 0.8% |
| PVH Corp. | 0.7% |
| Adient PLC | 0.7% |
Sector Allocation
Top Ten Holdings
| CBIZ, Inc. | 1.1% |
| Everforth, Inc. | 1.0% |
| PBF Energy, Inc., Class A | 1.0% |
| Par Pacific Holdings, Inc. | 0.9% |
| CONMED Corp. | 0.9% |
| Dorian LPG Ltd. | 0.8% |
| DXC Technology Co. | 0.8% |
| International Seaways, Inc. | 0.8% |
| PVH Corp. | 0.7% |
| Adient PLC | 0.7% |
| [1] | Excludes any Acquired Fund Fees and Expenses of the underlying investment companies in which the Fund invests. |
| [2] | Excludes any Acquired Fund Fees and Expenses of the underlying investment companies in which the Fund invests. |
| [3] | Excludes any Acquired Fund Fees and Expenses of the underlying investment companies in which the Fund invests. |
| [4] | Excludes any Acquired Fund Fees and Expenses of the underlying investment companies in which the Fund invests. |
| [5] | Includes extraordinary expenses. If these extraordinary expenses were not included, the expense ratio would have been 0.70%. |
| [6] | Excludes any Acquired Fund Fees and Expenses of the underlying investment companies in which the Fund invests. |
| [7] | Includes extraordinary expenses. If these extraordinary expenses were not included, the expense ratio would have been 0.70%. |
| [8] | Includes extraordinary expenses. If these extraordinary expenses were not included, the expense ratio would have been 0.70%. |